22 Matching Annotations
  1. Feb 2021
    1. Almost everywhere you look, climate change is having only small, and often benign, impacts. The impact of extreme weather events ― hurricanes, tornadoes, floods and droughts ― are, if anything, declining.

      This contradicts the evidence presented in dozens of scientific contributions, and summarized IPCC reports.

    2. fewer people are dying from heat; death rates from climate-sensitive diseases like malaria and diarrhoea have decreased (since 1900 malaria death rates have declined 96 per cent); hunger rates have declined; poverty has declined (GDP per capita has quadrupled since 1950 even as CO2 levels have sextupled); life expectancy has more than doubled since the start of industrialisation; health adjusted life expectancy has increased

      All of these have multiple confounding factors (e.g. technological, health and economical development) so that these changes cannot be directly linked to CO2, but also do not invalidate negative effects of climate change. As such, this statement is simply misleading.

    3. mortality from ‘Extreme Weather Events’ has declined by 99 per cent since the 1920s

      No reference to this claim. On the contrary, scientific attribution studies such as Mitchell et al. 2016 show clear impacts of extreme events on excessive mortality.

    4. Empirical evidence directly contradicts claims that increased carbon dioxide has reduced human wellbeing. In fact, human wellbeing has never been higher

      Carbon dioxide increase does not directly affect human well being, but the main process responsible for increasing CO2 is also responsible for air pollution that does directly affect human health (https://www.sciencedirect.com/science/article/abs/pii/S0013935121000487 , https://www.ncbi.nlm.nih.gov/pmc/articles/PMC6834528/).

      In addition, many environmental consequences from anthropogenic greenhouse gas emissions and global warming have heavy costs in terms of human lives and life quality, for example heatwaves, famines due to drought, increase/expansion in infeccious diseases… (https://www.nature.com/articles/nature04188 , https://iopscience.iop.org/article/10.1088/1748-9326/11/7/074006)

    5. Food supplies per capita decreasing — No (increased 31 per cent since 1961)

      Same as comment above.

    6. Cereal yields decreasing — No (they have tripled since 1961)

      This is also misleading because crop yield increase since the 1960s is related with massive increase in nitrogen fertilization and agricultural industrialization. However, studies have shown that extreme events made more likely by global warming are associated with losses in crop yields (Beillouin et al. 2020,Tigchelaar et al., 2018,Mehrabi et al. 2019) and peaks in crop prices (Chatzoupoulos et al. 2019).

  2. Oct 2018
    1. statement

      It would have been worth adding the statement link, because it includes references that support the statements. http://www.climateandlandusealliance.org/scientists-statement/

    2. Lawrence said a steep drop in emissions to zero by 2040 would negate the need for “negative emissions” technology that would damage forests’ ability to suck up carbon, maintain local water supplies and weather patterns and provide a home for a riot of birds, mammals, insects and other creatures.

      It would have been good to add references for this statement.

    3. “It’s horrifying that we’d lose our biodiversity to avert climate change. Losing tropical forests is not somehow cheaper than putting up wind farms in the US or Sahara.”

      Indeed. But it's not clear that the report will make (makes) such suggestion. The trade-offs between the different options are mentioned in Chapter 2 - but agree that not as highlighted as they probably should.

    4. The Report just came out (http://www.ipcc.ch/report/sr15/). Going briefly through the summary for policy makers: " In pathways limiting global warming to 1.5°C with limited or no overshoot, BECCS deployment is projected to range from 0–1, 0–8, and 0–16 GtCO2yr-1 in 2030, 2050, and 2100, respectively, while agriculture, forestry and land-use (AFOLU) related CDR measures are projected to remove 0–5, 1–11, and 1–5 GtCO2yr-1 in these years (medium confidence). The upper end of these deployment ranges by mid-century exceeds the BECCS potential of up to 5 GtCO 2yr-1 and afforestation potential of up to 3.6 GtCO2yr-1 assessed based on recent literature (medium confidence )." Chaper 2 deals with Agriculture, Forestry and Other Land-Use http://report.ipcc.ch/sr15/pdf/sr15_chapter2.pdf

  3. Jan 2018
    1. Which is to say that these beans will be eaten by cows, and the cows will convert the beans to meat, and the humans will eat the meat. In the process, the cows will emit much greenhouse gas, and they will consume far more calories in beans than they will yield in meat, meaning far more clearcutting of forests to farm cattle feed than would be necessary if the beans above were simply eaten by people

      Even compared to other meat products, beef has additionally lower meat yield, i.e. the weight of meat produced per kg of live weight (Nijdam et al. 2012 Food Policy), and lower energy efficiency (lower energy output per energy input, http://journals.ametsoc.org/doi/pdf/10.1175/EI167.1)

    2. substituting beans for beef.

      Beans have a carbon footprint between 1-2kg of CO2 equivalent per kg, while values for beef range 9-129 (Nijdam et al. 2012 Food Policy). Since they differ in their energy and protein content, the authors of this study calculated separately the CO2 emissions resulting from replacing beans for beef for the same amount of energy or proteins.

      Durk Nijdam, Trudy Rood, Henk Westhoek, The price of protein: Review of land use and carbon footprints from life cycle assessments of animal food products and their substitutes, In Food Policy, Volume 37, Issue 6, 2012, Pages 760-770, ISSN 0306-9192, https://doi.org/10.1016/j.foodpol.2012.08.002. (http://www.sciencedirect.com/science/article/pii/S0306919212000942) Keywords: Protein; Meat; Dairy; Fish; Meat substitutes; Environmental impact; Land use; Carbon footprint; Life cycle assessment (LCA)

  4. Oct 2017
    1. The grasslands, crops, forests and territorial waters of Australia absorb more carbon dioxide than Australia emits.

      This is not true. According to the CSIRO (see here): Taking all fluxes together, the Australian biosphere gained carbon on average at 59 million tonnes of carbon per year (1 Mt = 1 Teragram, Tg) during the period 1990-2011. This amount is the equivalent to 62% of Australia’s emissions from fossil fuels for the same period (this calculation excludes the fossil fuel exports shown in the budget figure). Australian carbon budget 
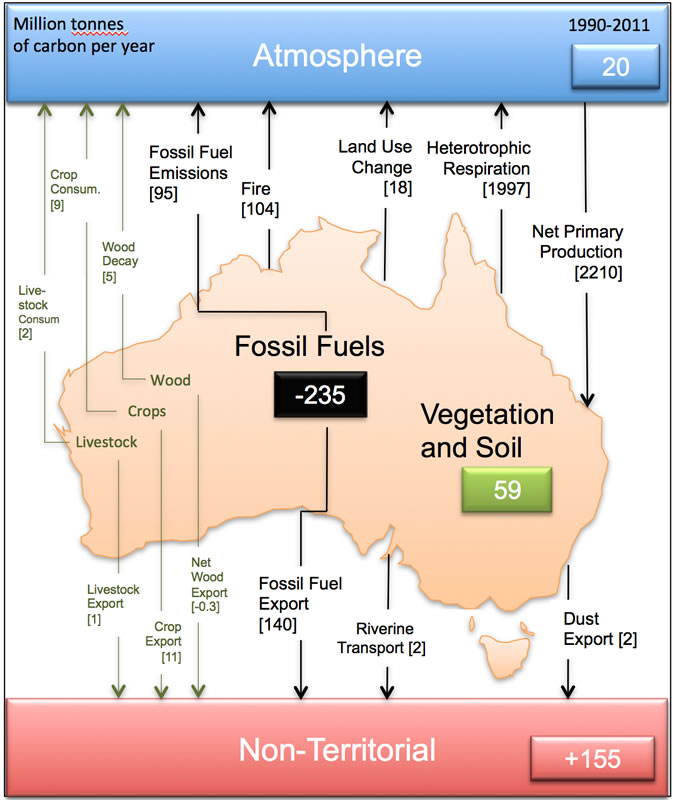
A thorough analysis of the australian carbon budget can be found here.

    2. The worldwide temperature record has been changed. Cooling trends have been “homogenised” to warming trends. In the corporate world, if a loss is “homo­genised” to a profit, it is fraud.

      Everytime new data is assimilated, the record is bound to change slightly. I think the author is referring to a discontinuity in the global temperature record in the 1945, that was shown to be due to changes in the instruments after WWII (see Thompson et al. 2008). Since this discontinuity was reported, new temperature products were corrected for instrumentation change. This is not fraud, just good science.

    3. Global human emissions are only 3 per cent of total annual emissions. It has never been shown that human emissions of carbon dioxide drive global warming.

      This is purposely misleading. Others have commented appropriately. The global carbon budget provides an overview of sources and sinks of CO2 since 1880.<br>

  5. Sep 2017
    1. You can plug leaks in your home insulation to save power, install a smart thermostat, switch to more efficient light bulbs, turn off unused lights, drive fewer miles by consolidating trips or taking public transit, waste less food, and eat less meat.

      According to a recent study, having fewer children has the largest impact on personal carbon footprint.

    2. using every tool available

      This is highly debatable, as even tool which are usually perceived to help mitigating climate (e.g. re-forestation), may not result in mitigation effects, depending on how they are implemented. A study on European forests has shown that afforestation since 1750 was responsible for an increase of 0.12 watts per square meter in the radiative imbalance at the top of the atmosphere, rather than a decrease, because of management choices.

    3. may be somewhat costlier in the short term

      The article does not mention the huge subsidies to the fossil fuel industry worldwide. According to the World Energy Outlook 2016, fossil-fuel subsidies were around $325 billion in 2015 ($490 billion in 2014) against 150 billion for renewables.

    4. making heat waves more frequent and intense.

      It is hard to attribute each particular event to human-induced climate change. The article correctly frames the influence in terms of increasing frequency and intensity of extremes, and directs the reader to a good reference page with clear explanations for non-experts.

    5. blocking them by trying to undermine the science.

      On the scientific community side, the consensus is broad. It's worth revisiting Cook et al. 2015 "Consensus on consensus: a synthesis of consensus estimates on human-caused global warming" ERL. In their review they find a 97% consensus about human-induced global warming in published climate studies.

    1. over 20 years of almost no change in temperatures.

      There has been a slow-down in global mean surface (troposphere) temperatures, but this does not question the fact that the earth-system as a whole is warming. In fact, during the so-called "hiatus", the net radiation imbalance in the top of the atmosphere persisted (implying that warming would continue even if emissions were to stop). In fact, at the same time that warming in the troposphere stalled, ocean heat content increased, especially in deeper layers: Ocean Heat content. Source: NOAA

      The fact that oceans took more heat from the atmosphere helps to explain the slow-down of warming at the surface. This seems to be, at least partly, explained by natural variability in the ocean (see here). Trenberth and colleagues argued, thus, that natural variability in the climate system makes the global mean surface temperature record to increase in steps, rather than in a linear way. In another study, Yan and colleagues analysed the redistribution of heat during the "hiatus" period and concluded that: "[...] the term “global warming hiatus” is a misnomer, although we will continue to use the widely used phrase to describe the slowdown or pause in the increase of GMST in the late 20th to early 21st century, with quotation marks. Alternatively, we would like to suggest to the climate community to use “global surface warming slowdown” instead in the future to avoid confusion. There is no absolute consensus on the specific oceanic sink for the excess heat that led to the slowdown in rising GMST (the Southern Ocean may be worth further attention though), but there is a general agreement in this group and in the literature that rather than a “global warming hiatus,” the slowdown of GMST increase in 1998–2013 was a result of the increased uptake of heat energy by the global ocean during those years."

    2. most of the models of warming trends failed to predict the "slowdown" in warming post-2000, resulting in less pronounced warming than predicted and thus more room in the CO2 "emissions budget" for the coming decades.

      There is an ongoing discussion about the reasons for models to overestimate the rates of tropospheric temperature in the early 21st century. This study assumes that this discrepancy is due to an error in the models' sensitivity to anthropogenic CO2 emissions (hence the need to "reset budgets"), but this is far from being a settled issue. In fact, in a recent study, Santer and colleagues show that the observed cooling relative to the model predictions could be explained by both internal variability in the climate system (transition to a negative phase of the Interdecadal Pacific Oscillation in ca. 1999 and other modes) and by systematic errors in the models' forcing that lead to an overestimation of the radiative forcing in the early 21st century. These errors include a later start of a minimum in solar cycle activity than have been assumed in CMIP5 simulations, and the cooling effect of both human and natural aerosol emissions. Schmidt and colleagues have shown that if adjusted for such effects, CMIP5 models reproduced the slow-down of the warming trends (Figure 1b in their paper).

      Therefore, it is important to acknowledge that the assumption on which this study is based (that there is an error in model sensitivity to anthropogenic CO2 emissions) has been contested in previous and contemporary studies, being far from settled.