3,223 Matching Annotations
  1. Sep 2024
    1. Author Response:

      Reviewer #1 (Public Review):

      Summary:

      The authors aimed to identify potential biomarkers for acute myocardial infarction (AMI) through blood metabolomics and fecal microbiome analysis. They found that long chain fatty acids (LCFAs) could serve as biomarkers for AMI and demonstrated a correlation between LCFAs and the gut microbiome. Additionally, in silico molecular docking and in vitro thrombogenic assays showed that these LCFAs can induce platelet aggregation.

      Strengths:

      The study utilized a comprehensive approach combining blood metabolomics and fecal microbiome analysis.

      The findings suggest a novel use of LCFAs as biomarkers for AMI.

      The correlation between LCFAs and the gut microbiome is a significant contribution to understanding the interplay between gut health and heart disease.

      The use of in silico and in vitro assays provides mechanistic insights into how LCFAs may influence platelet aggregation.

      Weaknesses:

      The evidence is incomplete as it does not definitively prove that gut dysbiosis contributes to fatty acid dysmetabolism.

      We appreciate this reviewer’s insightful comment regarding the causal relationship between gut dysbiosis and fatty acid dysmetabolism. We acknowledge that our study primarily demonstrates a strong association rather than causation. While establishing causality was beyond the scope of the current study, we recognize the importance of addressing this point. In our revised manuscript, we will emphasize the observational nature of our findings and discuss the need for future research, including longitudinal studies and interventional trials, to explore the causal links between gut dysbiosis and fatty acid dysmetabolism. We believe that this clarification strengthens the interpretation of our results and aligns with the reviewer's concern.

      The study primarily shows an association between the gut microbiome and fatty acid metabolism without establishing causation.

      We agree with the reviewer that our study presents an association rather than definitive proof of causation between the gut microbiome and fatty acid metabolism. To address this, we plan to expand the discussion section to more clearly outline the limitations of our study in establishing causality. We will also propose future research directions, such as the use of animal models and longitudinal human studies, which could help elucidate the causal pathways. By clarifying this aspect, we aim to provide a more balanced perspective on our findings.

      Reviewer #2 (Public Review):

      Summary:

      Fan et al. investigated the relationship between early acute myocardial infarction (eAMI) and disturbances in the gut microbiome using metabolomics and metagenomics analyses. They studied 30 eAMI patients and 26 healthy controls, finding elevated levels of long-chain fatty acids (LCFA) in the plasma of eAMI patients.

      Strengths:

      The research attributed a substantial portion of LCFA variance in eAMI to changes in the gut microbiome, as indicated by omics analyses. Computational profiling of gut bacteria suggested structural variations linked to LCFA variance. The authors also conducted molecular docking simulations and platelet assays, revealing that eAMI-associated LCFAs may enhance platelet aggregation.

      Weaknesses:

      The results should be validated using different assays, and animal models should be considered to explore the mechanisms of action.

      We appreciate the reviewer’s suggestion to validate our findings using additional assays and animal models. We agree that further validation is crucial to confirm the robustness of our results and to explore the underlying mechanisms in greater detail. While our current study focused on human subjects and in vitro assays to establish initial findings, we acknowledge that additional experimental approaches are necessary. In the revised manuscript, we plan to include a discussion on the potential use of different assays (e.g., advanced metabolomics techniques, multi-omics integration) and animal models to validate and expand upon our findings. Moreover, we are planning to undertake these experiments in future studies to build upon the foundational work presented here.

      We believe that our revised responses and the planned manuscript revisions will address the reviewers’ concerns effectively. We are confident that these changes will enhance the overall contribution of our study to the field. Thank you again for your valuable feedback.

    1. Author response:

      The following is the authors’ response to the original reviews.

      Public Reviews:

      Joint Public Review: 

      The molecular mechanisms that mediate the regulated exocytosis of neuropeptides and neurotrophins from neurons via large dense-core vesicles (LDCVs) are still incompletely understood. Motivated by their earlier discovery that the Rab3-RIM1 pathway is essential for neuronal LDCV exocytosis, the authors now examined the role of the Rab3 effector Rabphilin-3A in neuronal LDCV secretion. Based on multiple live and confocal imaging approaches, the authors provide evidence for a synaptic enrichment of Rabphilin-3A and for independent trafficking of Rabphilin-3A and LDCVs. Using an elegant NPY-pHluorin imaging approach, they show that genetic deletion of Rabphilin-3A causes an increase in electrically triggered LDCV fusion events and increased neurite length. Finally, knock-out-replacement studies, involving Rabphilin-3A mutants deficient in either Rab3- or SNAP25-binding, indicate that the synaptic enrichment of Rabphilin-3A depends on its Rab3 binding ability, while its ability to bind to SNAP25 is required for its effects on LDCV secretion and neurite development. The authors conclude that Rabphilin-3A negatively regulates LDCV exocytosis and propose that this mechanism also affects neurite growth, e.g. by limiting neurotrophin secretion. These are important findings that advance our mechanistic understanding of neuronal large dense-core vesicle (LDCV) secretion. 

      The major strengths of the present paper are: 

      (i) The use of a powerful Rabphilin-3A KO mouse model. 

      (ii) Stringent lentiviral expression and rescue approaches as a strong genetic foundation of the study. 

      (iii) An elegant FRAP imaging approach. 

      (iv) A cutting-edge NPY-pHluorin-based imaging approach to detect LDCV fusion events. 

      We thank the reviewers for their positive evaluation of our manuscript.

      Weaknesses that somewhat limit the convincingness of the evidence provided and the corresponding conclusions include the following: 

      (i) The limited resolution of the various imaging approaches introduces ambiguity to several parameters (e.g. LDCV counts, definition of synaptic localization, Rabphilin-3A-LDCV colocalization, subcellular and subsynaptic localization of expressed proteins, AZ proximity of Rabphilin-3A and LDCVs) and thereby limits the reliability of corresponding conclusions. Super-resolution approaches may be required here. 

      We thank the reviewer for their constructive suggestion. We fully agree that super-resolution imaging would produce a more precise localization of RPH3A and co-localization with DCVs. We have now repeated our (co)-localization experiments with STED microscopy. We find that RPH3A colocalized with the pre-synaptic marker Synapsin1 and, to a lesser extent, with the post synaptic marker Homer and DCV marker chromogranin B (new Figure 1). This indicates that RPH3A is highly enriched in synapses, mostly the pre-synapse, and that RPH3A partly co-localizes with DCVs.  

      (ii) The description of the experimental approaches lacks detail in several places, thus complicating a stringent assessment. 

      We apologize for the lack of detail in explaining the experimental approaches. We have included a more detailed description in the revised manuscript. 

      (iii) Further analyses of the LDCV secretion data (e.g. latency, release time course) would be important in order to help pinpoint the secretory step affected by Rabphilin-3A. 

      We agree. To address this comment, we have now included the duration of the fusion events (new Figure S2D-F). The start time of the fusion events are shown in the cumulative plots in now Figure 3F and I. The kinetics are normal in the RPH3A KO neurons.

      (iv) It remains unclear why a process that affects a general synaptic SNARE fusion protein - SNAP25 - would specifically affect LDCV but not synaptic vesicle fusion. 

      We agree that we have not addressed this issue systematically enough in the original manuscript. We have now added a short discussion on this topic in the Discussion of the revised manuscript (p 15, line 380-386). In brief, we do not claim full selectivity for the DCV pathway. Some effects of RPH3A deficiency on the synaptic vesicle cycle have been observed. Furthermore, because DCVs typically do not mix in the synaptic vesicle cluster and fuse outside the active zone (and outside the synapse), DCVs might be more accessible to RPH3A regulation.

      (v) The mechanistic links between Rabphilin-3A function, LDCV density in neurites, neurite outgrowth, and the proposed underlying mechanisms involving trophic factor release remain unclear. 

      We agree that we have not addressed all these links systematically enough in the original manuscript, although we feel that we have at least postulated the best possible working model to link RPH3A function to DCV exocytosis/neurotrophic factor release and neurite outgrowth (p 15-16, line 396-400). Of course, a single study cannot support all these links with sufficient experimental evidence. We have now added a short text on what we can conclude exactly based on our experiments and how we see the links between RPH3A function, DCV exocytosis/neurotrophic factor release, neurite outgrowth and DCV density in neurites (p 13-14, line 317-325).

      Reviewer #1 (Public Review): 

      Summary:

      The manuscript by Hoogstraaten et al. investigates the effect of constitutive Rabphilin 3A (RPH3A) ko on the exocytosis of dense core vesicles (DCV) in cultured mouse hippocampal neurons. Using mCherry- or pHluorin-tagged NPY expression and EGFP- or mCherry tagged RPHA3, the authors first analyse the colocalization of DCVs and RPH3A. Using FRAP, the authors next analyse the mobility of DCVs and RAB3A in neurites. The authors go on to determine the number of exocytotic events of DCVs in response to high-frequency electrical stimulation and find that RPH3A ko increases the number of exocytotic events by a factor 2-3, but not the fraction of released DCVs in a given cell (8x 50Hz stim). In contrast, the release fraction is also increased in RBP3A KOs when doubling the stimulation number (16x 50Hz). They further observe that RPH3A ko increases dendrite and axon length and the overall number of ChgrB-positive DCVs. However, the overall number of DCVs and dendritic length in ko cells directly correlate, indicating that the number of vesicles per dendritic length remains unaffected in the RPH3A KOs. Lentiviral co-expression of tetanus toxin (TeNT) showed a non-significant trend to reduce axon and dendrite length in RPH3a KOs. Finally, the authors use co-expression of RAB3A and SNAP25 constructs to show that RAB3A but not SNAP25 interaction is required to allow the exocytosis-enhancing effect in RPH3A KOs. 

      While the authors' methodology is sound, the microscopy results are performed well and analyzed appropriately, but their results in larger parts do not sufficiently support their conclusions. Moreover, the experiments are not always described in sufficient detail (e.g. FRAP; DCV counts vs. neurite length) to fully understand their claims. 

      Overall, I thus feel that the manuscript does not provide a sufficient advance in knowledge. 

      Strengths: 

      - The authors' methodology is sound, and the microscopy results are performed well and analyzed appropriately. 

      - Figure 2: The exocytosis imaging is elegant and potentially very insightful. The effect in the RPH3A KOs is convincing. 

      - Figure 4: the logic of this experiment is elegant. It shows that the increased number of DCV fusion events in RPH3A KOs is related to the interaction of RPH3A with RAB3A but not with SNAP25. 

      We thank the reviewer for their positive evaluation of our manuscript.

      Weaknesses: 

      - The results in larger parts do not sufficiently support the conclusions. 

      - The experiments are not always described in sufficient detail (e.g. FRAP; DCV counts vs. neurite length) to fully understand their claims. 

      - Not of sufficient advance in knowledge for this journal 

      - The significance of differences in control experiments WT vs. KO) varies between experiments shown in different figures. 

      - Axons and dendrites were not analyzed separately in Figures 1 and 2. 

      - The colocalization study in Figure 1 would require super-resolution microscopy. 

      To address the reviewers’ comments, we have provided a more detailed explanation of our analysis (p 19-20, line 521-542). In addition, we have repeated our colocalization experiments using STED microscopy, see Joint Public Review item (i).  

      Reviewer #2 (Public Review): 

      Summary: 

      Hoogstraaten et al investigated the involvement of rabphilin-3A RPH3A in DCV fusion in neurons during calcium-triggered exocytosis at the synapse and during neurite elongation. They suggest that RPH3A acts as an inhibitory factor for LDV fusion and this is mediated partially via its interaction with SNAP25 and not Rab3A/Rab27. It is a very elegant study although several questions remain to be clarified. 

      Strengths: 

      The authors use state-of-the-art techniques like tracking NPY-PHluorin exocytosis and FRAP experiments to quantify these processes providing novel insight into LDCs exocytosis and the involvement of RPH3A. 

      We thank the reviewer for their positive evaluation of our manuscript.

      Weaknesses: 

      At the current state of the manuscript, further supportive experiments are necessary to fully support the authors' conclusions. 

      We thank the reviewer for their comments and suggestions. We have performed additional experiments to support our conclusions, see Joint Public Review items (i) – (iv)

      Reviewer #3 (Public Review): 

      Summary: 

      The molecular mechanism of regulated exocytosis has been extensively studied in the context of synaptic transmission. However, in addition to neurotransmitters, neurons also secrete neuropeptides and neurotrophins, which are stored in dense core vesicles (DCVs). These factors play a crucial role in cell survival, growth, and shaping the excitability of neurons. The mechanism of release for DCVs is similar, but not identical, to that used for SV exocytosis. This results in slow kinetic and low release probabilities for DCV compared to SV exocytosis. There is a limited understanding of the molecular mechanisms that underlie these differences. By investigating the role of rabphilin-3A (RPH3A), Hoogstraaten et al. uncovered for the first time a protein that inhibits DCV exocytosis in neurons. 

      Strengths: 

      In the current work, Hoogstraaten et al. investigate the function of rabphilin-3A (RPH3A) in DVC exocytosis. This RAB3 effector protein has been shown to possess a Ca2+ binding site and an independent SNAP25 binding site. Using colocalization analysis of confocal imaging the authors show that in hippocampal neurons RPH3A is enriched at pre- and post-synaptic sites and associates specifically with immobile DCVs. Using site-specific RPH3A mutants they found that the synaptic location was due to its RAB3 interaction site. They further could show that RPH3A inhibits DCV exocytosis due to its interaction with SNAP25. They came to that conclusion by comparing NPY-pHluorin release in WT and RPH3A KO cells and by performing rescue experiments with RPH3A mutants. Finally, the authors showed that by inhibiting stimulated DCV release, RPH3A controlled the axon and dendrite length possibly through the reduced release of neurotrophins. Thereby, they pinpoint how the proper regulation of DCV exocytosis affects neuron physiology. 

      We thank the reviewer for their positive evaluation of our manuscript.

      Weaknesses: 

      Data context 

      One of the findings is that RPH3A accumulates at synapses and is mainly associated with immobile DCVs.

      However, Farina et al. (2015) showed that 66% of all DCVs are secreted at synapses and that these DCVs are immobile prior to secretion. To provide additional context to the data, it would be valuable to determine if RPH3A KO specifically enhances secretion at synapses. Additionally, the authors propose that RPH3A decreases DCV exocytosis by sequestering SNAP25 availability. At first glance, this hypothesis appears suitable. However, due to RPH3A synaptic localization, it should also limit SV exocytosis, which it does not. In this context, the only explanation for RPH3A's specific inhibition of DCV exocytosis is that RPH3A is located at a synapse site remote from the active zone, thus protecting the pool of SNAP25 involved in SV exocytosis from binding to RPH3A. This hypothesis could be tested using super-resolution microscopy. 

      We thank the reviewer for their suggestion. We have now performed super resolution microscopy, see Joint Public Review item (i). However, these new data do not necessarily explain the stronger effect of RP3A deficiency on DCV exocytosis, relative to SV exocytosis. We have added a short discussion on this topic to the revised manuscript, see Joint Public Review item (iv).

      Technical weakness 

      One technical weakness of this work consists in the proper counting of labeled DCVs. This is significant since most findings in this manuscript rely on this analysis. Since the data was acquired with epi-fluorescence or confocal microscopy, it doesn't provide the resolution to visualize individual DCVs when they are clumped. The authors use a proxy to count the number of DCVs by measuring the total fluorescence of individual large spots and dividing it by the fluorescence intensity of discrete spots assuming that these correspond to individual DCVs. This is an appropriate method but it heavily depends on the assumption that all DCVs are loaded with the same amount of NPY-pHluorin or chromogranin B (ChgB). Due to the importance of this analysis for this manuscript, I suggest that the authors show that the number of DCVs per µm2 is indeed affected by RPH3A KO using super-resolution techniques such as dSTORM, STED, SIM, or SRRF. 

      The reviewer is correct that this is a crucial issue, that we have not addressed optimally until now. We have previously devoted a large part of a previous manuscript to this issue, but have not referred to this previous work clearly enough. We have now clarified this (p 7, line 187-190). In brief, we have previously quantified the ratio between fluorescent intensity of ChgB and NPY-pHluorin in confocal microscopy over the number of dSTORM puncta in sparse areas of WT mouse hippocampal neurons (Persoon et al., 2018). This quantification yielded a unitary fluorescence intensity per vesicle that was very stable of different neurons. Although there might be some underestimation of the total number of DCVs when using confocal microscopy, the study of Persoon et al. (2018) has demonstrated that these parameters correlate well and that the estimations are accurate. Considering that the rF/F0 is similar in RPH3A WT and KO neurons (now Figure S2I), meaning that the intensity of NPY-pHluorin of one fusion event is comparable, we can presume that this correlation also applies for the RPH3A KO neurons.

      Recommendations for the authors:

      Reviewer #1 (Recommendations For The Authors): 

      Major points: 

      (1) The authors perform an extensive analysis regarding the colocalization of RPH3A and DCVs (Figure 1 upper part). This analysis is hampered by the fact that the recorded data has in relation to vesicle size limited resolution (> 1 µm) to allow making strong claims here. In my view, super-resolution microscopy would be required for the co-localization studies shown in Figure 1. 

      We fully agree and have now performed super-resolution microscopy, see Joint Public Review item (i)

      (2) The FRAP experiments (Figure 1 lower part) cannot be sufficiently understood from what is presented. The methods say that both laser channels were activated during bleaching but NPY-pHluorin is not bleached in Fig.1E. Explanation of the bleaching is not very circumspect. In 1D, it is rather EGFP-RPH3A that is entering the bleached area than the NPY vesicles. These experiments require a more careful explanation of methodology, observed results, and their interpretation. Overall, the observed effects in the original kymograph traces require a better explanation. 

      We acknowledge that NPY-pHluorin in Figure 1E (now Figure 2C) is not completely bleached. NPY-pHluorin appeared to be more difficult to bleach than NPY-mCherry. However, it is important to clarify that we merely bleached the neurites to remove the stationary puncta and facilitate our analysis of DCV/RPH3A dynamics. This bleaching step does not affect the interpretation of our results. We apologize that this was not clearly stated in the text and have made the necessary adjustments in legend, results- and methods section, (p 6-7, line 162-163; p 5, line 140-142 and p 19, line 508-513). Additionally, we apologize for the accidental switch of the kymographs for NPY-mCherry and EGFP-RPH3A in Figure 1D (now Figure 2B, C). We greatly appreciate identifying this error.  

      (3) Figure 1: The authors need to mention whether axons, dendrites, or both were analyzed throughout the different panels and how they were identified. Is it possible that axons were wrapping around dendrites in their cultures (compare e.g. Shimojo et al., 2015)? Given the limited spatial resolution and because of this wrapping, interpretation of results could be affected. 

      We completely agree with the reviewer’s assessment and conclusion. We are unable to distinguish axons from dendrites using this experimental design. We have made sure to specify in the text that our observation that RPH3A does not co-travel with DCVs is true for both dendrites and axons, (p 5, line 150).

      (4) Figure 2: The exocytosis imaging is elegant and potentially very insightful. The effect in the RPH3A KOs is convincing. However, the authors determine the efficacy of exocytosis from NPY-pHluorin unquenching of DCVs only. This is only one of several possible parameters to read out the efficiency of exocytosis. Kinetics like e.g. delay between stimulation and start of exocytosis events or release time course of NPY after DCV fusion were not determined. Such analysis could give a better insight into what process before or after the fusion of DCVs is affected by RPH3A ko. 

      We fully agree with the reviewer. We have now included the duration of the fusion events (new Figure S2D-F). The start time of the fusion events are shown in the cumulative plots in now Figure 3F and I. The kinetics are normal in the RPH3A KO neurons.

      Moreover, it needs to be mentioned whether 2C and D are from WT or ko cultures. It would be best to show representative examples from both genotypes. 

      We have now adjusted this in the new figure (now Figure 3C, D).

      The number of fusion events is much increased but the release fraction is not significantly changed. While this is consistent with results in Figure 4C it is at variance with 4F. This raises questions about the reliability of the effects in RPH3A KOs. 

      The release fraction indicates the number of fusion events normalized to the total DCV pool. In Figure 4D, we observed a slightly bigger pool size, which explains the lack of significance when analyzing the released fraction. In Figure 4G, however, DCV pool sizes are similar between KO and WT, leading to a statistically significant effect on release fraction in KO neurons. Furthermore, Figures 4B and E distinctly show a substantial increase in fusion events in RPH3A KO neurons. This variability in pool size observed could potentially be attributed to variation in culture or inherent biological variability.

      Given the increased number of ChgrB-positive DCVs in RPH3A KOs (shown in Figure 2) and that only the cumulative number of exocytosis events were analysed, how can the authors exclude that the RPH3A ko only affects vesicle number but not release, if the % change in released vesicles is not different to WT? Kinetics of release don't seem to be affected. Importantly, what was the density of NPY-pHluorin vesicles in WT vs. ko? 

      In Figure 2 (now Figure 5) we show that RPH3A KO neurons are larger and contain more endogenous ChgB+ puncta than WT neurons. This increased number of ChgrB+ puncta scales with their size as puncta density is not increased. A previous study (Persoon et al., 2018) has demonstrated a strong correlation between DCV number and neuron size. Our data show that RPH3A deficiency increased DCV exocytosis, but the released fraction of vesicles depends on the total number of DCVs, which we determined during live recording by dequenching NPY-pHluorin using NH4+. Considering that this is an overexpression of a heterologous DCV-fusion reporter, and not endogenous staining of DCVs, as in the case of ChgrB+ puncta, some variability is not unexpected.

      Also in these experiments, the question arises of whether the authors analyse axons, dendrites, or both throughout the different panels and how they were identified. 

      In our experimental design we record all fusion events per cell, including both axons and dendrites but excluding the cell soma. We have clarified this in the method section, (p 19, line 508 and p 19, line 521-522).

      (5) Figure 3: in D the authors show that ChgrB-pos. DCV density is slightly increased in KOs. How does this relate to the density of NPY-pHluorin DCVS in Figure 2? 

      We do not observe a difference in NPY-pHluorin density (see Author response image 1). However, it is important to note that we relied on tracing neurites in live recording images to determine the neuronal size. In contrast, the ChgB density was based on dendritic length using MAP2 (post-hoc) staining was limited. In addition, Chgr+ puncta represent an endogenous DCV staining, NPY-pHluorin quantification is based on overexpression of a heterologous DCV-fusion reporter. These two factors likely contribute some variability.

      Author response image 1.

      The authors show a non-significant trend of TeNT coexpression to reduce axon and dendrite lengths in RPH3A KOs. While this trend is visible, I think one cannot draw conclusions from that when not reaching significance. The argument of the authors that the increased axon and dendrite lengths are created by growth factor peptide release from DCV during culture time is interesting. However, the fact that TeNT expression shows a trend toward reducing this effect on axons/dendrites is not sufficient to prove the release of such growth factors. 

      We agree. We have toned down this speculation in the revised manuscript, (p 15-16, line 395-400).

      Lastly, the authors don't provide insight into the mechanisms, of how RPH3A ko increases the number of DCVs per µm dendritic length in the neurons. In my view, there are too many loose ends in this story of how RPH3A ko first increases spontaneous release of DCVs and then enhances neurite growth and DCV density. Did the authors e.g. measure the spontaneous release of DCVs in their cultures? 

      We measured spontaneous release of DCVs during the 30s baseline recording prior to stimulation. We observed no difference in spontaneous release between WT and KO neurons (now Figure S2H). However, baseline recording lasted only 30 seconds. It is possible that this was too short to detect subtle effects.

      Other points: 

      (1) Figure 4: the logic of this experiment is elegant. It shows that the increased number of DCV fusion events in RPH3A KOs is related to the interaction of RPH3A with RAB3A but not with SNAP25. As mentioned above, it is irritating that the reduction of fusion events in KOs and on the release fraction is sometimes reaching significance, but sometimes it does not. Likewise, the absence of significant effects on DCV numbers is not consistent with the results shown in Figures 3C and D. 

      DCV numbers in Figure 3 (now Figure 5) are determined by staining for endogenous ChgB, whereas in Figure 4D and G DCV numbers are determined by overexpressing NPY-pHluorin and counting the dequenched puncta following a NH4+ puff.

      (2) Figure 1B: truncation of the y-axis needs to be clearly indicated. 

      We have replaced this figure with new Figure 1 and have indicated truncations of the y-axis when needed (new Figure 1E). 

      (3) Page 10: "Given that neuropeptides are key modulators of adult neurogenesis (Mu et al., 2010), and that RPH3A depletion leads to increased DCV exocytosis, it is coherent that we observed longer neurites in RPH3A KO neurons." I cannot follow the argument of the authors here: what has neurogenesis to do with neurite length? 

      We apologize for the confusion. We have clarified this in the revised text, (p 16, line 398-400).

      Minor point: 

      There are some typos in the manuscript. e.g., page 8: "... may partially dependent on regulated secretion...); page 6: "...to dequence all...". 

      Thank you for noticing, we have corrected the typos.

      Reviewer #2 (Recommendations For The Authors): 

      (1) Supplementary Figure S1A, in my opinion, should be in Figure 1A as it illustrates all the constructs used in this study and helps the reader to follow it up. 

      We thank the reviewer for their suggestion. However, we feel that with the adjustments we have made in Figure 1, the illustrations of the constructs fit better in Figure S1, since new Figure 1 shows the localization of endogenous RPH3A and not that of the constructs.  

      (2) One of the conclusions of the manuscript is the synaptic localization of the different RPH3A mutants. The threshold for defining synaptic localization is not clear either from the images nor from the analysis: for example, the Menders coefficient for VGut1-Syn1 which is used as a positive control, ranges from 0.65-0.95 and that of RPH3A and Syn1 ranges from 0.5-0.95. These values should be compared to all mutants and the conclusions should be based on such comparison. 

      We agree. We have now repeated our initial co-localization experiment with all the RPH3A mutants (now Figure S1D-F).  

      (3) Strengthening this figure with STED/SIM/dSTORM microscopy can verify and add a new understanding of the subtle changes of RPH3A localization. 

      We fully agree and have now added super-resolution microscopy data, see Joint Public Review item (i).

      (4) As RAB3A/RAB27A (ΔRAB3A/RAB27A) loses the punctate distribution, please clarify how can it function at the synapse and not act as a KO. Is it sorted to the synapse and how does it is sorted to the synapse? 

      We used lentiviral delivery to introduce our constructs, resulting in the overexpression of ΔRAB3A/RAB27A mutant RPH3A. This overexpression likely compensates for the loss of the punctate distribution of RPH3A, thereby maintaining its limiting effect on DCV exocytosis. It is plausible that under physiological conditions, the mislocalization of RPH3A would lead to increased exocytosis, similar to what we observed in the KO. 

      (5) Is RPH3A expressed in both excitatory and inhibitory neurons? 

      We agree this is an important question. Single cell RNA-seq already suggests the protein is expressed in both, but we nevertheless decided to test expression of RPH3A protein in excitatory and inhibitory neurons, using immunocytochemistry with VGAT and VGLUT as markers in hippocampal and striatal WT neurons. We found that RPH3A is expressed in both VGLUT+ hippocampal neurons and VGAT+ striatal neurons (new Figure S1A, B).  

      (6) The differential use of ChgB and NPY as markers for DCVs should be clarified and compared as these are used at different stages of the manuscript. 

      We have previously addressed the comparison between ChgB and NPY-pHluorin (Persoon et al., 2018). We made sure to indicate this more clearly throughout the manuscript to clarify the use of the two markers. 

      (7) FRAP experiments- A graph describing NPY recovery should be added as a reference to 2H and discussed. 

      We agree. We have made the necessary adjustments (new Figure 2G).

      (8) Figure 2E shows some degree of "facilitation" between the 2 8x50 pulses RPH3A KO neurons. Can the author comment on that? What was the reason for using this dual stimulation protocol? 

      There is indeed some facilitation between the two 8 x 50 pulses in KO neurons and to a lesser extent also in the WT neurons, which we have observed before in WT neurons (Baginska et al., 2023). Baginska et al. (2023) showed recently that different stimulation protocols can influence certain fusion dynamics, like the ratio of persistent and transient events and event duration. We used two different stimulation protocols to thoroughly investigate the effect of RPH3A on exocytosis, and assess the robustness of our findings regarding the number of fusion events. Fusion kinetics was similar in WT an KO neurons for both stimulation protocols (new Figure 2D-F).

      (9) Figure 3 quantifies dendrites length and then moves to quantify both axon and dendrites for the Tetanus toxin experiment. What are the effects of KO on axon length? In the main figures, it is not mentioned but in S3 it seems not to be affected. How does it reconcile with the main conclusion on neurite length? 

      Figure 3H (now Figure 6C) shows the effect of the KO on axon length: the axon length is increased in RPH3A KO neurons compared to WT, similar to dendrite length. Re-expressing RPH3A in KO neurons rescues axonal length to WT levels. In Figure S3, we observe a similar trend as in main Figure 3 (new Figure 6), yet this effect did not reach significance. Based on this, we concluded that neurite length is increased upon RPH3A depletion.

      (10) For lay readers, please explain the total pool and how you measured it. However, see the next comment. 

      We agree. We have now defined this better in the revised manuscript, (p 19, line 524-527 and p 20, line 535-539).

      (11) It is a bit hard to understand if the total number of DCV was increased in the KO and if the pool size was increased and in which figure it is quantified. Some sentences like: "A trend towards a larger intracellular DCV pool in KO compared to WT neurons was observed" do not fit with "No difference in DCV pool size was observed between WT and KO neurons (Figure S2D)" or with "During stronger stimulation (16 bursts of 50 APs at 50 Hz), the total fusion and released fraction of DCVs were increased in KO neurons compared to WT". They are not directly supported, or not related to specific figures. Please indicate if the total DCVs pool, as measured by NH4, was increased and based on that, the fraction of the releasable DCVs following the long stimulation. From Figure 2H, the conclusion is an increase in fusion events. In general, NH4 is not quantified clearly- is it quantified in Figure S2C? And if it is a trend, how can it become significant in Figure 3? 

      We agree there has been some inconsistency in the way we describe the data on the total number of DCVs. We have addressed this in the revised text to ensure better clarity. The total DCV pool measured by NPY-pHluorin was not significantly increased in KO neurons, we see a trend towards a bigger DCV pool in the 2x8 50 Hz stimulation paradigm (now Figure S2C), therefore the released fraction of vesicles is not increased in Figure 1G (now Figure 3G). The number of DCV in Figure 3 (now Figure 5) is based on endogenous ChgB staining and not overexpression like the DCV pool measured by NPY-pHluorin. In Figure 3 (now Figure 5) we show that RPH3A KO neurons have slightly more ChgB+ puncta compared to WT.

      (12) In Figure 3, the quantification is not clear, discrete puncta are not visible but rather a smear of chromogranin staining. How was it quantified? An independent method to count DCV number, size, and distribution like EM is necessary to support and add further understanding. 

      We acknowledge that discrete ChgB puncta are not completely visible in Figure 3 (now Figure 5). Besides the inherent limitation in resolution with confocal imaging, we believe that this is due to ChgB accumulation in the KO neurons, as shown in now Figure 5D. Nonetheless, to address this concern of the reviewer, we have selected other images that represent our dataset (now Figure 5A). Furthermore, the number of ChgB+ DCVs was calculated using SynD software (Schmitz et al., 2011; van de Bospoort et al., 2012) (see previous reply). EM would offer valuable independent confirmation on the total DCV number, size and distribution. However, with the current method we already know that vesicle numbers are at least similar. Does that justify the (major) investment in a quantitative EM study? Moreover, this issue does not affect the central message of the current study.

      (13) Can the author discuss if the source of DCVs that are released at the synapse is similar or different from the source of DCVs fused while neurites elongate? 

      With our current experimental design, we are unable to draw conclusions regarding this aspect. We are not sure how experiments to identify this source (probably the Golgi?) would be crucial to sustain the central message of our study.

      (14) An interesting and related question: what are the expression levels of RPH3A during development and neuronal growth during the nervous system development? 

      While we have not specifically examined the expression levels of RPH3A over development, public databases show that RPH3A expression increases over time in mice, consistent with other synaptic proteins (Blake et al., 2021; Baldarelli et al., 2021; Krupke et al., 2017). We have now added this to the revised manuscript (p 2, line 55-56).

      (15) The conclusion from Figure 4 about the contribution of SNAP25 interaction to RPH3A inhibitory effect is not convincing. The data are scattered and in many neurons, high levels of fusion events were detected. Further or independent experiments are needed to support this conclusion. For example, is the interaction with SNAP25 important for its inhibitory activity in other DCV-releasing systems like adrenal medulla chromaffin cells? 

      We agree that further studies in other DCV-releasing systems like chromaffin cells would provide valuable insight into the role of SNAP25 interaction in RPH3A’s inhibitory effect on exocytosis. However, we believe that starting new series of experiments in another model system is outside of the scope of our current study.

      (16) Furthermore, the number of DCVs in the KO is similar in this experiment, raising some more questions about the quantification of the number of vesicles, that differ, in different sections of the manuscript (points # 10,11). 

      The total DCV pool in the fusion experiments is measured by overexpression NPY-pHluorin, this cannot be directly compared to the number of endogenous ChgB+ DCV in Figure 3 (now Figure 5), see also item (11)

      (17) The statement - "RPH3A is the only negative regulator of DCV" is not completely accurate as other DCV inhibitors like tomosyn were described before. 

      We agree. By this statement, we intend to convey that RPH3A is the only negative regulator of DCVs without substantial impact on synaptic vesicle exocytosis, unlike Tomosyns. We have clarified this in the revised text, (p 15, line 366-367).

      (18) The support for the effect of KO on the "clustering of DCVs" is not convincing. 

      The intensity of endogenous ChgB puncta was decreased in RPH3A KO neurons (now Figure 5E). However, the peak intensity induced by single NPY-pHluorin labeled DCV fusion events (quanta) was unchanged (now Figure S2I). This indicates that the decrease in ChgB puncta intensity must be due to a reduced number of DCVs (quanta) in this specific location. We have interpreted that as ‘clustering’, or maybe ‘accumulation’. However, we only put forward this possibility. We are now more careful in our speculations within the text, (p 11 line 271-277).

      (19) Final sentence: "where RPH3A binds available SNAP25, consequently restricting the assembly of SNARE complexes" should be either demonstrated or rephrased as no effect of trans or general SNARE complex formation is shown. 

      We agree. We have made the necessary adjustments in the text, (p 15, line 387-389).   

      (20) A scheme summarizing RPH3A's interaction with synaptic proteins and its effects on DCVs release, maybe even versus its effects on SVs release, should be considered as a figure or graphic abstract. 

      We have included a working model in Figure 7.  

      (21) Figure 4 logically should come after Figure 2 to summarize the fusion-related chapter before moving to neurite elongation. 

      We have placed Figure 4 after Figure 2 (now Figure 3).

      Reviewer #3 (Recommendations For The Authors): 

      One important finding of this study is that RPH3A downregulates neuron size, possibly by inhibiting DCV release. Additionally, the authors demonstrated that the number of DCVs is directly proportional to the number of DCVs per µm2, and that RPH3A KO reduces DCV clustering. This conclusion was drawn by comparing ChgB with NPY-pHluorin loading of the DCVs. However, this comparison is not valid as ChgB is expressed at an endogenous level and NPY-pHluorin is over-expressed. In the KO situation where DCV exocytosis is enhanced, the available endogenous ChgB may be depleted faster than the overexpressed NPY-pHluorin. Hoogstraaten et al. should either perform a study in which ChgB is overexpressed to test whether the difference in DCV remains or at least provides an alternative interpretation of their data. 

      We thank the reviewer for this comment. The reviewer challenges one or two conclusions in our original manuscript (It is not entirely clear to what exactly “This conclusion” refers): (a) “the number of DCVs is directly proportional to the number of DCVs per µm2”, and (b) “that RPH3A KO reduces DCV clustering”. The reviewer probably means that the number of DCVs per neuron is directly proportional to size of the neuron (a) and states this (these) conclusion(s) are “not valid as ChgB is expressed at an endogenous level and NPY-pHluorin is over-expressed” because “endogenous ChgB may be depleted faster than the overexpressed NPY-pHluorin”. We have three arguments to conclude that faster depletion of ChgB cannot affect these two conclusions: (1) DCVs bud off from the Golgi with newly synthesized (fresh) ChgB. Whether or not a larger fraction of DCVs is released does not influence this initial ChgB loading into DCVs (together with over-expressed NPY-pHluorin); (2) in hippocampal neurons merely 1-6% of the total DCV pool undergoes exocytosis (the current study and also extensively demonstrated in Persoon et al., 2018). RPH3A KO neurons release few percent more of the total DCV pool. Hence, “depletion of ChgB” is only marginally different between experimental groups; and (c) the proposed experiment overexpressing ChgB will not help scrutinize our current conclusions as ChgB overexpression is known to affect DCV biogenesis and the total DCV pool, most likely much more than a few percent more release by RPH3A deficiency.

      Hoogstraaten et al. conducted a thorough analysis of the impact of RPH3A KO and its rescue using various mutants on dendrite and axon length (see Supplementary Figure 3). However, they did not test the effect of the ΔSNAP25 mutant. The authors demonstrated that this mutant is the least efficient in rescuing DCV exocytosis (Figure 4E). Hence the neurons expressing this mutant should have a similar size to the KO neurons. This finding would strongly support the argument that DCV exocytosis regulates neuron size. Otherwise, it would suggest that RPH3A may have a function in regulating exocytosis at the growth cones that is independent of SNAP25. Since the authors most probably have the data that allows them to measure the neuron size (acquired for Supplementary Figure 2), I suggest that they perform the required analysis. 

      We agree this is important and performed new experiments to determine the dendrite length of RPH3A WT, KO and KO neurons expressing the ΔSNAP25 mutant. We observed that the dendrite length of RPH3A KO neurons expressing ΔSNAP25 mutant is indeed similar to KO neurons (new Figure S3C). Although not significant we observe a clear trend towards bigger neurons compared to WT.  This strengthens our conclusion that increased DCV exocytosis contributes to the observed increased neuronal size.

      The authors displayed the result of DCV exocytosis in two ways. One is by showing the number of exocytosis events the other is to display the proportion of DCVs that were secreted. They do the latter by dividing the secreted DCV by the total number of DCVs. These are visualized at the end of the experiment through NH4+ application. While this method works well for synaptic secretion as the marker of SV is localized to the SV membrane and remains at the synapse upon SV exocytosis, it cannot be applied in the same manner when it is the DCV content that is labeled as it is released upon secretion. Hence, the total pool of vesicles should be the number of DCV counted upon NH4+ application in addition to those that are secreted. This way of analyzing the total pool of DCV might also explain the difference in this pool size between KO neurons stimulated two times with 8 stimuli instead of one time with 16 stimuli (Sup Fig 2 C and D). This is an important point as it affects the conclusions drawn from Figure 2. 

      We thank the reviewed for this comment. We agree, and we have made the necessary adjustments throughout the manuscript. 

      The kymogram of DCV exocytic events displayed in Figure 2D shows a majority of persistent (>20s long) events. This is strange as NPY-pHluori corresponds to the released cargo. Previous work using the same labeling and stimulation technique showed that content release occurs in less than 10s (Baginska et al. 2023). The authors should comment on that difference. 

      In Baginska et al. (2023), the authors distinguished between persistent and transient events. The transient events are shorter than 10s for the 2x8 and 16x stimulation paradigms, whereas persistent events can last for more than 10s. In our study we did not make this distinction. However, in response to this reviewer, we have now quantified the fusion duration per cell. These new data show that the mean duration is similar between genotypes for both stimulation paradigms. We have added these new data (new Figure S2D-F).

      In Figures 1D and E, some puncta in the kymogram appeared to persist after bleaching. This raises questions about the effectiveness of the bleaching procedure for the FRAP experiment. 

      The reviewer is correct that NPY-pHluorin in Figure 1E (now Figure 2C) is not fully bleached. NPY-pHluorin was more resistant to bleaching than NPY-mCherry. However, we merely bleached the neurites to facilitate our analysis by reducing fluorescence of the stationary puncta without causing phototoxicity. Some remaining fluorescence after bleaching does not affect our conclusions in any way.

      In the discussion, the paragraph titled "RPH3A does not travel with DCVs in hippocampal neurons" is quite confusing and would benefit from a streamlined explanation. 

      We thank the reviewed for this comment. We made the necessary adjustments to make this paragraph clearer, (p 14, line 339-351).

      First paragraph of page 8 "TeNT expression in KO neurons restored neurite length to WT levels. When compared to KO neurons without TeNT, neurite length was not significantly decreased but displayed a trend towards WT levels (Figure 3G, H)." These two sentences are confusing as they seem contradictory. 

      We agree that this conclusion has been too strong. However, we do not see a contradiction. The significant effect between KO and control neurons on both axon and dendrite length is lost upon TeNT expression (which forms the basis for our conclusions cited by the reviewer, now Figure 6B, C). While the difference between KO neurons +/- TeNT did not reach statistical significance. The (strong) trend is clearly in the same direction. We have refined our original conclusion in the revised manuscript, (p 12, line 304-306).

      The data availability statement is missing. 

      We have added the data availability statement, (p 21, line 571-572).

    1. Author response:

      The following is the authors’ response to the original reviews.

      Public Reviews:

      Reviewer #1 (Public Review):

      Summary:

      O'Leary and colleagues present data identifying several procedures that alter discrimination between novel and familiar objects, including time, environmental enrichment, Rac-1, context reexposure, and brief reminders of the familiar object. This is complimented with an engram approach to quantify cells that are active during learning to examine how their activation is impacted following each of the above procedures at test. With this behavioral data, authors apply a modeling approach to understand the factors that contribute to good and poor object memory recall.

      We thank the Reviewer for summarizing the scope and depth of our manuscript, and indeed for recognizing our efforts. We engage below with the Reviewer’s specific criticisms.

      Strengths:

      Authors systematically test several factors that contribute to poor discrimination between novel and familiar objects. These results are extremely interesting and outline essential boundaries of incidental, nonaversive memory.<br /> These results are further supported by engram-focused approaches to examine engram cells that are reactivated in states with poor and good object recognition recall.

      We thank the Reviewer for these positive comments.

      Weaknesses:

      For the environmental enrichment, authors seem to suggest objects in the homecage are similar to (or reminiscent of) the familiar object. Thus, the effect of improved memory may not be related to enrichment per se as much as it may be related to the preservation of an object's memory through multiple retrievals, not the enriching experiences of the environment itself. This would be consistent with the brief retrieval figure. Authors should include a more thorough discussion of this.

      This is one of the main issues highlighted by the Editor and the Reviewers. We agree that these results dove-tail with the reminder experiments. We have included additional discussion, see line 510-546.

      Authors should justify the marginally increased number of engram cells in the non-enrichment group that did not show object discrimination at test, especially relative to other figures. More specific cell counting criteria may be helpful for this. For example, was the DG region counted for engram and cfos cells or only a subsection?

      There was a marginal, but non-significant increase in the number of labelled cells within the standard housed mice in Figure 3f. The cell counting criteria was the same across experimental groups and conditions, where the entire dorsal and ventral blade of the dorsal DG was counted for each animal. This non-statistically significant variance may be due to surgical and viral spread difference between mice. We have clarified this in the manuscript, see line 229-232.

      It is unclear why the authors chose a reactivation time point of 1hr prior to testing. While this may be outside of the effective time window for pharmacological interference with reconsolidation for most compounds, it is not necessarily outside of the structural and functional neuronal changes accompanied by reconsolidation-related manipulations.

      A control experiment was performed to demonstrated that a brief reminder exposure of 5 mins on its own was insufficient to induce new learning that formed a lasting memory (Supplementary Figure S4a). Mice given only a brief acquisition period of 5 mins, exhibited no preference for the novel object when tested 1 hour after training, suggesting the absence of a lasting object memory (Supplementary Figure S4b & c). We therefore used the 1-hour time point for the brief reminder experiment in Figure 4a. We have clarified this within the manuscript and supplementary data see line 258-264.

      Figure 5: Levels of exploration at test are inconsistent between manipulations. This is problematic, as context-only reexposures seem to increase exploration for objects overall in a manner that I'm unsure resembles 'forgetting'. Instead, cross-group comparisons would likely reveal increased exploration time for familiar and novel objects. While I understand 'forgetting' may be accompanied by greater exploration towards objects, this is inconsistent across and within the same figure. Further, this effect is within the period of time that rodents should show intact recognition. Instead, context-only exposures may form a competing (empty context) memory for the familiar object in that particular context.

      The Reviewer raises an important question, and we agree with the Reviewer that there should be caution and qualification around interpreting these results as “forgetting”. Indeed, for the context-only rexposures, cross-group comparisons show increased exploration time for familiar and novel objects. As the mice exhibit relatively high exploration of both the novel and familiar objects. An alternative explanation would be that the mice have not truly forgotten the familiar object, but rather as the mouse has not seen the familiar object in the last 6 context only sessions, its reappearance makes it somewhat novel again. Therefore, this change in the object’s reappearance triggers the animal’s curiosity, and in turn drives exploration by the animal. In addition, the context-only exposures may form a competing memory for the familiar object in that particular context. We have highlighted this in the results and also included greater discussion. See lines 306-315.

      I am concerned at the interpretation that a memory is 'forgotten' across figures, especially considering the brief reminder experiments. Typically, if a reminder session can trigger the original memory or there is rapid reacquisition, then this implies there is some savings for the original content of the memory. For instance, multiple context retrievals in the absence of an object reminder may be more consistent with procedures that create a distinct memory and subsequently recruit a distinct engram.

      These findings raise an important question regarding the interpretation of ‘forgetting’. If a reminder trial or experience can trigger the original memory, or there is rapid reacquisition, then this would suggest there is a degree of savings for the original memory content (85, 86). Previous work has emphasized retrieval deficits as a key characteristic of memory impairment, supporting the idea that memory recall or accessibility may be driven by learning feedback from the environment (7, 8, 14–18). Within our behavioral paradigm, a lack of memory expression would still constitute forgetting due to the loss of learned behavioral response in the presence of natural retrieval cues. The changes in memory expression may therefore underlie the adaptive nature of forgetting. This is consistent with the idea that the engram is intact and available, but not accessible. Here we studied natural forgetting, and our data showing memory retrieval following optogenetic reactivation demonstrates that the original engram persists at a cellular level, otherwise activation of those cells would no longer trigger memory recall. We also agree with the reviewer that multiple context retrievals may indeed lead to the formation of a second distinct engram that competes with the original. Recent work suggests that retroactive interference emerges from the interplay of multiple engrams competing for accessibility (18). We have added clarification and included extra discission of this interpretation. See lines 589-598.

      Authors state that spine density decreases over time. While that may be generally true, there is no evidence that mature mushroom spines are altered or that this is consistent across figures. Additionally, it's unclear if spine volume is consistently reduced in reactivated and non-reactivated engram cells across groups. This would provide evidence that there is a functionally distinct aspect of engram cells that is altered consistently in procedures resulting in poor recognition memory (e.g. increased spine density relative to spine density of non-reactivated engram cells and non-engram cells)

      We thank the Reviewer for their helpful comments on explaining our engram dendritic spine data. We agree with the Reviewer that an analysis of the changes in spine type, as well as the difference between engram and non-engram spines as well and reactivation and non-reactivated engram spines would be interesting and may help to further illuminate the morphological changes of forgetting and memory retrieval. Indeed, future analysis could determine if spine density is reduced in reactivated and non-reactivated engram cells or indeed across engram non-engram cells within different learning conditions. This avenue of investigation could determine if there is a functionally distinct aspect of engram cells that are altered following forgetting (67). However, such analysis is beyond the scope of this study. We have highlighted this limitation and included its discussion. See lines 493-499.

      Authors should discuss how the enrichment-neurogenesis results here are compatible with other neurogenesis work that supports forgetting.

      We validated the effectiveness of the enrichment paradigm to enhance neural plasticity by measuring adult hippocampal neurogenesis. The hippocampus has been identified as one of the only regions where postnatal neurogenesis continues throughout life (75). Levels of adult hippocampal neurogenesis do not remain constant throughout life and can be altered by experience (41–43, 57).  In addition, adult born neurons have been shown to contribute to the process of forgetting (74, 78, 79). Although the contribution of adult born neurons to cognition and the memory engram is not fully understood (80, 81). Mishra et al, showed that immature neurons were actively recruited into the engram following a hippocampal-dependent task (67). Moreover, increasing the level of neurogenesis rescued memory deficits by restoring engram activity (67). Augmenting neurogenesis further rescued the deficits in spine density in both immature and mature engram neurons in a mouse model of Alzheimer’s disease (67). Whether neurogenesis alters spine density on differentially for reactivated or non-reactivation engrams cells remains to be investigated (67, 68). This avenue of research would help to illuminate the morphological changes following forgetting and provide evidence if there is a functionally distinct aspect of engram cells that is altered in forgetting (67, 68). Our engram labelling strategy which utilized c-fos-tTA transgenic mice combined with an AAV9-TRE-ChR2-eYFP virus does not necessarily label sufficient immature neurons. Future work could utilize a different engram preparation, such as a genetic labelling strategy (TRAP2) or using a different immediate early gene promoter such as Arc to investigate the contribution of new-born neurons to the engram ensemble. We have added additional discussion of how our work fits with previous literature investigating neurogenesis and forgetting. See lines 547-565.

      Reviewer #2 (Public Review):

      Summary:

      The manuscript examines an important question about how an inaccessible, natural forgotten memory can be retrieved through engram ensemble reactivation. It uses a variety of strategies including optogenetics, behavioral and pharmacological interventions to modulate engram accessibility. The data characterize the time course of natural forgetting using an object recognition task, in which animals can retrieve 1 day and 1 week after learning, but not 2 weeks later. Forgetting is correlated with lower levels of cell reactivation (c-fos expression during learning compared to retrieval) and reduction in spine density and volume in the engram cells. Artificial activation of the original engram was sufficient to induce recall of the forgotten object memory while artificial inhibition of the engram cells precluded memory retrieval. Mice housed in an enriched environment had a slower rate of forgetting, and a brief reminder before the retrieval session promoted retrieval of a forgotten memory. Repeated reintroduction to the training context in the absence of objects accelerated forgetting. Additionally, activation of Rac1-mediated plasticity mechanisms enhanced forgetting, while its inhibition prolonged memory retrieval. The authors also reproduce the behavioral findings using a computational model inspired by Rescorla-Wagner model. In essence, the model proposes that forgetting is a form of adaptive learning that can be updated based on prediction error rules in which engram relevancy is altered in response to environmental feedback.

      We thank the Reviewer for summarizing the scope and depth of our manuscript, and for recognizing our efforts. We engage below the Reviewer’s specific criticisms of our interpretations.

      Strengths:

      (1) The data presented in the current paper are consistent with the authors claim that seemingly forgotten engrams sometimes remain accessible. This suggests that retrieval deficits can lead to memory impairments rather than a loss of the original engram (at least in some cases).

      We thank the Reviewer for their positive summary.

      (2) The experimental procedures and statistics are appropriate, and the behavioral effects appear to be very robust. Several key effects are replicated multiple times in the manuscript.

      We thank the Reviewer for their positive comments.

      Weaknesses:

      (1) My major issue with the paper is the forgetting model proposed in Figure 7. Prior work has shown that neutral stimuli become associated in a manner similar to conditioned and unconditioned stimuli. As a result, the Rescorla-Wagner model can be used to describe this learning (Todd & Homes, 2022). In the current experiments, the neutral context will become associated with the unpredicted objects during training (due to a positive prediction error). Consequently, the context will activate a memory for the objects during the test, which should facilitate performance. Conversely, any manipulation that degrades the association between the context and object should disrupt performance. An example of this can be found in Figure 5A. Exposing the mice to the context in the absence of the objects should violate their expectations and create a negative prediction error. According to the Rescorla-Wagner model, this error will create an inhibitory association between the context and the objects, which should make it harder for the former to activate a memory of the latter (Rescorla & Wagner, 1972). As a result, performance should be impaired, and this is what the authors find. However, if the cells encoding the context and objects were inhibited during the context-alone sessions (Figure 5D) then no prediction error should occur, and inhibitory associations would not be formed. As a result, performance should be intact, which is what the authors observe.

      What about forgetting of the objects that occurs over time? Bouton and others have demonstrated that retrieval failure is often due to contextual changes that occur with the passage of time (Bouton, 1993; Rosas & Bouton, 1997, Bouton, Nelson & Rosas, 1999). That is, both internal (e.g. state of the animal) and external (e.g. testing room, chambers, experimenter) contextual cues change over time. This shift makes it difficult for the context to activate memories with which it was once associated (in the current paper, objects). To overcome this deficit, one can simply re-expose animals to the original context, which facilitates memory retrieval (Bouton, 1993). In Figure 2D, the authors do something similar. They activate the engram cells encoding the original context and objects, which enhances retrieval.

      Therefore, the forgetting effects presented in the current paper can be explained by changes in the context and the associations it has formed with the objects (excitatory or inhibitory). The results are perfectly predicted by the Rescorla-Wagner model and the context-change findings of Bouton and others. As a result, the authors do not need to propose the existence of a new "forgetting" variable that is driven by negative prediction errors. This does not add anything novel to the paper as it is not necessary to explain the data (Figures 7 and 8).

      We thank the reviewer for clearly explaining their concern about our model. We are very sorry that we did not sufficiently explain that our model is, in fact, based on the classic Rescorla-Wagner model. The key equation of the model that updates “engram strength”  is equivalent to the canonical Rescorla-Wagner model that is commonly used in research on reinforcement learning and decision-making (105). One potential minor difference is that we crucially assume different learning rates for positive and negative prediction errors. However, this variant of the Rescorla-Wagner model is common in the computational literature and is generally not regarded as a qualitatively different kind of model. In fact, it allows us to capture that establishing an object-context association (after a positive prediction error) is faster than the forgetting process (through negative errors).

      The other equations that are explained in detail in the Methods are necessary to simulate exploration behavior and render the model suitable for model fitting. Concerning exploration behavior, we use the softmax function, which is commonly used in combination with the Rescorla-Wager model, in order to translate the learned quantity (in our case, engram strength) into behavior (here exploration). The other equations are necessary to fit the model to the data (learning rate α and behavioral variability in exploration behavior).

      Therefore, we fully agree with the reviewer that the Rescorla-Wagner can explain our empirical results, in particular by assuming that the different manipulations affect the strength of object-context associations, which, in turn, governs forgetting as behaviorally observed. 

      In our previous version of the manuscript, we only referred to the Rescorla-Wagner model directly in the Methods. But to make this important point clearer, we now refer to the origin of the model multiple times in the Results section as well. See lines 81, 386-393.

      We also agree with the reviewer that the learning/forgetting process can be described in terms of changes in object-context associations (e.g., inhibitory associations after a negative prediction error). Therefore, we now explicitly refer to the relationship between updated object-context associations and forgetting and highlight that we believe that stronger associations signal higher engram “relevancy”. See lines 386-393.

      We have extended Figure 7 (new panels a and b), where we illustrate the idea that (a) object-context associations govern forgetting and (b) show the key Rescorla-Wagner equation, including a simple explanation of the main terms (engram strength, prediction error, and learning rate). Finally, we have also extended our discussion of the model, where we now directly state that the Rescorla-Wagner model captures the key results of our experiments. See lines 573-580.

      In order to further support a link between our empirical data and computational modeling, we also added extra experiments that showed the modulation of engram cells within the dentate gyrus can regulate these object-context associations. See Supplementary Figure 12a-f and lines 401-404.

      To summarize our reply, we agree with the reviewer’s comment and hope that we have clarified the direct relationship to the Rescorla-Wagner model.

      (2) I also have an issue with the conclusions drawn from the enriched environment experiment (Figure 3). The authors hypothesize that this manipulation alleviates forgetting because "Experiencing extra toys and objects during environmental enrichment that are reminiscent of the previously learned familiar object might help maintain or nudge mice to infer a higher engram relevancy that is more robust against forgetting.". This statement is completely speculative. A much simpler explanation (based on the existing literature) is that enrichment enhances synaptic plasticity, spine growth, etc., which in turn reduces forgetting. If the authors want to make their claim, then they need to test it experimentally. For example, the enriched environment could be filled with objects that are similar or dissimilar to those used in the memory experiments. If their hypothesis is correct, only the similar condition should prevent forgetting.

      We thank the Reviewer for this alternative perspective on our findings. First of all, we agree that this statement is speculative. The effects of enrichment on neural plasticity are well established and it likely contributes to the enhanced memory recall. It is important to emphasize that this process of updating is not necessarily separate from enrichment-induced plasticity at an implementational level, but part of the learning experience within an environment containing multiple objects. The enrichment or, more generally, experience, may therefore enhance memory through the modification of activity of specific engram ensembles. The idea of enrichment facilitating memory updating is consistent with the results obtained by the reminder experiments and further supported by our analysis with the Rescorla-Wagner computational model, where experience updates the accessibility of existing memories, possibly through reactivation of the original engram ensemble.

      We would like to further clarify that our explanation concerns the algorithmic level, in contrast to the neural level. Based on the computational analyses using the Rescorla-Wagner model and in line with the reviewer’s previous comment on the model, we believe that forgetting is governed by the strength of object-context associations (or engram relevancy). Our interpretation is that stronger associations signal that the memory or engram representation is important ("relevant") and should not be forgotten. Accordingly, due to a vast majority of experiences with extra cage objects in the enriched environment, mice might generally learn that such objects are common in their environment and potentially relevant in the future (i.e., the object-context association is strong, preventing forgetting). Our speculation of these results is to help unify our empirical data with the computational model.

      We believe that the Reviewer's alternative explanation in terms of synaptic plasticity, spine growth is not mutually exclusive with the modelling work. It is possible that the computational mechanisms that we explore based on the Rescorla-Wagner model are neuronally related to the biological mechanisms that the reviewer suggests at the implementational level. Therefore, ultimately, the two perspectives might even complement each other. We have included additional discussion to clarify this point. See lines 510-546.

      (3) It is well-known that updating can both weaken or strengthen memory. The authors suggest that memory is updated when animals are exposed to the context in the absence of the objects. If the engram is artificially inhibited (opto) during context-only re-exposures, memory cannot be updated. To further support this updating idea, it would be good to run experiments that investigate whether multiple short re-exposures to the training context (in the presence of the objects or during optogenetic activation of the engram) could prevent forgetting. It would also be good to know the levels of neuronal reactivation during multiple re-exposures to the context in the absence versus context in the presence of the objects.

      We thank the Reviewer for their comments. We agree that additional experiments would be helpful to further support the idea of updating. We have performed additional experiments to test the idea that multiple short re-exposures to the training context, in the presence of objects prevents forgetting. In this paradigm, mice were repeatedly exposed to the original object pair (Supplementary Figure S5a). The results indicate that repeated reminder trials facilitate object memory recall (Supplementary Figure 5b&c). These data indicated that subsequent object reminders over time facilitates the transition of a forgotten memory to an accessible memory. See Supplementary Figure S5 and Lines 279-287.

      (4) There are a number of studies that show boundary conditions for memory destabilization/reconsolidation. Is there any evidence that similar boundary conditions exist to make an inaccessible engram accessible?

      The Reviewer asks an interesting question about boundary conditions and engram accessibility. Boundary conditions could indeed affect the degree of destabilization and reconsolidation, the salience or strength of the memory, as well as the timing of retrieval cues. Future models could focus on understanding the specific boundary conditions in which a memory becomes retrievable and the degree to which it is sufficiently destabilized and liable for updating and forgetting. We have included additional discussion on the potential role of boundary conditions for engram accessibility. See lines 661-666.

      (5) More details about how the quantification of immunohistochemistry (c-fos, BrdU, DAPI) was performed should be provided (which software and parameters were used to consider a fos positive neurons, for example).

      We have added additional information for the parameters of quantification of immunohistochemistry. See lines 796-809.

      (6) Duration of the enrichment environment was not detailed.

      We have highlighted the details for the environmental enrichment duration. See lines 756.

      Reviewer #3 (Public Review):

      Summary:

      The manuscript by Ryan and colleagues uses a well-established object recognition task to examine memory retrieval and forgetting. They show that memory retrieval requires activation of the acquisition engram in the dentate gyrus and failure to do so leads to forgetting. Using a variety of clever behavioural methods, the authors show that memories can be maintained and retrieval slowed when animals are reared in environmental enrichment and that normally retrieved memories can be forgotten if exposed to the environment in which the expected objects are no longer presented. Using a series of neural methods, the authors also show that activation or inhibition of the acquisition engram is key to memory expression and that forgetting is due to Rac1.

      We thank the Reviewer for summarizing the scope and depth of our manuscript, and indeed for recognizing our efforts. We engage below the Reviewer’s specific criticisms of our interpretations.

      Strengths:

      This is an exemplary examination of different conditions that affect successful retrieval vs forgetting of object memory. Furthermore, the computational modelling that captures in a formal way how certain parameters may influence memory provides an important and testable approach to understanding forgetting.

      The use of the Rescorla-Wagner model in the context of object recognition and the idea of relevance being captured in negative prediction error are novel (but see below).

      The use of gain and loss of function approaches are a considerable strength and the dissociable effects on behaviour eliminate the possibility of extraneous variables such as light artifacts as potential explanations for the effects.

      We thank the Reviewer for their positive comments.

      Weaknesses:

      Knowing what process (object retrieval vs familiarity) governed the behavioural effect in the present investigation would have been of even greater significance.

      The Reviewer touches on an important issue of the object recognition task. Understanding how experience alters object familiarity versus object retrieval and its impact on learning would help to develop better models of object memory and forgetting. We have added additional discussion. See lines 666-669.

      The impact of the paper is somewhat limited by the use of only one sex.

      We agree that using only male mice limits the impact of the paper. Indeed, the field of behavioural neuroscience is moving to include sex as a variable. Future experiments should include both male and female mice.

      While relevance is an interesting concept that has been operationalized in the paper, it is unclear how distinct it is from extinction. Specifically, in the case where the animals are exposed to the context in the absence of the object, the paper currently expresses this as a process of relevance - the objects are no longer relevant in that context. Another way to think about this is in terms of extinction - the association between the context and the objects is reduced results in a disrupted ability of the context to activate the object engram.

      We thank the reviewer for their insightful comment on the connection between engram relevance and memory extinction. Lacagnina et al., demonstrated that extinction training suppressed the reactivation of a fear engram, while activating a second putative extinction ensemble (59). In another study, these extinction engram cells and reward cells were shown to be functionally interchangeable (92). Moreover, in a study conducted by Lay et al., the balance between extinction and acquisition was disrupted by inhibiting the extinction recruited neurons in the BLA and CN (93). These results suggested that decision making after extinction can be governed by a balance between acquisition and extinction specific ensembles (93). Together, this may suggest that in the present study, when mice are repeatedly exposed to the training context, the association between the context and the objects is reduced, resulting in a disrupted ability of the context to activate the object engram. Therefore, memory relevance and extinction may operate similarly to effect engram accessibility, and in essence ‘forgetting’ of object memories may be due to neurobiological mechanisms similar to that of extinction learning (4). We have included additional discussion on the link between our results and the extinction literature. See lines 642-654.

      Recommendations for the authors:

      Reviewer #1 (Recommendations For The Authors):

      Additional measures that may help interpretation of and clarify data are:

      A minute-by-minute analysis for training and testing may provide insight about the learning rate and testing temporal dynamics that may shed light substantially on differential levels of exploration. This should be applied across figures and would support conclusions from models in Figures 7-8 as well.

      Locomotion/distance travelled measures.

      We have included additional analysis for a minute-by-minute analysis of training and testing of the object memory test at 24 hr, 2 weeks as well as under the standard housing and enrichment conditions. The results further support the initial finding that novel object recognition is increased in mice that recall the object at 24 hr. Similarly, mice housed in the enriched housing initially explore the novel object more compared to the familiar object. See Supplementary Figure 1 and 2, as well as lines 103-105 and 211-213.

      The appropriate control for the context exposure figure would be to expose to a novel context in one group and the acquisition/testing context for the other.

      We agree with the reviewer that an additional control of a novel context would further support our findings. Indeed, this line of investigate may dove-tail with the other reviewer comments on the role of competing engrams and interference. Future work could investigate the degree to which novel contexts and multiple memories can affect the rate of forgetting through engram updating. We have included additional discussion. See lines 643 and 655. However, in our experience it is necessary to pre-expose mice to different contexts before object exposure (e.g. Autore et al ’23), in order to form discriminate object/context associations. Establishing such a paradigm for this study would be at odds with the established paradigms and schedules in this current study. Moreover, the possibility that the effect of object displacement on forgetting requires the familiar context, or not, does not impact the main conclusions of this study. However, we agree that it is a point for expansion in the future.

      A control virus+light group vs simply a no-light condition.

      For optogenetic experiments. Control mice underwent the same surgery procedure with virus and optic fibre implantation. However, no light was delivered to excite or inhibit the respective opsin. Previous papers have shown laser light delivered to tissue expressing an AAV-TRE-EYFP lacking an light-opsin does cause cellular excitation. We have clarified this in the text. See lines 726-729.

      Reviewer #2 (Recommendations For The Authors):

      Minor details:

      (1) In the pharmacological modification of Rac 1, please specify what percentage of DMSO was used to dissolve Rac1 inhibitor and correct the typo 'DSMO'

      Rac1 inhibitor (Ehop016) was reconstituted and prepared in PBS with 1% Tween-80, 1% DMSO and 30% PEG. We have clarified this in the text and corrected the typo, thank you. See lines 767.
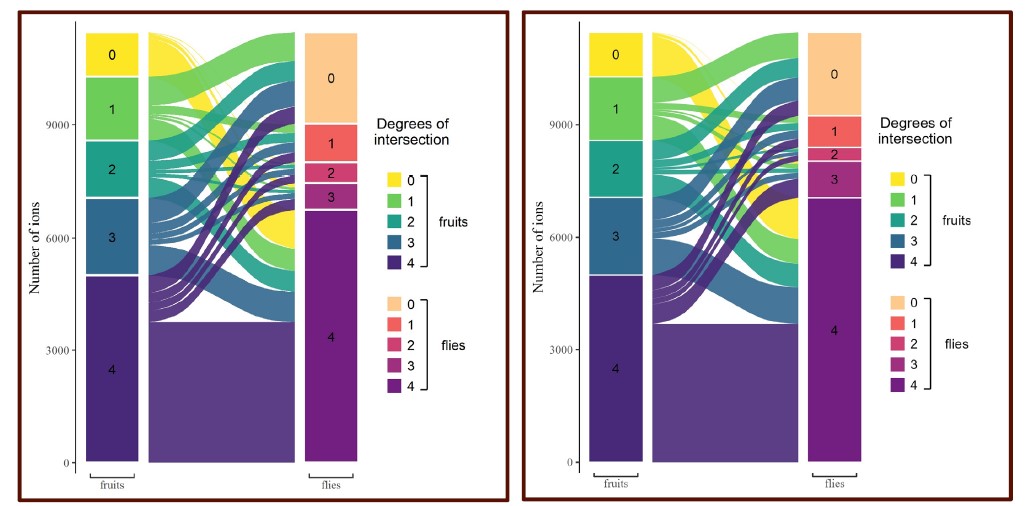
      (2) In the penultimate paragraph there is a typo 'predication error'

      This is now corrected. Thankyou.

      Reviewer #3 (Recommendations For The Authors):

      I was unable to find information on what the No Light group consisted of. Was there a control virus infused, were the animals implanted with optical fibres (in the presence or absence of a virus), were they surgical controls, etc?

      For optogenetic experiments. No Light Control mice underwent the same surgery procedure with virus and optic fibre implantation. However, no light was delivered to excite or inhibit the respective opsin. We have clarified this in the text. See lines 726-729.

      The discussion lacked specificity in places. For example, the idea of eluding to 'other variables' is somewhat vague (p. 21, middle paragraph). Some examples of what other variables could be relevant would be helpful in capturing what direction or relevance the model may have going forward.

      We have expanded the discussion of other variables which might impact engram relevance and how the model might be developed moving forward. These may include, boundary conditions of destabilization and reconsolidation, the salience or strength of the memory as well as the timing of retrieval cues or updating experience. Future models could focus on understanding the specific boundary conditions in which a memory becomes retrievable and the degree to which it is sufficiently destabilized and liable for updating and forgetting. The role of perceptual learning on memory retrieval and forgetting may also be an avenue of future investigation. Understanding how experience alters object familiarity versus object retrieval and its impact on learning would also help to develop better models of object memory and forgetting. In the current study, only male mice were utilized. Therefore, future work could also include sex as a variable to fully elucidate the impact of experience on the processes of forgetting. See lines 642-669.

      In the same paragraph (p. 21, middle paragraph) there is mention of multiple engrams and how they can compete. The authors reference Autore et al (2023), but I thought Lacagina did this really beautifully also in an experimental setting. This idea is also expressed in Lay et al. (2022). So additional references would further strengthen the authors argument here.

      We thank the reviewer for the additional references for discussing engram competition. We have included these papers in the discission. See lines 642-654.

      Relatedly, environmental enrichment was considered in terms of object relevance. I wonder if the authors may want to consider thinking about their results in terms of effects on perceptual learning.

      Indeed, perceptual learning maybe playing a role in environmental enrichment. We have included additional discussion. See lines 666-669.

    1. Author response:

      The following is the authors’ response to the original reviews.

      Public Reviews:

      Reviewer #1 (Public Review):

      The authors present a model for multisensory correlation detection that is based on the neurobiologically plausible Hassenstein Reichardt detector. It modifies their previously reported model (Parise & Ernst, 2016) in two ways: a bandpass (rather than lowpass) filter is initially applied and the filtered signals are then squared. The study shows that this model can account for synchrony judgement, temporal order judgement, etc in two new data sets (acquired in this study) and a range of previous data sets.

      Strengths:

      (1) The model goes beyond descriptive models such as cumulative Gaussians for TOJ and differences in cumulative Gaussians for SJ tasks by providing a mechanism that builds on the neurobiologically plausible Hassenstein-Reichardt detector.

      (2) This modified model can account for results from two new experiments that focus on the detection of correlated transients and frequency doubling. The model also accounts for several behavioural results from experiments including stochastic sequences of A/V events and sine wave modulations.

      Additional thoughts:

      (1) The model introduces two changes: bandpass filtering and squaring of the inputs. The authors emphasize that these changes allow the model to focus selectively on transient rather than sustained channels. But shouldn't the two changes be introduced separately? Transients may also be detected for signed signals.

      We updated the original model because our new psychophysical evidence demonstrates the fundamental role of unsigned transient for multisensory perception. While the original model received input from sustained unimodal channels (low-pass filters), the new version receives input from unsigned unimodal transient channels. Transient channels are normally modelled through bandpass filters (to remove the DC and high-frequency signal components) and squaring (to remove the sign). While these may appear as two separate changes in the model, they are, in fact, a single one: the substitution of sustained with unsigned transient channels (for a similar approach, see Stigliani et al. 2017, PNAS). Either change alone would not be sufficient to implement a transient channel that accounts for the present results.

      That said, we were also concerned with introducing too many changes in the model at once. Indeed, we simply modelled the unimodal transient channels as a single band-pass filter followed by squaring. This is already a stripped-down version of the unsigned transient detectors proposed by Adelson and Bergen in their classic Motion Energy model. The original model consisted of two biphasic temporal filters 90 degrees out of phase (i.e., quadrature filters), whose output is later combined. While a simpler implementation of the transient channels was sufficient in the present study, the full model may be necessary for other classes of stimuli (including speech, Parise, 2024, BiorXiv). Therefore, for completeness, we now include in the Supplementary Information a formal description of the full model, and validate it by simulating our two novel psychophysical studies. See Supplementary Information “The quadrature MCD model” section and Supplementary Figure S8.

      (2) Because the model is applied only to rather simple artificial signals, it remains unclear to what extent it can account for AV correlation detection for naturalistic signals. In particular, speech appears to rely on correlation detection of signed signals. Can this modified model account for SJ or TOJ judgments for naturalistic signals?

      It can. In a recent series of studies we have demonstrated that a population of spatially-tuned MCD units can account for audiovisual correlation detection for naturalistic stimuli, including speech (e.g. the McGurk Illusion). Once again, unsigned transients were sufficient to replicate a variety of previous findings. We have now extended the discussion to cover this recent research: Parise, C. V. (2024). Spatiotemporal models for multisensory integration. bioRxiv, 2023-12.

      Even Nidiffer et al. (2018) which is explicitly modelled by the authors report a significant difference in performance for correlated and anti-correlated signals. This seems to disagree with the results of study 1 reported in the current paper and the model's predictions. How can these contradicting results be explained? If the brain detects correlation on signed and unsigned signals, is a more complex mechanism needed to arbitrate between those two?

      We believe the reviewer here refers to our Experiment 2 (where, like Nidiffer at al. (2018) we used periodic stimuli, not Experiment 1, which consists of step stimuli). We were also puzzled by the difference between our Experiment 2 and Nidiffer et al. (2018): we induced frequency doubling, Nidiffer did not. Based on quantitative simulations, we concluded that this difference could be attributed to the fact that while Nidiffer included on each trial an intensity ramp in their periodic audiovisual stimuli, we did not. As a result, when considering the ramp (unlike in Nidiffer’s analyses), all audiovisual signals used by Nidiffer were positively correlated (irrespective of frequency and phase offset), while our signals in Experiment 2 were sometimes correlated and other times not (depending on the phase offset). This important simulation is included in Supplementary Figure S7; we also have now updated the text to better highlight the role of the pedestal in determining the direction of the correlation.

      (3) The number of parameters seems quite comparable for the authors' model and descriptive models (e.g. PSF models). This is because time constants require refitting (at least for some experimental data sets) and the correlation values need to be passed through a response mode (i.e. probit function) to account for behavioural data. It remains unclear how the brain adjusts the time constants to different sensory signals.

      This is a deep question. For simplicity, here the temporal constants were fitted to the empirical psychometric functions. To avoid overfitting, whenever possible we fitted such parameters over some training datasets, while trying to predict others. However, in some cases, it was necessary to fit the temporal constants to specific datasets. This may suggest that the temporal tuning of those units is not crystalised to some pre-defined values, but is adjusted based on recent perceptual history (e.g., the sequence of trials and stimuli participants are exposed to during the various experiments).

      For transparency, here we show how varying the tuning of the temporal constants of the filters affects the goodness of fit of our new psychophysical experiments (Supplementary Figure S8). As it can be readily appreciated, the relative temporal tuning of the unimodal transient detector was critical, though their absolute values could vary over a range of about 15 to over 100ms. The tuning of the low-pass filters of the correlation detector (not shown here) displayed much lower temporal sensitivity over a range between 0.1s to over 1s.

      This simulation shows the impact of temporal tuning in our simulations, however, the question remains as to how such a tuning gets selected in the first place. An appealing explanation relies on natural scene statistics: units are temporally tuned to the most common audiovisual stimuli. Although our current empirical evidence does not allow us to quantitatively address this question, in previous simulations (see Parise & Ernst, 2016, Supplementary Figure 8), by analogy with visual motion adaptation, we show how the temporal constants of our model can dynamically adjust and adapt to recent perceptual history. We hope these new and previous simulations address the question about the nature of the temporal tuning of the MCD units.

      (4) Fujisaki and Nishida (2005, 2006) proposed mechanisms for AV correlation detection based on the Hassenstein-Reichardt motion detector (though not formalized as a computational model).

      This is correct, Fujisaki and Nishida (2005, 2007) also hypothesized that AV synchrony could be detected using a mechanism analogous to motion detection. Interestingly, however, they ruled out such a hypothesis, as their “data do not support the existence of specialized low-level audio-visual synchrony detectors”. Yet, along with our previous work (Parise & Ernst, 2016, where we explicitly modelled the experiments of Fujisaki and Nishida), the present simulations quantitatively demonstrate that a low-level AV synchrony detector is instead sufficient to account for audiovisual synchrony perception and correlation detection. We now credit Fujusaki and Nishida in the modelling section for proposing that AV synchrony can be detected by a cross-correlator.

      Finally, we believe the reviewer is referring to the 2005 and 2007 studies of Fujisaki and Nishida (not 2006); here are the full references of the two articles we are referring to:

      Fujisaki, W., & Nishida, S. Y. (2005). Temporal frequency characteristics of synchrony–asynchrony discrimination of audio-visual signals. Experimental Brain Research, 166, 455-464.

      Fujisaki, W., & Nishida, S. Y. (2007). Feature-based processing of audio-visual synchrony perception revealed by random pulse trains. Vision Research, 47(8), 1075-1093.

      Reviewer #2 (Public Review):

      Summary:

      This is an interesting and well-written manuscript that seeks to detail the performance of two human psychophysical experiments designed to look at the relative contributions of transient and sustained components of a multisensory (i.e., audiovisual) stimulus to their integration. The work is framed within the context of a model previously developed by the authors and is now somewhat revised to better incorporate the experimental findings. The major takeaway from the paper is that transient signals carry the vast majority of the information related to the integration of auditory and visual cues, and that the Multisensory Correlation Detector (MCD) model not only captures the results of the current study but is also highly effective in capturing the results of prior studies focused on temporal and causal judgments.

      Strengths:

      Overall the experimental design is sound and the analyses are well performed. The extension of the MCD model to better capture transients makes a great deal of sense in the current context, and it is very nice to see the model applied to a variety of previous studies.

      Weaknesses:

      My one major issue with the paper revolves around its significance. In the context of a temporal task(s), is it in any way surprising that the important information is carried by stimulus transients? Stated a bit differently, isn't all of the important information needed to solve the task embedded in the temporal dimension? I think the authors need to better address this issue to punch up the significance of their work.

      In hindsight, it may appear unsurprising that transient signals carry most information for audiovisual integration. Yet, so somewhat unexpectedly, this has never been investigated using perhaps the most diagnostic psychophysical tools for perceived crossmodal timing; namely temporal order and simultaneity judgments–along with carefully designed experiments with quantitative predictions for the effect of either channel. The fact that the results conform to intuitive expectations further supports the value of the present work: grounding empirically with what is intuitively expected. This offers solid psychophysical evidence that one can build on for future advancements. Importantly, developing a model that builds on our new results and uses the same parameters to predict a variety of classic experiments in the field, further supports the current approach.

      If “significance” is intended as shaking previous intuitions or theories, then no: this is not a significant contribution. If instead, by significance we intend to build a solid empirical and theoretical ground for future work, then we believe this study is not significant, it is foundational. We hope that this work's significance is better captured in our discussion.

      On a side note, there is an intriguing factor around transient vs. sustained channels: what matters is the amount of change, not the absolute stimulus intensity. Previous studies, for example, have suggested a positive cross modal mapping between auditory loudness and visual lightness or brightness [Odegaard et al., 2004]. This study, conversely, challenges this view and demonstrates that what matters for multisensory integration in time is not the intensity of a stimulus, but changes thereof.

      In a more minor comment, I think there also needs to be a bit more effort into articulating the biological plausibility/potential instantiations of this sustained versus transient dichotomy. As written, the paper suggests that these are different "channels" in sensory systems, when in reality many neurons (and neural circuits) carry both on the same lines.

      The reviewer is right, in our original manuscript we glossed over this aspect. We have now expanded the introduction to discuss their anatomical basis. However, we are not assuming any strict dichotomy between transient and sustained channels; rather, our results and simulations demonstrate that transient information is sufficient to account for audiovisual temporal integration.

      Recommendations for the authors:

      Reviewer #1 (Recommendations For The Authors):

      (1) Related to point 2 of the public review, can the authors provide additional results showing that the model can also account for naturalistic signals and more complex stochastic signals?

      While working on this manuscript, we were also working in parallel on a project related to audiovisual integration of naturalistic signals. A pre-print is available online [Parise, 2024, BiorXiv], and the related study is now discussed in the conclusions.

      (2) As noted in the public review, Fujisaki and Nishida (2005, 2006) already proposed mechanisms for AV correlation detection based on the Hassenstein-Reichardt motion detector. Their work should be referenced and discussed.

      We have now acknowledged the contribution of Fujisaki and Nishida in the modelling section, when we first introduce the link between our model and the Hassenstein-Reichardt detectors.

      (3) Experimental parameters: Was the phase shift manipulated in blocks? If yes, what about temporal recalibration?

      To minimise the effect of temporal recalibration, the order of trials in our experiments was randomised. Nonetheless, we can directly assess potential short-term recalibration effects by plotting our psychophysical responses against both the current SOA, and that of the previous trials. The resulting (raw) psychometric surfaces below are averaged across observers (and conditions for Experiment 1). In all our experiments, responses are obviously dependent on the current SOA (x-axis). However, the SOA of the previous trials (y-axis) does not seem to meaningfully affect simultaneity and temporal order judgments. The psychometric curves above the heatmaps represent the average psychometric functions (marginalized over the SOA of the previous trial).

      All in all, the present analyses demonstrate negligible temporal recalibration across trials, likely induced by a random sequence of lags or phase shifts. Therefore, when estimating the temporal constants of the model, it seems reasonable to ignore the potential effects of temporal recalibration. To avoid increasing the complexity of the present manuscript, we would prefer not to include the present analyses in the revised version.

      Author response image 1.

      Effect of previous trial. Psychometric surfaces for Experiments 1 and 2 plotted against the lag in the current vs. the previous trial. While psychophysical responses are strongly modulated by the lag in the last trial (horizontal axis), they are relatively unaffected by the lag in the previous trial (vertical axis).

      (4) The model predicts no differences for experiment 1 and this is what is empirically observed. Can the authors support these null results with Bayes factors?

      This is a good suggestion: we have now included a Bayesian repeated measures ANOVA to the analyses of Experiment 1. As expected, these analyses provide further, though mild evidence in support for the null hypothesis (See Table S2). For completeness, the new Bayesian analyses are presented alongside the previous frequentist ones in the revised manuscript.

    1. Author response:

      The following is the authors’ response to the original reviews.

      Reviewer #1 (Public Review):

      Summary:

      This important work advances our understanding of sperm motility regulation during fertilization by uncovering the midpiece/mitochondria contraction associated with motility cessation and structural changes in the midpiece actin network as its mode of action. The evidence supporting the conclusion is solid, with rigorous live cell imaging using state-of-the-art microscopy, although more functional analysis of the midpiece/mitochondria contraction would have further strengthened the study. The work will be of broad interest to cell biologists working on the cytoskeleton, mitochondria, cell fusion, and fertilization. Strengths: The authors demonstrate that structural changes in the flagellar midpiece F-actin network are concomitant to midpiece/mitochondrial contraction and motility arrest during sperm-egg fusion by rigorous live cell imaging using state-of-art microscopy.

      Response P1.1: We thank the reviewer for her/his positive assessment of our manuscript.

      Weaknesses:

      Many interesting observations are listed as correlated or in time series but do not necessarily demonstrate the causality and it remains to be further tested whether the sperm undergoing midpiece contraction are those that fertilize or those that are not selected. Further elaboration of the function of the midpiece contraction associated with motility cessation (a major key discovery of the manuscript) would benefit from a more mechanistic study.

      Response P1.2: We thank the reviewer for this point. We have toned down some of our statements since some of the observations are indeed temporal correlations. We will explore some of these possible connections in future experiments. In addition, we have now incorporated additional experiments and possible explanations about the function of the midpiece contraction.

      Reviewer #2 (Public Review): 

      (1) The authors used various microscopy techniques, including super-resolution microscopy, to observe the changes that occur in the midpiece of mouse sperm flagella. Previously, it was shown that actin filaments form a double helix in the midpiece. This study reveals that the structure of these actin filaments changes after the acrosome reaction and before sperm-egg fusion, resulting in a thinner midpiece. Furthermore, by combining midpiece structure observation with calcium imaging, the authors show that changes in intracellular calcium concentrations precede structural changes in the midpiece. The cessation of sperm motility by these changes may be important for fusion with the egg. Elucidation of the structural changes in the midpiece could lead to a better understanding of fertilization and the etiology of male infertility. The conclusions of this manuscript are largely supported by the data, but there are several areas for improvement in data analysis and interpretation. Please see the major points below.

      Response P2.1: We thank the reviewer for the positive comments.

      (2) It is unclear whether an increased FM4-64 signal in the midpiece precedes the arrest of sperm motility. in or This needs to be clarified to argue that structural changes in the midpiece cause sperm motility arrest. The authors should analyze changes in both motility and FM4-64 signal over time for individual sperm.

      Response P2.2 : We have conducted single cell experiments tracking both FM4-64 and motility as the reviewer suggested (Supplementary Fig S1). We have observed that in all cases, cells gradually diminished the beating frequency and increased FM4-64 fluorescence in the midpiece until a complete motility arrest is observed. A representative example is shown in this Figure but we will reinforce this concept in the results section.

      (3) It is possible that sperm stop moving because they die. Figure 1G shows that the FM464 signal is increased in the midpiece of immotile sperm, but it is necessary to show that the FM4-64 signal is increased in sperm that are not dead and retain plasma membrane integrity by checking sperm viability with propidium iodide or other means.

      Response P2.3: This is a very good point. In our experiments, we always considered sperm that were motile to hypothesize about the relevance of this observation. We have two types of experiments: 

      (1) Sperm-egg Fusion: In experiments where sperm and eggs were imaged to observe their fusion, sperm were initially moving and after fusion, the midpiece contraction (increase in FM4-64 fluorescence was observed) indicating that the change in the midpiece (that was observed consistently in all fusing cells analyzed), is part of the process. 

      (2) Sperm that underwent acrosomal exocytosis (AE): we have observed two behaviours as shown in Figure 1: 

      a) Sperm that underwent AE and they remain motile without midpiece contraction (they are alive for sure); 

      b) Sperm that underwent AE and stopped moving with an increase in FM464 fluorescence. We propose that this contraction during AE is not desired because it will impede sperm from moving forward to the fertilization site when they are in the female reproductive tract. In this case, we acknowledge that the cessation of sperm motility may be attributed to cellular death, potentially correlating with the increased FM4-64 signal observed in the midpiece of immotile sperm that have undergone AE. To address this hypothesis, we conducted image-based flow cytometry experiments, which are well-suited for assessing cellular heterogeneity within large populations.

      Author response image 1 illustrates the relationship between cell death and spontaneous AE in noncapacitated mouse sperm, where intact acrosomes are marked by EGFP. Cell death was evaluated using Sytox Blue staining, a dye that is impermeable to live cells and shows affinity for DNA. AE was assessed by the absence of EGFP in the acrosome. 

      Author response image 1a indicates a lack of correlation between Sytox and EGFP fluorescence. Two populations of sperm with EGFP signals were found (EGFP+ and EGFP-), each showing a broad distribution of Sytox signal, enabling the distinction between cells that retain plasma membrane integrity (live sperm: Sytox-) and those with compromised membranes (dead cells: Sytox+). The observed bimodal distribution of EGFP signal, regardless of live versus dead cell populations, indicates that the fenestration of the plasma membrane known to occur during AE is a regulated process that does not necessarily compromise the overall plasma membrane integrity. 

      These observations are reinforced by the single-cell examples in Author response image 1b, where we were able to identify sperm in four categories: live sperm with intact acrosome (EGFP+/Sytox-), live sperm with acrosomal exocytosis (EGFP-/Sytox-), dead sperm with intact acrosome (EGFP+/Sytox+), and dead sperm with AE (EGFP-/Sytox+). Note the case of AE (lacking EGFP signal) which bears an intact plasma membrane (lacking Sytox Blue signal). Author response image 2 shows single-cell examples of the four categories observed with confocal microscopy to reinforce the observations from Author response image 1a.

      Author response image 1.

      Fi. Image based flow cytometry analysis (ImageStream Merk II), of non-capacitated mouse sperm, showing the distribution of EGFP signal (acrosome integrity) against Sytox Blue staining (cell viability).  (A) The quadrants show: Sytox Blue + / EGFP low (17.6%), Sytox Blue + / EGFP high (40.1%), Sytox Blue - / EGFP high (20.2%), and Sytox Blue - / EGFP low (21.7%). Each quadrant indicates the percentage of the total sperm population exhibiting the corresponding staining pattern. Axes are presented in a log10 scale of arbitrary units of fluorescence.  (B) Representative single-cell images corresponding to the four categorized sperm populations from the flow cytometry analysis in panel (A). The top row displays sperm with compromised plasma membrane integrity (Sytox Blue +), showing low (left) and high (right) EGFP signals. The bottom row shows sperm with intact plasma membrane (Sytox Blue -), displaying high (left) and low (right) EGFP signal. It is worth noting that when analyzing the percentages in (A), we observed that the data also encompass a population of headless flagella, which was present in all observed categories. Therefore, the percentages should be interpreted with caution.

      Author response image 2.

      Confocal Microscopy Examples of AE and cell viability. The top row features sperm with compromised plasma membrane integrity (Sytox Blue +) and high EGFP expression; the second row displays sperm with compromised membrane and low EGFP expression; the third row illustrates sperm with intact membrane (Sytox Blue -) and high EGFP expression; the bottom row shows sperm with intact membrane and low EGFP expression. 

      Author response images 3-5 provide insight into the relationship between FM4-64 and Sytox Blue fluorescence intensities in non-capacitated sperm (CTRL, Author response image 3), capacitated sperm and acrosome exocytosis events stimulated with 100 µM progesterone (PG, Author response image 4), and capacitated sperm stimulated with 20 µM ionomycin (IONO, Author response image 5). Two populations of sperm with Sytox Blue signals were clearly distinguished (Sytox+ and Sytox-), enabling the discernment between live and dead sperm. Interestingly, the upper right panels of Author response images 3A, 4A, and 5A (Sytox Blue+ / FM4-64 high) consistently show a positive correlation between FM4-64 and Sytox Blue. This observation aligns with the concern raised by Reviewer 2, suggesting that compromised membranes due to cell death provide more binding sites for FM4-64. 

      Nonetheless, the lower panels of Author response images 3A, 4A and 5A (Sytox Blue-) show no correlation with FM4-64 fluorescence, indicating that this population can exhibit either low or high FM4-64 fluorescence. As expected, in stark contrast with the CTRL case, the stimulation of AE with PG or IONO in capacitated sperm increased the population of live sperm with high FM4-64 fluorescence (Sytox Blue+ / FM4-64 high: CTRL: 7.85%, PG: 8.73%, IONO: 13.5%). 

      Single-cell examples are shown in Author response images 3B, 4B, and 5B, where the four categories are represented: dead sperm with low FM4-64 fluorescence (Sytox Blue+ / FM4-64 low), dead sperm with high FM4-64 fluorescence (Sytox Blue+ / FM4-64 high), live sperm with low FM4-64 fluorescence (Sytox Blue- / FM4-64 low), and live sperm with high FM4-64 fluorescence (Sytox Blue- / FM4-64 high). 

      Author response image 3.

      Relationship between cell death and FM4-64 fluorescence in capacitated sperm without inductor of RA. Image-based flow cytometry analysis of non-capacitated mouse sperm loaded with FM464 and Sytox Blue dyes, with one and two minutes of incubation time, respectively. (A) The quadrants show: Sytox Blue+ / FM4-64 low (13.3%), Sytox Blue+ / FM4-64 high (49.8%), Sytox Blue- / FM4-64 low (28.1%), and Sytox Blue- / FM4-64 high (7.85%). Each quadrant indicates the percentage of the total sperm population exhibiting the corresponding staining pattern. Axes are presented on a log10 scale of arbitrary units of fluorescence. (B) Representative single-cell images corresponding to the four categorized sperm populations from the flow cytometry analysis in panel (A).

      Author response image 4.

      Relationship between cell death and FM4-64 fluorescence capacitated sperm stimulated with progesterone. Image-based flow cytometry analysis of non-capacitated mouse sperm loaded with FM4-64 and Sytox Blue dyes, with one and two minutes of incubation time, respectively. (A) The quadrants show: Sytox Blue+ / FM4-64 low (9.04%), Sytox Blue+ / FM4-64 high (61.6%), Sytox Blue- / FM4-64 low (19.7%), and Sytox Blue- / FM4-64 high (8.73%). Each quadrant indicates the percentage of the total sperm population exhibiting the corresponding staining pattern. Axes are presented on a log10 scale of arbitrary units of fluorescence. (B) Representative single-cell images corresponding to the four categorized sperm populations from the flow cytometry analysis in panel (A)

      Author response image 5.

      Relationship between cell death and FM4-64 fluorescence capacitated sperm stimulated with ionomycin. Image-based flow cytometry analysis of non-capacitated mouse sperm loaded with FM464 and Sytox Blue dyes, with one and two minutes of incubation time, respectively. (A) The quadrants show: Sytox Blue+ / FM4-64 low (4.52%), Sytox Blue+ / FM4-64 high (60.6%), Sytox Blue- / FM4-64 low (20.5%), and Sytox Blue- / FM4-64 high (13.5%). Each quadrant indicates the percentage of the total sperm population exhibiting the corresponding staining pattern. Axes are presented on a log10 scale of arbitrary units of fluorescence. (B) Representative single-cell images corresponding to the four categorized sperm populations from the flow cytometry analysis in panel (A).

      Based on the data presented in Author response images 1 to 6, we derive the following conclusions summarized below:

      (1) There is no direct relationship between cell death (Sytox Blue-) and AE (EGFP) (Author response images 1 and 2).

      (2) There is bistability in the FM4-64 fluorescent intensity. Before reaching a certain threshold, there is no correlation between FM4-64 and Sytox Blue signals, indicating no cell death. However, after crossing this threshold, the FM4-64 signal becomes correlated with Sytox Blue+ cells, indicating cell death (Author response images 4-6).

      (3) The Sytox Blue- population of capacitated sperm is sensitive to AE stimulation with progesterone, leading to the expected increase in FM4-64 fluorescence.

      Therefore, while the FM4-64 signal alone is not a definitive marker for either AE or cell death, it is crucial to use additional viability assessments, such as Sytox Blue, to accurately differentiate between live and dead sperm in studies of acrosome exocytosis and sperm motility. In the present work, we did not use a cell viability marker due to the complex multicolor, multidimensional fluorescence experiments. However, cell viability was always considered, as any imaged sperm was chosen based on motility, indicated by a beating flagellum. The determination of whether selected sperm die during or after AE remains to be elucidated. The results presented in Figure 2 and Supplementary S1 show examples of motile sperm that experience an increase in FM4-64 fluorescence.

      All this information is added to the manuscript (Supplementary Figure 1D).

      (4) It is unclear how the structural change in the midpiece causes the entire sperm flagellum, including the principal piece, to stop moving. It will be easier for readers to understand if the authors discuss possible mechanisms.

      Response P2.4: As requested, we have incorporated a possible explanation in the discussion section (see line 644-656). We propose three possible hypotheses for the cessation of sperm motility, which can be attributed to the simultaneous occurrence of various events:

      (1) Rapid increase in [Ca2+]i levels: A rapid increase in [Ca2+]i levels may trigger the activation of Ca2+ pumps within the flagellum. This process consumes local ATP levels, disrupting glycolysis and thereby depleting the energy required for motility.

      (2) Reorganization of the actin cytoskeleton: Alterations in the actin cytoskeleton can lead to changes in the mechanical properties of the flagellum, impacting its ability to move effectively.

      (3) Midpiece contraction: Contraction in the midpiece region can potentially interfere with mitochondrial function, impeding the energy production necessary for sustained motility.

      (5) The mitochondrial sheath and cell membrane are very close together when observed by transmission electron microscopy. The image in Figure 9A with the large space between the plasma membrane and mitochondria is misleading and should be corrected. The authors state that the distance between the plasma membrane and mitochondria approaches about 100 nm after the acrosome reaction (Line 330 - Line 333), but this is a very long distance and large structural changes may occur in the midpiece. Was there any change in the mitochondria themselves when they were observed with the DsRed2 signal?

      Response P2.5: The authors appreciate the reviewer’s observation regarding the need to correct the image in Figure 9A, as the original depiction conveys a misleading representation of the spatial relationship between the mitochondrial sheath and the plasma membrane. This figure has been corrected to accurately reflect a more realistic proximity, while keeping in mind that it is a cartoonish representation.

      Regarding the comments about the distances mentioned between former lines 330 and 333, the measurement was not intended to describe the gap between the plasma membrane and the mitochondria but rather the distance between F-actin and the plasma membrane. 

      Author response image 6 shows high-resolution scanning electron microscopy (SEM) of two sperm fixed with a protocol tailored to preserve plasma membranes (ref), where the insets clearly show the flagellate architecture in the midpiece with an intact plasma membrane covering the mitochondrial network. A non-capacitated sperm with an intact acrosome is shown in panel A, and a capacitated sperm that has experienced AE is shown in panel B.

      Notably, the results depicted in Author response image 6 demonstrate that, irrespective of the AE status, the distance between the plasma membrane and mitochondria consistently remains less than 20 nm, thus confirming the close proximity of these structures in both physiological states. As Reviewer 2 pointed out, if there is no significant difference in the distance between the plasma membrane and mitochondria, then the observed structural changes in the actin network within the midpiece should somehow alter the actual deposition of mitochondria within the midpiece. Figure 5D-F shows that midpiece contraction is associated with a decrease in the helical pitch of the actin network; the distance between turns of the actin helix decreases from  l = 248  nm to  l = 159  nm. This implies a net change in the number of turns the helix makes per 1 µm, from 4 to 6 µm-1.

      Author response image 6.

      SEM image showing the proximity between plasma membrane and mitochondria. Scale bar 100 nm.

      Additionally, a structural contraction can be observed in Figure 5D-F, where the radius of the helix decreases by about 50 nm. To clarify this point, we sought to measure the deposition of individual DsRed2 mitochondria using computational superresolution microscopy—FF-SRM (SRRF and MSSR), Structured Illumination Microscopy (SIM), or a combination of both (SIM + MSSR), in 2D. Author response image 7 shows that these three approaches allow the observation of individual DsRed mitochondria; however, the complexity of their 3D arrangement, combined with the limited space between mitochondria (as seen in Author response image 6), precludes a reliable estimation of mitochondrial organization within the midpiece. To overcome these challenges, we decided to study the midpiece architecture via SEM experiments on non-capacitated versus capacitated sperm stimulated with ionomycin to undergo the AE.

      Author response image 7.
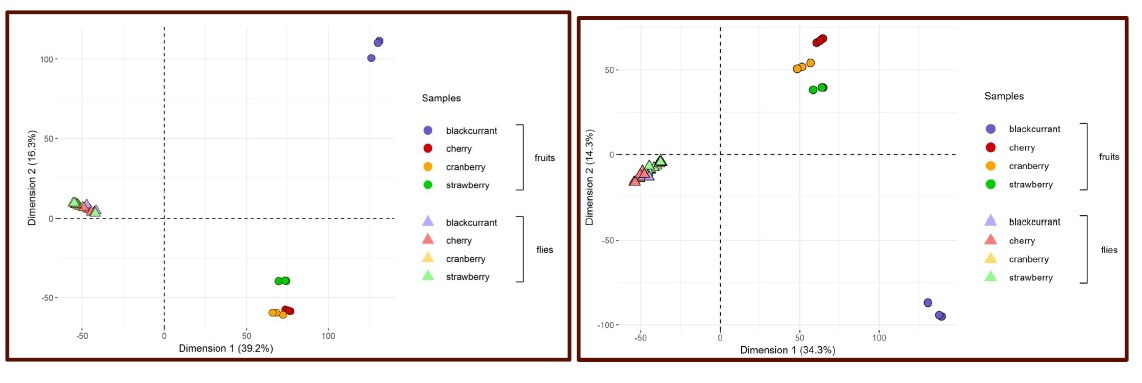
      Organization of mitochondria observed via FF-SRM and SIM. Scale bar 2 µm. F.N: Fluorescence normalized. F: Frequency
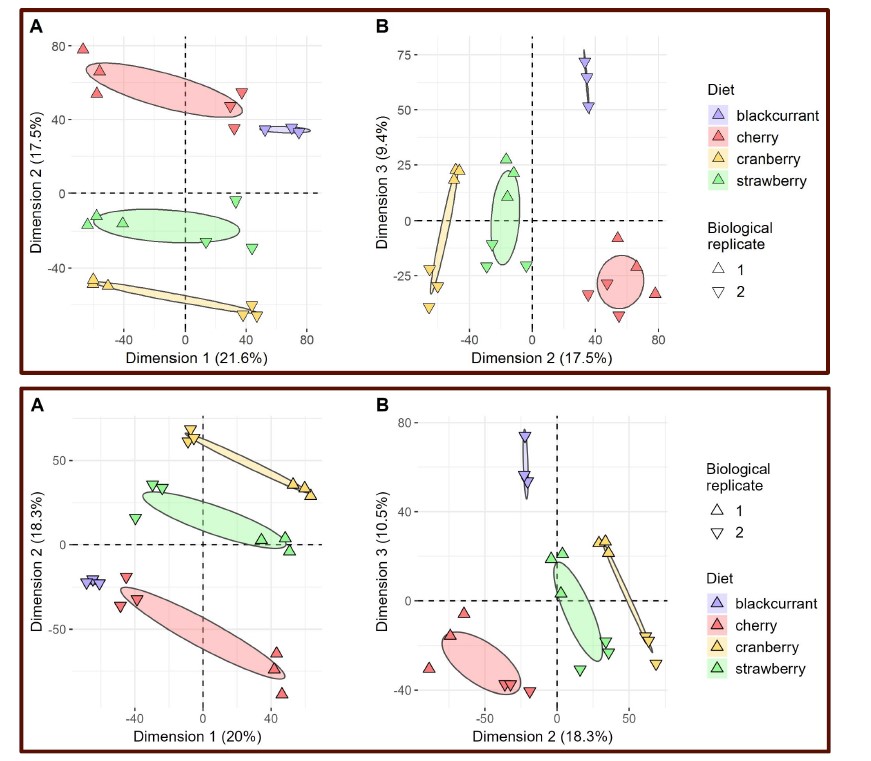
      Author response image 8 presents a single-cell comparison of the midpiece architecture in noncapacitated (NC) and acrosome-intact (AI) versus acrosome-reacted (AR) sperm, along with measurements of the midpiece diameter throughout its length. Notably, the diameter of the midpiece increases from the base of the head to more distal regions, ranging from 0.45 nm to 1.10 µm (as shown in Author response images 7 and 8). A significant correlation between the diameter of the flagellum and its curvature was observed (Author response image 9), suggesting a reorganization of the midpiece due to shearing forces. This is further exemplified in Author response images 8 and 9, which provide individual examples of this phenomenon.

      Author response image 8.

      Comparison of the midpiece architecture in acrosome-intact and acrosome-reacted sperm using scanning electron microscopy (SEM).

      As expected, the overall diameter of the midpiece in AI sperm was larger than in AR sperm, with measurements of 0.731 ± 0.008 µm for AI and 0.694 ± 0.007 µm for AR (p = 0.013, Kruskal-Wallis test n > 100, N = 2), as shown in Author response image 10. Additionally, this Author response image 7 indicates that the reorganization of the midpiece architecture involves a change in the periodicity of the mitochondrial network, with frequencies shifting from fNC to fEA mitochondria per micron.  

      Author response image 9.

      Comparison of the midpiece architecture in acrosome-intact (A) and acrosome-reacted (B) sperm using scanning electron microscopy (SEM).

      Collectively, the structural results presented in Figure 5 and Author response images 6 to 10 demonstrate that the AE involves a comprehensive reorganization of the midpiece, affecting its diameter, pitch, and the organization of both the actin and mitochondrial networks. All this information is now incorporated in the new version of the paper (Figure. 2F)

      Author response image 10.

      Quantification of the midpiece diameter of the sperm flagellum in acrosome-intact and acrosome-reacted sperm analyzed by scanning electron microscopy (SEM). Data is presented as mean ± SEM. Kruskal-Wallis test was employed,  p = 0.013 (AI n=85 , AR n=72).

      (6) In the TG sperm used, the green fluorescence of the acrosome disappears when sperm die. Figure 1C should be analyzed only with live sperm by checking viability with propidium iodide or other means.

      Response P2.6: We concur with Reviewer 2 that ideally, any experiment conducted for this study should include an intrinsic cell viability test. However, the current research employs a wide array of multidimensional imaging techniques that are not always compatible with, or might be suboptimal for, simultaneous viability assessments. In agreement with the reviewer's concerns, it is recognized that the data presented in Figure 1C may inherently be biased due to cell death. Nonetheless, Author response image 1 demonstrates that the relationship between AE and cell death is more complex than a straightforward all-or-nothing scenario. Specifically, Author response image 1C illustrates a case where the plasma membrane is compromised (Sytox Blue+) yet maintains acrosomal integrity (EGFP+). This observation contradicts Reviewer 1's assertion that "the green fluorescence of the acrosome disappears when sperm die," as discussed more comprehensively in response P2.3.

      In light of these observations, we have meticulously revisited the entire manuscript to address and clarify potential biases in our results due to cell death. Consequently, Author response image 5 and its detailed description have been incorporated into the supplementary material of the manuscript to contribute to the transparency and reliability of our findings.

      Reviewer #3 (Public Review):

      (1) While progressive and also hyperactivated motility are required for sperm to reach the site of fertilization and to penetrate the oocyte's outer vestments, during fusion with the oocyte's plasma membrane it has been observed that sperm motility ceases. Identifying the underlying molecular mechanisms would provide novel insights into a crucial but mostly overlooked physiological change during the sperm's life cycle. In this publication, the authors aim to provide evidence that the helical actin structure surrounding the sperm mitochondria in the midpiece plays a role in regulating sperm motility, specifically the motility arrest during sperm fusion but also during earlier cessation of motility in a subpopulation of sperm post acrosomal exocytosis. The main observation the authors make is that in a subpopulation of sperm undergoing acrosomal exocytosis and sperm that fuse with the plasma membrane of the oocyte display a decrease in midpiece parameter due to a 200 nm shift of the plasma membrane towards the actin helix. The authors show the decrease in midpiece diameter via various microscopy techniques all based on membrane dyes, bright-field images and other orthogonal approaches like electron microscopy would confirm those observations if true but are missing. The lack of additional experimental evidence and the fact that the authors simultaneously observe an increase in membrane dye fluorescence suggests that the membrane dyes instead might be internalized and are now staining intracellular membranes, creating a false-positive result. The authors also propose that the midpiece diameter decrease is driven by changes in sperm intracellular Ca2+ and structural changes of the actin helix network. Important controls and additional experiments are needed to prove that the events observed by the authors are causally dependent and not simply a result of sperm cells dying.

      Response P3.1: We appreciate the reviewer's observations and critiques. In response, we have expanded our experimental approach to include alternative methodologies such as mathematical modeling and electron microscopy, alongside further fluorescence microscopy studies. This diversified approach aims to mitigate potential interpretation artifacts and substantiate the validity of our observations regarding the contraction of the sperm midpiece. Additionally, we have implemented further control experiments to fortify the credibility and robustness of our findings, ensuring a more comprehensive and reliable set of results.

      First, we acknowledge the concerns raised by Reviewer 2 regarding the interpretation of the magnitude of the observed contraction of the sperm flagellum's midpiece (see response P2.5). Specifically, we believe that the assertion that "... there is a decrease in midpiece parameter due to a 200 nm shift of the plasma membrane towards the actin helix" stated by reviewer 3 needs careful examination. We recognize that the fluorescence microscopy data provided might not conclusively support such a substantial shift. Our live cell imaging and superresolution microscopy experiments indicate that there is a significant decrease in the diameter of the sperm flagellum associated with AE. This is supported by colocalization experiments where FM4-64-stained structures (fluorescing upon binding to membranes) are observed moving closer to Sir-Actinlabeled structures (binding to F-actin). Quantitatively, Figure S5 describes the spatial shift between FM4-64 and Sir-Actin signals, narrowing from a range of 140-210 nm to 50-110 nm (considering the 2nd and 3rd quartiles of the distributions). The mean separation distance between both signals changes from 180 nm in AI cells to 70 nm in AR cells, a net shift of 110 nm. This observation suggests caution regarding the claim of a "200 nm shift of the plasma membrane towards the actin cortex." 

      Moreover, the concerns raised by Reviewer #3 about the potential internalization of membrane dyes, which might create a false-positive result by staining intracellular membranes, offer an alternative mechanism to explain a shift of up to 100 nm. This perspective is also supported by the critique from Reviewer #2 regarding the substantial distance (about 100 nm) between the plasma membrane and mitochondria post-acrosome reaction:  “The authors state that the distance between the plasma membrane and mitochondria approaches about 100 nm after the acrosome reaction (…), but this is a very long distance and large structural changes may occur in the midpiece”. These insights have prompted us to refine our methodology and interpretation of the data to ensure a more accurate representation of the underlying biological processes.

      Author response image 11 shows a first principles approach in two spatial dimensions to explore three scenarios where a membrane dye, such as FM4-64, stains structures at and within the midpiece of a sperm flagellum, but yet does not result in a net change of diameter. Author response image 11A-C illustrates three theoretical arrangements of fluorescent dyes: Model 1 features two rigid, parallel structures that mimic the plasma membrane surrounding the midpiece of the flagellum. Model 2 builds on Model 1 by incorporating the possibility of dye internalization into structures located near the membrane, suggesting a slightly more complex interaction with nearby membranous intracellular structures. Model 3 represents an extreme scenario where the fluorescent dyes stain both the plasma membrane and internal structures, such as mitochondrial membranes, indicating extensive dye penetration and binding. Author response image 11D-F displays the convolution of the theoretical fluorescent signals from Models 1 to 3 with the theoretical point spread function (PSF) of a fluorescent microscope, represented by a Gaussian-like PSF with a sigma of 19 pixels (approximately 300 nm). This process simulates how each model's fluorescence would manifest under microscopic observation, showing subtle differences in the spatial distribution of fluorescence among the models. Author response image 11G-I reveals the superresolution images obtained through Mean Shift Super Resolution (MSSR) processing of the models depicted in Author response image 11D-F.

      By analyzing the three scenarios, it becomes clear that the signals from Models 2 and 3 shift towards the center compared to Model 1, as depicted in Author response image 11J. This shift in fluorescence suggests that the internalization of the dye and its interaction with internal structures might significantly influence the perceived spatial distribution and intensity of fluorescence, thereby impacting the interpretation of structural changes within the midpiece. Consequently, the experimentally observed contraction of up to 100 nm in  could represent an actual contraction of the sperm flagellum's midpiece, a relocalization of the FM4-64 membrane dyes to internal structures, or a combination of both scenarios.

      To discern between these possibilities, we implemented a scanning electron microscopy (SEM) approach. The findings presented in Figure 5 and Author response images 7 to 9 conclusively demonstrate that the AE involves a comprehensive reorganization of the midpiece. This reorganization affects its diameter, which changes by approximately 50 nm, as well as the pitch and the organization of both the actin and mitochondrial networks. This data corroborates the structural alterations observed and supports the validity of our interpretations regarding midpiece dynamics during the AE.

      Author response image 11.

      Modeling three scenarios of midpiece staining with membrane fluorescent dyes.

      Secondly, we wish to clarify that in some of our experiments, we have utilized changes in the intensity of FM4-64 fluorescence as an indirect measure of midpiece contraction. This approach is supported by a linear inverse correlation between these variables, as illustrated in Figure S2D. It is important to note that this observation is correlative and indirect; therefore, our data does not directly substantiate the claim that "in a subpopulation of sperm undergoing AE and sperm that fuse with the plasma membrane of the oocyte, there is a decrease in midpiece parameter due to a 200 nm shift of the plasma membrane towards the actin helix". Specifically, we have not directly measured the distance between the plasma membrane and actin cortex in experiments involving gamete fusion.

      All the concerns highlighted in this Response P1.1 have been addressed and incorporated into the manuscript. This addition aims to provide comprehensive insight into the experimental observations and methodologies used, ensuring that the data is transparent and accessible for thorough review and replication.

      Editor Comment:

      As the authors can see from the reviews, the reviewers had quite different degrees of enthusiasm, thus discussed extensively. The major points in consensus are summarized below and it is highly recommended that the authors consider their revisions.

      (1) Causality of midpiece contraction with motility arrest is not conclusively supported by the current evidence. Time-resolved imaging of FM4-64 and motility is needed and the working model needs to be revised with two scenarios - whether the sperm contracting indicates a fertilizing sperm or sperm to be degenerated.

      (2) The rationale for using FM4-64 as a plasma membrane marker is not clear as it is typically used as an endo-membrane marker, which is also related to the discrepancy of Fluo-4 signal diameter vs. FM4-64 (Figure 4E). The viability of sperm with increased FM4-64 needs to be demonstrated.

      (3) The mechanism of midpiece contraction in motility cessation along the whole flagellum is not discussed.

      (4) The use of an independent method to support the changes in midpiece diameter/structural changes such as DsRed (transgenic) or TEM.

      (5) The claim of Ca2+ change needs to be toned down.

      Response Editor: We thank the editor and the reviewers for their thorough and positive assessment of our work and the constructive feedback to further improve our manuscript. Please find below our responses to the reviewers’ comments. We have addressed all these points in the current version. Briefly,

      (1) Time resolved images to show the correlation between FM4-64 fluorescence increase and the motility was incorporated

      (2) The rationale for using FM4-64 was added.

      (3) The mechanism of midpiece contraction was discussed in the paper

      (4) An independent method was included to support our conclusions (SEM and other markers not based on membrane dyes)

      (5) The results related to the calcium increase were toned down.

      Recommendations for the authors:

      Reviewer #1 (Recommendations For The Authors):

      (1) To claim midpiece actin polymerization/re-organization is required for AE, demonstrating that AE does not occur in the presence of actin depolymerizing drugs (e.g., Latrunculin A, Cytochalasin D) would be necessary since the current data only shows the association/correlation. Was the block of AE by actin depolymerization observed?

      Response R1.1: We agree with the reviewer but unfortunately, since actin polymerization and or depolymerization in the head are important for exocytosis, we cannot use this experimental approach to dissect both events. Addition of these inhibitors block the occurrence of AE (PMID: 12604633).

      (2) Please provide the rationale for using FM4-64 to visualize the plasma membrane since it has been reported to selectively stain membranes of vacuolar organelles. What is the principle of increase of FM4-64 dye intensity, other than the correlation with midpiece contraction? For example, in lines 400-402: the authors mentioned that 'some acrosomereacted moving sperm within the perivitelline space had low FM4-64 fluorescence in the midpiece (Figure 6C). After 20 minutes, these sperm stopped moving and exhibited increased FM4-64 fluorescence, indicating midpiece contraction (Figure 6D).' While recognizing the increase of FM4-64 dye intensity can be an indicator of midpiece contraction, without knowing how and when the intensity of FM4-64 dye changes, it is hard to understand this observation. Please discuss.

      Response R1.2: FM4-64 is an amphiphilic styryl fluorescent dye that preferentially binds to the phospholipid components of cell membranes, embedding itself in the lipid bilayer where it interacts with phospholipid head groups. Due to its amphiphilic nature, FM dyes primarily anchor to the outer leaflet of the bilayer, which restricts their internalization. It has been demonstrated that FM4-64 enters cells through endocytic pathways, making these dyes valuable tools for studying endocytosis.

      Upon binding, FM4-64's fluorescence intensifies in a more hydrophobic environment that restricts molecular rotation, thus reducing non-radiative energy loss and enhancing fluorescence. These photophysical properties render FM dyes useful for observing membrane fusion events. When present in the extracellular medium, FM dyes rapidly reach a chemical equilibrium and label the plasma membrane in proportion to the availability of binding sites.

      In wound healing studies, for instance, the fluorescence of FM4-64 is known to increase at the wound site. This increase is attributed to the repair mechanisms that promote the fusion of intracellular membranes at the site of the wound, leading to a rise in FM4-64 fluorescence. Similarly, an increase in FM4-64 fluorescence has been reported in the heads of both human and mouse sperm, coinciding with AE. In this scenario, the fusion between the plasma membrane and the acrosomal vesicle provides additional binding sites for FM4-64, thus increasing the total fluorescence observed in the head. This dynamic response of FM4-64 makes it an excellent marker for studying these cellular processes in real-time.

      This study is the first to report an increase in FM4-64 fluorescence in the midpiece of the sperm flagellum. Figures 5 and Author response images 6 to 9 demonstrate that during the contraction of the sperm flagellum, structural rearrangements occur, including the compaction of the mitochondrial sheath and other membranous structures. Such contraction likely increases the local density of membrane lipids, thereby elevating the local concentration of FM4-64 and enhancing the probability of fluorescence emission. Additionally, changes in the microenvironment such as pH or ionic strength during contraction might further influence FM4-64’s fluorescence properties, as detailed by Smith et al. in the Journal of Membrane Biology (2010). The photophysical behavior of FM4-64, including changes in quantum yield due to tighter membrane packing or alterations in curvature or tension, may also contribute to the increased fluorescence observed. Notably, Figure S2 indicates that other fluorescent dyes like Memglow 700, Bodipy-GM, and FM1-43 also show a dramatic increase in their fluorescence during the midpiece contraction. Investigating whether the compaction of the plasma membrane or other mesoscale processes occur in the midpiece of the sperm flagellum could be a valuable area for future research. The use of fluorescent dyes such as LAURDAN or Nile Red might provide further insights into these membrane dynamics, offering a more comprehensive understanding of the biochemical and structural changes during sperm motility and gamete fusion events.

      (3) As the volume of the whole midpiece stays the same while the diameter decreases along the whole midpiece (midpiece contraction), the authors need to describe what changes in the midpiece length they observe during the contraction. Was the length of the midpiece during the contraction measured and compared before and after contraction?

      Response R1.3: As requested, we have measured the length of the midpiece in AI and AR sperm. As shown in Author response image 12 (For review purposes only), no statistically significant differences were observed. 

      Author response image 12.

      Midpiece length measured by the length of mitochondrial DsRed2 fluorescence in EGFP-DsRed2 sperm. Measurements were done before (acrosome-intact) and after (acrosome-reacted) acrosome exocytosis and midpiece contraction. Data is presented as the mean ± sem of 14 cells induced by 10 µM ionomycin. Paired t-test was performed, resulting in no statistical significance. 

      (4) Most of all, it is not clear what the midpiece, thus mitochondria, contraction means in terms of sperm bioenergetics and motility cessation. Would the contraction induce mitochondrial depolarization or hyperpolarization, increase or decrease of ATP production/consumption? It will be great if this point is discussed. For example, an increase in mitochondrial Ca2+ is a good indicator of mitochondrial activity (ATP production).

      Response R1.4: That is an excellent point. We have discussed this idea in the discussion (line 620-624). We are currently exploring this idea using different approaches because we also think that these changes in the midpiece may have an impact in the function of the mitochondria and perhaps, in their fate once they are incorporated in the egg after fertilization. 

      (5) The authors claimed that Ca2+ signal propagates from head to tail, which is the opposite of the previous study (PMID: 17554080). Please clarify if it is a speculation. Otherwise, please support this claim with direct experimental evidence (e.g., high-speed calcium imaging of single cells).

      Response R1.5: In that study, it was claimed that a [Ca2+]i  increase that propagates from the tail to the head occurs when CatSper is stimulated. They did not evaluate the occurrence of AE when monitoring calcium.

      Our data is in agreement with our previous results (PMID: 26819478) that consistently indicated that only the[Ca2+]i  rise originating in the sperm head is able to promote AE. 

      (6) Figure 4E: Please explain how come Fluo4 signal diameter can be smaller than FM4-64 dye if it stains plasma membrane (at 4' and 7').

      Response R1.6: When colocalizing a diffraction-limited image (Fluo4) with a super-resolution image (FM4-64), discrepancies in signal sizes and locations can become apparent due to differences in resolution. The Fluo4 signal, being diffraction-limited, adheres to a resolution limit of approximately 200-300 nanometers under conventional light microscopy. This limitation causes the fluorescence signal to appear broader and less defined. Conversely, super-resolution microscopy techniques, such as SRRF (Super-Resolution Radial Fluctuations), achieve resolutions down to tens of nanometers, allowing FM4-64 to reveal finer details at the plasma membrane and display potentially smaller apparent sizes of stained structures. Although both dyes might localize to the same cellular regions, the higher resolution of the FM4-64 image allows it to show a more precise and smaller diameter of the midpiece of the flagellum compared to the broader, less defined signal of Fluo4. To address this, the legend of Figure 4E has been slightly modified to clarify that the FM4-64 image possesses greater resolution. 

      (7) Figure 5D-G: the midpiece diameter of AR intact cells was shown ~ 0.8 um or more in Figure 2, while now the radius in Figure 5 is only 300 nm. Since the diameter of the whole midpiece is nearly uniform when the acrosome is intact, clarify how and what brings this difference and where the diameter/radius measurement is done in each figure.

      Response R1.7: The difference resides in what is being measured. In Figure 2, the total diameter of the cell is measured, through the maximum peaks of FM4-64 fluorescence which is a probe against plasma membrane. As for Figure 5, the radius shown makes reference to the radius of the actin double helix within the midpiece. To that end, cells were fixed and stained with phalloidin, a F-actin probe.

      Minor points

      (8) Figure S1 title needs to be changed. The "Midpiece contraction" concept is not introduced when Figure S1 is referred to.

      Response R1.8: This was corrected in the new version.

      (9) Reference #19: the authors are duplicated.

      Response R1.9: This was corrected in the new version.

      (10) Line 315-318: sperm undergoing contraction -> sperm undergoing AR/AE?

      Response R1.10: This was corrected in the new version.

      (11) Line 3632 -> punctuation missing.

      Response R1.11: Modified as requested.

      (12) Movie S7: please add an arrow to indicate the spermatozoon of interest.

      Response R1.12:  The arrow was added as suggested.

      (13) Line 515: One result of this study was that the sperm flagellum folds back during fusion coincident with the decrease in the midpiece diameter. The authors did not provide an explanation for this observation. Please speculate the function of this folding for the fertilization process.

      Response R1.13: As requested, this is now incorporated in the discussion. We speculate that the folding of the flagellum during fusion further facilitates sperm immobilization because it makes it more difficult for the flagellum to beat. Such processes can enhance stability and increase the probability of fusion success. Mechanistically, the folding may occur as a consequence of the deformation-induced stress that develops during the decrease of midpiece diameter. 

      Reviewer #2 (Recommendations For The Authors):

      (1) Figure 2C, D, E. Does "-1" on the X-axis mean one minute before induction? If so, the diameter is already smaller and FM4-64 fluorescence intensity is higher before the induction in the spontaneous group. Does the acrosome reaction already occur at "-1" in this group?

      Response R2.1: Yes, “-1” means that the measurements of the diameter/FM4-64 fluorescence was done one minute before the induction. And it is correct that the diameter is smaller and FM464 fluorescence higher in the spontaneous group because these sperm underwent acrosome exocytosis before the induction, that is, spontaneously.

      (2) Figure 3D. Purple dots are not shown in the graph on the right side.

      Response R2.2: Modified as requested.

      (3) Lines 404-406. "These results suggest that midpiece contraction and motility cessation occur only after acrosome-reacted sperm penetrate the zona pellucida". Since midpiece contraction and motility cessation also occur before the passage through the zona pellucida (Figure 9B), "only" should be deleted.

      Response R2.3: Modified as requested.

      Reviewer #3 (Recommendations For The Authors):

      (1) Do the authors have a hypothesis as to why the observed decrease in midpiece parameter results in cessation of sperm motility? It would be beneficial for the manuscript to include a paragraph about potential mechanisms in the discussion.

      Response R3.1: As requested, a potential mechanism has been proposed in the discussion section (line 644-656).

      (2) Since the authors propose in Gervasi et al. 2018 that the actin helix might be responsible for the integrity of the mitochondrial sheath and the localization of the mitochondria, is it possible that the proposed change in plasma membrane diameter and actin helix remodeling for example alters the localization of the mitochondria? TEM should be able to reveal any associated structural changes. In its current state, the manuscript lacks experimental evidence supporting the author's claim that the "helical actin structure plays a role in the final stages of motility regulation". The authors should either include additional evidence supporting their hypothesis or tone down their conclusions in the introduction and discussion.

      Response  R3.3: We agree with the reviewer. This is an excellent point. As suggested by this reviewer as well as the other reviewers, we have performed SEM to observe the changes in the midpiece observed after its contraction for two main reasons. First, to confirm this observation using a different approach that does not involve the use of membrane dyes. As shown in Author response image 6-10, we have observed that in addition to the midpiece diameter, there is a reorganization of the mitochondria sheet that is also suggested by the SIM experiments. These observations will be explored with more experiments to confirm the structural and functional changes that mitochondria undergo during the contraction. We are currently investigating this phenomenon, These results are now included in the new Figure  2F.

      (3) In line 134: The authors write: 'Some of the acrosome reacted sperm moved normally, whereas the majority remained immotile". Do the authors mean that a proportion of the sperm was motile prior to acrosomal exocytosis and became immotile after, or were the sperm immotile to begin with? Please clarify.

      Response R3.4: This statement is based on the quantification of the motile sperm after induction of AE within the AR population (Fig. 1C). 

      (4) The authors do not provide any experimental evidence supporting the first scenario. In video 1 a lot of sperm do not seem to be moving to begin with, only a few sperm show clear beating in and out of the focal plane. The highlighted sperm that acrosome-reacted upon exposure to progesterone don't seem to be moving prior to the addition of progesterone. In contrast, the sperm that spontaneously acrosome react move the whole time. In video 1 this reviewer was not able to identify one sperm that stopped moving upon acrosomal exocytosis. Similarly in video 3, although the resolution of the video makes it difficult to distinguish motile from non-motile sperm. In video 2 the authors only show sperm that are already acrosome reacted. Please explain and provide additional evidence and statistical analysis supporting that sperm stop moving upon acrosomal exocytosis.

      Response R3.5: In videos 1 and 3, the cells are attached to the glass with concanavalin-A, this lectin makes sperm immotile (if well attached) because both the head and tail stick to the glass. The observed motility of sperm in these videos is likely due to them not being properly attached to the glass, which is completely normal. On the contrary, in videos 2 and 4, sperm are attached to the glass with laminin. This is a glycoprotein that only binds the sperm to the glass through its head, that is why they move freely.

      (5) Could the authors provide additional information about the FM4-64 fluorescent dye?

      What is the mechanism, and how does it visualize structural changes at the flagellum? Since the whole head lights up, does that mean that the dye is internalized and now stains additional membranes, similar to during wound healing assays (PMID 20442251, 33667528). Or is that an imaging artifact? How do the authors explain the correlation between FM4-64 fluorescence increase in the midpiece and the observed change in diameter? Does FM4-64 have solvatochromatic properties?

      Response R3.6: We appreciate the insightful queries posed by Reviewer 3, which echo the concerns initially brought forward by Reviewer 1. For a detailed explanation of the mechanism of FM4-64 dye, how we interpret  it, visualizes structural changes in the flagellum, and its behavior during cellular processes, please refer to our detailed response in Response R1.2. In brief, FM464 is a lipophilic styryl dye that preferentially binds to the outer leaflets of cellular membranes due to its amphiphilic nature. Upon binding, the dye becomes fluorescent, allowing for the visualization of membrane dynamics. The increase in fluorescence in the sperm head or midpiece likely results from the dye’s accumulation in areas where membrane restructuring occurs, such as during AE or in response to changes in the flagellum structure.

      Regarding the specific questions about internalization and whether FM4-64 stains additional membranes similarly to what is observed in wound healing assays, it's important to note that FM4-64 can indeed be internalized through endocytosis and subsequently label internal vesicular structures. Additionally, FM4-64 may experience changes in its fluorescence as a result of fusion events that increase the lipid content of the plasma membrane, as observed in studies cited (PMID 20442251, 33667528). This characteristic makes FM4-64 valuable not only for outlining cell membranes but also for tracking the dynamics of both internal and external membrane systems, particularly during cellular events that involve significant membrane remodeling, such as wound healing or AE.

      Concerning whether the increased fluorescence and observed changes in diameter are artifacts or reflect real biological processes, the correlation observed likely indicates actual changes in the midpiece architecture through molecular mechanisms that remain to be further elucidated. The data presented in Figures 5 and Author response images 6-10 support that this increase in fluorescence is not merely an artifact but a feature of how FM4-64 interacts with its environment. 

      Finally, regarding the solvatochromatic properties of FM4-64, while the dye does show changes in its fluorescence intensity in different environments, its solvatochromatic properties are generally less pronounced than those of dyes specifically designed to be solvatochromatic. FM464's fluorescence changes are more a result of membrane interaction dynamics and dye concentration than of solvatochromatic shifts. 

      (6) For the experiment summarized in Figure S1, did the authors detect sperm that acrosome-reacted upon exposure to progesterone and kept moving? This reviewer is wondering how the authors reliably measure FM4-64 fluorescence if the flagellum moves in and out of the focal plane. If the authors observe sperm that keep moving, what was the percentage within a sperm population and how did FM4-64 fluorescence change?

      Response R3.6: We did identify sperm that underwent acrosome reaction upon exposure to progesterone and continued to exhibit movement. However, due to the issue raised by the reviewer regarding the flagellum going out of focus, we opted to quantify the percentage of sperm that were adhered to the slide (using laminin). This approach allows for the observation of flagellar position over time, facilitating an easy assessment of fluorescence changes. The percentage of sperm that maintained movement after AE is depicted in Figure 1C.

      (7) In Figure S1B it doesn't look like the same sperm is shown in all channels or time points, the hook shown in the EGFP channel is not always pointing in the same direction. If FM4-64 is staining the plasma membrane, how do the authors explain that the flagellum seems to be more narrow in the FM4-64 channel than in the brightfield and DsRed2 channel?

      Response 3.7: It is the same sperm, but due to technical limitations images were sequentially acquired. For example, for time 5 minutes after progesterone, all images in DIC were taken, then all images in the EGFP channel, then DsRed2* and finally FM4-64. The reason for this was to acquire images as fast as possible, particularly in DIC images which were then processed to get the beat frequency.

      Regarding the flagellum that seems to be more narrow in the FM4-64 channel compared to the BF or DsRed2 channel, the explanation is related to the fact that intensity of the DsRed2 signal is stronger than the other two. This higher signal may have increased the amount of photons captured by the detector.

      (8) Overall, it would be beneficial to include statistics on how many sperm within a population did change FM4-64 fluorescence during AE and how many did not, in addition to information about motility changes and viability. Did the authors exclude that the addition of FM4-64 causes cell death which could result in immotile sperm or that only dying sperm show an increase in FM4-64 fluorescence?

      Response 3.8: The relationship between cell death and the increase in FM4-64 fluorescence is widely discussed in Response P2.3. In our experiments, we always considered sperm that were motile to hypothesize about the relevance of this observation. We have two types of experiments: 

      (1) Sperm-egg Fusion: In experiments where sperm and eggs were imaged to observe their fusion, sperm were initially moving and after fusion, the midpiece contraction (increase in FM4-64 fluorescence was observed) indicating that the change in the midpiece (that was observed consistently in all fusing cells analyzed), is part of the process. 

      (2) Sperm that underwent AE: we have observed two behaviours as shown in Figure 1: 

      a) Sperm that underwent AE and they remain motile without midpiece contraction (they are alive for sure); 

      b) Sperm that underwent AE and stopped moving with an increase in FM464 fluorescence. We propose that this contraction during AE is not desired because it will impede sperm from moving forward to the fertilization site when they are in the female reproductive tract. In this case, we acknowledge that the cessation of sperm motility may be attributed to cellular death, potentially correlating with the increased FM4-64 signal observed in the midpiece of immotile sperm that have undergone AE. To address this hypothesis, we conducted image-based flow cytometry experiments, which are well-suited for assessing cellular heterogeneity within large populations.

      Regarding the relationship between the increase in FM4-64 and AE, we have always observed that AE is followed by an increase in FM4-64 in the head in mice (PMID: 26819478) as well as in human (PMID: 25100708) sperm. This was originally corroborated with the EGFP sperm. However, not all the cells that undergo AE increase the FM4-64 fluorescence in the midpiece.

      (9) The authors report that a fraction of sperm undergoes AE without a change in FM4-64 fluorescence (Figure 1F). How does the [Ca2+]i change in those cells? Again statistics on the distribution of a certain pattern within a population in addition to showing individual examples would be very helpful.

      Response 3.9: A recent work shows that an initial increase in [Ca2+]i  is required to induce changes in flagellar beating necessary for hyperactivation (Sánchez-Cárdenas et al., 2018). However, when [Ca2+]i  increases beyond a certain threshold, flagellar motility ceases. These conclusions are based on single-cell experiments in murine sperm with different concentrations of the Ca2+ ionophore, A23187. The authors reported that complete loss of motility was observed when using ionophore concentrations higher than 1 μM. In contrast, spermatozoa incubated with 0.5 μM A23187 remained motile throughout the experiment. Once the Ca2+ ionophore is removed, the sperm would reduce the concentration of this ion to levels compatible with motility and hyperactivation (Navarrete et al., 2016). However, some of the washed cells did not recover mobility in the recorded time window (Sánchez-Cárdenas et al., 2018). These results would indicate that due to the increase in [Ca2+]i  induced by the ionophore, irreversible changes occurred in the sperm flagellum that prevented recovery of mobility, even when the ionophore was not present in the recording medium. 

      Taking into account our results, one possible scenario to explain this irreversible change would be the contraction of the midpiece. Our results demonstrate that the increase in [Ca2+]i observed in the midpiece (whether by induction with progesterone, ionomycin or occurring spontaneously) causes the contraction of this section of the flagellum and its subsequent immobilization. 

      (10) While the authors results show that changes in [Ca2+]i correlate with the observed reduction of the midpiece diameter, they do not provide evidence that the structural changes are triggered by Ca2+i influx. It could just be a coincidence that both events spatially overlap and that they temporarily follow each other. The authors should either provide additional evidence or tone down their conclusion.

      Response 3.10: We agree with the reviewer. As suggested, we have toned down our conclusion.

      (11) Are the authors able to detect the changes in the midpiece diameter independent from FM4-64 or other plasma membrane dyes? An alternative explanation could be that the dyes are internalized due to cell death and instead of staining the plasma membrane they are now staining intracellular membranes, resulting in increased fluorescence and giving the illusion that the midpiece diameter decreased. How do the authors explain that the Bodipy-GM1 Signal directly overlaps with DsRed2 and SIR-actin, shouldn't there be some gap? Since the rest of the manuscript is based on that proposed decrease in midpiece diameter the authors should perform orthogonal experiments to confirm their observation.

      Response 3.11: As requested by the reviewer, we have not used new methods to visualize the change in sperm diameter in the midpiece. In neither of them, a membrane dye was used. First, we have performed immunofluorescence to detect a membrane protein (GLUT3). Second, we have used scanning electron microscopy. The results are now incorporated in the new Figure 2FG. In both experiments, a change in the midpiece diameter was observed. Please, also visit responses P2.5 and Author response images 8 to 10.  

      Regarding the overlap between the signal of Bodipy GM1 (membrane) and the fluorescence of DsRed2 (mitochondria) and Sir-Actin (F-actin), it is only observed in acrosomereacted sperm, not in acrosome-intact sperm (Figure S4). In our view, these structures become closed after midpiece contraction, and the resolution of the images is insufficient to distinguish them clearly. This issue is also evident in Figure 5B. Therefore, we conducted additional experiments using more powerful super-resolution techniques such as STORM (Figures 5D-F).

      (12) The proposed gap of 200 nM between the actin helix and the plasma membrane, has been observed by TEM? Considering that the diameter of the mouse sperm midpiece is about 1 um, that is a lot of empty space which leaves only about 600 nm for the rest of the flagellum. The axoneme is 300 nm and there needs to be room for the ODFs and the mitochondria. Please explain.

      Response 3.12: Unfortunately, the filament of polymerized actin cannot be observed by TEM. Furthermore, we were discouraged from trying other approaches, such as utilizing phalloidin gold, because for some reason, it does not work properly.

      In our view, the 200 nm gap between the actin cytoskeleton and the plasma membrane is occupied by the mitochondria (that is the size that it is frequently reported based on TEM; see https://doi.org/10.1172/jci.insight.166869).

      (13) The results provided by the authors do not convince this reviewer that the actin helix moves, either closer to the plasma membrane or toward the mitochondria, the observed differences are minor and not confirmed by statistical analysis.

      Response 3.13: As requested, the title of that section was changed. Moreover, our conclusion is exactly as the reviewer is suggesting: “Since the results of the analysis of SiR-actin slopes were not conclusive, we studied the actin cytoskeleton structure in more detail”. This conclusion is based on the statistical analysis shown in Figure S5D-E.

      (14) The fluorescence intensity of all plasma membrane dyes increases in all cells chosen by the authors for further analysis. Could the increase in SiR-Actin fluorescence be explained by a microscopy artifact instead of actin helix remodeling? Alternatively, can the authors exclude that the observed increase in SIR-Actin might be an artifact caused by the increase in FM4-64 fluorescence? Since the brightness in the head similarly increases to the fluorescence in the flagellum the staining pattern looks suspiciously similar. Did the authors perform single-stain controls?

      Response 3.14: We had similar concerns when we were doing the experiments using SiR-actin. Although we have performed single stain controls to make sure that the actin helix remodelling occurs during the midpiece contraction, we have performed experiments using higher resolution techniques such as STORM using a different probe to stain actin (Phalloidin).

      (15) Should actin cytoskeleton remodeling indeed result in a decrease of actin helix diameter, what do the authors propose is the underlying mechanism? Shouldn't that result in changes in mitochondrial structure or location and be visible by TEM? This reviewer is also wondering why the authors focus so much on the actin helix, while the plasma membrane based on the author's results is moving way more dramatically.

      Response 3.15: This raises an intriguing point. Currently, we lack an understanding of the underlying mechanism driving actin remodeling, and we are eager to conduct further experiments to explore this aspect. For instance, we are investigating the potential role of Cofilin in remodeling the F-actin network. Initial experiments utilizing STORM imaging have revealed the localization of Cofilin in the midpiece region, where the actin helix is situated.

      Regarding mitochondria, thus far, we have not uncovered any evidence suggesting that acrosome reaction or fusion with the egg induces a rearrangement of these organelles within the structure. The rationale for investigating polymerized actin in depth stems from the fact that, alongside the axoneme and other flagellar structures such as the outer dense fibers and fibrous sheet, these are the sole cytoskeletal components present in that particular tail region.

      (14) The fact that the authors observe that most sperm passing through the zona pellucida, which requires motility, display high FM4-64 fluorescence, doesn't that contradict the authors' hypothesis that midpiece contraction and motility cessation are connected? Videos confirming sperm motility and information about pattern distribution within the observed sperm population in the perivitelline space should be provided.

      Response 3.14: We believe it is a matter of time, as depicted in Figure 1D, our model shows that first the cells lose the acrosome, present motility and low FM4-64 fluorescence in the midpiece (pattern II) and after that, they lose motility and increase FM4-64 fluorescence in the midpiece (pattern III). That is why, we think that when sperm pass the zona pellucida they present pattern II and after some time they evolve into pattern III. 

      (15) In the experiments summarized in Figure 8, did all sperm stop moving? Considering that 74 % of the observed sperm did not display midpiece contraction upon fusion, again doesn't that contradict the authors' hypothesis that the two events are interdependent? Similarly, in earlier experiments, not all acrosome-reacted sperm display a decrease in midpiece diameter or stop moving, questioning the significance of the event. If some sperm display a decrease in midpiece diameter and some don't, or undergo that change earlier or later, what is the underlying mechanism of regulation? The observed events could similarly be explained by sperm death: Sperm are dying × plasma membrane integrity changes and plasma membrane dyes get internalized × [Ca2+]i simultaneously increases due to cell death × sperm stop moving.

      Response 3.15: The percentage of sperm that did not exhibit midpiece contraction in Fig.8B is 26%, not 74%, indicating that it does not contradict our hypothesis. However, this still represents a significant portion of sperm that remain unchanged in the midpiece, leaving room for various explanations. For instance, it's possible that: i) the change in fluorescence was not detected due to the event occurring after the recording concluded, or ii) in some instances, this alteration simply does not occur. Nevertheless, we did not track subsequent events in the oocyte, such as egg activation, to definitively ascertain the success of fusion. Incorporation of the dye only manifests the initiation of the process.

      (16) The authors propose changes in Ca2+ as one potential mechanism to regulate midpiece contraction, however, the Ca2+ measurements during fusion are flawed, as the authors write in the discussion, by potential Ca2+ fluorophore dilution. Considering that the authors observe high Ca2+ in all sperm prior to fusion, could that be a measuring artifact? Were acrosome-intact sperm imaged with the same settings to confirm that sperm with low and high Ca2+ can be distinguished? Should [Ca2+]i changes indeed be involved in the regulation of motility cessation during fusion, could the authors speculate on how [Ca2+]i changes can simultaneously be involved in the regulation of sperm hyperactivation?

      Response 3.16: We agree with the reviewer that our experiments using calcium probes are not conclusive for many technical problems. We have toned down our conclusions in the new version of the manuscript.

      (17) 74: AE takes place for most cells in the upper segment of the oviduct, not all of them.

      Please correct.

      Response 3.17: Corrected in the new version.

      (18) 88: Achieved through, or achieved by, please correct.

      Response 3.18: Corrected in the new version.

      (19) 243: Acrosomal exocytosis initiation by progesterone, please specify.

      Response 3.19: Modified in the new version.

      (20) 277: "The actin cytoskeleton approaches the plasma membrane during the contraction of the midpiece" is misleading. The author's results show the opposite.

      Response 3.20: As suggested, this statement was modified.

      (21) 298: Why do the authors find it surprising that the F-actin network was unchanged in acrosome-intact sperm that do not present a change in midpiece diameter?

      Response 3.21: The reviewer is right. The sentence was modified.

      (22) Figures 5D,F: The provided images do not support a shift in the actin helix diameter.

      Response 3.22: The shift in the actin helix diameter is provided in Figure 5E and 5G.

      (23) Figure S5C: The authors should show representative histograms of spontaneously-, progesterone induced-, and ionomycin-induced AE. Based on the quantification the SiRactin peaks don't seem to move when the AR is induced by progesterone.

      Response 3.23: As requested, an ionomycin induced sperm is incorporated.

      (24) 392: Which experimental evidence supports that statement?

      Response 3.24: A reference was incorporated. 

      Reference 13 is published, please update. Response 3.25: updated as requested.

    1. Author response:

      The following is the authors’ response to the original reviews.

      Reviewer #1 (Public Review):

      Using the UK Biobank, this study assessed the value of nuclear magnetic resonance measured metabolites as predictors of progression to diabetes. The authors identified a panel of 9 circulating metabolites that improved the ability in risk prediction of progression from prediabetes to diabetes. In general, this is a well-performed study, and the findings may provide a new approach to identifying those at high risk of developing diabetes. I have some comments that may improve the importance of this study.

      We deeply appreciate the reviewer's invaluable time dedicated to the review of this manuscript and the insightful comments to enhance its overall quality.

      (1) It is unclear why the authors only considered the top 20 variables in the metabolite selection and why they did not set a wider threshold.

      Thank you for the comment. We set the top 20 variables in the metabolite selection balancing the performance of the final diabetes risk prediction model and the clinical applicability due to measurement costs. We have added this explanation in the “Methods” section.

      “We chose the intersection set of the top 20 most important variables selected by the three machine learning models, after balancing the performance of the final diabetes risk prediction model and the clinical applicability associated with measurement costs of metabolites.”

      (2) The methods section would benefit from a more detailed exposition of how parameter tuning was conducted and the range of parameters explored during the training of the RSF model.

      According to the reviewer’s suggestion, we have added a more detailed description of parameters tunning and the range of parameters explored during the training of the RSF model in the “Method S3” section in the Supplementary material.

      “The RSF model was fitted using the “randomForestSRC” package and the grid search method was used for hyperparameter tuning. Specifically, the grid search method was used to tune hyperparameters among the RSF model, through minimizing out-of-sample or out-of-bag error1. Each tree in the RSF is constructed from a random sample of the data, typically a bootstrap sample or 63.2% of the sample size (as in the present study). Consequently, not all observations are used to construct each tree. The observations that are not used in the construction of a tree are referred to as out-of-bag observations. In an RSF model, each tree is built from a different sample of the original data, so each observation is “out-of-bag” for some of the trees. The prediction for an observation can then be obtained using only those trees for which the observation was not used for the construction. A classification for each observation is obtained in this way and the error rate can be estimated from these predictions. The resulting error rate is referred to as the out-of-bag error. Through calculating the out-of-bag error in each iteration, the best hyperparameters were finally determined.

      The hyperparameters to be tuned and range of grid search in the present study were below: number of trees (50-1000, by 50), number of variables to possibly split at each node (3-6, by 1), and minimum size of terminal node (1-20, by 1)2.”

      (3) It is hard to understand the meaning of the decision curve analysis and the clinical implications behind the net benefit, which are required to clarify the application values of models.

      Thank you for the comment. We have added more description and discussion about the decision curve analysis in the “Methods” and “Discussion” sections.

      “Furthermore, we used decision curve analysis (DCA) to assess the clinical usefulness of prediction model-based guidance for prediabetes management, which calculates a clinical “net benefit” for one or more prediction models in comparison to default strategies of treating all or no patients3.”

      “Most importantly, a model with good discrimination does not necessarily have high clinical value. Hence, DCA was used to compare the clinical utility of the model before and after adding the metabolites, and this showed a higher net benefit for the latter than the basic model, suggesting the addition of the metabolites increased the clinical value of prediction, i.e., the potential benefit of guiding management in individuals with prediabetes3,4. These results provided novel evidence supporting the value of metabolic biomarkers in risk prediction and stratification for the progression from prediabetes to diabetes.”

      (4) Notably, the NMR platform utilized within the UK Biobank primarily focused on lipid species. This limitation should be discussed in the manuscript to provide context for interpreting the results and acknowledge the potential bias from the measuring platform.

      Thank you for the comment. We acknowledged this limitation that NMR platform within the UK Biobank primarily focused on lipid species and the potential bias from the measuring platform and have added this in “Discussion” section.

      “Third, the Nightingale metabolomics platform primarily focused on lipids and lipoprotein sub-fractions, and thus the predictive value of other metabolites in the progression from prediabetes to diabetes warranted further research using an untargeted metabolomics approach.”

      (5) The manuscript should explain the potential influence of non-fasting status on the findings, particularly concerning lipoprotein particles and composition. There should be a detailed discussion of how non-fasting status may impact the measurement and the findings.

      According to the reviewer’s suggestion, we have added more details to explain the potential influence of non-fasting status on our findings in the “Discussion” section.

      “Additionally, the use of non-fasting blood samples might increase inter-individual variation in metabolic biomarker concentrations, however, fasting duration has been reported to account for only a small proportion of variation in plasma metabolic biomarker concentrations5. Therefore, we believe the impact of non-fasting samples on our findings would be minor.”

      (6) Cross-platform standardization is an issue in metabolism, and further descriptions of quality control are recommended.

      Thank you for the comment. We have added more description of quality control in the “Method S1” section in the Supplementary material.

      “Metabolic biomarker profiling by Nightingale Health’s NMR platform provides consistent results over time and across spectrometers. Furthermore, the sample preparation is minimal in the Nightingale Health’s metabolic biomarker platform, circumventing all extraction steps. These aspects result in highly repeatable biomarker measurements. Pre-specified quality metrics were agreed between UK Biobank and Nightingale Health to ensure consistent results across the samples, and pilot measurements were conducted. Nightingale Health performed real-time monitoring of the measurement consistency within and between spectrometers throughout the UK Biobank samples. Two control samples provided by Nightingale Health were included in each 96-well plate for tracking the consistency across multiple spectrometers. Furthermore, two blind duplicate samples provided by the UK Biobank were included in each well plate, with the position information unlocked only after results delivery. Coefficient of variation (CV) targets across the metabolic biomarker profile were pre-specified for both Nightingale Health’s internal control samples and UK Biobank’s blind duplicates. The targets were met for each consecutively measured batch of ~25,000 samples. For the majority of the metabolic biomarkers, the CVs were below 5% (https://biobank.ndph.ox.ac.uk/showcase/refer.cgi?id=3000). Further, the distributions of measured biomarkers from 5 sample batches indicated absence of batch effects (https://biobank.ctsu.ox.ac.uk/ukb/ukb/docs/nmrm_app1).”

      Reviewer #2 (Public Review):<br /> Deciphering the metabolic alterations characterizing the prediabetes-diabetes spectrum could provide early time windows for targeted preventive measures to extend precision medicine while avoiding disproportionate healthcare costs. The authors identified a panel of 9 circulating metabolites combined with basic clinical variables that significantly improved the prediction from prediabetes to diabetes. These findings provided insights into the integration of these metabolites into clinical and public health practice. However, the interpretation of these findings should take account of the following limitations.

      We appreciate the reviewer’s positive comments and encouragement.

      (1) First, the causal relationship between identified metabolites and diabetes or prediabetes deserves to be further examined particularly when the prediabetic status was partially defined. Some metabolites might be the results of prediabetes rather than the casual factors for progression to diabetes.

      Thank you for your insightful comments. We agree with you that the panel of metabolites in this study might not be the causal factor for progression from prediabetes to diabetes, which needs further validation in experimental studies. We have added this limitation in the “Discussion” section.

      “Fifth, we could not draw any conclusion about the causality between the identified metabolites and the risk for progression to diabetes due to the observational nature, which remained to be validated in further experimental studies.”

      (2) The blood samples were taken at random (not all in a non-fasting state) and so the findings were subjected to greater variability. This should be discussed in the limitations.

      According to the reviewer’s suggestion, we have added more details to explain the potential influence of non-fasting status on our findings in the “Discussion” section.

      “Additionally, the use of non-fasting blood samples might increase inter-individual variation in metabolic biomarker concentrations, however, fasting duration has been reported to account for only a small proportion of variation in plasma metabolic biomarker concentrations5. Therefore, we believe the impact of non-fasting samples on our findings would be minor.”

      (3) The strength of NMR in metabolic profiling compared to other techniques (i.e., mass spectrometry [MS], another commonly used metabolic profiling method) could be added in the Discussion section.

      According to the reviewer’s suggestion, we have added the strength of NMR in metabolic profiling compared to other techniques in the “Discussion” section.

      “Circulating metabolites were quantified via NMR-based metabolome profiling within the UK Biobank, which offers metabolite qualification with relatively lower costs and better reproducibility6.”

      (4) Fourth, the applied platform focuses mostly on lipid species which may be a limitation as well.

      Thank you for the comment. We acknowledged this limitation that NMR platform within the UK Biobank primarily focused on lipid species and the potential bias from the measuring platform and have added this in the “Discussion” section.

      “Third, the Nightingale metabolomics platform primarily focused on lipids and lipoprotein sub-fractions, and thus the predictive value of other metabolites in the progression from prediabetes to diabetes warranted further research using an untargeted metabolomics approach.”

      (5) It is a very large group with pre-diabetes, but the results only apply to prediabetes and not to the general population. This should be clear, although the authors have also validated the predictive value of these metabolites in the general population.

      Thank you for the comment. We agree with you that the results only apply to prediabetes and not to the general population, though they also showed potential predictive value among participants with normoglycemia. We have accordingly modified the relevant expressions in the “Conclusion” section to restrict these findings to participants with prediabetes.

      “In this large prospective study among individuals with prediabetes, we detected a panel of circulating metabolites that were associated with an increased risk of progressing to diabetes.”

      Recommendations for the Authors:

      Thank you for providing the valuable feedback and the time you have dedicated to our work.

      (1) In the first paragraph of the Discussion section, please include the specific names of the metabolites selected from machine learning methods.

      Thank you for your comment and we have added accordingly in the first paragraph of the “Discussion” section.

      “More importantly, our findings suggested that adding the selected metabolites (i.e., cholesteryl esters in large HDL, cholesteryl esters in medium VLDL, triglycerides in very large VLDL, average diameter for LDL particles, triglycerides in IDL, glycine, tyrosine, glucose, and docosahexaenoic acid) could significantly improve the risk prediction of progression from prediabetes to diabetes beyond the conventional clinical variables.”

      (2) To enhance the readability and simplicity of the paper, the description of covariate collection in the methods section should be streamlined, with detailed information provided in the supplementary materials.

      Thank you for your suggestion and we have moved details about covariates collection to the “Supplementary method S2” to enhance the readability and simplicity of the paper.

      “Information on covariates was collected through a self-completed touchscreen questionnaire or verbal interview at baseline, including age, sex, ethnicity, Townsend deprivation index, household income, education, employment status, smoking status, moderate alcohol, physical activity, healthy diet score, healthy sleep score, family history of diabetes, history of cardiovascular disease (CVD), history of hypertension, history of dyslipidemia, history of chronic lung diseases (CLD), and history of cancer.

      Physical measurements included systolic (SBP) and diastolic blood pressure (DBP), height, weight, waist circumference (WC), and hip circumference (HC). Body mass index (BMI) was calculated as weight in kilograms divided by the square of height in meters (kg/m²). Missing covariates were imputed by the median value for continuous variables and a missing indicator for categorical variables. More details about covariates collection can be found in Method S2.”

      3. Title for Table 2, using Cox proportional hazards prediction models is not common. You may consider the title "Performance of Cox proportional hazards regression models in prediction of progression of prediabetes to diabetes".

      Thank you for your suggestion and we have revised it accordingly.

      4. Figure 3, did the authors consider competing risk to compute cumulative incidence function?

      Thank you for your comment. We did not consider competing risk from death when plotting the cumulative hazard curves. However, following your suggestion, we have included an additional cumulative hazard plot after considering the competing

      References

      (1) Janitza S, Hornung R. On the overestimation of random forest's out-of-bag error. PLoS One. 2018;13(8):e0201904.

      (2) Tian D, Yan HJ, Huang H, et al. Machine Learning-Based Prognostic Model for Patients After Lung Transplantation. JAMA Netw Open. 2023;6(5):e2312022.

      (3) Vickers AJ, van Calster B, Steyerberg EW. A simple, step-by-step guide to interpreting decision curve analysis. Diagn Progn Res. 2019;3:18.

      (4) Li J, Xi F, Yu W, Sun C, Wang X. Real-Time Prediction of Sepsis in Critical Trauma Patients: Machine Learning-Based Modeling Study. JMIR Form Res. 2023;7:e42452.

      (5) Li-Gao R, Hughes DA, le Cessie S, et al. Assessment of reproducibility and biological variability of fasting and postprandial plasma metabolite concentrations using 1H NMR spectroscopy. PLoS One. 2019;14(6):e0218549.

      (6) Geng T-T, Chen J-X, Lu Q, et al. Nuclear Magnetic Resonance–Based Metabolomics and Risk of CKD. American Journal of Kidney Diseases. 2023.

    1. Author response:

      The following is the authors’ response to the previous reviews.

      Reviewer #1 (Public Review):

      Summary:

      The study of human intelligence has been the focus of cognitive neuroscience research, and finding some objective behavioral or neural indicators of intelligence has been an ongoing problem for scientists for many years. Melnick et al, 2013 found for the first time that the phenomenon of spatial suppression in motion perception predicts an individual's IQ score. This is because IQ is likely associated with the ability to suppress irrelevant information. In this study, a high-resolution MRS approach was used to test this theory. In this paper, the phenomenon of spatial suppression in motion perception was found to be correlated with the visuo-spatial subtest of gF, while both variables were also correlated with the GABA concentration of MT+ in the human brain. In addition, there was no significant relationship with the excitatory transmitter Glu. At the same time, SI was also associated with MT+ and several frontal cortex FCs.

      Strengths:

      (1) 7T high-resolution MRS is used.

      (2) This study combines the behavioral tests, MRS, and fMRI.

      Weaknesses:

      Major:

      In Melnick (2013) IQ scores were measured by the full set of WAIS-III, including all subtests. However, this study only used visual spatial domain of gF. I wonder why only the visuo-spatial subtest was used not the full WAIS-III? I am wondering whether other subtests were conducted and, if so, please include the results as well to have comprehensive comparisons with Melnick (2013).

      We thank the reviewer for pointing this out. The decision was informed by Melnick’s findings which indicated high correlations between Surround suppression (SI) and the Verbal Comprehension, Perceptual Reasoning, Working Memory, and Processing Speed Indexes, with correlation coefficients of 0.69, 0.47, 0.49, and 0.50, respectively. It is well-established that the hMT+ region of the brain is a sensory cortex involved in visual perception processing (3D perception). Furthermore, motion surround suppression (SI), a specific function of hMT+, aligns closely with this region's activities. Given this context, the Perception Reasoning sub-ability was deemed to have the clearest mechanism for further exploration. Consequently, we selected the most representative subtest of Perception Reasoning—the Block Design Test—which primarily assesses 3D visual intelligence.” For further clarification, due to these reasons, we conducted only the visuo-spatial subtest.

      Minor:

      Comments:

      In the first revised version, we addressed the following recommendations in the 'Author response' file titled 'Recommendation for the authors.' It seems our response may not have reached you successfully. We would like to share and expand upon our response here:

      (1) Table 1 and Table supplementary 1-3 contain many correlation results. But what are the main points of these values? Which values do the authors want to highlight? Why are only p-values shown with significance symbols in Table supplementary 2??

      (1.1) What are the main points of these values?

      Thank reviewer for pointing this out. These correlations represent the relationship between behavior task (SI/BDT) and resting-state functional connectivity. It indicates that left hMT+ is involved in the efficient information integration network when it comes to BDT task. In addition, left hMT+’s surround suppression is involved in several hMT+ - frontal connectivity. Furthermore, the overlap regions between two task indicates the underlying mechanism.

      (1.2) Which values do the authors want to highlight?

      Table 1 and Table Supplementary 1-3 present the preliminary analysis results for Table 2 and Table Supplementary 4-6. So, we generally report all value. Conversely, in the Table 2 and Table Supplementary 4-6, we highlight the value which support our main conclusion.

      (1.3) Why are only p-values shown with significance symbols in Table Supplementary 2?

      Thank you for pointing this out, it is a mistake. We have revised it and delete the significance symbols.

      (2) Line 27, it is unclear to me what is "the canonical theory".

      We thank reviewer for pointing this out. We have revised “the canonical theory" to “the prevailing opinion” (line 27)

      (3) Throughout the paper, the authors use "MT+", I would suggest using "hMT+" to indicate the human MT complex, and to be consistent with the human fMRI literature.

      We thank reviewer for pointing this out. We have revised them.

      (4) At the beginning of the results section, I suggest including the total number of subjects. It is confusing what "31/36 in MT+, and 28/36 in V1" means.

      We thank reviewer for pointing this out. We have included the total number of subjects in the beginning of result section. (line 110, line 128)

      (5) Line 138, "This finding supports the hypothesis that motion perception is associated with neural activity in MT+ area". This sentence is strange because it is a well-established finding in numerous human fMRI papers. I think the authors should be more specific about what this finding implies.

      We thank reviewer for pointing this out. We have revised it to:” This finding is in line with prior results, which indicates that motion perception is associated with neural activity in hMT+ area, but not in EVC (primarily in V1)” (lines 156-158)

      (6) There are no unit labels for all x- and y-axies in Figure 1. I only see the unit for Conc is mmol per kg wet weight.

      We thank reviewer for pointing this out. Figure 1 is a schematic and workflow chart, so labels for x- and y-axes are not needed. I believe this confusion might pertain to Figure 3. In Figures 3a and 3b, the MRS spectrum does not have a standard y-axis unit as it varies based on the individual physical conditions of the scanner; it is widely accepted that no y-axis unit is used. While the x-axis unit is ppm, which indicate the chemical shift of different metabolites. In Figure 3c, the BDT represents IQ scores, which do not have a standard unit. Similarly, in Figures 3d and 3e, the Suppression Index does not have a standard unit.

      (7) Although the correlations are not significant in Figure Supplement 2&3, please also include the correlation line, 95% confidence interval, and report the r values and p values (i.e., similar format as in Figure 1C).

      We thank reviewer for pointing this out. We have revised them and include the correlation line, 95% confidence interval, r values and p values.

      (8) There is no need to separate different correlation figures into Figure Supplementary 1-4. They can be combined into the same figure.

      We thank reviewer for the suggestion. However, each correlation figure in the supplementary figures has its own specific topic and conclusion. Please notes that in the revised version, we have added a figure showing the EVC (primarily in V1) MRS scanning ROI as Supplementary Figure 1. Therefore, the figures the reviewer is concerned about are Supplementary Figure 2-5. The correlation figures in Supplementary Figure 2 indicate that GABA in EVC (primarily in V1) does not show any correlation with BDT and SI, illustrating that inhibition in EVC (primarily in V1) is unrelated to both 3D visuo-spatial intelligence and motion suppression processing. The correlations in Supplementary Figure 3 indicate that the excitation mechanism, represented by Glutamate concentration, does not contribute to 3D visuo-spatial intelligence in either hMT+ or EVC (primarily in V1). Supplementary Figure 4 validates our MRS measurements. Supplementary Figure 5 addresses potential concerns regarding the impact of outliers on correlation significance. Even after excluding two “outliers” from Figures 3d and 3e, the correlation results remain stable.

      (9) Line 213, as far as I know, the study (Melnick et al., 2013) is a psychophysical study and did not provide evidence that the spatial suppression effect is associated with MT+.

      We thank reviewer for pointing this out. It was a mistake to use this reference, and we have revised it accordingly. (line 242)

      (10) At the beginning of the results, I suggest providing more details about the motion discrimination tasks and the measurement of the BDT.

      We thank reviewer for pointing this out. We have included some brief description of task in the beginning of result section. (lines 116-120)

      (11) Please include the absolute duration thresholds of the small and large sizes of all subjects in Figure 1.

      We thank reviewer for the suggestion. We have included these results in Figure 3.

      (12) Figure 5 is too small. The items in plot a and b can be barely visible.

      We thank reviewer for pointing this out. We increase the size and resolution of the Figure.

      Reviewer #3 (Public Review):

      (1) Throughout the manuscript, hMT+ connectivity with the frontal cortex has been treated as an a priori hypothesis/space. However, there is no such motivation or background literature mentioned in the Introduction. Can the authors clarify the necessity of functional connectivity? In other words, can BOLD activity of hMT+ in the localizer task substitute for functional connectivity between hMT+ and the frontal cortex?

      (1.1) Throughout the manuscript, hMT+ connectivity with the frontal cortex has been treated as an a priori hypothesis/space. However, there is no such motivation or background literature mentioned in the Introduction. Can the authors clarify the necessity of functional connectivity?

      We thank reviewer for pointing this out. We offered additional motivation and background literature in the introduction: “Frontal cortex is usually recognized as the cognitive core region (Duncan et al., 2000; Gray et al., 2003). Strong connectivity between the cognitive regions suggests a mechanism for large-scale information exchange and integration in the brain (Barbey, 2018; Cole et al., 2012).  Therefore, the potential conjunctive coding may overlap with the inhibition and/or excitation mechanism of hMT+. Taken together, we hypothesized that 3D visuo-spatial intelligence (as measured by BDT) might be predicted by the inhibitory and/or excitation mechanisms in hMT+ and the integrative functions connecting hMT+ with frontal cortex (Figure 1a).” (lines 67-74). Additionally, we have included a whole-brain analysis for validation. Functional connectivity reveals the information exchange relationships across regions, enhancing our understanding of how hMT+ and the frontal cortex collaborate when solving visual-spatial intelligence tasks.

      (1.2) In other words, can BOLD activity of hMT+ in the localizer task substitute for functional connectivity between hMT+ and the frontal cortex?

      We thank the reviewer for this question. The localizer task was used solely for defining the hMT+ MRS scanning area. Functional connectivity was measured using resting-state fMRI. Research has shown that resting-state functional connectivity between the frontal cortex and other ROIs can further reveal the neural mechanisms underlying intelligence tasks (Song et al., 2008).

      (2) There is an obvious mismatch between the in-text description and the content of the figure:<br /> "In contrast, there was no correlation between BDT and GABA levels in V1 voxels (figure supplement 1a). Further, we show that SI significantly correlates with GABA levels in hMT+ voxels (r = 0.44, P = 0.01, n = 31, Figure 3d). In contrast, no significant correlation between SI and GABA concentrations in V1 voxels was observed (figure supplement 1b)."

      We thank reviewer for pointing this out. We have revised it. The revised version is :” In contrast, there was no correlation between BDT and GABA levels in V1 voxels (figure supplement 2a). Further, we show that SI significantly correlates with GABA levels in hMT+ voxels (r = 0.44, P = 0.01, n = 31, Figure 3d). In contrast, no significant correlation between SI and GABA concentrations in V1 voxels was observed (figure supplement 2b).” (lines 151-156)

      (3) The authors' response to my previous round of review indicated that the "V1 ROIs" covered a substantial amount of V3 (32%). Therefore, it would no longer be appropriate to call these "V1 ROIs". I'd suggest renaming them as "Early Visual Cortex (EVC) ROIs" to be more accurate. Can the authors justify why choosing the left hemisphere for visual intelligence task, which is typically believed to be right lateralized?

      (3.1) The authors' response to my previous round of review indicated that the "V1 ROIs" covered a substantial amount of V3 (32%). Therefore, it would no longer be appropriate to call these "V1 ROIs". I'd suggest renaming them as "Early Visual Cortex (EVC) ROIs" to be more accurate.

      We thank the reviewer for pointing this out. We have revised our description of the MRS scanning ROIs to Early Visual Cortex (EVC). Since the majority of our EVC ROIs are in V1 (around 70%) and almost no V2 was included, we decided to mark the EVC ROIs with the explanation "primarily in V1" for better clarification. This terminology has been widely used to better emphasize the V1-based experimental design.

      (3.2) Can the authors justify why choosing the left hemisphere for visual intelligence task, which is typically believed to be right lateralized?

      We thank the reviewer for pointing this out. The use of the left MT/V5 as a target was motivated by studies demonstrating that left MT+/V5 TMS is more effective at causing perceptual effects (Tadin et al., 2011). Therefore, we chose to use the left hMT+ as our MRS ROI and maintain consistency across different models' ROIs. Additionally, our results support the notion that the visual intelligence task is right lateralized in the frontal cortex. At the resting-fMRI level, we found that significant ROIs, where functional connectivity is highly correlated with BDT scores, are in the right frontal cortex (Figure 5a, b).

      (4) "Small threshold" and "large threshold" are neither standard descriptions, and it is unclear what "small threshold" refers to in the following figure caption. Additionally, the unit (ms) is confusing. Does it refer to timing?<br /> "(f) Peason's correlation showing significant negative correlations between BDT and small threshold."

      Thank you for pointing this out; we agree with your suggestion. We have revised the terms “small threshold” and “large threshold” to “duration threshold of small grating” and “duration threshold of large grating”, respectively. The unit (ms) refers to timing. The details are described in the methods section: “The duration was adaptively adjusted in each trial, and duration thresholds were estimated using a staircase procedure. Thresholds for large and small gratings were obtained from a 160-trial block that contained four interleaved 3-down/1-up staircases. For each participant, we computed the correct rate for different stimulus durations separately for each stimulus size. These values were then fitted to a cumulative Gaussian function, and the duration threshold corresponding to the 75% correct point on the psychometric function was estimated for each stimulus size”.

      (5) In the response letter, the authors mentioned incorporating the neural efficiency hypothesis in the Introduction, but the revised Introduction does not contain such information.

      We thank the reviewer for pointing this out. In our revised version, the second paragraph of the introduction addresses the neural efficiency hypothesis: “The “neuro-efficiency” hypothesis is one explanation for individual differences in gF (Haier et al., 1988). This hypothesis puts forward that the human brain’s ability to suppress irrelevant information leads to more efficient cognitive processing. Correspondingly, using a well-known visual motion paradigm (center-surround antagonism) (Liu et al., 2016; Tadin et al., 2003), Melnick et al found a strong link between suppression index (SI) of motion perception and the scores of the block design test (BDT, a subtest of the Wechsler Adult Intelligence Scale (WAIS), which measures the visuo-spatial component (3D domain) of gF (Melnick et al., 2013). Motion surround suppression (SI), a specific function of human extrastriate cortical region, middle temporal complex (hMT+), aligns closely with this region's activities (Gautama & Van Hulle, 2001). Furthermore, hMT+ is a sensory cortex involved in visual perception processing (3D domain) (Cumming & DeAngelis, 2001). These findings suggest that hMT+ potentially plays a significant role in 3D visuo-spatial intelligence by facilitating the efficient processing of 3D visual information and suppressing irrelevant information. However, more evidence is needed to uncover how the hMT+ functions as a core region for 3D visuo-spatial intelligence.” (lines 51-66)

      Recommendations for the authors:

      Reviewer #1 (Recommendations for The Authors):

      In the Code availability, it states that "this paper does not report original code". It seems weird because at least the code to reproduce the figures from the data should be provided.

      Thank you for pointing this out. Almost all figures were created using software such as DPABI, BrainNet, and GraphPad Prism 9.5, which are manually operated and do not require code adjustments. However, for the MRS fitting curve, we can provide our MATLAB code for redrawing the MRS fitting. The code has been uploaded to GitHub.

    1. Author response:

      The following is the authors’ response to the original reviews.

      Public Reviews:

      Reviewer #1 (Public Review):

      Summary:

      In this work, Qiu and colleagues examined the effects of preovulatory (i.e., proestrous or late follicular phase) levels of circulating estradiol on multiple calcium and potassium channel conductances in arcuate nucleus kisspeptin neurons. Although these cells are strongly linked to a role as the "GnRH pulse generator," the goal here was to examine the physiological properties of these cells in a hormonal milieu mimicking late proestrus, the time of the preovulatory GnRH-LH surge. Computational modeling is used to manipulate multiple conductances simultaneously and support a role for certain calcium channels in facilitating a switch in firing mode from tonic to bursting. CRISPR knockdown of the TRPC5 channel reduced overall excitability, but this was only examined in cells from ovariectomized mice without estradiol treatment. The patch clamp experiments are comprehensive and overall solid but a direct demonstration of the role of these conductances in being necessary for surge generation (or at least having a direct physiological consequence on surge properties) is lacking, substantially reducing the impact of the findings.

      Strengths:

      (1) Examination of multiple types of calcium and potassium currents, both through electrophysiology and molecular biology.

      (2) Focus on arcuate kisspeptin neurons during the surge is relatively conceptually novel as the anteroventral periventricular nucleus (AVPV) kisspeptin neurons have received much more attention as the "surge generator" population.

      (3) The modeling studies allow for direct examination of manipulation of single and multiple conductances, whereas the electrophysiology studies necessarily require examination of each current in isolation. The construction of an arcuate kisspeptin neuron model promises to be of value to the reproductive neuroendocrinology field.

      We thank the reviewer for recognizing our comprehensive examination of Kiss-ARH neurons through electrophysiological, molecular and computational modeling of their activity during the preovulatory surge, which as the reviewer pointed out is “conceptually novel.”  We  have bolstered our argument that Kiss1-ARH neurons transition from synchronized firing to burst firing with the E2-mediated regulation of channel expression with the addition of new experiments. We have addressed the recommendations as follows:

      Weaknesses:

      (1) The novelty of some of the experiments needs to be clarified. This reviewer's understanding is that prior experiments largely used a different OVX+E2 treatment paradigm mimicking periods of low estradiol levels, whereas the present work used a "high E2" treatment model. However, Figures 10C and D are repeated from a previous publication by the same group, according to the figure legend. Findings from "high" vs. "low" E2 treatment regimens should be labeled and clearly separated in the text. It would also help to have direct comparisons between results from low E2 and high E2 treatment conditions.

      We have revised Figures 10C and 10D to include new findings (only) on Tac2 and Vglut2 expression in OVX and E2-treated Kiss1ARH.  Most importantly, our E2 treatment regime is clearly stated in the Methods and is exactly the same that was used previously (Qiu, eLife 2016 and Qiu, eLife 2018) for the induction of the LH surge in OVX mice (Bosch, Molecular and Cellular Endocrinology 2013) .

      (2) In multiple places, links are made between the changes in conductances and the transition from peptidergic to glutamatergic neurotransmission. However, this relationship is never directly assessed. The data that come closest are the qPCR results showing reduced Tac2 and increased Vglut2 mRNA, but in the figure legend, it appears that these results are from a prior publication using a different E2 treatment regimen.

      In the revised Figure 1, we have now included a clear depiction of the transition from synchronized firing driven by NKB signaling in OVX females to burst firing driven by glutamate in E2-treated females. All of the qPCR results in the revised manuscript are new.  We have used the same E2 treatment paradigm as previously published (Qiu, eLife 2018).

      (3) Similarly, no recordings of arcuate-AVPV glutamatergic transmission are made so the statements that Kiss1ARH neurons facilitate the GnRH surge via this connection are still only conjecture and not supported by the present experiments.

      Using a horizontal hypothalamic slice preparation, we have shown that Kiss1-ARH neurons excite GnRH neurons via Kiss1ARH glutaminergic input to Kiss1AvPV/Pen neurons (summarized in Fig. 12, Qiu, eLife 2016). We did not think that it was necessary to repeat these experiments for the current manuscript.

      (4) Figure 1 is not described in the Results section and is only tenuously connected to the statement in the introduction in which it is cited. The relevance of panels C and D is not clear. In this regard, much is made of the burst firing pattern that arises after E2 treatment in the model, but this burst firing pattern is not demonstrated directly in the slice electrophysiology examples.

      We have extensively revised Figure 1 to include new whole-cell, current clamp recordings that document burst firing  in  E2-treated, OVX females, which is now cited in the Results.

      (5) In Figure 3, it would be preferable to see the raw values for R1 and R2 in each cell, to confirm that all cells were starting from a similar baseline. In addition, it is unclear why the data for TTA-P2 is not shown, or how many cells were recorded to provide this finding.

      Before initiating photo-stimulation for each Kiss1-ARH neuron, we adjust the resting membrane potential to -70 mV, as noted  in each panel in Figure 3, through current injections. We have now included new findings on the effects of the T-channel blocker TTA-P2 on slow EPSP in the revised Figure 3. The number of cells tested with each calcium channel blocker is depicted in each of the bar graphs summarizing the effects of the blockers (Figure 3E).

      (6) In Figure 5, panel C lists 11 cells in the E2 condition but panel E lists data from 37 cells. The reason for this discrepancy is not clear.

      In Figure 5D, we measured the L-, N-, P/Q and R channel currents after pretreatment with TTA-P2 to block the T-type current, whereas in Figure 5C, we measured the total current without TTA-P2.

      (7) In all histogram figures, it would be preferable to have the data for individual cells superimposed on the mean and SEM.

      In the revised Figures we have included the individual data points for the individual neurons and animals (qPCR). 

      (8) The CRISPR experiments were only performed in OVX mice, substantially limiting interpretation with respect to potential roles for TRPC5 in shaping arcuate kisspeptin neuron function during the preovulatory surge.

      The TRPC5 channels are most  important for generating slow EPSPs when expression of NKB is high in the OVX state. Conversely, the glutamatergic response becomes more significant when the expression of NKB and TRPC5 channel are muted in the E2-treated state. Therefore, the CRISPR experiments were specifically conducted in OVX mice to maximize the effects.

      (9) Furthermore, there are no demonstrations that the CRISPR manipulations impair or alter the LH surge.

      In this manuscript, our focus is on the cellular electrophysiological activity of the Kiss1ARH neurons in OVX and E2-treated OVX females. Exploration of CRISPR manipulations related to the LH surge is certainly slated for future  experiments, but these in vivo experiments are  beyond the scope of these comprehensive cellular electrophysiological and molecular studies.

      (10) The time of day of slice preparation and recording needs to be specified in the Methods.

      We have provided the times of slice preparation and recordings in the revised Methods and Materials.

      Reviewer #2 (Public Review):

      Summary:

      Kisspeptin neurons of the arcuate nucleus (ARC) are thought to be responsible for the pulsatile GnRH secretory pattern and to mediate feedback regulation of GnRH secretion by estradiol (E2). Evidence in the literature, including the work of the authors, indicates that ARC kisspeptin coordinate their activity through reciprocal synaptic interactions and the release of glutamate and of neuropeptide neurokinin B (NKB), which they co-express. The authors show here that E2 regulates the expression of genes encoding different voltage-dependent calcium channels, calcium-dependent potassium channels, and canonical transient receptor potential (TRPC5) channels and of the corresponding ionic currents in ARC kisspeptin neurons. Using computer simulations of the electrical activity of ARC kisspeptin neurons, the authors also provide evidence of what these changes translate into in terms of these cells' firing patterns. The experiments reveal that E2 upregulates various voltage-gated calcium currents as well as 2 subtypes of calcium-dependent potassium currents while decreasing TRPC5 expression (an ion channel downstream of NKB receptor activation), the slow excitatory synaptic potentials (slow EPSP) elicited in ARC kisspeptin neurons by NKB release and expression of the G protein-associated inward-rectifying potassium channel (GIRK). Based on these results, and on those of computer simulations, the authors propose that E2 promotes a functional transition of ARC kisspeptin neurons from neuropeptide-mediated sustained firing that supports coordinated activity for pulsatile GnRH secretion to a less intense firing in glutamatergic burst-like firing pattern that could favor glutamate release from ARC kisspeptin. The authors suggest that the latter might be important for the generation of the preovulatory surge in females.

      Strengths:

      The authors combined multiple approaches in vitro and in silico to gain insights into the impact of E2 on the electrical activity of ARC kisspeptin neurons. These include patch-clamp electrophysiology combined with selective optogenetic stimulation of ARC kisspeptin neurons, reverse transcriptase quantitative PCR, pharmacology, and CRIPR-Cas9-mediated knockdown of the Trpc5 gene. The addition of computer simulations for understanding the impact of E2 on the electrical activity of ARC kisspeptin cells is also a strength.

      The authors add interesting information on the complement of ionic currents in ARC kisspeptin neurons and on their regulation by E2 to what was already known in the literature. Pharmacological and electrophysiological experiments appear of the highest standards. Robust statistical analyses are provided throughout, although some experiments (illustrated in Figures 7 and 8) do have rather low sample numbers.

      The impact of E2 on calcium and potassium currents is compelling. Likewise, the results of Trpc5 gene knockdown do provide good evidence that the TRPC5 channel plays a key role in mediating the NKB-mediated slow EPSP. Surprisingly, this also revealed an unsuspected role for this channel in regulating the membrane potential and excitability of ARC kisspeptin neurons.

      We thank the reviewer for recognizing that the “pharmacological and electrophysiological experiments appear of the highest standards” and “the addition of the computer modeling for understanding the impact of E2 on the electrical activity of ARC kisspeptin cells is also a strength.  However, we agree with the reviewer that we needed to provide a direct demonstration of “burst-like” firing of Kiss1-ARH neurons, which we have provided in Figure 1. We have addressed the other recommendations as follows:

      Weaknesses:

      The manuscript also has weaknesses that obscure some of the conclusions drawn by the authors.

      One has to do with the fact that "burst-like" firing that the authors postulate ARC kisspeptin neurons transition to after E2 replacement is only seen in computer simulations, and not in slice patch-clamp recordings. A more direct demonstration of the existence of this firing pattern, and of its prominence over neuropeptide-dependent sustained firing under conditions of high E2 would make a more convincing case for the authors' hypothesis.

      We have provided  a more direct demonstration of the existence of this firing pattern in the whole-cell current clamp experiments in the revised Figure 1.

      In addition, and quite importantly, the authors compare here two conditions, OVX versus OVX replaced with high E2, that may not reflect the physiological conditions (the diestrous [low E2] and proestrous [high E2] stages of the estrous cycle) under which the proposed transition between neuropeptide-dependent sustained firing and less intense burst firing might take place. This is an important caveat to keep in mind when interpreting the authors' findings. Indeed, that E2 alters certain ionic currents when added back to OVX females, does not mean that the magnitude of these ionic currents will vary during the estrous cycle.

      We have published that the magnitude of the slow EPSP, which is TRPC5 channel mediated, varies throughout the estrous cycle with the slow EPSP reaching a maximal amplitude during diestrus, which was significantly reduced during proestrus,  similar to that found in OVX compared to E2-treated, OVX females (Figure 2, Qiu, eLife 2016).  Moreover, TRPC5 channel mRNA expression,  similar to the peptides, is downregulated by an E2 treatment (Figure 10 this manuscript) that mimics proestrus levels of the steroid (Bosch et al., Mol Cell Endocrinology 2013). Furthermore, the magnitude of ionic currents is directly proportional to the number of ion channels expressed in the plasma membrane, which we have found correlates with mRNA expression. Therefore, it is likely that the magnitude of these ionic currents will vary during the estrous cycle.

      Lastly, the results of some of the pharmacological and genetic experiments may be difficult to interpret as presented. For example, in Figure 3, although it is possible that blockade of individual calcium channel subtypes suppresses the slow EPSP through decreased calcium entry at the somato-dendritic compartment to sustain TRPC5 activation and the slow depolarization (as the authors imply), a reasonable alternative interpretation would be that at least some of the effects on the amplitude of the slow EPSP result from suppression of presynaptic calcium influx and, thus, decreased neurotransmitter and neuropeptide secretion. Along the same lines, in Figure 12, one possible interpretation of the observed smaller slow EPSPs seen in mice with mutant TRPC5 could be that at least some of the effect is due to decreased neurotransmitter and neuropeptide release due to the decreased excitability associated with TRPC5 knockdown.

      The reviewer raises a good point, but our previous findings clearly demonstrated that chelating intracellular calcium with BAPTA in whole-cell current clamp recordings abolishes the slow EPSP and persistent firing (Qiu et al., J. Neurosci 2021), which we have noted is the  rationale for dissecting out the contribution of T, R, N, L and P/Q calcium channels to the slow EPSP in our current studies.  The revised Figure 3 also includes the effects of T-channel blocker.

      However, to further bolster the argument for the post-synaptic contribution of the calcium channels to the slow EPSP  and eliminate the potential presynaptic effects of the calcium channel blockers on the postsynaptic slow EPSP amplitude, which may result from reduced presynaptic calcium influx and subsequently decreased neurotransmitter release, we have utilized an additional strategy. Specifically, we have measured the response to the externally administered TACR3 agonist senktide under conditions in which the extracellular calcium influx, as well as neurotransmitter and neuropeptide release, are blocked (revised Figure 3).

      Recommendations for the authors:

      Reviewer #1 (Recommendations For The Authors):

      (1) The use of optogenetics in Figure 3 to trigger the slow EPSP could be better clarified in the text.

      We have clarified in the Methods the optogenetic protocol for generating the slow EPSP, which we have published previously (Qiu et al., eLife 2016; eLife 2018, J. Neurosci 2021).

      (2) The citation for Figure 4C in the text does not match what is shown in the figure.

      Figure 4C has been removed in the revised manuscript.

      (3) Figure 5 - it would be clearer to have panel D labeled as "model results" or similar to distinguish it from the slice recording data.

      Panel D has been labeled as "Model results”.

      (4) The text in lines 191-197 in the Results may be better suited to the Discussion.

      We have modified the text in order to present the new findings without the discussion points.

      (5) It is somewhat confusing to have figure panels cited out of order in the main text (e.g., 7H before 7G and 8H before 8G).

      We have edited the text to report the findings in the proper order of the panels in Figures 7 and 8.

      Reviewer #2 (Recommendations For The Authors):

      - The observations that E2 treatment of OVX mice has an effect on the magnitude of a number of ionic currents does not necessarily mean that these changes will be seen during the estrous cycle, in response to fluctuations in circulating E2 concentrations. Experiments comparing either different estrous cycle stages or OVX mice treated with low or high E2 would be required to gain insight into this question. As such, the relevance of the authors' findings (however interesting these are as they stand) to any potential physiological endocrine/reproductive state transition is questionable, in the reviewer's opinion. The authors should acknowledge this important caveat and moderate the interpretations of their findings and the conclusions of their manuscript accordingly.

      We have published that the magnitude of the slow EPSP, which is TRPC5 channel mediated, varies throughout the estrous cycle with the slow EPSP being large during diestrus and significantly reduced during proestrus,  similar to that found in OVX compared to E2-treated, OVX females (Figure 2, Qiu, eLife 2016).  Moreover, TRPC5 channel mRNA expression,  similar to the peptides, is downregulated by an E2 treatment (Figure 10 this manuscript) that mimics proestrus levels of the steroid (Bosch et al., Mol Cell Endocrinology 2013). Furthermore, the magnitude of ionic currents is directly proportional to the number of ion channels expressed in the plasma membrane, which we have found correlates with mRNA expression. Therefore, it is likely that the magnitude of these ionic currents will vary during the estrous cycle.

      - The bursting firing pattern that the authors refer to and postulate will favor glutamate release under high E2 conditions is only seen in the computer simulations, not in patch-clamp recordings in brain slices (see also comment below). This substantially weakens some of the conclusions of the manuscript. Unless the authors can convincingly demonstrate a change in ARC kisspeptin firing pattern in response to increasing E2 using electrophysiology, these conclusions should be moderated.

      We now include examples of burst firing activity under E2-treatment conditions in Figure 1 and have included summary figure (pie chart) documenting that a significant percentage of cells exhibit this activity with E2 treatment.  

      Other comments:

      - Title: "E2 elicits distinct firing patterns" is not shown in this work. As such, the title needs to be revised.

      We now show these distinct firing patterns in Figure 1, so we think the wording in the title is an accurate reflection of our findings. 

      - Abstract: some of the interpretations are overstated, in the reviewer's opinion.

      Line 23, "... elevating the whole-cell calcium current and contributing to high-frequency firing" should be moderated, as what is shown by the authors is that blockade of calcium channel subtypes suppresses the slow EPSP and associated firing, the frequency of which is not reported (see also a later comment).

      We now include examples of burst firing activity under E2-treatment conditions in Figure 1 and have modified the abstract to state “high frequency burst firing.”

      Lines 26-28, that "mathematical modeling confirmed the importance of TRPC5 channels for initiating and sustaining synchronous firing, while GIRK channels, activated by Dyn binding to kappa opioid receptors, were responsible for repolarization" is simply not what the simulations show, in the reviewer's opinion. Indeed, there is no consideration of synchronous activity in the model, which simulates the firing of a single ARC kisspeptin neuron. Further, the model shows that TRPC5 can contribute to overall excitability (firing in response to current injection, Figure 12G) and that increasing TRPC5 conductance increases firing in response to NKB while this is decreased by adding GIRK conductance to the model (Figure 13A). Therefore, considerations of the importance of TRPC5 channels in initiating synchronous firing and the role of Dyn A-induced GIRK activity should not be included in the interpretations of the mathematical simulations.

      The significance of synchronization lies in the fact that when neuronal networks synchronize, the behavior of each neuron within the network becomes identical. In such scenarios, the firing of a single neuron mirrors the activity of the entire neuronal network. Consequently, our model simulations, based on a single-cell neuronal model, can be utilized to make reliable inferences about synchronized neuronal activity.

      Lines 31-33 (also lines 92-95), that "the transition to burst firing with high, preovulatory levels of E2 facilitates the GnRH surge through its glutamatergic synaptic connection to preoptic Kiss1 neurons" is not supported by the experiments (physiologic or computational) described in the manuscript, and is, therefore, only speculative. These statements should be removed throughout the manuscript.

      Previously, we (Qiu et al., (eLife 2016) documented a direct glutamatergic projection from Kiss1-ARH neurons to Kiss1-AVPV/PeN neurons.  Moreover, Lin et al. (Frontiers Endocrinology 2021) demonstrated that low frequency stimulation of Kiss1-ARH:ChR2 neurons, that is known to only release glutamate, boosts the LH surge, and in a follow-up paper the O’Byrne lab blocked this stimulation with ionotropic glutamate antagonists (Shen et al., Frontiers in Endocrinology 2022).  We have included these references in the Introduction and Discussion, but we did not think that it was necessary to cite these papers in the Abstract.  However, we have re-worded this final statement in the Abstract to: “the transition to burst firing with high, preovulatory levels of E2 would facilitate the GnRH surge….” 

      - Introduction: the usefulness of Figure 1 is questionable. From reading the figure legend, it is the reviewer's understanding that panels A and B are published elsewhere (there is no description of methods or results in the manuscript). Further, panels C and D are meant to illustrate that ARC kisspeptin neurons display different types of firing in OVX vs E2-treated OVX mice. The legend to C indicates that the trace illustrates "synchronous firing" but shows one cell (how can this be claimed as synchronous?) - the legend to D indicates that the trace "demonstrates" burst firing in ARC kisspeptin neurons. This part of the figure is, in the reviewer's opinion, misleading because these are only two examples (no quantifications or replicates are provided) obtained by stimulating firing in two different endocrine conditions by two different agonists. The "demonstration" of differential firing patterns would require a thorough examination of firing patterns in response to current injections (as in Figure 12 E-F) or in response to the two agonists, under the different hormonal conditions.

      Figure 1 has now been completely revised to include new data documenting the different firing patterns.  The methods detailing these experiments can be found in the Material and Methods section.

      The introduction presents a rather incomplete picture of what is known regarding how ARC kisspeptin neurons might coordinate their activity to drive episodic GnRH secretion, and it omits published work showing that blockade of glutamate receptors (in particular AMPA receptors) decreases ARC kisspeptin neuron coordinated activity in the brain slices and in vivo and suppresses pulsatile GnRH/LH secretion in mice.

      If we are not mistaken, the reviewer is referring to fiber photometry recordings of GCaMP activity, which we cite in the Discussion.  However, for the Introduction we tried to “set the stage” for our studies on measuring the individual channels underlying the different firing patterns and how they are regulated by E2.

      The introduction is also quite long with extensive descriptions of previous work by the authors and in other brain areas that would be better suited for the discussion.

      Again, we are trying to rationalize why we focused on particular ion channels based on the literature.

      - Results: lines 129-132 should be moderated, as whether calcium channels increase excitability or facilitate TRPC5 channel opening has not been directly assessed here.

      High frequency optogenetic stimulation of Kiss1-ARH neurons and NKB through its cognate receptor (TACR3) activates TRPC 5 channels (Qiu et al., eLife 2016; J. Neurosci 2021). BAPTA prevents the opening of TRPC5 channels and abrogates the slow EPSP following high frequency stimulation.  Figure 3 documents that inhibition of voltage-activated calcium channels attenuates the slow EPSP, which results in a decrease in excitability.

      Lines 145-146, one limitation of this experiment is that blockade of calcium channel subtypes will not only affect calcium entry and subsequent actions of calcium on TRPC5 channels but also impair the release of neurotransmitters and neuropeptides from kisspeptin neurons. The interpretation that "calcium channels contribute to maintaining the sustained depolarization underlying the slow EPSP" needs, therefore, to be moderated as it is not possible to extract the direct contribution of calcium channels to the activation of TRPC5 channels from these experiments.

      We cited our previous findings documenting that chelating intracellular calcium with BAPTA abolishes the slow EPSP and persistent firing (Qiu et al., J Neurosci 2021).  However, to eliminate the potential effects of calcium channel blockers on the slow EPSP amplitude, which may result from reduced presynaptic calcium influx and subsequently decreased neurotransmitter and neuropeptide secretion, we adopted a different strategy by comparing responses between Senktide and Cd2+ plus Senktide. Our findings revealed that the non-selective Ca2+ channel blocker Cd2+ significantly inhibited Senk-induced inward current (Figures 3F-H).

      Panel C should be removed from Figure 4, as it is published elsewhere.

      Figure 4C has been removed.

      Lines 168-169, "...E2 treatment led to a significant increase in the peak calcium current density in Kiss1ARH neurons, which was recapitulated as predicted by our computational modeling..." How did the model "predict" this increase in calcium current density? As no information is provided in the methods or supplementary information as to how the effect of E2 was integrated into the model, the authors will need to provide additional narration in the text to explain this statement. The "T-channel inflection" referred to in the figure legend will also need to be explained. Lastly, in Figure 5C, the current density unit should be pA/pF. 

      We have added text in the supplementary information to explain how we used the qPCR and electrophysiological data to inform the model regarding the effect that E2 has on the various ionic currents and noted in the Figure 13 legend that the increase/decrease in the conductances is physiologically mediated by E2. We have eliminated the T-channel inflection point (Figure 5D) and corrected the current density label (Figure 5C).

      Lines 198-199, please clarify "E2 does not modulate calcium channel kinetics directly but rather alters the mRNA expression to increase the conductance".

      We have clarified that “that long-term E2 treatment does not modulate calcium channel kinetics but rather alters the mRNA expression to increase the calcium channel conductance” by referring to the specific figures (i.e., Figures 4, 6) in a previous sentence.

      Figures 7 and 8 titles do not accurately reflect the contents: there is nothing about repolarization in the experiments illustrated in Figure 7 or Figure 8. The sample sizes (3 to 4 cells) are also quite small for these experiments.

      We have modified the Figure titles per the reviewer’s comments and increased the cell numbers.

      The title of Figure 9 also does not fully reflect the figure's contents. Although panel G does suggest that the M current contributes to regulating the membrane potential, the reviewer's reading of this figure panel is that the fractional contribution of the M current does not vary during a short burst of action potentials. The suggestion that "KCNQ channels play a key role in repolarizing Kiss1ARH neurons following burst firing" (line 272) and the statement that "our modeling predicted that M-current contributed to the repolarization following burst firing" (line 273) should be revised accordingly.

      The point is that the M-current contributes, albeit a small fraction, to the repolarization during burst firing.

      Line 288, please indicate what figure informs this statement.

      We have revised the statement since the modeling (Figure 13) comes later in the Results.

      Line 311-313, this sentence only superficially describes the simulation, in the reviewer's opinion. Does the model inform on how TRPC5 channels/currents do that? The supplementary information indicates that there is a tone of extracellular neurokinin B embedded in the model. This is important information that should be clearly stated in the manuscript. The authors should also consider discussing the influence of this neurokinin B tone on the contribution of TRPC5 to cell excitability. As a neurokinin B tone in the extracellular space will likely alter the firing of kisspeptin neurons in the model, readers will likely need more information about all this.

      In our current ramp simulations of the model (Fig 12 G&H) there is no involvement of neurokinin B (i.e., the NKB parameter  is set to zero), and the effect on the rheobase is solely due to the decrease of the TRPC5 conductance.  In the model, TRPC5 channels are activated by intracellular calcium levels and are therefore contributing to cell excitability even in the absence of extracellular NKB. The NKB tone is used for the simulations presented in Figure 13 where we vary the TRPC5 conductance under saturating levels of extracellular NKB.

      Lines 316-318 also read as quite superficial. More explanations of what is illustrated in Figure 13 are needed. In particular, it is unclear from the methods and supplementary information what the different ratios of conductances in OVX+E2 vs in OVX are and how they were varied in the model. Furthermore, it is unclear to the reviewer how the outcome of these simulations matches the authors' postulate that E2 enables a transition to a burst firing pattern that favors glutamate release. Looking at simulated firing in Figure 13B, E2 (by increasing calcium conductances) would tend to enable high-frequency firing within bursts (nearing 50 Hz by eye) and high burst rates (approximately 4 bursts per second), which the reviewer would argue might be expected to cause significant neuropeptide release in addition to that of glutamate.

      We have added to the text: “Furthermore, the burst firing of the OVX+E2 parameterized model was supported by elevated h- and Ca 2+-currents (Figure 13B) as well as by the high conductance of Ca2+ channels relative to the conductance of TRPC5 channels (Figure 13C).” We have also provided in the Supplemental Information (Table of Model Parameters) the specific conductances in the OVX and OVX+E2 state and how they are varied to produce the model simulations.

      Granted the high frequency firing during a burst could release peptide, but in the E2-treated, OVX females the expression of the peptides are at “rock bottom.”  Therefore, the sustained high frequency firing during the slow EPSP in the OVX state would generate maximum peptide release.

      In Figure 13C, the reviewer is unclear on the ranges of TRPC5 conductances shown. The in vitro experiments suggest that E2 suppresses Trpc5 gene expression and might suppress TRPC5 currents. The ratio of gTRPC5(OVX+E2)/gTRPC5(OVX) should, thus, be <1.0. This is not represented in the parameter space provided, making the interpretation of this simulation difficult. Please clarify what the effect of decreasing gTRPC5 will be on firing patterns in the model.

      Thank you for pointing this typographical error.  The ratio should be gTRPC5 (OVX)/TRPC5(OVX + E2) for the X-axis.

      - Discussion: many statements and conclusions are overreaching and need to be revised; for example lines 320-322, 329-330, 335-338, 369, 371-373, 391-394, 463-464, and 489-494;

      We have tempered these statements, so they are not “overreaching.”

      Lines 489-494: the authors should integrate published observations that i) ablation of ARC kisspeptin neurons results in increased LH surges in mice and rats and that ii) optogenetic stimulation of ARC kisspeptin fibers in the POA is only effective at increasing LH secretion in a surge-like manner when done at high frequencies (20 Hz), in their discussion of the role of ARC kisspeptin neurons and their firing patterns in the preovulatory surge.

      We have included the paper from the O’Byrne lab (Shen et al. Frontiers in Endocrinology 2022) in the Discussion. However, the Mittleman-Smith paper (Endocrinology, 2016) ablating KNDy neurons using NK3-saporin not only targeted KNDy neurons but other arcuate neurons that express NK3 receptors.  Therefore, we have not cited it in the Discussion.

    1. Author response:

      The following is the authors’ response to the original reviews.

      Public Reviews:

      Reviewer #1 (Public Review):

      Summary:

      An online database called MRAD has been developed to identify the risk or protective factors for AD.

      Strengths:

      This study is a very intriguing study of great clinical and scientific significance that provided a thorough and comprehensive evaluation with regard to risk or protective factors for AD. It also provided physicians and scientists with a very convenient, free as well as user-friendly tool for further scientific investigation.

      We thank the reviewer for the conclusion and positive comments.

      Weaknesses:

      (1) Comment: The paper mentions that the MRAD database currently contains data only from European populations, with no mention of data from other populations or ethnicities. Given potential differences in Alzheimer's Disease (AD) across different populations, the limitations of the data should be emphasized in the discussion, along with plans to expand the database to include data from more racial and geographic regions.

      Thank you for your valuable comment. Further information regarding the limitations of populations is provided in the Conclusions section (page 19).

      The newly added text describing the limitations of populations is as follows:

      “However, in this study, since the GWAS datasets for both the exposure and the outcome traits (AD) selected were obtained from the public database (MRC IEU OpenGWAS), where the GWAS datasets for AD are only of European population, and since we use the TwoSampleMR, which requires that the populations for the exposure trait and the outcome trait be the same to satisfy the requirement for a control variable, this study currently has certain limitations in terms of population. We initiated a Mendelian randomization study on AD at clinical hospitals in China and are currently in the sample collection stage to address the limitations. In the future, we will integrate data from more populations and keep updating new progresses in AD research to explore its potential differences in different populations.”

      (2) Comment: Sufficient information should be provided to clarify the data sources, sample selection, and quality control methods used in the MRAD database. Readers may expect more detailed information about the data to ensure data reliability, representativeness, and research applicability.

      Thank you for your helpful suggestion. We appreciate you taking time and making effort in reviewing our manuscript and thank you for your insightful comments. We agree that adding more details is essential to make the manuscript more reliability, representativeness, and research applicability.

      The newly added text describing more detailed information about the data is as follows:

      (1) Sufficient information about data sources and sample selection (in the Data sources section of Methods section, page 8):

      “Exposure traits

      Inclusion criteria: datasets of the European population.

      Exclusion criteria: (i) eQTL-related datasets; (ii) AD-related datasets.

      “In this study, the GWAS datasets selected were derived from 42,335 GWAS datasets in the public database (MRC IEU OpenGWAS, https://gwas.mrcieu.ac.uk/). Based on the above inclusion and exclusion criteria, 19,942 eQTL-related datasets were excluded first, leaving 22,393 GWAS datasets. Next, the datasets with the European population were selected, and 18,117 GWAS datasets were obtained. Finally, 20 AD-related datasets were excluded; 18,097 GWAS datasets were obtained at the end as the exposure traits of this study (See Table S1 for basic information).

      Outcome traits

      Inclusion criteria: (i) datasets of patients with AD with complete information and clear data sources; (ii) datasets of the European population.

      Exclusion criteria: (i) Number of SNPs <1 million; (ii) datasets with unspecified sex; (iii) datasets with a family history of AD; (iv) datasets with dementia.

      Based on the above criteria, 16 GWAS datasets of outcome traits were selected from the MRC IEU OpenGWAS database, comprising datasets of AD from Alzheimer Disease Genetics Consortium (ADGC), Cohorts for Heart and Aging Research in Genomic Epidemiology Consortium (CHARGE), The European Alzheimer’s Disease Initiative (EADI), and Genetic and Environmental Risk in AD/Defining Genetic, Polygenic and Environmental Risk for Alzheimer’s Disease Consortium (GERAD/PERADES) 2019 (ieu-b-2); AD from Benjamin Woolf 2022 (ieu-b-5067); AD from International Genomics of Alzheimer's Project (IGAP) 2013 (ieu-a-297) as the datasets of main outcome traits for AD, as well as 13 datasets from FinnGen biobank 2021 corresponding to various AD subtypes, referred to as AD-finn subtypes. (as shown in Figure 2).”

      (2) Sufficient information about quality control methods (in the Statistical models for causal effect inference section of Methods section, page 9-10:

      “A random-effects IVW model was used in this study as the major analysis method to uncover potential risk or protective factors for AD. The random-effects IVW model as the gold standard for MR studies, its principle is to calculate the inverse of the variance of each IV as its weight, assuming all IVs are valid. The regression does not include an intercept term, and the final result is the weighted average of the effect estimates from all IVs [34]. This model indicates that the true effect values may vary across different studies due to both sampling error and the heterogeneity of the true effect. The weight of each study is jointly determined by its inverse variance and the estimated heterogeneity variance. Thus, as long as there is no pleiotropy, even when there is significant heterogeneity (p < 0.05), this method remains the best MR model.

      To assess the robustness of the IVW results, sensitivity analysis was performed using six additional models: (i) MR-Egger: MR-Egger’s biggest difference from IVW is that it considers the intercept term during regression to evaluate bias caused by horizontal pleiotropy. The intercept represents the magnitude of horizontal pleiotropy, with a value close to 0 indicating minimal pleiotropy. The primary purpose is to detect and correct for horizontal pleiotropy. Thus, when significant horizontal pleiotropy is observed (p < 0.05), this method is preferred [35,36]. (ii) Weighted median: The weighted median method is a technique for evaluating causal relationships using a majority of genetic variants (SNPs). If at least 50% of the SNPs are valid IVs, the median of the causal estimates will tend toward the true causal effect. This method provides an unbiased estimate (i.e., the “majority validity” assumption) [37]. (iii) Simple mode: Involves comparing the frequencies or proportions of genotypes or phenotypes between control and experimental groups. Moreover, it can illustrate whether the observed differences in genotypes or phenotypes between the two groups are statistically significant. (iv) Weighted mode: The weighted mode method is a technique for combining multiple Mendelian randomization estimates. This method assigns weights to the causal effect estimates of different genetic variants on the trait and then takes the weighted mode as the final estimate of the causal effect. In genetic variant estimates, the method can decrease bias caused by outliers. (v) Maximum likelihood: This method is used when it is known that a random sample follows a particular probability distribution; however, the specific parameters of that distribution remain unknown, and it involves conducting multiple experiments, observing the results, and using those results to infer the approximate values of the parameters [38]. (vi) Penalized weighted median: An enhanced version of the weighted median estimate that provides a consistent estimate of the causal effect. (vii) Heterogeneity and horizontal pleiotropy assessment use the heterogeneity tests [39] and Egger intercept tests [40], respectively.”

      (3) Comment: While the authors mention that the MRAD database offers interactive visualization interfaces, the paper lacks detailed information on how to interpret and understand these visual results. Guidelines on effectively using these visualization tools to help researchers better comprehend the data are essential.

      Thank you very much for your feedback, as we believe that our manuscript has been improved substantially as a result of your input.  Owing to space constraints, the MRAD database user guide is included in the Supplementary Material. Meanwhile, for better understanding, the subheading of the relevant content in the Supplementary Material has been revised to “MRAD User Guide” (see Supplementary Material for details, page 11). Furthermore, considering user-friendliness, the user guide has been integrated into the database and can be accessed directly from the homepage by clicking on the “User Guide” module.

      (4) Comment: In the conclusion section of the paper, it is advisable to explicitly emphasize the practical applications and potential clinical significance of the MRAD database. The paper should articulate how MRAD can contribute to the early identification, diagnosis, prevention, and treatment of AD and its potential societal and clinical value more clearly.

      Thank you for pointing this out. In the Discussion section of the revised manuscript, we have now added how MRAD can contribute to the early identification, diagnosis, prevention, and treatment of AD and its potential societal as well as clinical value. And we reorganized the structure of Discussion section to make the text easier to understand, which could be helpful to further clarify the significance of MRAD. (page 15)

      The newly added text describing the practical applications and potential clinical significance of the MRAD database is as follows:

      “(i) The current methods for identifying AD mainly rely on assessment scales, cerebrospinal fluid (CSF) examinations, and brain PET/MRI. However, assessment scales can be biased by factors such as the anxiety and nervousness of the subjects. CSF examinations require an invasive lumbar puncture, leading to low patient acceptance. PET/MRI scans are expensive and have limited equipment accessibility. These limitations restrict early AD identification. Thus, there is a pressing clinical need for readily available, time- and cost-effective, and accurate detection methods. In this study, the Medical laboratory science and Molecular trait used could be less expensive, faster to detect, easier to operate, and more accessible for widespread adoption. They hold great value for early AD identification and have the potential to become crucial tools for identifying AD in the future. (ii) Imaging acts as a powerful assistive tool for diagnosing Alzheimer’s disease. Traditional imaging examinations mainly depict changes in the brain’s macroscopic structure, while research on microstructural changes in disease-related areas is relatively limited. Studies have demonstrated that microstructural neurodegenerative processes are extensive and pronounced during AD progression. Our study results cover traditional macroscopic neuroimaging results and reveal numerous potential causal relationships between brain microstructure and AD. The combination of macroscopic and microstructural insights will provide more valuable information for clinical diagnosis. (iii) Clarifying patient’s disease, past history, and family history can aid in preventing AD at an early stage, and prevention of AD could be attained through monitoring anthropometric indicators, improving gut microbiota, and adjusting lifestyle traits. (iv) Currently, the development of new drugs for AD is mainly underscored by Aβ, Tau, and other inhibitors. Since 2000, global pharmaceutical companies have invested hundreds of billions of dollars in the development of new drugs for AD, and these drugs have not yielded successful results. AD drug development has thus been perceived as having the highest failure rate of all drug research, reaching 99.6%. Hence, further research on molecular traits to find new targets and develop new drugs for these targets will provide new pathways for AD treatment.”

      (5) Comment: Grammar and Spelling Errors: There are several spelling and grammar errors in the paper. Referring to a scientific editing service is recommended.

      We appreciate your comments and suggestions for improving our manuscript. We have now used a professional editing service offered by Taylor and Francis to revise the grammar and language, and we have obtained a certificate of proof, which is attached. Thank you for recognizing our research, we have tried our best to improve the quality of this paper to ensure that it meets the high standards required for publication in of journal elife.

      Reviewer #2 (Public Review):

      Summary:

      This MR study by Zhao et al. provides a comprehensive hypothesis-free approach to identifying risk and protective factors causal to Alzheimer's Disease (AD).

      Strengths:

      The study employs a comprehensive, hypothesis-free approach, which is novel over traditional hypothesis-driven studies. Also, causal associations between risk/protective factors and AD were addressed using genetic instruments and analysis.

      We greatly appreciate the positive feedback regarding the overall quality of our work.

      Major comments:

      (1) Comment: The authors used the inverse-variance weighted (IVW) model as the primary method and other MR methods (MR-Egger, weighted mean, etc.) for sensitivity analysis. However, each method has its own assumption, and IVW is only robust when pleiotropy and heterogeneity are not severe. Rather than using IVW imprudently across all associations, it would be more appropriate to choose the best MR method for each association based on heterogeneity/Egger intercept tests. This customized approach, based on tests of MR assumption violations, yields more stable and reliable results. For reference, please follow up on work by Milad et al. (EHJ - "Plasma lipids and risk of aortic valve stenosis: a Mendelian randomization study"). This study selected the best MR model for each association based on pleiotropy and heterogeneity tests. Given the large number of tests in this work, I suggest initially screening significant signals using IVW, as done, and then validating the results using multiple MR methods for those signals. It is common for MR estimates from different methods to vary significantly (with some being statistically significant and others not), and in such cases, the MR estimates from the best-fitted model should be trusted and highlighted.

      Thank you for your professional comments. We agree that our description of the Statistical models for causal effect inference was not specific enough. Therefore, we have included a new text describing more details about each method’s assumption and supplied a predefined approach to select the best statistical estimation from these methods in the Statistical models for causal effect inference section of Methods section (page 9-10). However, we would like to clarify our analysis method. In this study, the main analysis method used is the IVW random effects model instead of the IVW fixed effects model. The IVW random effects model indicates that the true effect values of different studies may vary, including both sampling error and heterogeneity of the true effect. The weight of each study is jointly determined by its inverse variance and the estimated heterogeneity variance. Thus, as long as there is no pleiotropy, even when there is significant heterogeneity (p < 0.05), this method is still the best MR model. We would like to thank you again for your feedback, as we believe that our manuscript has been improved substantially as a result of your input.

      The newly added text describing more details about each method’s assumption and the customized best-fitted model is as follows:

      “Statistical models for causal effect inference

      A random-effects IVW model was used in this study as the major analysis method to uncover potential risk or protective factors for AD. The random-effects IVW model as the gold standard for MR studies, its principle is to calculate the inverse of the variance of each IV as its weight, assuming all IVs are valid. The regression does not include an intercept term, and the final result is the weighted average of the effect estimates from all IVs [34]. This model indicates that the true effect values may vary across different studies due to both sampling error and the heterogeneity of the true effect. The weight of each study is jointly determined by its inverse variance and the estimated heterogeneity variance. Thus, as long as there is no pleiotropy, even when there is significant heterogeneity (p < 0.05), this method remains the best MR model.

      To assess the robustness of the IVW results, sensitivity analysis was performed using six additional models: (i) MR-Egger: MR-Egger’s biggest difference from IVW is that it considers the intercept term during regression to evaluate bias caused by horizontal pleiotropy. The intercept represents the magnitude of horizontal pleiotropy, with a value close to 0 indicating minimal pleiotropy. The primary purpose is to detect and correct for horizontal pleiotropy. Thus, when significant horizontal pleiotropy is observed (p < 0.05), this method is preferred [35,36]. (ii) Weighted median: The weighted median method is a technique for evaluating causal relationships using a majority of genetic variants (SNPs). If at least 50% of the SNPs are valid IVs, the median of the causal estimates will tend toward the true causal effect. This method provides an unbiased estimate (i.e., the “majority validity” assumption) [37]. (iii) Simple mode: Involves comparing the frequencies or proportions of genotypes or phenotypes between control and experimental groups. Moreover, it can illustrate whether the observed differences in genotypes or phenotypes between the two groups are statistically significant. (iv) Weighted mode: The weighted mode method is a technique for combining multiple Mendelian randomization estimates. This method assigns weights to the causal effect estimates of different genetic variants on the trait and then takes the weighted mode as the final estimate of the causal effect. In genetic variant estimates, the method can decrease bias caused by outliers. (v) Maximum likelihood: This method is used when it is known that a random sample follows a particular probability distribution; however, the specific parameters of that distribution remain unknown, and it involves conducting multiple experiments, observing the results, and using those results to infer the approximate values of the parameters [38]. (vi) Penalized weighted median: An enhanced version of the weighted median estimate that provides a consistent estimate of the causal effect. (vii) Heterogeneity and horizontal pleiotropy assessment use the heterogeneity tests [39] and Egger intercept tests [40], respectively.”

      (2) Comment: Lines 157-160 mentioned "But to date, AD has been reported as hypothesis-driven MR study based on a single factor, ignoring the potential role of a huge number of other risk factors. Also, due to the high degree of heterogeneity present in AD subtypes, which have different biological and genetic characteristics. Thus, the previous studies cannot offer a systematic and complete viewpoint.". This statement overlooks a similar study published in Molecular Psychiatry ("A Phenome-wide Association and Mendelian Randomization Study for Alzheimer's Disease: A Prospective Cohort Study of 502,493"), which rigorously assessed the effects of 4171 factors spanning 10 different categories on AD using observational analysis and MR. The authors should revise their statement on the novelty of their study type throughout the manuscript and discuss how their work differs from and potentially strengthens previous studies.

      Thank you for directing us to this literature. We have read this article carefully. This study shares some similarities with our study but there are significant differences with regards to sample sources and research fields. The study, as mentioned by the reviewer, used the UKB database as its sample source, and analyzed the association between 10 categories (comprising 4,171 factors) and AD, which were sociodemographic, physical measures, lifestyle and environment, health conditions, mental health, medications and operations, cognitive function, sex-specific factors, employment, and early-life factors. However, the study revealed they are restricted by the available variables from the UKB database, which lead to variables such as air pollution, blood glucose measures and so on were not included. Conversely, our study used samples from the MRC IEU OpenGWAS database, the largest open GWAS database globally. Furthermore, our research focus differs, as we primarily investigate the causal relationship between the following 10 categories (comprising 18,097 traits) and AD, which were Disease, Medical laboratory science, Imaging, Anthropometric, Treatment, Molecular trait, Gut microbiota, Past history, Family history, and Lifestyle trait. Most importantly, we have established a database encompassing all MR analysis results, allowing researchers and clinicians worldwide to conveniently and rapidly retrieve AD-associated risk factors via an online open integrated platform (MRAD, https://gwasmrad.com/mrad/).We have now added a new text in the Background section (page 6-7) describing the differences and potential strengthens towards previous studies.

      The newly added text describing the differences and novelty towards previous studies is as follows:

      “Chen et al. [30] used MR analysis to reveal the causal relationship between AD and factors including sociodemographic and early life status. However, the study revealed they are restricted by the available variables from the UKB database, which lead to variables such as air pollution, blood glucose measures and so on were not included. And also, due to the high degree of heterogeneity present in AD subtypes, which have different biological and genetic characteristics. Thus, the previous studies cannot offer a systematic and complete viewpoint. Our study uses the MRC IEU OpenGWAS database as the sample source for MR analysis to address the aforementioned limitations. The MRC IEU OpenGWAS database, the largest open GWAS database globally, has compiled 42,335 GWAS summary datasets from sources such as the UK Biobank, FinnGen Biobank, and Biobank Japan. Analyzing large-scale datasets will break new ground for MR research on AD.

      MR requires a combination of background knowledge in biology, computer science, software studies, and statistics, which often leads to a dilemma where biologists are not well-versed in computer and statistical fields, while computer science experts struggle to adopt a medical biology mindset. Consequently, the vast majority of available GWAS data have not been effectively utilized through MR. Therefore, the construction of a multi-level data platform specifically for AD based on MR analysis of massive GWAS data is of great strategic significance, and it will facilitate researchers and clinicians worldwide to conveniently and rapidly obtain risk factors that are causally associated with AD.”

      Reference:

      [30] Chen SD, Zhang W, Li YZ, et al. (2023). A Phenome-wide Association and Mendelian Randomization Study for Alzheimer's Disease: A Prospective Cohort Study of 502,493 Participants From the UK Biobank. Biol Psychiatry. 1;93(9):790-801.

      (3) Comment: Given the large number of tests, the multiple testing issue is concerning. To mitigate potential false positives, I recommend employing the Bonferroni threshold or FDR. The authors should only interpret exposures that are significant at the Bonferroni threshold.

      We sincerely appreciate the reviewer's feedback. Thank you for pointing this out. We have added the results of the Bonferroni correction to the Statistical models for the causal effect inference section of the Methods section (page 10) in response to the reviewer's feedback.

      The newly added text describing Bonferroni threshold is as follows:

      “The above analyses were performed using the TwoSampleMR[41] package in the R (version 4.1.2) software. Association of exposures with outcomes was assessed using odds ratio (OR) and 95% confidence interval (95% CI), with OR > 1 indicating a positive association (risk factor) and 0 < OR < 1 indicating a negative association (protective factor). Differences with a two-sided p < .05 were considered statistically significant. Furthermore, owing to the relatively large number of exposure and outcome traits included in this study, the multiple testing correction method Bonferroni correction was added to identify significant hits, threshold for Bonferroni-corrected was 0.05 divided by 289,552 tests (p <1.727e-07).”

      (4) Comment: In the discussion, the authors should interpret or highlight exposures that remain significant after multiple testing corrections.

      Thank you for your valuable comment. In response to reviewer feedback, we have put extra emphasis on the exposures that remained significant after multiple testing corrections in the Discussion section (page 17). We thank you again for your feedback, as we believe that our manuscript has been improved substantially as a result of your input.

      Recommendations for the authors:

      Reviewer #1 (Recommendations For The Authors):

      (1) Comment: In this study, the authors used the inverse-variance weighted (IVW) model as the major analysis method to perform Mendelian randomization analysis to identify various classes of risk or protective factors for AD, early-onset AD, and late-onset AD. An online database called MRAD has been thereby developed with the assistance of Shiny package. This study is a very intriguing study of great clinical and scientific significance that provided a thorough and comprehensive evaluation with regard to risk or protective factors for AD. It also provided physicians and scientists with a very convenient, free as well as user-friendly tool for further scientific investigation.

      I believe this manuscript is great research that is worth publishing with all the comments from the Public Review resolved.

      We thank the reviewer for taking the time to read and provide valuable feedback on our manuscript, which allowed us to improve the overall quality of our research. All the comments from the Public Review have been rechecked, and appropriate changes have been made in accordance with the reviewers’ suggestions. Point-by-point responses to all the comments from the Public Review can be found in the above. If there are any further issues, please do not hesitate to let us know, so that we can ensure that our manuscript meets the high standards required for publication.

      Reviewer #2 (Recommendations For The Authors):

      (1) Comment: In the middle lower left section of the graphical abstract, the overlapping positive (N=63) and overlapping negative (N=16) do not sum to the overlapping number (N=80). Could you clarify if any have both positive and negative effects? Additionally, the font size inside the circular elements is too small to read.

      We thank you for raising this issue. We have clarified this in the MRAD utility data mining section of Results section (page 12): A total of 63 exposure traits (risk factors) were positively associated with all the three main outcome traits, while 16 exposure traits (protective factors) were negatively associated with the three main outcome traits, with Ulcerative colitis (ebi-a-GCST000964) being negatively associated with the AD outcome traits of ieu-b-2 and ieu-a-297, and positively associated with the AD outcome traits of ieu-b-5067. Additionally, we apologize for the small, unreadable fonts in the graphical abstract figure. In response to reviewer feedback, we have increased the font size within the figure and enhanced the resolution to improve image readability (page 3).
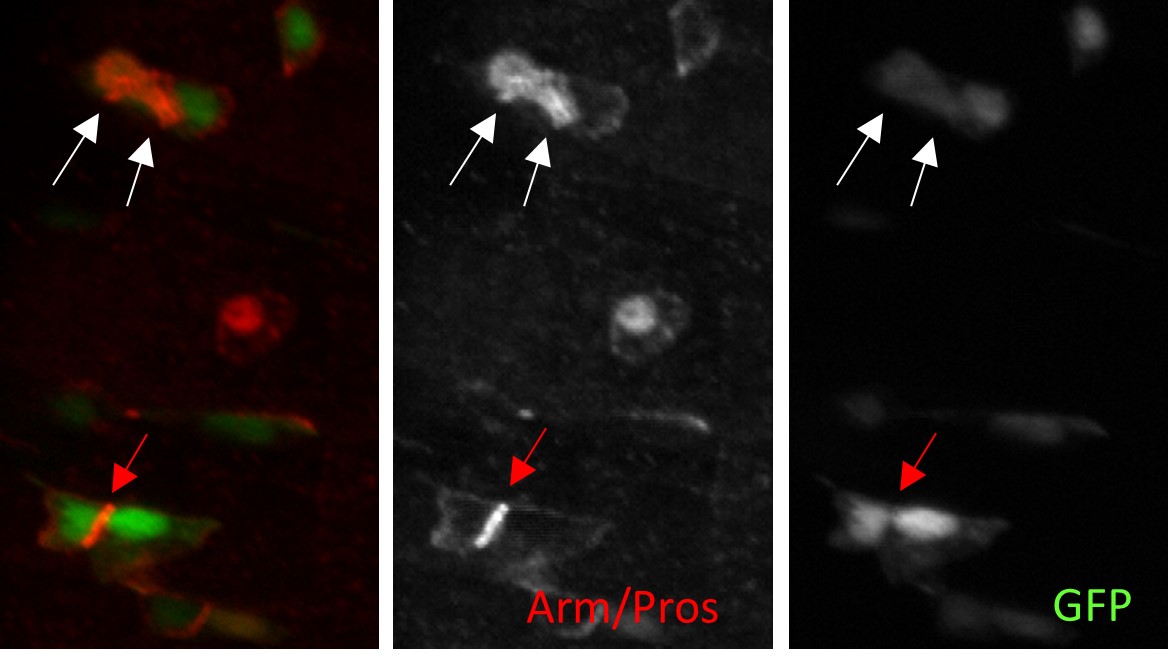
      (2) Comment: The x-axis label ("Alzheimer's disease outcome") should be more descriptive. If published GWAS results are used, indicate this as XXX et al. (2022). Also, specify the AD outcome for each category (e.g., AD, early-onset AD, late-onset AD). The y-axis labels should also be clarified; remove identification codes and retain only the exposure names. Apply the same improvements to Figures 2-8.

      We appreciate your comments and suggestions for improving our manuscript.

      (i) In response to reviewer feedback, information of published GWAS such as authors and year of publication have now been added to the x-axis labels, as demonstrated in Figure 4 (page 31).

      (ii) The outcome IDs are unique. We used these IDs to represent the AD information on the x-axis to maintain a clean and clear figure. The corresponding details for each ID are explained in the Outcome traits section of the Methods section (page 8, as shown in Figure 2). AD_EO refers to early-onset AD, and AD_LO refers to late-onset AD, which are also specified in the Abbreviations (page 4).

      (iii) We sincerely appreciate the reviewers’ meticulous feedback. While exposure IDs in this study are unique, exposure names are not. A single exposure name may correspond to multiple IDs, each with a potentially different source of information (e.g., author, year, population sample). We believe obtaining consistent results across multiple IDs further strengthens the reliability of our conclusions. Hence, for better clarity of specific exposure information, the exposure IDs have been retained.

      (3) Comment: The results across Figures 1-8 are repetitive and not very informative. Consider other visualizations to condense the information into one or two figures. I would recommend using a Manhattan plot or PheWAS plot concept to effectively display many test results at once. Please display the Bonferroni threshold in the plot as a horizontal line to show which exposures are meaningful after adjusting multiple comparisons.

      We appreciate this helpful suggestion. We have now condensed Figures 1–8 into a single figure (as shown in Figure 4). Additionally, we have now displayed the Bonferroni correction results in the sensitivity analysis results figures (as shown in Figure 5, Figure S1-S7).

      (4) Comment: Consider placing Figure S1 as Figure 1, condensing Figures 1-8 into Figures 2 and 3, and placing the circular diagrams from Figure S6 as Figure 4.

      We appreciate this valuable suggestion. The sequence of the figures has been adjusted.

      (5) Comment: Create a main table summarizing robust and consistent exposures for AD that are significant at the Bonferroni threshold for readers. For each exposure, please include estimates from IVW, MR-Egger, weighted median, simple mode, weighted mode, maximum likelihood, and penalized weighted median, along with heterogeneity and horizontal pleiotropy tests. I would also highlight or bold estimates from the best-fit model/MR method to help readers identify the most reliable estimates when estimates from multiple methods are heterogeneous.

      We appreciate this helpful suggestion. Owing to the excessive amount of information in the table, we have uploaded the table covering the aforementioned information according to the reviewer’s suggestion as supplementary materials (See Table S2). (i) The corresponding id.exposure that pass the Bonferroni threshold are reflected in red font. (ii) Furthermore, according to the customized best-fitted model (as mentioned in the Statistical models for causal effect inference section of Methods section), when there is no pleiotropy or when pleiotropy is not applicable (less than 3 SNPs), random-effects IVW model is the best model. These corresponding id.exposure are shown in red font with a yellow highlight. (iii) Moreover, according to the customized best-fitted model, when there is pleiotropy, MR-Egger is the best model. These corresponding id.exposure are shown in red font with a green highlight.

      (6) Comment: Figures S4-S10: These figures are screenshots of web browsers and may not be worth showing. Consider using tools like Adobe AI or R ggplot to create more refined visualizations that are specific to the research question and improve the message of this work.

      Thank you very much for your valuable suggestion in reviewing our manuscript. In this study, Figures S4-S10 are screenshots related to the user guide. We sincerely appreciate the reviewer’s feedback and have revised the subheading of this section to MRAD User Guide to clarify its purpose. Demonstrating both text and figures in this section, we aim to help users understand ways to operate MRAD more intuitively and easily.

      (7) Comment: Additionally, please show upfront or highlight results from MR analyses based on R packages, as the author mentioned in the method section. Somehow it's difficult to find results from MR-Egger, weighted median, simple mode, weighted mode, maximum likelihood, and penalized weighted median, along with heterogeneity and horizontal pleiotropy tests in the supplementary materials. Apologies if I missed them. Please ensure these results are clearly presented.

      We appreciate your comments and suggestions for improving our manuscript. Thank you for pointing this out. We have added the results of the sensitivity analysis based on R packages (as shown in Figure 5, Figure S1-S7, and Table S2).

    1. Author response:

      The following is the authors’ response to the original reviews.

      Public Reviews:

      Reviewer #1 (Public Review):

      I am not convinced how this study relates to HIV individual HFpEF, and the study design does not seem to be well thought out. 

      This is an important point and we have modified the manuscript as mentioned below in our responses.

      The connectivity of the study experiments is loose, and data analysis and conclusions are broadly overstated and misinterpreted.

      We have modified the manuscript thoroughly so the data are interpret properly, and the conclusions are stated logically. 

      For example the study lacks any measure of diastolic contractile function, and even if performed, the relevance of TNFa treatments to cells in vitro in these immature cell contexts would remain unclear. There is surprisingly no reported molecular analyses of potential mechanisms of the calcium transient changes. The study falls short in molecular detail and instead relies on drug treatments and responses that are hard to interpret with dosages that are not well justified and treatments that are numerous. Unclear what changes in calcium transients mean functionally without a comprehensive assessment of CM biomechanical contraction and relaxation measurements, and this would also require parallel molecular investigations of potential targets of any phenotypes observed.

      As mentioned above, we have modified the manuscript so the data are interpret properly, and the conclusions are stated logically. In terms of mechanisms for the observed phenomenon, we agree that this was not the focus of studies, however, we have provided a paragraph in the discussion that covers this topic. Although Decay and downstroke time were utilized as surrogates of cardiomyocyte relaxation, direct biomechanical characterization of contraction was not conducted in this study. While cytosolic calcium concentration is a predominant factor to regulate the cell’s relaxation (Reference 52 in the manuscript), there are several mechanisms to modify the relationship, including the transition of sarcomere protein isoforms to pathogenic ones (Reference 53 in the manuscript) and the stimulation of β-adrenergic receptor on cardiomyocytes (Reference 54 in the manuscript). Since hiPSC-CMs utilized for each study is from iPS cells derived from a single donor, we believe that the patterns of sarcomere protein expression and the regulation of β-adrenergic receptor pathway should be consistent among samples, supporting their effects should be minimum in our system. We also did not elucidate molecular mechanisms underlying prolonged decay time induced by TNF-α and IFN-γ in this study. Lee et al. reported that 25 ng/ml TNFa treatment induced a longer decay portion of the calcium transient and a decreased sarcoplasmic ATPase (SERCA) expression in rabbit cardiomyocytes from pulmonary vein (Reference 55 in the manuscript), suggesting our observation in iPS-CM is also through decreased expression of SERCA though further studies remain conducted.

      Calcium transient data need to be better illustrated such as with representative peak tracings. The data overall is with too few samples, particularly given the inherent heterogeneity of iPSCM studies. The iPS-CM system as a model for diastolic dysfunction remains unestablished.

      We have now prepared several representative curves of calcium transient and their derivatives in Figure 4 D and E, H and I, and in Figure 1-figure supplement 1B. In terms of the way to collect Ca-transient data, each dot in the bar graphs represents the average of signals obtained from one well of the 96-well plates. About 75K cells were seeded in one well, and we believe that the number of cells integrated in the analyses should be sufficient for the statistical analyses. We modified our manuscript as this system does not quantifying diastolic function directly, but represents Ca measurements that indicate cardiomyocyte relaxation.

      There are unclear dose choices for the various ART drugs tested, as well as the other drugs tested such as SGLT2i. Besides the observation that SLC5A2 (SGLT2 target) is not established to be expressed in adult mammalian cardiomyocytes. 

      Thank you for the comment. The dose ranges of ART drugs were chosen to extend to 10fold above the IC50 concentrations and reflects the upper range of circulating drug concentration in patients receiving these medications (Reference 36-39 in the manuscript). For SGLT2 inhibitor concentration, we referred to a paper utilizing 1-10 μM dapagliflozin (PMID: 35818731). We conducted a preliminary study to test the effect of 1 and 10 μM of dapagliflozin on the Ca-transient of iPS-CMs, and we found that 1 μM of the drug treatment did not cause changes in Ca-transient. Marfella et al. reported that SLC5A2 (SGLT2) expresses in cardiomyocytes under diabetic condition (PMID 36096423). Since diabetes is associated with low grade systemic inflammation, HIV patients might also express SGLT2 in cardiomyocytes. Taken together, we believe that the dosages of the drugs used in our studies are relevant to the clinical therapeutical usages of the drugs.

      HIV plasma samples were not tested for cytokine levels, but this could be done to assess the validity of the final experiments. It is unclear what is being tested with these experiments. 

      This is a good point and we agree with the reviewer. However, we had limited amount of the patient serum and could not perform a comprehensive analysis of these samples. Nevertheless, we have added a section in the Discussion section providing some clinical relevance of our findings based on the papers that have assessed cytokine levels in the serum of HIV patients.

      The choice of serum controls from a second institution (UCSF) opens up concerns over batch effects unrelated to differences in diastolic dysfunction. However, there were no differences with the Northwestern samples. It is unclear why this data is included as it does not add to the impact of the study. 

      In our study, we utilized two sets of HIV patient serum samples from different institutions, supporting that our results can be reproduced. We believe that these results significantly augmented the rigor of our findings.

      There are concerns about the quality of the iPS-CMs since there is no cell imaging or molecular analyses. Figure 5 Supplement 1 images are of low quality and low resolution to assess cell quality. Overall the iPS-CM QC data is extremely sparse 

      We have now added the representative images of iPS-CMs to Figure 1- figure supplement 1A. Our group has used hiPS-CMs extensively in the past (PMID: 26439715). We also updated Fig 5 Supplement 1 with images with better resolution and added Fig 5 Supplement 2 with magnified images. 

      Reviewer2 (Public Review):

      However, there are some topics that are not well-connected, and the rationale and hypothesis are not clearly defined beforehand, such as mitochondrial membrane potential, mitochondrial ROS, and angiogenic potential. 

      We modified the manuscript so the rationale and hypothesis of the study is clearly stated. 

      As the hiPSC cardiomyocytes are treated with various reagents to measure diastolic dysfunction, it is important to confirm whether the treatment time and dose used were sufficient to exert a functional effect. Dose and time-dependent experiments are essential, or at least sufficient citations should be provided for selecting the dose for IFN and TNF. 

      We used previous publications for the dosages of the drugs used in our paper (1-4). 

      After IFN and TNF treatment, determining the expression levels of molecular markers of DD/HFpEF is crucial. Again, if sufficient evidence is available, it can be cited. 

      We have included a section in the discussion to address this issue. Briefly, Lee et al. reported that 25 ng/ml TNFa induces a longer decay of calcium transient and a decrease in sarcoplasmic ATPase (SERCA) expression in rabbit cardiomyocytes from pulmonary vein (PMID 17383682). The prolonged Cadecay time in hiPS-CM with the drug administration may be due to a decrease in SERCA expression and impaired Ca-uptake into sarcoplasmic reticulum.

      The Methods section describes TMRE colocalization and immunofluorescence, but no images are provided.

      We have performed immunofluorescence of hiPSC-CM with TMRE for the quantification of mitochondrial membrane potential (MMP). 

      The concentration of TNF and IFN in patients is critical, which was acknowledged and discussed as a limitation of the study by the authors. Authors should consider this aspect, and if not feasible, clinical reports should be cited to provide a rough estimation of their concentration. 

      Thank you for this comment. A new section detailing the points brought up by the Reviewer is now added to discussion.

      Recommendation for the authors:

      Reviewer #1 (Recommendation for the authors):

      I suggest a more comprehensive analysis of diastolic function including biomechanical studies of contraction and diastolic function. I suggest increasing the sample #'s, getting a better characterziation of the cardiomyocytes, their expression profiles, and maturation state. The team should dig more deeply into potential molecular mechanisms of the calcium transient changes. Are there changes in SERCA or other SR factors' phosphorylation state or other molecular explanations for the observed changes? I would remove the serum treatment experiments as they distract since they didn't show differences. These are a few of the suggestions I would have for the team.

      Our system for measurement of Ca-transient unfortunately does not allow to obtain data on the cellular biomechanical property. We modified the manuscript so the results are not overstated and that the interpretation is correct. Since each dot in bar-graphs for Ca-transient data represents the average of signals generated from 75 K cells, we believe that the number of cells analyzed was sufficient for the analyses. Although it is not conclusive, previous reports suggested induction of SERCA2A expression by TNF-α treatment in isolated cardiomyocytes, suggesting that the mechanism underlying the prolonged calcium decay time in our model may be due to changes in SERCA levels. We included the data from human serum samples from HIV patients since they provide a platform to assess the effects of HIV patient serum on. We believe that these data convey a significant progress understanding the process of myocardial dysfunction in HIV patients.

      References

      Amirayan-Chevillard, N., Tissot-Dupont, H., Capo, C., Brunet, C., Dignat-George, F., Obadia, Y., Gallais, H., and Mege, J. L. (2000) Impact of highly active anti-retroviral therapy (HAART) on cytokine production and monocyte subsets in HIV-infected patients. Clinical and experimental immunology 120, 107-112

      Fraietta, J. A., Mueller, Y. M., Yang, G., Boesteanu, A. C., Gracias, D. T., Do, D. H., Hope, J. L., Kathuria, N., McGettigan, S. E., Lewis, M. G., Giavedoni, L. D., Jacobson, J. M., and Katsikis, P. D. (2013) Type I interferon upregulates Bak and contributes to T cell loss during human immunodeficiency virus (HIV) infection. PLoS Pathog 9, e1003658

      Lau, S. L., Yuen, M. L., Kou, C. Y., Au, K. W., Zhou, J., and Tsui, S. K. (2012) Interferons induce the expression of IFITM1 and IFITM3 and suppress the proliferation of rat neonatal cardiomyocytes. Journal of cellular biochemistry 113, 841-847

      Stone, S. F., Price, P., Keane, N. M., Murray, R. J., and French, M. A. (2002) Levels of IL-6 and soluble IL-6 receptor are increased in HIV patients with a history of immune restoration disease after HAART. HIV Med 3, 21-27

    1. Author response:

      The following is the authors’ response to the previous reviews.

      Reviewer #3:

      Comments on current version:

      As mentioned in my first review, this work is significantly underpowered for the following reasons: 1) n=4 for each treatment group.; 2) no randomization of the surgical sites receiving treatments; 3) implants surgically inserted without precision/guided surgery. The authors have not addressed these concerns.

      On a minor note: not sure why the authors present a methodology to evaluate the dynamic bone formation (line 272) but do not present results (i.e. by means of histomorphometrical analyses) utilizing this methodology.

      We sincerely appreciate your thorough review and valuable feedback. We have carefully considered your comments and would like to address them as follows:

      As mentioned in my first review, this work is significantly underpowered for the following reasons:

      (1) n=4 for each treatment group.;

      We acknowledge your concern regarding the limited sample size (n=4 per group). While we understand this may affect statistical power, our choice was influenced by ethical considerations in animal experimentation and resource constraints. Increasing the sample size would undoubtedly strengthen the statistical power of our study. However, the logistical and ethical constraints associated with using a larger number of animals in such invasive procedures were significant limiting factors. Specifically, increasing the number of medium to large experimental animals could raise ethical issues, so we used the minimum number possible. Additionally, our study design was reviewed and approved by the animal IRB, which dictated the minimum number of animals we could use. Nevertheless, we conducted power analysis to ensure that our sample size, although limited, was sufficient to detect significant differences given the high variability typically observed in biological responses. The results obtained from our n=4 samples showed consistent trends and significant differences between groups, indicating the robustness of our findings. I will include this point in the limitations section of the discussion. Thank you.

      (2) no randomization of the surgical sites receiving treatments;

      Thank you for pointing out this issue. We agree that randomization is essential when considering individual differences and the anatomical variations of the jawbone, such as those found in humans. However, this study is an animal experiment where other conditions were controlled, and the interventions were applied after complete bone healing following tooth extraction. Therefore, the impact of randomization of surgical sites was likely minimal, and it is challenging to determine whether it significantly influenced the experimental results. Of course, twelve female OVX beagles were randomly designated into three groups. (Methods section, line 298) However regarding your concern, we would like to present the robustness of histological results from different surgical sites as shown below. Also we will include this point in the limitations section of the discussion.

      Histologic analysis of the different surgical sites showed significant differences in bone formation and osseointegration among the three treatment groups: vehicle control, rhPTH(1-34), and dimeric Cys25PTH(1-34). Goldner trichrome staining (Figure A-C) showed enhanced bone formation in both the rhPTH(1-34) and dimeric Cys25PTH(1-34) groups compared to the vehicle control group. The rhPTH(1-34) group showed the most pronounced bone mass gain around the implant. Both treatment groups showed improved bone-to-implant contact compared to the control group, as indicated by the red arrows.

      Masson trichrome staining (Figure D-F) further confirmed these results, showing an increase in bone matrix (blue staining) in the rhPTH(1-34) and dimeric Cys25PTH(1-34) groups, with the dimeric rhPTH(1-34) group showing the most extensive and dense bone formation.

      TRAP staining (Figure G-I and G'-I') was used to assess osteoclast activity. Interestingly, both the rhPTH(1-34) and dimeric Cys25PTH(1-34) groups showed an increase in TRAP-positive cells compared to the vehicle control, suggesting enhanced bone remodeling activity. The highest number of TRAP-positive cells was observed in the rhPTH(1-34) group and the highest trabecular number, indicating the most active bone remodeling.

      To summarize the results, histological analyses revealed that both rhPTH(1-34) and dimeric Cys25PTH(1-34) treatments significantly enhanced osseointegration and bone formation around titanium implants in a postmenopausal osteoporosis model compared to the control. The rhPTH(1-34) group demonstrated superior outcomes, exhibiting the most substantial increase in bone volume, bone-to-implant contact, and osteoclastic activity, indicating its greater efficacy in promoting bone regeneration and implant integration in this experimental context.

      Author response image1.

      Histological analysis using Goldner trichrome, Masson trichrome, and TRAP staining

      (3) implants surgically inserted without precision/guided surgery. The authors have not addressed these concerns.

      The primary purpose of precision guides is to prevent damage to various anatomical structures and to ensure perfect placement at the desired location. Even disregarding the potential inaccuracies of precision guides in actual clinical settings, the primary goal of this animal experiment was not to achieve perfect placement or prevent damage to anatomical structures. Instead, the objective was to histologically measure the integrity of the bone surrounding titanium fixture's platform after pharmacological intervention, ensuring it was fully seated in the alveolar bone. To this end, we secured sufficient visibility through periosteal dissection to confirm the perfect placement of the implant and adhered to the principle of maintaining sufficient mesiodistal distance between each fixture. Using such precision guides in this animal experiment, which is not an evaluation of 'implant precision guides,' could potentially introduce inaccuracies and contradict the experimental objectives. Furthermore, since this experiment was conducted on an edentulous ridge where all teeth had been extracted, achieving the same placement as in the presurgical simulation would be impossible, even with the use of precision guides. Thank you once again for your constructive feedback. We will include this point in the limitations section of the discussion.

      On a minor note: not sure why the authors present a methodology to evaluate the dynamic bone formation (line 272) but do not present results (i.e. by means of histomorphometrical analyses) utilizing this methodology.

      As the reviewer mentioned, we confirmed that the sentence was included in the Methods section despite the analysis not actually being performed. We sincerely apologize for this oversight and will make the necessary corrections immediately. Thank you very much for your keen observation.

    1. Author response:

      The following is the authors’ response to the original reviews.

      Reviewer #1 (Public Review):

      Major comments: 

      My main concern about the manuscript is the extent of both clinical and statistical heterogeneity, which complicates the interpretation of the results. I don't understand some of the antibiotic comparisons that are included in the systematic review. For instance the study by Paul et al (50), where vancomycin (as monotherapy) is compared to co-trimoxazole (as combination therapy). Emergence (or selection) of co-trimoxazole in S. aureus is in itself much more common than vancomycin resistance. It is logical and expected to have more resistance in the co-trimoxazole group compared to the vancomycin group, however, this difference is due to the drug itself and not due to co-trimoxazole being a combination therapy. It is therefore unfair to attribute the difference in resistance to combination therapy. Another example is the study by Walsh (71) where rifampin + novobiocin is compared to rifampin + co-trimoxazole. There is more emergence of resistance in the rifampin + co-trimoxazole group but this could be attributed to novobiocin being a different type of antibiotic than co-trimoxazole instead of the difference being attributed to combination therapy. To improve interpretation and reduce heterogeneity my suggestion would be to limit the primary analyses to regimens where the antibiotics compared are the same but in one group one or more antibiotic(s) are added (i.e. A versus A+B). The other analyses are problematic in their interpretation and should be clearly labeled as secondary and their interpretation discussed. 

      Thank you for raising these important points and highlighting the need for clarification. We understand that the reviewer has concerns regarding the following points:

      (1) The structure of presenting our analyses, i.e. main analyses and sub-group analyses and their corresponding discussion and interpretation

      Our primary interest was whether combining antibiotics has an overarching effect on resistance and to identify factors that explain potential differences of the effect of combining antibiotic across pathogens/drugs. Therefore, pooling all studies, and thereby all combinations of antibiotics, is one of our main analyses. The decision to pool all studies that compare a lower number of antibiotics to a higher number of antibiotics was hence predefined in our previously published study protocol (PROSPERO CRD42020187257).

      We indeed, find that heterogeneity is high in our statistical analyses. As planned in our study protocol, we did perform several prespecified sub-group analyses and added additional ones. We now emphasize that several sub-group analyses were performed to investigate heterogeneity (L 119ff): “The overall pooled estimates are based on studies that focus on various clinical conditions/pathogens and compare different antibiotics treatments. To explore the impact of these and other potential sources of heterogeneity on the resistance estimates we performed various sub-group analyses and metaregression.” 

      The performed sub-group analyses specifically focused on specific pathogens/clinical conditions (figure 3) or explored heterogeneity due to different antibiotics in comparator arms – as suggested by the reviewer (figure 3B, SI section 6). We find that the heterogeneity remains high even if only resistances to antibiotics common to both arms are considered (SI section 6.1.8). With this analysis we excluded comparisons of different antibiotics (e.g., A vs B+C), such as those between vancomycin and cotrimoxazole named by the reviewer. While we aimed to explore heterogeneity and investigate potential factors affecting the effect of combining antibiotic on resistance, limitations arose due to limited evidence and the nature of data provided by the identified studies. Therefore, interpretability remains also limited for the subgroup analyses, which we highlight in the discussion. (L 186 ff: We accounted for many sources of heterogeneity using stratification and meta-regression, but analyses were limited by missing information and sparse data.) Further, specific subgroup analyses are discussed in more detail in the SI.

      (2) Difference in resistance development due to the type of the antibiotics or due to combination therapy?

      The reviewer raises an important point, which we also try to make: future studies should be systematically designed to compare antibiotic combination therapy, i.e. identical antibiotics in treatment arms should be used, except for additional antibiotics used in both treatment arms. We already mentioned this point in our discussion but highlight this now by emphasizing how many studies did not have identical antibiotics in their treatment arms. We write in L194ff: “19 (45%) of our included studies compared treatment arms with no antibiotics in common, and 22 studies (52%) had more than one antibiotic not identical in the treatment arms (table 1). To better evaluate the effect of combination therapy, especially more RCTs would be needed where the basic antibiotic treatment is consistent across both treatment arms, i.e. the antibiotics used in both treatment arms should be identical, except for the additional antibiotic added in the comparator arm (table 1).”

      Furthermore, we investigated the importance of the type of antibiotics with several subgroup analyses (e.g. SI sections 6.1.8 and 6.1.10). We now further highlight the concern of the type of antibiotics in the result section of the main manuscript, where we discuss the sub-group analysis with no common antibiotics in the treatment arms 131 ff: “Furthermore, a lower number of antibiotics performed better than a higher number if the compared treatment arms had no antibiotics in common (pooled OR 4.73, 95% CI 2.14 – 10.42; I2\=37%, SI table S3), which could be due to different potencies or resistance prevalences of antibiotics as discussed in SI (SI section 6.1.10).” As mentioned above we also perform sub-group analyses, where only resistances of antibiotics common to both arms are considered (SI section 6.1.8). However, as discussed in the corresponding sections, the systematic assessment of antibiotic combination therapy remains challenging as not all resistances against antibiotics used in the arms were systematically measured and reported. Furthermore, the power of these sub-group analyses is naturally a concern, as they include fewer studies. 

      Another concern is about the definition of acquisition of resistance, which is unclear to me. If for example meropenem is administered and the follow-up cultures show Enterococcus species (which is intrinsically resistant to meropenem), does this constitute acquisition of resistance? If so, it would be misleading to determine this as an acquisition of resistance, as many people are colonized with Enterococci and selection of Enterococci under therapy is very common. If this is not considered as the acquisition of resistance please include how the acquisition of resistance is defined per included study. Table S1 is not sufficiently clear because it often only contains how susceptibility testing was done but not which antibiotics were tested and how a strain was classified as resistant or susceptible. 

      Thank you for pointing out this potential ambiguity. The definition of acquisition of resistance reads now (L 275 ff): “A patient was considered to have acquired resistance if, at the follow-up culture, a resistant bacterium (as defined by the study authors) was detected that was not present in the baseline culture.” We also changed the definition accordingly in the abstract (L 36 ff). We hope that the definition of acquisition is now clearer. Our definition of “acquisition of resistance” is agnostic to bacterial species and hence intrinsically resistant species, as the example raised by the reviewer, can be included if they were only detected during the follow-up culture by the studies. Generally, it was not always clear from the studies, which pathogens were screened for and whether the selection of intrinsically resistant bacteria was reported or not. Therefore, we rely on the studies' specifications of resistant and non-resistant without further distinction from our side, i.e. classifying data into intrinsic and non-intrinsic resistance. Overall, the outcome “acquisition of resistance” can be interpreted as a risk assessment for having any resistant bacterium during or after treatment. In contrast, the outcome “emergence of resistance” is more rigorous, demanding the same species to be detected as more resistant during or after treatment.

      The information, which antibiotic susceptibility tests were performed in each individual study can be found in the main text in table 1. However, we agree that this information should be better linked and highlighted again in table S1. We therefore now refer to table 1 in the table description of table S1. L134 ff.: “See table 1 in the main text for which antibiotics the antibiotics tested and reported extractable resistance data”. Furthermore, we added the breakpoints for resistant and susceptible classification if specifically stated in the main text of the study. However, we did not do further research into old guidelines, manufactures manuals or study protocols in case the breakpoints are not specifically stated in the main text as the main goal of this table, in our opinion, is to show a justification, why the studies could be considered for a resistance outcome. We therefore decided against further breakpoint investigations for studies, where the breakpoint is not specifically stated in the main text. 

      Line 85: "Even though within-patient antibiotic resistance development is rare, it may contribute to the emergence and spread of resistance." 

      Depending on the bug-drug combination, there is great variation in the propensity to develop within-patient antibiotic resistance. For example: within-patient development of ciprofloxacin resistance in Pseudomonas is fairly common while within-patient development of methicillin resistance in S. aureus is rare. Based on these differences, large clinical heterogeneity is expected and it is questionable where these studies should be pooled. 

      We agree that our formulation neglects differences in prevalence of within-host resistance emergence depending on bug-drug combinations. We changed our statement in L 86 to: “Within-patient antibiotic resistance development, even if rare, may contribute to the emergence and spread of resistance.”

      Line 114: "The overall pooled OR for acquisition of resistance comparing a lower number of antibiotics versus a higher one was 1.23 (95% CI 0.68 - 2.25), with substantial heterogeneity between studies (I2=77.4%)" 

      What consequential measures did the authors take after determining this high heterogeneity? Did they explore the source of this large heterogeneity? Considering this large heterogeneity, do the authors consider it appropriate to pool these studies?

      Thank you for highlighting this lack of clarity. As mentioned above, we now highlight that we performed several subgroup analyses to investigate heterogeneity. (L 116ff): “The overall pooled estimates are based on studies that focus on various clinical conditions/pathogens and compare different antibiotics treatments. To explore the impact of these and other potential sources of heterogeneity on the resistance estimates we performed various subgroup analyses and meta-regression.” Nevertheless, these analyses faced limitations due to the scarcity of evidence and often still showed a high amount of heterogeneity. Given the lack of appropriate evidence, it is hard to identify the source of heterogeneity. The decision to pool all studies was pre-specified in our previously published study protocol (PROSPERO CRD42020187257) and was motivated by the question whether there is a general effect of combination therapy on resistance development or identify factors that explain potential differences of the effect of combination therapy across bug-drug combinations. Therefore, we think that the presentation of the overall pooled estimate is appropriate, as it was predefined, and potential heterogeneity is furthermore explored in the subgroup analyses. 

      Reviewer #1 (Recommendations For The Authors): 

      I want to congratulate the investigators for the rigorous approach followed and the - in my opinion - correct interpretation of the data and analysis. The disappointing outcome is independent of the quality of the approach used. Yet, the consequences of that outcome are rather limited, and will not be surprising for - at least - some in the field of antibiotic resistance. 

      Thank you for your positive and differentiated feedback.

      Reviewer #2 (Recommendations For The Authors): 

      Line 93: "The screening of the citations of the 41 studies identified one additional eligible study, for a total of 42 studies". 

      Why was this study missed in the search strategy? 

      What is the definition of "quasi-RCTs"? Why were these included in the analysis? 

      Thank you for pointing out this lack of clarity. The additional study, which was found through screening the references of included studies, was not identified with our search strategy as neither the abstract nor database specific identifiers provided any indications that resistance was measured in this study. We added an explanation in the supplementary materials L 792 ff. and refer to this explanation in the main manuscript (L 95). 

      Quasi-randomized trials are trials that use allocation methods, which are not considered truly random. We added this specification in L 95. It now reads: “….two quasi-RCTs, where the allocation method used is not truly random” and in L 252 ff: “Studies were classified as quasi-RCTs if the allocation of participants to study arms was not truly random.” For instance, the study Macnab et al. (1994) assigned patients alternately to the treatment arms. Quasi-randomized controlled trials can lead to biases and especially old studies are more likely to have used quasi-random allocation methods. This can also be seen in our study, where the two quasi-randomized controlled trials were published in 1994 and 1997. The bias is considered in the risk of bias assessment and in our conducted sensitivity analysis regarding the impact of risk of bias on our estimates (supplementary information sections 3.0 and 4.2). Furthermore, one of the two previous conducted meta-analyses comparing beta-lactam monotherapy to beta-lactam and aminoglycoside, which assessed resistance development also included quasi-randomized controlled trials Paul et al 2014. Overall, while designing the study, we decided to include quasi-randomized controlled trials to increase statistical power as we expected that limited statistical power might be a concern and decided to assess potential biases in the risk of bias assessment.  
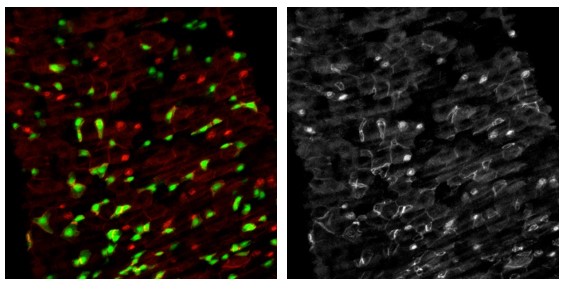
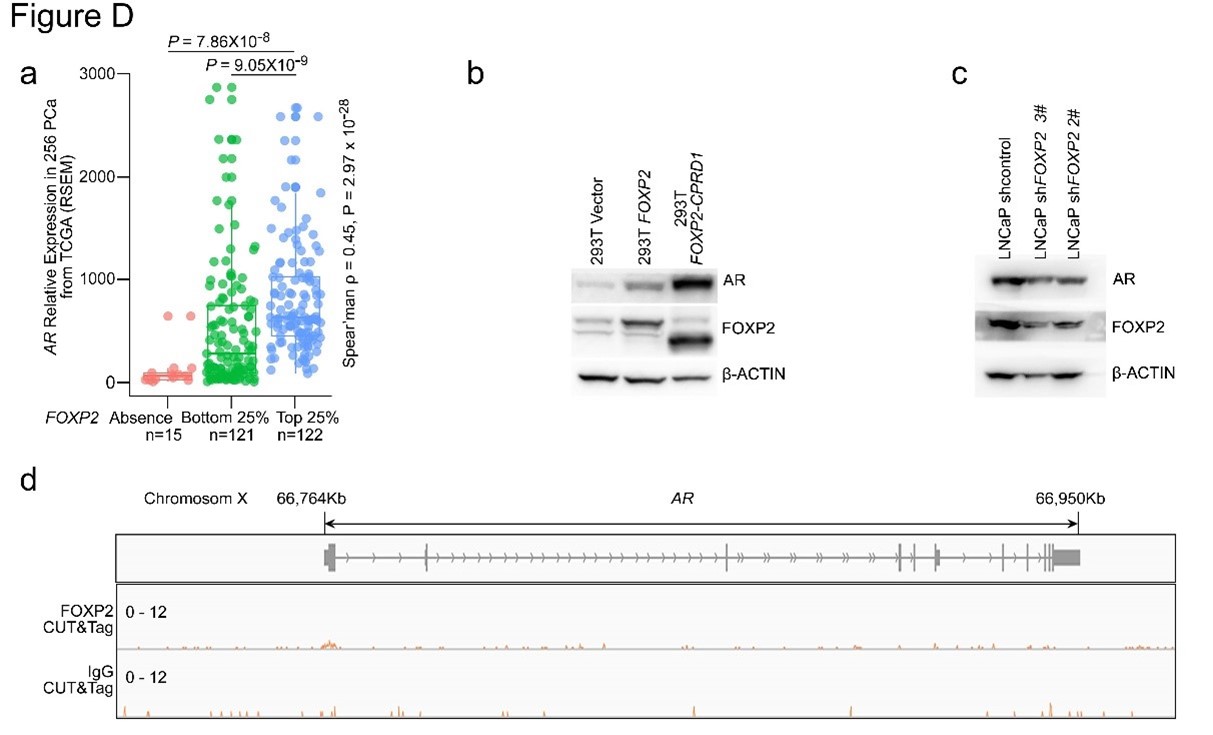
      Line 100: "Consequently, most studies did not have the statistical power to detect a large effect on within-patient resistance development (figure 2 B, SI p 14).". 

      Small studies actually have more power to detect large effects while smaller power to detect small effects. Please rephrase. 

      Thank you for pointing out this lack of clarity. We rephrased the sentence in order to emphasize our point that the studies are underpowered even if we assume in our power analysis a large effect on resistance development between treatment arms. In this context “the small” studies include too few patients to detect a large difference in resistance development. As resistance development is a rare event, generally studies have to include a larger number of patients to estimate the effect of intervention. We rephrased the sentence in L 101ff to: “Consequently, most studies did not have the statistical power to detect differences in within-patient resistance development even if we assume that the effect on resistance development is large between treatment arms.”

      Line 108: "... and prophylaxis for blood cancer patients with four studies (10%) respectively.". 

      I would suggest using the medical term hematological malignancy patients. 

      Thank you for the suggestion, we changed it as suggested to hematological malignancy patients, also accordingly in the figures, and table 1.

      Line 117: "Since the results for the two resistance outcomes are comparable, our focus in the following is on the acquisition of resistance". 

      The first OR is 1.23 and the second is 0.74, why do you consider these outcomes as comparable? 

      Thank you for pointing out our unprecise formulation. Due to the lack of power the exact estimates need to be interpreted with care. Here, we wanted to make the point that qualitatively the results of both outcomes do not differ in the sense that our analysis shows no substantial difference between a higher and a lower number of antibiotics. We rephrased the sentence to be more precise (L 123ff): “The results for the two resistance outcomes are qualitatively comparable in the sense that individual estimates may differ, but show similar absence of evidence to support either the benefit, harm or equivalence of treating with a higher number of antibiotics. Therefore, our …”. More detailed discussion about differences in estimates can be found in the SI, when the estimates of emergence of resistance are presented (e.g. SI section 2.1).

      Line 123: "Furthermore, a lower number of antibiotics performed better than a higher number if the compared treatment arms had no antibiotics in common (pooled OR 4.73, 95% CI 2.14 - 10.42; I 2 =37%, SI p 7).". 

      How do you explain this? What does this mean? 

      We now added a more detailed explanation in the supplement (L 376ff.): “The result that if the treatment arms had no antibiotics in common a lower number of antibiotics performed better than a higher number of antibiotics could be due to different potencies of antibiotics or resistance prevalences. Further, there could be a bias to combine less potent antibiotics or antibiotics with higher resistance prevalence to ensure treatment efficacy, which couldlead to higher chances to detect resistances in the treatment arm with higher number of antibiotics, e.g. by selecting pre-existing resistance due to antibiotic treatment (see also section 6.1.9).” We furthermore already specifically mention this point in the main manuscript and refer then to the detailed explanation in the SI (L134 ff, “which could be due to different potencies or resistance prevalences of antibiotics as discussed in SI (SI section 6.1.10)”)

      Overall, we want to point out that these results need to be interpreted with caution as overall the statistical power is limited to confidently estimate the difference in effect of a higher and lower number of antibiotics.

      Line 125: ". In contrast, when restricting the analysis to studies with at least one common antibiotic in the treatment arms are pooled there was little evidence of a difference (pooled OR 0.55, 95% CI 0.28 - 1.07". 

      The difference was not statistically significant but there does seem to be an indication of a difference, please rephrase. 

      We rephrased the sentence to (L135 ff.): “In contrast, when restricting the analysis to studies with at least one common antibiotic in the treatment arms we found no evidence of a difference, only a weak indication that a higher number of antibiotics performs better (pooled OR 0.55, 95% CI 0.28 – 1.07; I2 \=74%, figure 3B).” 

      Line 190: "Similarly, today, relevant cohort studies could be analysed collaboratively using various modern statistical methods to address confounding by indication and other biases (66, 67)". 

      However, residual confounding by indication is likely. Please also mention the disadvantages of observational studies compared to RCTs. 

      We now highlight that causal inference with observational data comes with its own challenges and stress that randomized controlled trials are still considered the gold standard. L 204ff now reads: “However, even with appropriate causal inference methods, residual confounding cannot be excluded when using observational data (67). Therefore, will remain the gold standard to estimate causal relationships.”

      Line 230: "Gram-negative bacteria have an outer membrane, which is absent in grampositive bacteria for instance, therefore intrinsic resistance against antibiotics can be observed in gram-negative bacteria (11)". 

      Intrinsic resistance is not unique for Gram-negative bacteria but also exists for Grampositive bacteria. 

      We agree with the reviewer that intrinsic resistance is not unique to gram-negative bacteria and refined our writing. We additionally added that differences between gram-negative and gram-positive bacteria are not only to be expected due to differing intrinsic resistances but also due to potential differences in the mechanistic interactions of antibiotics, i.e., synergy or antagonism. The paragraph reads now (SI L289): “The gram status of a bacterium may potentially determine how effective an antibiotic, or an antibiotic combination is. Differences between gram-negative and gram-positive bacteria such as distinct bacterial surface organisation can lead to specific intrinsic resistances of gram-negative and grampositive bacteria against antibiotics (55). These structural differences can lead to varying effects of antibiotic combinations between gram-negative and gram-positive bacteria (56).”

    1. Author response:

      The following is the authors’ response to the original reviews.

      Recommendations for the authors:

      Reviewer #1 (Recommendations For The Authors):

      Line 127. Provide a few more words describing the voltage protocol. To the uninitiated, panels A and B will be difficult to understand. "The large negative step is used to first close all channels, then probe the activation function with a series of depolarizing steps to re-open them and obtain the max conductance from the peak tail current at -36 mV. "

      We have revised the text as suggested (revision lines 127 to Line 131): “From a holding potential within the gK,L activation range (here –74 mV), the cell is hyperpolarized to –124 mV, negative to EK and the activation range, producing a large inward current through open gK,L channels that rapidly decays as the channels deactivate. We use the large transient inward current as a hallmark of gK,L. The hyperpolarization closes all channels, and then the activation function is probed with a series of depolarizing steps, obtaining the max conductance from the peak tail current at –44 mV (Fig. 1A).”

      Incidentally, why does the peak tail current decay? 

      We added this text to the figure legend to explain this: “For steps positive to the midpoint voltage, tail currents are very large. As a result, K+ accumulation in the calyceal cleft reduces driving force on K+, causing currents to decay rapidly, as seen in A (Lim et al., 2011).”

      The decay of the peak tail current is a feature of gK,L (large K+ conductance) and the large enclosed synaptic cleft (which concentrates K+ that effluxes from the HC). See Govindaraju et al. (2023) and Lim et al. (2011) for modeling and experiments around this phenomenon.

      Line 217-218. For some reason, I stumbled over this wording. Perhaps rearrange as "In type II HCs absence of Kv1.8 significantly increased Rin and tauRC. There was no effect on Vrest because the conductances to which Kv1.8 contributes, gA and gDR activate positive to the resting potential. (so which K conductances establish Vrest???). 

      We kept our original wording because we wanted to discuss the baseline (Vrest) before describing responses to current injection.

      Vrest is presumably maintained by ATP-dependent Na/K exchangers (ATP1a1), HCN, Kir, and mechanotransduction currents. Repolarization is achieved by delayed rectifier and A-type K+ conductances in type II HCs.

      Figure 4, panel C - provides absolute membrane potential for voltage responses. Presumably, these were the most 'ringy' responses. Were they obtained at similar Vm in all cells (i.e., comparisons of Q values in lines 229-230). 

      We added the absolute membrane potential scale. Type II HC protocols all started with 0 pA current injection at baseline, so they were at their natural Vrest, which did not differ by genotype or zone. Consistent with Q depending on expression of conductances that activate positive to Vrest, Q did not co-vary with Vrest (Pearson’s correlation coefficient = 0.08, p = 0.47, n= 85).

      Lines 254. Staining is non-specific? Rather than non-selective? 

      Yes, thanks - Corrected (Line 264).

      Figure 6. Do you have a negative control image for Kv1.4 immuno? Is it surprising that this label is all over the cell, but Kv1.8 is restricted to the synaptic pole? 

      We don’t have a null-animal control because this immunoreactivity was done in rat. While the cuticular plate staining was most likely nonspecific because we see that with many different antibodies, it’s harder to judge the background staining in the hair cell body layer. After feedback from the reviewers, we decided to pull the KV1.4 immunostaining from the paper because of the lack of null control, high background, and inability to reproduce these results in mouse tissue. In our hands, in mouse tissue, both mouse and rabbit anti-KV1.4 antibodies failed to localize to the hair cell membrane. Further optimization or another method could improve that, but for now the single-cell expression data (McInturff et al., 2018) remain the strongest evidence for KV1.4 expression in murine type II hair cells.

      Lines 400-404. Whew, this is pretty cryptic. Expand a bit? 

      We simplified this paragraph (revision lines 411-413): “We speculate that gA and gDR(KV1.8) have different subunit composition: gA may include heteromers of KV1.8 with other subunits that confer rapid inactivation, while gDR(KV1.8) may comprise homomeric KV1.8 channels, given that they do not have N-type inactivation .”

      Line 428. 'importantly different ion channels'. I think I understand what is meant but perhaps say a bit more. 

      Revised (Line 438): “biophysically distinct and functionally different ion channels”.

      Random thought. In addition to impacting Rin and TauRC, do you think the more negative Vrest might also provide a selective advantage by increasing the driving force on K entry from endolymph? 

      When the calyx is perfectly intact, gK,L is predicted to make Vrest less negative than the values we report in our paper, where we have disturbed the calyx to access the hair cell (–80, Govindaraju et al., 2023, vs. –87 mV, here). By enhancing K+ accumulation in the calyceal cleft, the intact calyx shifts EK—and Vrest—positively (Lim et al., 2011), so the effect on driving force may not be as drastic as what you are thinking.

      Reviewer #2 (Recommendations For The Authors):

      (1) Introduction: wouldn't the small initial paragraph stating the main conclusion of the study fit better at the end of the background section, instead of at the beginning? 

      Thank you for this idea, we have tried that and settled on this direct approach to let people know in advance what the goals of the paper are.

      (2) Pg.4: The following sentence is rather confusing "Between P5 and P10, we detected no evidence of a non-gK,L KV1.8-dependent.....". Also, Suppl. Fig 1A seems to show that between P5 and P10 hair cells can display a potassium current having either a hyperpolarised or depolarised Vhalf. Thus, I am not sure I understand the above statement. 

      Thank you for pointing out unclear wording. We used the more common “delayed rectifier” term in our revision (Lines 144-147): “Between P5 and P10, some type I HCs have not yet acquired the physiologically defined conductance, gK,L.. N effects of KV1.8 deletion were seen in the delayed rectifier currents of immature type I HCs (Suppl. Fig. 1B), showing that they are not immature forms of the Kv1.8-dependent gK,L channels. ”

      (3) For the reduced Cm of hair cells from Kv1.8 knockout mice, could another reason be simply the immature state of the hair cells (i.e. lack of normal growth), rather than less channels in the membrane? 

      There were no other signs to suggest immaturity or abnormal growth in KV1.8–/– hair cells or mice. Importantly, type II HCs did not show the same Cm effect.

      We further discussed the capacitance effect in lines 160-167: “Cm scales with surface area, but soma sizes were unchanged by deletion of KV1.8 (Suppl. Table 2). Instead, Cm may be higher in KV1.8+/+ cells because of gK,L for two reasons. First, highly expressed trans-membrane proteins (see discussion of gK,L channel density in Chen and Eatock, 2000) can affect membrane thickness (Mitra et al., 2004), which is inversely proportional to specific Cm. Second, gK,L could contaminate estimations of capacitive current, which is calculated from the decay time constant of transient current evoked by small voltage steps outside the operating range of any ion channels. gK,L has such a negative operating range that, even for Vm negative to –90 mV, some gK,L channels are voltage-sensitive and could add to capacitive current.”

      (4) Methods: The electrophysiological part states that "For most recordings, we used .....". However, it is not clear what has been used for the other recordings.

      Thanks for catching this error, a holdover from an earlier ms. version.  We have deleted “For most recordings” (revision line 466).

      Also, please provide the sign for the calculated 4 mV liquid junction potential. 

      Done (revision line 476).

      Reviewer #3 (Recommendations For The Authors): 

      (1) Some of the data in panels in Fig. 1 are hard to match up. The voltage protocols shown in A and B show steps from hyperpolarized values to -71mV (A) and -32 mV (B). However, the value from A doesn't seem to correspond with the activation curve in C.

      Thank you for catching this.  We accidentally showed the control I-X curve from a different cell than that in A. We now show the G-V relation for the cell in A.

      Also the Vhalf in D for -/- animals is ~-38 mV, which is similar to the most positive step shown in the protocol.

      The most positive step in Figure 1B is actually –25 mV. The uneven tick labels might have been confusing, so we re-labeled them to be more conventional.

      Were type I cells stepped to more positive potentials to test for the presence of voltage-activated currents at greater depolarizations? This is needed to support the statement on lines 147-148. 

      We added “no additional K+ conductance activated up to +40 mV” (revision line 149-150).  Our standard voltage-clamp protocol iterates up to ~+40 mV in KV1.8–/– hair cells, but in Figure 1 we only showed steps up to –25 mV because K+ accumulation in the synaptic cleft with the calyx distorts the current waveform even for the small residual conductances of the knockouts. KV1.8–/– hair cells have a main KV conductance with a Vhalf of ~–38 mV, as shown in Figure 1, and we did not see an additional KV conductance that activated with a more positive Vhalf up to +40 mV.

      (2) Line 151 states "While the cells of Kv1.8-/- appeared healthy..." how were epithelia assessed for health? Hair cells arise from support cells and it would be interesting to know if Kv1.8 absence influences supporting cells or neurons. 

      We added our criteria for cell health to lines 477-479: “KV1.8–/– hair cells appeared healthy in that cells had resting potentials negative to –50 mV, cells lasted a long time (20-30 minutes) in ruptured patch recordings, membranes were not fragile, and extensive blebbing was not seen.”

      Supporting cells were not routinely investigated. We characterized calyx electrical activity (passive membrane properties, voltage-gated currents, firing pattern) and didn’t detect differences between +/+, +/–, and –/– recordings (data not shown). KV1.8 was not detected in neural tissue (Lee et al., 2013). 

      (3) Several different K+ channel subtypes were found to contribute to inner hair cell K+ conductances (Dierich et al. 2020) but few additional K+ channel subtypes are considered here in vestibular hair cells. Further comments on calcium-activated conductances (lines 310-317) would be helpful since apamin-sensitive SK conductances are reported in type II hair cells (Poppi et al. 2018) and large iberiotoxin-sensitive BK conductances in type I hair cells (Contini et al. 2020). Were iberiotoxin effects studied at a range of voltages and might calcium-dependent conductances contribute to the enhanced resonance responses shown in Fig. 4? 

      We refer you to lines 310-317 in the original ms (lines 322-329 in the revised ms), where we explain possible reasons for not observing IK(Ca) in this study.

      (4) Similar to GK,L erg (Kv11) channels show significant Cs+-permeability. Were experiments using Cs+ and/or Kv11 antagonists performed to test for Kv11? 

      No. Hurley et al. (2006) used Kv11 antagonists to reveal Kv11 currents in rat utricular type I hair cells with perforated patch, which were also detected in rats with single-cell RT-PCR (Hurley et al. 2006) and in mice with single-cell RNAseq (McInturff et al., 2018).  They likely contribute to hair cell currents, alongside Kv7, Kv1.8, HCN1, and Kir. 

      (5) Mechanosensitive ("MET") channels in hair cells are mentioned on lines 234 and 472 (towards the end of the Discussion), but a sentence or two describing the sensory function of hair cells in terms of MET channels and K+ fluxes would help in the Introduction too. 

      Following this suggestion we have expanded the introduction with the following lines  (78-87): “Hair cells are known for their large outwardly rectifying K+ conductances, which repolarize membrane voltage following a mechanically evoked perturbation and in some cases contribute to sharp electrical tuning of the hair cell membrane.  Because gK,L is unusually large and unusually negatively activated, it strongly attenuates and speeds up the receptor potentials of type I HCs (Correia et al., 1996; Rüsch and Eatock, 1996b). In addition, gK,L augments a novel non-quantal transmission from type I hair cell to afferent calyx by providing open channels for K+ flow into the synaptic cleft (Contini et al., 2012, 2017, 2020; Govindaraju et al., 2023), increasing the speed and linearity of the transmitted signal (Songer and Eatock, 2013).”

      (6) Lines 258-260 state that GKL does not inactivate, but previous literature has documented a slow type of inactivation in mouse crista and utricle type I hair cells (Lim et al. 2011, Rusch and Eatock 1996) which should be considered. 

      Lim et al. (2011) concluded that K+ accumulation in the synaptic cleft can explain much of the apparent inactivation of gK,L. In our paper, we were referring to fast, N-type inactivation. We changed that line to be more specific; new revision lines 269-271: “KV1.8, like most KV1 subunits, does not show fast inactivation as a heterologously expressed homomer (Lang et al., 2000; Ranjan et al., 2019; Dierich et al., 2020), nor do the KV1.8-dependent channels in type I HCs, as we show, and in cochlear inner hair cells (Dierich et al., 2020).”

      (7) Lines 320-321 Zonal differences in inward rectifier conductances were reported previously in bird hair cells (Masetto and Correia 1997) and should be referenced here.

      Zonal differences were reported by Masetto and Correia for type II but not type I avian hair cells, which is why we emphasize that we found a zonal difference in I-H in type I hair cells. We added two citations to direct readers to type II hair cell results (lines 333-334): “The gK,L knockout allowed identification of zonal differences in IH and IKir in type I HCs, previously examined in type II HCs (Masetto and Correia, 1997; Levin and Holt, 2012).”

      Also, Horwitz et al. (2011) showed HCN channels in utricles are needed for normal balance function, so please include this reference (see line 171). 

      Done (line 184).

      (8) Fig 6A. Shows Kv1.4 staining in rat utricle but procedures for rat experiments are not described. These should be added. Also, indicate striola or extrastriola regions (if known). 

      We removed KV1.4 immunostaining from the paper, see above.

      (9) Table 6, ZD7288 is listed -was this reagent used in experiments to block Gh? If not please omit. 

      ZD7288 was used to block gH to produce a clean h-infinity curve in Figure 6, which is described in the legend.

      (10) In supplementary Fig. 5A make clear if the currents are from XE991 subtraction. Also, is the G-V data for single cell or multiple cells in B? It appears to be from 1 cell but ages P11-505 are given in legend. 

      The G-V curve in B is from XE991 subtraction, and average parameters in the figure caption are for all the KV1.8–/–  striolar type I hair cells where we observed this double Boltzmann tail G-V curve. I added detail to the figure caption to explain this better.

      (11) Supplementary Fig. 6A claims a fast activation of inward rectifier K+ channels in type II but not type I cells-not clear what exactly is measured here.

      We use “fast inward rectifier” to indicate the inward current that increases within the first 20 ms after hyperpolarization from rest (IKir, characterized in Levin & Holt, 2012) in contrast to HCN channels, which open over ~100 ms. We added panel C to show that the activation of IKir is visible in type II hair cells but not in the knockout type I hair cells that lack gK,L. IKir was a reliable cue to distinguish type I and type II hair cells in the knockout.

      For our actual measurements in Fig 6B, we quantified the current flowing after 250 ms at –124 mV because we did not pharmacologically separate IKir and IH.

      Could the XE991-sensitive current be activated and contributing?

      The XE991-sensitive current could decay (rapidly) at the onset of the hyperpolarizing step, but was not contributing to our measurement of IKir­ and IH, made after 250 ms at –124 mV, at which point any low-voltage-activated (LVA) outward rectifiers have deactivated. Additionally, the LVA XE991-sensitive currents were rare (only detected in some striolar type I hair cells) and when present did not compete with fast IKir, which is only found in type II hair cells.

      Also, did the inward rectifier conductances sustain any outward conductance at more depolarized voltage steps? 

      For the KV1.8-null mice specifically, we cannot answer the question because we did not use specific blocking agents for inward rectifiers.  However, we expect that there would only be sustained outward IR currents at voltages between EK and ~-60 mV: the foot of IKir’s I-V relation according to published data from mouse utricular hair cells – e.g., Holt and Eatock 1995, Rusch and Eatock 1996, Rusch et al. 1998, Horwitz et al., 2011, etc.  Thus, any such current would be unlikely to contaminate the residual outward rectifiers in Kv1.8-null animals, which activate positive to ~-60 mV. 

      (I-HCN is also not a problem, because it could only be outward positive to its reversal potential at ~-40 mV, which is significantly positive to its voltage activation range.)

    1. Author response:

      (1) Reviewer 1 suggested that we repeat the analyses in additional ROIs in the prefrontal cortex (PFC). We appreciate this suggestion and believe it will contribute to a comprehensive understanding of the current findings. These results will be included in the revision.

      (2) Reviewer 1 suggested that we also examine results in motor-related ROIs to rule out influences from response planning. We would like to note that our experimental design makes it unlikely that response planning would have influenced our results, as participants were unable to plan their motor responses in advance due to randomized response mapping on a trial-by-trial basis. Nevertheless, we agree with the reviewer that showing results from motor-related ROIs is important, and will include these results in the revision.

      (3) Reviewer 1 raised a question about the effect size of the results across different ROIs. In our manuscript, we tried to avoid direct comparisons of representational strength across ROIs, by focusing on the differences in representational strength between conditions within the same ROI. Nevertheless, we agree that clarifying this issue is important, which we will address in the revision.

      (4) Reviewer 2 raised a concern about the similarity between the RNN and fMRI results. We acknowledge that the complexity of our results makes it challenging to replicate all fMRI findings within a single RNN (e.g., simulating three brain regions in a single network with distinct result patterns). Nonetheless, the current RNNs effectively captured our key fMRI findings, including increased stimulus representation in frontal cortex as well as the tradeoff in category representation with varying levels of flexible control. Reviewer 2 also made several suggestions in tweaking the RNN structure and in choosing alternative analysis methods. We are happy to carry out these points as we think they could potentially increase the alignment between the two modalities.

    1. Author response:

      We are grateful to the reviewers and editors for their insightful comments. All recognized that, while mutation recurrences have been used for inferring cancer drivers, our approach has the rigor of quantitative analysis. We would like to add that, without rigorously ruling out mutational hotspots, most CDNs have not been accepted as driver mutations.

      This paper develops the theory stating that (i) recurrent point mutations are true Cancer Driving Nucleotides (CDNs); and (ii) non-recurrent mutations are unlikely to be CDNs. The reviewers question that, with the theory, we still have not discovered new driving mutations. This is done in the companion paper. Table 3 shows that, averaged across cancer types, the conventional method would identify 45 CDGs while the CDN method tallies 258 CDGs. The power of the CDN method in identifying new driver genes is evident.

      The second question is "By this theory, will we be able discover most CDNs when the sample size increases from ~ 1000 to 10,000?" This is a question of forecast and can be partially answered using GENIE data. Fig. 7 of this study shows that, when n increases from ~ 1000 to ~ 9,000, the numbers of discovered CDNs increase by 3 – 5 fold, most of which come from the two-hit class, as expected.

      Fig. 7 also addresses the queries whether we have used datasets other than TCGA. We indeed have used all public data, including GENIE, ICGC and other integrated resources such as COSMIC. For the main study, we rely on TCGA because it is unbiased for estimating the probability of CDN occurrences. In many datasets, the numerators are given but the denominators are not (the number of patients with the mutation / the total number of patients surveyed). 

      The third question is about mutation recurrences among cancer types. As stated by one reviewer, "different cancer types have unique mutational landscapes". While this is true when the analysis is done at the whole-gene level, one gets a different picture at the nucleotide level where the resolution is much higher. The pan-cancer trend of point mutations is evident in Fig. 4 of the companion paper.

      Again, we heartily appreciate the criticisms and suggestions of the reviewers and editors!

    1. Author response:

      The following is the authors’ response to the original reviews.

      Reviewer #1 (Public Review):

      [...] Overall the manuscript is well written, and the successful generation of the new endogenous Cac tags (Td-Tomato, Halo) and CaBeta, stj, and stolid genes with V5 tags will be powerful reagents for the field to enable new studies on calcium channels in synaptic structure, function, and plasticity. There are also some interesting, though not entirely unexpected, findings regarding how Brp and homeostatic plasticity modulate calcium channel abundance. However, a major concern is that the conclusions about how "molecular and organization diversity generate functional synaptic heterogeneity" are not really supported by the data presented in this study. In particular, the key fact that frames this study is that Cac levels are similar at Ib and Is active zones, but that Pr is higher at Is over Ib (which was previously known). While Pr can be influenced by myriad processes, the authors should have first assessed presynaptic calcium influx - if they had, they would have better framed the key questions in this study. As the authors reference from previous studies, calcium influx is at least two-fold higher per active zone at Is over Ib, and the authors likely know that this difference is more than sufficient to explain the difference in Pr at Is over Ib. Hence, there is no reason to invoke differences in "molecular and organization diversity" to explain the difference in Pr, and the authors offer no data to support that the differences in active zone structure at Is vs Ib are necessary for the differences in Pr. Indeed, the real question the authors should have investigated is why there are such differences in presynaptic calcium influx at Is over Ib despite having similar levels/abundance of Cac. This seems the real question, and is all that is needed to explain the Pr differences shown in Fig. 1. The other changes in active zone structure and organization at Is vs Ib may very well contribute to additional differences in Pr, but the authors have not shown this in the present study, and rely on other studies (such as calcium-SV coupling at Is vs Ib) to support an argument that is not necessitated by their data. At the end of this manuscript, the authors have found an interesting possibility that Stj levels are reduced at Is vs Ib, that might perhaps contribute to the difference in calcium influx. However, at present this remains speculative.

      Overall, the authors have generated powerful reagents for the field to study calcium channels and how they are regulated, but draw conclusions about active zone structure and organization contributing to functional heterogeneity that are not strongly supported by the data presented.

      Reviewer 1 raises an interesting question that we agree will form the basis of important studies. Here, we set out to address a different question, which we will work to better frame. While we and others had previously found a strong correlation between calcium channel abundance and synaptic release probability (Pr (Akbergenova et al., 2018; Gratz et al., 2019; Holderith et al., 2012; Nakamura et al., 2015; Sheng et al., 2012)), more recent studies found that calcium channel abundance does not necessarily predict synaptic strength (Aldahabi et al., 2022; Rebola et al., 2019). Our study explores this paradox and presents findings that provide an explanation: calcium channel abundance predicts Pr among individual synapses of either low-Pr type-Ib or high-Pr type-Is inputs where modulating channel number tunes synaptic strength, but does not predict Pr between the two inputs, indicating an inputspecific role for calcium channel abundance in promoting synaptic strength. Thus, we propose that calcium channel abundance predictably modulates synaptic strength among individual synapses of a single input or synapse subtype, which share similar molecular and spatial organization, but not between distinct inputs where the underlying organization of active zones differs. Consistently, in the mouse, calcium channel abundance correlates strongly with release probability specifically when assessed among homogeneous populations of connections (Aldahabi et al., 2022; Holderith et al., 2012; Nakamura et al., 2015; Rebola et al., 2019; Sheng et al., 2012).

      As Reviewer 1 notes, the two-fold difference in calcium influx at type-Is synapses is certainly an important difference underlying three-fold higher Pr. However, growing evidence indicates that calcium influx alone, like calcium channel abundance, does not reliably predict synaptic strength between inputs. For example, Rebola et al. (2019) compared cerebellar synapses formed by granule and stellate cells and found that lower Pr granule synapses exhibit both higher calcium channel abundance and calcium influx. In another example, Aldahabi et al. (2023) demonstrate that even when calcium influx is greater at high-Pr synapses, it does not necessarily explain differences in synaptic strength between inputs. Studying excitatory hippocampal CA1 synapses onto distinct interneuronal targets, they found that raising calcium entry at low-Pr inputs to high-Pr synapse levels is not sufficient to increase synaptic strength to high-Pr synapse levels. Similarly, at the Drosophila NMJ, the finding that type-Ib synapses exhibit loose calcium channel-synaptic vesicle coupling whereas type-Is synapses exhibit tight coupling suggests factors beyond calcium influx also contribute to differences in Pr between the two inputs (He et al., 2023). Consistently, a two-fold increase in external calcium does not induce a three-fold increase in release at low-Pr type-Ib synapses (He et al., 2023). Thus, upon finding that calcium channel abundance is similar at type-Ib and -Is synapses, we focused on identifying differences beyond calcium channel abundance and calcium influx that might contribute their distinct synaptic strengths. We agree that these studies, ours included, cannot definitively determine the contribution of identified organizational differences to distinct release probabilities because it is not currently possible to specifically alter subsynaptic organization, and will ensure that our language is tempered accordingly. However, in addition to the studies cited above and our findings, recent work demonstrating that homeostatic potentiation of neurotransmitter release is accompanied by greater spatial compaction of multiple active zone proteins (Dannhauser et al., 2022; Mrestani et al., 2021) and decreased calcium channel mobility (Ghelani et al., 2023) provide support for the interpretation that subsynaptic organization is a key parameter for modulating Pr.

      Reviewer #2 (Public Review):

      The authors aim to investigate how voltage-gated calcium channel number, organization, and subunit composition lead to changes in synaptic activity at tonic and phasic motor neuron terminals, or type Is and Ib motor neurons in Drosophila. These neuron subtypes generate widely different physiological outputs, and many investigations have sought to understand the molecular underpinnings responsible for these differences. Additionally, these authors explore not only static differences that exist during the third-instar larval stage of development but also use a pharmacological approach to induce homeostatic plasticity to explore how these neuronal subtypes dynamically change the structural composition and organization of key synaptic proteins contributing to physiological plasticity. The Drosophila neuromuscular junction (NMJ) is glutamatergic, the main excitatory neurotransmitter in the human brain, so these findings not only expand our understanding of the molecular and physiological mechanisms responsible for differences in motor neuron subtype activity but also contribute to our understanding of how the human brain and nervous system functions.

      The authors employ state-of-the-art tools and techniques such as single-molecule localization microscopy 3D STORM and create several novel transgenic animals using CRISPR to expand the molecular tools available for exploration of synaptic biology that will be of wide interest to the field. Additionally, the authors use a robust set of experimental approaches from active zone level resolution functional imaging from live preparations to electrophysiology and immunohistochemical analyses to explore and test their hypotheses. All data appear to be robustly acquired and analyzed using appropriate methodology. The authors make important advancements to our understanding of how the different motor neuron subtypes, phasic and tonic-like, exhibit widely varying electrical output despite the neuromuscular junctions having similar ultrastructural composition in the proteins of interest, voltage gated calcium channel cacophony (cac) and the scaffold protein Bruchpilot (brp). The authors reveal the ratio of brp:cac appears to be a critical determinant of release probability (Pr), and in particular, the packing density of VGCCs and availability of brp. Importantly, the authors demonstrate a brp-dependent increase in VGCC density following acute philanthotoxin perfusion (glutamate receptor inhibitor). This VGCC increase appears to be largely responsible for the presynaptic homeostatic plasticity (PHP) observable at the Drosophila NMJ. Lastly, the authors created several novel CRISPRtagged transgenic lines to visualize the spatial localization of VGCC subunits in Drosophila. Two of these lines, CaBV5-C and stjV5-N, express in motor neurons and in the nervous system, localize at the NMJ, and most strikingly, strongly correlate with Pr at tonic and phasic-like terminals.

      (1) The few limitations in this study could be addressed with some commentary, a few minor follow-up analyses, or experiments. The authors use a postsynaptically expressed calcium indicator (mhcGal4>UAS -GCaMP) to calculate Pr, yet do not explore the contribution that glutamate receptors, or other postsynaptic contributors (e.g. components of the postsynaptic density, PSD) may contribute. A previous publication exploring tonic vs phasic-like activity at the drosophila NMJ revealed a dynamic role for GluRII (Aponte-Santiago et al, 2020). Could the speed of GluR accumulation account for differences between neuron subtypes?

      We did observe that GCaMP signals are higher at type Is synapses, where synapses tend to form later but GluRs accumulate more rapidly upon innervation (Aponte-Santiago et al., 2020). However, because we are using our GCaMP indicator as a plus/minus readout of synaptic vesicle release at mature synapses, we do not expect differences in GluR accumulation to have a significant effect on our measures. Consistently, the difference in Pr we observe between type-Ib and -Is inputs (Fig. 1C) is similar to that previously reported (He et al., 2023; Lu et al., 2016; Newman et al., 2022).

      (2) The observation that calcium channel density and brp:cac ratio as a critical determinant of Pr is an important one. However, it is surprising that this was not observed in previous investigations of cac intensity (of which there are many). Is this purely a technical limitation of other investigations, or are other possibilities feasible? Additionally, regarding VGCC-SV coupling, the authors conclude that this packing density increases their proximity to SVs and contributes to the steeper relationship between VGCCs and Pr at phasic type Is. Is it possible that brp or other AZ components could account for these differences. The authors possess the tools to address this directly by labeling vesicles with JanellaFluor646; a stronger signal should be present at Is boutons. Additionally, many different studies have used transmission electron microscopy to explore SVs location to AZs (t-bars) at the Drosophila NMJ.

      To date, the molecular underpinnings of heterogeneity in synaptic strength have primarily been investigated among individual type-Ib synapses. However, a recent study investigating differences between type-Ib and -Is synapses also found that the Cac:Brp ratio is higher at type-Is synapses (He et al., 2023).

      At this point, we do not know which active zone components are responsible for the organizational (Figs. 1, 2) and coupling (now demonstrated by He et al., 2023) differences between type-Ib and -Is synapses or what establishes the differences in active zone protein levels we observe (Figs. 3,6), although Brp likely plays a local role. We find that Brp is required for dynamically regulating calcium channel levels during homeostatic plasticity and plays distinct roles at type-Ib and -Is synapses (Figs. 3, 4). Brp regulates a number of proteins critical for the distribution of docked synaptic vesicles near T bars of type Ib active zones, including Unc13 (Bohme et al., 2016). Extending these studies to type-Is synapses will be of great interest.

      (3) In reference to the contradictory observations that VGCC intensity does not always correlate with, or determine Pr. Previous investigations have also observed other AZ proteins or interactors (e.g. synaptotagmin mutants) critically control release, even when the correlation between cac and release remains constant while Pr dramatically precipitates.

      This is an important point as a number of molecular and organizational differences between high- and low-Pr synapses certainly contribute to baseline functional differences. The other proteins we (Figs. 3,6) and others (Dannhauser et al., 2022; Ehmann et al., 2014; He et al., 2023; Jetti et al., 2023; Mrestani et al., 2021; Newman et al., 2022) have investigated are less abundant and/or more densely organized at type-Is synapses. Investigating additional active zone proteins, including synaptic proteins, and determining how these factors combine to yield increased synaptic strength are important next steps.

      (4) To confirm the observations that lower brp levels results in a significantly higher cac:brp ratio at phasic-like synapses by organizing VGCCs; this argument could be made stronger by analyzing their existing data. By selecting a population of AZs in Ib boutons that endogenously express normal cac and lower brp levels, the Pr from these should be higher than those from within that population, but comparable to Is Pr. I believe the authors should also be able to correlate the cac:brp ratio with Pr from their data set generally; to determine if a strong correlation exists beyond their observation for cac correlation.

      We do not have simultaneous measures of Pr and Cac and Brp abundance. However, our findings suggest that distinct Cac:Brp ratios at type Ib and Is inputs reflect underlying organizational differences that contribute to distinct release probabilities between the two synaptic subtypes. In contrast, within either synaptic subtype, release probability is positively correlated with both Cac and Brp levels. Thus, the mechanisms driving functional differences between synaptic subtypes are distinct from those driving functional heterogeneity within a subtype, so we do not expect Cac:Brp ratio to correlate with Pr among individual type-Ib synapses. We will work to clarify this point in the revised text.

      (5) For the philanthotoxin induced changes in cac and brp localization underlying PHP, why do the authors not show cac accumulation after PhTx on live dissected preparations (i.e. in real time)? This also be an excellent opportunity to validate their brp:cac theory. Do the authors observe a dynamic change in brp:cac after 1, or 5 minutes; do Is boutons potentiate stronger due to proportional increases in cac and brp? Also regarding PhTx-induced PHP, their observations that stj and α2δ-3 are more abundant at Is synapses, suggests that they may also play a role in PhTx induced changes in cac. If either/both are overexpressed during PhTx, brp should increase while cac remains constant. These accessory proteins may determine cac incorporation at AZs.

      As we have previously followed Cac accumulation in live dissected preparations and found that levels increase proportionally across individual synapses (Gratz et al., 2019), we did not attempt to repeat these challenging experiments at smaller type-Is synapses. We will reanalyze our data to investigate Cac:Brp ratio at individual active zones post PhTx. However, as noted above, we do not expect changes in the Cac:Brp ratio to correlate with Pr among individual synapses of single inputs as this measure reflects organization differences between inputs and PhTx induces an increase in the abundance of both proteins at both inputs.

      Determining the effect of PhTx on Stj levels at type-Ib and -Is active zones is an excellent idea and might provide insight into how lower Stj levels correlate with higher Pr at type-Is synapses. While prior studies have demonstrated critical roles for Stj in regulating Cac accumulation during development and in promoting presynaptic homeostatic potentiation (Cunningham et al., 2022; Dickman et al., 2008; Kurshan et al., 2009; Ly et al., 2008; Wang et al., 2016), its regulation during PHP has not been investigated.

      Taken together this study generates important data-driven, conceptional, and theoretical advancements in our understanding of the molecular underpinnings of different motor neurons, and our understanding of synaptic biology generally. The data are robust, thoroughly analyzed, appropriately depicted. This study not only generates novel findings but also generated novel molecular tools which will aid future investigations and investigators progress in this field.

      References

      Akbergenova, Y., K.L. Cunningham, Y.V. Zhang, S. Weiss, and J.T. Littleton. 2018. Characterization of developmental and molecular factors underlying release heterogeneity at Drosophila synapses. eLife. 7.

      Aldahabi, M., F. Balint, N. Holderith, A. Lorincz, M. Reva, and Z. Nusser. 2022. Different priming states of synaptic vesicles underlie distinct release probabilities at hippocampal excitatory synapses. Neuron. 110:4144-4161 e4147.

      Aponte-Santiago, N.A., K.G. Ormerod, Y. Akbergenova, and J.T. Littleton. 2020. Synaptic Plasticity Induced by Differential Manipulation of Tonic and Phasic Motoneurons in Drosophila. The Journal of neuroscience : the official journal of the Society for Neuroscience. 40:6270-6288.

      Bohme, M.A., C. Beis, S. Reddy-Alla, E. Reynolds, M.M. Mampell, A.T. Grasskamp, J. Lutzkendorf, D.D. Bergeron, J.H. Driller, H. Babikir, F. Gottfert, I.M. Robinson, C.J. O'Kane, S.W. Hell, M.C. Wahl, U. Stelzl, B. Loll, A.M. Walter, and S.J. Sigrist. 2016. Active zone scaffolds differentially accumulate Unc13 isoforms to tune Ca(2+) channel-vesicle coupling. Nature neuroscience. 19:1311-1320.

      Cunningham, K.L., C.W. Sauvola, S. Tavana, and J.T. Littleton. 2022. Regulation of presynaptic Ca(2+) channel abundance at active zones through a balance of delivery and turnover. Elife. 11.

      Dannhauser, S., A. Mrestani, F. Gundelach, M. Pauli, F. Komma, P. Kollmannsberger, M. Sauer, M. Heckmann, and M.M. Paul. 2022. Endogenous tagging of Unc-13 reveals nanoscale reorganization at active zones during presynaptic homeostatic potentiation. Front Cell Neurosci. 16:1074304.

      Dickman, D.K., P.T. Kurshan, and T.L. Schwarz. 2008. Mutations in a Drosophila alpha2delta voltage gated calcium channel subunit reveal a crucial synaptic function. The Journal of neuroscience : the official journal of the Society for Neuroscience. 28:31-38.

      Ehmann, N., S. Van De Linde, A. Alon, D. Ljaschenko, X.Z. Keung, T. Holm, A. Rings, A. Diantonio, S. Hallermann, U. Ashery, M. Heckmann, M. Sauer, and R.J. Kittel. 2014. Quantitative super-resolution imaging of Bruchpilot distinguishes active zone

      states. Nature Communications. 5.

      Ghelani, T., M. Escher, U. Thomas, K. Esch, J. Lützkendorf, H. Depner, M. Maglione, P. Parutto, S. Gratz, T. Matkovic-Rachid, S. Ryglewski, A.M. Walter, D. Holcman, K. O‘Connor Giles, M. Heine, and S.J. Sigrist. 2023. Interactive nanocluster compaction of the ELKS scaffold and Cacophony Ca<sup>2+</sup> channels drives sustained active zone potentiation. Science Advances. 9:eade7804.

      Gratz, S.J., P. Goel, J.J. Bruckner, R.X. Hernandez, K. Khateeb, G.T. Macleod, D. Dickman, and K.M. O'Connor-Giles. 2019. Endogenous tagging reveals differential regulation of Ca<sup>2+</sup> channels at single AZs during presynaptic homeostatic potentiation and depression. The Journal of Neuroscience:3068-3018.

      He, K., Y. Han, X. Li, R.X. Hernandez, D.V. Riboul, T. Feghhi, K.A. Justs, O. Mahneva, S. Perry, G.T. Macleod, and D. Dickman. 2023. Physiologic and Nanoscale Distinctions Define Glutamatergic Synapses in Tonic vs Phasic Neurons. The Journal of neuroscience : the official journal of the Society for Neuroscience. 43:4598-4611.

      Holderith, N., A. Lorincz, G. Katona, B. Rózsa, A. Kulik, M. Watanabe, and Z. Nusser. 2012. Release probability of hippocampal glutamatergic terminals scales with the size of the active zone. Nature neuroscience. 15:988-997.

      Jetti, S.K., A.B. Crane, Y. Akbergenova, N.A. Aponte-Santiago, K.L. Cunningham, C.A. Whittaker, and J.T. Littleton. 2023. Molecular Logic of Synaptic Diversity Between Drosophila Tonic and Phasic Motoneurons. bioRxiv:2023.2001.2017.524447.

      Kurshan, P.T., A. Oztan, and T.L. Schwarz. 2009. Presynaptic alpha2delta-3 is required for synaptic morphogenesis independent of its Ca2+-channel functions. Nature neuroscience. 12:1415-1423.

      Lu, Z., A.K. Chouhan, J.A. Borycz, Z. Lu, A.J. Rossano, K.L. Brain, Y. Zhou, I.A. Meinertzhagen, and G.T. Macleod. 2016. High-Probability Neurotransmitter Release Sites Represent an Energy-Efficient Design. Current biology : CB. 26:2562-2571.

      Ly , C.V., C.-K. Yao , P. Verstreken , T. Ohyama , and H.J. Bellen 2008. straightjacket is required for the synaptic stabilization of cacophony, a voltage-gated calcium channel α1 subunit. Journal of Cell Biology. 181:157-170.

      Mrestani, A., M. Pauli, P. Kollmannsberger, F. Repp, R.J. Kittel, J. Eilers, S. Doose, M. Sauer, A.-L. Sirén, M. Heckmann, and M.M. Paul. 2021. Active zone compaction correlates with presynaptic homeostatic potentiation. Cell Reports. 37:109770.

      Nakamura, Y., H. Harada, N. Kamasawa, K. Matsui, Jason S. Rothman, R. Shigemoto, R.A. Silver, David A. DiGregorio, and T. Takahashi. 2015. Nanoscale Distribution of Presynaptic Ca2+ Channels and Its Impact on Vesicular Release during Development. Neuron. 85:145-158.

      Newman, Z.L., D. Bakshinskaya, R. Schultz, S.J. Kenny, S. Moon, K. Aghi, C. Stanley, N. Marnani, R. Li, J. Bleier, K. Xu, and E.Y. Isacoff. 2022. Determinants of synapse diversity revealed by superresolution quantal transmission and active zone imaging. Nature Communications. 13:229.

      Rebola, N., M. Reva, T. Kirizs, M. Szoboszlay, A. Lőrincz, G. Moneron, Z. Nusser, and D.A. Digregorio. 2019. Distinct Nanoscale Calcium Channel and Synaptic Vesicle Topographies Contribute to the Diversity of Synaptic Function. Neuron. 104:693-710.e699.

      Sheng, J., L. He, H. Zheng, L. Xue, F. Luo, W. Shin, T. Sun, T. Kuner, D.T. Yue, and L.-G. Wu. 2012. Calcium-channel number critically influences synaptic strength and plasticity at the active zone. Nature neuroscience. 15:998-1006.

      Wang, T., R.T. Jones, J.M. Whippen, and G.W. Davis. 2016. alpha2delta-3 Is Required for Rapid Transsynaptic Homeostatic Signaling. Cell Rep. 16:2875-2888.

      Reviewer #1 (Recommendations For The Authors): 

      Major points: 

      (1) A central question regarding VGCC differences at Is vs Ib active zones is why is calcium influx higher at Is active zones compared to Ib. Ideally, the authors would have started this study by showing correlations between Cac abundance, presynaptic calcium influx, and Pr at Is vs Ib active zones. If they had, they would likely find that Cac abundance scales with calcium influx and Pr within Is vs Ib, but that calcium influx is over two-fold enhanced at Is over Ib when normalized to the same Cac abundance. This is more than sufficient to explain the Pr differences, so the rest of the study should have focused on revealing why influx is different at Is over Ib despite an apparently similar level of Cac abundance. Then the examination of CaBeta, Stj, etc could have been used to help explain this conundrum. 

      A lesson might be gleaned in how to structure this narrative from the Rebola 2019 study, which the authors cite and discuss at length. Similar to the current study, that paper started with two synapses ("strong" vs "weak") and sought to explain why they were so different in synaptic strength. First, they examined presynaptic calcium influx, and surprisingly found that the strong synapse had reduced calcium influx compared to the weak. Then the rest of the paper sought to explain why synaptic strength (Pr) was higher at the strong synapse despite reduced calcium influx. The authors do not use this logical flow and narrative in the present study, despite the focus being on how Cav2 channels contribute to strong vs weak synapses - and the primary function of Cav2 channels is to pass calcium at active zones to drive vesicle fusion. 

      Although the authors did not show that presynaptic calcium influx is higher at Is vs Ib active zones in the current manuscript, other studies have previously established that calcium influx is two-fold higher at Is active zones vs Ib (as the authors cite). Rather than focusing so much on Pr at Is vs Ib active zones, which as the authors know can be influenced by myriad differences, it seems the more relevant parameter to study is simply to address presynaptic calcium influx at Is vs Ib, which is the primary function of Cac. Put more simply, if Cac levels are the same at Is vs Ib active zones, why is calcium influx at least two-fold higher at Is? 

      It would therefore seem crucial for the authors to determine presynaptic calcium influx levels (ideally at individual AZs) to really understand how Cac intensity levels correlate with calcium influx. The authors instead map Pr at individual AZs, but as the authors know there are many variables that influence whether a SV releases in addition to calcium influx. There are a number of options for this kind of imaging in Drosophila, including genetically encoded calcium indicators targeted to active zones. But since several studies have previously established that influx is higher at Is active zones over Ib, this may not be necessary. That being said, there is a lot of value in quantitatively analyzing Cac/Stj/CaBeta abundance, calcium influx, and Pr together at individual active zones.

      We appreciate the perspective that we could have focused on why Ca2+ influx is 2x greater at type Is active zones, which we agree is an important and interesting question. However, growing evidence indicates that Ca2+ influx alone, like Ca2+ channel abundance, does not reliably predict synaptic strength between inputs. So, here we focused instead on how other differences between synapses influence Pr and contribute to synaptic heterogeneity between and/or among synapses formed by strong and weak inputs. We have changed our title and framing to better reflect this focus. 

      As Reviewer 1 notes, Rebola et al. (2019) found that lower Pr granule synapses exhibit higher Ca2+ influx (and Ca2+ channel abundance). In another example, Aldahabi et al. (2022) demonstrated that even when Ca2+ influx is greater at high-Pr synapses, it does not necessarily explain differences in synaptic strength as raising Ca2+ entry at low-Pr synapses to high-Pr synapse levels was not sufficient to increase synaptic strength to high-Pr input levels. Similar findings have been reported at tonic and phasic synapses of the Crayfish NMJ (Msghina, 1999).

      Several lines of evidence argue that factors beyond Ca2+ influx also play important roles in establishing distinct release properties at the Drosophila NMJ. A recent study using using a botulinum transgene to isolate type Ib and Is synapses for electrophysiological analysis found that increasing external [Ca2+] from physiological levels (1.8 mM) to 3 mM or even 6 mM does not result in a 3-fold increase in EPSCs or quantal content at type Ib synapses despite the prediction that the increase would be even greater given the power dependence of release on between Ca2+ concentration (He et al., 2023). The authors further found that type Ib synapses are more sensitive than type Is synapses to the slow Ca2+ chelator EGTA, indicating looser Ca2+ channel-SV coupling. 

      Consistently, we find that although VGCC levels are similar at the two inputs, their density is greater at type Is active zones (Figs. 1 and 2). Our findings also reveal additional molecular differences that may contribute to the observed differences in neurotransmitter release properties between the two inputs, including lower levels of the active zone protein Brp (Fig 3) and the auxiliary subunit α2δ-3/Stj (Fig. 6) at high Pr type Is inputs. In contrast, levels of each of these proteins positively correlate with synaptic strength among active zones of a single input, whether low- or high-Pr (Figs. 1, 3, 6). Similarly, levels of each of these proteins increase during homeostatic potentiation of neurotransmitter release (Figs. 4 and 7). Thus, we propose that two broad mechanisms contribute to synaptic diversity in the nervous system: (1) spatial organization and relative molecular content establish distinct average basal release probabilities that differ between inputs and (2) among individual synapses of distinct inputs, coordinated modulation of Ca2+ channel and active zone protein abundance independently tunes Pr. These intersecting mechanisms provide a framework for understanding the extensive and dynamic synaptic diversity observed across nervous systems.

      (2) In addition to key points made above, it seems the authors should at least consider (if not experimentally test) what other differences might contribute to the higher calcium influx at Is over Ib:  

      - Distinct splice isoforms of Cac (and/or Stj/Cabeta): The recent RNAseq analysis of gene expression at Is vs Ib motor neurons from Troy Littleton's group may inform this consideration? 

      - Stj reduction at Is: Do channel studies in heterologous systems give any insight into VGCC channel function with and without a2d-3? Do Cav2 channels without a2d pass more calcium? This would then offer an obvious solution to the key conundrum underlying this study. 

      These are excellent questions that we are actively pursuing. While there is no evidence of differentially expressed splice isoforms of Stj or Ca-β in the recent RNA-seq data from Jetti et al., 2023, subtle changes in Cac isoform usage were observed that may contribute to differences in Ca2+ influx. In heterologous systems, α2δ expression generally increases Ca2+ channel membrane insertion and  Ca2+ currents. However, in vivo α2δ’s can also mediate extracellular interactions that may modulate channel function. We address these points in greater detail in the revised discussion.  

      (3) Assess Stj and CaBeta levels at AZs after PhTx: The successful generation of endogenously tagged Stj and CaBeta enables some relatively easy experiments that would be of interest, similar to what the authors present for Cac. Does Brp similarly control Stj and CaBeta at Is vs Ib compared to what they show for Cac? In addition, does homeostatic plasticity similarly change Stj and CaBeta at Is vs Ib compared to what the authors have shown for Cac? i.e., do they both similarly increase in intensity, by the same amount, as Cac? 

      We agree and have included an analysis of α2δ-3/Stj levels following PhTx exposure (Fig. 7A-C). We have also investigated the regulation of Stj during chronic presynaptic homeostatic potentiation (Fig. 7D-F). In both cases, StjV5-N levels significantly increase at type Ib and Is active zones, consistent with our finding that among AZs of either type Ib or Is inputs, Stj levels correlate with Cac abundance and, thus, Pr. Together with our and others’ findings, this suggests that coordinated increases Ca2+ channel, auxiliary subunit,  and active zone protein abundance positively tunes synaptic strength at diverse synaptic subtypes.

      Minor points: 

      (1) Including line numbers would make reviewing/commenting easier. 

      We apologize for this oversight and have added line numbers to the revised manuscript.

      (2) Fig. 2I: It is not apparent what the mean cluster density is between Ib vs Is (as it is in Fig. 2F-H graphs). The mean and error bars should be included in 2I as it is in 2G. Same with Fig. 3C. 

      Thank you for pointing this out. We have added error bars to the paired analysis in 2I as well as in 3C and 1C.

      (3) Fig. 4 - it might make more sense to normalize Brp and Cac intensity as a percentage of baseline (PhTx at Is or Ib) rather than normalizing everything to control Ib. 

      We have revised the graphs as suggested in Figure 4 and throughout.

      (4) Page 5 bottom - REFS missing after Fig. 1E. 

      Thank you for catching this. We have fixed it.

      Reviewer #2 (Recommendations For The Authors): 

      This reader found differentiating between low Pr sites (deep purple) and cac measurements (black) difficult in Fig 1B. You may consider depicting this differently. 

      Thank you for this feedback. We have changed the color scheme to improve readability.

      I found it difficult to discern the difference between experiments Fig 1E and Fig 1J. Why are individual dots distributed differently? 

      The individual data points are the same as in 1E and 1F, but we have removed the individual NMJ dimensionality to combine all Is and Ib data points together along with best fit lines for comparison of their slopes. We have added text to the revised manuscript to clarify this.

      Results section, second paragraph, add references, remove 'REF': We next investigated the correlation between Pr and VGCC levels and found that at type Is inputs, single-AZ Cac intensity positively correlates with Pr (Fig. 1E; REFS). 

      Thank you. We have corrected this error.

    1. Author response:

      Reviewer #1 (Public Review):

      Greter et al. provide an interesting and creative use of lactulose as a "microbial metabolism" inducer, combined with tracking of H2 and other fermentation end products. The topic is timely and will likely be of broad interest to researchers studying nutrition, circadian rhythm, and gut microbiota. However, a couple of moderate to major concerns were noted that may impact the interpretation of the current data:

      (1)  Much of the data relies on housing gnotobiotic mice in metabolic cages, but I couldn't find any details of methods to assess contamination during multiple days of housing outside of gnotobiotic isolators/cages. Given the complexity of the metabolic cage system used, sterility would likely be incredibly challenging to achieve. More details needed to be included about how potential contamination of the mice was assessed, ideally with 16S rRNA gene sequencing data of the endpoint samples and/or qPCR for total colonization levels relative to the more targeted data shown.

      We thank the reviewer for pointing out that we have not made the experimental setup clear in the text. One of the unique features of our metabolic cage setup is that the mice do not need to be housed outside gnotobiotic isolators, but that the whole system is placed inside an isolator. We have developed and published this system recently (Hoces et al, PLOS Biol 2022), including extensive testing for sterility/gnotobiosis. We will improve clarity in a revised version.

      Given that 16S sequencing of germ-free mice will typically produce false positive reads, we used Blautia pseudococcoides as an indicator strain for contaminations. This strain is present in our SPF mouse colony, forms spores that are highly resilient to decontamination measures, and has been the most likely contaminant in our gnotobiotic system. We have checked for presence of this strain in the cecum content of all our animals at the end of each experiment, and only included experiments which had a B. pseudococcoides signal below threshold level.

      (2)  The language could be softened to provide a more nuanced discussion of the results. While lactulose does seem to induce microbial metabolism it also could have direct effects on the host due to its osmotic activity or other off-target effects. Thus, it seems more precise to just refer to lactulose specifically in the figure titles and relevant text. Additionally, the degree to which lactulose "disrupts the diurnal rhythm" isn't clear from the data shown, especially given that the markers of circadian rhythm rapidly recover from the perturbation. It is probably more precise to instead state that lactulose transiently induces fermentation during the light phase or something to that effect. The discussion could also be expanded to address what methods are available or could be developed to build upon the concepts here; for example, the use of genetic inducers of metabolism which may avoid the more complex responses to lactulose.

      The point about language is well taken. We tried to make the argument that what we call disruption of the diurnal rhythm is acute, meaning that it is not disrupting the rhythm "chronically" (i.e., for longer), but that it recovers rapidly from this transient disruption. Given the confusion this wording is causing we are rephrasing this in a new version of the manuscript.

      We also appreciate the mention of concepts from our study that can be built on in future studies, and we will add a paragraph on potential further research.

      Despite these concerns, this was still an intriguing and valuable addition to the growing literature on the interface of the microbiome and circadian fields.

      We thank the reviewer for all their encouraging and constructive remarks!

      Reviewer #2 (Public Review):

      Summary:

      The authors aimed to investigate how microbial metabolites, such as hydrogen and short-chain fatty acids (SCFAs), influence feeding behavior and circadian gene expression in mice.

      Specifically, they sought to understand these effects in different microbial environments, including a reduced community model (EAM), germ-free mice, and SPF mice. The study was designed to explore the broader relationship between the gut microbiome and host circadian rhythms, an area that is not well understood. Through their experiments, the authors hoped to elucidate how microbial metabolism could impact circadian clock genes and feeding patterns, potentially revealing new mechanisms of gut microbiome-host interactions.

      Strengths:

      The manuscript presents a well-executed investigation into the complex relationship between microbial metabolites and circadian rhythms, with a particular focus on feeding behavior and gene expression in different mouse models. One of the major strengths of the work lies in its innovative use of a reduced community model (EAM) to isolate and examine the effects of specific microbial metabolites, which provides valuable insights into how these metabolites might influence host behavior and circadian regulation. The study also contributes to the broader understanding of the gut microbiome's role in circadian biology, an area that remains poorly understood. The experiments are thoughtfully designed, with a clear rationale that ties together the gut microbiome, metabolic products, and host physiological responses. The authors successfully highlight an intriguing paradox: the significant influence of microbial metabolites in the EAM model versus the lack of effect in germ-free and SPF mice, which adds depth to the ongoing exploration of microbial-host interactions. Despite some methodological concerns, the manuscript offers compelling data and opens up new avenues for research in the field of microbiome and circadian biology.

      We thank the reviewer for their encouraging remarks, specifically on the surprising findings that microbial metabolism seems to affect circadian clock gene expression and behavior differently in EAM and SPF mice.

      Weaknesses:

      The manuscript, while providing valuable insights, has several methodological weaknesses that impact the overall strength of the findings. First, the process for stool collection lacks clarity, raising concerns about potential biases, such as the risk of coprophagia, which could affect the dry-to-wet weight ratio analysis and compromise the validity of these measurements.

      We thank the reviewer for pointing out that our description of the specific methods used for collecting feces were presented in a somewhat confusing manner. In short, dry and wet fecal weights were determined based on fecal pellets that were freshly produced and directly collected from restrained mice. To determine total fecal output over time, we collected all fecal pellets produced in a 5 hour window in a cage, determined their dry weight, and then used the water content determined for fresh feces to calculate wet weight. Using this method, we cannot account for potential differences in coprophagia between the groups. However, this is not likely to affect the dry-to-wet ratio of fecal output in our results.

      Additionally, the use of the term "circadian" in some contexts appears inaccurate, as "diurnal" might be more appropriate, especially given the uncertainty regarding whether the observed microbiome fluctuations are truly circadian.

      Similarly to our answer to reviewer 1 above, we appreciate this remark about imprecise language and have addressed this issue in the text. Indeed, we do not think the microbiota fluctuations are truly circadian, but likely a result of the entrainment through the host's food intake.

      Another significant issue is the unexpected absence of an osmotic effect of lactulose in EAM mice, which contradicts the known properties of lactulose as an osmotic laxative. This finding requires further verification, including the use of a positive control, to ensure it is not artifactual.

      This is a good point. We have used this lactulose dosage specifically to induce microbial metabolism without causing osmotic diarrhea, and went to some lengths do demonstrate this. In response to this comment (and one by reviewer 3 below about transit time), we are planning an experiment that will use a higher lactulose dose as a positive control.

      The presentation of qRT-PCR data as log2-fold changes, with a mean denominator, could introduce bias by artificially reducing variability, potentially leading to spurious findings or increased risk of Type I error. This approach may explain the unexpected activation of both the positive and negative limbs of the circadian clock.

      While we agree that our description of the qpcr method used for measuring circadian clock gene expression was lacking detail, we do not see how log2-fold changes (as opposed to, e.g., fold change) would lead to an increased risk of Type 1 error. We did not use a mean denominator for analyzing the data but used the house-keeping data for the same sample as denominator for the respective circadian clock genes. This will be described more clearly in a revised methods section.

      Moreover, the lack of detailed information on the primers and housekeeping genes used in the experiments is concerning, particularly given the importance of using non-circadian housekeeping genes for accurate normalization.

      We apologize for this omission, it seems like the resource table got lost in the submission, leading to missing information. It will be included in the revised manuscript.

      The methods for measuring metabolic hormones, such as GLP-1 and GIP, are also not adequately described. If DPP-IV/protease inhibitor tubes were not used, the data could be unreliable due to the rapid degradation of these hormones by circulating proteases.

      We thank the reviewer for spotting this mistake. We will add details of how GLP-1 and GIP were measured to the methods section. While we did not use DPP-IV/protease inhibitor tubes, we added the inhibitors to the syringes when sampling blood, leading to the same effect.

      Finally, the manuscript does not address the collection of hormone levels during both fasting and fed phases, a critical aspect for interpreting the metabolic impact of microbial metabolites.

      We agree that it will be interesting to measure hormone levels also in the fed phase, and we will include this data in a revised version of the manuscript. Even with that data, a more thorough examination of hormone levels over the diurnal cycle, as suggested by reviewer 3, might be relevant for a full-scale follow-up. Given our data, we of course cannot exclude that there may be time-point-specific differences and therefore have softened the language around this conclusion to state that hormone levels are not acutely changed after a lactulose intervention “at the time-points examined”.

      These methodological concerns collectively weaken the robustness of the study's results and warrant careful reconsideration and clarification by the authors.

      Because of these weaknesses, the authors have partially achieved their aims by providing novel insights into the relationship between microbial metabolites and host circadian rhythms. The data do suggest that microbial metabolites can significantly influence feeding behavior and circadian gene expression in specific contexts. However, the unexpected absence of an osmotic effect of lactulose, the potential biases introduced by the log2-fold change normalization in qRT- PCR data, and the lack of clarity in critical methodological details weaken the overall conclusions. While the study provides valuable contributions to understanding the gut microbiome's role in circadian biology, the methodological weaknesses prevent a full endorsement of the authors' conclusions. Addressing these issues would be necessary to strengthen the support for their findings and fully achieve the study's aims.

      We thank the reviewer again for their careful and critical reading of our work, and for their constructive input. We hope that many of the concerns will be addressed by providing more methodological detail and additional experimental data in the revised version of our manuscript.

      Despite the methodological concerns raised, this work has the potential to make a significant impact on the field of circadian biology and microbiome research. The study's exploration of the interaction between microbial metabolites and host circadian rhythms in different microbial environments opens new avenues for understanding the complex interplay between the gut microbiome and host physiology. This research contributes to the growing body of evidence that microbial metabolites play a crucial role in regulating host behaviors and physiological processes, including feeding and circadian gene expression.

      We thank the reviewer for their encouraging remarks!

      Reviewer #3 (Public Review):

      Summary:

      In the manuscript by Greter, et al., entitled "Acute targeted induction of gut-microbial metabolism affects host clock genes and nocturnal feeding" the authors are attempting to demonstrate that an acute exposure to a non-nutritive disaccharide (lactulose) promotes microbial metabolism that feeds back onto the host to impact circadian networks. The premise of the study is interesting and the authors have performed several thoughtful experiments to dissect these relationships, providing valuable insights for the field. However, the work presented does not necessarily support some of the conclusions that are drawn. For instance, lactulose is administered during the fasting period to mimic the impact of a feeding bout on the gut microbiota, but it would be important to perform this treatment during the fed state as well to show that the effects on food intake, etc. do not occur.

      This is a good point, and we will include an experiment addressing this in a revised version of the manuscript.

      To truly draw the conclusion that the current outcomes are directly connected to and mediated via an impact on the host circadian clock, it would be ideal to perform these studies in a circadian gene knock-out animal (i.e., Cry1 or Cry2 KO mice, or perhaps Bmal-VilCre tissue- specific KO mice). If the effects are lost in these animals, this would more concretely connect the current findings to the circadian clock gene network.

      We agree that these would be interesting experiments to follow up on the question how the observed effects are actuated by host functions. However, they would require a large amount of preparatory work (including rederiving the KO mice to get them germ-free in our gnotobiotic facility), we argue that they are beyond the scope of this study.

      Despite these reservations, the work is promising.

      We thank the reviewer for their encouraging assessment.

      Strengths:

      Attempting to disentangle nutrient acquisition from microbial fermentation and its impact on diurnal dynamics of gut microbes on host circadian rhythms is an important step for providing insights into these host-microbe interactions.

      The authors utilize a novel approach in leveraging lactulose coupled with germ-free animals and metabolic cages fitted with detectors that can measure microbial byproducts of fermentation, particularly hydrogen, in real-time.

      The authors consider several interesting aspects of lactulose delivery, including how it shifts osmotic balance as well as provides calculations that attempt to explain the caloric contribution of fermentation to the animal in the context of reduced food intake. This provides interesting fundamental insights into the role of microbial outputs on host metabolism.

      Thank you!

      Weaknesses:

      While the authors have done a large amount of work to examine the osmotic vs. metabolic influence of lactulose delivery, the authors have not accounted for the enlarged cecum and increased cecal surface area in germ-free mice. The authors could consider an additional control of cecectomy in germ-free mice.

      We thank the reviewer for pointing out the potential effect of the anatomical differences of germ- free and conventionally colonized mice. We agree that when comparing germ-free mice to SPF mice, the enlarged cecum area in germ-free animals could lead to differences in water release or uptake. However, this is not the case in the gnotobiotic mice colonized with our minimal microbiota, which have comparable cecum sizes to germ-free mice, and thus comparing water transport over the cecum wall between those groups can be done without correcting for cecal surface areas. We will add information on cecum sizes in the different experimental groups to a revised version of the manuscript.

      The authors have examined GI hormones as one possible mechanism for how food intake is altered by microbial fermentation of lactulose. However, the authors measure PYY and GLP-1 only at a single time point, stating that there are no differences between groups. Given the goal of the studies is to tie these findings back into circadian rhythms, it would be important to show if the diurnal patterns of these GI hormones are altered.

      We fully agree that a deeper investigation of the diurnal fluctuations of hormone levels would be an interesting next step in studying whether perturbations in food intake can disturb these rhythms. Doing this for the whole rhythm would really require a full second study. For a revised version of this manuscript, we will add a second time-point of hormone measurements (during the fed phase) to this study. In addition, we will soften the statements made around these data to point out just that hormone level fluctuations could not be detected during specific time points after lactulose treatment, and therefore do not seem to explain the imminent behavioral changes.

      Considerations of other factors, such as conjugated vs. deconjugated bile acids, microbial bile salt hydrolase activity, and bile acid resorption, might be an important consideration for how lactulose elicits more influence on ileal circadian clock genes relative to cecum and colon.

      We absolutely agree that investigation of microbial bile acid modification and their metabolism by the host would be an interesting topic for a follow-up study.

      Measurements of GI transit time (both whole gut and regional) would be an important for consideration for how lactulose might be impacting the ileum vs. cecum vs. colon.

      This is also an interesting point, and we will add an assessment of transit time to a revised version of the manuscript.

    1. Author response:

      General comment:

      "This important study examined neuronal activity in the dentate nucleus of the cerebellum when monkeys performed a difficult perceptual decision-making task. The authors provide convincing evidence that the cerebellum represents sensory, motor, and behavioral outcome signals that are sent to the attentional system, but further analysis focusing on the disparity of performance between animals would improve the quality of the paper. This paper is of great general interest in that it shows the involvement of the cerebellum in cognitive processes at the neuronal level."

      We thank you for these general comments, and we agree with all of them. 

      Public Reviews (Reviewer #1):

      Summary:

      Recordings were made from the dentate nucleus of two monkeys during a decision-making task. Correlates of stimulus position and stimulus information were found to varying degrees in the neuronal activities. 

      We agree with this summary.

      Strengths:

      A difficult decision-making task was examined in two monkeys.

      We agree with this statement.

      Weaknesses:

      One of the monkeys did not fully learn the task. The manuscript lacked a coherent hypothesis to be tested, and no attempt was made to consider the possibility that this part of the brain may have little to do with the task that was being studied. 

      We understand these comments. It is correct that one of the monkeys did not fully learn the task, but it should be noted that both monkeys learned significantly above chance level, and we therefore find the recordings of both monkeys useful. We tested the hypothesis that neurons of the nucleus dentate can dynamically modulate their activity during a visual attention task, comprising not only sensorimotor but also cognitive attentional components. We agree that this hypothesis should be spelled out more explicitly in the introduction, which we will do in the revised version. We also appreciate the comment of this Reviewer that in our original submission we did not show our attempt to consider the possibility that this part of the brain may have little to do with the task that was being studied. We in fact did consider this possibility in that we applied muscimol to the dentate nucleus in one of the monkeys. The data of this one successful experiment show that the behaviour was reversibly affected in line with our hypothesis. Given that this only concerned one of the monkeys, we preferred not to present these data in the article. However, as the Reviewer correctly points out that this question remains hanging in the air, we will show them in our formal rebuttal letter. Please note that we decided to focus at the end of our research project on the tracing experiments, showing in both monkeys the connections of the dentate nucleus with the regions that are involved in attention. As a result, both monkeys have been sacrificed and we cannot expand upon our muscimol experiments anymore (which would have been useful indeed).

      Last but not least, given the comments of the Reviewers, we will also add a Supplementary figure to Figure 2, in which we will present the data for both monkeys separately and provide our interpretation. This may help to strengthen our conclusions. 

      Public Reviews (Reviewer #2):

      The authors trained monkeys to discriminate peripheral visual cues and associate them with planning future saccades of an indicated direction. At the same time, the authors recorded single-unit neural activity in the cerebellar dentate nucleus. They demonstrated that substantial fractions of DN cells exhibited sustained modulation of spike rates spanning task epochs and carrying information about stimulus, response, and trial outcome. Finally, tracer injections demonstrated this region of the DN projects to a large number of targets including several known to interconnect the visual attention network. The data compellingly demonstrate the authors' central claims, and the analyses are well-suited to support the conclusions. Importantly, the study demonstrates that DN cells convey many motor and nonmotor variables related to task execution, event sequencing, visual attention, and arguably decision-making/working memory.

      We thank the Reviewer for this positive and constructive feedback.

    1. Author response:

      We would like to thank the reviewers for their time and for their kind comments about our work. We expect that their comments will help us to improve the manuscript and so will plan the following experiments/revisions to address some of their comments:

      Reviewer 1 (Public Review):

      (1) The cutoffs the authors used to define "conditionally essential" mutants are not reported. The results also lack validation for lethality using a titratable system. It would be ideal to validate several genes in each dataset to determine cutoffs (i.e. 5-fold decrease in insertion mutants) for conditional lethality. It was not done (or described) here.

      We will report the cutoffs used when we generate the revised manuscript. Our experiments identified hundreds of lethal combinations and we have six datasets, validation of several genes from each would require generation of at least 20 depletion strains and subsequent testing of each. Validation using a depletion system would therefore be a significant undertaking and is typically not the standard when using these approaches. However, should time permit then we will attempt a subset of these experiments.

      (2) Also, two mutations that both make the cells sick could provide an additive effect (i.e. dapF and BamB), which doesn't necessarily mean the pathways are linked. The authors should revise their wording. They have not shown genetic linkage in some cases.

      We will revise the text to address this.

      (3) Mutations throughout the manuscript are not complemented. It would be ideal to add complementation data to show the gene-phenotype relationship is specific.

      We thank the reviewers for highlighting this and will complete the complementation experiments.

      (4) Also, I would argue the term "conditionally essential genes" should be replaced with "synthetically lethal". Strains were compared in the same conditions but with different genetic backgrounds.

      We take the reviewers point and will revise the text accordingly.

      Reviewer 2 (Public Review):

      Weaknesses:

      (1) An important control in any genetic interaction study is to do complementation tests to demonstrate that the phenotype observed is indeed due to the missing gene under analysis. Although the Keio library was designed to avoid polar effects, it is impossible to predict other undesirable effects of the deletions (hitting of a non-annotated sRNA or RNA stability effects, for example). Thus, before one can safely conclude that a proposed genetic interaction is real, complementation tests should be carried out. This seems particularly important in the case of a new and surprising interaction, such as that between bamB and DNA replication and repair genes.

      We thank the reviewers for highlighting this and will complete the complementation experiments.

      (2) Why not include the suppressor interactions in the work? There are probably plenty, and in principle, they should be as informative as the conditional essential (or synthetic lethal) ones. The only one highlighted in the paper is that between bamB and diaA, since it nicely fits with the synthetic lethal effects with initiation inhibitors seqA and hda. Even if the authors cannot make sense of the suppressor interactions, their inclusion in the paper should make the dataset richer and more valuable to the community.

      These data are available in supplementary table 1. However, we appreciate this is not obvious and so will make a new supplementary table and include a brief description of the data for the revised paper.

      (3) The enrichment analysis in Figure 2B deserves some clarification. What is the meaning of gene ratio? How can single genes of a pathway yield an enrichment signal? Why weren´t seqA and hda included in the DNA replication class in 2B?

      We apologise for the confusion caused and will include a description of the analysis in the methods section.

      (4) The writing puts too much emphasis on demonstrating that bam lipoproteins and chaperones are specialized instead of fully redundant. However, I have the impression this is a long-settled conclusion in the field, as the manuscript itself describes at several points when reviewing the literature.

      We will revise the text to reduce this emphasis.

      Reviewer #3 (Public Review):

      In this work, Bryant, et al. investigate genetic interactions between non-essential members of the outer membrane protein biogenesis pathway and other genes in the genome using a transposon-directed insertion sequencing (TraDIS) approach in E. coli K-12. The authors identify interactions with other components of the envelope including LPS, peptidoglycan, and enterobacterial common antigen biogenesis, and they tie these interactions to specific members of the outer membrane biogenesis pathway. Although many of these interactions are known and have been previously investigated in the field, the study provides several synthetic phenotypes that could be useful for further investigations.

      The strengths of the paper include their unbiased, TraDIS approach, and follow up on the interactions they observe. The interactions with genes of unknown function also are of interest as they may suggest experiments to find the functions of these genes. The largest weakness of this paper is the use of a gene deletion allele for bamB that is known to be polar leading to decreased expression of an essential gene. This largely invalidates all results related to DNA replication. In addition, it is a weakness that the paper does not adequately address its place in the field through discussion of existing results on the interactions they investigate.

      We appreciate the reviewers’ comments and concerns about the bamB allele, and we will address these concerns by completing complementation experiments for the CRISPRi depletion experiments and the run-out assays. However, despite the statement that it is known to be polar, several previous studies have also used the bamB Keio library strain. Many of these studies transfer the allele to a clean background and use the derivative in which the cassette has been removed as we have done here (Cox et al., 2017, Gunasinghe et al., 2018, Psonis et al., 2019, Storek et al., 2019, Ranava et al. 2021, Steenhuis et al., 2021, Thewasano et al., 2023). Therefore, we feel somewhat justified in our choice of strain.

      We are unable to find a reference for the Keio bamB strain causing polar effects and would have appreciated the reviewers’ guidance here. However, we believe the concern about polar effects stems from the observations of Ruiz et al., (2005), in which it was observed that a yfgL::ISE1 allele causes polar effects. This was hypothesised to be due to the ORF contained within the IS being transcribed in the opposite orientation to yfgL and the downstream der gene. They subsequently observed that a strain carrying a Tn5KAN-I-SceI insertion in yfgL (yfgL::kan) did not cause polar effects and this was hypothesised to be due to the kan cassette being co-oriented with yfgL. In addition, Charlson et al., 2006 generated a yfgL deletion by replacing the majority of the gene with a kan cassette in a manner similar to that of the Keio library that was subsequently flipped out. This study also found no evidence of polar effects on der. In theory, the strain used here, and in previous studies by other groups, should provide minimal disruption to transcription through generation of a mini-gene from the original bamB sequence to maintain operon expression. This is in contrast to the disruption caused by the yfgL::ISE1 allele.

      While we do appreciate the concern, several pieces of evidence lend themselves to counter the statement that our strain choice largely invalidates the results. The der GTPase is essential, hence the concern about polar effects leading to the bamB phenotypes we see. However, depletion of der leads to cold sensitivity, whereas we find that the bamB strain used here actually performs better in colder temperatures. In addition, the der depletion is sensitive to doxycycline, whereas the bamB mutant has increased fitness in this condition (Fig 1) (Bharat and Brown, 2015, Hwang and Inouye, 2008). Hence, should the mutation lead to decreased expression of der then we would expect the bamB strain to phenocopy the der depletion, which it does not. Regardless of this information, we will still address these concerns by completing complementation experiments.

    1. Author response:

      The following is the authors’ response to the original reviews.

      Reviewer #1 (Public Review):

      Weakness 1. Enhancing Reproducibility and Robustness: To enhance the reproducibility and robustness of the findings, it would be valuable for the authors to provide specific numbers of animals used in each experiment. Explicitly stating the penetrance of the rod-like neurocranial shape in dact1/2-/- animals would provide a clearer understanding of the consistency of this phenotype. 

      In Fig. 3 and Fig. 4 animal numbers were added to the figure and figure legend (line 1111). In Fig. 5 animal numbers were added to the figure. We now state that dact1/2-/- animals exhibit the rod-like neurocranial shape that is completely penetrant (Line 260). 

      Weakness 2. Strengthening Single-Cell Data Interpretation: To further validate the single-cell data and strengthen the interpretation of the gene expression patterns, I recommend the following: 

      -Provide a more thorough explanation of the rationale for comparing dact1/2 double mutants with gpc4 mutants.

      -Employ genotyping techniques after embryo collection to ensure the accuracy of animal selection based on phenotype and address the potential for contamination of wild-type "delayed" animals.

      -Supplement the single-cell data with secondary validation using RNA in situ or immunohistochemistry techniques. 

      An explanation of our rationale was added to the results section (Lines 391403) and a summary schematic was added to Figure 6 (panel A).

      Genotyping of the embryos was not possible but quality control analysis by considering the top 2000 most variable genes across the dataset showed good clustering by genotype, indicating the reproducibility of individuals in each group (See Supplemental Fig. 4).

      The gene expression profiles obtained in our single-cell data analysis for gpc4, dact1, and dact2 correlate closely with our in situ hybridization analyses. Further, our data is consistent with published zebrafish single-cell data. We validated our finding of increased capn8 expression in dact1/2 mutants by in situ hybridization. Therefore we are confident in the robustness of our single-cell data.  

      Weakness 3. Directly Investigating Non-Cell-Autonomous Effects: To directly assess the proposed non-cell-autonomous role of dact1/2, I suggest conducting transplantation experiments to examine the ability of ectodermal/neural crest cells from dact1/2 double mutants to form wild-type-like neurocranium.  

      The reviewer’s suggestion is an excellent experiment and something to consider for future work. Cell transplant experiments between animals of specific genotypes are challenging and require large numbers. It is not possible to determine the genotype of the donor and recipient embryos at the early timepoint of 1,000 cell stage where the transplants would have to be done in the zebrafish. So that each transplant will have to be carried out blind to genotype from a dact1+/-; dact2+/- or dact1-/-; dact2+/- intercross and then both animals have to be genotyped at a subsequent time point, and the phenotype of the transplant recipient be analyzed. While possible, this is a monumental undertaking and beyond the scope of the current study.

      Weakness 4. Further Elucidating Calpain 8's Role: To strengthen the evidence supporting the critical role of Calpain 8, I recommend conducting overexpression experiments using a sensitized background to enhance the statistical significance of the findings. 

      We thank the reviewer for their suggestion and have now performed capn8 overexpression experiments in embryos generated from dact1/2 double heterozygous breeding. We found a statistically significant effect of capn8 overexpression in the dact1+/-,dact2+/- fish (Lines 462-464 and Fig. 8C,D). 

      Minor Comments:  

      Comment: Creating the manuscript without numbered pages, lines, or figures makes orientation and referencing harder.  

      Revised

      Comment: Authors are inconsistent in the use of font and adverbs, which requires extra effort from the reader. ("wntIIf2 vs wnt11f2 vs wnt11f2l"; "dact1/2-/- vs dact1/dact2 -/-"; "whole-mount vs wholemount vs whole mount").  

      Revised throughout.

      Comment: Multiple sentences in the "Results" belong to the "Materials and Methods" or the "Discussion" section. 

      We have worked to ensure that sentences are within the appropriate sections of the manuscript.

      Comment: Abstract:

      "wnt11f2l" should be "wnt11f2"  

      Revised (Line 24).

      Comment: Main text:

      Page 5 - citation Waxman, Hocking et al. 2004 is used 3x without interruption any other citation. 

      Revised (Line 112).

      Page 9 - "dsh" mutant is mentioned once in the whole manuscript - is this a mistake?

      Revised, Rewritten (Line 196).

      Page 10 - Fig 2B does not show ISH.

      Revised (Line 229).

      Page 11 - "kyn" mutant is mentioned here for the first time but defined on page 15.

      Revised (Line 245). Now first described on page 4.

      Page 14 - "cranial CNN" should be CNCC.

      Revised. (Line 334)

      Page 16 - dact1/dact2/gpc4: Fig. 5C is used but it should be Fig 5E.

      Revised. (Line 381)

      Page 18 - dact1/2-/- or dact1-/-, dact2-/-. 

      Revised. (Line 428)

      Comment: Methods:

      Page 24 - ZIRC () "dot" is missing. ChopChop ")" is missing. "located near the 5' end of the gene" - In the Supplementary Figure 1 looks like in the middle of the gene.

      Revised. (Lines 600, 609, 611, respectively).

      Page 25 - WISH -not used in the main text.

      Revised. (Line 346).

      Page 26 - 4% (v/v) formaldehyde; at 4C - 4{degree sign}C; 50% (v/v) ethanol; 3% (w/v) methylcellulose.

      Revised. (Lines 659, 660, 662).

      Page 27 - 0.1% (w/v) BSA. 

      Revised. (Line 668).

      Comment: Discussion:

      The overall discussion requires more references and additional hypotheses. On page 20, when mentioning 'as single mutants develop normally,' does this refer to the entire animals or solely the craniofacial domain? Are these mutants viable? If they are, it's crucial to discuss this phenomenon in relation to prior morpholino studies and genetic compensation.

      Observing how the authors interpret previously documented changes in nodal and shh signaling would be beneficial. While Smad1 is discussed, what about other downstream genes? Is shh signaling altered in the dact1/2 double mutants? 

      We have revised the Discussion to include more references (Lines 473, 476, 483, 488, 491, 499, 501, 502, 510, 515, 529, 557, 558) and additional hypotheses (Lines 503-505, 511-519, 522-525). We have added more specific information regarding the single mutants (Lines 270-275, 480-493, Fig. S3). We have added discussion of other downstream genes, including smad1 (Lines 561-572) and shh (Lines 572-580).

      Comment: Figures:

      Appreciating differences between specimens when eyes were or were not removed is quite hard.

      Yes this was an unfortunate oversight, however, the key phenotype is the EP shown in the dissections.

      Fig 1. - wntIIf2 vs wnt11f2? C - Thisse 2001 - correct is Thisse et al. 2001.

      Revised typo in Fig 1. (And Line 1083).

      Fig 1E: These plots are hard to understand without previous and detailed knowledge. Authors should include at least some demarcations for the cephalic mesoderm, neural ectoderm, mesenchyme, and muscle. Missing color code.

      We have moved this data to supplementary figure S1 and have added labels of the relevant cell types and have added the color code.

      Comment:- Fig 2 - In the legend for C - "wildtype and dact2-/- mutant" and "dact1/2 mutant"; in the picture is dact1-/-, dact2-/-.

      Revised (Line 1105).

      Fig 2 - B - it is a mistake in 6th condition dact1: 2x +/+, heterozygote (+/-) is missing.

      Revised Figure 2B.

      Fig 4. - Typo in the legend: dact1/"t"2-/- .

      Revised. (Line 1127).

      Fig 8C - In my view, when the condition gfp mRNA says "0/197, " none of the animals show this phenotype. I assume the authors wanted to say that all the animals show this phenotype; therefore, "197/197" should be used.

      We have removed this data from the figure as there were concerns by the reviewers regarding reproducibility. 

      Fig S1 - Missing legend for the 28 + 250, 380 + 387 peaks? RT-qPCR - is not mentioned in the Materials and Methods. In D - ratio of 25% (legend), but 35% (graph).

      Revised.(Line 1203, Line 625, Line 1213, respectively).

      Fig S2 - The word "identified" - 2x in one sentence. 

      Revised. (Line 1230).

      Reviewer #2 (Public Review):

      Weakness(1) While the qualitative data show altered morphologies in each mutant, quantifications of these phenotypes are lacking in several instances, making it difficult to gauge reproducibility and penetrance, as well as to assess the novel ANC forms described in certain mutants.  

      In Fig. 3 and Fig. 4 animal numbers were added to the figure legend. In Fig. 5 animal numbers were added to the figure to demonstrate reproducibility. We now state that dact1/2-/- animals exhibit the rod-like neurocranial shape that is completely penetrant (Line 260). As the altered morphologies that we report are qualitatively significant from wildtype we did not find it necessary to make quantitative measurements. For experiments in which it was necessary to in-cross triple heterozygotes (Fig 3, Fig. 5), we dissected and visually analyzed the ANC of at least 3 compound mutant individuals. At least one individual was dissected for the previously published or described genotypes/phenotypes (i.e. wt, wntllf2-/-, dact1/2-/-, gpc4-/-, wls/-). We realize quantitative measurements may identify subtle differences between genotypes. However, the sheer number of embryos needed to generate these relatively rare combinatorial genotypes and the amount of genotyping required prevented quantitative analyses. 

      Weakness 2) Germline mutations limit the authors' ability to study a gene's spatiotemporal functional requirement. They therefore cannot concretely attribute nor separate early-stage phenotypes (during gastrulation) to/from late-stage phenotypes (ANC morphological changes). 

      We agree that we cannot concretely attribute nor separate early and latestage phenotypes. Conditional mutants to provide temporal or cell-specific analysis are beyond the scope of this work. Here we speculate based on evidence obtained by comparing and contrasting embryos with grossly similar early phenotypes and divergent late-stage phenotypes. We believe our findings contribute to the existing body of literature on zebrafish mutants with both early convergent extension defects and craniofacial abnormalities.   

      Weakness (3) Given that dact1/2 can regulate both canonical and non-canonical wnt signaling, this study did not specifically test which of these pathways is altered in the dact1/2 mutants, and it is currently unclear whether disrupted canonical wnt signaling contributes to the craniofacial phenotypes, even though these phenotypes are typical non-canonical wnt phenotypes. 

      Previous literature has attributed canonical wnt, non-canonical wnt, and nonwnt functions to dact, and each of these likely contributes to the dact mutant phenotype (Lines 87-89). We performed cursory analyses of tcf/lef:gfp expression in the dact mutants and did not find evidence to support further analysis of canonical wnt signaling in these fish. Single-cell RNAseq did not identify differential expression of any canonical or non-canonical wnt genes in the dact1/2 mutants.

      Further research is needed to parse out the intracellular roles of dact1 and dact2 in response to wnt and tgf-beta signaling. Here we find that dact may also have a role in calcium signaling, and further experiments are needed to elaborate this role.      

      Weakness (4) The use of single-cell RNA sequencing unveiled genes and processes that are uniquely altered in the dact1/2 mutants, but not in the gpc4 mutants during gastrulation. However, how these changes lead to the manifested ANC phenotype later during craniofacial development remains unclear. The authors showed that calpain 8 is significantly upregulated in the mutant, but the fact that only 1 out of 142 calpainoverexpressing animals phenocopied dact1/2 mutants indicates the complexity of the system. 

      To further test whether capn8 overexpression may contribute to the ANC phenotype we performed overexpression experiments in the resultant embryos of dact1/dact2 double het incross. We found the addition of capn8 caused a small but statistically significant occurrence of the mutant phenotype in dact1/2 double heterozygotes (Fig.8D). We agree with the reviewer that our results indicate a complex system of dysregulation that leads to the mutant phenotype. We hypothesize that a combination of gene dysregulation may be required to recapitulate the mutant ANC phenotype. Further, as capn8 activity is regulated by calcium levels, overexpression of the mRNA alone likely has a small effect on the manifestation of the phenotype. 

      Weakness (5) Craniofacial phenotypes observed in this study are attributed to convergent extension defects but convergent extension cell movement itself was not directly examined, leaving open if changes in other cellular processes, such as cell differentiation, proliferation, or oriented division, could cause distinct phenotypes between different mutants. 

      Although convergent extension cell movements were not directly examined, our phenotypic analyses of the dact1/2 mutant are consistent with previous literature where axis extension anomalies were attributed to defects in convergent extension (Waxman 2004, Xing 2018, Topczewski 2001). We do not attribute the axis defect to differentiation differences as in situ analyses of established cell type markers show the existence of these cells, only displaced relative to wildtype (Figure 1). We agree that we cannot rule out a role for differences in apoptosis or proliferation however, we did not detect transcriptional differences in dact1/2 mutants that would indicate this in the single-cell RNAseq dataset. Defects in directed division are possible, but alone would not explain that dact1/2 mutant phenotype, particularly the widened dorsal axis (Figure 1).

      Major comments:  

      Comment (1) The author examined and showed convergent extension phenotype (CE) during body axis elongation in dact1/dact2-/- homozygous mutants. Given that dact2-/- single mutants also displayed shortened axis, the authors should either explain why they didn't analyze CE in dact2-/- (perhaps because that has been looked at in previously published dact2 morphants?) or additionally show whether CE phenotypes are present in dact1 and dact2 single mutants.  

      The authors should quantify the CE phenotype in both dact2-/- single mutants and dact1/dact2-/- double mutants, and examine whether the CE phenotypes are exacerbated in the double mutants, which may lend support to the authors' idea that dact1 can contribute to CE. The authors stated in the discussion that they "posit that dact1 expression in the mesoderm is required for dorsal CE during gastrulation through its role in noncanonical Wnt/PCP signaling". However, no evidence was presented in the paper to show that dact1 influences CE during body axis elongation.  

      Because any axis shortening in shortening in dact2-/- single mutants was overcome during the course of development and at 5 dpf there was no noticeable phenotype, we did not analyze the single mutants further.  

      We have added data to demonstrate the resulting phenotype of each combinatorial genotype to provide a more clear and detailed description of the single and compound mutants (Fig. S3). 

      Our hypothesis that dact1 may contribute to convergent extension is based on its apparent ability to compensate (either directly or indirectly) for dact2 loss in the dact2-/- single mutant. 

      Comment (2) Except in Fig. 2, I could not find n numbers given in other experiments. It is therefore unclear if these mutant phenotypes were fully or partially penetrant. In general, there is also a lack of quantifications to help support the qualitative results. For example, in Fig. 4, n numbers should be given and cell movements and/or contributions to the ANC should be quantified to statistically demonstrate that the second stream of CNCC failed to contribute to the ANC.  

      Similarly, while the fan-shaped and the rod-shaped ANCs are very distinct, the various rod-shaped ANCs need to be quantified (e.g. morphometry or measurements of morphological features) in order for the authors to claim that these are "novel ANC forms", such as in the dact1/2-/-, gpc4/dact1/2-/-, and wls/dact1/2-/- mutants (Fig. 5).  

      We have added n numbers for each experiment and stated that the rod-like phenotype of the dact1/2-/- mutant was fully penetrant. 

      Regarding CNCC experiments, we repeated the analysis on 3 individual controls and mutants and did not find evidence that CNCC migration was directly affected in the dact1/2 mutant. Rather, differences in ANC development are likely secondary to defects in floor plate and eye field morphometry. Therefore we did not do any further analyses of the CNCCs.

      Regarding figure 5, we have added n numbers. We dissected and analyzed a minimum of three triple mutants (dact1/2-/-,gpc4-/- and dact1/2-/-,wls-/-) and numerous dact1/s double mutants and found that the triple mutant ANC phenotype was consistent and recognizably different enough from the dact1/2-/-, or gpc4 or wls single mutant that morphometry measurements were not needed. Further, the triple mutant phenotype (narrow and shortened) appears to be a simple combination of dact1/2 (narrow) and gpc4/wls (shortened) phenotypes. As we did not find evidence of genetic epistasis, we did not analyze the novel ANC forms further.

      Comment (3): The authors have attributed the ANC phenotypes in dact1/2-/- to CE defects and altered noncanonical wnt signaling. However, no evidence was presented to support either. The authors can perhaps utilize diI labelling, photoconversionmediated lineage tracing, or live imaging to study cell movement in the ANC and compare that with the cell movement change in the gpc4-/- , and gpc4/dact1/2-/- mutants in order to first establish that dact1/2 affect CE and then examine how dact1/2 mutations can modulate the CE phenotypes in gpc4-/- mutants.  

      Concurrently, given that dact1 and dact2 can affect (perhaps differentially) both canonical and non-canonical wnt signaling, the authors are encouraged to also test whether canonical wnt signaling is affected in the ANC or surrounding tissues, or at minimum, discuss the potential role/contribution of canonical wnt signaling in this context.  

      Given the substantial body of research on the role of noncanonical wnt signaling and planar cell polarity pathway on convergent extension during axis formation (reviewed by Yang and Mlodzik 2015, Roszko et al., 2009) and the resulting phenotypes of various zebrafish mutants (i.e. Xing 2018, Topczewski 2001), including previous research on dact1 and 2 morphants (Waxman 2004), we did not find it necessary to analyze CE cell movements directly.  

      Our finding that CNCC migration was not defective in the dact1/2 mutants and the knowledge that various zebrafish mutants with anterior patterning defects (slb, smo, cyc) have a similar craniofacial abnormality led us to conclude that the rod-like ANC in the dact1/2 mutant was secondary to an early patterning defect (abnormal eye field morphology). Therefore, testing dact1/2 and convergent extension or wnt signaling in the ANC itself was not an aim of this paper.  

      Comment (4) The authors also have not ruled out other possibilities that could cause the dact1/2-/- ANC phenotype. For example, increased cell death or reduced proliferation in the ANC may result in the phenotype, and changes in cell fate specification or differentiation in the second CNCC stream may also result in their inability to contribute to the ANC. 

      We agree that we cannot rule out whether cell death or proliferation is different in the dact1/2 mutant ANC. However, because we do not find the second CNCC stream within the ANC, this is the most likely explanation for the abnormal ANC shape. Because the first stream of CNCC are able to populate the ANC and differentiate normally, it is most likely that the inability of the second stream to populate the ANC is due to steric hindrance imposed by the abnormal cranial/eye field morphology. These hypotheses would need to be tested, ideally with an inducible dact1/2 mutant, however, this is beyond the scope of this paper.     

      Comment (5) The last paragraph of the section "Genetic interaction of dact1/2 with Wnt regulators..." misuses terms and conflates phenotypes observed. For instance, the authors wrote "dact2 haploinsuffciency in the context of dact1-/-; gpc4-/- double mutant produced ANC in the opposite phenotypic spectrum of ANC morphology, appearing similar to the gpc4-/- mutant phenotype". However, if heterozygous dact2 is not modulating phenotypes in this genetic background, its function is not "haploinsuffcient". The authors then said, "These results show that dact1 and dact2 do not have redundant function during craniofacial morphogenesis, and that dact2 function is more indispensable than dact1". However this statement should be confined to the context of modulating gpc4 phenotypes, which is not clearly stated. 

      Revised (Lines 380, 382).   

      Comment (6) For the scRNA-seq analysis, the authors should show the population distribution in the UMAP for the 3 genotypes, even if there are no obvious changes. The authors are encouraged, although not required, to perform pseudotime or RNA velocity analysis to determine if differentiation trajectories are changed in the NC populations, in light of what they found in Fig. 4. The authors can also check the expression of reporter genes downstream of certain pathways, e.g. axin2 in canonical wnt signaling, to query if these signaling activities are changed (also related to point #3 above). 

      We have added population distribution data for the 3 genotypes to Supplemental Figure 4. Although RNA velocity analysis would be an interesting additional analysis, we would hypothesize that the NC population is not driving the differences in phenotype. Rather these are likely changes in the anterior neural plate and mesoderm. 

      Comment (7) While the phenotypic difference between gpc4-/- and dact1/2-/- are in the ANC at a later stage, ssRNA-seq was performed using younger embryos. The authors should better explain the rationale and discuss how transcriptomic differences in these younger embryos can explain later phenotypes. Importantly, dact1, dact2, and capn8 expression were not shown in and around the ANC during its development and this information is crucial for interpreting some of the results shown in this paper. For example, if dact1 and dact2 are expressed during ANC development, they may have specific functions during that stage. Alternatively, if dact1 and dact2 are not expressed when the second stream CNCCs are found to be outside the ANC, then the ANC phenotype may be due to dact1/2's functions at an earlier time point. The author's statement in the discussion that "embryonic fields determined during gastrulation effect the CNCC ability to contribute to the craniofacial skeleton" is currently speculative. 

      We have reworded our rationale and hypothesis to increase clarity (Lines 391-405). We believe that the ANC phenotype of the dact1/2 mutants is secondary to defective CE and anterior axis lengthening, as has been reported for the slb mutant (Heisenberg 1997, 2000). We utilized the gpc4 mutant as a foil to the dact1/2 mutant, as the gpc4 mutant has defective CE and axis extension without the same craniofacial phenotype.

      We have added dact1 and dact2 WISH of 24 and 48 hpf (Fig1. D,E) to show expression during ANC development. 

      Comment (8) The functional testing of capn8 did not yield a result that would suggest a strong effect, as only 1 in 142 animals phenocopied dact1/2. Therefore, while the result is interesting, the authors should tone down its importance. Alternatively, the authors can try knocking down capn8 in the dact1/2 mutants to test how that affects the CE phenotype during axis elongation, as well as ANC morphogenesis. 

      As overexpression of capn8 in wildtype animals did not result in a significant phenotype, we tested capn8 overexpression in compound dact1/2 mutants as these have a sensitized background. We found a small but statistically significant effect of exogenous capn8 in dact1+/-,dact2+/- animals. While the effect is not what one would expect comparing to Mendelian genetic ratios, the rod-like ANC phenotype is an extreme craniofacial dysmorphology not observed in wildtype or mRNA injected embryos hence significant. The experiment is limited by the available technology of over-expressing mRNA broadly without temporal or cell specificity control. It is possible that if capn8 over-expression was restricted to specific cells (floor plate, notochord or mesoderm) and at the optimal time period during gastrulation/segmentation that the aberrant ANC phenotype would be more robust. We agree with the reviewer that although the finding of a new role for capn8 during development is interesting, its importance in the context of dact should be toned down and we have altered the manuscript accordingly (Lines 455-467).  

      Comment (9) A difference between the two images in Fig. 8B is hard to distinguish.

      Consider showing flat-mount images. 

      We have added flat-mount images to Fig. 8B

      Minor comments:

      Comment (1) wnt11f2 is spelled incorrectly in a couple of places, e.g. "wnt11f2l" in the abstract and "wntllf2" in the discussion. 

      Revised throughout.

      Comment (2) For Fig. 1D, the white dact1 and yellow dact2 are hard to distinguish in the merged image. Consider changing one of their colors to a different one and only merge dact1 and dact2 without irf6 to better show their complementarity.  

      We agree with the reviewer that the expression patterns of dact1 and dact2 are difficult to distinguish in the merged image. We have added outlines of the cartilage elements to the images to facilitate comparisons of dact1 and dact2 expression (Fig 1F). 

      Comment (3) For Fig. 1E, please label the clusters mentioned in the text so readers can better compare expressions in these cell populations.  

      We have moved this data to supplementary figure S1 and have added labels.

      Comment (4) The citing and labelling of certain figures can be more specific. For example, Fig. S1A, B, and Fig. S1C should be used instead of just Fig. S1 (under the section titled dact1 and dact2 contribute to axis extension...". Similarly, Fig. 4 can be better labeled with alphabets and cited at the relevant places in the text.  

      We have modified the labeling of the figures according to the reviewer’s suggestion (Fig S2 (previously S1), Fig4) and have added reference to these labels in the text (Lines 202, 204, 212, 328, 334, 336). 

      Comment (5) For Fig. 2B, the (+/+,-/-) on x-axis should be (+/-,-/-).  

      Revised in Figure 2B.

      Comment (6) Several figures are incorrectly cited. Fig. 2C is not cited, and the "Fig. 2C" and "Fig. 2D" cited in the text should be "Fig. 2D" and "Fig. 2E" respectively. Similarly, Fig. 5C and D are not cited in the text and the cited Fig. 5C should be 5E. The VC images in Fig. 5 are not talked about in the text. Finally, Fig. 7C was also not mentioned in the text.  

      We have corrected the labeling and have added descriptions of each panel in the Results (Fig.2 Line 231, 237, 242, Fig 5 Line 373, 381, Fig 7 line 431). 

      Comment (7) In the main text, it is indicated that zebrafish at 3ss were used for ssRNAseq, but in the figure legend, it says 4ss. 

      Revised (Line 682)

      Comment (8) No error bars in Fig. S1B and the difference between the black and grey shades in Fig. S1D is not explained.  

      Error bars are not included in the graphs of qPCR results (now Fig S2C) as these are results of a pool of 8 embryos performed one time. We have added a legend to explain the gray vs. black bars (now Fig S2E). 

      Reviewer #3 (Public Review):  

      Weaknesses: The hypotheses are very poorly defined and misinterpret key previous findings surrounding the roles of wnt11 and gpc4, which results in a very confusing manuscript. Many of the results are not novel and focus on secondary defects. The most novel result of overexpressing calpain8 in dact1/2 mutants is preliminary and not convincing.  

      We apologize for not presenting the question more clearly. The Introduction was revised with particular attention to distinguish this work using genetic germline mutants from prior morpholino studies. Please refer to pages 4-5, lines 106-121.

      Weakness 1) One major problem throughout the paper is that the authors misrepresent the fact that wnt11f2 and gpc4 act in different cell populations at different times. Gastrulation defects in these mutants are not similar: wnt11 is required for anterior mesoderm CE during gastrulation but not during subsequent craniofacial development while gpc4 is required for posterior mesoderm CE and later craniofacial cartilage morphogenesis (LeClair et al., 2009). Overall, the non-overlapping functions of wnt11 and gpc4, both temporally and spatially, suggest that they are not part of the same pathway.  

      We have reworded the text to add clarity. While the loss of wnt11 versus the loss of gpc4 may affect different cell populations, the overall effect is a shortened body axis. We stressed that it is this similar impaired axis elongation phenotype but discrepant ANC morphology phenotypes in the opposite ends of the ANC morphologic spectrum that is very interesting and leads us to investigate dact1/2 in the genetic contexts of wnt11f2 and gpc4.  Pls refer to page 4, lines 73-84. Further, the reviewer’s comment that wnt11 and gpc4 are spatially and temporally distinct is untested. We think the reviewer’s claim of gpc4 acting in the posterior mesoderm refers to its requirement in the tailbud (Marlow 2004). However this does not exclude gpc4 from acting elsewhere as well. Further experiments would be necessary. Both wnt11f2 and gpc4 regulate non-canonical wnt signaling and are coexpressed during some points of gastrulation and CF development (Gupta et al., 2013; Sisson 2015). This data supports the possibility of overlapping roles. 

      Weakness 2) There are also serious problems surrounding attempts to relate single-cell data with the other data in the manuscript and many claims that lack validation. For example, in Fig 1 it is entirely unclear how the Daniocell scRNA-seq data have been used to compare dact1/2 with wnt11f2 or gpc4. With no labeling in panel 1E of this figure these comparisons are impossible to follow. Similarly, the comparisons between dact1/2 and gpc4 in scRNA-seq data in Fig. 6 as well as the choices of DEGs in dact1/2 or gpc4 mutants in Fig. 7 seem arbitrary and do not make a convincing case for any specific developmental hypothesis. Are dact1 and gpc4 or dact2 and wnt11 coexpressed in individual cells? Eyeballing similarity is not acceptable.  

      We have moved the previously published Daniocell data to Figure S1 and have added labeling. These data are meant to complement and support the WISH results and demonstrate the utility of using available public Daniocell data. Please recommend how we can do this better or recommend how we can remediate this work with specific comment. 

      Regarding our own scRNA-seq data, we have added rationale (line 391-403) and details of the results to increase clarity (Lines 419-436). We have added a panel to Figure 6 (panel A) to help illustrate or rationale for comparing dact1/2 to gpc4 mutants to wt. The DEGs displayed in Fig.7A are the top 50 most differentially expressed genes between dact1/2 mutants and WT (Figure 7 legend, line 422-424).   

      We have looked at our scRNA-seq gene expression results for our clusters of interest (lateral plate mesoderm, paraxial mesoderm, and ectoderm). We find dact1, dact2, and gpc4 co-expression within these clusters. Knowing whether these genes are coexpressed within the same individual cell would require going back and analyzing the raw expression data. We do not find this to be necessary to support our conclusions. The expression pattern of wnt11f2 is irrelevant here.   

      Weakness 3) Many of the results in the paper are not novel and either confirm previous findings, particularly Waxman et al (2004), or even contradict them without good evidence. The authors should make sure that dact2 loss-of-function is not compensated for by an increase in dact1 transcription or vice versa. Testing genetic interactions, including investigating the expression of wnt11f2 in dact1/2 mutants, dact1/2 expression in wnt11f2 mutants, or the ability of dact1/2 to rescue wnt11f2 loss of function would give this work a more novel, mechanistic angle.

      We clarified here that the prior work carried out by Waxman using morppholinos, while acceptable at the time in 2004, does not meet the rigor of developmental studies today which is to generate germline mutants. The reviewer’s acceptance of the prior work at face value fails to take the limitation of prior work into account. Further, the prior paper from Waxman et al did not analyze craniofacial morphology other than eyeballing the shape of the head and eyes. Please compare the Waxman paper and this work figure for figure and the additional detail of this study should be clear. Again, this is by no means any criticism of prior work as the prior study suffered from the technological limitations of 2004, just as this study also is the best we can do using the tools we have today. Any discrepancies in results are likely due to differences in morpholino versus genetic disruption and most reviewers would favor the phenotype analysis from the germline genetic context. We have addressed these concerns as objectively as we can in the text (Lines 482-493). The fact that dact1/2 double mutants display a craniofacial phenotype while the single mutants do not, suggests compensation (Lines 503-505), but not necessarily at the mRNA expression level (Fig. S2C). 

      This paper tests genetic interaction through phenotyping the wntll/dact1/dact2 mutant.

      Our results support the previous literature that dact1/2 act downstream of wnt11 signaling. There is no evidence of cross-regulation of gene expression. We do not expect that changes in wnt11 or dact would result in expression changes in the others.

      RNA-seq of the dact1/2 mutants did not show changes in wnt11 gene expression. Unless dact1 and/or dact2 mRNA are under expressed in the wnt11 mutant, we would not expect a rescue experiment to be informative. And as wnt11 is not a focus of this paper, we have not performed the experiment.  

      Weakness 4) The identification of calpain 8 overexpression in Dact1/2 mutants is interesting, but getting 1/142 phenotypes from mRNA injections does not meet reproducibility standards.

      As the occurrence of the mutant phenotype in wildtype animals with exogenous capn8 expression was below what would meet reproducibility standards, we performed an additional experiment where capn8 was overexpressed in embryos resulting from dact1/dact2 double heterozygotes incross (Fig. 8). We reasoned that an effect of capn8 overexpression may be more robust on a sensitized background. We found a statistically significant effect of capn8 in dact1/2 double heterozygotes, though the occurrence was still relatively rare (6/80). These data suggest dysregulation of capn8 contributes to the mutant ANC phenotype, though there are likely other factors involved. 

      Comment: The manuscript title is not representative of the findings of this study.  

      We revised the title to strictly describe that we generated and carried out genetic analysis in loss of function compound mutants (Genetic requirement) and that we found capn8 was important which modified this requirement.

      Introduction: p.4:

      Comment: Anterior neurocranium (ANC) - it has to be stated that this refers to the combined ethmoid plate and trabecular cartilages. 

      Thank you, we agree that the ANC and ethmoid plate terminology has been confusing in the literature and we should endeavor to more clearly describe that the phenotypes in question are all in the ethmoid plate and the trabeculae are not affected. ANC has been replaced with ethmoid plate (EP) throughout the manuscript and figures. We also describe that all the observed phenotypes affect the ethmoid plate and not the trabeculae, (pages 13, Lines 265-267).

      Comment: Transverse dimension is incorrect terminology - replace with medio-lateral.

      Revised (Lines 69, 74).

      Comment: Improper way of explaining the relationship between mutant and gene..."Another mutant knypek, later identified as gpc4..." a better  way to explain this would be that the knypek mutation was found to be a non-sense mutation in the gpc4 gene.  

      Revised (Line 71)

      Comment: "...the gpc4 mutant formed an ANC that is wider in the transverse dimension than the wildtype, in the opposite end of the ANC phenotypic spectrum compared to wnt11f2...These observations beg the question how defects in early patterning and convergent extension of the embryo may be associated with later craniofacial morphogenesis."

      This statement is broadly representative of the general failure to distinguish primary from secondary defects in this manuscript. Focusing on secondary defects may be useful to understand the etiology of a human disease, but it is misleading to focus on secondary defects when studying gene function. The rod-like ethmoid of slb mutant results from a CE defect of anterior mesoderm during gastrulation(Heisenberg et al. 1997, 2000), while the wide ethmoid plate of kny mutants results from CE defects of cartilage precursors (Rochard et al., 2016). Based on this evidence, wnt11f2 and gpc4 act in different cell populations at different times.  

      It is true that the slb mutant craniofacial phenotype has been stated as secondary to the CE defect during gastrulation and the kny phenotype as primary to chondrocyte CE defects in the ethmoid, however the direct experimental evidence to conclude only primary or only secondary effects does not yet exist. There is no experiment to our knowledge where wnt11f2 was found to not affect ethmoid chondrocytes directly. Likewise, there is no experiment having demonstrated that dysregulated CE in gpc4 mutants does not contribute to a secondary abnormality in the ethmoid. 

      Here, we are analyzing the CE and craniofacial phenotypes of the dact1/2 mutants without any assumptions about primary or secondary effects and without drawing any conclusions about wnt11f2 or gpc4 cellular mechanisms.     

      Comment: "The observation that wnt11f2 and gpc4 mutants share similar gastrulation and axis extension phenotypes but contrasting ANC morphologies supports a hypothesis that convergent extension mechanisms regulated by these Wnt pathway genes are specific to the temporal and spatial context during embryogenesis."

      This sentence is quite vague and potentially misleading. The gastrulation defects of these 2 mutants are not similar - wnt11 is required for anterior mesoderm CE during gastrulation and has not been shown to be active during subsequent craniofacial development while gpc4 is required for posterior mesoderm CE and craniofacial cartilage morphogenesis (LeClair et al., 2009). Here again, the non-spatially overlapping functions of wnt11 and gpc4 suggest that are not part of the same pathway.  

      Though the cells displaying defective CE in wnt11f2 and gpc4 mutants are different, the effects on the body axis are similar. The dact1/2 showed a similar axis extension defect (grossly) to these mutants. Our aim with the scRNA-seq experiment was to determine which cells and gene programs are disrupted in dact1/2 mutants. We found that some cell types and programs were disrupted similarly in dact1/2 mutants and gpc4 mutants, while other cells and programs were specific to dact1/2 versus gpc4 mutants. We can speculate that these that were specific to dact1/2 versus gpc4 may be attributed to CE in the anterior mesoderm, as is the case for wnt11. 

      p.5

      Comment: "We examined the connection between convergent extension governing gastrulation, body axis segmentation, and craniofacial morphogenesis." A statement focused on the mechanistic findings of this paper would be welcome here, instead of a claim for a "connection" that is vague and hard to find in the manuscript.  

      We have rewritten this statement (Line 125).

      p.7 Results:

      Comment: It is unclear why Farrel et al., 2018 and Lange et al., 2023 are appropriate references for WISH. Please justify or edit.  

      This was a mistake and has been edited (Page 9).

      Comment: " Further, dact gene expression was distinct from wnt11f2." This statement is inaccurate in light of the data shown in Fig1A and the following statements - please edit to reflect the partially overlapping expression patterns.  

      We have edited to clarify (Lines 142-143).

      p.8

      Comment: "...we examined dact1 and 2 expression in the developing orofacial tissues. We found that at 72hpf..." - expression at 72hpf is not relevant to craniofacial morphogenesis, which takes place between 48h-60hpf (Kimmel et al., 1998; Rochard et al., 2016; Le Pabic et al., 2014).  

      We have included images and discussion of dact1 and dact2 expression at earlier time points that are important to craniofacial development (Lines 160-171)(Fig 1D,E). 

      Comment: "This is in line with our prior finding of decreased dact2 expression in irf6 null embryos". - This statement is too vague. How are th.e two observations "in line".  

      We have removed this statement from the manuscript.

      Comment: Incomplete sentence (no verb) - "The differences in expression pattern between dact1 and dact2...".  

      Revised (Line 172).

      Comment: "During embryogenesis..." - Please label the named structures in Fig.1E.

      Please be more precise with the described expression time. Also, it would be useful to integrate the scRNAseq data with the WISH data to create an overall picture instead of treating each dataset separately.  

      We have moved the previously published Daniocell data to supplementary figure S1 and have labeled the key cell types. 

      p.9

      Comment: "The specificity of the gene disruption was demonstrated by phenotypic rescue with the injection of dact1 or dact2 mRNA (Fig. S1)." - please describe what is considered a phenotypic rescue.

      -The body axis reduction of dact mutants needs to be documented in a figure. Head pictures are not sufficient. Is the head alone affected, or both the head and trunk/tail? Fig.2E suggests that both head and trunk/tail are affected - please include a live embryos picture at a later stage.  

      We have added a description of how phenotypic rescue was determined (Line 208). We have added a figure with representative images of the whole body of dact1/2 mutants. Measurements of body length found a shortening in dact1/2 double mutants versus wildtype, however differences were not found to be significantly different by ANOVA (Fig. 3C, Fig. S3, Line 270-275).

      p. 11

      Comment: "These dact1-/-;dact2-/- CE phenotypes were similar to findings in other Wnt mutants, such as slb and kny (Heisenberg, Tada et al., 2000; Topczewski, Sepich et al., 2001)." The similarity between slb and kny phenotypes should be mentioned with caution as CE defects affect different regions in these 2 mutants. It is misleading to combine them into one phenotype category as wnt11 and gpc4 are most likely not acting in the same pathway based on these spatially distinct phenotypes.  

      Here we are referring to the grossly similar axis extension defects in slb and kny mutants. We refer to these mutants to illustrate that dact1 and or 2 deficiency could affect axis extension through diverse mechanisms. We have added text for clarity (Lines 249-252).  

      Comment: "No craniofacial phenotype was observed in dact1 or dact2 single mutants. However, in-crossing to generate [...] compound homozygotes resulted in dramatic craniofacial deformity."

      This result is intriguing in light of (1) the similar craniofacial phenotype previously reported by Waxman et al (2004) using morpholino- based knock-down of dact2, and the phenomenon of genetic compensation demonstrated by Jakutis and Stainier 2001 (https://doi.org/10.1146/annurev-genet-071719-020342). The authors should make sure that dact2 loss-of-function is not compensated for by an increase in dact1 transcription, as such compensation could lead to inaccurate conclusions if ignored.  

      We agree with the reviewer that genetic compensation of dact2 by dact1 likely explains the different result found in the dact2 morphant versus CRISPR mutant. We found increased dact1 mRNA expression in the dact2-/- mutant (Fig S2X) however a more thorough examination is required to draw a conclusion. Interestingly, we found that in wildtype embryos dact1 and dact2 expression patterns are distinct though with some overlap. It would be informative to investigate whether the dact1 expression pattern changes in dact2-/- mutants to account for dact2 loss.   

      Comment: "Lineage tracing of NCC movements in dact1/2 mutants reveals ANC composition" - the title is misleading - ANC composition was previously investigated by lineage tracing (Eberhardt et al., 2006; Wada et al., 2005).  

      This has been reworded (Line 292)

      p.13

      Comment: There is no frontonasal prominence in zebrafish.  

      This is true, texts have been changed to frontal prominence.  (Lines 293,

      299, 320)

      Comment: The rationale for investigating NC migration in mutants where there is a gastrula-stage failure of head mesoderm convergent extension is unclear. The whole head is deformed even before neural crest cells migrate as the eye field does not get split in two (Heisenberg et al., 1997; 2000), suggesting that the rod-like ethmoid plate is a secondary defect of this gastrula-stage defect. In addition, neural crest migration and cartilage morphogenesis are different processes, with clear temporal and spatial distinctions.  

      We carried out the lineage tracing experiment to determine which NC streams contributed to the aberrantly shaped EP, whether the anteromost NC stream frontal prominence, the second NC stream of maxillary prominence, or both.  We found that the anteromost NCC did contribute to the rod-like EP, which is different from when hedgehod signaling is disrupted,  So while it is possible that the gastrula-effect head mesoderm CE caused a secondary effect on NC migration, how the anterior NC stream and second NC stream are affected differently between dact1/2 and shh pathway is interesting.  We added discussion of this observation to the manuscript (page 23, Lines 514-520). 

      p. 14-16

      Comment: Based on the heavy suspicion that the rod-like ethmoid plate of the dact1/2 mutant results from a gastrulation defect, not a primary defect in later craniofacial morphogenesis, the prospect of crossing dact1/2 mutants with other wnt-pathway mutants for which craniofacial defects result from craniofacial morphogenetic defects is at the very least unlikely to generate any useful mechanistic information, and at most very likely to generate lots of confusion. Both predictions seem to take form here.  

      However, the ethmoid plate phenotype observed in the gpc4-/-; dact1+/-; dact2-/- mutants (Fig. 5E) does suggest that gpc4 may interact with dact1/2 during gastrulation, but that is the case only if dact1+/-; dact2-/- mutants do not have an ethmoid cartilage defect, which I could not find in the manuscript. Please clarify.  

      The perspective that the rod-like EP of the dact1/2 is due to gastrulation defect is being examined here. Why would other mutants such as wnt11f2 and gpc4 that have gastrulation CE defects have very different EP morphology, whether primary or secondary NCC effect?  Further dact1 and dact2 were reported as modifiers of Wnt signaling, so it is logical to genetically test the relationship between dact1, dact2, wnt11f2, gpc4 and wls. The experiment had to be done to investigate how these genetic combinations impact EP morphology. This study found that combined loss of dact1, dact2 and wls or gpc4 yielded new EP morphology different than those previously observed in either dact1/2, wls, gpc4, or any other mutant is important, suggesting that there are distinct roles for each of these genes contributing to facial morphology, that is not explained by CE defect alone.   

      Comment: I encourage the authors to explore ways to test whether the rod-like ethmoid of dact1/2 mutants is more than a secondary effect of the CE failure of the head mesoderm during gastrulation. Without this evidence, the phenotypes of dact1/2 -gpc4 or - wls are not going to convince us that these factors actually interact.  

      Actually, we find our results to support the hypothesis that the ethmoid of the dact1/2 mutants is a secondary effect of defective gastrulation and anterior extension of the body axis. However, our findings suggest (by contrasting to another mutant with impaired CE during gastrulation) that this CE defect alone cannot explain the dysmorphic ethmoid plate. Our single-cell RNA seq results and the discovery of dysregulated capn8 expression and proteolytic processes presents new wnt-regulated mechanisms for axis extension.    

      p. 20 Discussion

      Comment: "Here we show that dact1 and dact2 are required for axis extension during gastrulation and show a new example of CE defects during gastrulation associated with craniofacial defects."

      Waxman et al. (2004) previously showed that dact2 is involved in CE during gastrulation.

      Heisenberg et al. (1997, 2000), previously showed with the slb mutant how a CE defect during gastrulation causes a craniofacial defect.  

      The Waxman paper using morpholino to disrupt dact2 is produced limited analysis of CE and no analysis of craniofacial morphogenesis. We generated genetic mutants here to validate the earlier morpholino results and to analyze the craniofacial phenotype in detail. We have removed the word “new” to make the statement more clear (Line 475).

      Comment: "Our data supports the hypothesis that CE gastrulation defects are not causal to the craniofacial defect of medially displaced eyes and midfacial hypoplasia and that an additional morphological process is disrupted."

      It is unclear to me how the authors reached this conclusion. I find the view that medially displaced eyes and midfacial hypoplasia are secondary to the CE gastrulation defects unchallenged by the data presented. 

      This statement was removed and the discussion was reworded.

      Comment: The discussion should include a detailed comparison of this study's findings with those of zebrafish morpholino studies.  

      We have added more discussion to compare ours to the previous morpholino findings (Lines 476-484).

      Comment: The discussion should try to reconcile the different expression patterns of dact1 and dact2, and the functional redundancy suggested by the absence of phenotype of single mutants. Genetic compensation should be considered (and perhaps tested).  

      The different expression patterns of dact1 and dact2 along with our finding that dact1 and dact2 genetic deficiency differently affect the gpc4 mutant phenotype suggest that dact1 and dact2 are not functionally redundant during normal development. This is in line with the previously published data showing different phenotypes of dact1 or dact2 knockdown. However, our results that genetic ablation of both dact1 and dact2 are required for a mutant phenotype suggests that these genes can compensate upon loss of the other. This would suggest then that the expression pattern of dact1 would be changed in the dact2 mutant and visa versa. We find that this line of investigation would be interesting in future studies. We have addressed this in the Discussion (Lines 485498).

      Comment: "Based on the data...Conversely, we propose...ascribed to wnt11f2 "

      Functional data always prevail overexpression data for inferring functional requirements.  

      This is true.

      p.21

      Comment: "Our results underscore the crucial roles of dact1 and dact2 in embryonic development, specifically in the connection between CE during gastrulation and ultimate craniofacial development."

      How is this novel in light of previous studies, especially by Waxman et al. (2004) and Heisenberg et al. (1997, 2000). In this study, the authors fail to present compelling evidence that craniofacial defects are not secondary to the early gastrulation defects resulting from dact1/2 mutations.  p. 22

      We have not claimed that the craniofacial defects are not secondary to the gastrulation defects. In fact, we state that there is a “connection”. Further, we do not claim that this is the first or only such finding. We believe our findings have validated the previous dact morpholino experiments and have contributed to the body of literature concerning wnt signaling during embryogenesis. 

      Comment: The section on Smad1 discusses a result not reported in the results section. Any data discussed in the discussion section needs to be reported first in the results section.  

      We have added a comment on the differential expression of smad1 to the results section (Lines 446-448).

    1. Author response:

      The following is the authors’ response to the original reviews.

      Public Reviews:

      Reviewer #1 (Public Review):

      In this manuscript entitled "Hexokinase regulates Mondo-mediated longevity via the PPP and organellar dynamics", Laboy and colleagues investigated upstream regulators of MML-1/Mondo, a key transcription factor that regulates aging and metabolism, using the nematode C. elegans and cultured mammalian cells. By performing a targeted RNAi screen for genes encoding enzymes in glucose metabolism, the authors found that two hexokinases, HXK-1 and HXK-2, regulate nuclear localization of MML-1 in C. elegans. The authors showed that knockdown of hxk-1 and hxk-2 suppressed longevity caused by germline-deficient glp-1 mutations. The authors demonstrated that genetic or pharmacological inhibition of hexokinases decreased nuclear localization of MML-1, via promoting mitochondrial β-oxidation of fatty acids. They found that genetic inhibition of hxk-2 changed the localization of MML-1 from the nucleus to mitochondria and lipid droplets by activating pentose phosphate pathway (PPP). The authors further showed that the inhibition of PPP increased the nuclear localization of mammalian MondoA in cultured human cells under starvation conditions, suggesting the underlying mechanism is evolutionarily conserved. This paper provides compelling evidence for the mechanisms by which novel upstream metabolic pathways regulate MML-1/Mondo, a key transcription factor for longevity and glucose homeostasis, through altering organelle communications, using two different experimental systems, C. elegans and mammalian cells. This paper will be of interest to a broad range of biologists who work on aging, metabolism, and transcriptional regulation. 

      Reviewer #2 (Public Review):

      Raymond Laboy et.al explored how transcriptional Mondo/Max-like complex (MML-1/MXL-2) is regulated by glucose metabolic signals using germ-line removal longevity model. They believed that MML-1/MXL-2 integrated multiple longevity pathways through nutrient sensing and therefore screened the glucose metabolic enzymes that regulated MML-1 nuclear localization. Hexokinase 1 and 2 were identified as the most vigorous regulators, which function through mitochondrial beta-oxidation and the pentose phosphate pathway (PPP), respectively. MML-1 localized to mitochondria associated with lipid droplets (LD), and MML-1 nuclear localization was correlated with LD size and metabolism. Their findings are interesting and may help us to further explore the mechanisms in multiple longevity models, however, the study is not complete and the working model remains obscure. For example, the exact metabolites that account for the direct regulation of MML-1 were not identified, and more detailed studies of the related cellular processes are needed. 

      The identification of responsible metabolites is necessary since multiple pieces of evidence from the study suggests that lipid other than glucose metabolites may be more likely to be the direct regulator of MML-1 and HXK regulate MML-1 indirectly by affecting the lipid metabolism: 1) inhibiting the PPP is sufficient to rescue MML-1 function independent of G6P levels; 2) HXK-1 regulates MML-1 by increasing fatty acid beta-oxidation; 3) LD size correlates with MML-1 nuclear localization and LD metabolism can directly regulate MML-1. The identification of metabolites will be helpful for understanding the mechanism. 

      Beta-oxidation and the PPP are involved in the regulation of MML-1 by HXK-1 and HXK-2, respectively. But how these two pathways participate in the regulation is not clear. Is it the beta-oxidation rate or the intermediate metabolites that matters? As for the PPP, it provides substrates for nucleotide synthesis and also its product NADPH is essential for redox balance. Is one of the metabolites or the NADPH levels involved in MML-1 regulation? More studies are needed to provide answers to these concerns. 

      Recommendations for the authors:

      Reviewer #1 (Recommendations For The Authors):

      Following are my comments that the authors may want to address to further improve this excellent paper.

      Major comments 

      (1) Although the authors provided evidence that hexokinases in glucose metabolism are associated with germline-deficient glp-1(-) mutants, they did not mention why they focused on glp-1(-) mutants rather than other longevity mutants. In their previous study (Nakamura et al., 2016), they showed that MML-1 is required for multiple longevity pathways in C. elegans, including reduced mitochondrial respiration and insulin/IGF-1 signaling. Please discuss why the authors focused on glp-1(-) mutants in this paper. It will be even better if the authors test the roles of hexokinases in some other longevity regimens. 

      Many thanks for this astute comment. Previously we had shown that mml-1 is required for glp-1, daf-2, and isp-1 longevity, and Johnson et al. had shown a requirement for eat-2, hence the idea that MML-1 is a convergent transcription factor. We first focused on glp-1 because that was the starting point of our screen, and the result was clear and simple: hexokinases regulate MML‑1 nuclear localization and activity in glp-1 and are required for longevity. Naturally, the question arises: do hexokinases behave like MML-1 as convergent longevity regulators across pathways? To address this, we examined the interaction of hxk-1 and hxk-2 with isp-1, daf-2, and raga-1.  Specifically, we now show that:

      A. Like glp-1(e2141) mutants, isp-1(qm150) mutants stimulate MML-1 nuclear localization, and the hexokinases are required for isp-1 longevity (Figure 1G-H).

      B. daf-2(e1370) mutants do not further stimulate MML-1 nuclear localization beyond basal levels, yet MML-1 is strongly required for daf-2 longevity (Nakamura et al., 2016, Supplementary Figure 1L-M). However, the hexokinases are not required for daf-2 longevity (Supplementary Figure 1M), suggesting that the signaling pathway is wired differently in daf-2, and that other pathways regulate MML-1 activity.

      C. raga-1(ok701) mutants stimulate MML-1 nuclear localization and mml-1 is required for raga-1 longevity, suggesting that MML-1 acts downstream of TORC1 signaling (Supplementary Figure 1N-O). However, hexokinases are not required for raga-1 longevity, suggesting that raga-1 acts downstream or parallel to hexokinase signaling (Supplementary Figure 1P).

      D. We performed untargeted metabolomics in glp-1, daf-2, and mml-1 single and double mutants and observed that hexose phosphates, which have been shown to regulate MML-1 human homologs MondoA/ChREBP, were differentially regulated between mutants.

      Author response image 1.

      E. Altogether these experiments reveal that though MML-1 promotes longevity in most pathways, the hexokinases are only required in some (glp-1, isp-1), but not others (raga-1, daf-2). Furthermore, strong MML-1 nuclear localization is often but not always associated with longevity (e.g. daf-2), and the wiring of the signaling pathway is different for various longevity regimens. Consistently, mTOR and Insulin signaling are more functionally linked and therefore may show a more similar genetic profile. Differences in hexose phosphate between glp-1 and daf-2 could explain why MML-1 requires hexokinase function in glp-1 to promote longevity but not in daf-2. However, considerably more work is required to rigorously validate this hypothesis.

      (2) In figure 5, the authors investigated whether the association between PPP and MML‑1/MondoA, tested in C. elegans, is conserved in mammals under starvation conditions. The authors should clarify why they tested the MondoA localization upon starvation in cultured human cells. This comment is related to my comment #1 as the authors could determine the roles of hexokinases under dietary restriction (DR)-conditions or in DR-mimetic in eat-2(-) mutants. 

      In this case, the actual translatability to a worm longevity pathway was not our goal. Rather, we examined MondoA in cell culture under contrasting conditions of MondoA subcellular localization, where high glucose media had cytosolic/nuclear localization and starvation conditions cytosolic localization. We then showed that similar to our data in worms, PPP inhibition with 6-AN induced MondoA nuclear localization and activity. We now mention this rationale in the results section, lines 352-356.

      (3) In figure 2, the authors showed that HXK-2 regulates mitochondrial localization of MML-1, and HXK-1 regulates nuclear localization of MML-1 through mitochondrial β-oxidation in glp‑1(-) mutants. Can the authors test whether mitochondrial β-oxidation affects the effects of hxk RNAi on longevity of glp-1(-) mutants? 

      Excellent suggestion. We tried to test this idea and found that acs-2 RNAi alone abolished glp-1 longevity, making epistasis experiments difficult to interpret. This is consistent with published data showing that glp-1 longevity requires NHR-49, a transcription factor that regulates mitochondrial b‑oxidation, that drives acs-2 expression (Ratnappan et al., 2014). It could well be that b‑oxidation inhibition promotes MML-1 nuclear localization but abolishes lifespan extension because of epistatic effects on other transcription factors or processes. Further investigation would be required to elucidate the exact mechanism that goes beyond the scope of the paper.

      (4) The authors showed that 2-deoxy-glucose, which decreases the activity of HXK, decreased the nuclear localization of MML-1, and this is consistent with their genetic data. Based on these data, 2-deoxy-glucose is expected to decrease longevity. Interestingly, however, 2-deoxy-glucose has been reported to increase lifespan by restricting glucose, whereas extra glucose intake decreases lifespan in C. elegans, shown by multiple research groups, including M. Ristow, C. Kenyon, and S.J.V. Lee labs. This is seemingly paradoxical and worth discussing with key references, especially because MondoA and Chrebp are known as glucose-responsive transcription factors. 

      Thank you for this important comment. 2-DG has been shown to extend lifespan by suppressing glucose metabolism at concentrations ranging from 0.1 to 5 mM, higher concentrations ranging from 20 to 50 mM had the opposite effect decreasing lifespan (Schulz et al., 2007). The concentration we tested was 50 mM 2-DG and observed decreased MML-1 nuclear localization, which is consistent with the previous data showing decreased longevity. We now raise this point in the discussion suggesting that mild inhibition of glucose metabolism has beneficial effects on longevity, while strong suppression causes a shortening of the lifespan (lines 411-414).

      Minor comments 

      (1) The current Introduction does not include the explicit statement about that MML-1 and MondoA are homologs. Please clarify this as naive readers may be confused.

      Thank you for pointing this out. We now say in the intro that MondoA and MML-1 are homologs (lines 59-60).

      (2) In figure 1, the effects of hxk-3 on nuclear localization of MML-1 is small compared to those of hxk-1 and hxk-2. Please add speculation about why HXK-3 has different roles in nuclear localization of MML-1 compared to HXK-1 and HXK-2. 

      According to GExplore 1.4 (Hutter & Suh, 2016), hxk-3 expression declines during larval development and is low expressed in the adult. Perhaps it has little effect in the young adult, and the other hexokinases suffice to support MML-1 nuclear localization. It also remains possible that hxk-3 is not required in glp-1, but required in other longevity pathways.

      (3) The authors tested the effects of genetic inhibition of hxk-1 and hxk-2 on the regulation of MML-1 localization and lifespan of glp-1(-) mutants by using RNAi. I wonder whether the authors can perform the experiments with hxk-1 or hxk-2 loss (or reduction) of function mutants. If they cannot, please discuss the reason and the limitations of RNAi. 

      This is an important point raised by the reviewer. We found that RNAi was most effective for phenotypes related to MML-1 nuclear localization and longevity, likely because it results in acute knockdown. We also showed that pharmacological inhibition of hexokinase function with 3BrP and 2‑DG (Supplementary Figure 1B and 1C) and the PPP with 6-AN (Figure 3B) had consistent results with our observation with RNAi.

      We generated hexokinase KO mutants by deleting the coding sequence of each hexokinase by CRISPR/Cas9. First, we measured the expression of each hexokinase isozyme in each mutant. Notably, hxk-1(syb1271) null mutant had higher expression of hxk-2 and hxk-3, hxk-2(syb1261) did not significantly affect the expression of hxk-1 and hxk-3, and hxk-3(syb1267) had a mild increase in hxk-2 expression. We followed up on the hxk-1(syb1271) and hxk-2(syb1261) and crossed these mutants with our MML-1::GFP reporter. We observed a modest but significant reduction in MML-1 nuclear localization in both strains. The effect with RNAi is much stronger in comparison to the null mutants, potentially due to a compensatory upregulation of the other hexokinases in the mutants that we do not observe with RNAi (Supplementary Figure 1D-E). Another alternative is that there is a threshold in the effects of hexokinase function on MML-1 nuclear localization. We tried to generate a hxk-1; hxk-2 double mutant but it was lethal and therefore did not pursue this further.

      Author response image 2.

      (4) Please correct minor typos throughout the manuscript. Following are some examples. <br /> - On page 4, line 111, please correct "Supplementary Figure D-E" to "Supplementary Figure 1D-E". 

      - On page 9, line 272, please correct "3A-B" to "4A-B". 

      - On page 9, line 275, please correct "S4" to "4". 

      - On page 10, line 309, please correct "4A" to "4B" 

      Corrected.

      (5) In Fig. 3E, please add the information about the scale bars in figure legends.

      Corrected.

      Reviewer #2 (Recommendations For The Authors):

      Here are some detailed suggestions for the authors:

      (1) Since MML-1/MXL-2 complex functions in multiple longevity models, e.g. DR, ILS, what are the roles of HXK-1 and HXK-2 in these models? 

      We now show that although mml-1 is required in most longevity pathways, hxk-1 and hxk-2 are required in some pathways (glp-1, isp-1) but not others (daf-2, raga-1). See above for more details.

      (2) As for the metabolites screening, the lipid metabolic genes can be included. Not only for the above reasons, also previous study had found that the mml-1 mRNA levels and MML-1 GFP nuclear localization were all increased in the glp-1 model, while mml-1 mRNA levels were unaffected by hxk knockdown, suggesting more pathways be involved. 

      We agree with the reviewer that understanding what metabolites regulate MML-1 nuclear localization and activity is an important, yet challenging question. Our studies demonstrate a role of glucose metabolism, in particular, hexokinase in this process, consistent with hexose-p being activators of MondoA. Our data also suggest mechanisms beyond hexose-p regulate MML-1, since knockdown of the PPP components stimulates MML-1 even when hxk-2 is depleted and low G6P, and inhibition of the PPP with 6-AN stimulates MondoA nuclear localization under starvation conditions in mammalian cell culture. We tested redox regulation, nucleoside, and lipid metabolism as candidate processes (see below). Notably, our data suggest this other mechanism is tied to lipid metabolism through droplet size since various perturbations that impact LD size and number (atgl-1, dgat-2, tkt-1, Figure 4) affected MML-1 nuclear localization. It remains an open question whether MML-1 is regulated by other metabolites through a ligand-protein interaction or not. We cannot exclude that beyond lipid droplet regulation, specific lipids, other metabolites, or metabolic modules linked to the PPP might regulate MML-1 nuclear localization and activity.

      We employed genetic manipulation and pharmacological inhibition to understand the upstream signals that regulate MML-1. These approaches will not be sufficient to determine whether other metabolite(s) are involved in MML-1/MondoA translocation to the nucleus through a direct interaction. Novel technologies that determine protein-metabolite interactions (e.g. MIDAS) will help us answer this question in future work, and go beyond the scope of this paper. As a compromise, we discuss possible metabolites that may orchestrate this based on our observations based on MML‑1 subcellular localization at LD/mitochondria (including PPP and TCA cycle intermediates).

      (3) Line 238, it should be "NADPH". 

      Corrected.

      (4) RNAi targeting enzymes of different branches of PPP can be performed

      In our initial screen, we examined the effect of various enzymes of the PPP on MML-1 nuclear localization (Figure 1A, Supplementary Table S1) and found that knockdown of enzymes in both the oxidative phase (PGDH/T25B9.9) and non-oxidative phase (transketolase/TKT-1) affect MML-1 nuclear localization. In line, 6-AN treatment, which affects the oxidative phase, also stimulated MML‑1 nuclear localization (Figure 3B). We also observed that knockdown of enzymes involved in ribose 5P conversion to ribose, ribose 1P, and phosphoribosyl pyrophosphate, an intermediate in nucleotide biosynthesis, decreased MML-1 nuclear localization (rpia-1, F07A11._5, _Y43F4B.5, _R151._2; Supplementary Table S1). Whether MML‑1/MondoA responds to nucleotide pool remains elusive.

      (5) As for PPP, these are many possibilities that can be tested. For example, as PPP supplies NADPH for oxidative balance, does MML-1 respond to ROS? Also, it appears the genes in the non-oxidative arm of PPP regulate MML-1, so is nucleotide synthesis involved? 

      Thank you for the suggestion. We tested other enzymes involved in NADPH production from the folate cycle and observed a mild but significant reduction of MML-1 nuclear localization upon dao-3i (Supplementary Table S1). Moreover, we tested whether MML-1 nuclear localization is responsive to ROS. While paraquat exposure induced oxidative stress by measuring the transcriptional reporter gst‑4p::GFP (Supplementary Figure 3A), paraquat exposure did not significantly affect MML-1 nuclear localization (Supplementary Figure 3B). Therefore we think it less likely that NADPH production acting through redox regulation is the main effect.

      We also tried supplementation with some of the metabolite outputs of PPP including ribose, ribulose, and xylulose, as well as nucleosides (see below), but saw no effect on MML-1 nuclear localization. We agree that further studies are required to pinpoint whether there is another metabolic moiety regulating MML-1 at the protein-ligand level, but this goes beyond the scope of the current investigation.

      Author response image 2.

    1. Author response:

      The following is the authors’ response to the original reviews.

      eLife assessment:

      This important study reports the deep evolutionary conservation of a core genetic program regulating spermatogenesis in flies, mice, and humans. The data presented are supportive of the main conclusion and generally convincing. This work will be of interest to evolutionary and reproductive biologists.

      The Authors would like to thank the Senior Editor and the two Reviewers for their positive assessment of our work, as well as for the helpful suggestions. Collectively, these suggestions provided insight that was instrumental in shaping the final version of the manuscript (see below for our point-by-point comments). The Authors believe that the refinements introduced to the final document clearly translate into an improved version of our work. Hence, we would like to thank all those involved in the peer review process for their encouraging words and constructive criticism.

      Public Reviews: 

      Reviewer #1 (Public Review):

      Summary: 

      By combining an analysis of the evolutionary age of the genes expressed in male germ cells, a study of genes associated with spermatocyte protein-protein interaction networks and functional experiments in Drosophila, Brattig-Correia and colleagues provide evidence for an ancient origin of the genetic program underlying metazoan spermatogenesis. This leads to identifying a relatively small core set of functional interactions between deeply conserved gene expression regulators, whose impairment is then shown to be associated with cases of human male infertility.

      Strengths: 

      In my opinion, the work is important for three different reasons. First, it shows that, even though reproductive genes can evolve rapidly and male germ cells display a significant level of transcriptional noise, it is still possible to obtain convincing evidence that a conserved core of functionally interacting genes lies at the basis of the male germ transcriptome. Second, it reports an experimental strategy that could also be applied to gene networks involved in different biological problems. Third, the authors make a compelling case that, due to its effects on human spermatogenesis, disruption of the male germ cell orthoBackbone can be exploited to identify new genetic causes of infertility.

      We thank the Reviewer for their positive assessment. Indeed, it was our main objective to convincingly demonstrate these three points.

      Weaknesses: 

      The main strength of the general approach followed by the authors is, inevitably, also a weakness. This is because a study rooted in comparative biology is unlikely to identify newly emerged genes that may adopt key roles in processes such as species-specific gamete recognition. Additionally, using a TPM >1 threshold for protein-coding transcripts may exclude genes, such as those encoding proteins required for gamete fusion, which are thought to be expressed at a very low level. Although these considerations raise the possibility that the chosen approach may miss information that, depending on the species, could be potentially highly functionally important, this by no means reduces its value in identifying genes belonging to the conserved genetic program of spermatogenesis.

      The Authors acknowledge the points raised by the Reviewer as inevitable trade-offs of the focus of our study (to uncover the deeply conserved genetic basis of spermatogenesis). Certainly, our pipeline could, in the future, be adapted to look for newly emerged genes or to employ different minimum expression cut-offs. To this end, we made all computational data and custom scripts easily available to the community. We would, nevertheless, kindly emphasize the challenge associated with the use of less restrictive TPM cut-offs, given the substantial level of transcriptional noise associated with this cell type. An abridged version of this discussion can be found in lines 512-515 of the manuscript.

      Reviewer #2 (Public Review):

      Summary: 

      This is a tour de force study that aims to understand the genetic basis of male germ cell development across three animal species (human, mouse, and flies) by performing a genetic program conservation analysis (using phylostratigraphy and network science) with a special emphasis on genes that peak or decline during mitosis-to-meiosis. This analysis, in agreement with previous findings, reveals that several genes active during and before meiosis are deeply conserved across species, suggesting ancient regulatory mechanisms. To identify critical genes in germ cell development, the investigators integrated clinical genetics data, performing gene knockdown and knockout experiments in both mice and flies. Specifically, over 900 conserved genes were investigated in flies, with three of these genes further studied in mice. Of the 900 genes in flies, ~250 RNAi knockdowns had fertility phenotypes. The fertility phenotypes for the fly data can be viewed using the following browser link:https://pages.igc.pt/meionav. The scope of target gene validation is impressive. Below are a few minor comments.

      We thank the Reviewer for their positive appraisal of our work.

      (1) In Supplemental Figure 2, it is notable that enterocyte transcriptomes are predominantly composed of younger genes, contrasting with the genetic age profile observed in brain and muscle cells. This difference is an intriguing observation and it would be curious to hear the author's comments.

      Indeed, this is an intriguing observation for which we can only provide a speculative answer. Enterocytes are specialized to absorb nutrients, hence their genetic program is finely tuned to maximize uptake under specific dietary conditions. In this regard, we can posit that variations in nutrient preference/availability in the course of each species’ evolutionary history (associated with habitat, environmental and/or behavioral changes) may have exerted a selective pressure for the emergence of new genes that could provide enterocytes with more efficient uptake capabilities under new circumstances. The application of evolutionary thinking to the rapidly expanding field of nutrigenomics could shed light on this possibility.

      (2) Regarding the document, the figures provided only include supplemental data; none of the main text figures are in the full PDF. 

      We thank the Reviewer for this helpful comment. We will ensure that the three main figures are correctly formatted in the final version of the manuscript.

      (3) Lastly, it would be great to section and stain mouse testis to classify the different stages of arrest during meiosis for each of the mouse mutants in order to compare more precisely to flies.

      We agree with the Reviewer that adding more mouse data would further improve what can already be considered an extensive body of experimental work. Given the costs associated with the generation of such data (in terms of resources and otherwise), the Authors believe such a study would be best suited to a follow-up manuscript.

      This paper serves as a vital resource, emphasizing that only through the analysis of hundreds of genes can we prioritize essential genes for germ cell development. its remarkable that about 60% of conserved genes have no apparent phenotype during germ cell development.

      Once again, we thank the Reviewer for their positive assessment of our work. Clarifying the degree of functional redundancy in an essential biological process such as male gametogenesis represents an exciting (and experimentally complex) future challenge.

      Strengths:

      The high-throughput screening was conducted on a conserved network of 920 genes expressed during the mitosis-to-meiosis transition. Approximately 250 of these genes were associated with fertility phenotypes. Notably, mutations in 5 of the 250 genes have been identified in human male infertility patients. Furthermore, 3 of these genes were modeled in mice, where they were also linked to infertility.

      This study establishes a crucial groundwork for future investigations into germ cell development genes, aiming to delineate their essential roles and functions.

      The Authors thank the Reviewer for emphasizing the potential usefulness of our results to the community, as that was one of the main motivations behind this project.

      Weaknesses: 

      The fertility phenotyping in this study is limited, yet dissecting the mechanistic roles of these proteins falls beyond its scope. Nevertheless, this work serves as an invaluable resource for further exploration of specific genes of interest.

      Please see the previous point.

      Recommendations for the authors:

      Reviewer #1 (Recommendations For The Authors): 

      Although the manuscript already includes a significant amount of data, there are two aspects that the authors may consider exploring: 

      (1) I understand that the choice of species whose gene expression was analyzed in the study was largely influenced by the quality of the corresponding genome annotations. However, since in evolutionary terms humans and mice are much closer to each other than Drosophila (as also shown in Figure 1c and Supplementary Figure 1), I found the statement "three evolutionarily distant gonochoric species" partially questionable. Have the authors considered adding an additional established animal model, such as for example zebrafish, to provide further coverage of the evolutionary space? Or, alternatively, could a posteriori analysis of the transcriptome of such an additional species be used to cross-validate their findings? The authors touch upon this point in the Discussion, but I wonder if they actually tried something in this direction, or simply decided that the currently available expression data from other organisms was too poor to be used for this purpose.

      We thank the Reviewer for bringing up this point, as it echoes one of our main concerns in terms of our approach (as discussed in lines 487-492). Indeed, when we were designing our study, we extensively discussed whether zebrafish and C. elegans datasets should be included, as high-quality expression and phenotypical data were available for both species. We ended up not including them for one main reason: the sexual system of these species deviates from that of humans, mice and fruit flies (all gonochoric species). More specifically, C. elegans are hermaphrodites and although zebrafish is a gonochoric species at the adult stage, they start their lifecycle as juvenile hermaphrodites (they first develop juvenile ovaries that later degenerate into a testis in males). Since it is largely unknown to what extent the transcriptome of male germ cells from these species deviates from the gonochoric program (by retaining oogenesis-related characteristics, for example), we decided to avoid possible confounding effects by excluding the two species. Undoubtedly, as more transcriptomic data from non-model organisms become available, these (and other) questions can be extensively revisited as our pipeline was designed to easily accommodate new data.

      (2) Although the use of the STRING database is a sensible choice given the general purpose of this work, in my experience the reliability of its individual interactions can vary significantly. I wonder if the authors have considered exploiting AlphaFold-Multimer as a parallel approach to estimate what proportion of the 79 functional interactions that they identified may reflect direct protein-protein contacts.

      We thank the Reviewer for this question and suggestion, as we were also concerned about STRING's reliability for individual interactions. For that
reason, we only utilized protein-protein interactions with a STRING combined confidence score ≥0.5
(corresponding to the estimated likelihood of a given association being
true), as described in more detail in the "Protein-protein interaction
(PPI) network construction" subsection. In addition, to make sure we were not biasing results towards conserved genes (which could arguably be overrepresented in STRING) we pursued a random rewiring test of degree
centrality and page rank, as detailed in section "Deeply conserved genes
are central components of the male germ cell transcriptome". We very much like the suggestion of using AlphaFold-Multimer to estimate the proportion of
direct protein-protein contacts for the 79 core interactions, but given
the already quite complex analytical pipeline of the present work, we will leave such analysis for a follow-up study. The final version of the manuscript now contains a reference to such an approach (lines 499-502).

      Finally, probably because my primary focus is not on gene regulation, I must say that I found the manuscript somewhat heavy to read. The integration of various data types and analyses, while enriching, also complicates the ability to clearly recall the main conclusions of each result section by the time one reaches the summary at the beginning of the Discussion. Given the relative brevity of the latter, expanding it to both reiterate what these conclusions are and illustrate how all the components converge to support the central message of the study would, in my opinion, benefit a general readership.  

      We thank the Reviewer for their fresh perspective on our document and for this most welcome suggestion. The final version of the manuscript now includes a longer discussion, containing an initial paragraph (lines 467-479) that summarizes our main findings and how they converge into a coherent body of work.

      Additionally, on a minor note, I suggest that the concept of phylostratigraphy be briefly explained when first mentioned in the Introduction, rather than later in the manuscript. This early clarification would aid comprehension for readers unfamiliar with the term. 

      To safeguard the flow of the manuscript, we have slightly tweaked the introduction section to avoid the use of highly specific terminology (such as phylostratigraphy) this early in the text. We replaced it with “comparison of genome sequences” (line 85). Phylostratigraphy is later explained in full detail in the corresponding section of the manuscript. We thank the Reviewer for this helpful suggestion.

      Reviewer #2 (Recommendations For The Authors): 

      Major concern - the absence of main text figures.

      We thank the Reviewer for this helpful comment. We will ensure that the three main figures are correctly formatted in the final version of the manuscript.

      Typos throughout - this will need your attention. 

      The Authors thank the Reviewer for the thorough and attentive assessment of our work. We have carefully revised the text to ensure a pleasant reading experience free of typographical errors.

    1. Author response:

      We want to thank the reviewers for their constructive feedback.

      General

      The recall values of our method range between 78.6% for all urine cases to 83.3% for feces (and not between 70-80%, as stated by reviewer #2), with a mean precision of 85.6%. This is rather similar to other machine learning-based methods commonly used for the analysis of complicated behavioral readouts. For example, in the paper presenting DeepSqueak for analysis of mouse ultrasonic vocalizations (Coffey et al. DeepSqueak: a deep learning-based system for detection and analysis of ultrasonic vocalizations. Neuropsychopharmacol. 44, 859–868 (2019). https://doi.org/10.1038/s41386-018-0303-6), the recall values reported for both DeepSqueak, Mupet and Ultravox (Fig. 2c, f) are very similar to our method.

      We have analyzed and reported all the types of errors made by our methods, which are mostly technical. For example, depositions that overlap the mouse blob for too long till getting cold will be associated with the mouse and therefore will not be detected (“miss” events). These technical errors are not supposed to create a bias for a specific biological condition and, hence, shouldn’t interfere with the use of our method. A video showing all of the mistakes made by our algorithm on the test set was submitted (Figure 2-video 1).

      Below we will to relate to specific points and describe our plan to revise the manuscript accordingly.

      Detection accuracy

      a. It should be noted that when large urine spots are considered, our algorithm got 100% correct classification (Figure 2, supplement 1, panel b). However, small urine deposits are very similar to feces in their appearance in the thermal picture. In fact,  if the feces are not shifted, discrimination can be quite challenging even for human annotators. To demonstrate the accuracy of the proposed method relative to human annotators, we plan to compare its results with the accuracy of a second human annotator.

      b. As part of the revision, we plan to test general machine learning-based object detectors such as faster-RCNN or YOLO (as suggested by Reviewer 2) and compare them with our method.

      c. To check if our method may introduce bias to the results, we plan to check if the errors are distributed evenly across time, space, and genders.

      Design choices

      (A) The preliminary detection algorithm has several significant parameters. These are:

      a. Minimal temperature rise for detection: 1.1°C rise during 5 sec.

      b. Size limits of the detection: 2 - 900 pixels.

      c. Minimal cooldown during 40 sec: 1.1°C and at least half the rise.

      d. Minimal time between detections in the same location: 30 sec.

      We chose to use low thresholds for the preliminary detection to allow detection of very small urinations and to minimize the number of “miss” events, relying on the classifier to robustly reject false alarms. Indeed, we achieved a low rate of miss events: 5 miss events for the entire test set (1 miss event per ~90 minutes of video). We attribute these 5 “miss” events to partial occlusion of the detection by the mouse.

      To adjust the preliminary detection parameters to a new environment, one will need to calibrate these parameters in their own setup. Mainly, the size of the detection depends on the resolution of the video, and the cooldown rate might be affected by the material of the floor, as well as the room temperature.

      We plan to explore the robustness of these parameters in our setup and report the influence on the accuracy of the preliminary algorithm.

      (B) We chose to feed the classifier with 71 seconds of videos (11 seconds before the event and 60 seconds after it) as we wanted the classifier to be able to capture the moment of the deposition, the cooldown process, as well as urine smearing or feces shifting which might give an additional clue for the classification. In the revised paper we plan to report accuracy when using a shorter video for classification.

      Generability

      a. In the revised version, we plan to report the accuracy of the method used on a different strain of mice (C57), with a different arena color (white arena instead of black).

      Statistics

      a. In the revised paper, we will explain why we chose each time window for analysis. Also, we will report statistics for different time windows, as suggested by Reviewer 3.

      b. Unlike reviewer #2, we don’t think that the small difference in recall rate between urine and feces (78.6% vs. 83.3%, respectively) creates a bias between them. Moreover, we don’t compare the urine rate to the feces rate.

      c. In the revised manuscript we will explicitly report the precision scores, although they also appear in our manuscript in Fig. 2- Supplement 1b.

    1. Author response:

      The following is the authors’ response to the previous reviews.

      Reviewer 1:

      • Although ROC AUC is a widely used metric. Other metrics such as precision, recall, sensitivity, and specificity are not reported in this work. The last two metrics would help readers understand the model’s potential implications in the context of clinical research.

      In response to this comment and related ones by Reviewer 2, we have overhauled how we evaluate our models. In the revised version, we have removed Micro ROC-AUC, as this evaluation metric is hard to interpret in the recommender system setting. Instead, the updated version fully focuses on two metrics: ROC-AUC and Precision at 1 of the negative class, both computed per spectrum and then averaged (equivalent to the instance-wise metrics in the previous version of the manuscript). We believe these metrics best reflect the use-case of AMR recommenders. In addition, we have kept (drug-)macro ROC-AUC as a complementary evaluation metric. As the ROC-AUC can be decomposed into sensitivity and specificity (at different prediction probability thresholds), we have added a ROC curve where sensitivity and specificity are indicated in Figure 8 (Appendices).

      • The authors did not hypothesize or describe in any way what an acceptable performance of their recommender system should be in order to be adopted by clinicians.

      In Section 4.3, we have extended our experiments to include a baseline that represents a “simulated expert”. In short, given a species, an expert can already make some best guesses as to what drugs will be effective or not. To simulate this, we count resistance frequencies per species and per drug in the training set, and use this as predictions of a “simulated expert”.

      We now mention in our manuscript that any performance above this level results in a real-world information gain for clinical diagnostic labs.

      • Related to the previous comment, this work would strongly benefit from the inclusion of 1-2 real-life applications of their method that could showcase the benefits of their strategy for designing antibiotic treatment in a clinical setting.

      While we think this would be valuable to try out, we are an in silico research lab, and the study we propose is an initial proof-of-concept focusing on the methodology. Because of this, we feel a real-life application of the model is out-of-scope for the present study.

      • The authors do not offer information about the model features associated with resistance. This information may offer insights about mechanisms of antimicrobial resistance and how conserved they are across species.

      In general, MALDI-TOF mass spectra are somewhat hard to interpret. Because of a limited body of work analyzing resistance mechanisms with MALDI-TOF MS, it is hard to link peaks back to specific pathways. For this reason, we have chosen to forego such an analysis. After all, as far as we know, typical MALDI-TOF MS manufacturers’ software for bacterial identification also does not provide interpretability results or insights into peaks, but merely gives an identification and confidence score.

      However, we do feel that the whole topic revolving around “the degree of biological insight a data modality might give versus actual performance and usability” merits further discussion. We have ultimately decided not to include a segment in our discussion section as it is hard to discuss this matter concisely.

      • Comparison of AUC values across models lacks information regarding statistical significance. Without this information it is hard for a reader to figure out which differences are marginal and which ones are meaningful (for example, it is unclear if a difference in average AUC of 0.02 is significant). This applied to Figure 2, Figure 3, and Table 2 (and the associated supplementary figures).

      To make trends a bit more clear and easier to discern, in our revised manuscript, all models are run for 5 replicates (as opposed to 3 in the previous version).

      There is an ongoing debate in the ML community whether statistical tests are useful for comparing machine learning models. A simple argument against them is that model runs are typically not independent from each other, as they are all trained on the same data. The assumptions of traditional statistical tests are therefore violated (t-test, Wilcoxon test, etc.). With such tests statistical significance of the smallest differences can simply be achieved by increasing the number of replicates (i.e. training the same models more times).

      More complicated but more appropriate statistical tests also exist, such as the 5x2 cross-validated t-test of Dietterich: “Approximate statistical tests for comparing supervised classification learning algorithms”, Neural computation 1998. However, these tests are typically not considered in deep learning, because only 10% of the data can be used for training, which is practically not desirable. The Friedman test of Demšar "On the appropriateness of statistical tests in machine learning." Workshop on Evaluation Methods for Machine Learning in conjunction with ICML. 2008., in combination with posthoc pairwise tests, is still frequently used in machine learning, but that test is only applicable in studies where many datasets are tested.

      For those reasons, most deep learning papers that only analyse a few datasets typically do not consider any statistical tests. For the same reasons, we are also not convinced of the added value of statistical tests in our study.

      • One key claim of this work was that their single recommender system outperformed specialist (single species-antibiotic) models. However, in its current status, it is not possible to determine that in fact that is the case (see comment above). Moreover, comparisons to species-level models (that combine all data and antibiotic susceptibility profiles for a given species) would help to illustrate the putative advantages of the dual branch neural network model over species-based models. This analysis will also inform the species (and perhaps datasets) for which specialist models would be useful to consider.

      We thank the reviewer for this excellent suggestion. In our new manuscript, we have dedicated an entire section of experiments to testing such species-specific recommender models (Section 4.2). We find that species-specific recommender systems generally outperform the models trained globally across all species. As a result, our manuscript has been majorly reworked.

      • Taking into account that the clustering of spectra embeddings seemed to be species-driven (Figure 4), one may hypothesize that there is limited transfer of information between species, and therefore the neural network model may be working as an ensemble of species models. Thus, this work would deeply benefit from a comparison between the authors' general model and an ensemble model in which the species is first identified and then the relevant species recommender is applied. If authors had identified cases to illustrate how data from one species positively influence the results for another species, they should include some of those examples.

      See the answer to the remark above.

      • The authors should check that all abbreviations are properly introduced in the text so readers understand exactly what they mean. For example, the Prec@1 metric is a little confusing.

      See the answer to a remark above for how we have overhauled our evaluation metrics in the revised version. In addition, in the revised version, we have bundled our explanations on evaluation metrics together in Section 3.2. We feel that having these explanations in a separate section will improve overall comprehensibility of the manuscript.

      • The authors should include information about statistical significance in figures and tables that compare performance across models.

      See answer above.

      • An extra panel showing species labels would help readers understand Figure 11.

      We have tried to play around with including species labels in these plots, but could not make it work without overcrowding the figure. Instead, we have added a reminder in the caption that readers should refer back to an earlier figure for species labels.

      • The authors initially stated that molecular structure information is not informative. However, in a second analysis, the authors stated that molecular structures are useful for less common drugs. Please explain in more detail with specific examples what you mean.

      In the previous version of our manuscript, we found that one-hot embedding-based models were superior to structure-based drug embedders for general performance. The latter however, delivered better transfer learning performance.

      In our new experiments however, we perform early stopping on “spectrum-macro” ROC-AUC (as opposed to micro ROC-AUC in the previous version). As a consequence, our results are different. In the new version of our manuscript, Morgan Fingerprints-based drug embedders generally outperform others both “in general” and for transfer learning. Hence, our previously conflicting statements are not applicable to our new results.

      • The authors may want to consider adding a few sentences that summarize the 'Related work' section into the introduction, and converting the 'Related work' section into an appendix.

      While we acknowledge that such a section is uncommon in biology, in machine learning research, a “related work” section is very common. As this research lies on the intersection of the two, we have decided to keep the section as such.

      Reviewer 2:

      • Are the specialist models re-trained on the whole set of spectra? It was shown by Weis et al. that pooling spectra from different species hinders performance. It would then be better to compare directly to the models developed by Weis et al, using their splitting logic since it could be that the decay in performance from specialists comes from the pooling. See the section "Species-stratified learning yields superior predictions" in https://doi.org/10.1038/s41591-021-01619-9.

      We train our “specialist” (or now-called “species-drug classifiers”) just as described in Weis et al.: All labels for a drug are taken, and then subsetted for a single species. We have clarified this a bit better in our new manuscript. The text now reads:

      “Previous studies have studied AMR prediction in specific species-drug combinations. For this reason, it is useful to compare how the dual-branch setup weighs up against training separate models for separate species and drugs. In Weis et al. (2020b), for example, binary AMR classifiers are trained for the following three combinations: (1) E. coli with Ceftriaxone, (2) K. pneumoniae with Ceftriaxone, and (3) S. aureus with Oxacillin. Here, such "species-drug-specific classifiers" are trained for the 200 most-common combinations of species and drugs in the training dataset.

      • Going back to Weis et al. a high variance in performance between species/drug pairs was observed. The metrics in Table 2 do not offer any measurement of variance or statistical testing. Indeed, some values are quite close e.g. Macro AUROC of Specialist MLP-XL vs One-hot M.

      See our answer to a remark of Reviewer 1 for our viewpoint on statistical significance testing in machine learning.

      • Since this is a recommendation task, why were no recommendation system metrics used, e.g. mAP@K, mRR, and so (apart from precision@1 for the negative class)? Additionally, since there is a high label imbalance in this task (~80% negatives) a simple model would achieve a very high precision@1.

      See the answer to a remark above for how we have overhauled our evaluation metrics in the revised version. In addition, in choosing our metrics, we wanted metrics that are both (1) appropriate (i.e. recommender system metrics), but also (2) easy to interpret for clinicians. For this reason, we have not included metrics such as mAP@K or mRR. We feel that “spectrum-macro” ROC-AUC and precision@1 cover a sufficiently broad evaluation set of metrics but are easy enough to interpret.

      • A highly similar approach was recently published (https://doi.org/10.1093/bioinformatics/btad717). Since it is quite close to the publication date of this paper, it could be discussed as concurrent work.

      We thank the reviewer for bringing our attention to this study. We have added a paragraph in our revised version discussing this paper as concurrent work.

      • It is difficult to observe a general trend from Figure 2. A statistical test would be advised here.

      See our answer to a remark of Reviewer 1 for our viewpoint on statistical significance testing in machine learning.

      • Figure 5. UMAPs generally don't lead to robust quantitative conclusions. However, the analysis of the embedding space is indeed interesting. Here I would recommend some quantitative measures directly using embedding distances to accompany the UMAP visualizations. E.g. clustering coefficients, distribution of pairwise distances, etc.

      In accordance with this recommendation, we have computed many statistics on the MALDI-TOF spectra embedding spaces. However, we could not come up with any statistic that illuminated us more than the visualization itself. For this reason, we have kept this section as is, and let the figure speak for itself.

      • Weis et al. also perform a transfer learning analysis. How does the transfer learning capacity of the proposed models differ from those in Weis et al?

      Weis et al. perform experiments towards “transferability”, not actual transfer learning. In essence, they use a model trained on data from one diagnostic lab towards prediction on data from another. However, they do not conduct experiments to learn how much data such a pre-trained classifier needs to fine-tune it for adequate performance on the new diagnostic lab, as we do. The end of Section 4.4 discusses how our proposed models specifically shine in transfer learning. The paragraph reads:

      “Lowering the amount of data required is paramount to expedite the uptake of AMR models in clinical diagnostics. The transfer learning qualities of dual-branch models may be ascribed to multiple properties. First of all, since different hospitals use much of the same drugs, transferred drug embedders allow for expressively representing drugs out of the box. Secondly, owing to multi-task learning, even with a limited number of spectra, a considerable fine-tuning dataset may be obtained, as all available data is "thrown on one pile".”

    1. Author response:

      The following is the authors’ response to the previous reviews.

      Reviewer #1 (Recommendations for the authors):

      In the revision the authors addressed all the points from this reviewer and most from other reviewers. The method is now described practically and in detail. The only thing this reviewer still misses is number of subtomograms for each structure. How many subtomograms did the authors extract by Dynamo from how many rootlets? How many out of them were valid in K-mean classification and used for sub-averages? Was the subaverage used for training by TomoSeg or each subtomograms belonging to the class? By clarifying it, this work will be referred by those who would take the same approach for other biological structures. 

      We now added the particle numbers of all structures to the corresponding text, figure legends and methods and elaborate on this below. We also clarify how we trained the TomoSeg network.

      Particle numbers:

      We extracted 591,453 subtomograms from 14 tomograms. This initial set was rigorously cleaned with Zcleaning, reducing it to 358,863 particles. Further cross-correlation and cluster cleaning yielded a final set of 180,252 particles. 

      This refined set was used for the structures presented in Figures 3E, F and S5A, B, as well as for the classification shown in Figure S5C. Of the classified particles, 34,490 particles contributed to classaverage 5 in Figure 3G and S5D, E. The detailed particle distribution of this classification is added as a supplementary table: 

      We further clarified the numbers in the results, method, and supplementary material section:

      Results:

      Page 7: “Figure 3. … (E) The initial average after alignment of 180,252 particles with a wide spherical alignment mask. (F) The initial average of particles aligned with a narrower cylindrical mask. (G) A class average of 34,490 particles, aligned and classified with a narrow mask.”

      Page 7/8: “We manually defined the D1-bands as surfaces in Dynamo (Castaño-Díez et al, 2017) and then approximated the number of filaments per surface area. We extracted 591,453 subtomograms from 14 tomograms, approximately four times as many subtomograms as the expected number of filaments. This initial set was rigorously cleaned to discard particles that did not have a filament in their center or had distorted striations, reducing it to 358,863 particles. Further cross-correlation and cluster cleaning yielded a final set of 180,252 particles.”

      Page 8: “We directly unbinned the data to a pixel size of 5.55 Å/pixel and used the rigorously cleaned set of 180,252 particles.”

      Page 8: “The resulting class averages contained a twist along the filament length in classes 2, 3 and 4 and most prominently in class 5. These four classes contain 72.29% of the particles, highlighting the prevalence of the twist-feature (Fig S5C, Table S2). Class 5 contained 19.27% of the data, i.e. 34,490 particles, and revealed the twist is formed by a filament of 2 nm thick by 5 nm wide with a helical groove along its length (Fig 3G).”

      Methods: 

      Page 13: “Surface triangulation was set to result in 591,453 extraction coordinates approximately 4 times the number of expected filaments.”

      Page 13: “Particles with no filament in their center, or particles that originated from regions in the rootlet with distorted striations (at the edge of a grid hole) were discarded, resulting in a particle set of 358,863 particles. Cluster- and careful per-tomogram cross-correlation cleaning were applied to remove particle duplicates, remaining particles with no filaments, and particles with disordered D-bands. This resulted in a final cleaned particle dataset of 180,252 particles.”

      Page 13: “For the final subtomogram class-average that contained the twist, the cleaned particle dataset motl with 180,252 particles was converted to a STAR file compatible with RELION 4.0 Alpha (Zivanov et al, 2022).”

      Supplementary material: 

      Page 17: “Table S1. Particle distribution of RELION 4.0 Alpha classification with alignment.”

      Page 22: “Figure S5: (C) Class averages of a classification with alignment of particles from Fig S5A. Their particle distribution is shown in Table S2.”

      For the initial classification, to identify a homogeneous subset, we used the original set of 591,453 picked particles (Fig S5A). The class distribution for this set is added as a supplementary table.

      We further clarified this in the results, methods and supplementary material:

      Results:

      Page 8: “To ask if there were any recurring arrangements of neighboring filaments in the data that could allow us to average a homogeneous subset, we resorted to classification of the original set of 591,453 particles (Fig S5A, Table S1).”

      Methods:

      Page 13: “Prior to classification in subTOM, alignments with limited X/Y/Z shifts and increasingly finer in-plane rotations were performed on the original dataset with 591,453 particles.”

      Supplementary material:

      Page 17: “Table S2. Particle distribution of subTOM classification for particle heterogeneity.”

      Page 22: “Figure S5: … The surfaces of a cross-section through the filament classes are shown in orange. The particle distribution is provided in Table S1. (B) …”

      TomoSeg network training

      The subtomograms and the class averages presented at the end of the manuscript were not used as input for training the TomoSeg network. TomoSeg training requires positive and negative sets of segmented 2D regions of interest within tomogram slices. These areas were selected and segmented within the Eman2 TomoSeg GUI, iteratively increasing the size of the training sets until satisfactory performance was achieved. 

      We have clarified the TomoSeg training process in the methods section to avoid confusion:

      Methods: 

      Page 13: “The tomograms were then preprocessed in EMAN2.2 for training of the TomoSeg CNN (Chen et al, 2017). Here, the features (filaments, D-bands, A-bands, gold fiducials, actin, membranes, membrane-associated densities and ice contaminations) were individually trained for each tomogram. This involved manually tracing a training set of 10-20 positive and 100-150 negative boxed areas per feature. We iteratively expanded and curated the training set until the segmentations were accurate, as recommended in the software manuals. Segmented maps were allowed to compete for the assignment of pixels in the tomograms, cleaned up in Amira (Thermo Fisher Scientific) and converted to object files.”

    1. Author response:

      The following is the authors’ response to the original reviews.

      Reviewer #1:

      (1) One issue that needs to be considered is the nomenclature of the enhancer. The authors have presented data to show this enhancer controls the expression of Ctnnb1 in the stomach, intestine, and colon tissues. However, the name proposed by the authors, ieCtnnb1 (intestinal enhancer of Ctnnb1), doesn't represent its functions. It might be more appropriate to call it a different name, such as gieCtnnb1 (gastrointestinal enhancer of Ctnnb1).

      We thank the reviewer for the insightful suggestion and agree that wholemount reporter assays indicated ieCtnnb1 and ieCTNNB1 indeed display activity in the stomach. However, in current study, we focused on the cellular distribution and the function in intestinal epithelia. After careful consideration, we reasoned that the current designation, ieCtnnb1, would be more appropriately represent its expression pattern and functions based on provided evidence. We hope the reviewer could understand our reasoning.  

      (2) The writing of this manuscript can be improved in a few places. 

      a) The definitions or full names for the abbreviations of some terms, e.g., Ctnnb1, ieCtnnb1, in both abstract and main text, are needed when they first appear. Specifically, Line 108 should be moved to Lines 26 and 95. Lines 125126 are redundant. ieCtnnb1 in Line 130 needs to be defined.

      We appreciate the suggestion. In the revision, we have included the definition of Ctnnb1 and the full name of ieCtnnb1 when they first appear in the abstract and the main text. Lines 125-126 were deleted in the revision.

      b) Line 192-194, the description of the result needs to be rewritten to reflect

      the higher expression of LacZ transcript in eGFP+ cells. 

      We would like to emphasize that the key point of this part is that the enhancer activity of ieCtnnb1 is present in both Lgr5-eGFP+ and Lgr5-eGFP- cells. This was validated by single-cell sequencing, which revealed the presence of LacZ transcripts in the Paneth cells. Moreover, we could not confidently conclude that eGFP+ cells have higher expression levels of LacZ, as these measurements were obtained from separate, semi-quantitative RTqPCR experiments.

      c)  More details are needed for how the data using human tumor samples were generated and how they were analyzed. 

      We thank the suggestion. In the revision, we have provided additional details regarding the data and subsequent analyses of human CRC samples as follows: “We previously conducted paired analyses of chromatin immunoprecipitation sequencing (ChIP-seq) for H3K27ac and H3K4me3, alongside RNA-seq on 68 CRC samples and their adjacent normal (native) tissue (Li et al., 2021).  In the current study, we performed analyses for the enrichment of H3K27ac and H3K4me3 at ieCTNNB1 and CTNNB1 promoter regions, as well as the expression levels of CTNNB1, followed by combined analyses (Figure. 5A, Figure 5 - figure supplement 1).”

      d) The genomic structures from multiple species are presented at the bottom of Figure 1a. However, the description and explanation are lacking in both the main text and the figure legend.

      We apologize for not presenting clearly. We have added related description in the legend of Figure 1A as “The sequence conservation of the indicated species is shown at the bottom as vertical lines”. We also added an explanation in lines 162-163 of the main text: “Notably, unlike neCtnnb1, the primary sequence of ieCtnnb1 is not conserved among vertebrates (Figure 1A, bottom)”.

      Reviewer #2:

      (1) One of the main issues emerging during reading concerns the interpretation of the consequence of deleting the ieCtnnb1 enhancer. The authors write on line 235 that the deletion of ieCtnnb1 "undermined" Wnt signaling in the intestinal epithelium. This feels too strong, as the status of the pathway is only mildly affected, testified by the observation that mice with homozygous deletion on ieCtnnb1 are alive and well. The enhancer likely "only" drives higher Ctnnb1 expression, and it does not affect Wnt signaling by other mechanisms. The reduction of Wnt target gene expression upon its deletion is easily interpreted as the consequence of reduced β-catenin. Also the title, in my opinion, allows this ambiguity to stick in readers' minds. In other words, the authors present no evidence that the ieCtnnb1 enhancer controls Wnt signaling dosage via any mechanism other than its upregulation of Ctnnb1 expression in the intestinal epithelium. Reduced Ctnnb1, in turn, could explain the observed reduction of Wnt signaling output and the interesting downstream physiological consequences. Unless the authors think otherwise, I suggest they clarify this throughout the text, including necessary modifications to the title.

      We greatly appreciate the reviewer’s important comments and suggestion. We agree that ieCtnnb1’s direct effect on the canonical Wnt signaling is to regulate the transcription of Ctnnb1 in the intestinal epithelia. Therefore, knockout of ieCtnnb1 leads to compromised expression of Ctnnb1 and, consequently, reduced Wnt signaling.  The term “undermined” is indeed too strong and has been revised to “compromised” in the revision (line 237). Similar revisions have been made throughout the manuscript. Particularly, the title was changed into “A Ctnnb1 enhancer transcriptionally regulates Wnt signaling dosage to balance homeostasis and tumorigenesis of intestinal epithelia”. However, as we state in the following point, decreased levels of β-catenin on ieCtnnb1 loss could lead to indirect effect, including the reduced expression of Bambi, which might cause a more significant decrease of nuclear β-catenin.

      (2) It is unclear how the reduction of Ctnnb1 mRNA caused by deletion of ieCtnnb1 in mice could lead to a preferential decrease of nuclear more than membranous β-catenin (Fig. 1K and L). This might reflect a general cell autonomous reduction in Wnt signaling activation; yet, it is not clear how this could occur. Do the authors have any explanations for this?

      It's a very important question. We observed that in inCtnnb1 knockout epithelia, the expression of Bambi (BMP and activin membrane-bound inhibitor) was significantly downregulated. Since BAMBI has been reported to stabilize β-catenin and facilitate its nuclear translocation, it is likely that the reduced level of BAMBI resulting from the loss of ieCtnnb1 further decreased nuclear βcatenin. In the revision, the expression change of Bambi has been added in Figure 1M. Moreover, the related content was extensively discussed with proper citations: “We noticed that after knocking out ieCtnnb1, the level of βcatenin in the nuclei of small intestinal crypt cells of Ctnnb1Δi.enh mice decreased more significantly compared to that in the cytoplasm (49.5% vs. 29.8%). Although the loss of ieCtnnb1 should not directly lead to reduced nuclear translocation of β-catenin, RNA-seq results showed that the loss of ieCtnnb1 causes a reduction in the expression of Bambi (BMP and activin membranebound inhibitor), a target gene in the canonical Wnt signaling pathway (Figure 1M). BAMBI promotes the binding of Frizzled to Dishevelled, thereby stabilizing β-catenin and facilitating its nuclear translocation (Lin et al., 2008; Liu et al., 2014; Mai et al., 2014; Zhang et al., 2015). Thus, it is likely that the decreased level of BAMBI resulting from the loss of ieCtnnb1 further reduced nuclear βcatenin”. 

      (3) In Figure 1 K-L the authors show β-catenin protein level. Why not show its mRNA?

      The mRNA levels of Ctnnb1 in small and large intestinal crypts were shown in Figure 1I and 1J, demonstrating reduced expression of Ctnnb1 upon ieCtnnb1 knockout. We hope the reviewer understands that it is unnecessary to measure the nuclear and cytosolic levels of Ctnnb1 transcripts, as the total mRNA level generally reflects the protein level. 

      (4) Concerning the GSEA of Figure 1 that includes the Wnt pathway components: a) it would be interesting to see which components and to what extent is their expression affected; b) why should the expression of Wnt components that are not Wnt target genes be affected in the first place? It is odd to see this described uncritically and used to support the idea of downregulated Wnt signaling.

      We appreciate the suggestion and apologize for any lack of clarity. The affected components of the Wnt signaling pathway and the extent of their changes are summarized in Figure 1 – figure supplement 3. Additionally, we have provided explanations for their downregulation. For instance, the reduced expression of Wnt3 and Wnt2b ligands in ieCtnnb1-KO crypts may be attributed to the decreased numbers of Paneth cells.  

      (5) In lines 251-252 the authors refer to "certain technical issues" in the isolation of cell type from the intestinal epithelium. Why this part should be obscure in the characterization of a tissue for which there are several established protocols of isolation and analysis is not clear. I would rather describe what these issues have been and how they protocol of isolation and analysis is not clear. I would rather describe what these issues have been and how they might have affected the data presented.

      We thank the reviewer for pointing this out. The single-cell preparation and sequencing of small intestinal cryptal epithelial cells were carried out largely according to reported protocols with slight modification. The enrichment of live crypt epithelial cells (EpCAM+DAPI-) by flow cytometry and cell filtering after single-cell sequencing were appropriate (Figure 2 – figure supplement 1A1C). We would like to emphasize a few points: 1) Unlike other protocols, we did not exclude immune cells, erythrocytes, or endothelial cells using negative sorting antibodies. 2) When defining cell populations, we focused exclusively on epithelial cell types and did not consider other cell types, such as immune cells. As a result, the so-called “undefined” cells include a mixture of nonepithelial cells. Indeed, markers for erythrocytes (AY036118/Erf1, PMID:12894589) and immune cells (Gm42418 and Lars2, PMID:30940803, PMID: 35659337) were the top three enriched genes in the “undefined” cluster (Figure 2 – figure supplement 1D). 3) Nonetheless, the overall findings remain robust, as key observations such as the loss of Paneth cells and reduced cell proliferation were validated through histological studies. This information has been incorporated into the revised manuscript with related references cited (lines 254-259). 

      (6) It is interesting that human SNPs exist that seem to fall within the ieCTNNB1 enhancer and affect the gastrointestinal expression of CTNNB1. Could the author report or investigate whether this SNP is present in human populations that have been considered in large-scale studies for colorectal cancer susceptibility? It seems to me a rather obvious next step of extreme importance to be ignored.

      (7) From Figure 5A a reader could conclude that colorectal tumor cells have a higher expression of CTNNB1 mRNA than in normal epithelium. This is the first time I have seen this observation which somewhat undermines our general understanding of Wnt-induced carcinogenesis exclusively initiated by APC mutations whereby it is β-catenin's protein level, not expression of its mRNA, of crucial importance. I find this to be potentially the most interesting observation of the current study, which could be linked to the activity of the enhancer discovered, and I suggest the authors elaborate more on this and perhaps consider it for future experimental follow-ups.

      We appreciate the comments and suggestions.  We therefore added related content in the revision (lines 470-475): “Importantly, ieCTNNB1 displayed higher enhancer activity in most CRC samples collected in the study. Moreover, the SNP rs15981379 (C>T) within ieCTNNB1 is associated with the expression of CTNNB1 in the GI tract. Future population studies could investigate how the enhancer activity of ieCTNNB1 and this particular SNP are associated with CRC susceptibility and prognosis”.

      (8) I am surprised that the authors, who seem to have dedicated lots of resources to this study, are satisfied by analyzing their ChIP experiments with qPCR rather than sequencing (Figure 6). ChIP-seq would produce a more reliable profile of the HNF4a and CREB1 binding sites on these loci and in other control regions, lending credibility to the whole experiment and binding site identification. Sequencing would also take care of the two following conceptual problems in primer design. 

      First: while the strategy to divide enhancer and promoter in 6 regions to improve the resolution of their finding is commendable, I wonder how the difference in signal reflects primers' efficiency rather than HNF4/CREB1 exact positioning. The possibility of distinguishing between regions 2 and 3, for example, in a ChIP-qPCR experiment, also depends on the average DNA fragment length after sonication, a parameter that is not specified here. 

      Second: what are the primers designed to detect the ieCtnnb1 enhancer amplifying in the yellow-columns samples of Figure 6G? In this sample, the enhancer is deleted, and no amplification should be possible, yet it seems that a value is obtained and set to 1 as a reference value.

      This is indeed a crucial point, and we fully agree with the reviewer that “ChIP-seq would produce a more reliable profile of the HNF4a and CREB1 binding sites on these loci and in other control regions”. However, we believe that our current ChIP-qPCR experiments have adequately addressed the potential concerns raised by the reviewers. (1) We have ensured that the DNA fragment length after sonication falls within the range of 200 bp to 500 bp, with an average length of approximately 300 bp (Author response image 1A). We have stated the point in the revised methods section (line 633). (2) We have randomly inspected 14 out of 26 primer sets used in Figure 6 and its supplemental figure (Author response image 1B-E), confirming that all primer sets demonstrate equal amplification efficiency (ranging from 90% to 110%). This information has also been included in the revised methods section (line 650). (3) Figures 6G and 6H show reduced enrichment of HNF4𝛼 (6G) and p-S133-CREB1 (6H) at the Ctnnb1 promoter in ieCtnnb1 knockout ApcMin/+ tumor tissues. The ChIP-qPCR primers used were positioned at the Ctnnb1 promoter, not at ieCtnnb1, with IgG control enrichment serving as the reference values on the Y-axes. 

      Author response image 1.

      (A) Agarose gel electrophoresis of sonicated DNA. (B-E) Tests of amplification efficiency for primer sets used in ChIP-qPCR.

      (9) The ChIP-qPCR showing preferential binding of pS133-CREB1 in small intestinal crypts and CHT15 cells (line 393) should be shown. 

      The ChIP-qPCR results demonstrating preferential binding of p-S133-

      CREB1 over CREB1 have been added in revised Figure 6C, 6D and Figure 6 – Supplement 1C.

      (10) It is not entirely clear what the blue tracks represent at the bottom of Figures 6C-D and Figure 6 - Figure Supplement 1C-D. The ChIP-seq profiles of both CREB1 and HNF4a shown in Figures 6A and Figure 6 - Figure Supplement 1A do not seem to match. Taking HNF4a, for example from Figure 6 - Figure Supplement 1A it seems to bind on the Ctnnb1 promoter, while in Figure 6 - Figure Supplement 1D the peaks are within the first intron. I realize this might all be a problem with a different scale across figure panels, but I suggest producing a cleared figure.

      We apologize for the confusion. We have revised Figure 6C-6D, Figure 6 - figure supplement 1C-D, and the corresponding legends to enhance clarity. (1) The top panels of Figures 6C and 6D respectively highlight shaded regions of ieCTNNB1 (pink) and the CTNNB1 promoter (grey) in Figure 6A, emphasizing the enrichment of p-S133-CREB1.  (2) The top panels of Figure 6 – figure supplement 1C and 1D respectively highlight shaded regions of ieCtnnb1 (pink) and the Ctnnb1 promoter (grey) in Figure 6A – figure supplement 1A, emphasizing the enrichment of HNF4α. (3) Because Figures 6C-6D and Figure 6 - figure supplement 1C-1D respectively correspond to human and mouse genomes, the positions of peaks and scales differ.  

      (11) In the intro the authors refer to "TCF-4". I suggest they use the more recent unambiguous nomenclature for this family of transcription factors and call it TCF7L2.

      TCF-4 has been changed into TCF7L2 in the revision (line 81)

      (12) In lines 121-122, the authors write "Although numerous putative enhancers...only a fraction of them were functionally annotated". To what study/studies are the authors referring? Please provide references.

      References were added in the revision (line 124)

      (13) In some parts the authors use strong words that should in my opinion be attenuated. Examples are: (i) at line 224, "maintains" would be better substituted with "contribute", as in the absence of ieCtnnb1, Ctnnb1 is still abundantly expressed; (ii) at line 266 "compromised" when the proliferative capacity of CFCs and TACs seems to be only mildly reduced; (iii) at line 286 "disrupts", the genes are simply downregulated.

      We thank these great suggestions. 1) On lines 224-225, the sentence was revised to: “These data suggest that ieCtnnb1 plays a specific role in regulating the transcription of Ctnnb1 in intestinal epithelia”. 2) On line 271, “compromised” were replaced with “mildly reduced”. 3) In ieCtnnb1 knockout epithelial cells of small intestine, genes related to secretory functions were decreased, while genes related to absorptive functions were increased. Therefore, the term 'disrupts' is more appropriate than 'downregulates'. 

      Reviewer #3:

      Line 81, c-Myc should be human MYC (italics) to agree with the other human gene names in this sentence. 

      c-Myc has been changed into MYC in the revision (line 82)

      Line 215, wildtype should be wild-type. 

      “wildtype” has been changed into “wild-type” in the revision (line 215)

      Line 224, Elimination of the enhancer did not abolish expression of Ctnnb1; therefore, it would be better to say that it "helps to maintain Ctnnb1 transcription" 

      The sentence was changed into “These data suggest that ieCtnnb1 plays a specific role in regulating the transcription of Ctnnb1 in intestinal epithelia” in revision (lines 224-225)

      Line 228, perhaps "to activate transcription" is meant. 

      “active” has been changed into “activate” in the revision (line 228)

      Line 235, consider "reduced" instead of "undermined". 

      “undermined” has been replaced with “compromised” in the revision (line 237)

      Line 262, "em" dashes should be a both ends of this insertion. 

      Line 298, "dysfunctional" would be better.

      Line 356, "samples were". 

      Line 481, 12-hr (add hyphen). 

      All above points have been optimized according to the reviewer’s suggestion.

      Line 712, Is "poly-N" meant? 

      “Poly-N” indicates undetected bases during sequencing. This explanation was added in the revision (lines 759-760).

      Figure 1K, the GAPDH signal is not visible and that panel is unnecessary as there is an H3 control.   

      Figure 1K and 1L respectively show levels of nuclear and cytoplasmic βcatenin. GAPDH and H3 were used as internal references for the cytoplasmic and nuclear fractions, respectively, confirming both robust fractionation and equal loading.

    1. Author response:

      We are grateful to the reviewers and editors for their insightful comments. All recognized that, while mutation recurrences have been used for inferring cancer drivers, our approach has the rigor of quantitative analysis. We would like to add that, without rigorously ruling out mutational hotspots, most CDNs have not been accepted as driver mutations.

      This paper develops the theory stating that i) recurrent point mutations are true Cancer Driving Nucleotides (CDNs); and ii) non-recurrent mutations are unlikely to be CDNs. The reviewers question that, with the theory, we still have not discovered new driving mutations. This is done in the companion paper. Table 3 shows that, averaged across cancer types, the conventional method would identify 45 CDGs while the CDN method tallies 258 CDGs. The power of the CDN method in identifying new driver genes is evident.

      The second question is "By this theory, will we be able discover most CDNs when the sample size increases from ~ 1000 to 10,000?"  This is a question of forecast and can be partially answered using GENIE data. Fig. 7 of this study shows that, when n increases from ~ 1000 to ~ 9,000, the numbers of discovered CDNs increase by 3 – 5 fold, most of which come from the two-hit class, as expected.

      Fig. 7 also addresses the queries whether we have used datasets other than TCGA. We indeed have used all public data, including GENIE, ICGC and other integrated resources such as COSMIC. For the main study, we rely on TCGA because it is unbiased for estimating the probability of CDN occurrences. In many datasets, the numerators are given but the denominators are not (the number of patients with the mutation / the total number of patients surveyed). 

      The third question is about mutation recurrences among cancer types. As stated by one reviewer, "different cancer types have unique mutational landscapes". While this is true when the analysis is done at the whole-gene level, one gets a different picture at the nucleotide level where the resolution is much higher. The pan-cancer trend of point mutations is evident in Fig. 4 of the companion paper.

      Again, we heartily appreciate the criticisms and suggestions of the reviewers and editors!

    1. Author response:

      We are grateful for the reviewers' acknowledgment of the originality of our manuscript and its potential importance in cancer treatment. We appreciate the reviewers' critiques on certain conclusions and thank them for their thorough feedback on the manuscript. In the revised version, we will provide a more detailed clarification of the previous data and methods, bolster the existing data, and present additional evidence in support of our hypothesis. Please find below our replies to particular concerns.

      In brief, to address the comments from Reviewer 1, we will make the following revisions in the manuscript:

      (1) To discuss the issues regarding the specificity of ATP5⍺ CAT-tailing, we will provide new patient-derived cell lines and tumor samples and investigate the CAT-tail modifications of nuclear genome-encoded mitochondrial proteins and changes in RQC proteins within them. We will endeavor to explore the nature of NEMF modifications in GSC cells (Fig. S1A).

      (2) To enhance the quality of image data, we will substitute some images (such as Fig. 1E and 3A) with higher quality images.

      (3) To further understand the influence of NEMF on cancer, the effects of NEMF overexpression in GSC cells will be evaluated through testing (e.g., Fig. 3D).

      (4) To further explore changes in apoptosis, we will employ additional methods to detect apoptosis, including Annexin-PI FACS assays, caspase cleavage analysis, assessing BAX-BCL2 ratios, and monitoring cytochrome c release.

      (5) To further confirm the effectiveness of the CAT-tailing-mitochondria mechanism in in vivo tumor models, we will utilize a Drosophila model to study the impact of the RQC pathway and CAT-tailing mechanism on tumor proliferation in vivo. The overactivation of the Notch signaling pathway in Drosophila can stimulate malignant proliferation of neural stem cells (NSCs) through both canonical (c-Myc mediated pathway) and non-canonical (PINK1-mitochondrial-mTORC2 pathway) pathways, leading to the development of a tumor-like phenotype in the larval brain. A recent publication in PNAS Nexus (Khaket et al., PNAS Nexus, 2024) discusses the impact of the RQC pathway on c-Myc. It is possible for us to analyze the alterations in CAT-tailing on mitochondrial proteins and mitochondrial membrane potential in this Notch model and study how the RQC pathway regulates them. Moreover, tumor implantation experiments will be carried out using immunodeficient mice. Our goal is to conduct a comparative analysis of the growth of control and NEMF KD glioblastoma cell lines in animal models, alongside performing essential biochemical analyses.

      Reference:

      Khaket, T. P., et al. (2024). Ribosome stalling during c-myc translation presents actionable cancer cell vulnerability. PNAS nexus, 3(8), pgae321.

      To address the comments from Reviewer 2, we will make the following revisions in the manuscript:

      (1) The concerns raised by the reviewer regarding the authenticity of the ATP5a CAT-tail modification are duly noted. Critical control experiments will be incorporated into our study, including NEMF knockout (or NFACT domain mutants) and cycloheximide treatment, alongside other methodologies. The results of these experiments will include placements such as Fig. 1B, 1C, S3A, and S3B to improve comprehension of the CAT-tail modification on ATP5⍺.

      (2) We thank the reviewer for reminding us to consider the differences between the artificial tail and the endogenous CAT-tail. A recently published study (Khan et al., 2024) provides a thorough analysis of the components of the CAT-tail. Our approach to addressing this issue involves emphasizing the use of the artificial CAT-tail sequence and adopting a more measured tone in the revised version. Additionally, we will induce the endogenous ATP5⍺-CAT-tail by express ATP5⍺-K20-non-stop in cells to validate their function in glioblastoma cells.

      (3) Moreover, we aim to examine the impact of different amino acid compositions in the ATP5⍺ c-terminus extension, such as the poly (Gly-Ser) repeats noted by the reviewer, on both mitochondrial function and glioblastoma biology in our revision. By comparing the results obtained from ATP5⍺-CAT-tails with different compositions, it is anticipated that more definitive conclusions can be drawn.

      (4) Additional minor revisions will be implemented to the text in accordance with the feedback given by the reviewer.

      Reference:

      Khan, D., Vinayak, A. A., Sitron, C. S., & Brandman, O. (2024). Mechanochemical forces regulate the composition and function of CAT tails. bioRxiv, 2024-08.

  2. Aug 2024
    1. Author response:

      The following is the authors’ response to the original reviews.

      Public Reviews:

      Reviewer #1:

      Summary:

      The current manuscript uses electron spin resonance spectroscopy to understand how the dynamic behavior and conformational heterogeneity of the LPS transport system change during substrate transport and in response to the membrane, bound nucleotide (or transition state analog), and accessory subunits. The study builds on prior structural studies to expand our molecular understanding of this highly significant bacterial transport system. 

      Strengths 

      This series of well-designed and well-executed experiments provides new mechanistic insights into the dynamic behavior of the LPS transport system. Notable new insights provided by this study include its indication of the spatial organization of the LptC domain, which was poorly resolved in structures, and how the LptC domain modulates the dynamic behavior of the gate through which lipids access the binding site. In addition, a mass spectrometry approach designed to examine LPS binding at different stages in the nucleotide-dependent conformational cycle provides insight into the order of operations of LPS binding and transport. 

      We thank the reviewer for the very positive comments and highlighting the important findings from our study.

      Reviewer #2 (Public Review):

      Lipopolysaccharide (LPS) is a major component of the outer membrane of Gram-negative bacteria and plays a critical role in bacterial virulence. The LPS export mechanism is a potential target for new antibiotics. Inhibiting this process can render bacteria more susceptible to the host immune system or other antibacterial agents. Given the rise of antibiotic-resistant bacteria, novel targets are urgently needed. The seven LPS transport (Lpt) proteins, A-G, move LPS from the inner to the outer membrane. This study investigated the conformational changes in the LptB2FG-LptC complex using site-directed spin labeling (SDSL) electron paramagnetic resonance (EPR) spectroscopy, revealing how ATP binding and hydrolysis affect the LptF βjellyroll domain and lateral gates. The findings highlight the role of LptC in regulating LPS entry, ensuring efficient and unidirectional transport across the periplasm. 

      The β-jellyrolls are not fully resolved in the vanadate-trapped structure of LptB2FG and LptB2FGC. Therefore, the current study provides valuable information on the functional dynamics of these periplasmic domains, their interactions, and their roles in the unidirectional transport of LPS. Additionally, the dynamic perspective of the lateral gates in LptFG in the presence and absence of LptC is another strength of this study. Moreover, at least in detergent samples, more comprehensive intermediates of the ATP turnover cycle are studied than in the available structures, providing crucial missing mechanistic details. 

      We thank the reviewer for highlighting our major findings!

      Other major strengths of the study include high-quality DEER distance measurements in both detergent and proteoliposomes, the latter providing valuable dynamics information in the lipid environment. However, lipid composition is not mentioned. The proteoliposome study is crucial since the previous structural study (Li, Orlando & Liao 2019) was done in rather small-diameter nanodiscs, which might affect the overall dynamics of the complex. It would have been beneficial if the investigators had reconstituted the complex in lipid nanodiscs with the same composition as proteoliposomes. The mixed lipid/detergent micelles provide an alternative. It seems the ATPase activity of the protein complex is much lower in detergent compared with lipid nanodiscs (Li, Orlando & Liao 2019). In the current study, ATPase activity in proteoliposomes is not provided. Also, the reviewer assumes cysteine-less (CL) constructs of the complex components were utilized. The ATPase assay on CL complex is not presented. Additionally, from previous structural studies and the mass spectrometry data presented here, LPS co-purifies and is already bound to the complex, thus the Apo state may represent the LPS-bound state without nucleotides. 

      The liposomes are made from E. coli polar lipid extract, which we added to the Materials and Methods part now. We could not yet perform the investigations in nanodiscs, which is one of our aims for future. The ATPase activity is lower in micelles and the reviewer is correct in that we did not perform/compare ATPase activity in proteoliposomes. The data denoted as wild-type (WT, Figure S4) corresponds to the cysteine-less (CL) variant, which is now corrected in the supporting information. As the reviewer commented, the mass spectrometry data reveal bound LPS in the apo-state. However, as seen from our results, ADP-Mg2+ state is similar to the apo state, thus in the cellular environment LPS may bind to this state as well.

      The selection of sites to probe lateral gate 2, which forms the main LPS entry site, may pose an issue. Although the authors provide justification based on the available structures, one site (position 325 in LptF) is located on a flexible loop, and position 52 in LptG is on the neighboring transmembrane helix, separated by a potentially flexible loop from the gating TM1. These labeling sites could exhibit significant local dynamics, resulting in a broader distribution of distances and potentially masking the gating-related conformational changes. 

      Position 52 in LptG is located at the beginning of the neighboring transmembrane helix. As we have discussed in the manuscript, position 325 in LptF is located on a short loop connected to TM5. In the structures, this loop shows a very similar orientation (Figure S6). Further, the observed heterogeneity for the lateral gate-2 is considerably modulated into distinct conformation(s) upon LptC binding (Figure 6D-E). This would not be the case if this loop possesses any independent flexibility. Confirming these observations, the room temperature continuous wave ESR spectra revealed the least flexibility for this spin pair (Figure S5, S7). In view of the reasons and observations detailed above, we conclude that the local flexibility at the labelled sites might not make any significant contribution for the broad distribution observed at this gate in LptB2FG (Figure 4). 

      Reviewer #3 (Public Review):

      Summary: 

      The manuscript by Dajka and co-workers reports the application of a biophysical approach to analyse the dynamics of the LptB2FG-C ABC transporter, involved in LPS transport across the cell envelope in Escherichia coli. LptB2FG-C belongs to a new class of ABC transporters (type VI) and is essential and conserved in several Gram-negative pathogens. Since LPS is the major component of the outer membrane of the Gram-negative cell and is responsible for the low permeability of this membrane to several antibiotics, a deep understanding of the mechanism and function of the LptB2FG-C transporter is crucial for the development of new drugs targeting Gram-negative pathogens. 

      Several structural studies have been published so far on the LptB2FG-C transporter, disclosing important aspects of the transport mechanism; nevertheless, lack of resolution of some regions of the individual proteins as well as the dynamic nature of the transport mechanism per se (e.g. the insertion and removal of the TM helix of LptC from the TMDs of the transporter during the LPS transport cycle) has greatly limited the understanding of the mechanism that couples ATP binding and hydrolysis with LPS transport. This knowledge gap could be filled by applying an approach that allows the analysis of dynamic processes. The DEER/PELDOR technique applied in this work fits well with this requirement. 

      Strengths: 

      In this study, the authors provide some new pieces of information on the LptB2FG-C function and the role of LptC in the transporter. Notably, they show that: 

      - There is high heterogeneity in the conformational states of the entry gate of LPS in the transporter (gate-2) that are reduced by the insertion of LptC, and the heterogeneity observed is not altered by ATP binding or hydrolysis (as expected since LPS entry is ATP-independent). 

      - ATP binding induces an allosteric opening of LptF β-jellyroll domain that allows for LPS passage to the β-jellyroll of LptC, which is stably associated with the β-jellyroll of LptF throughout the cycle. 

      - The β-jellyroll of LptG is highly flexible, indicating an involvement in the LPS transport cycle. 

      The manuscript is timely and overall clear. 

      We thank the reviewer for the positive comments and highlighting our findings and the strength of DEER/PELDOR spectroscopy for characterizing the dynamics aspect of the LPS transport system.

      Weaknesses:

      I list my concerns below and provide suggestions that, in my opinion, should be addressed to reinforce the findings of this study. 

      (1) Protein complex controls: the authors assess the ATPase activity of the spin-labelled variants of their protein complexes to rule out the possibility that engineering the proteins to enable spin labelling could affect their functionality (Figure S4). It has been reported that the association of LptC to LptB2FG complex inhibits its ATPase activity. However, in the ATPase assay data shown in Figure S4, the inhibitory effect of the LptC TM is not visible (please compare LptB2FG F-A45C G-I335C and F-L325C G-A52C with and without LptC). This can lead to suspect that the regulatory function of LptC is missing in the LptC-containing complexes used in this work. I suggest the authors include wt LptB2FGC in the assay to compare the ATPase activity of this complex with wt LptB2FG. The published inhibitory effect of TM LptC has been observed in proteoliposomes. Since it is not clear from the paper if the ATPase assay in Figure 4 has been conducted in DDM or proteoliposomes, the lack of inhibitory effect could be due to the assay conditions. A comparative test could answer this question. 

      We could not observe the inhibitory effect of LptC on the ATPase activity of LptB2FG. As the reviewer pointed out, the primary reason is that we performed the assays in detergent micelles and not in proteoliposomes. For this reason, a comparison of the activity between (cysteine-less) LptB2FG and LptB2FG-C as the reviewer suggested would not be informative. As this information is not directly relevant for our current interpretations, we plan to perform those experiments in liposomes in the near future.

      (2) Figure 2: NBD closure upon ATP binding to LptB2FG is convincingly demonstrated both in DDM micelles and proteoliposomes, validating the experimental system. However, since under physiological conditions, ATP binding should take place before the displacement of the TM of LptC (Wilson and Ruiz, Mol microbiol 2022), I suggest the authors carry out the experiments with LptC-containing complexes to investigate conformational changes (if any) that are triggered when ATP binding occurs before the TM displacement.  

      We thank the reviewer for the suggestion. These experiments are in our to do list and would be performed in the near future.

      (3) Proteoliposomes: in the experiments shown in Figures 3 and 4, unlike those in Figure 2, measurements in proteoliposomes give different results from the experiments in DDM, showing higher heterogeneity. Could this be related to the presence (or absence) of LPS in liposomes? It is not mentioned in the materials and methods section whether LPS is present. Could the authors please discuss this? 

      We thank the reviewer for bringing out this interesting point. The liposomes are made from E. coli polar lipid extract. In the polar lipid extract, phosphatidylethanolamine (PE) is the predominant lipid component with minor amounts of phosphatidylglycerol (PG) and cardiolipin. Thus, the differences in the heterogeneity we observed in proteoliposomes might not be due to the presence of LPS. We added a short description on this aspect in the ‘Discussion’ part.

      (4) The authors show large conformational heterogeneity in gate-2 (using the spin-labelled pair F-L325R1-G-A52R1) and suggest that deviation from the corresponding simulations could be due to the need for enhanced dynamics to allow for gate interaction with LPS or LptC. The effect of LptC is probed in the experiments shown in Figure 6, but I suggest the authors add LPS to the complexes to evaluate the possible stabilizing effect of LPS on the conformations shown in Figure 4. 

      This indeed is an important experiment, which we plan to do in the near future.

      (5) Figure 6: the measurement of lateral gate 1 and 2 dynamics in the LptC-containing complexes clearly supports the hypothesis, proposed based on the available structures, that TM LptC dissociates from LptB2FG upon ATP binding. However, direct evidence of this movement is still missing. Would it be possible to monitor the dynamics of the TM LptC by directly labelling this protein domain? This would give a conclusive demonstration of the displacement during the ATPase cycle. 

      Yes, it should be possible to label LptC and monitor its position with respect to LptF or LptG. These experiments are in progress in our laboratory. 

      (6) LPS release assay: Figure 6 panels H-I-J show the MS spectra relative to LPS-bound and free proteins obtained from wt LptB2FG upon ATP binding and ATP hydrolysis conditions. From these spectra the authors conclude that LPS is completely released only upon ATP hydrolysis. However, the current model predicts that LPS release into the Lpt bridge made by LptC-A-D is triggered by ATP binding. For this reason, I suggest the authors assess LPS release also from the LptB2FGC complex where, in the absence of LptA, LPS would be expected to be mostly retained by the complex under the same conditions. 

      These indeed are exciting experiments. LPS binding and release by LptB2FGC is in progress in our laboratories.

      Recommendations for the authors:

      Reviewer #1 (Recommendations For The Authors):

      Page 2 typo: apo-sate should be apo-state 

      Thank you! We corrected the typo.

      Can the authors clarify whether LPS is co-purified with the protein? Does it remain bound throughout the liposome reconstitution process? 

      Our mass spectrometry data show that LPS is co-purified with LptB2FG in micelles. However, we cannot yet verify the presence of bound LPS after reconstitution into proteoliposomes. We added a sentence in the last paragraph before Discussion as ‘Thus, LPS is co-purified with LptB2FG in micelles.’

      Reviewer #2 (Recommendations for The Authors): 

      Several points require clarification: 

      (1) The reviewer would have benefited from access to the raw DEER traces. For instance, in Figure 4, the change in the raw data appears subtle. The differences between the Apo and vanadate-trapped states in b-DDM might be related to a lower signal-to-noise ratio in the Apo state. 

      We would be happy to share the raw DEER data upon request. The analysis is performed with the primary data, which also takes into account of the noise level for the calculating the confidence interval. Therefore, the distances with the 95% confidence interval are reliable to the extent as they are presented.  

      (2) The panel labels in Figures 2-4 do not match the legends. 

      Thank you! We corrected them.

      (3) In Figure 2G, the authors state, "Overall, the ATP-induced closure as observed in micelles (and the structures) is maintained in the native-like lipid bilayers for the NBDs." This statement is technically incorrect since the vanadate-trapped state is not equivalent to the ATP+EDTA "ATP binding" state, which was not tested in proteoliposomes (PLS). The authors should have tested this condition for a few mutants in proteoliposomes. They should revise the manuscript to reflect this or provide evidence that the ATP+EDTA state is similar to the vanadate-trapped state in PLS. 

      We corrected the sentence as ‘Overall, the nucleotide-induced closure as observed in micelles (and the structures) is maintained in the native-like lipid bilayers for the NBDs.’

      (4) The mutant F-L325R1_G-A52R1 is not optimal for probing gate 2. Specifically, position 325 in LptF is highly flexible, as indicated by the very broad distance distributions in Figure 4, and may hinder probing the associated conformational changes in this gate. Comparing the cryo-EM structures of this loop under different conditions (Figure S6) does not provide solid evidence for the lack of flexibility. 

      Position 52 in LptG is located at the beginning of the neighboring transmembrane helix. As we have discussed in the manuscript, position 325 in LptF is located on a short loop connected to TM5. In the structures, this loop shows a very similar orientation (Figure S6). Further, the observed heterogeneity for the lateral gate-2 is considerably modulated into distinct conformation(s) upon LptC binding (Figure 6D-E). This would not be the case if this loop possesses any independent flexibility. Confirming these observations, the room temperature continuous wave ESR spectra revealed the least flexibility for this spin pair (Figure S5, S7). In view of the reasons and observations detailed above, we conclude that the local flexibility of the labelled sites might not make any significant contribution for the broad distribution observed at this gate in LptB2FG (Figure 4). 

      (5) Regarding Figure 4B, the authors state, "In the vanadate-trapped and ATP samples, the major population is centered at 2 nm (which corresponds to the simulation on the vanadate trapped structure)". While the shift to shorter distances aligns with the structures, the average distance from the simulation is around 3 nm and does not correspond closely to the DEER distances of 2 nm. 

      Thank you for noting this point. We corrected the sentence as ‘In the vanadate-trapped and ATP samples, the major population is centred at 2 nm (which is closer to the simulation on the vanadate-trapped structure).’

      (6) Regarding Figure 4D, the authors state, "Unlike the lateral gate-1 (and the NBDs), ADP-Mg2+ also induced a similar shift in the distance distribution." The reviewer believes that even without interaction with LptC, an equilibrium exists between two states in gate-2, and ATP binding or vanadate-trapping shifts the equilibrium to a shorter-distance population. Additionally, if the signal-to-noise ratio of the Apo state were similar to that of the ADP-Mg2+ state, similar distance distributions would have been observed for the Apo state. 

      We thank the reviewer for bringing out this excellent point. We thoroughly modified the corresponding section as ‘ADP-Mg2+ also gave a broad distribution comparable to the apo-state. Thus, in the apo-state this gate appears to exist in an equilibrium between the two conformations observed from the corresponding structures. ATP binding or vanadate-trapping shifts the equilibrium towards the collapsed conformation.’

      (7) Defining the conformational dynamics of the b-jellyroll domains is one of the major strengths of this study. The LptF and LptG b-jellyroll domains exhibit high flexibility in detergent micelles. Unfortunately, none of the experiments were repeated in proteoliposomes to determine if this flexibility persists in a lipid environment. 

      As it is conceivable, it is truly beyond the scope of the current study to repeat all the measurements in liposomes. Currently we are extending those investigations to liposomes and would be able to provide more insights in the near future.

      (8) Regarding Figure 6G, the authors claim, "Distances corresponding to the apo state are present possibly due to an incomplete vanadate trapping for this sample." It is unlikely that vanadate trapping would be incomplete for just one sample. A repeat experiment is recommended. 

      We will update on this point is due time.

      (9) Regarding the structural dynamics of the lateral gates, detergent micelles, and liposomes are vastly different environments. It is challenging to reach a consensus model based on data mostly derived from detergent micelles and only a few from proteoliposomes. 

      The observations in PLS are qualitatively similar to the micellar sample for the investigated positions (please see the first paragraph in “Discussion”). Further, our observations are in agreement with previous structural and biochemical data and further extent the mechanism in a coherent manner. 

      Reviewer #3 (Recommendations For The Authors):

      Minor comments 

      (1) Figure legends: There are several mismatches between panel nomenclature and the corresponding descriptions in the legends. Please check the correspondence between panel identification and descriptions throughout the manuscript (for example, F-G and H-J in Figure 2; and I and H in Figure 3). 

      Thank you! We corrected them.

      - Figure 6 legend: asterisk is in panel D and not C. 

      Corrected

      - Panels E and F are not mentioned. Moreover, the spectra for vanadate trapped conformation of LptF219-LptC104 have not been given a letter. 

      Corrected

      - A description of the different colors in the "Distance r" axis should be added to figure 2, 3, and 4 legends. 

      Corrected

      - Please indicate the meaning of the black arrows in figure legends. 

      Corrected

      (2) To improve data comprehension by the readers, the authors should indicate the relative spinlabelled pairs on the top of Figure 2, 3, and 4, as done for Figures 5 and 6. 

      Done

      (3) Reference 56 is cited incorrectly in the reference list and refers to a study employing reconstituted LptB2FG complexes rather than isolated β-jellyroll domains. 

      Corrected

      (4) Figure 3: How do the authors explain the evidence that ATP binding influences gate 1 conformational flexibility only in DDM micelles with respect of PLS? Is this something related to the release of LPS from the complex in different environments? 

      We do not know whether this difference is related to LPS release. Therefore, we generally interpreted as an effect of the membrane environment.

      (5) The initial sentence of the discussion looks somewhat incomplete, please correct it. 

      Done

      (6) To improve the readability of the paper, it could be useful to better focus the topic of the headings of the result paragraphs concerning the analysis of the individual lateral gates (for example, by indicating the name of the gate in the headings).

      Done

    1. Author response:

      The following is the authors’ response to the original reviews.

      Public Reviews:

      Reviewer #1 (Public Review):

      In this study, the authors used a stopped-flow method to investigate the kinetics of substrate translocation through the channel in hexameric ClpB, an ATP-dependent bacterial protein disaggregase. They engineered a series of polypeptides with the N-terminal RepA ClpB-targeting sequence followed by a variable number of folded titin domains. The authors detected translocation of the substrate polypeptides by observing the enhancement of fluorescence from a probe located at the substrate's C-terminus. The total time of the substrates' translocation correlated with their lengths, which allowed the authors to determine the number of residues translocated by ClpB per unit time.

      Strengths:

      This study confirms a previously proposed model of processive translocation of polypeptides through the channel in ClpB. The novelty of this work is in the clever design of a series of kinetic experiments with an engineered substrate that includes stably folded domains. This approach produced a quantitative description of the reaction rates and kinetic step sizes. Another valuable aspect is that the method can be used for other translocases from the AAA+ family to characterize their mechanism of substrate processing.

      Weaknesses:

      The main limitation of the study is in using a single non-physiological substrate of ClpB, which does not replicate the physical properties of the aggregated cellular proteins and includes a non-physiological ClpB-targeting sequence. Another limitation is in the use of ATPgammaS to stimulate the substrate processing. It is not clear how relevant the results are to the ClpB function in living cells with ATP as the source of energy, a multitude of various aggregated substrates without targeting sequences that need ClpB's assistance, and in the presence of the co-chaperones.

      Indeed, we agree that our RepA-Titinx substrates are not aggregates but are model, soluble, substrates used to reveal information about enzyme catalyzed protein unfolding and translocation.  Our substrates are similar to RepA-GFP and GFP-SsrA used by multiple labs including Wickner, Horwich, Sauer, Baker, Shorter, Bukua, to name only a few.  The fact that “this is what everyone does” does not make the substrates physiological or the most ideal. However, this is the technology we currently have until we and others develop something better. In the meantime, we contend that  the results presented here do advance our knowledge on enzyme catalyzed protein unfolding

      Part of what this manuscript seeks to accomplish is presenting the development of a single-turnover experiment that reports on processive protein unfolding by AAA+ molecular motors, in this case, ClpB.  Importantly, we are treating translocation on an unfolded polypeptide chain and protein unfolding of stably folded proteins as two distinct reactions catalyzed by ClpB. If these functions are used to disrupt protein aggregates, in vivo, then this remains to be seen.

      We contend that processive ClpB catalyzed protein unfolding has not been rigorously demonstrated prior to our results presented here.  Avellaneda et al mechanically unfolded their substrate before loading ClpB (Avellaneda, Franke, Sunderlikova et al. 2020).  Thus, their experiment represents valuable observations reflecting polypeptide translocation on a pre-unfolded protein.  Our previous work using single-turnover stopped-flow experiments employed unstructured synthetic polypeptides and therefore reflects polypeptide translocation and not protein unfolding (Li, Weaver, Lin et al. 2015).  Weibezahn et al used unstructured substrates in their study with ClpB (BAP/ClpP), and thus their results represent translocation of a pre-unfolded polypeptide and not enzyme catalyzed protein unfolding (Weibezahn, Tessarz, Schlieker et al. 2004). 

      Many studies have reported the use of  GFP with tags or RepA-GFP and used the loss of GFP fluorescence to conclude protein unfolding.  However, such results do not reveal if ClpB processively and fully translocates the substrate through its axial channel.  One cannot rule out, even when trapping with “GroEL trap”, the possibility that ClpB only needs to disrupt some of the fold in GFP before cooperative unfolding occurs leading to loss of fluorescence.  Once the cooperative collapse of the structure occurs and fluorescence is lost it has not been shown that ClpB will continue to translocate on the newly unfolded chain or dissociate. In fact, the Bukau group showed that folded YFP remained intact after luciferase was unfolded (Haslberger, Zdanowicz, Brand et al. 2008).  Our approach, reported here, yields signal upon arrival of the motor at the c-terminus or within the PIFE distance thus we can be certain that the motor does arrive at the c-terminus after unfolding up to three tandem repeats of the Titin I27 domain.

      ATPgS is a non-physiological nucleotide analog.  However, ClpB has been shown to exhibit curious behavior in its presence that we and others, as the reviewer acknowledges, do not fully understand (Doyle, Shorter, Zolkiewski et al. 2007).  Some of the experiments reported here are seeking to better understand that fact.  Here we have shown that ATPgS alone will support processive protein unfolding. With this assay in hand, we are now seeking to go forward and address many of the points raised by this reviewer. 

      The authors do not attempt to correlate the kinetic step sizes detected during substrate translocation and unfolding with the substrate's structure, which should be possible, given how extensively the stability and unfolding of the titin I27 domain were studied before. Also, since the substrate contains up to three I27 domains separated with unstructured linkers, it is not clear why all the translocation steps are assumed to occur with the same rate constant.

      We assume that all protein unfolding steps occur with the same rate constant, ku.  We conclude that we are not detecting the translocation rate constant, kt, as our results support a model where kt is much faster than ku.  We do think it makes sense that the same slow step occurs between each cycle of protein unfolding.

      We have added a discussion relating our observations to mechanical unfolding of tandem repeats of Titin I27 from AFM experiments  (Oberhauser, Hansma, Carrion-Vazquez and Fernandez 2001). Most interestingly, they report unfolding of Titin I27 in 22 nm steps.  Using 0.34 nm per amino acids this yields ~65 amino acids per unfolding step, which is comparable to our kinetic step-size of 57 – 58 amino acids per step.

      Some conclusions presented in the manuscript are speculative:

      The notion that the emission from Alexa Fluor 555 is enhanced when ClpB approaches the substrate's C-terminus needs to be supported experimentally. Also, evidence that ATPgammaS without ATP can provide sufficient energy for substrate translocation and unfolding is missing in the paper.

      In our previous work we have used fluorescently labeled 50 amino acid peptides as substrates to examine ClpB binding (Li, Lin and Lucius 2015, Li, Weaver, Lin et al. 2015).  In that work we have used fluorescein, which exhibits quenching upon ClpB binding.  We have added a control experiment where we have attached alexa fluor 555 to the 50 amino acid substrate so we can be assured the ClpB binds close to the fluorophore.  As seen in supplemental Fig. 1 A  upon titration with ClpB, in the presence of ATPγS, we observe an increase in fluorescence from AF555, consistent with PIFE.  Supplemental Fig. 1 B shows the relative fluorescence enhancement at the peak max increases up to ~ 0.2 or a 20 % increase in fluorescence, due to PIFE, upon ClpB binding.   

      Further, peak time is our hypothesized measure of ClpB’s arrival at the dye. Our results indicate that the peak time linearly increases as a function of an increase in the number of folded TitinI27 repeats in the substrates which also supports the PIFE hypothesis. Finally, others have shown that AF555 exhibits PIFE and we have added those references.

      The evidence that ATPγS alone can support translocation is shown in Fig. 2 and supplemental Figure 1.  Fig. 2 and supplemental Figure 1 are two different mixing strategies where we use only ATPgS and no ATP at all.  In both cases the time courses are consistent with processive protein unfolding by ClpB with only ATPγS.

      Reviewer #2 (Public Review):

      Summary:

      The current work by Banwait et al. reports a fluorescence-based single turnover method based on protein-induced fluorescence enhancement (PIFE) to show that ClpB is a processive motor. The paper is a crucial finding as there has been ambiguity on whether ClpB is a processive or non-processive motor. Optical tweezers-based single-molecule studies have shown that ClpB is a processive motor, whereas previous studies from the same group hypothesized it to be a non-processive motor. As co-chaperones are needed for the motor activity of the ClpB, to isolate the activity of ClpB, they have used a 1:1 ratio ATP and ATPgS, where the enzyme is active even in the absence of its co-chaperones, as previously observed. A sequential mixing stop-flow protocol was developed, and the unfolding and translocation of RepA-TitinX, X = 1,2,3 repeats was monitored by measuring the fluorescence intensity with the time of Alexa F555 which was labelled at the C-terminal Cysteine. The observations were a lag time, followed by a gradual increase in fluorescence due to PIFE, and then a decrease in fluorescence plausibly due to the dissociation from the substrate allowing it to refold. The authors observed that the peak time depends on the substrate length, indicating the processive nature of ClpB. In addition, the lag and peak times depend on the pre-incubation time with ATPgS, indicating that the enzyme translocates on the substrates even with just ATPgS without the addition of ATP, which is plausible due to the slow hydrolysis of ATPgS. From the plot of substrate length vs peak time, the authors calculated the rate of unfolding and translocation to be ~0.1 aas-1 in the presence of ~1 mM ATPgS and increases to 1 aas-1 in the presence of 1:1 ATP and ATPgS. The authors have further performed experiments at 3:1 ATP and ATPgS concentrations and observed ~5 times increase in the translocation rates as expected due to faster hydrolysis of ATP by ClpB and reconfirming that processivity is majorly ATP driven. Further, the authors model their results to multiple sequential unfolding steps, determining the rate of unfolding and the number of amino acids unfolded during each step. Overall, the study uses a novel method to reconfirm the processive nature of ClpB.

      Strengths:

      (1) Previous studies on understanding the processivity of ClpB have primarily focused on unfolded or disordered proteins; this study paves new insights into our understanding of the processing of folded proteins by ClpB. They have cleverly used RepA as a recognition sequence to understand the unfolding of titin-I27 folded domains.

      (2) The method developed can be applied to many disaggregating enzymes and has broader significance.

      (3) The data from various experiments are consistent with each other, indicating the reproducibility of the data. For example, the rate of translocation in the presence of ATPgS, ~0.1 aas-1 from the single mixing experiment and double mixing experiment are very similar.

      (4) The study convincingly shows that ClpB is a processive motor, which has long been debated, describing its activity in the presence of only ATPgS and a mixture of ATP and ATPgS.

      (5) The discussion part has been written in a way that describes many previous experiments from various groups supporting the processive nature of the enzyme and supports their current study.

      Weaknesses:

      (1) The authors model that the enzyme unfolds the protein sequentially around 60 aa each time through multiple steps and translocates rapidly. This contradicts our knowledge of protein unfolding, which is generally cooperative, particularly for titinI27, which is reported to unfold cooperatively or utmost through one intermediate during enzymatic unfolding by ClpX and ClpA.

      We do not think this represents a contradiction.  In fact, our observations are in good agreement with mechanical unfolding of tandem repeats of Titin I27 using AFM experiments (Oberhauser, Hansma, Carrion-Vazquez and Fernandez 2001).  They showed that tandem repeats of TitinI27 unfolded in steps of ~22 nm.  Dividing 22 nm by 0.34 nm/Amino Acid gives ~65 amino acids per unfolding event.  This implies that, under force, ~65 amino acids of folded structure unfolds in a single step.  This number is in excellent agreement with our kinetic step-size of 65 AA/step. 

      Importantly, the experiments cited by the reviewer on ClpA and ClpX are actually with ClpAP and ClpXP.  We assert that this is an important distinction as we have shown that ClpA employs a different mechanism than ClpAP (Rajendar and Lucius 2010, Miller, Lin, Li and Lucius 2013, Miller and Lucius 2014).  Thus, ClpA and ClpAP should be treated as different enzymes but, without question, ClpB and ClpA are different enzymes.

      (2) It is also important to note that the unfolding of titinI27 from the N-terminus (as done in this study) has been reported to be very fast and cannot be the rate-limiting step as reported earlier(Olivares et al, PNAS, 2017). This contradicts the current model where unfolding is the rate-limiting step, and the translocation is assumed to be many orders faster than unfolding.

      Most importantly, the Olivares paper is examining ClpXP and ClpAP catalyzed protein unfolding and translocation and not ClpB.  These are different enzymes.  Additionally, we have shown that ClpAP and ClpA translocate unfolded polypeptides with different rates, rate constants, and kinetic step-sizes indicating that ClpP allosterically impacts the mechanism employed by ClpA to the extent that even ClpA and ClpAP should be considered different enzymes (Rajendar and Lucius 2010, Miller, Lin, Li and Lucius 2013).  We would further assert that there is no reason to assume ClpAP and ClpXP would catalyze protein unfolding using the same mechanism as ClpB as we do not think it should be assumed ClpA and ClpX use the same mechanism as ClpAP and ClpXP, respectively. 

      The Olivares et al paper reports a dwell time preceding protein unfolding of ~0.9 and ~0.8 s for ClpXP and ClpAP, respectively.   The inverse of this can be taken as the rate constant for protein unfolding and would yield a rate constant of ~1.2 s-1, which is in good agreement with our observed rate constant of 0.9 – 4.3 s-1 depending on the ATP:ATPγS mixing ratio.  For ClpB, we propose that the slow unfolding is then followed by rapid translocation on the unfolded chain where translocation by ClpB must be much faster than for ClpAP and ClpXP.  We think this is a reasonable interpretation of our results and not a contradiction of the results in Olivares et al. Moreover, this is completely consistent with the mechanistic differences that we have reported, using the same single-turnover stopped flow approach on the same unfolded polypeptide chains with ClpB, ClpA, and ClpAP (Rajendar and Lucius 2010, Miller, Lin, Li and Lucius 2013, Miller and Lucius 2014, Li, Weaver, Lin et al. 2015).

      (3) The model assumes the same time constant for all the unfolding steps irrespective of the secondary structural interactions.

      Yes, we contend that this is a good assumption because it represents repetition of protein unfolding catalyzed by ClpB upon encountering the same repeating structural elements, i.e. Beta sheets. 

      (4) Unlike other single-molecule optical tweezer-based assays, the study cannot distinguish the unfolding and translocation events and assumes that unfolding is the rate-limiting step.

      Although we cannot, directly, distinguish between protein unfolding and translocation we have logically concluded that protein unfolding is likely rate limiting. This is because the large kinetic step-size represents the collapse of ~60 amino acids of structure between two rate-limiting steps, which we interpret to represent cooperative protein unfolding induced by ClpB.  It is not an assumption it is our current best interpretation of the observations that we are now seeking to further test. 

      Reviewer #3 (Public Review):

      Summary:

      The authors have devised an elegant stopped-flow fluorescence approach to probe the mechanism of action of the Hsp100 protein unfoldase ClpB on an unfolded substrate (RepA) coupled to 1-3 repeats of a folded titin domain. They provide useful new insight into the kinetics of ClpB action. The results support their conclusions for the model setup used.

      Strengths:

      The stopped-flow fluorescence method with a variable delay after mixing the reactants is informative, as is the use of variable numbers of folded domains to probe the unfolding steps.

      Weaknesses:

      The setup does not reflect the physiological setting for ClpB action. A mixture of ATP and ATPgammaS is used to activate ClpB without the need for its co-chaperones, Hsp70. Hsp40 and an Hsp70 nucleotide exchange factor. This nucleotide strategy was discovered by Doyle et al (2007) but the mechanism of action is not fully understood. Other authors have used different approaches. As mentioned by the authors, Weibezahn et al used a construct coupled to the ClpA protease to demonstrate translocation. Avellaneda et al used a mutant (Y503D) in the coiled-coil regulatory domain to bypass the Hsp70 system. These differences complicate comparisons of rates and step sizes with previous work. It is unclear which results, if any, reflect the in vivo action of ClpB on the disassembly of aggregates.

      We agree with the reviewer, there are several strategies that have been employed to bypass the need for Hsp70/40 or KJE to simplify in vitro experiments.  Here we have developed a first of its kind transient state kinetics approach that can be used to examine processive protein unfolding.  We now seek to go forward with examining the mechanisms of hyperactive mutants, like Y503D, and add the co-chaperones so that we can address the limitations articulated by the reviewer.   In fact we already began adding DnaK to the reaction and found that DnaK induced ClpB to release the polypeptide chain (Durie, Duran and Lucius 2018).  However, the sequential mixing strategy developed here was needed to go forward with examining the impact of co-chaperones. 

      Recommendations for the authors:

      Reviewer #1 (Recommendations For The Authors):

      Line 1: I recommend changing the title of the paper to remove the terms that are not clearly defined in the text: "robust" and "processive". What are the Authors' criteria for describing a molecular machine as "robust" vs. "not robust"? A definition of processivity is given in equation 2, but its value for ClpB is not reported in the text, and the criteria for classifying a machine as "processive" vs. "non-processive" are not included. Besides, the Authors have previously reported that ClpB is non-processive (Biochem. J., 2015), so it is now clear that a more nuanced terminology should be applied to this protein. Also, Escherichia coli should be fully spelled out in the title.

      The title has been changed.  We have removed “robust” as we agree with the reviewer, there is no way to quantify “robust”.  However, we have kept “processive” and have added to the discussion a calculation of processivity since we can quantify processivity.  Importantly, the unstructured substrates used in our previous studies represent translocation and not protein unfolding.  here, on folded substrates, we detect rate-limiting protein unfolding followed by rapid translocation.  Thus, we report a lower bound on protein unfolding processivity of 362 amino acids. 

      Line 20: The comment about mitochondrial SKD3 should be removed. SKD3, like ClpB, belongs to the AAA+ family, and it is simply a coincidence that the original study that discovered SKD3 termed it an Hsp100 homolog. The similarity between SKD3 and ClpB is limited to the AAA+ module, so there are many other metazoan ATPases, besides SKD3, that could be called homologs of ClpB, including mitochondrial ClpX, ER-localized torsins, p97, etc.

      Removed.

      Lines 133-139. Contrary to what the authors state, it is not clear that the "lag-phase" becomes significantly shorter for subsequent mixing experiments (Figure 1E) perhaps except for the last one (2070 s). It is clear, however, that the emission enhancement becomes stronger for later mixes. This effect should be discussed and explained, as it suggests that the pre-equilibrations shorter than ~2000 sec do not produce saturation of ClpB binding to the substrate.

      We have added supplemental figure 2, which represents a zoom into the lag region.  This better illustrates what we were seeing but did not clearly show to the reader.  In addition, we address all three changes in the time courses, i.e. extend of lag, change in peak position, and the change in peak height. 

      Line 175. The hydrolysis rate of ATPgammaS in the presence of ClpB should be measured and compared to the hydrolysis rate with ATP/ATPgammaS to check if the ratio of those rates agrees with the ratio of the translocation rates. These experiments should be performed with and without the RepA-titin substrate, which could reveal an important linkage between the ATPase engine and substrate translocation. These experiments are essential to support the claim of substrate translocation and unfolding with ATPgammaS as the sole energy source.

      The time courses shown in figure 2 and supplemental Figure 1 are collected with only ATPgS and no ATP.  The time courses show a clear increase in lag and appearance of a peak with increasing number of tandem repeats of titin domains.  We do not see an alternate explanation for this observation other than ATPγS supports ClpB catalyzed protein unfolding and translocation.  What is the reviewers alternate explanation for these observations?

      We agree with the reviewer that the linkage of ATP hydrolysis to protein unfolding and translocation is essential and we are seeking to acquire this knowledge.  However, a simple comparison of the ratio of rates is not adequate. We contend that a complete mechanistic study of ATP turnover by ClpB is required to properly address this linkage and such a study is too substantial to be included here but is currently underway. 

      All that said, the statement on line 175 was removed since we do not report any ATPase measurements in this paper.

      Line 199: It is an over-simplification to state that "1:1 mix of ATP to ATPgammaS replaces the need for co-chaperones". This sentence should be corrected or removed. The ClpB co-chaperones (DnaK, DnaJ, GrpE) play a major role in targeting ClpB to its aggregated substrates in cells and in regulating the ClpB activity through interactions with its middle domain. ATPgammaS does not replace the co-chaperones; it is a chemical probe that modifies the mechanism of ClpB in a way that is not entirely understood.

      We agree with the reviewer.  The sentence has been modified to point out that the mix of ATP and ATPγS activates ClpB.

      Figure 3B, Supplementary Figure 5A. The solid lines from the model fit cannot be distinguished from the data points. Please modify the figures' format to clearly show the fits and the data points.

      Done.

      Lines 326, 329. It is not clear why the authors mention a lack of covalent modification of substrates by ClpB. AAA+ ATPases do not produce covalent modifications of their substrates.

      The issue of covalent modification was presented in the introduction lines 55 – 60 pointing out that much of what we have learned about protein unfolding and translocation catalyzed by ClpA and ClpX is from the observations of proteolytic degradation catalyzed by the associated protease ClpP.  However, this approach is not possible for ClpB/Hsp104 as these motors do not associate with a protease unless they have been artificially engineered to do so. 

      Lines 396-399. I am puzzled why the authors try to correlate the size of the detected kinetic step with the length of the ClpB channel instead of the size characteristics of the substrate.

      We are attempting to discuss/rationalize the observed large kinetic step-size which, in part, is defined by the structural properties of the enzyme as well as the size characteristics of the substrate.  We have attempted to clarify this and better discuss the properties of the substrate as well as ClpB.

      As I mentioned in the Public Review, it is essential to demonstrate that the emission increase used as the only readout of the ClpB position along the substrate is indeed caused by the proximity of ClpB to the fluorophore. One way to accomplish that would be to place the fluorophore upstream from the first I27 domain and determine if the "lag phase" in the emission enhancement disappears.

      Alexa Fluor 555 is well established to exhibit PIFE.  However, as in the response to the public review, we have included an appropriate control showing this in supplemental Fig. 1.

      Finally, the authors repetitively place their results in opposition to the study of Weibezahn et al. published in 2004 which first demonstrated substrate translocation by engineering a peptidase-associated variant of ClpB. It should be noted that the field of protein disaggregases has moved since the time of that publication from the initial "from-start-to-end" translocation model to a more nuanced picture of partial translocation of polypeptide loops with possible substrate slipping through the ClpB channel and a dynamic assembly of ClpB hexamers with possible subunit exchange, all of which may affect the kinetics in a complex way. However, the present study confirmed the "start-to-end" translocation model, albeit for a non-physiological ClpB substrate, and that is the take-home message, which should be included in the text.

      It is not clear to us that the field has “moved on” since Weibezahn et al 2004.  Their engineered construct that they term “BAP” with ClpP is still used in the field despite us reporting that proteolytic degradation is observed in the absence of ATP with that system  (Li, Weaver, Lin et al. 2015) and should, therefore, not be used to conclude processive energy driven translocation. The “partial translocation” by ClpB is also grounded in observations of partial degradation catalyzed by ClpP with BAP from the same group (Haslberger, Zdanowicz, Brand et al. 2008). It is not clear to us that the idea of subunit exchange leading to the possibility of assembly around internal sequences is being considered.  We do agree that this is an important mechanistic possibility that needs further interrogation. We agree with the reviewer, all these factors are confounding and lead to a more nuanced view of the mechanism.

      All that said, we have removed some of the opposition in the discussion.

      Reviewer #2 (Recommendations For The Authors):

      (1) It is assumed that the lag phase will be much longer than the phase in which we see a gradual increase in fluorescence, as the effect of PIFE is significant only when the enzyme is very close to the fluorophore. Particularly for RepA-titin3, the enzyme has to translocate many tens of nm before it is closer to the C-terminus fluorophore. However, in all cases, the lag time is lower or similar to the gradual increase phase (for example, Figure 3B). Could the authors explain this?

      The extent of the lag, or time zero until the signal starts to increase, is interpreted to indicate the time the motor moves from it’s initial binding site until it gets close enough to the fluorophore that PIFE starts to occur.  In our analysis we apply signal change to the last intermediate and dissociation or release of unfolded RepA-TitinX.  The increase in PIFE is not “all or nothing”.  Rather, it is starting to increase gradually.  Further, because these are ensemble measurements, and each molecule will exhibit variability in rate there is increased breadth of the peak due to ensemble averaging. 

      (2) Although the reason for differences in the peak position (for example, Figure 1E, 2B) is apparent, the reason for variations in the relative intensities has to be given or speculated.

      We have addressed the reason for the different peak heights in the revised manuscript.  It is the consequence of the fact that each substrate has slightly different fluorescent labeling efficiencies.  Thus, for each sample there is a mix of labeled and unlabeled substrates both of which will bind to ClpB but the unlabeled ClpB bound substrates do not contribute to the fluorescence signal, but will represent a binding competitor.  Thus, for low labeling efficiency there is a lower concentration of ClpB bound to fluorescent RepA-Titinx and for higher labeling efficiency there is higher concentration of ClpB bound to RepA-Titinx leading to an increased peak height.  RepA-Titin2 has the highest labeling efficiency and thus the largest peak height.

      Reviewer #3 (Recommendations For The Authors):

      The authors should make it clear that they and previous authors have used different constructs or conditions to bypass the physiological regulation of ClpB action by Hsp70 and its co-factors as mentioned above. In particular, the construct used by Avellaneda et al should be explained when they challenge the findings of those authors.

      Minor points:

      The lines fitting the experimental points are difficult or impossible to see in Figures 2B, 3B, and s5B.

      Fixed

      Typo bottom of p6 - "averge"

      Fixed

      Avellaneda, M. J., K. B. Franke, V. Sunderlikova, B. Bukau, A. Mogk and S. J. Tans (2020). "Processive extrusion of polypeptide loops by a Hsp100 disaggregase." Nature.

      Doyle, S. M., J. Shorter, M. Zolkiewski, J. R. Hoskins, S. Lindquist and S. Wickner (2007). "Asymmetric deceleration of ClpB or Hsp104 ATPase activity unleashes protein-remodeling activity." Nature structural & molecular biology 14(2): 114-122.

      Durie, C. L., E. C. Duran and A. L. Lucius (2018). "Escherichia coli DnaK Allosterically Modulates ClpB between High- and Low-Peptide Affinity States." Biochemistry 57(26): 3665-3675.

      Haslberger, T., A. Zdanowicz, I. Brand, J. Kirstein, K. Turgay, A. Mogk and B. Bukau (2008). "Protein disaggregation by the AAA+ chaperone ClpB involves partial threading of looped polypeptide segments." Nat Struct Mol Biol 15(6): 641-650.

      Li, T., J. Lin and A. L. Lucius (2015). "Examination of polypeptide substrate specificity for Escherichia coli ClpB." Proteins 83(1): 117-134.

      Li, T., C. L. Weaver, J. Lin, E. C. Duran, J. M. Miller and A. L. Lucius (2015). "Escherichia coli ClpB is a non-processive polypeptide translocase." Biochem J 470(1): 39-52.

      Miller, J. M., J. Lin, T. Li and A. L. Lucius (2013). "E. coli ClpA Catalyzed Polypeptide Translocation is Allosterically Controlled by the Protease ClpP." Journal of Molecular Biology 425(15): 2795-2812.

      Miller, J. M. and A. L. Lucius (2014). "ATP-gamma-S Competes with ATP for Binding at Domain 1 but not Domain 2 during ClpA Catalyzed Polypeptide Translocation." Biophys Chem 185: 58-69.

      Oberhauser, A. F., P. K. Hansma, M. Carrion-Vazquez and J. M. Fernandez (2001). "Stepwise unfolding of titin under force-clamp atomic force microscopy." Proc Natl Acad Sci U S A 98(2): 468-472.

      Rajendar, B. and A. L. Lucius (2010). "Molecular mechanism of polypeptide translocation catalyzed by the Escherichia coli ClpA protein translocase." J Mol Biol 399(5): 665-679.

      Weibezahn, J., P. Tessarz, C. Schlieker, R. Zahn, Z. Maglica, S. Lee, H. Zentgraf, E. U. Weber-Ban, D. A. Dougan, F. T. Tsai, A. Mogk and B. Bukau (2004). "Thermotolerance requires refolding of aggregated proteins by substrate translocation through the central pore of ClpB." Cell 119(5): 653-665.

    1. Author response:

      The following is the authors’ response to the original reviews.

      We would like to thank the reviewers and editor for their helpful comments. We have addressed their concerns as detailed below.

      It would have been nice to have included a bona-fide SIRT2 target as a control throughout the study.

      We agree that including a bona-fide SIRT2 target as a control is important for validating our results. Previous data from our work has shown that SIRT2 demyristoylates ARF6. Thus, we have included a blot in Figure S15 demonstrating that SIRT2 knockdown results in increased myristoylation of ARF6. This serves as a control to confirm the activity and role of SIRT2 in our study.

      Did the authors also consider investigating SIRT1 in their assays? SIRT1 activates ACSS2 while SIRT2 leads to degradation of ACSS2. They should at least discuss these seemingly opposing roles of SIRT1 and SIRT2 in the regulation of ACSS2 and acetate metabolism in more depth particularly as it concerns situations (i.e., diseases, pathologies) where either SIRT1, SIRT2, or both sirtuins, are active. This would enhance the significance of the findings to the broader research community.

      The study by Hallows et al. showed increased SIRT1 deacetylate K661 of ACSS2 and increase its catalytic activity. Subsequently, a follow-up investigation unveiled the role of the circadian clock in modulating intracellular acetyl-CoA levels through SIRT1-catalyzed K661 deacetylation of. Conversely, our research elucidates a contrasting mechanism wherein SIRT2 inhibits ACSS2 by deacetylating K271 under conditions of nutrient stress. The dual regulation of ACSS2 by SIRT1 through the circadian clock and SIRT2 under nutrient stress underscores the intricate and multifaceted nature of regulatory mechanisms involved in lipid metabolism. These findings underscore the versatility of lysine acetylation in modulating cellular metabolic pathways.

      Collectively, these studies contribute to a better understanding of how SIRT1 and SIRT2 regulate ACSS2 activity in various metabolic contexts, thereby enhancing our knowledge of acetate metabolism and its implications in health and disease.

      We have included such discussion of the manuscript.

      In Figure 3, the authors should consider immunoblotting for endogenous ACSS2 throughout the differentiation and lipogenesis study since the total ACSS2 levels is the crucial aspect to affecting acetate-dependent promotion of lipogenesis in adipocytes, and to confirm TM-dependent stabilization of ACSS2 in that assay.

      We have updated Figure 3 to include immunoblotting for endogenous ACSS2 levels. Additionally, we have confirmed the TM-dependent stabilization of ACSS2, which is now shown in Figure S12.

      Do the authors have any data proving the K271 mutants of ACSS2 are still functional? Or that K271 ACSS2 protein is folded correctly?

      To assess the functionality of the mutants, we isolated Flag-tagged wildtype, K271R, and K271Q ACSS2 proteins from SIRT2 knockdown HEK293T cells. Subsequently, we examined acetyl-CoA formation from acetate and CoA using high-performance liquid chromatography (HPLC). Our findings indicate that while the wildtype ACSS2 exhibits slightly higher activity compared to the K271R and K271Q mutants, but all variants remain functional (Figure S13).

      Nearly all experiments are performed in a single cell line. Authors should test whether SIRT2 regulates ACSS2 acetylation in at least 1 or 2 more cell lines. Does SIRT2 regulate ACSS2 acetylation in 3T3-L1 preadipocytes?

      Experiments showing that endogenous ACSS2 levels change in EBSS and nutrient-deprived media were repeated in A549 cells (Figure S5). However, due to the poor transfection efficiency of A549 cells, we were unable to obtain acetylation data. Similarly, conducting acetylation experiments in 3T3-L1 preadipocytes is challenging due to poor transfection efficiency.

      The article does not explicitly address whether the absence of amino acids impacts the acetylation and subsequent degradation of ACSS2 by activating SIRT2. If so, one would expect the level of ACSS2 acetylation or ACSS2 expression under amino acid deprivation to be lower than that under normal conditions, as depicted in Fig. 1C and Fig. S3.

      The experiments shown in Fig. 1C and Fig. S3 were using overexpressed Flag-tagged ACSS2 and we actually adjust the amount of DNA used to have similar Flag-ACSS2 levels.

      To address the comment raised by the reviewer, we added Figure S14, which shows that endogenous ACSS2 acetylation is decreased under amino acid deprivation in SIRT2 control KD cells, indicating that the absence of amino acids impacts ACSS2 acetylation. The decreased expression of ACSS2 under amino acid deprivation is also addressed in Figure S6.

      Several reviewers noted discrepancies between what is occurring to basal levels of ACSS2 vs in SIRT2 KD conditions. Fig. 2H shows higher basal level of acetylated ACSS2 in K271R mutant compared to wildtype (input may be an issue). If Fig. 2H is a critical piece of data, authors are recommended to show this using FLAP-IP & then Ac-K.

      The increased stability of the K271R mutant compared to the wildtype (WT) results in higher protein levels, which results in the different input levels. However, this does not affect the conclusion that K271 is the acetylation site as the quantification result shows that K271R mutant has lower acetylation level and is not regulated by SIRT2 (Figure S16).

      Regarding the basal levels of ACSS2 in control and SIRT2 KD conditions, it was because the experiments in question were using overexpressed Flag-tagged ACSS2 and we actually adjust the amount of DNA used to have similar Flag-ACSS2 levels. To address the concern, we monitored endogenous ACSS2 protein and acetylation levels and the results are shown in Figure S14.

      Also, in Fig 2I there is no difference in basal ubiquitination between WT and K271R mutant. Related, based on model you would expect that overexpression of ACSS2-K271R mutant compared to wildtype would be at higher levels. In many figures authors do not see this (Fig. 2I, 3A, 3B). This needs to be explained.

      This is related to some previous comments. In these experiments, we actually adjusted the DNA used in the transfection to obtain equal protein levels so that we can quantify other things (acetylation or ubiquitination levels). As stated in the manuscript regarding Figures 3A and 3B, "To ensure comparable expression levels at the beginning, we adjusted the amount of transfected DNA for both wild-type and the K271R mutant ACSS2." This approach allowed us to accurately compare the ubiquitination status between the wildtype and K271R mutant ACSS2 variants.

      Data showing role of ACSS2-K271 mutant in lipid accumulation requires clarification. Based on model overexpression of ACSS2-K271 mutant should by itself cause increased lipid accumulation compared to wildtype.

      This is indeed the case and we have added this in the revised manuscript “Consistent with our above observation that ACSS2 K271R mutant is more stable than the WT, expressing the K271R mutant lead to more lipid droplets than expressing the WT ACSS2 (Figure S12).”

      Loading controls are notably absent at certain instances, such as IPs in Fig. 1A, 1C, and the IP in Fig. 2H. Such controls are required to interpret potential changes in acetylation.

      For this experiment, we employed an approach where we overexpressed Flag-tagged wild-type (WT) and mutant forms of ACSS2. We conducted an immunoprecipitation (IP) targeting acetyl-lysine residues to enrich lysine-acetylated proteins, followed by immunoblotting for the Flag tag to specifically detect ACSS2 acetylation levels. To ensure the reliability of our results, we included a Flag blot to confirm equal expression levels of ectopically expressed ACSS2 across our samples before IP. Given the nature of our experimental design and the specific aim of investigating ACSS2 acetylation, we believe that additional loading controls beyond the input Flag blot are not required for the interpretation of our results. The inclusion of the input Flag blot serves as a control for protein expression levels, which is crucial for accurate assessment of ACSS2 acetylation status.

      While CHX treatment is known to inhibit protein synthesis, it appears contradictory that CHX treatment in Fig. 2C seemingly leads to ACSS2 accumulation in SIRT2 knockdown HEK293T cells. This discrepancy requires clarification.

      We conducted quantitative analysis of the immunoblot with replicates to ensure the reliability of our findings. Our analysis indicates that the protein level of ACSS2 remains relatively stable over the time course of CHX treatment. The observed slight increase at the 8-hour time point can be attributed to inherent experimental variability, as evidenced by the presence of large error bars in the graph. We have included a graph in Figure S7 to show that there is no significant change in the level of ACSS2 in the SIRT2 HEK293T cells.

      In Fig. 2F-H, the authors argue that SIRT2 deacetylates ACSS2 to facilitate its ubiquitination and subsequent proteasomal degradation. However, these results are depicted under normal conditions, whereas findings in Fig. 1 suggest that SIRT2 deacetylates ACSS2 exclusively under nutrient stress. An explanation for this inconsistency is warranted.

      These experiments were done in amino acid deprived (EBSS) media. We have corrected this in the manuscript.

      Line 160 authors conclude "amino acid limitation..deacetylates K271"..but this was not directly demonstrated. Authors should add this data or change conclusion.

      Addressed in response to some of the comments above.

      Figures 1A and 1B, acetylation quantification, not clear if it is relative to the Flag tag or actin.

      Acetylation quantification is relative to Flag tag. This is clarified in the figure legend.

      Methods section lacking details & not well referenced (how did authors express wildtype & mutant in 3T3-L1 cells?) 

      ACSS2 wildtype and K271R mutant Flag-tagged expression plasmids were transfected into ACSS2 knockdown 3T3-L1 cells using PEI transfection reagent following the manufacturer’s protocol. The pCMV-Tag4a empty vector was used as the negative control. Differentiation of 3T3L1 cell lines were done according to manufacturer’s protocol (DIF001-1KT, Sigma Aldrich) 24 hours after transfection. This has been included in the methods.

      In Figure 3A, is the actin blot from the same immunoblots above it? Reviewers recommend the authors upload original immunoblot.

      This experiment was repeated, and the blot has been replaced.

    1. Author response:

      The following is the authors’ response to the original reviews.

      Thank you for your time and consideration on our submission. We also thank the reviewers for their consideration and helpful comments.  We have revised the introduction, results, and discussion sections of the revised manuscript in accordance with the reviewers’ suggestions, which have enhanced the clarity of our work. Specifically, we have clarified that the aim of the study is to report newly discovered sperm behaviours inside the uterus via high resolution deep tissue live imaging, and to stimulate further studies and discussion in the field of postcopulatory sexual selection in mice based on our observations. To the best of our knowledge, many of the specific sperm behaviours described in our manuscript are being reported for the first time, proven through direct observation inside the living reproductive tract.

      We have also restructured our manuscript and moved our hypothetical interpretations based on our experimental observations to the discussion section. We hope that these revisions have clarified our claims and that our revised manuscript effectively communicates the importance of our findings and its values in prompting new questions and insight that encourage further studies. We believe that our work clearly demonstrates the importance of sperm/reproductive tract interaction, which cannot be adequately studied in artificial environments, and may become an important guideline for designing future experiments and studies.

      Public Reviews: 

      Reviewer #1 (Public Review): 

      Summary: 

      The authors want to determine the role of the sperm hook of the house mouse sperm in movement through the uterus. The authors are trying to distinguish between two hypotheses put forward by others on the role of the sperm hook: (1) the sperm cooperation hypothesis (the sperm hook helps to form sperm trains) vs (2) the migration hypothesis (that the sperm hook is needed for sperm movement through the uterus). They use transgenic lines with fluorescent labels to sperm proteins, and they cross these males to C57BL/6 females in pathogen-free conditions. They use 2-photon microscopy on ex vivo uteri within 3 hours of mating and the appearance of a copulation plug. There are a total of 10 post-mating uteri that were imaged with 3 different males. They provide 10 supplementary movies that form the basis for some of the quantitative analysis in the main body figures. Their data suggest that the role of the sperm hook is to facilitate movement along the uterine wall. 

      We thank the reviewer for summarizing our work and the critical review of our paper. As summarized, the sperm hook has been primarily associated with the sperm cooperation (sperm hook) hypothesis and the migration hypothesis. However, we would like to emphasize that the aim of our work is not to cross check between the two hypotheses. Our aim was not to disprove either hypothesis, but rather to develop an experimental platform that enables detailed observation of sperm migration dynamics within the live reproductive tract. 

      Through live imaging, we observed both the formation of sperm trains as well as interaction between the sperm and female reproductive tract epithelium. However, in our observations, we could not find advantage in terms of faster movement for the rarely observed sperm trains. While these events were infrequent in our experiments, we are not asserting that the sperm train hypothesis is invalid but rather reporting our observations as is. 

      The main findings of our work lie in the newly observed dynamic behaviours of mouse sperm interacting with the female reproductive tract epithelium. Specifically, tapping and associated guided movement along the uterus wall, anchoring and related resistance to internal fluid flow and migration through the utero-tubal junction, and self-organized behaviour while clinging onto the colliculus tubarius. We have extensively revised the manuscript structure to clarify our findings.

      Strengths: 

      Ex vivo live imaging of fluorescently labeled sperm with 2-photon microscopy is a powerful tool for studying the behavior of sperm. 

      Weaknesses: 

      The paper is descriptive and the data are correlations. 

      The data are not properly described in the figure legends. 

      When statistical analyses are performed, the authors do not comment on the trend that sperm from the three males behave differently from each other. This weakens confidence in the results. For example, in Figure 1 the sperm from male 3613 (blue squares) look different from male 838 (red circles), but all of these data are considered together. The authors should comment on why sperm across males are considered together when the individual data points appear to be different across males. 

      Thank you for your comments and suggestions. We have revisited all figure legends and made the necessary amendments (shown in the red-lined manuscript). Please note that, for a better flow of the paper, the previous Figure 1 has been changed to Figure 2 in the revised manuscript.

      Regarding the analysis using different males, we would like to explain the statistics used. We used generalized linear mixed models to test the effect of the Angle and Distance to the wall on the migration kinetic parameters. The advantage of the generalized linear mixed models is that they consider individual variations in the data as an error term, thereby controlling such individual variations. 

      There are two main factors contributing to individual variations. One is, as you pointed out, the difference in sperm from different males. However, we used genetically similar mice, so genetical variations must be minimal. Nonetheless, there must be individual differences that caused variations including age, stress level as well as body conditions. As these factors cannot be controlled, we used the mixed model approach where individual variations are grouped within the individual. This approach enabled us to test the effect of each explanatory variable (Angle and Distance) within an individual. 

      The second factor that could cause variations is the female oestrous status. To avoid artifacts that could influence sperm behaviour, we did not use any invasive methods, such as hormone injections, to control or induce female oestrus. We controlled for this possible effect by including the mating date as a random effect. Since each female was used only once, the mating date reflects the variation caused by each female.

      To provide further verification that the variation between individual males do not affect our results, we conducted analysis per individual male and mating dates (per each female). As clearly shown, sperm data points from individual males or female also show consistent clear correlations with the distance from the uterus wall. As pointed out, while the mean sperm speed could be different between individuals, they are not the topic we are interested in here. Our interest here is the effect of the distance between sperm and the uterine wall. Additionally, the variation between males is not always larger than those effect of the day (female), which in total suggest that integrating male variation is not essential. We have added this information to Supplementary Figure (Fig. S3) of the revised supplementary materials.

      Moving forward, we can also consider the same analysis for the effects of the distance from wall on sperm SWR and LIN (linearity of forward progression) where no statistical significance was found. As see in the following figures, no statistically significant effect of the distance to wall on SWR and LIN are seen in that the regression lines drawn for each male and mating dates.

      In summary, the statistical approach we used here has successfully reflected variations in sperm kinetics from different males as well as the variance from different females. We hope that our explanations and additional analysis answer your concerns. 

      Movies S8-S10 are single data points and no statistical analyses are performed. Therefore, it is unclear how penetrant the sperm movements are. 

      With respect to Movie S8, Figure 4A and B (Figure 5A and B in the current revised manuscript) depict the trajectories of accumulated spermatozoa (sperm trains) in the female uterus, as shown in Movie S8. We have added this information to the revised figure legend (L 293) for clarity. We could not observe sperm trains that moved faster than single sperms during over 100 hours of observation and collection of over 10TB of images. The three sperm trains presented in Fig. 5B were the sperm trains that moved in the head-forward direction. Most other identifiable trains, or clusters, did not move or could not move forward as their heads were entangled randomly. Although we of course agree that a statistical test for Movie S8 (also Fig. 5B) would be great, due to the small number of sperm trains we found, we could not perform meaningful statistical tests. Instead, we provided all data in the box plots in Fig. 5C so that readers can evaluate and understand our points. We believe that this is a more neutral way of presenting our data rather than providing statistical significance.

      Regarding Movies S9 and S10, we are not entirely sure whether we understood your comments clearly. It would be very helpful if you could point out more specifically to the manuscript with line numbers as we would like to address your concerns and suggestions, and we believe that your input will improve our manuscript. We did not describe the penetration of sperm in these movies. Movies S9 and S10 are newly found sperm behaviours inside the UTJ and Isthmus. We observed that sperm beating is influenced by the width of luminal space as well as internal flow as see in Movies S9 and S10. As our animal model only expresses red fluorescence in the midpiece, accurate beating frequency measurement cannot be performed. However, we can clearly observe that beating is not continuous and almost results in a halt with respect to reproductive tract variations. We revised our description about the findings about beating speed changes in the revised manuscript (LL 305-335).  

      Movies S1B - did the authors also track the movement of sperm located in the middle of the uterus (not close to the wall)? Without this measurement, they can't be certain that sperm close to the uterus wall travels faster. 

      We revised the new Movie S1B to include videos that were used for the sperm migration kinetics analysis in Figure 2 (previously Figure 1). As you can see in the movies, the graph, and statistical analysis, there is a clear trend showing spermatozoa migration is slower as a function of distance from the uterus wall. Regarding your comment with respect to the middle of the uterus (not close to the wall), we have added another movie (Movie S1C) that was acquired at different depths from the wall (going towards the centre of the uterus). As clearly seen in Movie S1c, when imaging deeper into the uterus, there are an increasing number of inactive or slow-moving spermatozoa. Since the diameter of the uterus is easily over 2mm, we currently do not have optical access to exactly the centre of the uterus, but for all depths that are observable, spermatozoa near the wall were clearly faster.

      Movie S5A - is of lower magnitude (200 um scale bar) while the others have 50 and 20 uM scale bars. Individual sperm movement can be observed in the 20 uM (Movie 5SC). If the authors went to prove that there is no upsucking movement of sperm by the uterine contractions, they need to provide a high magnification image. 

      The main focus of video S5A, is the intramural UTJ where spermatozoa are located in rows within narrow luminal space (see Author response image 1). When there is up-suck like sperm passive carriage, there must be sperm movement from the uterus to intramural UTJ as in Author response image 1 left. However, there is no such sperm movement could be seen in our observations, as shown in Movie 5A. Importantly, as you can see in Movie 5A, indicated by an arrow from 5 sec to 6 sec, some spermatozoa are moving downward (see also Author response image 1 right). This is the opposite direction of movement with respect to possible up-suck like sperm carriage. 

      Genetical evidence also support up-suck like passive sperm carriage is not the case for sperm migration from the uterus to UTJ. If environmental up-suck like passive transfer plays an important role, it is unlikely that genetically modified spermatozoa cannot pass the entrance of the intramural UTJ (Nakanishi et al., 2004, Biol. Reprod.; Li et al., 2013, J. Mol. Cell Biol.; Larasati et al., 2020, Biol. Reprod.; Qu et al., 2021, Protein Cell). 

      Author response image 1.

      The left image represents what is expected when up-suck like passive sperm carriage occurs. The right image represents what is actually experimentally observed in the intramural UTJ (see Movie S5A). The direction of the arrowheads indicates the direction of sperm movement.

      Movie S8 - if the authors want to make the case that clustered sperm do not move faster than unclustered sperm, then they need to show Movie S8 at higher magnification. They also need to quantify these data. 

      We understand your concern. As shown in Figure 5B, we included all sperm kinetics data of each sperm train and unlinked spermatozoon around the trains as individual dots. The only analysis we did not conduct was a statistical test with the data as it could be erroneous due to the large sample size difference (3 trains vs 181 unlinked spermatozoa). As the medians of the four sperm kinetic parameters are similar except SWR, we concluded that they are not necessarily faster than unlinked single spermatozoa. Since there is no known advantage to spermatozoa (including sperm trains) with intermediate moving speeds for sperm competition – for example in IVF, success fertilization rate is high when faster and active spermatozoa with normal shape are selected (Vaughan & Sakkas, 2019, Biol. Reprod.) – it is questionable whether there can be an advantage to the formation of sperm trains whose speed is not faster than unlinked spermatozoa in our data.

      However, we do not agree with your comment regarding the need for higher magnification. Measurement of the sperm migration speeds (kinetic parameters) does not require measurement of exact tail movements in this study. Only sperm heads were tracked to measure their trajectory and such tracking was better done at low mag. For example, measuring the speed of a car does not need higher magnifications to visualize the rotation of the wheels. Additionally, including the effect of observation magnification on the sperm kinetic parameters for all 4 GLMM models for Figure 2 (Table S3) does not change the result, which shows that magnification is not a factor that influences our analysis. 

      Movie S9C - what is the evidence that these sperm are dead or damaged? 

      Thank you for your valid comment. We tracked sperm movements for at least 10 minutes and such entangled spermatozoa in the UTJ never became re-active. As you can see in the new Movie S9b, entangled spermatozoa were also acrosome re-acted (green acrosome head is gone) while active spermatozoa are responding to peristaltic movement by exhibiting movements within the same video. However, as you pointed out, we did not measure their viability with appropriate dyes. Although we also considered about extracting these spermatozoa and performing viability tests, we could not come up with a way to specifically extract the exact spermatozoa that were imaged. Considering your comments, we changed the term damaged or dead to inactive in the revised manuscript (LL 313-316, Legend Figure 6D. LL 380-384).

      Movie S10 - both slow- and fast-moving sperm are seen throughout the course of the movie, which does not support the authors' conclusion that sperm tails beat faster over time. 

      There must have been a misunderstanding. We did not indicate that sperm beating got faster over time anywhere in the main manuscript, including the figure legend and related movie captions. As correctly pointed out, the sperm beating speed changes over time (not getting faster over time) and shows a correlation with internal fluid flow and width of luminal space (LL 320-332). Please let us know if you meant something else. 

      Reviewer #2 (Public Review): 

      Summary: 

      The specific objective of this study was to determine the role of the large apical hook on the head of mouse sperm (Mus musculus) in sperm migration through the female reproductive tract. The authors used a custom-built two-photon microscope system to obtain digital videos of sperm moving within the female reproductive tract. They used sperm from genetically modified male mice that produce fluorescence in the sperm head and flagellar midpiece to enable visualization of sperm moving within the tract. Based on various observations, the authors concluded that the hook serves to facilitate sperm migration by hooking sperm onto the lining of the female reproductive tract, rather than by hooking sperm together to form a sperm train that would move them more quickly through the tract. The images and videos are excellent and inspirational to researchers in the field of mammalian sperm migration, but interpretations of the behaviors are highly speculative and not supported by controlled experimentation. 

      Thank you for your critical review and valuable comments on our manuscript. As pointed out, some of our findings and suggestions were largely observation based. However, to the best of our knowledge, many of our observations are novel, particularly in the context of live imaging inside the female uterus and reproductive tract. We believe these observations open doors to many questions and follow up studies that can be envisioned based on our findings, which is what drives science forward. 

      That being said, we entirely agree that many follow up experiments need to be designed and performed, especially to validate the exact molecular mechanisms of the observed dynamics. We acknowledge that it is unfortunate we currently lack the proper molecular experimental toolsets to perform further tests. We have removed much of the hypothetical discussions from the results section and moved them to the discussion section. We hope that our revision more clearly defines the observed experimental data and our interpretations.

      Strengths: 

      The microscope system developed by the authors could be of interest to others investigating sperm migration. 

      The new behaviors shown in the images and videos could be of interest to others in the field, in terms of stimulating the development of new hypotheses to investigate. 

      Weaknesses: 

      The authors stated several hypotheses about the functions of the sperm behaviors they saw, but the hypotheses were not clearly stated or tested experimentally. 

      The hypothesis statements were weakened by the use of hedge words, such as "may". 

      We appreciate your helpful comments and have revised our hypotheses and suggestions accordingly. We have removed instances of “may” or revised it to be more direct. We have also moved most of our interpretations and hypotheses from the results to the discussion section. 

      It is important to note that experimental approaches to test what we suggested from our findings in the current ex-vivo observation platform are not trivial and require extensive investigation of several unknown factors of the female reproductive tract. For instance, obtaining detailed information on the chemical characteristics and fluid dynamics in the female reproductive tract is essential to build a microfluidic channel that accurately resembles the uterus and oviduct, replicating what we found in an extracted living entire organ. This poses a significant challenge and requires collaborative expertise from many labs, which we hope to build in the near future. 

      Furthermore, our biggest concern is that, even if we were to construct the appropriate microfluidic channel to test sperm migration, it is very likely that the sperm behaviours that we observed under natural conditions may not be replicated in artificial environments. This raises questions about whether in-silico or in-vitro findings can truly resemble what we reported here using the ex-vivo observation inside a living organ.

      To share our experience related to this difficulty, at the initial stage of our study, we attempted sperm injection combined with fluorescent beads to visualize the fluid flow, as well as dyeing the female reproductive tract and spermatozoa after mating. However, none of these resulted in meaningful results. Another potential approach to perform similar research regarding our claims is using genetical engineering to indirectly confirm the influence of the sperm hook morphology on sperm behaviour. However, such an approach lacks a mechanical demonstration about how the sperm hook interacts with the female reproductive tract. 

      It is unfortunate that the sperm behaviours that we found and reported here are considered as highly speculative. The main findings of our work lie in the newly observed dynamic behaviours of mouse sperm interacting with the female reproductive tract epithelium. Specifically, these behaviours include tapping and associated guided movement along the uterus wall, anchoring and related resistance to internal fluid flow and migration through the utero-tubal junction, and self-organized behaviour while clinging onto the colliculus tubarius. 

      We have extensively revised the manuscript structure to clarify our findings and integrated our points in the introduction. Although we understand our following hypotheses may be considered speculative and the causative relationship between the sperm hook and its role in sperm migration requires further experimental approaches, we believe that the image-based observation of dynamic behaviours of spermatozoa are solid. We believe our findings will facilitate further studies and discussion in the field of studies on postcopulatory sexual selection in rodents.

      Recommendations for the authors:

      Reviewer #1 (Recommendations For The Authors): 

      The manuscript is written for an expert in a fairly small field. I recommend that the authors rewrite the manuscript to make it more accessible to people outside of the field. These suggestions include 

      (1) Provide a diagram of the female reproductive tract in Figure 1. 

      a. Indicate where sperm enter the tract and the location of the oocyte they are trying to reach. 

      b. Label all areas of the uterus that are mentioned in this study and be consistent about the label. 

      (2) All movies should have a diagram of the location of the uterus that is being imaged. 

      Thank you for the great suggestion. We have added a diagram of the female reproductive tract in the revised Figure 1A. In response to your comments 1a and b, we have indicated such information by including eggs in the ampulla and arrows that indicate sperm migration direction. We have also labelled the name of the specific areas that were studied in the manuscript.

      We are unsure how to integrate the diagram in all movies without reframing the videos, which could cause serious corruption of the files. More importantly, we think that adding the same diagram to all movies may complicate the visuals and disrupt indications and subject in the movie. Instead, we have referred to the common diagram (Figure 1A) in each movie caption, specifying where the video was taken. Thank you for the suggestion. With this information, we hope readers can now more easily understand where we made the observations. 

      (3) The major questions in the field need to be better described in the introduction. 

      Thank you for your valuable suggestions and specific comments which have greatly helped improve our manuscript. We have revised our introduction and discussion sections by adding more literature reviews and integrating studies across a wider range of the postcopulatory sexual selection, as per your suggestion (LL 34-57, LL 385-398).

      (4) The major question that the authors are trying to address should be described in the introduction. 

      Thank you for the helpful suggestion. We have clarified in the introduction that our aim was to contribute to the field of postcopulatory sexual selection in rodents by advancing methodological progress and to stimulate discussion and future research on the function of the sperm hook in murine rodents (LL 76-94) based on our observations.

      (5) A discussion of the sperm hook should be provided. How many species have this structure (or similar structure)? 

      We have integrated your point into the revised discussion section. Essentially, most murine rodent species have sperm hooks (while their exact shapes differ). However, as there are over 500 species and not all of them have been tested, we do not know exactly how many of them have this structure. Therefore, we included paper references that examined species variations in sperm hook characteristics and their possible correlation with sperm competition (LL 385417) in the discussion. Additionally, we also included papers by Breed (2004) and by Roldan et al (1992) that investigated murine rodents with a sperm hook in the introduction section as well (LL 58-61).  

      (6) The figure legends must describe everything in the figure or movie. 

      Thank you for the helpful suggestion. We previously thought that our figure legends may be too long. We have included further information in the figure legends and movie captions. We have also revised the movies by adding some clips following our revision (Movie S1).

      Reviewer #2 (Recommendations For The Authors): 

      Here are some specific concerns I had about the clarity of approach to experiments and interpretations of results. 

      In the Introduction, the authors stated that the study was intended to determine the function of the hooks on the mouse sperm heads. However, in the Results section, the authors did not explain the rationale for the first set of experiments with respect to the overall objective of the study. In this experiment, the authors measured the velocities of sperm swimming in the uterus and found that the sperm moved faster when closer to the uterine wall (VCL, VSL). They concluded that migration along the uterine wall "may" be an efficient strategy for reaching the entrance to the uterotubal junction (UTJ) and did not explain how this related to the function of the hooks. 

      Thank you for your critical comment and guidance. We have changed the order of Figure 1 and Figure 2 and revised the result section to integrate your points. At the initial stage of the study, we expected to find evidence of the function of sperm trains in aiding sperm migration in the female uterus (which has not been observed in the live uterus; previous works were done invitro with extracted sperm from epididymis or uterus after mating). However, what we found was something unexpected: dynamic sperm hook related movements facilitating sperm migration inside the female uterus by playing a mechanical role in sperm interaction with the uterine wall. These results that were presented in the previous Figure 2 has been reorganized as the new Figure 1.

      Based on this observation, our research later moved to clarify whether such sperm-epithelium interaction indeed helps sperm migration. This led us to measure sperm kinetics in relation to their distance and angle to the uterine wall. We have revised our introduction and result parts by integrating these points. We hope that our revision will answer your questions. We have also reduced the use of ‘may’ or ‘can’ in the results section. In the revised manuscript, we have moved such hypotheses to the discussion section and focused on what we observed in the results section.

      The authors proposed that the sperm hook "may" play a crucial role in determining the direction of migration. When sperm encountered a uterine wall, significantly more changed migration direction toward the pro-hook direction than toward the anti-hook direction. In Figure 2B, sperm behavior is not visually understandable nor clearly explained. 

      Thank you for the helpful comments. We have removed “may” and “might” to make our claim clearer and more concise. We have also revised the previous Figure 2B by combining it with the previous Figure 2C (they have been combined into Figure 1C now). We have also revised Figure 1B by increasing the line thickness of the sperm trajectory of the pro-wall-hook direction and added the anti-wall-hook trajectory. We hope that these revisions make the figure easier to understand.

      In Figure 2E, are the authors showing that the tip of the hook is caught between two epithelial cells? Please clarify the meaning of this figure. 

      Please clarify the difference between "tapping" and "anchoring". 

      Thank you for the detailed comments. As you pointed out, we currently have no evidence whether sperm can be caught in epithelia inter-cellular gaps. We have revised this source of confusion by removing the gap in the revised figure (Figure 1E). We have also included the definition of anchoring (LL 142-143) and tapping (LL 128-130). Anchoring facilitates the attachment of sperm to the uterine epithelia. Such anchoring also involves the catching of the sperm head in the inter-mucosal fold or gap, particularly at the entrance of the intramural UTJ at the end of the uterus. Tapping is the interaction between the head hook and epithelia in which the sperm hook is tapping (or patting) on the surface. Sperm tapping can be a byproduct that results from flagella beating when spermatozoa migrate toward the pro-wall-hook direction along the uterine wall (epithelia) or can play some role in sperm migration. As we currently cannot draw a conclusion, we did not integrate the possible function of the tapping in the manuscript.

      The authors proposed that opposite sliding of neighboring mucosal folds lining the UTJ would cause small openings to form, through which only perhaps one sperm at a time could enter and pass through the UTJ into the uterus. This hypothesis was not actually tested. 

      Imaging inside deep tissue is challenging due to light scattering as it penetrates through biological tissue. While this is also true for the uterus, the intramural UTJ is especially difficult to image because the UTJ consists of several thick muscle and cell layers (see Movie S5A). Another challenge is that the peristaltic movement of the UTJ results in constant movement, making continuous tracking of single sperms while passing through the entirety of the UTJ impossible in our current experiments. We have moved this hypothesis to the discussion section and restated that this is a pure hypothetical model (LL 399-406). We hope that our model encourages the community in designing or establishing an improved ex-vivo observation system that may be able to test this hypothetical model in the near future.

      Next, the authors hypothesized that sperm that encounter the small openings in the UTJ may then be guided onward and the hooks could prevent backward slipping. This was also not tested. 

      As you’ve noted, the function of the sperm hook that aids in sliding and preventing backward slipping could not be tested directly in our ex-vivo observation platform that relies on natural movement of the living organ. However, we believe that these limitations also highlight the importance of continued research and the development of more advanced methodologies in this field.

      We would also like to note that we provide direct observations of spermatozoa resisting internal flow due to reproductive tract contractions in Movie S3A, B as well as Movie S5B. We referred to these movies and pointed out the role of anchoring (sperm attachment) in preventing sperm from being squeezing out (LL 140-149, LL 224-241). Unfortunately, we cannot conceive of how this behaviour can be tested additionally in any uterus-resembling microfluidic device or ex-vivo systems. In line with your suggestion, we have rewritten the related result section and moved our related discussions in the result part to the discussion section (LL 224-241, LL 399-417). 

      The authors observed that large numbers of uterine sperm are attached to the entrance of the UTJ. Some sperm clustered and synchronized their flagellar beating. The authors speculated that this behavior served to push sperm in clusters onward through the UTJ. 

      We would like to note that we did not speculate that sperm clustering and their synchronization could serve to push spermatozoa in a cluster to move onward through the UTJ. We only pointed out our observation in recorded videos, that generative flow from the clustered spermatozoa pushed away other spermatozoa as seen in Movie S7 (LL 261-264). Although such sperm cooperation is possible (blocking passage of later sperm), we cannot draw that conclusion from our observation. The possibility you pointed out (pushing sperm onward through the UTJ) was suggested by Qu et al in 2021 [Cooperation-based sperm clusters mediate sperm oviduct entry and fertilization, Protein & Cell] based on their observations on cleared dead reproductive tracts.

      The authors found only a few sperm trains in the uterus, UTJ, and oviduct, so they could not measure sufficient numbers of samples to test whether sperm trains swim faster than single sperm. Without sufficient data, they concluded that the "sperm trains did not move faster than unlinked single spermatozoa." 

      We would like to take this opportunity to clarify our claims. We do not claim that our current experiments can give the final verdict on whether the sperm train hypothesis for faster swimming is correct or not. The phrase “sperm trains did not move faster” was not intended to mean that the sperm train hypothesis is invalid.  We did not draw a conclusion but dryly described the experimental data that we observed (LL 279-286).  We would once again like to emphasize that the main claim of our manuscript is not to rule out the sperm train hypothesis, but to present the various dynamic interactions of the sperm head with the female reproductive tract. To make the statement more balanced, we revised the sentence as “observed sperm trains did not move faster or slower than unlinked single spermatozoa” (LL 281-282).

      The authors hypothesized that the dense sperm clusters at the entrance into the UTJ could prevent the rival's sperm from entering the UTJ (due to plugging entrance and/or creating an outward flow to sweep back the rival's sperm), but they did not test it. 

      We agree that we were not able to test such possible function of the sperm cluster at UTJ entrance. Following your concerns, we revised the result part (LL 256-264) by removing most of our discussions related to the observed phenomena. We also integrated some interpretation rather to the discussion section (LL 421-437) and suggested that future works using appropriate microfluidic channel designs or sequential double mating experiments may be performed for additional tests (LL 443-447). However, we would like to point out that Movie S7C clearly shows surrounding sperms that are swept away from the sperm clusters. Since the sperm density is high, this is almost equivalent to a particle image velocimetry experiment, and we can clearly see the effect of the outward flow generated by the sperm clusters.

    1. Author response:

      The following is the authors’ response to the original reviews.

      This valuable study combines multidisciplinary approaches to examine the role of insulin-like growth factor 2 mRNA-binding protein 2 (IGF2BP2) as a potential novel host dependency factor for Zika virus. The main claims are partially supported by the data, but remain incomplete. The evidence would be strengthened by improving the immunofluorescence analyses, addressing the role of IGF2BP2 in "milder" infections, and elucidating the role of IGF2BP2 in the biogenesis of the viral replication organelle. With the experimental evidence strengthened, this work will be of interest to virologists working on flaviviruses.

      We thank the reviewers for their feedback and constructive suggestions. In this revised version of the manuscript, we have addressed the reviewer’s comments to the best of our ability as detailed below. We believe that the newly incorporated data strengthens our study and conclusions. We hope that this revised manuscript will satisfy the reviewers and will be of high interest to flavivirologists.

      Public Reviews:

      Reviewer #1 (Public Review):

      Summary:

      This study investigated the co-option of IGF2BP2, an RNA-binding protein by ZIKV proteins. Designed experiments evaluated if IFG2BP2 co-localized to sites of viral RNA replication, interacted with ZIKV proteins, and how ZIKV infection changed the IGF2BP2 interactome.

      Strengths:

      The authors have used multiple interdisciplinary techniques to address several questions regarding the interaction of ZIKV proteins and IGF2BP2.

      The findings could be exciting, specifically regarding how ZIKV infection alters the interactome of IGF2BP2.

      We thank the reviewer for acknowledging the multidisciplinary approach of our study and its exciting potential.

      Weaknesses:

      Significant concerns regarding the current state of the figures, descriptions in the figure legends, and the quality of the immunofluorescence and electron microscopy exist.

      In this new version of the manuscript, we have improved the quality of the microscopy data and included the requested information in the figure legends as described below in the Recommendations section.

      Reviewer #2 (Public Review):

      Clément Mazeaud et al. identified the insulin-like growth factor 2 mRNA-binding protein 2 (IGF2BP2) as a proviral cellular protein that regulates Zika virus RNA replication by modulating the biogenesis of virus-induced replication organelles.

      The absence of IGF2BP2 specifically dampens ZIKV replication without having a major impact on DENV replication. The authors show that ZIKV infection changes IGF2BP2 cellular distribution, which relocates to the perinuclear viral replication compartment. These assays were conducted by infecting cells with an MOI of 10 for 48 hours. Considering the ZIKV life cycle, it is noteworthy that at this time there may be a cytopathic effect. One point of concern arises regarding how the authors can ascertain that the observed change in localization is a consequence of the infection rather than of the cytopathic effect. To address this concern, shorter infection periods (e.g., 24 hours post-infection) or additional controls, such as assessing cellular proteins that do not change their localization or infecting with another flavivirus lacking the IGF2BP2 effect, could be incorporated into their experiments.

      We thank the reviewer for these relevant comments regarding the specificity of IGF2BP2 relocalization to the ZIKV replication compartment.

      It is noteworthy that we chose the 2-day post-infection time point for our analyses because it corresponds to the peak of replication with much more titers produced compared to those at 24 hours post-infection (generally ~106 PFU/mL vs. ~104 PFU/mL). Consistently, the abundance of viral replication factories is more obvious at this time-point. A MOI of 5-10 was chosen to maximize the % of infected cells. That said, as suggested by the reviewer, we have analyzed the distribution of IGF2BP2 in ZIKV-infected cells at one-day post-infection, and we provide evidence in Figure S1 that IGF2BP2 relocalizes to the dsRNA-containing compartment at this time point.

      Importantly, we now show in Figure S5 that in contrast to IGF2BP2, other host RNA-binding proteins such as LARP1 and DDX5 do not accumulate to ZIKV replication compartment at 2 days post-infection. LARP1 actually seems to be excluded from it while DDX5 remains nuclear. Of note, consistent with the ZIKV-induced decrease in expression observed in western blots (Fig 4A), the intensity of DDX5 signal decreases in infected cells. Altogether, this demonstrates that the IGF2BP2 relocalization phenotype is specific and is not due to ZIKV-induced cell death.

      By performing co-immunoprecipitation assays on mock and infected cells that express HAtagged IGF2BP2, the authors propose that the observed change in IGF2BP2 localization results from its recruitment to the replication compartment by the viral NS5 polymerase and associated with the viral RNA. Given that both IGF2BP2 and NS5 are RNA-binding proteins, it is plausible that their interaction is mediated indirectly through the RNA molecule. Notably, the authors do not address the treatment of lysates with RNase before the IP assay, leaving open the possibility of this indirect interaction between IGF2BP2 and NS5.

      We agree with the hypothesis of the reviewer. As suggested, we have performed coimmunoprecipitation assays following RNase A treatment of the cell lysates. As shown in new Fig S6, the abundance of ZIKV NS5 co-immunoprecipitating with IGF2BP2-HA is drastically decreased upon RNase A treatment compared to the untreated condition. This demonstrates that the IGF2BP2/NS5 interaction is mostly RNA-dependent, which is not surprising as RNA is often a structural component of ribonucleoprotein complexes. Of note, the same is observed with ATL2. This new set of data allows us to refine our model of Figure 11 and the discussion as they strongly suggest that the direct binding of IGF2BP2 to viral RNA (evidenced in vitro; Fig 5D) is required for subsequent association with NS5 and ER-shaping protein ATL2. This is in line with the fact that viral RNA is a co-factor in the biogenesis of ER-derived ZIKV vesicle packets (PMID: 32640225). However, we cannot exclude a contribution of cellular RNA in these processes as discussed.   

      In in vitro binding assays, the authors demonstrate that the RNA-recognition motifs of the IGF2BP2 protein specifically bind to the 3' nontranslated region (NTR) of the ZIKV genome, excluding binding to the 5' NTR. However, they cannot rule out the possibility of this host protein associating with other regions of the viral genome. Using a reporter ZIKV subgenomic replicon system in IGF2BP2 knock-down cells, they additionally demonstrate that IGF2BP2 enhances viral genome replication. Despite its proviral function, the authors note that the "overexpression of IGF2BP2 had no impact on total vRNA levels." However, the authors do not delve into a discussion of this latter statement.

      We agree with the reviewer’s comments. We now mention in the discussion that we cannot exclude the possibility that IGF2BP2 associates with RNA motifs within the coding region of the viral genomic RNA, especially considering that it contains N6A-methylated sequences (PMID: 27773535; 27773536; 29373715). Moreover, we discuss the observation that IGF2BP2 overexpression has no impact on vRNA levels (as well as titers). We believe that this is because endogenous IGF2BP2 is highly expressed in cancer cells such as the Huh7.5 and JEG-3 cells used here and is presumably not limiting for viral replication in our system (PMID: 38320625; 35111811; 34309973; 35023719; 37088822; 33224879; 35915142).

      In this study, the authors extend their findings by illustrating that ZIKV infection triggers a remodeling of IGF2BP2 ribonucleoprotein complex. They initially evaluate the impact of ZIKV infection on IGF2BP2's interaction with its endogenous mRNA ligands. Their results reveal that viral infection alters the binding of specific mRNA ligands, yet the physiological consequences of this loss of binding in the cell remain unexplored. 

      We acknowledge that it would be of interest to further study the physiological relevance of the modulation of IGF2BP2 ribo-interactome. Since we have focused here on the role of IGF2BP2 in viral replication, we feel that this will be the focus of future studies notably involving a larger omic-centered approach to identify the most impacted IGF2BP2 mRNA ligands. Of note, Gokhale and colleagues have already reported that CIRBP, TNRC6A and PUM2 proteins regulates the replication of Flaviviridae (PMID: 31810760).

      Additionally, the authors demonstrate that ZIKV infection modifies the IGF2BP2 interactome. Through proteomic assays, they identified 62 altered partners of IGF2BP2 following ZIKV infection, with proteins associated with mRNA splicing and ribosome biogenesis being the most represented. In particular, the authors focused their research on the heightened interaction between IGF2BP2 and Atlastin 2, an ER-shaping protein reported to be involved in flavivirus vesicle packet formation. The validation of this interaction by Western blot assays prompted an analysis of the effect of ZIKV on organelle biogenesis using a newly described replication-independent vesicle packet induction system. Consequently, the authors demonstrate that IGF2BP2 plays a regulatory role in the biogenesis of ZIKV replication organelles.

      Based on these findings and previously published data, the authors propose a model outlining the role of IGF2BP2 in ZIKV infectious cycle, detailing the changes in IGF2BP2 interactions with both cellular and viral proteins and RNAs that occur during viral infection.

      The conclusions drawn in this paper are generally well substantiated by the data.

      We thank the reviewers for this encouraging general comments on our study.

      However, it is worth noting that the majority of infections were conducted at a high MOI for 48 hours, spanning more than one infectious cycle. To enhance the robustness of their findings and mitigate potential cell stress, it would be valuable to observe these effects at shorter time intervals, such as 24 hours post-infection.

      As explained above, IGF2BP2 relocalization to the (dsRNA-enriched) replication compartment was also observed in ZIKV infected cells at one day post-infection.

      Furthermore, the assertion regarding the association of IGF2BP2 with NS5 could be strengthened through additional immunoprecipitation (IP) assays. These assays, performed in the presence of RNAse treatment, would help exclude the possibility of an indirect interaction between IGF2BP2 and NS5 (both RNA-binding proteins) through viral RNA, thus providing more confidence in the observed association.

      See above for our answer and the description of the new data of Fig. S7.

      Reviewer #3 (Public Review):

      Summary:

      The manuscript by Mazeaud and colleagues pursued a small-scale screen of a targeted RNAi library to identify novel players involved in Zika (ZIKV) and dengue (DENV) virus replication. Loss-of-function of IGF2BP2 resulted in reduced titers for ZIKV of the Asian and African lineages in hepatic Huh7.5 cells, but not for either of the four DENV serotypes nor West Nile virus (WNV). The phenotype was further confirmed in two additional cell lines and using a ZIKV reporter virus. In addition, using immunoprecipitation assays the interaction between IGF2BP2 and ZIKV NS5 protein and RNA genome was detected. The work addressed the role of IGF2BP2 in the infected cell combining confocal microscopy imaging, and proteomic analysis. The approach indicated an altered distribution of IGF2BP2 in infected cells and changes in the protein interactome including disrupted association with partner mRNAs and modulation of the abundance of a specific set of protein partners in IGF2BP2 immunoprecipitated ribonucleoprotein (RNP) complexes. Finally, based on the changes in IGF2BP2 interactome and specifically the increment in the abundance of Atlastin 2, the biogenesis of ZIKV replication organelles (vRO) is investigated using a genetic system that allows virus replication-independent assembly of vRO. Electron microscopy showed that knockdown of IGF2BP2 expression reduced the number of cells with vRO.

      Strengths:

      The role of IGF2BP2 as a proviral factor for ZIKV replication is novel. The study follows a logical flow of experiments that altogether support the assembly of a specialized RNP complex containing IGF2BP2 and ZIKV NS5 and RNA genome.

      We thank the reviewer for their positive feedback on our study and its novelty.

      Weaknesses:

      The statistical analysis should clearly indicate the number of biological replicates of experiments to support statistical significance.

      This information has been included in all figure legends.

      The claim that IGF2BP2 knockdown impairs de novo viral organelle biogenesis and viral RNA synthesis is built upon data that show a reduction in RNA synthesis <0.5-fold as assessed using a reporter replicon, thus suggesting a limited impact of the knockdown on RNA replication.

      We agree that a 50% decrease in the replication of our reporter replicon might be considered mild. However, we want to pinpoint that in an infectious set-up, the phenotypes were higher as demonstrated by an 80% decrease in viral particle production even when IGF2BP2 levels were never depleted more that 80% compared to endogenous levels. Moreover, our findings were validated through the analysis of de novo vRO biogenesis by electron microscopy in a replication-independent set-up. Together, these experiments provide compelling evidence for a role for IGF2BP2 in the early stages of viral genome replication.

      Validation of IGF2BP2 partners that are modulated upon ZIKV infection (i.e. virus yield in knocked down cells) can be relevant especially for partners such as Atlastin 2, as the hypothesis of a role for IGF2BP2 RNP in vRO biogenesis is based on the observed increase in the abundance of Atlastin 2 in the RNP complex preciìtated from infected cells.

      First, we would like to emphasize that the proviral role of ATL2 in flavivirus replication, including links to vRO biogenesis, was already reported in two independent studies notably by one of the co-authors (PMID: 31636417; 31534046). Therefore, we have chosen to discuss these previous studies in the manuscript rather than repeating published experiments.  Second, we agree that it would be interesting to further interrogate the role of modulated IGF2BP2 protein partners in ZIKV replication. However, these experiments would constitute a new project per se involving fastidious RNAi-based phenotypic screening and subsequent functional characterization of the identified hits. Therefore, this will be the focus of follow-up studies.  

      Recommendations for the Authors:

      Reviewer #1 (Recommendations For The Authors):

      All IFAs claimed that showing co-localization is minimal, this needs to be addressed.

      We have performed colocalization analyses for relevant images in the revised manuscript (see below and Figs. 4B, 5A, S4A-C and S5A-D. Although this quantification increases confidence in our analysis, we were still cautious in our conclusions, stating that colocalization was partial and that IGF2BP2 accumulates in the replication compartment.

      Western blots and IPs need to be quantified.

      As requested, we have included WB quantification in Figs. 2A, 4A, 4D, 8B-D, S6C and S7D.

      Figure 1: What is the strain background for the ZIKV reporter virus?

      As indicated in the legend of Figure 1E of the primary submission, the Rluc-expressing ZIKV reporter virus (ZIKV-R2A) was based on the FSS13025 isolate (Asian lineage)(PMID: 27198478). To clarify this, we have also indicated the strain background in the main text of the Results and Material & Methods sections.

      Figure 2A: If shGF2BP2 reduces viral titer, the NS3 should show a reduction in 2A, but it doesn't.

      We agree with the reviewer. Although NS3 seems not to be decreased upon IGF2BP2 knockdown in the experiment initially shown in Figure 2A, it should be noted that our homemade rat anti-NS3 antibody is highly sensitive, leading to signal saturation that makes it challenging to distinguish changes in NS3 expression without diluting substantially the lysate sample before the PAGE-SDS. The initial reason for including Fig 2A was not to make a statement about viral protein expression but to validate IGF2BP2 knock-down efficiency. Conclusions about NS3 levels in the initial figure are further complicated by the high MOI of ZIKV was used in Huh7.5 cells which are not quantitative for viral replication measurements. To address this issue, we assessed the impact of IGF2BP2 knockdown on viral protein abundance (as a read-out of overall viral replication) with a lower MOI of ZIKV. The results of the repeat experiment (seen in the new Fig. 2A) show that IGF2BP2 knockdown leads to a decrease in the abundance of NS4A, NS5 and NS3, which is consistent with the titer decrease phenotypes.

      Figure S3: The re-localization claimed is minimal and does not show overlap with NS3. The dsRNA is difficult to see here. Suggest improving the immunofluorescence images and reducing the claim for "strong" co-option of RNP complexes.

      In addition to replication complexes, NS3 labels convoluted membranes which are devoid of dsRNA and IGF2BP2 and surround the cage-like replication compartment as large puncta (PMID: 27545046; 33432690; 28249158). The signal overlap is more obvious between IGF2BP2 and NS3/dsRNA-containing areas, which is reflected by the Mander’s coefficients that have been included in the revised version (Fig. S5C-D). We have also adjusted the text to conclude that the colocalization was partial and that IGF2BP2 accumulated in the replication compartment. We acknowledge that the dsRNA signal is weak, and we have updated the images (and others, when relevant) to better visualize this viral component. Moreover, we have rephrased the sentence to remove the word “strongly”.

      Figure 4A: Western blot needs quantification.

      This is now included in the figure.

      Figure 4B: As in many of the IFAs, the co-localization is only partial. Additionally, the dsRNA is not visible. So the images need to be improved. The colocalization should be quantified across the cell diameter.

      We changed the color and intensity of the dsRNA staining to make it more visible. Mander’s colocalization coefficients have been determined and included in Figures 4B and S5C-D.

      Figure 4C: It is difficult to understand what the +/- is on the blots for the cell extracts and the anti-HA IP samples. It is not described in the figure legend or the text.

      As already indicated on the right of the panel, the +/- indicates whether or not IGF2BP2-HA was overexpressed in the cells. In the revised version, this is clarified in the figure legend.

      Figure 5A: Once again similar to other IFAs, the co-localization is only minimal and thus difficult to claim as "co-localization" is actually happening. It would be good to either improve the images or discuss this observation in the text and reduce the claim of colocalization. Specifically, since the two proteins might be co-localizing in specific regions which would make it a very interesting observation. Also, quantification of co-localizing regions would be beneficial.

      We have included the requested colocalization analysis. We have been cautious to indicate that colocalization was only partial. It is noteworthy that, despite many efforts in the optimization of the cell permeabilization procedure, we noticed that the FISH probes were not very efficient in accessing the perinuclear area of the infected cells, where replication complexes accumulate. In that respect, it is likely that this imaging approach “miss” some of the IGF2BP2/vRNA complexes and that the determined colocalization factor is underestimated. This explains why the confirmation of the vRNA/IGF2BP2 complex with a biochemical approach (Fig. 5B) was very relevant.

      Figure 5D: It is unclear what the blue squares represent. Clearer figure legends and text would be beneficial.

      As stated in the initial figure, the blue squares indicate values obtained with the ZIKV 5’ UTR probe while the green circles involve a 3’ UTR probe. We have further emphasized this information in the figure legend to make it clearer.

      Figure 6B. The graph is missing the data and X-axis label for shIGF2BP2.

      We had initially omitted the values of the conditions with shIGF2BP2 and the replicationdead GAA replicon, since this viral system does not allow accumulation of viral genomes or proteins and was not relevant at the 48h time point. We thought that the inclusion of the shNT/GAA condition was enough an internal negative control of viral replication since values for shIGF2BP2/GAA did not exceed background. Nevertheless, we have now included this condition in the revised figure.

      Figure 7D: It is unclear what the -/+ signs are in the cell extracts and the IP blots. Specifically, since there is an NS5 signal in the (-) lanes.

      As explained above, the +/- indicates whether IGF2BP2-HA was overexpressed. The meaning of these symbols is now further clarified in the figure legend.

      Figure 8C: The circles with the different colors are not clearly described. What does it mean?

      As indicated in the figure (left part), the red and green circles identify the partners of the STRING network whose association with IGF2BP2 is decreased and increased during infection, respectively. We have included this information in the figure legend.

      Figure 9: The electron microscopy to quantify vesicles should be carried out using whole-cell tomography in order to get the most accurate quantification of the vesicles following different treatments. This is because if you only look at one cell profile (slice), the number of vesicles might be less in that profile and more in another below or above it. It is unclear how many cell profiles were used for the quantification and how the calculations were carried out.

      We agree with the reviewer that ideally, one should perform 3D electron tomography to precisely assess the morphology of VPs. Regardless the fact that we do not possess the imaging infrastructure to perform that type of analysis, such an approach would represent a tremendous amount of work if one would like to process at least 200-400 vesicles from > 50 cells and their whole cytoplasm (as we did). Despite not having 3D images, this number of data points is sufficient to see general changes in viral replication vesicle morphology, especially considering that Huh7-Lunet cells are relatively flat cells. (PMID: 32640225; 36700643; 34696522; 31636417). Furthermore, since IGF2BP2 knockdown decreases the abundance of VPs and does not impact their diameter, we believe that the addition of sophisticated 3D analysis would not bring any new and relevant information and that the TEM data stand by themselves for the conclusion we made. A more refined morphological analysis to determine how IGF2BP2 is structurally involved in virus-mediated membrane reorganization could be the focus of a future study.

      We feel that we have already provided sufficient information about the quantification in the Material & Methods section of the first version of the manuscript: “Quantification was performed by systematically surveying cells and evaluating the presence of VPs. Only cells with >2 VPs were considered as positive. For each condition, >50 cells were surveyed over 4 biological replicas. All observed VPs were imaged, and VP diameters were determined using ImageJ by measuring the distance across two axes and averaging”.

      Reviewer #2 (Recommendations For The Authors):

      The inclusion of a control in the knock-down and infection assays with the reporter virus could enhance the validity of the findings. Introducing STAT2 knockdown, a recognized antiviral protein for ZIKV, as a control would provide a valuable benchmark to evaluate the extent of viral enhancement in the experiments. This additional control not only supports the proposed function of LARP1 in virus assembly/release but also strengthens the overall interpretation of the results.

      We agree that adding a positive control could have been relevant for assessing the extent of replication modulation, especially for increases such as that observed with shLARP1. However, finding such control proteins in our system was a challenge. Indeed, STAT2 would not have been a good control for these experiments since we used Huh7.5 cells for the RNAi mini-screening, which do not express a functional RIG-I protein, and generally do not produce type I and III interferons. Thus, STAT2 knockdown is not expected to result in an increase in replication. That said, we feel that it was unnecessary to include a control for replication inhibition here given that only a few statistically reliable candidates we obtained. Instead, we have opted for an extensive secondary validation approach by assessing the proviral role of IGF2BP2 for multiple viruses - DENV1-2-3-4, WNV and SARS-CoV-2, and 3 ZIKV strains in three relevant cell types.

      Additionally, in Figure S4, the authors employ an antibody against NS5 that specifically recognizes ZIKV NS5 but not DENV NS5. Given the objective of highlighting distinctions between these two viruses, it is advisable to use an antibody that detects DENV NS5 as well. This approach would contribute to a more comprehensive comparison, ensuring a balanced representation of both viruses in the experimental analysis.

      We thank the reviewer for this relevant suggestion. We have repeated the coimmunoprecipitation assays using antibodies specific to DENV NS5 (Aithor response image 1). While we specifically pulled down ZIKV NS5 with IGF2BP2-HA as expected, this was not the case for DENV NS5 when using extracts from DENV-infected cells despite our multiple attempts. Indeed, the amount of pulled-down DENV NS5 with IGF2BP2-HA was always comparable to that in the negative control (“empty” pWPI lentivirus-transduced cells, “-“ condition), which corresponds to non-specific binding to the HA-resin. Thus, while the antibody was very efficient at detecting DENV NS5 in the cell extracts, no specific binding between DENV NS5 and IGF2BP2-HA could be evidenced. Consistent with our different replication phenotypes between DENV and ZIKV, this strongly supports that the NS5/IGF2BP2 interaction is specific to ZIKV. The specificity of the IGF2BP2 interaction with ZIKV NS5 compared to DENV NS5 is discussed in the updated manuscript.

      Author response image 1.

      DENV NS5 is not specifically co-immunoprecipitated with IGF2BP2-HA in contrast to ZIKV NS5. Huh7.5 cells stably expressing IGF2BP2-HA (+) and control cells (-) were infected with ZIKV H/PF/2013 at a MOI of 10 or left uninfected. Two days later, cell extracts were prepared and subjected to RNase A treatment (+) or not (-) before anti-HA immunoprecipitations. The resulting complexes were analyzed by western blotting for their abundance in the indicated proteins.

      Reviewer #3 (Recommendations For The Authors):

      (1) Statistical analysis. Please clearly indicate what columns and error bars represent for bar graphs such as those presented in Figures 1A-D and F, Figures 2B-C, and bottom panels in DE, Figure 3, Figure 5B, Figure 6B-C, and Figures 9B-D and F. For instance, the mean of n independent experiments and standard deviation.

      Information about the number of replicates, error bars, and statistical tests has been added for all figures in the legends. 

      (2) What is the scale in the Y-axis of Figure 2C? As shown, it is difficult to know what is the virus titer in knocked-down cells. Please use a linear scale or a log scale.

      This is a linear scale of viral titers, which we have modified to make it clearer for the reader.

      (3) Throughout the manuscript (e.g. Figures 1, 2, and 3) the fold reduction in titer is presented instead of the actual virus titers. I suggest showing the titer as it may be much more informative for the reader.

      We prefer showing the data as fold reduction as they better reflect the IGF2BP2 knockdowninduced phenotypes across the independent biological replicates. Indeed, from one experiment to another, the reference titers in the control condition sometimes varies because of the cell passage or the lentiviral transduction efficiency for instance, especially when low multiplicities of infection are used. However, the reduction phenotype in foldchange observed upon IGF2BP2 knockdown was always consistent regardless of the titer value.  Of note, all considered experiments had reference titers above 105 PFU/mL.

      (4) Is it possible to perform a colocalization analysis of confocal images showing overlapping signals?

      This has been done and the results of these analyses are included in the updated figures 4B, 5A, S4 and S5.

      (5)  Assessing the effect of Atlastin2 knockdown in virus yield and showing coimmunoprecipitation of Atlastin 2 with NS5 can add relevant information.

      As mentioned in the discussion and above, ATL2 was already reported to be required for DENV and ZIKV replication in two independent studies (including one by one of the coauthors)(PMID: 31636417; 31534046). We have not tested whether ATL2 associates with NS5. However, new Fig. S7 of the revised manuscript shows that IGF2BP2/ATL2 is RNAdependent. This suggests that, as initially depicted in our model, IGF2BP2 associates with the ER (and thus, ATL2) after its binding to the viral RNA. Further interrogation into the role of atlastins in the flavivirus replication cycle is the focus of another ongoing IGF2BP2-unrelated study from one of the co-authors which will be reported elsewhere.

    1. Author response:

      The following is the authors’ response to the original reviews.

      eLife assessment

      The manuscript reports useful findings by resolving the crystal structure of Sedoheptulose-1,7-Bisphosphatase (SBPase) from the green algae Chlamydomonas reinhardtii, which is involved in the Calvin cycle. The data presented are solid based on validated methodologies, which help in understanding the structure and function of this enzyme.

      We thank the editors for this positive assessment.

      Public Reviews:

      Reviewer #1 (Public Review):

      In this study, Le Moigne and coworkers shed light on the structural details of the Sedoheptulose-1,7-Bisphosphatase (SBPase) from the green algae Chlamydomonas reinhardtii. The SBPase is part of the Calvin cycle and catalyzes the dephosphorylation of sedoheptulose-1,7-bisphosphate (SBP), which is a crucial step in the regeneration of ribulose-1,5-bisphosphate (RuBP), the substrate for Rubisco. The authors determine the crystal structure of the CrSBPase in an oxidized state. Based on this structure, potential active site residues and sites of post-translational modifications are identified. Furthermore, the authors determine the CrSBPase structure in a reduced state revealing the disruption of a disulfide bond in close proximity to the dimer interface. The authors then use molecular dynamics (MD) to gain insights into the redox-controlled dynamics of the CrSBPase and investigate the oligomerization of the protein using small-angle X-ray scattering (SAXS) and size-exclusion chromatography. Despite the difference in oligomerization, disruption of this disulfide bond did not impact the activity of CrSBPase, suggesting additional thiol-dependent regulatory mechanisms modulating the activity of the CrSBPase.

      We thank reviewer 1 for his/her careful reading of our manuscript.

      The authors provide interesting new findings on a redox-mechanism that modulates the oligomeric behavior of the SBPase, however without investigating this potential mechanism in more detail. The conclusions of this manuscript are mostly supported by the data, but they should be more carefully evaluated in respect to what is known from other systems as e.g. the moss Physcomitrella patens. This is especially of interest, as SBPase was previously reported to be dimeric, whereas for FBPase a dimer/tetramer equilibrium has been observed.

      We thank reviewer 1 for his/her comments on the novel or confirmatory character of our structure-function analysis onCrSBPase. We address the questions of oligomeric states later in this response.

      (1) Given that PpSBPase has been already characterized in detail, the authors should provide a more rigorous comparison to the existing data on SBPases. This includes a more conclusive structural comparison but also the enzymatic assays should be compared to the findings from P. patens. Do the authors observe differences between the moss and the chlorophyte systems, maybe even in regard to the oligomerization of the SBPase?

      Indeed, a previous study conducted by one of the authors of the current manuscript (Stéphane D. Lemaire) and collaborators determined the structure and regulatory properties of SBPase from the moss Physcomitrella patens (Gütle et al. 2018 https://doi.org/10.1073/pnas.1606241113). We added a clearer reference to this earlier work. The differences that we observed regarding the oligomeric states of SBPase from Chlamydomonas reinhardtii principally stem from our analytical method in vitro through size-exclusion chromatography, in comparison with crystal packing analysis in the reference study. We detailed PpSBPase/CrSBPase oligoimeric state comparison in the paragraph 'Oligomeric states of CrSBPase'. Besides, the asymmetric unit of our CrSBPase crystal structure is also a homodimer, similarly to PpSBPase, and we suggest that PpSBPase is also likely to adopt several oligomeric states in vitro. If this were confirmed by experiments, SBPase in several organisms would behave analogously to FBPase regarding the dimer/tetramer equilibrium.

      In paragraph 'Crystal structure of CrSBPase' we added a comparison by alignment of our CrSBPase crystal structure to the previously reported _Pp_SBPase crystal structure, stating that with RMSD=0.478 Å the proteins are essentially identical.

      In paragraph 'CrSBPase enzymatic activity' we compared the value we obtained for enzyme specific activity to those previously published on other SBPase from Chlamydomonas or the land plant Spinacia oleracea, highlighting the similarity of results in three different systems and teams (Seuter et al. 2002 https://doi.org/10.1023/A:1019297521424 and Tamoi et al. 2005 DOI: 10.1271/bbb.69.848).

      (2) The authors should include the control experiments (untreated SBPase) and the assays performed with mutant versions of the SBPase, which are currently only mentioned in the text or not shown at all.

      We add supplementary figure 14 in order to illustrate that since SBPase C115S or C120S mutants are still activated by reducing agent, the disulfide bridge between cysteines 115 and 120 is not the single control over SBPase activity but rather a control over the oligomeric exchange of the enzyme indirectly contributing to redox activation of the active site.

      (3) The representation of the structure in figures (especially Figures 1 and 3) should be adjusted to match the author's statements. In Figure 1, the angle from which the structure is displayed changes over the entire figure making it difficult to follow especially as a non-structural biologist. Furthermore, important aspects of the structure mentioned in the text are not labeled and should be highlighted, by e.g. a close-up. Same holds true for Figure 3 that currently mostly shows redundant information.

      We thank reviewer 1 for his/her advise on how to improve Figure 1. We drew new images for the complete figure, hopefully providing more consistent and clearer visual support to our text. For simplicity, protein is now always represented centered around its active site in the same orientation. We represent co-crystallized water in all projections as a guide to the eye.

      Figure 3 and supplementary figure 3 were switched in order to better represent the experimental evidence provided by the resolution of SBPase structure under reducing conditions, i.e., the increase in local disorder around C115-C120 pair of cysteines in the 113-130 stretch forming a redox-conditionally dynamic loop and β-hairpin motif.

      (4) The authors state that mutation of C115 and C120 to serine destabilize the dimer formation, while more tetramer and monomer is formed. As the tetramer is essentially a dimer of dimers, the authors should elaborate how this might work mechanistically. In my opinion, dimer formation is a prerequisite for tetramer formation and the two mutations rather stabilize the tetramer instead of destabilizing the dimer.

      Time-dependent dynamic character of SBPase oligomer exchange is not resolved by the current study because we essentially combined size-exclusion chromatography (SEC) and X-ray crystallography to define quaternary structures at equilibrium. Overall, homodimer is the dominant state of wild-type SBPase by abundance in the purified recombinant form and by forming the constitutive asymmetric unit in all crystal packings. Dimer is indeed present in the tetramer state, a dimer of dimers, as pertinently stated by reviewer 1.

      This being recognized, we tried to explain the systematic co-elution of the principal dimeric form with an additional species of smaller size on SEC (supplementary figure 1, right-side shoulder of the peak), at the apparent mass of a monomer. When solving the crystal structures of SBPase we realized that the dimer interface is contributed by residues 113-130 forming a loop and β-hairpin motif. Notably, in this loop cysteine 115 (C115) maps at bonding distance of 3.9 Å of side chain of arginine 220 (R220) from dimer partner subunit. In loop 113-120, cysteine pair C115 and C120 are subject to redox switching between disulfide (closed) and dithiol (open) conformations, as shown in our structures 7B2O and 7ZUV, respectively. Given that the reduction of C115-C120 disulfide bridge correlates with a higher flexibility of this motif that contributes to dimer interface (figure S3), we hypothesized that reduction of SBPase would destabilize dimer state to the benefit of transitory monomer state, and indeed point mutagenesis of C115S or C120S caused a large modification of oligomer equilibrium in favour of the monomer (figure S1C).

      Mechanistically, we suggest two scenarios for the tetramer formation: either monomers first interact as in the crystallographic dimer before pairing such dimers into tetramers (as proposed by reviewer 1), or monomers start tetramerization by favoring the alternative subunit interface (figure 5B, between cyan and magenta chains) before stabilizing the crystallographic homodimer interface. In this latter case, monomerization would be necessary to efficiently re-arrange SBPase dimers into tetramers.

      In physiological conditions the re-arrangement switch would be controlled by C115-C120 reduction through ferredoxin-thioredoxin redox cascade. Structural studies in dynamic conditions like native mass spectroscopy/photometry would be necessary to solve this speculation unambiguously although at this stage of our investigation there seem little doubt to us that C115-C120 disulfide-dithiol exchange is essential to control a dimer/monomer balance in first instance.

      Reviewer #2 (Public Review):

      The central theme of the manuscript is to report on the structure of SBPase - an enzyme central to the photosynthetic Calvin-Benson-Bassham cycle. The authors claim that the structure is first of its kind from a chlorophyte Chlamydomonas reinhardtii, a model unicellular green microalga. The authors use a number of methods like protein expression, purification, enzymatic assays, SAXS, molecular dynamics simulations and xray crystallography to resolve a 3.09 A crystal structure of the oxidized and partially reduced state. The results are supported by the claims made in the manuscript. One of the main weakness of the work is the lack of wider discussion presented in the manuscript. While the structure is the first from a chlorophyte, it is not unique. Several structures of SBPase are available. As the manuscript currently reads, the wider context of SBPase structures available and comparisons between them is missing from the manuscript. Another important point is that the reported structure of crSBPase is 0.453A away from the alphafold model. Though fleetingly mentioned in the methods section, it should be discussed to place it in the wider context.

      We thank reviewer 2 for his/her assessment of our manuscript. In response to his/her suggestion to better compare our SBPase structure from the model microalga Chlamydomonas reinhardtii to that of the ortholog from Physcomitrium patens previously reported by an author of this manuscript (Stéphane D. Lemaire) and collaborators (Gütle et al. 2018), we wish to point out that paragraph 3 of the introduction was dedicated to this reference along with a mention to related Thermosynechococcus elongatus dual function fructose-1,6-bisphosphatase sedoheptulose-1,7-bisphosphatase (F/SBPase). We nevertheless follow his/her suggestion to better detail comparison between chloroplastic SBPase structures in the first result section 'Crystal structure of CrSBPase', consistently with response 1 to reviewer 1 (see above).

      Regarding the integration of AlphaFold (AF) computational models in a general discussion about SBPase molecular structure, we wish to point out that our initial 7B2O crystallographic model of CrSBPase was deposited in PDB on 2020-11-27 before AlphaFold2 was available for the scientific community (Jumper et al. publication date is 15 July 2021).

      AF2 entry AF-P46284-F1-model_v4 from AlphaFold Protein Structure Database aligns with our crystal structure 7B2O chain E with RMSD = 0.434 Å, showing excellent agreement between experiment and prediction at the level of protein main chain. It must still be pointed out that it is the AF2 model which is at 0.434 Å away from the experiment, and not the opposite. Exceptions of alignments are in local differences in several loops conformations and in the length of secondary structure elements. Many amino acid residues side chains adopt distinct orientations between the computational model and the experimental structure.

      AF3 was recently communicated (Abramson et al. 2024) along with its online prediction server hosted at https://golgi.sandbox.google.com. CrSBPase model from AF3 align to our crystal structure 7B2O chain A with RMSD = 0.489 Å showing again their strong similarity and with a smaller discrepancy between AF2 and AF3 of RMSD = 0.216 Å. The only significant deviations between 7B2O and AF3 are in the orientation of several side chains and notably on the conformation of region 114-131 that contain the redox sensor motif.

      We added the last two paragraphs to the revised version of the manuscript, after the results section presenting our crystallographic work.

      Recommendations for the authors:

      We made all recommended modifications as detail below.

      Reviewer #1 (Recommendations For The Authors):

      I have outlined a number of minor points below.

      We addressed all minor points listed.

      Line 220: The asymmetric unit only contains three dimers. The dimer of dimer or tetramer can only be reconstituted by displaying the symmetry mates.

      We corrected our sentence for 'The asymmetric unit is composed of six polypeptide chains packing as three dimers'.

      I also suggest that the authors separate the description of the asymmetric unit content from the modeled water molecules and rephrase e.g. „..and four water molecules could be modeled."

      We rephrased as suggested.

      I appreciate that the authors uploaded the structure in advance of this article, which allowed to evaluate the quality of the structure. Although this does not add valuable information, I have identified several unmodeled blobs, which possibly also account for waters.

      Unmodeled blobs were tentatively assigned to water but had to be removed during later refinements. We used Coot Validate tools 'Unmodelled blobs' and 'Check/Delete water' to progress towards the current optimal refinement statistics. We admit that the resolution of the crystallographic dataset (3.09 Å) is limiting to reliably model mobile or less resolved elements like water molecules. Overall, we estimate that the functional elements of the structure are modeled to the best of our knowledge and with minimal subjectivity.

      Line 222: Please write 309 instead of spelling the number.

      We corrected for 309 instead of spelling the number.

      Line 223: The structure representation in Figure 1A/B has to be improved. The authors might consider labeling the two domains & color them in two colors instead of the rainbow color coding. Furthermore, the 90{degree sign} rotation does not add much information. Here, turning the model in a different direction that allows to see the central b-sheet of domain 2 might be better suited. Furthermore, instead of describing b-strands first, followed by a-helices, I suggest describing which secondary structure elements form the two domains.

      We improved Figure 1A as suggested while keeping Figure 2B with 90° rotation as rainbow color gradient in order to display with clarity the secondary structure content and connectivity. The orientation was tilted to better display the central β-sheet. This new version of Figure 1A/B should facilitate the text description of SBPase architecture that we amended as suggested.

      Line 229: The information on A113-120 should be depicted in a closeup in Figure 1A.

      We made a close-up view of sequence 113-120 as added figures 1C-D and modified the rest of the figure and legend accordingly.

      Line 234: Please provide an r.m.s.d here.

      We now provide r.m.s.d. for all structural alignments.

      Line 242: Please introduce the domain labeling in Fig 1C to make it easier to track the exact region within SBP here. Is the residue numbering according to SBP or the human FBP?

      Modified version of figure 1 now shows SBPase in the same orientation for panels A, E, F, G, H for simplicity. Domains labeling is indicated in panel A with NTD/CTD distinct colors as suggested. We explicited the position of W401 on all panels as a guide to the eye. We indicated in figure legend that residue numbering is according to Chlamydomonas SBPase Uniprot entry P46284.

      Line 244: Is Figure 1D in the same orientation as C? I suggest making the surface transparent and showing the cartoon below, which will allow to easier see the solvent accessibility of the residues. Also, clearly label W401 (although it's the only water shown/modeled in this region).

      We modified figure 1 to show all equivalent panels (ie. A-E-F-G-H) with the same orientation. In this new form we think that solvent accessibility and the relative position of significant residues is easier to interpret for the reader. W401 is consistently labeled throughout figure 1 panels.

      Line 263: Please provide a close-up of the C222 and C231 including measured distance. It's clearly not visible from this view. It might even be helpful to provide close-ups of all cysteine residues that are mentioned in the text.

      In the modified version of figure 1 we estimate that C222 and C231 are more easily visible. We added a close-up view of C22-C231 environment in a new supplementary figure 2. Since we do not explore further the functional relevance of this redox pair we chose not include C222-C231 close-up view in main figure 1. We added legends and modified supplementary figures numbering accordingly.

      Line 276: As already mentioned earlier, none of the panels in Figure 1 provide a close-up of this loop. This should be added.

      This loop is now displayed as a close-up view in panels C and D of main figure 1.

      Line 284: It is difficult to follow the relative positions of the potential modification sites if the model is always depicted from a different angle in Figure 1. The authors might want to change this across Figure 1 or show the rotation angle.

      This problem was addressed in the revised figure 1, panels A-E-F-G-H are in the same orientation now. Panel B was kept at a rotation of 90° with corresponding annotation.

      Line 290: Please label W401. Also stick to one nomenclature (W or H20).

      We labeled W401 and kept nomenclature consistent throughout the manuscript.

      For comparative reasons, a full kinetic measurement (determination of Km and kcat) of the SBPase would also be helpful here.

      We resolved to avoid a full kinetic measurement of CrSBPase because we could neither identify a reliable chemical provider nor synthesize ourselves the physiological substrate sedoheptulose-1,7-bisphosphate (SBP) and only characterized the reaction with fructose-1,6-bisphosphate. However, in the revised form of the manuscript we added in main text paragraph 'CrSBPase enzymatic activity' the kinetic constants from the previous reference study conducted on spinach SBPase (Cadet and Meunier, Biochem. J. 1988) with KMSBP\=0.05 mM and kcatSBP\=81 sec-1 of fully active enzyme with SBP as a substrate. For comparison, the authors of this study report that activity of SBPase on FBP is in the same range but lower, with KMFBP\=0.38 mM and kcatFBP\=21 sec-1. We also added a comparison of specific activities of our CrSBPase and spinach SBPase in the main text, showing that our enzyme behaves as previously reported ortholog from land plant.

      Line 303: How much MgSO4 was used for the experiment shown in Figure 2A?

      10 mM of MgS04 was used for experiment shown in Figure 2A. We added this information in the figure legend. We also added in the legend that 10 mM DTT is present in the experiment of Figure 2B and that 10 mM of MgSO4 and 1 mM of DTT are present in the experiment of Figure 2C.

      Line 321: In my opinion it is not necessary to show the regions of all molecules here. I was rather expecting a superposition of the two structures (oxidized and reduced) with a close-up of the respective disulfide in the two states.

      We agree that the initial version of Figure 3 panels showing side-by-side all conformational variants of the redox motif appear redundant. We switched initial Figure 3 to supplementary data and replaced it with the crystallographic b-factor mapping of the redox motif, in the variable conditions resolved by the crystals. We would like to stress that all these conformations were experimentally determined through X-ray crystallography, whether of the crystal of pure inactive enzyme that proved to be oxidized on the redox motif, or of the equivalent crystals submitted to activating treatment by the chemical reductant TCEP. As an attempt to clarification we added visual boxes to better appreciate this reduction-induced conformational plasticity that we interpreted as a local conditional disorder.

      Line 331: Could the authors provide movies of the MD simulation? Otherwise, interpretation of the MD simulation results might be difficult for non-experts.

      We added two movies of 20-µsec MD simulations as supplementary data to help non-expert readers.

      Line 343: It might be helpful to label the structure elements in Figure 4 accordingly (e.g. residues, etc.)

      We added secondary structure labeling in Figure 4.

      Line 381: Should be changed to Figure 5A.

      We changed reference to figure 6 that is a renumbering of figure 5 with changes included from suggestions below. Figure 6 now includes chromatograms of recombinant SBPase in panel A and chromatogram and western blot analysis of Chlamydomonas extracts in panel B.

      Line 383: See above, figure 5B. Which structure is shown in the figure? 7zuv or 7b2o? Maybe include both structures in the figure in a side-by-side view. The authors might also want to include the SEC chromatograms in the main figure. Especially the purification from Chlamydomonas is helpful to estimate whether post-translational modifications have an impact on the oligomerization. This should also be mentioned in the text.

      7b2o and 7zuv are illustrated side-by-side in panels A and B of figure 5. This was indicated in the figure legend, we now added the information on the figure. As suggested above we included chromatograms initially presented as supplementary material in a new main figure 6, panel A for recombinant proteins and panel B for proteins extracted from Chlamydomonas. Initial figures 5D-E, showing surface conservation of the dimeric SBPase, is moved to supplementary figure 5.

      Line 385: I don't find the cultivation of Chlamydomonas in the method section. It should be added.

      We added a methods paragraph dedicated to « Cultivation of Chlamydomonas for native SBPase analysis ».

      Line 390-392: This information is not really helpful. Concentrated purified proteins might precipitate after a week storage without physiologically relevant effects being the reason.

      We agree that the observation of a precipitate building up in vitro after a week of storage bears no particular physiological implications. We rather intended to report that an aggregated form of purified protein can be turned to droplets under the redox conditions that activate the enzyme. We reformulated these lines for clarification.

      Line 397: I would appreciate having the SEC-chromatograms of the mutants also in the main figure.

      Size-exclusion chromatograms that were initially in supplementary figures are now shown in main text figure 6 panel A, with the profiles WT and mutants aligned.

      Line 402: Where are these data shown? They should be included in Figure 5.

      We added a figure to present these data, not shown in the initial version of the manuscript. We preferred to place it as supplementary material because C115S and C120S mutant catalytic activity is essentially the same as WT and do not reveal a direct mechanistic effect of C115-C120 reduction over the catalytic pocket.

      Line 427: Did the authors look into a possible cooperativity of their SBPase?

      We did not observe direct positive cooperativity that could be ascribed to allostery in our enzymatic assays. It was previously reported for spinach SBPase that SBP saturation functions were hyperbolic with no evidence of homotropic interactions in the enzyme oligomer (Cadet and Meunier Biochem J. 1988 253, 249-254). The authors of this kinetic study however present a clear sigmoid response of SBPase to Mg2+ concentration, suggestive of an activating cross-talk between active sites in the oligomer. We consider this hypothesis of interest and wish we could further investigate allosteric conformational changes when SBP physiological substrate would be available.

      Line 428-434: I don't really understand how the proteome mapping fits in here. Do the authors speculate that SBPase is recruited by some of the identified enzymes or directly interacts with them or that rather the spatial distribution optimizes the reaction kinetics?

      We indeed want to correlate our in vitro observations of CrSBPase conditions of activity to those recently published by the group of Dr. Martin Jonikas in a physiological, in vivo setup of Chlamydomonas reinhardtii (Wang, Patena et al. Cell 2023 186, 3499–3518). We have no experimental evidence demonstrating the first suggestion that SBPase is recruited or directly interacts with partner enzymes but we privilege the second suggestion that local spatial distribution in the chloroplast stroma optimizes enzyme reaction kinetic thanks to Calvin-Benson-Bassham enzymes proximity. We rephrased these lines to clarify our hypothesis and express its speculative character.

      Reviewer #2 (Recommendations For The Authors):

      To make the manuscript stronger, the authors are recommended to do the following:

      We followed given recommendations.

      (1) include a wider discussion on the other SBPase structures that are available. A detailed comparison should be made between the oxidized and reduced structures present in the PDB with the structures that are being reported in the manuscript.

      Consistently with reviewer #1 suggestion, and as detailed in response to public review above, we followed the recommendation to better report previous structural studies of SBPase in the results section. We also added comparisons with computational models from AlphaFold2 and AlphaFold3.

      (2) The authors mention co-operativity between the subunits. With excellent sampling from molecular dynamics simulations, the authors should demonstrate co-operativity between the subunits.

      Our molecular dynamic (MD) simulations span 20 µsec of SBPase in the dimeric state, starting from the experimental structures determined by XRC. In the considered time window, the only significant events that we observed are the local reorganization of the LBH motif that is a prerequisite for dimer rearrangement. We infer that local disorder contributes a separation of the pair of subunits in order to later allow for the building of the active homotetramer, at longer time scales that are outside the capacities used in this work. Moreover, demonstrating cooperativity with MD simulations would require more than a single event to ensure that results are significant, and performing series of 20µs-MD of SBPase is also outside the available capacities.

    1. Author response:

      The following is the authors’ response to the original reviews.

      eLife assessment

      This study provides a useful strategy for treating mouse cutaneous squamous cell carcinoma (mCSCC) with serum derived from mCSCC-exposed mice. The exploration of serum-derived antibodies as a potential therapy for curing cancer is particularly promising but the study provides inadequate evidence for specific effects of mCSCC-binding serum antibodies. This study will be of interest to scientists seeking a novel immunotherapic strategy in cancer therapy.

      Joint Public Review:

      Summary:

      This study presents an immunotherapeutic strategy for treating mouse cutaneous squamous cell carcinoma (mCSCC) using serum from mice inoculated with mCSCC. The author hypothesizes that antibodies in the generated serum could aid the immune system in tumor volume reduction. The study results showed a reduction in tumor volume and altered expression of several cancer markers (p53, Bcl-xL, NF-κB, Bax) suggesting the potential effectiveness of this approach.

      Strengths:

      The approach shows potential effect on preventing tumor progression, from both the tumor size and the cancer biomarker expression levels bringing attention to the potential role of antibodies and B cell responses in cancer therapy.

      We greatly appreciate your positive feedback on our study.

      Weaknesses:

      These are some of the specific things that the author could consider to strengthen the evidence supporting the claims in their study.

      (1) The study fails to provide evidence of the specific effect of mCSCC-antibodies on mCSCC. The study utilized serum which also contains many immune response factors like cytokines that could contribute to tumor reduction. There is no information on serum centrifugation conditions, which makes it unclear whether immune components like antigen-specific T cells, activated NK cells, or other immune cells were removed from the serum. The study does not provide evidence of neutralizing antibodies through isolation, analysis of B cell responses, or efficacy testing against specific cancer epitopes. To affirm the specific antibodies' role in the observed immune response, isolating antibodies rather than employing whole serum could provide more conclusive evidence. Purifying the serum to isolate mCSCC-binding antibodies, such as through protein A purification, and ELISA would have been more useful to quantify the immune response. It would be interesting to investigate the types of epitopes targeted following direct tumor cell injection. A more thorough characterization of the antibodies, including B cell isolation and/or hybridoma techniques, would strengthen the claim.

      I am deeply appreciative of the reviewer's highly professional comments. Tumor development involves the coexistence of cancer cells at different developmental stages, each harboring a variety of known and unknown mutated proteins. These mutated proteins expose multiple known and unknown epitopes, each capable of stimulating the production of corresponding antibodies in healthy mice. Identifying all these antibodies presents a significant challenge. Current research methodologies, such as ELISA, WB, and ChIP, can only identify known antibodies based on existing antigens. A prerequisite for using these techniques is that both antigens and antibodies are identified. At present, there is no technology available to identify antibodies produced by an unknown mutated protein and epitope. However, I find the reviewer's comments insightful. Perhaps we can initially identify some known mCSCC-antibodies on mCSCC. However, studying the specific effect of these known mCSCC-antibodies on mCSCC is uncertain because we believe that tumor shrinkage results from the combined action of both known and unknown antibodies.

      We concur with the reviewer's observations regarding the use of serum, which is rich in immune response factors such as cytokines that could potentially contribute to tumor reduction. In our future research, we plan to systematically analyze the individual roles of these antibodies and cytokines in tumor reduction. In 1973, Nature published a report indicating that serum demonstrated promising results in tumor treatment (Immunotherapy of Cancer with Antibody in Rats. Nature 243, 492 (1973). https://doi.org/10.1038/243492b0). Since then, there have been scarcely any reports on serum therapy for tumors. The primary focus of our study is to evaluate the efficacy of serum therapy in treating tumors. We hypothesize that antibodies and cytokines form a complex interactive network, working in synergy to reduce tumors. Consequently, we believe that studying these antibodies and cytokines in isolation may not yield effective results.

      In this study, the methodology section outlines the process of serum preparation. It is important to note that serum is devoid of blood cells. I hypothesized that whole blood might have superior therapeutic effects compared to serum. This is because antibodies could potentially synergize with immune cells (including T cells, B cells, and NK cells), thereby enhancing the effectiveness of the treatment. As previously discussed, these antibodies, cytokines, and immune cells form a complex interactive network aimed at tumor reduction. Consequently, there are numerous factors that could influence the experimental outcomes, which presents a challenge for analyzing the results. Furthermore, the implementation of whole blood transfusion therapy introduces additional considerations, such as potential side effects and reactions associated with blood transfusions.

      We thank the reviewers for their suggestion to purify the serum in order to isolate mCSCC-binding antibodies. As we previously mentioned, separating a large number of both known and unknown serum antibodies presents a significant technical challenge. We are eager to discuss and consider suggestions from the reviewers regarding methods to identify a large variety and number of unknown antibodies on cells. Perhaps, as the reviewer suggested, we could begin with known antibodies and employ Protein A purification technology to purify these antibodies and subsequently detect immune responses. We could also categorize the types of epitopes targeted, direct tumor cell injection, to study the epitopes of these types in further studies. The suggestion to study the response of B cells is valuable, and we plan to conduct comprehensive research on the response and status of B cells in our future studies.  

      The purification of antibodies to enhance the specificity of their effectiveness against tumors is a critical aspect of our study. However, we would like to address some concerns raised. (1) The separation of all antibodies and cytokines presents a significant technical challenge. Particularly, there is a risk of overlooking antibodies that are present in low concentrations but play crucial roles. (2) What concerns us is that studying the composition separately would lose the overall effectiveness of the study. Our primary concern is that studying these components in isolation could compromise the holistic understanding of the study. This is akin to current research on traditional medicine, where the separation and individual study of compounds often result in a loss of overall therapeutic efficacy. For instance, consider a scenario where 100 antibodies collectively work to shrink a tumor. These antibodies interact with 20 cytokines, forming a complex network that enhances the cytokines' activity against tumor cells. Furthermore, many important antibodies and cytokines are currently unknown. Studying these antibodies in isolation could potentially result in the loss of this therapeutic effect. Therefore, in the discussion section, we have emphasized that our study considers a tumor mass, including tumor cells at various stages of development, as a single entity. As a practicing clinician, my primary focus is on the therapeutic outcomes in tumor treatments, despite the mechanisms of serum therapy remaining largely elusive, liking a black box.

      (2) In the study design, the control group does not account for the potential immunostimulatory effects of serum injection itself. A better control would be tumor-bearing mice receiving serum from healthy non-mCSCC-exposed mice. Additionally, employing a completely random process for allocating the treatment groups would be preferable. Also, the study does not explain why intravenous injection of tumor cells would produce superior antibodies compared to those naturally generated in mCSCC-bearing mice.

      I concur with the reviewer's perspective that using serum from healthy, non-mCSCC exposed mice as a control could potentially improve our study. Initially, our primary concern was to minimize harm to the mice and avoid excessive blood reactions, which led us to exclude the use of serum from healthy, non-mCSCC exposed mice in our control group. The main objective of our study was to investigate tumor shrinkage through serum treatment, specifically serum-derived antibodies. We anticipated that tumor-bearing mice receiving serum from healthy, non-mCSCC exposed mice would exhibit a response to the injected serum, which would manifest as a blood reaction. However, we did not expect this to result in a tumor treatment effect. If it turns out that normal serum (from healthy, non-mCSCC-exposed mice) possesses tumor-reducing properties, it would indeed be a novel discovery. We appreciate the reviewer's insightful suggestion and will consider incorporating it into our future research.

      We concur with the reviewer's observations that the use of a completely random process for assigning treatment groups would be more desirable. Indeed, the complete randomization of the entire process further underscores the efficacy and universality of serum therapy. In this study, we utilized paired mice to mitigate the risk of cross-infection and adverse reactions associated with blood transfusions. We deeply value the reviewer's expert feedback.  

      Lastly, the reason why tumor cells, when intravenously injected, produce antibodies superior to those naturally generated in mCSCC-bearing mice, is due to the following reasons. As tumor cells grow, they produce a variety of mutated proteins to adapt to the immune microenvironment and evade the immune system of mCSCC-bearing mice. However, these tumor cells with mutated proteins are exceptionally sensitive and recognizable to healthy mice. This recognition triggers an immune response in healthy mice, leading to the production of specific therapeutic antibodies. This simultaneous production of diverse and abundant antibodies is only achievable by living organisms.

      (3) In Figure 2B, it would be more helpful if the author could provide raw data/figures of the tumor than just the bar graph. Similarly in Figure 3, the author should show individual data points in addition to the error bar to visualize the actual distribution.

      Raw data (numerical values) have been incorporated into Figures 2B and 3, but the data is placed in the table below the graph. If placed above the error bar, it requires a small font and may not be clear.

      (4) The author mentioned that different stages of tumor cells have different surface biomarkers. Therefore, experimenting with injecting tumor cells at various stages could reveal the most immunogenic stage. Such an approach would allow for a comparative analysis of immune responses elicited by tumor cells at different stages of development.

      Yes, throughout the course of tumor development, tumor cells at various stages will exhibit distinct markers or possess different mutated proteins. The concept of segregating tumor cells from different stages and independently comparing their immune responses is indeed commendable. Future research could involve isolating cells that express identical biomarkers at each stage for a comparative analysis of the immune responses triggered by the tumor cells. However, this approach diverges from the original intent of this study.

      Most tumor cells exist within the same developmental stage. However, this does not imply that all tumor cells within the tumor mass are at the same stage. For instance, a stage III liver cancer tumor may contain both stage I and stage IV tumor cells. Moreover, due to the complexity of tumor development, not all tumor cell surface markers are identical, even for tumors at the same stage. For instance, 20 major proteins and 100 minor proteins are implicated in tumor formation. In fact, random mutations in just 5 of these major proteins and 10 minor proteins can instigate the development of tumors. This implies that the protein pattern (tumor cell surface markers) associated with each individual's tumor is unique. While studying tumor cells at different stages separately allows for the observation of the immune response of tumor cells at each stage, it lacks a comprehensive research and treatment effect. For this reason, the design of this study treats a tumor mass as a whole, encompassing both the primary stage tumor cells and those not in that stage. These tumor cells are then injected to produce corresponding therapeutic antibodies. Furthermore, if tumor cells from only one stage are isolated and specific antibodies are produced against these cells, it could lead to immune escape of tumor cells at other stages, preventing the tumor from shrinking. Therefore, our approach aims to address this issue by considering the tumor mass as a whole.

      (5) In the abstract the author mentioned that using mCSCC is a proof-of-concept for this potential cancer treatment strategy. The discussion session should extend to how this strategy might apply to other cancer types beyond carcinoma.

      We have incorporated an additional paragraph in the discussion section where we delve into the concepts and experimental principles underpinning this study. This, we believe, addresses the reviewer's query regarding the applicability of our study's methodology to other types of tumors. The process for other tumors also involves isolating cells from the tumor, stimulating therapeutic antibody production in healthy mice using these cells, and ultimately reintroducing these antibodies into mice with tumors to facilitate tumor elimination

      Recommendations For The Authors:

      The author is encouraged to refine the study's design in future studies considering the weaknesses highlighted above, summarize the results more effectively, and seek opportunities to expand on this promising idea and enhance the research's impact and applicability.

      We greatly appreciate the valuable suggestions provided by the editor and reviewers. These insights will certainly be addressed in our future research endeavors.

      Suggestions for title modification:

      Following the scope of the study, the term 'specific homologous neutralizing-antibodies' may be misleading as neutralizing antibodies typically refer to antibodies preventing viral cell entry. In cancer therapy, 'neutralization' is not a relevant concept, as cancer cells do not infect host cells. Using whole tumor cells as immunogens diverges from the specificity of traditional vaccination approaches that utilize well-defined proteins or antigens. Furthermore, the term "homologous" suggests a precision in targeting that is not demonstrated by reintroducing serum without isolating its specific components. Therapeutic effects should not be attributed to "neutralizing antibodies" without isolating or characterizing the antibody response or verifying their efficacy against specific cancer epitopes. Additionally, it is suggested that you indicate the biological system that your study utilised in the title. More so, this approach is not entirely novel, as seen with the use of adjuvants in some flu vaccines, or in Moderna's cancer vaccine mRNA-4157, which encodes up to 34 patient-specific tumor neoantigens. You can consider the title below or a variant of the same.

      Suggested title: Generating serum-based antibodies from tumor-exposed mice: a potential strategy in cutaneous squamous cell carcinoma treatment

      I concur with your suggestion and have modified the title to " Generating serum-based antibodies from tumor-exposed mice: a new potential strategy for cutaneous squamous cell carcinoma treatment ". I believe this research remains some new, hence the addition of the word "new". Furthermore, the term "novel" in the paper has been either removed or substituted.

      Moreover, I propose that this study shares similarities with Moderna's cancer vaccine mRNA-415, albeit with certain differences. Moderna's cancer vaccine mRNA-415 encodes 34 recognized neoantigens to stimulate an immune response by eliciting specific T cell responses. This is similar to the strategy of some companies developing a protein set for diagnosing lung cancer, liver cancer, among others. Without a doubt, these methods have improved the effectiveness of tumor diagnosis and treatment. However, I think that these methods currently face challenges in completely eradicating tumors because they perceive tumors as a static process and cells that express certain mutated proteins in a fixed manner. I believe that small molecule antibodies, cytokines, and immune cells present in serum that are difficult to detect, have low concentrations, or are unknown are essential for maintaining the expression of important mutant proteins and the escape of tumor cells. This is also the primary reason why tumors are difficult to treat and prone to recurrence at present.

      From my perspective, different tumors, as well as different stages of the same tumor, express varying mutated proteins or surface markers. Targeting some may result in others escaping or even creating a more conducive growth environment for those that do escape. Our study adopts a comprehensive view of a tumor block, encompassing tumor cells at different stages and tumor cells at the same stage but expressing different biomarkers. This approach generates a multitude of known and unknown antibodies that work in concert with cytokines and immune cells. While our method may not be capable of generating all mutated proteins and epitope antibodies due to the weakness of some antigens (epitopes of mutated proteins), it can still be effective. As long as the number of tumor cells is reduced below a certain threshold following multiple rounds of treatment with various antibodies produced at different stages, these cancer cells can be eradicated by the body's immune system. This is a process that is real-time and dynamic. Undoubtedly, if it becomes evident that alterations in a set of proteins can bolster the immune system and eradicate tumor cells, then the implications are significant. The immunotherapy proteins, which have demonstrated positive therapeutic effects, developed by certain companies are also predicated on this very principle.

      Finally, I greatly appreciate your suggestions, which will be considered and gradually addressed in future research.

    1. Author response:

      The following is the authors’ response to the original reviews.

      Reviewer#1:

      Comment #1: It is unclear how the fraction of NK cell populations is quantified in the spatial-seq datasets. Figures display spatial data with expression scores, but the method for calculating the score and determining NK cell presence in tumor tissue is ambiguous. Clarification is needed on whether the identification relied solely on visual inspection or if quantitative analyses using other criteria were conducted.

      Thank you for your questions. We removed the background and made the accordingly modifications according to your demand. We used the AddModuleScore function in Seurat to quantify the main immune subpopulations in spatial-seq using the gene sets identified in single-cell-seq. Additionally, the tumor and non-tumor region was identified by immunohistochemistry as well as cell clusters in spatial-seq, it is rough that we can't quantify the NK cell presence in each region precisely. The consolation is that the differences of NK cell presence in tumor and non-tumor region is observable by visual inspection. The methodology has been supplemented in the revised manuscript (line 190-193).

      Comment #2: The authors do not provide a clear definition of "resting" NK cells. It remains unclear whether they refer to a senescent state or a non-matured NK cell population. Furthermore, the criteria used to define resting and activated cells based on the expression of KIR2DL4, GPR183, GRP171, CD69, IFNG, GZMK, TTC38, CD160, and PLEKNF1 in Figure 4 are not well-defined. The expression patterns of these genes in Figure 4D are not distinct, and it is unclear which combination of genes was used to classify the populations. Clarification is needed on whether the presence of GZMK alone defines resting NK cells, or if the presence of any of the described genes (GZMK, TTC38, or CD160) is sufficient. Additionally, the method used for this classification, whether visual or algorithm-based, should be described.

      Thank you for your question. The resting and activated NK cells was defined by the preferential expression of the described resting genes (AZU, BPI, CAMP, CD160,CD2, CDHR1, CEACAM8, DEFA4, ELANE, GFI1, GZMK, KLRC4, MGAM, MS4A3, NME8, PLEKHF1, TEP1, TRBC1, TTC38, ZNF135) and activated NK genes (APOBEC3G, APOL6, CCL4, CCND2, CD69, CDK6, CSF2, DPP4, FASLG, GPR171, GPR18, GRAP2, IFNG, KIR2DL4, KIR2DS4, LTA, LTB, NCR3, OSM, PTGER2, SOCS1, TNFSF14) in CIBERSORT. Actually, these marker genes were not specifically expressed in a single NK cells subset. On the other hand, combined with further flow cytometric analysis verification, the resting NK cell tend to be a decidual-like NK cells and tumor- infiltrated NK cells with higher expression of CD9, CD49a and PD-1.

      Comment #3: Criteria used to define high or low NK cell presence/infiltration in Figure 5 are not described in the main text or figure legend. Since, the claim that the presence of the resting or activated NK cells predicts cancer prognosis is based on this figure, this needs to be clearly described.

      Thank you for your questions. The activated and resting NK cell percentage in TCGA and GSE29623 was determined by CIBERSORT. Additionally, the infiltration of activated and resting NK cell was also determined by the AddModuleScore function using the gene sets of activated and resting NK cell identified in single-cell-seq, the differences of activated and resting NK cell presence in tumor and non-tumor region is also determined by visual inspection. We have amended in the main text and figure legend in the revised manuscript.

      Comment #4: The absence of FMO controls for KIR2DL4 or GZMK and the lack of increase in GZMK expression during co-culture with tumour lines raises concerns since GZMK was used as a defining feature of resting NK cells.

      Thank you for your questions. We did a new batch of flow experiments and FMO controls of all the markers used in the experiments were set up to define the precise positive gate locations.

      Author response image 1.

      The positive gate locations of CD56, GZMK, KIR2DL4, CD9, CD49a, PD-1 defined according to the FMO control.

      Comment #5: All the co-cultures were performed with tumour cell line only and no healthy cells, such as human foreskin fibroblasts, were used as control. In the absence of a non-tumour cell line, it is very difficult to draw any conclusions. Furthermore, to claim that resting or activated NK cells are responsible for tumour migration or proliferation, it is important to at least isolate resting and activated NK cells ex vivo and culture with tumour lines, instead of NK cell lines.

      Thank you for your questions. According to your suggestion, NK cells were co-cultured with human foreskin fibroblasts, the phenotype was identified by Flow cytometry. When co-cultured with HFF in direct contact (CN group), NK cells were also tending towards tissue infiltration state (high expression of CD9). However, the domestication effect is significantly reduced compared to co-culturing with tumor cells. Additionally, unlike supernatant of CNS group (NK and HCT were in contact) from NK and HCT co-culture system could significantly increase the migration of fresh HCT, fresh HCT underwent a limited increase (no statistical significance was found) in migration when cultured in the supernatant from the co-culture system in which NK and HFF were in contact (CNS group), but not when co-cultures were performed in the cell supernatant (SNS group) and fresh medium (MNS group). Finally, we tried to isolate resting and activated NK cells from fresh colon cancer surgical specimen. Unfortunately, the NK cells were too few to perform further functional experiments such as migration and proliferation.

      Author response image 2.

      Phenotype switch of NK cells in different co-cultured system and the corresponding NK cell-mediated effect on cell migration of fresh colon cancer cell (HCT-116).

      A-B: NK cells underwent phenotype switch (high expression of CD9) when cocultured with HCT and HFF, the phenotype switch was more obvious when co-cultured with HCT. CN: NK cells cocultured with HCT/HFF; SN: NK cells cocultured with supernatant of HCT/HFF; MN: NK cells cocultured in fresh medium. C-E: Transwell assay showed the only tumor co-cultured NK mediated the inductive effect on cell migration of colon cancer cell (HCT-116). CNS: Colon cancer cells were cultured in the supernatant from co-culture system that NK and HCT/HFF were cultured in direct contact; SNS: Colon cancer cells were cultured in the supernatant from co-culture system that NK cocultured with supernatant of HCT/HFF; MNS: Colon cancer cells were cultured in the fresh medium.

      Comment #6: It seems that flow cytometric analyses and GZMK and KIR2DL4 staining were performed without cell permeabilization. Could authors confirm if this is accurate, or if they performed intracellular staining instead?

      Thank you for your questions. For GZMK, which known as the secretory protein, flow cytometric analyses were performed both with (Fig.3) and without cell fixation and permeabilization, no significant differences were found among each group. The difference is that GZMK was nearly all negative without fixation and permeabilization while it is all positive with fixation and permeabilization. Conditions of flow cytometry analyses for GZMK may need further optimization or GZMK may not be a suitable flow cytometric marker for resting NK cells. On the other hand, for membrane protein such as CD56, CD9, CD49a, KIR2DL4, PD-1, staining was performed without cell permeabilization.

      Author response image 3.

      Phenotype switch (CD56+, GZMK+) of NK cells was analyzed by FACS after fixation and permeabilization in different co-cultured groups. CN: NK cells cocultured with colon cancer cells; SN: NK cells cocultured with supernatant of cancer cells; MN: NK cells cocultured in fresh medium.

      Comment #7: The identity of the published datasets used for analysis is not provided, and references are not cited in the results section.

      Thank you for your questions. We are sorry for the neglect of our previous work. We have added the information in the revised manuscript (section of Materials and Methods) (Line 123-128).

      Comment #8: References are difficult to locate, as the main text follows APA style while the reference section is organized numerically with no clear order.

      Thank you for your questions. We have modified the format of the references in the revised manuscript.

      Comment #9: Figure 3 shows volcano plots showing DEG genes between tumor and healthy tissue NK cells are not described clearly, and authors did not discuss the significance of these genes, highlighted in the plot.

      Thank you for your questions. Volcano plots of Figure 3 showed the DEGs between colon cancer with metastasis and without metastasis in TCGA database. We focused on the genes which were enriched in the pathway of “Natural killer cell mediated cytotoxicity” and found nearly all the genes enriched in the pathway were down-regulated in the colon cancer with metastasis. We have modified the description in the result section and added the description of importance of these genes in the discussion section in the revise manuscript (Line 322-326).

      Comment #10: The meaning of "M0" and "M1" in Figures 5A and 5B is unclear and should be defined in the text.

      Thank you for your questions. "M0" and "M1" in Figure 5A and 5B means “colon cancer without metastasis” and “colon cancer with metastasis”, respectively. We have modified in the revise manuscript (Line 350-354).

      Comment #11: Terms such as "dynamic remodelling of NK cells" and "landscape of NK cells" are used without explanation, necessitating clarification of their meaning.

      Thank you for your questions. We have modified in the revise manuscript (Line 331-334).

      Comment #12: In vitro assays are described vaguely, making it difficult for readers to understand. More clarity is needed in describing these assays.

      Thank you for your questions. We have added clarification in the revise manuscript (Line 205-211).

      Reviewer #2:

      Comment #1: This manuscript investigates the role of the abundant NK cells that are observed in colon cancer liver metastasis using sequencing and spatial approaches in an effort to clarify the pro and anti-tumorigenic properties of NK cells. This descriptive study characterises different categories of NK cells in tumor and tumor-adjacent tissues and some correlations. An attempt has been made using pseudotime trajectory analysis but no models around how these NK cells might be regulated are provided.

      Thank you for your questions. The single-cell sequencing data enrolled in this study are CD45 positive immune cells and do not involve tumor cells, cellular communication analysis between NK cells and tumor cells cannot be conducted. The change process of NK can only be predicted through pseudotime trajectory analysis. Our hypothesis is that tumor cells domesticate NK cells into a tumor- infiltrated NK cells through direct contact, and flow cytometry experiments have also confirmed that tumor cells can only have such domestication through direct contact with NK cells (with prominent high expression of CD9). However, the detailed mechanism remained unclear.

      Comment #2: A small number of patients are analyzed in this study. The descriptive gene markers, while interesting, need to be further validated to understand how strong this analysis might be and its potential application.

      Thank you for your questions. The sample size included in this study is indeed a bit small, which is also a limitation of our study. However, this is the only large sample single-cell sequencing dataset could be found that includes primary colon cancer tissues, paired paratumor normal colon tissues, paired liver metastatic cancer tissue, and paired paratumor normal liver tissues. We will expand the sample size to further verify the current conclusion in subsequent experiments. In addition, the marker genes of different NK groups used in this study refer to the CIBERSORT's classification of activated NK cells and resting NK cells, which is a widely recognized indicator. We will verify the expression and clinical application value of the screened genes in tissues in subsequent studies.

      Comment #3: Figure 1C and other figures throughout the paper. It is not clear how marker genes were selected.

      Thank you for your questions. The marker genes displayed in the Figure.3C were the highly variable genes of each cell group as well as the marker genes of each immune cells, such as T cells (CD3D, CD3E), NK cells (NKG7, KLRD1), monocytes (LYZ, S100A8, S100A9), B cells (CD79A), plasma cells (JCHAIN, IGHA1, IGHA2), Neutrophils (CXCL8, FCGR3B).

      Comment #4: Figure 1E. P and T have not been defined. Lines should not connect the datasets as they are independent assessments.

      Thank you for your questions. P and T means paratumor normal tissues and tumor tissues, respectively. Which have been added in the caption of Figure 1E. Additionally, the single cell sequencing samples included in the study were paired, with primary colon cancer tissues, paired normal tissues adjacent to colon cancer, paired liver metastatic cancer tissue, and paired normal liver tissues from 20 colon cancer patients with liver metastasis, paired test analysis was thus performed.

      Comment #5: Figure 2C. It is unclear what ST-P1 means. This is not a particularly informative figure.

      Thank you for your questions. We are sorry that it was our annotation error. Actually, it is the spatial transcriptome of the primary colon cancer tissue and liver metastasis tissue of four patients. We have made the modifications in the revised manuscript.

      Comment #6: Multiple figures - abbreviations are used but not provided in the legend. They occur in the text but are not directly related to the figures where they are used to label axes or groups.

      Thank you for your questions. We have rechecked and made corresponding modifications in the revised manuscript.

      Comment #6: Patients: it is not clear what other drugs patients have been exposed to or basic data (sex, age, underlying conditions etc)

      Thank you for your questions. The baseline data of the patient of SC dataset and ST dataset were showed in the Table.1 and Table.2 followed, respectively. They were not presented before as no patients characteristics related analysis was performed in the current study.

      Author response table 1.

      The baseline data of patient from single cell sequencing database.

      Author response table 2.

      The baseline data of patient from spatial transcriptome database.

    1. Author response:

      The following is the authors’ response to the current reviews.

      Reviewer #1 (Public Review): 

      In the manuscript "Mechanistic target of rapamycin (mTOR) pathway in Sertoli cells regulates age-dependent changes in sperm DNA methylation", the authors proposed to test if the balance of mTOR complexes in Sertoli cells may play a significant role in age-dependent changes in the sperm epigenome. The paper could be of interest and has a good scientific aim but there are too many drawbacks that hamper the initial enthusiasm. All sections need extensive revision. The paper is mostly descriptive without a mechanistic-orientated explanation for the observed results. 

      Comments on revised version: 

      I am not sure that the authors have made an attempt to clearly answer the reviewers comments that aimed to improve the quality of the manuscript. It stands as mostly descriptive and with limited interest as it is. 

      We are thankful to the reviewer for agreeing to review our revised manuscript. Unfortunately, we completely disagree with the evaluation provided by the reviewer. Research on sperm DNA methylation experienced a significant rise of interest in the current century and by now more than 2000 papers have been published. Although it was demonstrated that the sperm DNA methylome may be affected by almost every factor analyzed, no study was published to identify molecular mechanisms that may link these factors with the sperm epigenome. Our study is the FIRST to identify such a mechanism (mTOR complexes balance in Sewrtoli cells). More so, we demonstrated experimentally that manipulations of this mechanism allow regulation of the rates of epigenetic aging of sperm in both directions (accelerate aging or rejuvenate). Thus, our study provides a mechanistic background for the development of therapeutic interventions that may target sperm epigenome.

      We acknowledge that our study does not provide the full cascade of events linking the balance of mTOR complexes in Sertoli cells with the sperm DNA methylome. It suggests, however, the most plausible event next in a cascade (BTB permeability changes). Our group is working on this question now and we hope to provide the answer soon in a separate study. Even after that, we will be far from understanding the complete chain of molecular events that link mTOR and sperm methylome. It may take many years and significant effort of many research groups to dissect the whole cascade. It is worth mentioning that understanding of a complete cascade involved in pathology is not needed to develop efficient therapies if the critical nodes are known. For many common drugs (e.g. metformin) we do not know the full chain of molecular mechanisms but use them successfully.

      Thus, we believe that our study is mechanistic as it identified a critical mechanism manipulation of which allows experimental aging and rejuvenation of the sperm methylome. Additionally, it generates new mechanistic questions and hypotheses to be answered in the future.

      Reviewer #3 (Public Review): 

      Summary and Strength: 

      The manuscript by Amir et al. describes that Sertoli-specific inactivation of the mTORC1 and mTORC2 complex by KO of either Raptor or Rictor, respectively, resulted in progressive changes in blood-testis-barrier (BTB) function, testis weight, and sperm parameters, including counts, morphology, mtDNA content and sperm DNA methylation. 

      The described studies are based on the hypothesis that a decline of BTB function with increasing chronological age of a male contributes to the DNA methylation changes that are known to occur in sperm DNA of old males when compared to sperm DNA from isogenic young males. In order to demonstrate the relevance of a functioning BTB for the maintenance of sperm methylation patterns, the authors generated mice with genetically disrupted mTORC2 complex or mTORC1 complex in Sertoli cells and determined sperm methylation patterns in comparison to isogenic wild-type males. In line with previously published scientific literature (e.g. Mok et al., 2013; Dong et al, 2015; and others), the manuscript corroborates that a Sertoli-cell specific deletion of mTORC2 caused a loss of BTB function and a progressive spermatogenic defect. The authors further show that sperm DNA is differentially methylated (DMRs) as a consequence of either a mTORC2 disruption (associated with a loss of BTB function) or following a mTORC1 disruption (BTB function either increased or not leaky) when compared to their isogenic age-matched wt controls. Those DMRs overlap partially with changes in sperm DNA methylation that were found when comparing sperm from 8-week males with sperm isolated from 22-week-old male mice. 

      The authors interpret the observed changes as representative of the sperm DNA methylation changes that occur during normal chronological aging of the male. For an aged control group, the authors use sperm DNA of 22-week-old wild-type mates from the mTORC2 and mTORC2 KO breeding and compare the sperm methylation patterns found in sperm from those 22-week males to 8-week young males, that are intended to represent an old and a young cohort, respectively. DNA methylation analysis indicates that a disruption of mTORC2 (& decrease of BTB function) results in increased DNA methylation of sperm DNA, while a disruption of mTORC1 (and proposed increase of BTB tightness, not shown in the manuscript, though) resulted in increased hypomethylation. 

      Weaknesses: 

      While the hypothesis and experimental system are interesting and the data demonstrating the relevance of the mTORC2 complex for BTB function is convincing, several open questions limit the evidence that supports the hypothesis that the sperm DNA methylation changes seen in old males are caused by BTB failure following an imbalance of mTOR signaling complexes. The major critique points are the lack of a chronologically old group and the choice of 8 weeks & 22 weeks age of age: 

      - Data illustrating the degree of BTB decline and sperm DNA methylation changes from chronologically "old" male mice is missing. 22-week-old mice are not considered old but are of good and mature breeding age, equivalent to humans in their mid-late twenties. (In the manuscript, the 22-week-old wildtype mice show no evidence of BTB breakdown (Figure 3), so why are their sperm used to represent "aged" sperm? 

      - Adding a group of "old" wild-type mice of 12-14 months of age, which is closer to the end of effective reproduction in mice, more equivalent to 45-59 year-old humans) could be used to illustrate that (a) aging causes a marked decrease in BTB function at this time in mouse life, and that this BTB breakdown chronologically aligns with the age-associated DNA hypermethylation seen in old sperm. Age-matched "old" mTORC1 KO, with a (supposedly) tighter BTB barrier, could then be expected to have a sperm DMA methylation profile closer to that of younger wild-type animals. Such data are currently missing. While the progressive testicular decline observed in the mTORC1 KO (Fig.5) could make it difficult to obtain the appropriately aged mTORC1 KO tissues, it is completely feasible to obtain data from chronologically old wild-type males. (The progressive testicular decline further raises the question of what additional defects the KO causes, and how such additional defects would influence the sperm DNA methylation profile.) The addition of data from an old group to the currently included groups could strengthen the interpretation that the observations in the BTB-defective mTORC2 KO mice are modelling an age-related testicular decline, provided that the DMRs seen in the chronologically old group significantly overlap with the BTB-defective changes. 

      - In the current form, the described differences in sperm DNA methylation are based on comparisons between pubertal mice (8 weeks) and mature but not old adult males (22 weeks), while a chronologically "old" group is missing from the data sets and comparisons. Thus, it appears that the described sperm methylation changes reflect developmental changes associated with normal maturation and not necessarily declining sperm quality due to aging. (Sperm obtained from 8-week-old mice likely were generated, at least in part, during the 1st wave of spermatogenesis, which is known to differ from the continuously proceeding spermatogenesis during the remained of the mature life. During the 1st wave of spermatogenesis, Sertoli cells are known to undergo gene expression changes which could contribute to varying degrees of BTB function, and thus have effects on the sperm DNA methylation profiles of such 1st wave sperm.) 

      - It is unclear why the aging-related DMRs between the 8 and 22-week-old wild-type mice vary so dramatically between the two wild-type groups derived from the mTORC1 and the mTORC2 breeding (Fig. S4). If the main difference was due to mTORC1 or mTORC2 activity, both wildtype groups should behave very similarly. Changes seen in a truly "old" mouse (e.g. 20 weeks to 56 weeks), changes in "young mTORC1" and in "old mTORC2" are missing.

      How do those numbers and profiles compare to the shown samples? 

      Comments on latest version: 

      The rebuttal letter and public response indicate the authors' reluctance to consider the limitations of their study, i.e. having chosen chronologically young animals to demonstrate a sperm aging effect and indicate that they are not willing to include adequate controls. 

      Since there is no evidence that mice at this young age have a deteriorating blood-testis-barrier (indeed, normal intact BTB is clearly visible in the figures included in this study from animals of the relevant age group), the whole central hypothesis that the study is built upon (i.e. that increasing age causes deteriorating BTB integrity which in turn causes age-related changes in sperm DNA methylation), appears irrelevant or invalid. 

      The authors' claim that age-related DNA methylation changes in sperm occur in linear fashion and that the changes are somewhat proportional with chronological age is in stark contrast of the claim that a decline of the BTB in old animals is causative for age-related sperm epigenetic changes, putting the relevance of the whole study in question. 

      We are thankful to the reviewer for agreeing to review our revised manuscript. We disagree with the evaluation provided by the reviewer, however.

      First, the reviewer misinterpreted the hypothesis of the study, although it is formulated in the last sentence of the Introduction:  “ … we hypothesized that the balance of mTOR complexes in Sertoli cells may also play a significant role in age-dependent changes in the sperm epigenome.” Instead, the reviewer assigned a different hypothesis to our study (that BTB integrity changes are responsible for age-dependent changes in sperm DNA methylation) and criticized us for not providing clear testing of this hypothesis.

      To clarify, we believe that our study provides high-quality testing of OUR hypothesis as we demonstrated experimentally that manipulations of mTOR complexes balance in Sertoli allow acceleration and deceleration of epigenetic aging of sperm. Additionally, our study generated a hypothesis that BTB permeability may mediate the effects of the mTOR pathway on sperm methylome. This second hypothesis is to be tested in the future research.

      We also disagree with the reviewer's interpretation of the aging process as an abrupt transition from a young, healthy, and undamaged state to an old, moribund, and damaged state. The whole body of biogerontological knowledge suggests instead steady accumulation of damage over lasting periods of time. For example, this understanding of steady change at the molecular level allowed the development and successful use of epigenetic clock and other molecular clock models, including several variants of sperm epigenetic clocks. These models clearly demonstrate linear or semi-linear accumulation in DNA-methylation changes in various tissues and biological species across the whole lifespan. It is reasonable to assume that BTB permeability decreases with age steadily as well and that in younger animals this decrease may be not easily detected by the existing analytical methods. Experimental data showing the dynamics of the BTB deterioration over age do not exist to our knowledge although it was demonstrated that older animals have loose BTB as compared with young. We agree with the reviewer that future studies testing the role of BTB deterioration for sperm methylome aging will need to provide such evidence. It was not the subject of the current study, however.


      The following is the authors’ response to the original reviews.

      Reviewer #1 (Public Review):

      In the manuscript "Mechanistic target of rapamycin (mTOR) pathway in Sertoli cells regulates age-dependent changes in sperm DNA methylation", the authors proposed to test if the balance of mTOR complexes in Sertoli cells may play a significant role in age-dependent changes in the sperm epigenome. The paper could be of interest and has a good scientific aim but there are too many drawbacks that hamper the initial enthusiasm. All sections need extensive revision. The paper is mostly descriptive without a mechanistic-orientated explanation for the observed results.

      Specific comments:

      (1) The abstract is poorly written. There is a lot of unnecessary introduction that does not provide a rationale for the work. It is not possible to understand the experimental approach or the major data just by reading the abstract. It does not clearly represent the work.

      - We have added details of experimental design and results to the abstract and reduced the introductory part of the abstract.

      (2) The introduction is somewhat vague and does not provide a clear rationale for the hypothesis. There should be more focus more on the role of mTOR in Sertoli cells that goes far beyond BTB. That will give more focus on mTOR. Then it is important to focus on BTB and mTOR: what is known? What is the gap and how can it be solved? Several relevant references are missed concerning mTOR and Sertoli cells.

      - The goal of this study was not to explore all potential roles of mTOR pathway in Sertoli cells, but to test if shifts in the balance of mTOR complexes regulate (accelerate/decelerate) epigenetic aging of sperm. As such, we disagree with the reviewer and consider that the current Introduction provides a focused rational for the study.

      (3) The Material and Methods section needs improvement. There is much important information missing. For instance: how many animals were used per group and how was the breeding done? At what age? Statistical analysis should be explained in detail.

      - The number of animals was clearly stated in the original manuscript. We have added details of breeding and statistical analysis. 

      (4) The results description could be improved. It is vague without highlighting how much difference was detected. The results should be numerically described when possible and the differences should be highlighted. A 10% difference may be significant but not biologically relevant. To correctly evaluate the differences it is important to describe them with some degree of detail.

      - For all DNA methylation experiments we provide numerical characteristics of methylation changes, including numbers of DMRs, % change, significance, correlation coefficients. We believe that only age- and genotype-associated changes in reproductive parameters were not characterized in our manuscript in detail. We have added Table 1 to provide these numbers.

      (5) There is no discussion of the data. The authors just summarize their findings without a comprehensive analysis of the literature and how the effects can be mediated. mTOR interacts with different pathways (mTORC1 and mTORC2 are even mediators of distinct pathways). This would be very relevant to discuss. In addition, there are many study limitations not discussed. There is no clear mechanistic explanation of the way by which the mTOR pathway in Sertoli cells regulates age-dependent changes in sperm DNA methylation. The paper seems preliminary.

      - We have added an additional paragraph to the discussion to highlight a potential molecular mechanism that links mTOR pathway with the sperm epigenome.

      (6) Figure 1 is too simple and does not provide any schematic support for the text.

      - We disagree with the reviewer and believe that the figure represents a good visualization of our hypothesis useful for the perception of the study.

      (7) Figure 2 lacks some detail. For instance, how many animals were used for each step?

      - Numbers of animals are provided in the text of the paper.

      (8) Taking into consideration the roles of mTOR on sperm, particularly mTORC1, it is not clear whether there were any differences in sperm motility.

      - We did not assess sperm motility in this study. 

      Reviewer #2 (Public Review):

      In this study, the authors hypothesized that the balance of mTOR complexes in Sertoli cells may also play a significant role in age-dependent changes in the sperm epigenome. To test this hypothesis, the authors use transgenic mice with manipulated activity of mTOR complexes in Sertoli cells. These results suggest that the mTOR pathway in Sertoli cells may be used as a novel target of therapeutic interventions to rejuvenate the sperm epigenome in advanced-age fathers.

      The authors attempt to demonstrate that the balance of mTOR complexes in Sertoli cells regulates the rate of sperm epigenetic aging. The authors have effectively met their research objectives, and their conclusions are supported by the data presented.

      - We are very thankful for the positive evaluation of our study.

      Reviewer #3 (Public Review):

      Summary and Strength:

      The manuscript by Amir et al. describes that Sertoli-specific inactivation of the mTORC1 and mTORC2 complex by KO of either Raptor or Rictor, respectively, resulted in progressive changes in blood-testis-barrier (BTB) function, testis weight, and sperm parameters, including counts, morphology, mtDNA content and sperm DNA methylation.

      The described studies are based on the hypothesis that a decline of BTB function with increasing chronological age of a male contributes to the DNA methylation changes that are known to occur in sperm DNA of old males when compared to sperm DNA from isogenic young males. In order to demonstrate the relevance of a functioning BTB for the maintenance of sperm methylation patterns, the authors generated mice with genetically disrupted mTORC2 complex or mTORC1 complex in Sertoli cells and determined sperm methylation patterns in comparison to isogenic wild-type males. In line with previously published scientific literature (e.g. Mok et al., 2013; Dong et al, 2015; and others), the manuscript corroborates that a Sertoli-cell specific deletion of mTORC2 caused a loss of BTB function and a progressive spermatogenic defect. The authors further show that sperm DNA is differentially methylated (DMRs) as a consequence of either a mTORC2 disruption (associated with a loss of BTB function) or following a mTORC1 disruption (BTB function either increased or not leaky) when compared to their isogenic age-matched wt controls. Those DMRs overlap partially with changes in sperm DNA methylation that were found when comparing sperm from 8-week males with sperm isolated from 22-week-old male mice.

      The authors interpret the observed changes as representative of the sperm DNA methylation changes that occur during normal chronological aging of the male. For an aged control group, the authors use sperm DNA of 22-week-old wild-type mates from the mTORC2 and mTORC2 KO breeding and compare the sperm methylation patterns found in sperm from those 22-week males to 8-week young males, that are intended to represent an old and a young cohort, respectively. DNA methylation analysis indicates that a disruption of mTORC2 (& decrease of BTB function) results in increased DNA methylation of sperm DNA, while a disruption of mTORC1 (and proposed increase of BTB tightness, not shown in the manuscript, though) resulted in increased hypomethylation.

      Weaknesses:

      While the hypothesis and experimental system are interesting and the data demonstrating the relevance of the mTORC2 complex for BTB function is convincing, several open questions limit the evidence that supports the hypothesis that the sperm DNA methylation changes seen in old males are caused by BTB failure following an imbalance of mTOR signaling complexes. The major critique points are the lack of a chronologically old group and the choice of 8 weeks & 22 weeks age of age:

      - Data illustrating the degree of BTB decline and sperm DNA methylation changes from chronologically "old" male mice is missing. 22-week-old mice are not considered old but are of good and mature breeding age, equivalent to humans in their mid-late twenties. (In the manuscript, the 22-week-old wildtype mice show no evidence of BTB breakdown (Figure 3), so why are their sperm used to represent "aged" sperm?

      - Adding a group of "old" wild-type mice of 12-14 months of age, which is closer to the end of effective reproduction in mice, more equivalent to 45-59 year-old humans) could be used to illustrate that (a) aging causes a marked decrease in BTB function at this time in mouse life, and that this BTB breakdown chronologically aligns with the age-associated

      DNA hypermethylation seen in old sperm. Age-matched "old" mTORC1 KO, with a (supposedly) tighter BTB barrier, could then be expected to have a sperm DMA methylation profile closer to that of younger wild-type animals. Such data are currently missing. While the progressive testicular decline observed in the mTORC1 KO (Fig.5) could make it difficult to obtain the appropriately aged mTORC1 KO tissues, it is completely feasible to obtain data from chronologically old wild-type males. (The progressive testicular decline further raises the question of what additional defects the KO causes, and how such additional defects would influence the sperm DNA methylation profile.) The addition of data from an old group to the currently included groups could strengthen the interpretation that the observations in the BTB-defective mTORC2 KO mice are modelling an age-related testicular decline, provided that the DMRs seen in the chronologically old group significantly overlap with the BTB-defective changes.

      - In the current form, the described differences in sperm DNA methylation are based on comparisons between pubertal mice (8 weeks) and mature but not old adult males (22 weeks), while a chronologically "old" group is missing from the data sets and comparisons. Thus, it appears that the described sperm methylation changes reflect developmental changes associated with normal maturation and not necessarily declining sperm quality due to aging. (Sperm obtained from 8-week-old mice likely were generated, at least in part, during the 1st wave of spermatogenesis, which is known to differ from the continuously proceeding spermatogenesis during the remained of the mature life. During the 1st wave of spermatogenesis, Sertoli cells are known to undergo gene expression changes which could contribute to varying degrees of BTB function, and thus have effects on the sperm DNA methylation profiles of such 1st wave sperm.)

      - It is unclear why the aging-related DMRs between the 8 and 22-week-old wild-type mice vary so dramatically between the two wild-type groups derived from the mTORC1 and the mTORC2 breeding (Fig. S4). If the main difference was due to mTORC1 or mTORC2 activity, both wildtype groups should behave very similarly. Changes seen in a truly "old" mouse (e.g. 20 weeks to 56 weeks), changes in "young mTORC1" and in "old mTORC2" are missing. How do those numbers and profiles compare to the shown samples?

      Some general comments regarding the chosen age of animals:

      - As mentioned, sperm from 8-week-old mice represent many sperm that were produced in the 1st wave of spermatogenesis; 22-week-old mice are not considered chronologically old mice, but mature and "relatively" young animals. 18-24 month-old mice are considered to be equivalent to 56-69 year-old humans, and might be more suitable to detect aging effects. "Old mice" for study purposes should be at least 12-14 months of age, ideally >18 months of age. 22 weeks (5 months of age) are mice at good breeding age, but still considered mature adults, not old males, and therefore are not expected to show typical aging health problems (like declining fertility).

      Even the cited reference (Flurkey et al. 2007) defines that "... mice used a reference group for "young mice" should be at least 3 months of age (~ 13 weeks), i.e. fully sexually mature. The authors specifically state: " The young adult group should be at least 3 months old because, although mice are sexually mature by 35 days, relatively rapid maturational growth continues for most biologic processes and structures until about 3 months. The upper age range for the young adult group is typically about 6 months. ... For the middleaged group, 10 months is typically the lower limit.... The upper age limit for the middleaged group is typically 14-15 months, because at this age, most biomarkers still have not changed to their full extent, and some have not yet started changing. For the old group, the lower age limit is 18 months because age-related change for almost all biomarkers of aging can be detected by then. The upper limit is 22-26 months, depending on the genotype." According to this reference, mice up to 6 months of age are generally considered "mature adults" (equivalent to humans 20-30 yrs), mice of 10-14 month are "middle-aged adults" (equivalent to ~38-47 human years) and 18-24 month mice are "old" (equivalent to human of 56-69 yrs.).

      Going on these commonly used age ranges, it is unclear why the authors used 8-week-old mice (generally considered pubertal to late adolescent age) as young mice and 5-month-old mice as "old mice".

      Differences seen between these cohorts most likely do not reflect aging, but more likely reflect changes associated with normal developmental maturation, since testis and epididymides continue to grow until about 10-11 weeks of age.

      - The DMRs identified between 8 and 22-week-old animals could represent DMRs that are dependent on developmental maturation more than being changed in an "age-dependent" manner (in the sense of increased chronological age). This interpretation is congruent with the fact that those DMRs are enriched for developmental categories.

      - We are thankful to the reviewer for a detailed explanation of their disagreement with the ages of mice used in this study. In short, the reviewer suggests that our older group (22 weeks) is not old enough to represent aged animals and our young group (8 weeks) may still have spermatozoa from the first wave of spermatogenesis, and as such the observed differences between the 2 ages cannot be considered as aging-related but rather may represent different stages of maturation of the reproductive system. At the first glance this criticism looks valid. 

      However, to design our experiments we used our data that was not included to this manuscript initially. These data demonstrated that age dependent changes in sperm DNA are linearly or semi linearly associated with age in the age range from 56 to 334 days. Thus, within this interval any 2 ages, distant enough to register the difference in DNA methylation, can be used to assess age dependent changes in DNA methylation and changes in the rates of epigenetic aging of sperm in response to genetic manipulations. We have added these results now, - see “Identification of agedependent patterns in sperm DNA methylation” section in Material and Methods and “Patterns of age-dependent changes in sperm DNA methylation” in Results. We also consider that the reviewer’s suggestion that sperm from 8-week-old mice represents the first wave of spermatogenesis does not have ground. Indeed, C57BL/6 mice first have fertile sperm in cauda epididymis at 37 days of age [1], 19 days earlier than the age of 56 days (8 weeks) at which sperm was collected in our study in the youngest group of mice. Given that young C57BL/6 mice ejaculate spontaneously around 3 times per 5 days [2], 8 weeks old mice have ejaculated > 10 times since the first wave of spermatogenesis before the sperm was collected for our study, making negligibly small the chances of survival of any first wave sperm in their cauda epididymides to the age of 8 weeks. We have added this information to the text.

      (1) Mochida, K.; Hasegawa, A.; Ogonuki, N.; Inoue, K.; Ogura, A. Early Production of Offspring by in Vitro Fertilization Using First-Wave Spermatozoa from Prepubertal Male Mice. J. Reprod. Dev. 2019, 65, 467–473, doi:10.1262/jrd.2019-042.

      (2) Huber, M.H.; Bronson, F.H.; Desjardins, C. Sexual Activity of Aged Male Mice: Correlation with Level of Arousal, Physical Endurance, Pathological Status, and Ejaculatory Capacity. Biol. Reprod. 1980, 23, 305–316, doi:10.1095/biolreprod23.2.305.

    1. Author response:

      We thank the editors and reviewers for their enthusiasm for this work and helpful suggestions. In summary, the reviewers provided suggestions for additional discussion items and clarifications for the text and figures, especially in relation to the cryo-EM structures and suppressor screen sections of the manuscript. We will consider each of these and make edits as needed. In particular, reviewers asked for further details about the structural model in addition to analysis of our new structure with respect to previously reported intron lariat spliceosome (ILS) complexes. For the latter point, we present additional evidence for the correct assignment of Yju2 in the S. cerevisiae ILS structure and note that docking of the 3’ splice site is not observed in any ILS structure from yeast, worms, or humans. This is consistent with our proposed mechanism. We will clarify these points in the text as well highlight some caveats of prior studies of the ILS complex. We feel that these changes will add additional nuance to the manuscript as well as clarify the findings and their context and significance for the reader.

    1. Author response:

      Public Reviews:

      Reviewer #1 (Public Review):

      Summary:

      This study sought to reveal the potential roles of m6A RNA methylation in gene dosage regulatory mechanisms, particularly in the context of aneuploid genomes in Drosophila. Specifically, this work looked at the relationships between the expression of m6A regulatory factors, RNA methylation status, classical and inverse dosage effects, and dosage compensation. Using RNA sequencing and m6A mapping experiments, an in-depth analysis was performed to reveal changes in m6A status and expression changes across multiple aneuploid Drosophila models. The authors propose that m6A methylation regulates MOF and, in turn, deposition of H4K16Ac, critical regulators of gene dosage in the context of genomic imbalance.

      Strengths:

      This study seeks to address an interesting question with respect to gene dosage regulation and the possible roles of m6A in that process. Previous work has linked m6A to X-inactivation in humans through the Xist lncRNA, and to the regulation of the Sxl in flies. This study seeks to broaden that understanding beyond these specific contexts to more broadly understand how m6A impacts imbalanced genomes in other contexts.

      Weaknesses:

      The methods being used particularly for analysis of m6A at both the bulk and transcript-specific level are not sufficiently specific or quantitative to be able to confidently draw the conclusions the authors seek to make. MeRIP m6A mapping experiments can be very valuable, but differential methylation is difficult to assess when changes are small (as they often are, in this study but also m6A studies more broadly). For instance, based on the data presented and the methods described, it is not clear that the statement that "expression levels at m6A sites in aneuploidies are significantly higher than that in wildtype" is supported. MeRIP experiments are not quantitative, and since there are far fewer peaks in aneuploidies, it stands to reason that more antibody binding sites may be available to enrich those fewer peaks to a larger extent. But based on the data as presented (figure 2D) this conclusion was drawn from RPKM in IP samples, which may not fully account for changing transcript abundances in absolute (expression level changes) and relative (proportion of transcripts in input RNA sample) terms.

      Methylated RNA immunoprecipitation followed by sequencing (MeRIP-seq) is a commonly used strategy of genome-wide mapping of m6A modification. This method uses anti-m6A antibody to immunoprecipitate RNA fragments, which results in selective enrichment of methylated RNA. Then the RNA fragments were subjected to deep sequencing, and the regions enriched in the immunoprecipitate relative to input samples are identified as m6A peaks using the peak calling algorithm. We identified m6A peaks in different samples by the exomePeak2 program and determined common m6A peaks for each genotype based on the intersection of biological replicates. Figure 2D shows the RPM values of m6A peaks in MeRIP samples for each genotype, indicating that the levels of reads in the m6A peak regions were significantly higher in the aneuploid IP samples than in wildtypes. When the enrichment of IP samples relative to Input samples (RPM.IP/RPM.Input) was taken into account, the statistics for all three aneuploidies were still significantly higher than those of the wildtypes (Mann Whitney U test p-values < 0.001). This analysis is not about changes in the abundance of transcripts, but from the MeRIP perspective, showing that there are relatively more m6A-modified reads mapped to the m6A peaks in aneuploidies than that in wildtypes. In addition, we have added the results of IP/Input in the main text, and revised the description in the manuscript to make it more precise to reduce possible misunderstandings.

      The bulk-level m6A measurements as performed here also cannot effectively support these conclusions, as they are measured in total RNA. The focus of the work is mRNA m6A regulators, but m6A levels measured from total RNA samples will not reflect mRNA m6A levels as there are other abundance RNAs that contain m6A (including rRNA). As a result, conclusions about mRNA m6A levels from these measurements are not supported.

      According to some published articles, m6A levels of purified mRNA or total RNA can be detected by different methods (such as mass spectrometry, 2D thin-layer chromatography, etc.) in Drosophila cells or tissues [1-3].

      Here, we used the EpiQuik m6A RNA Methylation Quantification Kit (Colorimetric) (Epigentek, NY, USA, Cat # P-9005), which is suitable for detecting m6A methylation status directly using total RNA isolated from any species such as mammals, plants, fungi, bacteria, and viruses. This kit has previously been used by researchers to detect the m6A/A ratio in total RNA [4, 5] or purified mRNA [6] from different species.

      In order to compare the m6A levels between the total RNA and mRNA, it was shown that the enrichment of mRNA from total RNA using Dynabeads™mRNA Purification Kit (Invitrogen Cat # 61006) did not show any significantly differences comparing with the results of total RNA (Figure 1). That’s the reason why most of the results of m6A levels in the manuscript were detected in total RNA.

      Author response image 1.

      The m6A levels of total RNA and mRNA

      As suggested, we will try to extract and purify mRNA from different genotypes to verify our conclusion based on the m6A levels of total RNA if necessary. In addition, m6A modification in other types of RNA other than mRNA (e.g., lncRNA, rRNA) is not necessarily meaningless. We will also add discussions of this issue in the manuscript.

      (1) Lence T, et al. (2016) m6A modulates neuronal functions and sex determination in Drosophila. Nature 540(7632):242-247.

      (2) Haussmann IU, et al. (2016) m(6)A potentiates Sxl alternative pre-mRNA splicing for robust Drosophila sex determination. Nature 540(7632):301-304.

      (3) Kan L, et al. (2017) The m(6)A pathway facilitates sex determination in Drosophila. Nat Commun 8:15737.

      (4) Zhu C, et al. (2023) RNA Methylome Reveals the m(6)A-mediated Regulation of Flavor Metabolites in Tea Leaves under Solar-withering. Genomics Proteomics Bioinformatics 21(4):769-787.

      (5) Song H, et al. (2021) METTL3-mediated m(6)A RNA methylation promotes the anti-tumour immunity of natural killer cells. Nat Commun 12(1):5522.

      (6) Yin H, et al. (2021) RNA m6A methylation orchestrates cancer growth and metastasis via macrophage reprogramming. Nat Commun 12(1):1394.

      Reviewer #2 (Public Review):

      Summary:

      The authors have tested the effects of partial- or whole-chromosome aneuploidy on the m6A RNA modification in Drosophila. The data reveal that overall m6A levels trend up but that the number of sites found by meRIP-seq trend down, which seems to suggest that aneuploidy causes a subset of sites to become hyper-methylated. Subsequent bioinformatic analysis of other published datasets establish correlations between the activity of the H4K16 acetyltransferase dosage compensation complex (DCC) and the expression of m6A components and m6A abundance, suggesting that DCC and m6A can act in a feedback loop on each other. Overall, this paper uses bioinformatic trends to generate a candidate model of feedback between DCC and m6A. It would be improved by functional studies that validate the effect in vivo.

      Strengths:

      • Thorough bioinformatic analysis of their data.

      • Incorporation of other published datasets that enhance scope and rigor.

      • Finds trends that suggest that a chromosome counting mechanism can control m6A, as fits with pub data that the Sxl mRNA is m6A modified in XX females and not XY males.

      • Suggests this counting mechanism may be due to the effect of chromatin-dependent effects on the expression of m6A components.

      Weaknesses:

      • The linkage between H4K16 machinery and m6A is indirect and based on bioinformatic trends with little follow-up to test the mechanistic bases of these trends.

      We found a set of ChIP-seq data (GSE109901) of H4K16ac in female and male Drosophila larvae from the public database, and analyzed whether H4K16ac is directly associated with m6A regulator genes. ChIP-seq is a standard method to study transcription factor binding and histone modification by using efficient and specific antibodies for immunoprecipitation. The results showed that there were H4K16ac peaks at the 5' region in gene of m6A reader Ythdc1 in both males and females. In addition, most of the genome sites where the other m6A regulator genes located are acetylated at H4K16 in both sexes, except that Ime4 shows sexual dimorphism and only contains H4K16ac peak in females. These results indicate that the m6A regulator gene itself is acetylated at H4K16, so there is a direct relationship between H4K16ac and m6A regulators. We have added these contents to the text.

      Besides the above conclusion from the seq data, we are also going to do some experiments to test the linkage between H4K16 and m6A in the next, such as how about the m6A levels when MOF is over expressed with the increased levels of H4K16Ac, the H4K16 levels when YT521B is knocked down or over expressed and the relative expression levels of important regulatory genes in there.

      • The paper lacks sufficient in vivo validation of the effects of DCC alleles on m6A and vice versa. For example, Is the Ythdc1 genomic locus a direct target of the DCC component Msl-2 ? (see Figure 7).

      In order to study whether Ythdc1 genomic locus is a direct target of DCC component, we first analyzed a published MSL2 ChIP-seq data of Drosophila (GSE58768). Since MSL2 is only expressed in males under normal conditions, this set of data is from male Drosophila. According to the results, the majority (99.1%) of MSL2 peaks are located on the X chromosome, while the MSL2 peaks on other chromosomes are few. This is consistent with the fact that MSL2 is enriched on the X chromosome in male Drosophila [1, 2]. Ythdc1 gene is located on chromosome 3L, and there is no MSL2 peak near it. Similarly, other m6A regulator genes are not X-linked, and there is no MSL2 peak. Then we analyzed the MOF ChIP-seq data (GSE58768) of male Drosophila. It was found that 61.6% of MOF peaks were located on the X chromosome, which was also expected [3, 4]. Although there are more MOF peaks on autosomes than MSL2 peaks, MOF peaks are absent on m6A regulator genes on autosomes. Therefore, at present, there is no evidence that the gene locus of m6A regulators are the direct targets of DCC component MSL2 and MOF, which may be due to the fact that most MSL2 and MOF are tethered to the X chromosome by MSL complex under physiological conditions. Whether there are other direct or indirect interactions between Ythdc1 and MSL2 is an issue worthy of further study in the future.

      (1) Bashaw GJ & Baker BS (1995) The msl-2 dosage compensation gene of Drosophila encodes a putative DNA-binding protein whose expression is sex specifically regulated by Sex-lethal. Development 121(10):3245-3258.

      (2) Kelley RL, et al. (1995) Expression of msl-2 causes assembly of dosage compensation regulators on the X chromosomes and female lethality in Drosophila. Cell 81(6):867-877.

      (3) Kind J, et al. (2008) Genome-wide analysis reveals MOF as a key regulator of dosage compensation and gene expression in Drosophila. Cell 133(5):813-828.

      (4) Conrad T, et al. (2012) The MOF chromobarrel domain controls genome-wide H4K16 acetylation and spreading of the MSL complex. Dev Cell 22(3):610-624.

      Quite a bit of technical detail is omitted from the main text, making it difficult for the reader to interpret outcomes.

      (1) Please add the tissues to the labels in Figure 1D.

      Figure 1D shows the subcellular localization of FISH probe signals in Drosophila embryos. Arrowheads indicate the foci of probe signals. The corresponding tissue types are (1) blastoderm nuclei; (2) yolk plasm and pole cells; (3) brain and midgut; (4) salivary gland and midgut; (5) blastoderm nuclei and yolk cortex; (6) blastoderm nuclei and pole cells; (7) blastoderm nuclei and yolk cortex; (8) germ band. We have added these to the manuscript.

      (2) In the main text, please provide detail on the source tissues used for meRIP; was it whole larvae? adult heads? Most published datasets are from S2 cells or adult heads and comparing m6A across tissues and developmental stages could introduce quite a bit of variability, even in wt samples. This issue seems to be what the authors discuss in lines 197-199.

      In this article, the material used to perform MeRIP-seq was the whole third instar larvae. Because trisomy 2L and metafemale Drosophila died before developing into adults, it was not possible to use the heads of adults for MeRIP-seq detection of aneuploidy. For other experiments described here, the m6A abundance was measured using whole larvae or adult heads; material used for RT-qPCR analysis was whole larvae, larval brains, or adult heads; Drosophila embryos at different developmental stages were used for fluorescence in situ hybridization (FISH) experiments. We provide a detailed description of the experimental material for each assay in the manuscript.

      (3) In the main text, please identify the technique used to measure "total m6A/A" in Fig 2A. I assume it is mass spec.

      We used the EpiQuik m6A RNA Methylation Quantification Kit (Colorimetric) (Epigentek, NY, USA, Cat # P-9005) to measure the m6A/A ratio in RNA samples. This kit is commercially available for quantification of m6A RNA methylation, which used colorimetric assay with easy-to-follow steps for convenience and speed, and is suitable for detecting m6A methylation status directly using total RNA isolated from any species such as mammals, plants, fungi, bacteria, and viruses.

      (4) Line 190-191: the text describes annotating m6A sites by "nearest gene" which is confusing. The sites are mapped in RNAs, so the authors must unambiguously know the identity of the gene/transcript, right?

      When the m6A peaks were annotated using the R package ChIPseeker, it will include two items: "genomic annotation" and "nearest gene annotation". "Genomic annotation" tells us which genomic features the peak is annotated to, such as 5’UTR, 3’UTR, exon, etc. "Nearest gene annotation" indicates which specific gene/transcript the peak is matched to. We modified the description in the main text to make it easier to understand.

    1. Author response:

      We would like to thank all reviewers for their valuable comments that help us to improve our manuscript. We will make the following modifications in the revised manuscript:

      (1) To reduce the complexity of the experiments we carried out, we will summarize trimeric G proteins in Ciona in the first paragraph of the Result section and explain how we focused on Gas and Gaq in the initial phase of this study.

      (2) As the reviewer 1 suggested, the polymodal roles of papilla neurons are interesting. We will add a discussion regarding this aspect. The sentences will be like the following:

      “The recent study (Hoyer et al., 2024) provided several lines of evidence suggesting that papilla neurons can serve as the sensors of several chemicals in addition to the mechanical stimuli. This finding and our model seem mutually related because these chemicals could modify Ca2+ and cAMP signaling. The use of G protein signaling may allow Ciona to reflect various environmental stimuli to initiate metamorphosis in the appropriate situation, both mechanically and chemically.”

      (3) As both reviewers suggested, imaging cAMP on the backgrounds of some G protein knockdowns and pharmacological treatments is important, and we will carry out some of these experiments.

      (4) According to reviewer 2's comment, we will carefully modify the text about interpreting the results so that the descriptions suitably reflect the results.

    1. Author response:

      Response to reviewers (Public review):

      We thank all the three reviewers for their opinion on our work on Candida albicans β-1,6-glucan, which highlights the importance of this cell wall component in the biology of fungi. Here are our responses to their comments for public reviews:

      (1) Indeed, the data presented for immunological studies is preliminary. It has been acknowledged by the reviewers that our analysis providing insights into the biosynthetic pathways involved in comprehensive in dealing with organization and dynamics of the β-1,6-glucan polymer in relation with other cell wall components and environmental conditions (temperature, stress, nutrient availability, etc.). However, we anticipated that there would be immediate curiosity as to what the immunological contribution of β-1,6 glucan and we therefore felt we needed to initiative these studies and include them. We therefore performed immunological studies to assess whether β-1,6-glucans act as a pathogen-associated molecular pattern (PAMP), and if so, what its immunostimulatory potential is. Our data clearly suggest that β-1,6-glucan is a PAMP, and consequently lead to several questions: (a) what are the host immune receptors involved in the recognition of this polysaccharide, and thereby the downstream signaling pathways, (b) how is β-1,6-glucan differentially recognized by the host when C. albicans switches from a commensal to an opportunistic pathogen, and (c) how does the host environment impact the exposure of this polysaccharide on the fungal surface. We believe addressing these questions is beyond the scope of the present manuscript and aim to present new data in future manuscript. Nonetheless, in the revised manuscript, suggest approaches that we can take to identify the receptor that could be involved in the recognition of β-1,6-glucan. Moreover, we have modified the discussion presenting it based on the data rather than being descriptive.    

      (2) It will be interesting to assess the organization of β-1,6-glucan and other cell wall components in the opaque cells. It is documented that the opaque cells are induced at acidic pH and in the presence of N-acetylglucosamine and CO2. Our data shows that pH has an impact on β-1,6-glucan, which suggests that there will be differential organization of this polysaccharide in the cell wall of opaque cells. As suggested by the reviewer, we will include analysis of opaque cells (and other C. albicans cell types) in future studies.

      With the exception of these major new avenues for this research, our revision can address each of the comments provided by the reviewers.

    1. Author response:

      Reviewer #1 (Public Review): 

      Summary: 

      In this study, Masroor Ahmad Paddar and his/her colleagues explore the noncanonical roles of ATG5 and membrane ATG8ylation in regulating retromer assembly and function. They begin by examining the interactomes of ATG5 and expand the scope of these effects to include homeostatic responses to membrane stress and damage. 

      Strengths: 

      This study provides novel insights into the noncanonical function of ATG8ylation in endosomal cargo sorting process. 

      Weaknesses: 

      The direct mechanism by which ATG8ylation regulates the retromer remains unsolved. 

      We agree with the reviewer.  We do however show how at least one aspect of ATG8ylation contributes to the proper retromer function, which occurs via lysosomal membrane maintenance and repair. Understanding the more direct effects on retromer will require a separate study. We will emphasize this in the revised manuscript and point out the limitations of the present work.

      Reviewer #2 (Public Review): 

      Summary:

      Padder et al. demonstrate that ATG5 mediates lysosomal repair via the recruitment of the retromer components during LLOMe-induced lysosomal damage and that mAtg8-ylation contributes to retromer-dependent cargo sorting of GLUT1. Although previous studies have suggested that during glucose withdrawal, classical autophagy contributes to retromer-dependent GLUT1 surface trafficking via interactions between LC3A and TBC1D5, the experiments here demonstrate that during basal conditions or lysosomal damage, ATGs that are not involved in mATG8ylation, such as FIP200, are not functionally required for retromer-dependent sorting of GLUT1. Overall, these studies suggest a unique role for ATG5 in the control of retromer function, and that conjugation of ATG8 to single membranes (CASM) is a partial contributor to these phenotypes. 

      Strengths: 

      (1) Overall, these studies suggest a unique non-autophagic role for ATG5 in the control of retromer function. They also demonstrate that conjugation of ATG8 to single membranes (CASM) is a partial contributor to these phenotypes. Overall, these data point to a new role for ATG5 and CASM-dependent mATG8ylation in lysosomal membrane repair and trafficking. 

      (2) Although the studies are overall supportive of the proposed model that the retromer is controlled by CASM-dependent mATG8-ylaytion, it is noteworthy that previous studies of GLUT1 trafficking during glucose withdrawal (Roy et al. Mol Cell, PMID: 28602638) were predominantly conducted in cells lacking ATG5 or ATG7, which would not be able to discriminate between a CASM-dependent vs. canonical autophagy-dependent pathway in the control of GLUT1 sorting. Is the lack of GLUT1 mis-sorting to lysosomes observed in FIP200 and ATG13KO cells also observed during glucose withdrawal? Notably, deficiencies in glycolysis and glucose-dependent growth have been reported in FIP200 deficient fibroblasts (Wei et al. G&D, PMID: 21764854) so there may be differences in regulation dependent on the stress imposed on a cell. 

      We thank the reviewer on the overall assessment of the strengths of the study.

      We have discussed in the manuscript the elegant study by Roy et al., PMID 28602683. To accommodate reviewer’s comment, we will additionally emphasize in the text that our study is focused on basal conditions and conditions that perturb endolysosomal compartments. We agree with the reviewer that under metabolic stress conditions (such as glucose limitation) more complex pathways may be engaged and will acknowledge that in the discussion.

      Weaknesses: 

      (1) Additional controls are needed to clarify the role of CASM in the control of retromer function. Because the manuscript proposes both CASM-dependent and independent pathways in the ATG5 mediated regulation of the retromer, it is important to provide robust evidence that CASM is required for retromer-dependent GLUT1 sorting to the plasma membrane vs. lysosome. The experiments with monsensin in Fig. 7C-E are consistent with but not unequivocally corroborative of a role for CASM.

      We fully agree with the reviewer. In fact, our data with bafilomycin A1 treatment causing GLUT1 miss-sorting (manuscript line 317) show that it is the perturbance of lysosomes  and not CASM per se that leads to mis-sorting of GLUT1 (Fig. 7D,E). Note that it has been shown (PMIDs: 28296541, 25484071 and 37796195) that although bafilomycin A1 deacidifies lysosomes it does not induce but instead inhibits CASM. This is because bafilomycin A1 cases dissociation of V1 and V0 sectors of V-ATPase, unlike other CASM-inducing agents which promote V1 V0 association. Complementing this, our data with ATG2AB DKO and ESCRT VPS37A KO (Fig. 8A-F) indicate that the repair of lysosomes is important to keep the retromer machinery functional (as illustrated in Fig. 8G). This may be one of the effector mechanisms downstream of membrane atg8ylation in general and hence also downstream of CASM. We will revise Fig. 7 title to read “Lysosomal damage causes GLUT1 mis-sorting” and will explain these relationships in the text.

      Based on the results shown with ATG16KO in Fig 4A-D, rescue experiments of these 16KO cells with WT vs. C-terminal WD40 mutant versions of ATG16 will specifically assess the requirement for CASM and potentially provide more rigorous support for the conclusions drawn. 

      We will carry out the experiment proposed by the reviewer for the planned revision.

      (2) Also, the role of TBC1D5 should be further clarified. In Fig S7, are there any changes in the interactions between TBC1D5 and VPS35 in response to LLOMe or other agents utilized to induce CASM?

      We thank the reviewer for pointing this out. We do have data with VPS35 in co-IPs shown in Fig. S7.  There is no change in the amounts of VPS35 or TBC1D5 in GFP-LC3A co-IPs. We will include a graph with quantification in the revised manuscript and emphasize this point.

      Does TBC1D5 loss-of-function modulate the numbers of GLUT1 and Gal3 puncta observed in ATG5 deficient cells in response to LLOMe? 

      We agree that TBC1D5 is an interesting aspect. However, because TBC1D5 does not change its interactions in the experiments in our study, we consider this topic (i.e. whether TBC1D5 phenocopies VPS35 and ATG5 KOs in its effects on Gal3) to be beyond the scope of the present work. We underscore that LLOMe (lysosomal damage) mis-sorts GLUT1 even without any genetic intervention (e.g., in WT cells in the absence of ATG5 KO; Fig. 7). Thus, in our opinion the effects of TBC1D5 inactivation may be a moot point.

      (3) Finally, the studies here are motivated by experiments in Fig. S1 (as well as other studies from the Deretic and Stallings labs) suggesting unique autophagy-independent functions for ATG5 in myeloid cells and neutrophils in susceptibility to Mycobacterium tuberculosis infection. However, it is curious that no attempt is made to relate the mechanistic data regarding the retromer or GLUT1 receptor mis-sorting back to the infectious models. Do myeloid cells or neutrophils lacking ATG5 have deficiencies in glucose uptake or GLUT1 cell surface levels? 

      Reviewer’s point is well taken. Glucose uptake, its metabolism, and diabetes underly resurgence in TB in certain populations and are important factors in a range of other diseases. This was alluded to in our discussion (lines 461-469). However, these are complex topics for future studies. We will expand this section of the discussion.

      Reviewer #3 (Public Review): 

      In this manuscript, Padder et al. used APEX2 proximity labeling to find an interaction between ATG5 and the core components of the Retromer complex, VPS26, VPS29, and VPS35. Further studies revealed that ATG5 KO inhibited the trafficking of GLUT1 to the plasma membrane. They also found that other autophagy genes involved in membrane atg8ylation affected GLUT1 sorting. However, knocking out other essential autophagy genes such as ATG13 and FIP200 did not affect GLUT1 sorting. These findings suggest that ATG5 participates in the function of the Retromer in a noncanonical autophagy manner. Overall, the methods and techniques employed by the authors largely support their conclusions. These findings are intriguing and significant, enriching our understanding of the non-autophagic functions of autophagy proteins and the sorting of GLUT1. Nevertheless, there are several issues that the authors need to address to further clarify their conclusions. 

      (1) The authors confirmed the interaction between Atg5 and the Retromer complex through Co-IP experiments. Is the interaction between Atg5 and the Retromer direct? If it is direct, which Retromer complex protein regulates the interaction with Atg5? Additionally, does ATG5 K130R mutant enhance its interaction with the Retromer? 

      AlphaFold modeling in the initial submission of our study to eLife (absent from the current version) suggested the possibility of a direct interaction between ATG5 and VPS35 with ATG12—ATG5 complex facing outwards, in which case K130R would not matter. However, mutational experiments in putative contact residues did not alter association in co-IPs. So either ATG5 interacts with other retromer subunits or more likely is in a larger protein complex containing retromer. It will take a separate study to dissect associations and find direct interaction partners. We can provide our data on the currently available modeling and mutational analyses in a full point-for-point rebuttal but believe that since they are inconclusive, they should not be included in the study.

      (2) To more directly elucidate how ATG5 regulates Retromer function by interacting with the Retromer and participates in the trafficking of GLUT1 to the plasma membrane, the authors should identify which region or crucial amino acid residues of ATG5 regulate its interaction with the Retromer. Additionally, they should test whether mutations in ATG5 that disrupt its interaction with the Retromer affect Retromer function (such as participating in the trafficking of GLUT1 to the plasma membrane) and whether they affect Atg8ylation. They also need to assess whether these mutations influence canonical autophagy and lysosomal sensitivity to damage. 

      Please see the response to point 1.

      We thank the editors and reviewers for their assessment, constructive criticisms and recommendations.

    1. Author response:

      Public Reviews:

      Reviewer #1 (Public Review): 

      By mapping H3K4me2 in mouse oocytes and pre-implantation embryos, the authors aim to elucidate how this histone modification is erased and re-established during the parental-to-zygotic transition, as well as how the reprogramming of H3K4me2 regulates gene expression and facilitates zygotic genome activation.

      Employing an improved CUT&RUN approach, the authors successfully generated H3K4me2 profiling data from a limited number of embryos. While the profiling experiments are very well executed, several weaknesses, particularly in data analysis, are apparent:

      (1) The study emphasizes H3K4me2, which often serves as a precursor to H3K4me3, a well-studied modification during early development. Analyzing the new H3K4me2 dataset alongside published H3K4me3 data is crucial for comprehensively understanding epigenetic reprogramming post-fertilization and the interplay between histone modifications. However, the current analysis is preliminary and lacks depth.

      Thank you very much for your valuable suggestions. The data of histone H3K4me3 in humans and mice has been published,and our previous data revealed the unique pattern of H3K4me3 during early human embryos and oocytes (Xia et al., 2019). So, this study mainly focuses on the localization of H3K4me2 in mouse oocytes and preimplantation embryos, how it is erased and re-established during mammalian parental-to-zygote transition, and its function. The combined analysis of H3K4me2 and H3K4me3 is not our main work, but it is not ruled out that there may be new discoveries between these two histones. Previously, our data tended to show that the H3K4me2 not only acts as a precursor of H3K4me3, but also plays its role independently.

      (2) Tranylcypromine (TCP) is known as an irreversible inhibitor of monoamine oxidase and LSD1. While the authors suggest TCP inhibits the expression of LSD2, this assertion is questionable. Given TCP's potential non-specific effects in cells, conclusions related to the experiments using TCP should be made with caution.

      Thank you for pointing this out, and we thank the reviewer again for the important suggestion. We found that the previous study indicated that TCP was a non-reversible inhibitor of LSD1 and LSD2, but according to our data, the content of LSD1 was very low in the early stages of mouse embryos, which mainly inhibited the function of LSD2. (Binda et al., 2010; Fang et al., 2010 )

      (3) Some batches of H3K4me2 antibody are known to cross-react with H3K4me3. Has the H3K4me2 antibody used in CUT&RUN been tested for such cross-reactivity? Heatmaps in the figures indeed show similar distribution for H3K4me2 and H3K4me3, further raising concerns about antibody specificity.

      We thank the reviewer for the insightful comments. The H3K4me2 antibody was purchased from Millipore (cat. 07030). Figure 2A shows the specific enrichment area of H3K4me2 in promoter and distal region. Some batches of H3K4me2 antibody are known to cross-react with H3K4me3, but the H3K4me2 antibody we used in our CUT&RUN seems to have Low cross-reactivity.

      (4) Certain statements lack supporting references or figures (examples on page 9 can be found on line 245, line 254, and line 258).

      Thank you for pointing this out, and we will add references to support the statement in the paper as suggested.

      (5) Extensive language editing is recommended to clarify ambiguous sentences. Additionally, caution should be taken to avoid overstatement - most analyses in this study only suggest correlation rather than causality.

      Thank you for your kind comments. We will revise the expression in the manuscript later.

      Reviewer #2 (Public Review):

      Chong Wang et al. investigated the role of H3K4me2 during the reprogramming processes in mouse preimplantation embryos. The authors show that H3K4me2 is erased from GV to MII oocytes and re-established in the late 2-cell stage by performing Cut & Run H3K4me2 and immunofluorescence staining. Erasure and re-establishment of H3K4me2 have not been studied well, and profiling of H3K4me2 in germ cells and preimplantation embryos is valuable to understanding the reprogramming process and epigenetic inheritance.

      (1) The authors claim that the Cut & Run worked for MII oocytes, zygotes, and the 2-cell embryos. However, it is unclear if H3K4me2 is erased during the stage or if the Cut & Run did not work for these samples. To support the hypothesis of the erasure of H3K4me2, the authors conducted immunofluorescence staining, and H3k4me2 was undetected in the MII oocyte, PN5, and 2-cell stage. However, the published papers showed strong staining of H3K4me2 at the zygote stage and 2-cell stage ((Ancelin et al., 2016; Shao et al., 2014)). The authors need to cite these papers and discuss the contradictory findings.

      The authors used 165 MII oocytes and 190 GV oocytes for the Cut & Run. The amount of DNA in MII oocytes is halved because of the emission of the first polar body. Would it be a reason that H3K4me2 has fewer H3K4me2 peaks in MII oocytes than GV oocytes?

      First of all, thank you for your valuable advice. The published papers showed strong staining of H3K4me2 at the zygote stage and 2-cell stage, which is interesting. I think we may have used different parameters in the confocal laser shooting process(Ancelin et al., 2016). We used the same parameter to continuously shoot the blastocyst stage from the GV stage. If we only shot the fertilized egg and the 2-cell stage, I think we may also see weak fluorescence at the 2-cell stage under different parameters. We will refer to this reference and discuss it in the resubmitted version.

      Moreover, you mentioned the H3K4me2 has fewer H3K4me2 peaks in MII oocytes than GV oocytes, because the MII expelled the polar body. There is no problem with this logic. However, the first polar body expelled from the MII stage is still in the zona pellucida, and we also collected the polar body in the CUT&RUN experiment; Therefore, compared to GV, the DNA content of MII samples is not halved. After further discussion, we believe that the reduction of H3K4me2 peaks in MII stage compared with GV stage may be closely related to oocyte maturation. It is the specific modification of histones in different forms at different times that affects the chromatin structure change appropriately with the different stages of meiosis. At present, it has been confirmed that H3K4me3 gradually decreases from GV to MII stage during the maturation of human oocytes. H3K27me3 did not change from GV to MII stage.

      In Figure 3C, 98% (13,183/13,428) of H3K4me2 marked genes in GV oocytes overlap with those in the 4-cell stage. Furthermore, 92% (14,049/15,112) of H3K4me2 marked genes in sperm overlap with those in the 4-cell stage. Therefore, most regions maintain germ line-derived H3K4me2 in the 4-cell stage. The authors need to clarify which regions of germ line-derived H3K4me2 are maintained or erased in preimplantation embryos. Additionally, it would be interesting to investigate which regions show the parental allele-specific H3K4me2 in preimplantation embryos since the authors used hybrid preimplantation embryos (B6 x DBA).

      Thank you very much for your suggestion. Further analysis of which regions show the parental allele-specific H3K4me2 in preimplantation embryos will make the study more interesting. We will discuss this in depth in resubmitted vision.

      (2) The authors claim that Kdm1a is rarely expressed during mouse embryonic development (Figure 4A). However, the published paper showed that KDM1a is present in the zygote and 2-cell stage using immunostaining and western blotting ((Ancelin et al., 2016)). Additionally, this paper showed that depletion of maternal KDM1A protein results in developmental arrest at the two-cell stage, and therefore, KDM1a is functionally important in early development. The authors should have cited the paper and described the role of KDM1a in early embryos.

      In the analysis of this experiment, we believe that in the early embryonic development of mice, the expression of KDM1A is lower than that of KDM1B, which is relative. Similarly, the transcriptome data we cite also show that KDM1A is expressed at elevated levels during oocyte maturation and fertilization compared to immature oocytes. In addition, the effects of loss of maternal KDM1a on embryonic development were not discussed. We believe that the absence of maternal KDM1b blocks embryonic development, and we will cite and discus the references later.

      (3) The authors used the published RNA data set and interpreted that KDM1B (LSD2) was highly expressed at the MII stage (Figure S3A). However, the heat map shows that KDM1B expression is high in growing oocytes but not at 8w_oocytes and MII oocytes. The authors need to interpret the data accurately.

      After re-checking the data, we found that there was a problem with the normalization method of our heat map, and we will re-make the heatmap and submit it in the modified version. With reference to Figure 4A, the content of Kdm1b is indeed higher than that of Kdm1a.

      (4) All embryos in the TCP group were arrested at the four-cell stage. Embryos generated from KDM1b KO females can survive until E10.5 (Ciccone et al., 2009); therefore, TCP-treated embryos show a more severe phenotype than oocyte-derived KDM1b deleted embryos. Depletion of maternal KDM1A protein results in developmental arrest at the two-cell stage ((Ancelin et al., 2016)). The authors need to examine whether TCP treatment affects KDM1a expression. Western blotting would be recommended to quantify the expression of KDM1A and KDM1B in the TCP-treated embryos.

      We will further dig the transcriptome data to confirm the specificity of TCP to KDM1b. In addition, the intervention of TCP on the whole fertilized egg in this study increased the H3K4me2 content, and the embryo development retarding effect was more significant than that obtained by crossing with normal paternal lines after knocking down KDM1B from the mother.

      (5) H3K4me2 is increased dramatically in the TCP-treated embryos in Figure 4 (the intensity is 1,000 times more than the control). However, the Cut & Run H3K4me2 shows that the H3K4me2 signal is increased in 251 genes and decreased in 194 genes in the TCP-treated embryos (Fold changes > 2, P < 0.01). The authors need to explain why the gain of H3K4me2 is less evident in the Cut & Run data set than in the immunofluorescence result.

      Thanks a lot for your question. In the experimental group, the fluorescence value of H3K4me2 in IF was increased by 1000 times (Figure 4E), and the expression of H3K4Me2-related genes in CR was up-regulated and down-regulated for a total of 445 changes (Figure 6A). In our opinion, as a semi-quantitative analysis, immunofluorescence cannot be compared with the quantitative analysis method of CR because of the different analysis models and threshold Settings.

      References

      Ancelin, K., ne Syx, L., Borensztein, M., mie Ranisavljevic, N., Vassilev, I., Briseñ o-Roa, L., Liu, T., Metzger, E., Servant, N., Barillot, E., Chen, C.-J., Schü le, R., & Heard, E. (2016). Maternal LSD1/KDM1A is an essential regulator of chromatin and transcription landscapes during zygotic genome activation. https://doi.org/10.7554/eLife.08851.001

      Ciccone, D. N., Su, H., Hevi, S., Gay, F., Lei, H., Bajko, J., Xu, G., Li, E., & Chen, T. (2009). KDM1B is a histone H3K4 demethylase required to establish maternal genomic imprints. Nature, 461(7262), 415-418. https://doi.org/10.1038/nature08315

      Shao, G. B., Chen, J. C., Zhang, L. P., Huang, P., Lu, H. Y., Jin, J., Gong, A. H., & Sang, J. R. (2014). Dynamic patterns of histone H3 lysine 4 methyltransferases and demethylases during mouse preimplantation development. In Vitro Cellular and Developmental Biology - Animal, 50(7), 603-613. https://doi.org/10.1007/s11626-014-9741-6

      References

      Xia W, Xu J, Yu G, Yao G, Xu K, Ma X, Zhang N, Liu B, Li T, Lin Z, Chen X, Li L, Wang Q, Shi D, Shi S, Zhang Y, Song W, Jin H, Hu L, Bu Z, Wang Y, Na J, Xie W, Sun YP. Resetting histone modifications during human parental-to-zygotic transition. Science. 2019 Jul 26;365(6451):353-360. doi: 10.1126/science.aaw5118. Epub 2019 Jul 4. PMID: 31273069.

      Binda C, Valente S, Romanenghi M, Pilotto S, Cirilli R, Karytinos A, Ciossani G, Botrugno OA, Forneris F, Tardugno M, Edmondson DE, Minucci S, Mattevi A, Mai A. Biochemical, structural, and biological evaluation of tranylcypromine derivatives as inhibitors of histone demethylases LSD1 and LSD2. J Am Chem Soc. 2010 May 19;132(19):6827-33.

      Fang R, Barbera AJ, Xu Y, Rutenberg M, Leonor T, Bi Q, Lan F, Mei P, Yuan GC, Lian C, Peng J, Cheng D, Sui G, Kaiser UB, Shi Y, Shi YG. Human LSD2/KDM1b/AOF1 regulates gene transcription by modulating intragenic H3K4me2 methylation. Mol Cell. 2010 Jul 30;39(2):222-33. doi: 10.1016/j.molcel.2010.07.008. PMID: 20670891; PMCID: PMC3518444.

      Ancelin K, Syx L, Borensztein M, Ranisavljevic N, Vassilev I, Briseño-Roa L, Liu T, Metzger E, Servant N, Barillot E, Chen CJ, Schüle R, Heard E. Maternal LSD1/KDM1A is an essential regulator of chromatin and transcription landscapes during zygotic genome activation. Elife. 2016 Feb 2;5:e08851. doi: 10.7554/eLife.08851. PMID: 26836306; PMCID: PMC4829419.

      Reviewer #3 (Public Review):

      Summary:

      This study explores the dynamic reprogramming of histone modification H3K4me2 during the early stages of mammalian embryogenesis. Utilizing the advanced CUT&RUN technique coupled with high-throughput sequencing, the authors investigate the erasure and re-establishment of H3K4me2 in mouse germinal vesicle (GV) oocytes, metaphase II (MII) oocytes, and early embryos.

      Strengths:

      The findings provide valuable insights into the temporal and spatial dynamics of H3K4me2 and its potential role in zygotic genome activation (ZGA).

      Weaknesses:

      The study primarily remains descriptive at this point. It would be advantageous to conduct further comprehensive functional validation and mechanistic exploration.

      Key areas for improvement include enhancing the innovation and novelty of the study, providing robust functional validation, establishing a clear model for H3K4me2's role, and addressing technical and presentation issues. The text would benefit from the introduction of a novel conceptual framework or model that provides a clear explanation of the functional consequences and molecular mechanisms underlying H3K4me2 reprogramming in the transition from parental to early embryonic development.

      While the findings are significant, the current manuscript falls short in several critical areas. Addressing major and minor issues will significantly strengthen the study's contribution to the field of epigenetic reprogramming and embryonic development.

    1. Author response:

      The following is the authors’ response to the current reviews.

      Reviewer #1 (Public Review):

      The authors did a great job addressing the weaknesses I raised in the previous round of review, except on the generalizability of the current result in the larger context of multi-attribute decision-making. It is not really a weakness of the manuscript but more of a limitation of the studied topic, so I want to keep this comment for public readers.

      The reward magnitude and probability information are displayed using rectangular bars of different colors and orientations. Would that bias subjects to choose an additive rule instead of the multiplicative rule? Also, could the conclusion be extended to other decision contexts such as quality and price, where a multiplicative rule is hard to formulate?

      We thank the reviewer for the comment. With regards whether the current type of stimuli may have biased participants to use an additive rule rather, we believe many other forms of stimuli for representing choice attributes would be equally likely to cause a similar bias. This is because the additive strategy is an inherently simplistic and natural way to integrate different pieces of non-interacting information. More importantly, even though it is easy to employ an additive strategy, most participants still demonstrated some levels of employing the multiplicative rule. However, it would indeed be interesting for future studies to explore whether the current composite model remains dominant in situations where the optimal solutions require an additive or subtractive rule, such as those concerning quality and price.

      “The same would apply even with a different choice of cues as long as the information is conveyed by two independent visual features.”

      “While the additive strategy is a natural and simple approach for integrating non-interacting pieces of information, to some extent, participants also used the multiplicative strategy that was optimal in the current experiment. A general question for such composite models is whether people mix two strategies in a consistent manner on every trial or whether there is some form of probabilistic selection occurring between the two strategies on each trial such that only one strategy is used on any given trial while, on average, one strategy is more probable than the other. It would also be interesting to examine whether a composite model is appropriate in contexts where the optimal solution is additive or subtractive, such as those concerning quality and price.”


      The following is the authors’ response to the original reviews.

      Reviewer #1 (Public Review):

      Summary:

      The current study provided a follow-up analysis using published datasets focused on the individual variability of both the distraction effect (size and direction) and the attribute integration style, as well as the association between the two. The authors tried to answer the question of whether the multiplicative attribute integration style concurs with a more pronounced and positively oriented distraction effect.

      Strengths:

      The analysis extensively examined the impacts of various factors on decision accuracy, with a particular focus on using two-option trials as control trials, following the approach established by Cao & Tsetsos (2022). The statistical significance results were clearly reported.

      The authors meticulously conducted supplementary examinations, incorporating the additional term HV+LV into GLM3. Furthermore, they replaced the utility function from the expected value model with values from the composite model.

      We thank the reviewer for the positive response and are pleased that the reviewer found our report interesting.

      Reviewer #1 Comment 1

      Weaknesses:

      There are several weaknesses in terms of theoretical arguments and statistical analyses.

      First, the manuscript suggests in the abstract and at the beginning of the introduction that the study reconciled the "different claims" about "whether distraction effect operates at the level of options' component attributes rather than at the level of their overall value" (see line 13-14), but the analysis conducted was not for that purpose. Integrating choice attributes in either an additive or multiplicative way only reflects individual differences in combining attributes into the overall value. The authors seemed to assume that the multiplicative way generated the overall value ("Individuals who tended to use a multiplicative approach, and hence focused on overall value", line 20-21), but such implicit assumption is at odds with the statement in line 77-79 that people may use a simpler additive rule to combine attributes, which means overall value can come from the additive rule.

      We thank the reviewer for the comment. We have made adjustments to the manuscript to ensure that the message delivered within this manuscript is consistent. Within this manuscript, our primary focus is on the different methods of value integration in which the overall value is computed (i.e., additive, multiplicative, or both), rather than the interaction at the individual level of attributes. However, we do not exclude the possibility that the distractor effect may occur at multiple levels. Nevertheless, in light of the reviewer’s comment, we agree that we should focus the argument on whether distractors facilitate or impair decision making and downplay the separate argument about the level at which distractor effects operate. We have now revised the abstract:

      “It is widely agreed that people make irrational decisions in the presence of irrelevant distractor options. However, there is little consensus on whether decision making is facilitated or impaired by the presence of a highly rewarding distractor or whether the distraction effect operates at the level of options’ component attributes rather than at the level of their overall value. To reconcile different claims, we argue that it is important to incorporate consideration of the diversity of people’s ways of decision making. We focus on a recent debate over whether people combine choice attributes in an additive or multiplicative way. Employing a multi-laboratory dataset investigating the same decision making paradigm, we demonstrated that people used a mix of both approaches and the extent to which approach was used varied across individuals. Critically, we identified that this variability was correlated with the effect of the distractor on decision making. Individuals who tended to use a multiplicative approach to compute value, showed a positive distractor effect. In contrast, in individuals who tended to use an additive approach, a negative distractor effect (divisive normalisation) was prominent. These findings suggest that the distractor effect is related to how value is constructed, which in turn may be influenced by task and subject specificities. Our work concurs with recent behavioural and neuroscience findings that multiple distractor effects co-exist.” (Lines 12-26)

      Furthermore, we acknowledge that the current description of the additive rule could be interpreted in several ways. The current additive utility model described as:

      where  is the options’ utility,  is the reward magnitude,  is the probability, and  is the magnitude/probability weighing ratio . If we perform comparison between values according to this model (i.e., HV against LV), we would arrive at the following comparison:

      If we rearrange (1), we will arrive at:

      While equations (1) and (2) are mathematically equivalent, equation (1) illustrates the interpretation where the comparison of the utilities occurs after value integration and forming an overall value. On the other hand, equation (2) can be broadly interpreted as the comparison of individual attributes in the absence of an overall value estimate for each option. Nonetheless, while we do not exclude the possibility that the distractor effect may occur at multiple levels, we have made modifications to the main manuscript employ more consistently a terminology referring to different methods of value estimation while recognizing that our empirical results are compatible with both interpretations.

      Reviewer #1 Comment 2

      The second weakness is sort of related but is more about the lack of coherent conceptual understanding of the "additive rule", or "distractor effect operates at the attribute level". In an assertive tone (lines 77-80), the manuscript suggests that a weighted sum integration procedure of implementing an "additive rule" is equal to assuming that people compare pairs of attributes separately, without integration. But they are mechanistically distinct. The additive rule (implemented using the weighted sum rule to combine probability and magnitude within each option and then applying the softmax function) assumes value exists before comparing options. In contrast, if people compare pairs of attributes separately, preference forms based on the within-attribute comparisons. Mathematically these two might be equivalent only if no extra mechanisms (such as inhibition, fluctuating attention, evidence accumulation, etc) are included in the within-attribute comparison process, which is hardly true in the three-option decision.

      We thank the reviewer for the comment. As described in our response to Reviewer #1 Comment 1, we are aware and acknowledge that there may be multiple possible interpretations of the additive rule. We also agree with the reviewer that there may be additional mechanisms that are involved in three- or even two- option decisions, but these would require additional studies to tease apart. Another motivation for the approach used here, which does not explicitly model the extra mechanisms the reviewer refers to was due to the intention of addressing and integrating findings from previous studies using the same dataset [i.e. (Cao & Tsetsos, 2022; Chau et al., 2020)]. Lastly, regardless of the mechanistic interpretation, our results show a systematic difference in the process of value estimation. Modifications to the manuscript text have been made consistent with our motivation (please refer to the reply and the textual changes proposed in response to the reviewer’s previous comment: Reviewer #1 Comment 1).

      Reviewer #1 Comment 3

      Could the authors comment on the generalizability of the current result? The reward magnitude and probability information are displayed using rectangular bars of different colors and orientations. Would that bias subjects to choose an additive rule instead of the multiplicative rule? Also, could the conclusion be extended to other decision contexts such as quality and price, whether a multiplicative rule is hard to formulate?

      We thank the reviewer for the comment. We agree with the observation that the stimulus space, with colour linearly correlated with magnitude, and orientation linearly correlated with probability, may bias subjects towards an additive rule. But that’s indeed the point: in order to maximise reward, subjects should have focused on the outcome space without being driven by the stimulus space. In practice, people are more or less successful in such endeavour. Nevertheless, we argue that the specific choice of visual stimuli we used is no more biased towards additive space than any other. In fact, as long as two or more pieces of information are provided for each option, as opposed to a single cue whose value was previously learned, there will always be a bias towards an additive heuristic (a linear combination), regardless of whether the cues are shapes, colours, graphs, numbers, words.

      As the reviewer suggested, the dataset analyzed in the current manuscript suggests that the participants were leaning towards the additive rule. Although there was a general tendency using the additive rule while choosing between the rectangular bars, we can still observe a spread of individuals using either, or both, additive and multiplicative rules, suggesting that there was indeed diversity in participants’ decision making strategies in our data.

      In previous studies, it was observed that human and non-human individuals used a mix of multiplicative and additive rules when they were tested on experimental paradigms different from ours (Bongioanni et al., 2021; Farashahi et al., 2019; Scholl et al., 2014). It was also observed that positive and negative distractor effects can be both present in the same data set when human and non-human individuals made decisions about food and social partner (Chang et al., 2019; Louie et al., 2013). It was less clear in the past whether the precise way a distractor affects decision making (i.e., positive/negative distractor effect) is related to the use of decision strategy (i.e., multiplicative/additive rules) and this is exactly what we are trying to address in this manuscript. A follow-up study looking at neural data (such as functional magnetic resonance imaging data) could provide a better understanding of the mechanistic nature of the relationship between distractor effects and decision strategy that we identified here.

      We agree with the reviewer that it is true that a multiplicative strategy may not be applicable to some decision contexts. Here it is important to look at the structure of the optimal solution (the one maximizing value in the long run). Factors modulating value (such as probability and temporal delay) require a non-linear (e.g., multiplicative solution), while factors of the cost-benefit form (such as effort and price) require a linear solution (e.g., subtraction). In the latter scenario the additive heuristic would coincide with the optimal solution, and the effect addressed in this study may not be revealed. Nonetheless, the present data supports the notion of distinct neural mechanisms at least for probabilistic decision-making, and is likely applicable to decision-making in general.

      Our findings, in conjunction with the literature, also suggest that a positive distractor effect could be a general phenomenon in decision mechanisms that involve the medial prefrontal cortex. For example, it has been shown that the positive distractor effect is related to a decision mechanism linked to medial prefrontal cortex [especially the ventromedial prefrontal cortex (Chau et al., 2014; Noonan et al., 2017)]. It is also known a similar brain region is involved not only when individuals are combining information using a multiplicative strategy (Bongioanni et al., 2021), but also when they are combining information to evaluate new experience or generalize information (Baram et al., 2021; Barron et al., 2013; Park et al., 2021). We have now revised the Discussion to explain this:

      “In contrast, the positive distractor effect is mediated by the mPFC (Chau et al., 2014; Fouragnan et al., 2019). Interestingly, the same or adjacent, interconnected mPFC regions have also been linked to the mechanisms by which representational elements are integrated into new representations (Barron et al., 2013; Klein-Flügge et al., 2022; Law et al., 2023; Papageorgiou et al., 2017; Schwartenbeck et al., 2023). In a number of situations, such as multi-attribute decision making, understanding social relations, and abstract knowledge, the mPFC achieves this by using a spatial map representation characterised by a grid-like response (Constantinescu et al., 2016; Bongioanni et al., 2021; Park et al., 2021) and disrupting mPFC leads to the evaluation of composite choice options as linear functions of their components (Bongioanni et al., 2021). These observations suggest a potential link between positive distractor effects and mechanisms for evaluating multiple component options and this is consistent with the across-participant correlation that we observed between the strength of the positive distractor effect and the strength of non-additive (i.e., multiplicative) evaluation of the composite stimuli we used in the current task. Hence, one direction for model development may involve incorporating the ideas that people vary in their ways of combining choice attributes and each way is susceptible to different types of distractor effect.” (Lines 260-274)

      Reviewer #1 Comment 4

      The authors did careful analyses on quantifying the "distractor effect". While I fully agree that it is important to use the matched two-option trials and examine the interaction terms (DV-HV)T as a control, the interpretation of the results becomes tricky when looking at the effects in each trial type. Figure 2c shows a positive DV-HV effect in two-option trials whereas the DV-HV effect was not significantly stronger in three-option trials. Further in Figure 5b,c, in the Multiplicative group, the effect of DV-HV was absent in the two-option trials and present in the three-option trials. In the Additive group, however, the effect of DV-HV was significantly positive in the two-option trials but was significantly lowered in the three-option trials. Hence, it seems the different distractor effects were driven by the different effects of DV-HV in the two-option trials, rather than the three-option trials?

      We thank the reviewer for the comment. While it may be a bit more difficult to interpret, the current method of examining the (DV−HV)T term rather than (DV−HV) term was used because it was the approach used in a previous study (Cao & Tsetsos, 2022).

      During the design of the original experiments, trials were generated pseudo-randomly until the DV was sufficiently decorrelated from HV−LV. While this method allows for better group-level examination of behaviour, Cao and Tsetsos were concerned that this approach may have introduced unintended confounding covariations to some trials. In theory, one of the unintended covariations could occur between the DV and specific sets of reward magnitude and probability of the HV and LV. The covariation between parameters can lead to an observable positive distractor effect in the DV−HV as a consequence of the attraction effect or an unintended byproduct of using an additive method of integrating attributes [for further elaboration, please refer to Figure 1 in (Cao & Tsetsos, 2022)]. While it may have some limitations, the approach suggested by Cao and Tsetsos has the advantage of leveraging the DV−HV term to absorb any variance contributed by possible confounding factors such that true distractor effects, if any, can be detected using the (DV−HV)T term.

      Reviewer #1 Comment 5

      Note that the pattern described above was different in Supplementary Figure 2, where the effect of DV-HV on the two-option trials was negative for both Multiplicative and Additive groups. I would suggest considering using Supplementary Figure 2 as the main result instead of Figure 5, as it does not rely on multiplicative EV to measure the distraction effect, and it shows the same direction of DV-HV effect on two-option trials, providing a better basis to interpret the (DV-HV)T effect.

      We thank the reviewer for the comments and suggestion. However, as mentioned in the response to Reviewer #1 Comment 4, the current method of analysis adopted in the manuscript and the interpretation of only (DV−HV)T is aimed to address the possibility that the (DV−HV) term may be capturing some confounding effects due to covariation. Given that the debate that is addressed specifically concerns the (DV−HV)T term, we elected to display Figure 5 within the main text and keep the results of the regression after replacing the utility function with the composite model as Supplementary Figure 5 (previously labelled as Supplementary Figure 2).

      Reviewer #2 (Public Review):

      This paper addresses the empirical demonstration of "distractor effects" in multi-attribute decision-making. It continues a debate in the literature on the presence (or not) of these effects, which domains they arise in, and their heterogeneity across subjects. The domain of the study is a particular type of multi-attribute decision-making: choices over risky lotteries. The paper reports a re-analysis of lottery data from multiple experiments run previously by the authors and other laboratories involved in the debate.

      Methodologically, the analysis assumes a number of simple forms for how attributes are aggregated (adaptively, multiplicatively, or both) and then applies a "reduced form" logistic regression to the choices with a number of interaction terms intended to control for various features of the choice set. One of these interactions, modulated by ternary/binary treatment, is interpreted as a "distractor effect."

      The claimed contribution of the re-analysis is to demonstrate a correlation in the strength/sign of this treatment effect with another estimated parameter: the relative mixture of additive/multiplicative preferences.

      We thank the reviewer for the positive response and are pleased that the reviewer found our report interesting.

      Reviewer #2 Comment 1

      Major Issues

      (1) How to Interpret GLM 1 and 2

      This paper, and others before it, have used a binary logistic regression with a number of interaction terms to attempt to control for various features of the choice set and how they influence choice. It is important to recognize that this modelling approach is not derived from a theoretical claim about the form of the computational model that guides decision-making in this task, nor an explicit test for a distractor effect. This can be seen most clearly in the equations after line 321 and its corresponding log-likelihood after 354, which contain no parameter or test for "distractor effects". Rather the computational model assumes a binary choice probability and then shoehorns the test for distractor effects via a binary/ternary treatment interaction in a separate regression (GLM 1 and 2). This approach has already led to multiple misinterpretations in the literature (see Cao & Tsetsos, 2022; Webb et al., 2020). One of these misinterpretations occurred in the datasets the authors studied, in which the lottery stimuli contained a confound with the interaction that Chau et al., (2014) were interpreting as a distractor effect (GLM 1). Cao & Tsetsos (2022) demonstrated that the interaction was significant in binary choice data from the study, therefore it can not be caused by a third alternative. This paper attempts to address this issue with a further interaction with the binary/ternary treatment (GLM 2). Therefore the difference in the interaction across the two conditions is claimed to now be the distractor effect. The validity of this claim brings us to what exactly is meant by a "distractor effect."

      The paper begins by noting that "Rationally, choices ought to be unaffected by distractors" (line 33). This is not true. There are many normative models that allow for the value of alternatives (even low-valued "distractors") to influence choices, including a simple random utility model. Since Luce (1959), it has been known that the axiom of "Independence of Irrelevant Alternatives" (that the probability ratio between any two alternatives does not depend on a third) is an extremely strong axiom, and only a sufficiency axiom for a random utility representation (Block and Marschak, 1959). It is not a necessary condition of a utility representation, and if this is our definition of rational (which is highly debatable), not necessary for it either. Countless empirical studies have demonstrated that IIA is falsified, and a large number of models can address it, including a simple random utility model with independent normal errors (i.e. a multivariate Probit model). In fact, it is only the multinomial Logit model that imposes IIA. It is also why so much attention is paid to the asymmetric dominance effect, which is a violation of a necessary condition for random utility (the Regularity axiom).

      So what do the authors even mean by a "distractor effect." It is true that the form of IIA violations (i.e. their path through the probability simplex as the low-option varies) tells us something about the computational model underlying choice (after all, different models will predict different patterns). However we do not know how the interaction terms in the binary logit regression relate to the pattern of the violations because there is no formal theory that relates them. Any test for relative value coding is a joint test of the computational model and the form of the stochastic component (Webb et al, 2020). These interaction terms may simply be picking up substitution patterns that can be easily reconciled with some form of random utility. While we can not check all forms of random utility in these datasets (because the class of such models is large), this paper doesn't even rule any of these models out.

      We thank the reviewer for the comment. In this study, one objective is to address an issue raised by Cao and Tsetsos (2022), suggesting that the distractor effect claimed in the Chau et al. (2014) study was potentially confounded by unintended correlation introduced between the distractor and the chooseable options. They suggested that this could be tested by analyzing the control binary trials and the experimental ternary trials in a single model (i.e., GLM2) and introducing an interaction term (DV−HV)T. The interaction term can partial out any unintended confound and test the distractor effect that was present specifically in the experimental ternary trials. We adopted these procedures in our current studies and employed the interaction term to test the distractor effects. The results showed that overall there was no significant distractor effect in the group. We agree with the reviewer’s comment that if we were only analysing the ternary trials, a multinomial probit model would be suitable because it allows noise correlation between the choices. Alternatively, had a multinomial logistic model been applied, a Hausman-McFadden Test could be run to test whether the data violates the assumption of independence of irrelevant alternatives (IIA). However, in our case, a binomial model is preferred over a multinomial model because of: (1) the inclusion of the binary trials, and (2) the small number of trials in which the distractor was chosen (the median was 4% of all ternary trials).

      However, another main objective of this study is to consider the possibility that the precise distractor effect may vary across individuals. This is exactly why we employed the composite model to estimate individual’s decision making strategy and investigated how that varied with the precise way the distractor influenced decision making.

      In addition, we think that the reviewer here is raising a profound point and one with which we are in sympathy; it is true that random noise utility models can predict deviations from the IIA axiom. Central to these approaches is the notion that the representations of the values of choice options are noisy. Thus, when the representation is accessed, it might have a certain value on average but this value might vary from occasion to occasion as if each sample were being drawn from a distribution. As a consequence, the value of a distractor that is “drawn” during a decision between two other options may be larger than the distractor’s average value and may even have a value that is larger than the value drawn from the less valuable choice option’s distribution on the current trial. On such a trial it may become especially clear that the better of the two options has a higher value than the alternative choice option. Our understanding is that Webb, Louie and colleagues (Louie et al., 2013; Webb et al., 2020) suggest an explanation approximately along these lines when they reported a negative distractor effect during some decisions, i.e., they follow the predictions of divisive normalization suggesting that decisions become more random as the distractor’s value is greater.

      An alternative approach, however, assumes that rather than noise in the representation of the option itself, there is noise in the comparison process when the two options are compared. This is exemplified in many influential decision making models including evidence accumulation models such as drift diffusion models (Shadlen & Shohamy, 2016) and recurrent neural network models of decision making (Wang, 2008). It is this latter type of model that we have used in our previous investigations (Chau et al., 2020; Kohl et al., 2023). However, these two approaches are linked both in their theoretical origin and in the predictions that they make in many situations (Shadlen & Shohamy, 2016). We therefore clarify that this is the case in the revised manuscript as follows:

      “In the current study and in previous work we have used or made reference to models of decision making that assume that a noisy process of choice comparison occurs such as recurrent neural networks and drift diffusion models (Shadlen & Shohamy, 2016; Wang, 2008). Under this approach, positive distractor effects are predicted when the comparison process becomes more accurate because of an impact on the noisy process of choice comparison (Chau et al., 2020; Kohl et al., 2023). However, it is worth noting that another class of models might assume that a choice representation itself is inherently noisy. According to this approach, on any given decision a sample is drawn from a distribution of value estimates in a noisy representation of the option. Thus, when the representation is accessed, it might have a certain value on average but this value might vary from occasion to occasion. As a consequence, the value of a distractor that is “drawn” during decision between two other options may be larger than the distractor’s average value and may even have a value that is larger than the value drawn from the less valuable choice option’s distribution on the current trial. On such a trial it may become especially clear that the better of the two options has a higher value than the alternative choice option. Louie and colleagues (Louie et al., 2013) suggest an explanation approximately along these lines when they reported a positive distractor effect during some decisions. Such different approaches share theoretical origins (Shadlen & Shohamy, 2016) and make related predictions about the impact of distractors on decision making.” (Lines 297-313)

      Reviewer #2 Comment 2

      (2) How to Interpret the Composite (Mixture) model?

      On the other side of the correlation are the results from the mixture model for how decision-makers aggregate attributes. The authors report that most subjects are best represented by a mixture of additive and multiplicative aggregation models. The authors justify this with the proposal that these values are computed in different brain regions and then aggregated (which is reasonable, though raises the question of "where" if not the mPFC). However, an equally reasonable interpretation is that the improved fit of the mixture model simply reflects a misspecification of two extreme aggregation processes (additive and EV), so the log-likelihood is maximized at some point in between them.

      One possibility is a model with utility curvature. How much of this result is just due to curvature in valuation? There are many reasonable theories for why we should expect curvature in utility for human subjects (for example, limited perception: Robson, 2001, Khaw, Li Woodford, 2019; Netzer et al., 2022) and of course many empirical demonstrations of risk aversion for small stakes lotteries. The mixture model, on the other hand, has parametric flexibility.

      There is also a large literature on testing expected utility jointly with stochastic choice, and the impact of these assumptions on parameter interpretation (Loomes & Sugden, 1998; Apesteguia & Ballester, 2018; Webb, 2019). This relates back to the point above: the mixture may reflect the joint assumption of how choice departs from deterministic EV.

      We thank the reviewer for the comment. They are indeed right to mention the vast literature on curvature in subjective valuation; however it is important to stress that the predictions of the additive model with linear basis functions are quite distinct for the predictions of a multiplicative model with non-linear basis functions. We have tested the possibility that participants’ behaviour was better explained by the latter and we showed that this was not the case. Specifically, we have added and performed model fitting on an additional model with utility curvature based on prospect theory (Kahneman & Tversky, 1979) with the weighted probability function suggested by (Prelec, 1998):

      where  and  represent the reward magnitude and probability (both rescaled to the interval between 0 and 1), respectively.  is the weighted magnitude and  is the weighted probability, while  and  are the corresponding distortion parameters. This prospect theory (PT) model is included along with the four previous models (please refer to Figure 3) in a Bayesian model comparison. Results indicate that the composite model remains the best account of participants’ choice behaviour (exceedance probability = 1.000, estimated model frequency = 0.720). We have now included these results in the main text and Supplementary Figure 2:

      “Supplementary Figure 2 reports an additional Bayesian model comparison performed while including a model with nonlinear utility functions based on Prospect Theory (Kahneman & Tversky, 1979) with the Prelec formula for probability (Prelec, 1998). Consistent with the above finding, the composite model provides the best account of participants’ choice behaviour (exceedance probability = 1.000, estimated model frequency = 0.720).” (Lines 193-198)

      Reviewer #2 Comment 3

      3) So then how should we interpret the correlation that the authors report?

      On one side we have the impact of the binary/ternary treatment which demonstrates some impact of the low value alternative on a binary choice probability. This may reflect some deep flaws in existing theories of choice, or it may simply reflect some departure from purely deterministic expected value maximization that existing theories can address. We have no theory to connect it to, so we cannot tell. On the other side of the correlation, we have a mixture between additive and multiplicative preferences over risk. This result may reflect two distinct neural processes at work, or it may simply reflect a misspecification of the manner in which humans perceive and aggregate attributes of a lottery (or even just the stimuli in this experiment) by these two extreme candidates (additive vs. EV). Again, this would entail some departure from purely deterministic expected value maximization that existing theories can address.

      It is entirely possible that the authors are reporting a result that points to the more exciting of these two possibilities. But it is also possible (and perhaps more likely) that the correlation is more mundane. The paper does not guide us to theories that predict such a correlation, nor reject any existing ones. In my opinion, we should be striving for theoretically-driven analyses of datasets, where the interpretation of results is clearer.

      We thank the reviewer for their clear comments. Based on our responses to the previous comments it should be apparent that our results are consistent with several existing theories of choice, so we are not claiming that there are deep flaws in them, but distinct neural processes (additive and multiplicative) are revealed, and this does not reflect a misspecification in the modelling. We have revised our manuscript in the light of the reviewer’s comments in the hope of clarifying the theoretical background which informed both our data analysis and our data interpretation.

      First, we note that there are theoretical reasons to expect a third option might impact on choice valuation. There is a large body of work suggesting that a third option may have an impact on the values of two other options (indeed Reviewer #2 refers to some of this work in their Reviewer #2 Comment 1), but the body of theoretical work originates partly in neuroscience and not just in behavioural economics. In many sensory systems, neural activity changes with the intensity of the stimuli that are sensed. Divisive normalization in sensory systems, however, describes the way in which such neural responses are altered also as a function of other adjacent stimuli (Carandini & Heeger, 2012; Glimcher, 2022; Louie et al., 2011, 2013). The phenomenon has been observed at neural and behavioural levels as a function not just of the physical intensity of the other stimuli but as a function of their associated value (Glimcher, 2014, 2022; Louie et al., 2011, 2015; Noonan et al., 2017; Webb et al., 2020).

      Analogously there is an emerging body of work on the combinatorial processes that describe how multiple representational elements are integrated into new representations (Barron et al., 2013; Papageorgiou et al., 2017; Schwartenbeck et al., 2023). These studies have originated in neuroscience, just as was the case with divisive normalization, but they may have implications for understanding behaviour. For example, they might be linked to behavioural observations that the values assigned to bundles of goods are not necessarily the sum of the values of the individual goods (Hsee, 1998; List, 2002). One neuroscience fact that we know about such processes is that, at an anatomical level, they are linked to the medial frontal cortex (Barron et al., 2013; Fellows, 2006; Hunt et al., 2012; Papageorgiou et al., 2017; Schwartenbeck et al., 2023). A second neuroscientific fact that we know about medial frontal cortex is that it is linked to any positive effects that distractors might have on decision making (Chau et al., 2014; Noonan et al., 2017). Therefore, we might make use of these neuroscientific facts and theories to predict a correlation between positive distractor effects and non-additive mechanisms for determining the integrated value of multi-component choices. This is precisely what we did; we predicted the correlation on the basis of this body of work and when we tested to see if it was present, we found that indeed it was. It may be the case that other behavioural economics theories offer little explanation of the associations and correlations that we find. However, we emphasize that this association is predicted by neuroscientific theory and in the revised manuscript we have attempted to clarify this in the Introduction and Discussion sections:

      “Given the overlap in neuroanatomical bases underlying the different methods of value estimation and the types of distractor effects, we further explored the relationship. Critically, those who employed a more multiplicative style of integrating choice attributes also showed stronger positive distractor effects, whereas those who employed a more additive style showed negative distractor effects. These findings concur with neural data demonstrating that the medial prefrontal cortex (mPFC) computes the overall values of choices in ways that go beyond simply adding their components together, and is the neural site at which positive distractor effects emerge (Barron et al., 2013; Bongioanni et al., 2021; Chau et al., 2014; Fouragnan et al., 2019; Noonan et al., 2017; Papageorgiou et al., 2017), while divisive normalization was previously identified in the posterior parietal cortex (PPC) (Chau et al., 2014; Louie et al., 2011).” (Lines 109-119)

      “At the neuroanatomical level, the negative distractor effect is mediated by the PPC, where signal modulation described by divisive normalization has been previously identified (Chau et al., 2014; Louie et al., 2011). The same region is also crucial for perceptual decision making processes (Shadlen & Shohamy, 2016). The additive heuristics for combining choice attributes are closer to a perceptual evaluation because distances in this subjective value space correspond linearly to differences in physical attributes of the stimuli, whereas normative (multiplicative) value has a non-linear relation with them (cf. Figure 1c). It is well understood that many sensory mechanisms, such as in primates’ visual systems or fruit flies’ olfactory systems, are subject to divisive normalization (Carandini & Heeger, 2012). Hence, the additive heuristics that are more closely based on sensory mechanisms could also be subject to divisive normalization, leading to negative distractor effects in decision making.

      In contrast, the positive distractor effect is mediated by the mPFC (Chau et al., 2014; Fouragnan et al., 2019). Interestingly, the same or adjacent, interconnected mPFC regions have also been linked to the mechanisms by which representational elements are integrated into new representations (Barron et al., 2013; Klein-Flügge et al., 2022; Law et al., 2023; Papageorgiou et al., 2017; Schwartenbeck et al., 2023). In a number of situations, such as multi-attribute decision making, understanding social relations, and abstract knowledge, the mPFC achieves this by using a spatial map representation characterised by a grid-like response (Constantinescu et al., 2016; Bongioanni et al., 2021; Park et al., 2021) and disrupting mPFC leads to the evaluation of composite choice options as linear functions of their components (Bongioanni et al., 2021). These observations suggest a potential link between positive distractor effects and mechanisms for evaluating multiple component options and this is consistent with the across-participant correlation that we observed between the strength of the positive distractor effect and the strength of non-additive (i.e., multiplicative) evaluation of the composite stimuli we used in the current task. Hence, one direction for model development may involve incorporating the ideas that people vary in their ways of combining choice attributes and each way is susceptible to different types of distractor effect.” (Lines 250-274)

      Reviewer #2 Comment 4

      (4) Finally, the results from these experiments might not have external validity for two reasons. First, the normative criterion for multi-attribute decision-making differs depending on whether the attributes are lotteries or not (i.e. multiplicative vs additive). Whether it does so for humans is a matter of debate. Therefore if the result is unique to lotteries, it might not be robust for multi-attribute choice more generally. The paper largely glosses over this difference and mixes literature from both domains. Second, the lottery information was presented visually and there is literature suggesting this form of presentation might differ from numerical attributes. Which is more ecologically valid is also a matter of debate.

      We thank the reviewer for the comment. Indeed, they are right that the correlation we find between value estimation style and distractor effects may not be detected in all contexts of human behaviour. What the reviewer suggests goes along the same lines as our response to Reviewer #1 Comment 3, multi-attribute value estimation may have different structure: in some cases, the optimal solution may require a non-linear (e.g., multiplicative) response as in probabilistic or delayed decisions, but other cases (e.g., when estimating the value of a snack based on its taste, size, healthiness, price) a linear integration would suffice. In the latter kind of scenarios, both the optimal and the heuristic solutions may be additive and people’s value estimation “style” may not be teased apart. However, if different neural mechanisms associated with difference estimation processes are observed in certain scenarios, it suggests that these mechanisms are always present, even in scenarios where they do not alter the predictions. Probabilistic decision-making is also pervasive in many aspects of daily life and not just limited to the case of lotteries.

      While behaviour has been found to differ depending on whether lottery information is presented graphically or numerically, there is insufficient evidence to suggest biases towards additive or multiplicative evaluation, or towards positive or negative distractor effects. As such, we may expect that the correlation that we reveal in this paper, grounded in distinct neural mechanisms, would still hold even under different circumstances.

      Taking previous literature as examples, similar patterns of behaviour have been observed in humans when making decisions during trinary choice tasks. In a study conducted by Louie and colleagues (Louie et al., 2013; Webb et al., 2020), human participants performed a snack choice task where their behaviour could be modelled by divisive normalization with biphasic response (i.e., both positive and negative distractor effects). While these two studies only use a single numerical value of price for behavioural modelling, these prices should originate from an internal computation of various attributes related to each snack that are not purely related to lotteries. Expanding towards the social domain, studies of trinary decision making have considered face attractiveness and averageness (Furl, 2016), desirability of hiring (Chang et al., 2019), as well as desirability of candidates during voting (Chang et al., 2019). These choices involve considering various attributes unrelated to lotteries or numbers and yet, still display a combination of positive distractor and negative distractor (i.e. divisive normalization) effects, as in the current study. In particular, the experiments carried out by Chang and colleagues (Chang et al., 2019) involved decisions in a social context that resemble real-world situations. These findings suggests that both types of distractor effects can co-exist in other value based decision making tasks (Li et al., 2018; Louie et al., 2013) as well as decision making tasks in social contexts (Chang et al., 2019; Furl, 2016).

      Reviewer #2 Comment 5

      Minor Issues:

      The definition of EV as a normative choice baseline is problematic. The analysis requires that EV is the normative choice model (this is why the HV-LV gap is analyzed and the distractor effect defined in relation to it). But if the binary/ternary interaction effect can be accounted for by curvature of a value function, this should also change the definition of which lottery is HV or LV for that subject!

      We thank the reviewer for the comment. While the initial part of the paper discussed results that were defined by the EV model, the results shown in Supplementary Figure 2 were generated by replacing the utility function based on values obtained by using the composite model. Here, we have also redefined the definition of HV or LV for each subject depending on the updated value generated by the composite model prior to the regression.

      References

      Apesteguia, J. & Ballester, M. Monotone stochastic choice models: The case of risk and time preferences. Journal of Political Economy (2018).

      Block, H. D. & Marschak, J. Random Orderings and Stochastic Theories of Responses. Cowles Foundation Discussion Papers (1959).

      Khaw, M. W., Li, Z. & Woodford, M. Cognitive Imprecision and Small-Stakes Risk Aversion. Rev. Econ. Stud. 88, 1979-2013 (2020).

      Loomes, G. & Sugden, R. Testing Different Stochastic Specificationsof Risky Choice. Economica 65, 581-598 (1998).

      Luce, R. D. Indvidual Choice Behaviour. (John Wiley and Sons, Inc., 1959).

      Netzer, N., Robson, A. J., Steiner, J. & Kocourek, P. Endogenous Risk Attitudes. SSRN Electron. J. (2022) doi:10.2139/ssrn.4024773.

      Robson, A. J. Why would nature give individuals utility functions? Journal of Political Economy 109, 900-914 (2001).

      Webb, R. The (Neural) Dynamics of Stochastic Choice. Manage Sci 65, 230-255 (2019).

      Reviewer #3 (Public Review):

      Summary:

      The way an unavailable (distractor) alternative impacts decision quality is of great theoretical importance. Previous work, led by some of the authors of this study, had converged on a nuanced conclusion wherein the distractor can both improve (positive distractor effect) and reduce (negative distractor effect) decision quality, contingent upon the difficulty of the decision problem. In very recent work, Cao and Tsetsos (2022) reanalyzed all relevant previous datasets and showed that once distractor trials are referenced to binary trials (in which the distractor alternative is not shown to participants), distractor effects are absent. Cao and Tsetsos further showed that human participants heavily relied on additive (and not multiplicative) integration of rewards and probabilities.

      The present study by Wong et al. puts forward a novel thesis according to which interindividual differences in the way of combining reward attributes underlie the absence of detectable distractor effect at the group level. They re-analysed the 144 human participants and classified participants into a "multiplicative integration" group and an "additive integration" group based on a model parameter, the "integration coefficient", that interpolates between the multiplicative utility and the additive utility in a mixture model. They report that participants in the "multiplicative" group show a negative distractor effect while participants in the "additive" group show a positive distractor effect. These findings are extensively discussed in relation to the potential underlying neural mechanisms.

      Strengths:

      - The study is forward-looking, integrating previous findings well, and offering a novel proposal on how different integration strategies can lead to different choice biases.

      - The authors did an excellent job of connecting their thesis with previous neural findings. This is a very encompassing perspective that is likely to motivate new studies towards a better understanding of how humans and other animals integrate information in decisions under risk and uncertainty.

      - Despite that some aspects of the paper are very technical, methodological details are well explained and the paper is very well written.

      We thank the reviewer for the positive response and are pleased that the reviewer found our report interesting.

      Reviewer #3 Comment 1

      Weaknesses:

      The authors quantify the distractor variable as "DV - HV", i.e., the relative distractor variable. Do the conclusions hold when the distractor is quantified in absolute terms (as "DV", see also Cao & Tsetsos, 2023)? Similarly, the authors show in Suppl. Figure 1 that the inclusion of a HV + LV regressor does not alter their conclusions. However, the (HV + LV)*T regressor was not included in this analysis. Does including this interaction term alter the conclusions considering there is a high correlation between (HV + LV)*T and (DV - HV)*T? More generally, it will be valuable if the authors assess and discuss the robustness of their findings across different ways of quantifying the distractor effect.

      We thank the reviewer for the comment. In the original manuscript we had already demonstrated that the distractor effect was related to the integration coefficient using a number of complementary analyses. They include Figure 5 based on GLM2, Supplementary Figure 3 based on GLM3 (i.e., adding the HV+LV term to GLM2), and Supplementary Figure 4 based on GLM2 but applying the utility estimate from the composite model instead of expected value (EV). These three sets of analyses produced comparable results. The reason why we elected not to include the (HV+LV)T term in GLM3 (Supplementary Figure 3) was due to the collinearity between the regressors in the GLM. If this term is included in GLM3, the variance inflation factor (VIF) would exceed an acceptable level of 4 for some regressors. In particular, the VIF for the (HV+LV) and (HV+LV)T regressors is 5.420, while the VIF for (DV−HV) and (DV−HV)T is 4.723.

      Here, however, we consider the additional analysis suggested by the reviewer and test whether similar results are obtained. We constructed GLM4 including the (HV+LV)T term but replacing the relative distractor value (DV-HV) with the absolute distractor value (DV) in the main term and its interactions, as follows:

      GLM4:

      A significant negative (DV)T effect was found for the additive group [t(72)=−2.0253, p=0.0465] while the multiplicative group had a positive trend despite not reaching significance. Between the two groups, the (DV)T term was significantly different [t(142)=2.0434, p=0.0429]. While these findings suggest that the current conclusions could be partially replicated, simply replacing the relative distractor value with the absolute value in the previous analyses resulted in non-significant findings. Taking these results together with the main findings, it is possible to conclude that the positive distractor effect is better captured using the relative DV-HV term rather than the absolute DV term. This would be consistent with the way in which option values are envisaged to interact with one another in the mutual inhibition model (Chau et al., 2014, 2020) that generates the positive distractor effect. The model suggests that evidence is accumulated as the difference between the excitatory input from the option (e.g. the HV option) and the pooled inhibition contributed partly by the distractor. We have now included these results in the manuscript:

      “Finally, we performed three additional analyses that revealed comparable results to those shown in Figure 5. In the first analysis, reported in Supplementary Figure 3, we added an  term to the GLM, because this term was included in some analyses of a previous study that used the same dataset (Chau et al., 2020). In the second analysis, we added an  term to the GLM. We noticed that this change led to inflation of the collinearity between the regressors and so we also replaced the (DV−HV) term by the DV term to mitigate the collinearity (Supplementary Figure 4). In the third analyses, reported in Supplementary Figure 5, we replaced the utility terms of GLM2. Since the above analyses involved using HV, LV, and DV values defined by the normative Expected Value model, here, we re-defined the values using the composite model prior to applying GLM2. Overall, in the Multiplicative Group a significant positive distractor effect was found in Supplementary Figures 3 and 4. In the Additive Group a significant negative distractor effect was found in Supplementary Figures 3 and 5. Crucially, all three analyses consistently showed that the distractor effects were significantly different between the Multiplicative Group and the Additive Group.” (Lines 225-237)

      Reviewer #3 Comment 2

      The central finding of this study is that participants who integrate reward attributes multiplicatively show a positive distractor effect while participants who integrate additively show a negative distractor effect. This is a very interesting and intriguing observation. However, there is no explanation as to why the integration strategy covaries with the direction of the distractor effect. It is unlikely that the mixture model generates any distractor effect as it combines two "context-independent" models (additive utility and expected value) and is fit to the binary-choice trials. The authors can verify this point by quantifying the distractor effect in the mixture model. If that is the case, it will be important to highlight that the composite model is not explanatory; and defer a mechanistic explanation of this covariation pattern to future studies.

      We thank the reviewer for the comment. Indeed, the main purpose of applying the mixture model was to identify the way each participants combined attributes and, as the reviewer pointed out, the mixture model per se is context independent. While we acknowledge that the mixture model is not a mechanistic explanation, there is a theoretical basis for the observation that these two factors are linked.

      Firstly, studies that have examined the processes involved when humans combine and integrate different elements to form new representations (Barron et al., 2013; Papageorgiou et al., 2017; Schwartenbeck et al., 2023) have implicated the medial frontal cortex as a crucial region (Barron et al., 2013; Fellows, 2006; Hunt et al., 2012; Papageorgiou et al., 2017; Schwartenbeck et al., 2023). Meanwhile, previous studies have also identified that positive distractor effects are linked to the medial frontal cortex (Chau et al., 2014; Noonan et al., 2017). Therefore, the current study utilized these two facts to establish the basis for a correlation between positive distractor effects and non-additive mechanisms for determining the integrated value of multi-component choices. Nevertheless, we agree with the reviewer that it will be an important future direction to look at how the covariation pattern emerges in a computational model. We have revised the manuscript in an attempt to address this issue.

      “At the neuroanatomical level, the negative distractor effect is mediated by the PPC, where signal modulation described by divisive normalization has been previously identified (Chau et al., 2014; Louie et al., 2011). The same region is also crucial for perceptual decision making processes (Shadlen & Shohamy, 2016). The additive heuristics for combining choice attributes are closer to a perceptual evaluation because distances in this subjective value space correspond linearly to differences in physical attributes of the stimuli, whereas normative (multiplicative) value has a non-linear relation with them (cf. Figure 1c). It is well understood that many sensory mechanisms, such as in primates’ visual systems or fruit flies’ olfactory systems, are subject to divisive normalization (Carandini & Heeger, 2012). Hence, the additive heuristics that are more closely based on sensory mechanisms could also be subject to divisive normalization, leading to negative distractor effects in decision making.

      In contrast, the positive distractor effect is mediated by the mPFC (Chau et al., 2014; Fouragnan et al., 2019). Interestingly, the same or adjacent, interconnected mPFC regions have also been linked to the mechanisms by which representational elements are integrated into new representations (Barron et al., 2013; Klein-Flügge et al., 2022; Law et al., 2023; Papageorgiou et al., 2017; Schwartenbeck et al., 2023). In a number of situations, such as multi-attribute decision making, understanding social relations, and abstract knowledge, the mPFC achieves this by using a spatial map representation characterised by a grid-like response (Constantinescu et al., 2016; Bongioanni et al., 2021; Park et al., 2021) and disrupting mPFC leads to the evaluation of composite choice options as linear functions of their components (Bongioanni et al., 2021). These observations suggest a potential link between positive distractor effects and mechanisms for evaluating multiple component options and this is consistent with the across-participant correlation that we observed between the strength of the positive distractor effect and the strength of non-additive (i.e., multiplicative) evaluation of the composite stimuli we used in the current task. Hence, one direction for model development may involve incorporating the ideas that people vary in their ways of combining choice attributes and each way is susceptible to different types of distractor effect.” (Lines 250-274)

      Reviewer #3 Comment 3

      -  Correction for multiple comparisons (e.g., Bonferroni-Holm) was not applied to the regression results. Is the "negative distractor effect in the Additive Group" (Fig. 5c) still significant after such correction? Although this does not affect the stark difference between the distractor effects in the two groups (Fig. 5a), the classification of the distractor effect in each group is important (i.e., should future modelling work try to capture both a negative and a positive effect in the two integration groups? Or just a null and a positive effect?).

      We thank the reviewer for the comment. We have performed Bonferroni-Holm correction and as the reviewer surmised, the negative distractor effect in the additive group becomes non-significant. However, we have to emphasize that our major claim is that there was a covariation between decision strategy (of combining attributes) and distractor effect (as seen in Figure 4). That analysis does not imply multiple comparisons. The analysis in Figure 5 that splits participants into two groups was mainly designed to illustrate the effects for an easier understanding by a more general audience. In many cases, the precise ways in which participants are divided into subgroups can have a major impact on whether each individual group’s effects are significant or not. It may be possible to identify an optimal way of grouping, but we refrained from taking such a trial-and-error approach, especially for the analysis in Figure 5 that simply supplements the point made in Figure 4. The key notion we would like the readers to take away is that there is a spectrum of distractor effects (ranging from negative to positive) that will vary depending on how the choice attributes were integrated.

      Reviewer #1 (Recommendations For The Authors):

      Reviewer #1 Recommendations 1

      Enhancements are necessary for the quality of the scientific writing. Several sentences have been written in a negligent manner and warrant revision to ensure a higher level of rigor. Moreover, a number of sentences lack appropriate citations, including but not restricted to:

      - Line 39-41.

      - Line 349-350 (also please clarify what it means by parameter estimate" is very accurate: correlation?).

      We thank the reviewer for the comment. We have made revisions to various parts of the manuscript to address the reviewer’s concerns.

      “Intriguingly, most investigations have considered the interaction between distractors and chooseable options either at the level of their overall utility or at the level of their component attributes, but not both (Chau et al., 2014, 2020; Gluth et al., 2018).” (Lines 40-42)

      “Additional simulations have shown that the fitted parameters can be recovered with high accuracy (i.e., with a high correlation between generative and recovered parameters).” (Lines 414-416)

      Reviewer #1 Recommendations 2

      Some other minor suggestions:

      - Correlative vs. Causality: the manuscript exhibits a lack of attentiveness in drawing causal conclusions from correlative evidence (manuscript title, Line 91, Line 153-155).

      - When displaying effect size on accuracy, there is no need to show the significance of intercept (Figure 2,5, & supplementary figures).

      - Adding some figure titles on Figure 2 so it is clear what each panel stands for.

      - In Figure 3, the dots falling on zero values are not easily seen. Maybe increasing the dot size a little?

      - Line 298: binomial linking function (instead of binomial distribution).

      - Line 100: composite, not compositive.

      - Line 138-139: please improve the sentence, if it's consistent with previous findings, what's the point of "surprisingly"?

      We thank the reviewer for the suggestions. We have made revisions to the title and various parts of the manuscript to address the reviewer’s concerns.

      - Correlative vs. Causality: the manuscript exhibits a lack of attentiveness in drawing causal conclusions from correlative evidence (manuscript title, Line 91, Line 153-155).

      We have now revised the manuscript:

      “Distractor effects in decision making are related to the individual’s style of integrating choice attributes” (title of the manuscript)

      “More particularly, we consider whether individual differences in combination styles could be related to different forms of distractor effect.” (Lines 99-100)

      “While these results may seem to suggest that a distractor effect was not present at an overall group level, we argue that the precise way in which a distractor affects decision making is related to how individuals integrate the attributes.” (Lines 164-167)

      - When displaying effect size on accuracy, there is no need to show the significance of intercept (Figure 2,5, & supplementary figures).

      We have also modified all Figures to remove the intercept.

      - Adding some figure titles on Figure 2 so it is clear what each panel stands for.

      We have added titles accordingly.

      - In Figure 3, the dots falling on zero values are not easily seen. Maybe increasing the dot size a little?

      In conjunction with addressing Reviewer #3 Recommendation 6, we have adapted the violin plots into histograms for a better representation of the values.

      - Line 298: binomial linking function (instead of binomial distribution).

      - Line 100: composite, not compositive.

      - Line 138-139: please improve the sentence, if it's consistent with previous findings, what's the point of "surprisingly"?

      We have made revisions accordingly.

      Reviewer #2 (Recommendations For The Authors):

      Reviewer #2 Recommendations 1

      Line 294. The definition of DV, HV, LV is not sufficient. Presumably, these are the U from the following sections? Or just EV? But this is not explicitly stated, rather they are vaguely referred to as values." The computational modelling section refers to them as utilities. Are these the same thing?

      We thank the reviewer for the suggestion. We have clarified that the exact method for calculating each of the values and updated the section accordingly.

      “where HV, LV, and DV refer to the values of the chooseable higher value option, chooseable lower value option, and distractor, respectively. Here, values (except those in Supplementary Figure 5) are defined as Expected Value (EV), calculated by multiplying magnitude and probability of reward.” (Lines 348-350)

      Reviewer #2 Recommendations 2

      The analysis drops trials in which the distractor was chosen. These trials are informative about the presence (or not) of relative valuation or other factors because they make such choices more (or less) likely. Ignoring them is another example of the analysis being misspecified.

      We thank the reviewer for the suggestion and this is related to Major Issue 1 raised by the same reviewer. In brief, we adopted the same methods implemented by Cao and Tsetsos (Cao and Tsetsos, 2022) and that constrained us to applying a binomial model. Please refer to our reply to Major Issue 1 for more details.

      Reviewer #2 Recommendations 3

      Some questions and suggestions on statistics and computational modeling:

      Have the authors looked at potential collinearity between the regressors in each of the GLMs?

      We thank the reviewer for the comment. For each of the following GLMs, the average variance inflation factor (VIF) has been calculated as follows:

      GLM2 using the Expected Value model:

      Author response table 1.

      GLM2 after replacing the utility function based on the normative Expected Value model with values obtained by using the composite model:

      Author response table 2.

      GLM3:

      Author response table 3.

      As indicated in the average VIF values calculated, none of them exceed 4, suggesting that the estimated coefficients were not inflated due to collinearity between the regressor in each of the GLMs.

      Reviewer #2 Recommendations 4

      - Correlation results in Figure 4. What is the regression line displayed on this plot? I suspect the regression line came from Pearson's correlation, which would be inconsistent with the Spearman's correlation reported in the text. A reasonable way would be to transform both x and y axes to the ranked data. However, I wonder why it makes sense to use ranked data for testing the correlation in this case. Those are both scalar values. Also, did the authors assess the influence of the zero integration coefficient on the correlation result? Importantly, did the authors redo the correlation plot after defining the utility function by the composite models?

      We thank the reviewer for the suggestion. The plotted line in Figure 4 was based on the Pearson’s correlation and we have modified the text to also report the Pearson’s correlation result as well.

      If we were to exclude the 32 participants with integration coefficients smaller than 1×10⁻⁶ from the analysis, we still observe a significant positive Pearson’s correlation [r(110)=0.202, p=0.0330].

      Author response image 1.

      Figure 4 after excluding 32 participants with integration coefficients smaller than 1×10⁻⁶.

      “As such, we proceeded to explore how the distractor effect (i.e., the effect of (DV−HV)T obtained from GLM2; Figure 2c) was related to the integration coefficient (η) of the optimal model via a Pearson’s correlation (Figure 4). As expected, a significant positive correlation was observed [r(142)=0.282, p=0.000631]. We noticed that there were 32 participants with integration coefficients that were close to zero (below 1×10⁻⁶). The correlation remained significant even after removing these participants [r(110)=0.202, p=0.0330].” (Lines 207-212)

      The last question relates to results already included in Supplementary Figure 5, in which the analyses were conducted using the utility function of the composite model. We notice that although there was a difference in integration coefficient between the multiplicative and additive groups, a correlational analysis did not generate significant results [r(142)=0.124, p=0.138]. It is possible that the relationship became less linear after applying the composite model utility function. However, it is noticeable that in a series of complementary analyses (Figure 5: r(142)=0.282, p=0.000631; Supplementary Figure 3: r(142)=0.278, p=0.000746) comparable results were obtained.

      Reviewer #2 Recommendations 5

      - From lines 163-165, were the models tested on only the three-option trials or both two and three-opinion trials? It is ambiguous from the description here. It might be worth checking the model comparison based on different trial types, and the current model fitting results do not tell an absolute sense of the goodness of fit. I would suggest including the correctly predicted trial proportions in each trial type from different models.

      We thank the reviewer for the suggestion. We have only modeled the two-option trials and the key reason for this is because the two-option trials can arguably provide a better estimate of participants’ style of integrating attributes as they are independent of any distractor effects. This was also the same reason why Cao and Tsetsos applied the same approach when they were re-analyzing our data (Cao and Tsetsos, 2022). We have clarified the statement accordingly.

      “We fitted these models exclusively to the Two-Option Trial data and not the Distractor Trial data, such that the fitting (especially that of the integration coefficient) was independent of any distractor effects, and tested which model best describes participants’ choice behaviours.” (Lines 175-178)

      Reviewer #2 Recommendations 6

      - Along with displaying the marginal distributions of each parameter estimate, a correlation plot of these model parameters might be useful, given that some model parameters are multiplied in the value functions.

      We thank the reviewer for the suggestion. We have also generated the correlation plot of the model parameters. The Pearson’s correlation between the magnitude/probability weighting and integration coefficient was significant [r(142)=−0.259, p=0.00170]. The Pearson’s correlation between the inverse temperature and integration coefficient was not significant [r(142)=−0.0301, p=0.721]. The Pearson’s correlation between the inverse temperature and magnitude/probability weighting was not significant [r(142)=−0.0715, p=0.394].

      “Our finding that the average integration coefficient  was 0.325 coincides with previous evidence that people were biased towards using an additive, rather than a multiplicative rule. However, it also shows rather than being fully additive ( =0) or multiplicative ( =1), people’s choice behaviour is best described as a mixture of both. Supplementary Figure 1 shows the relationships between all the fitted parameters.” (Lines 189-193)

      Reviewer #2 Recommendations 7

      Have the authors tried any functional transformations on amounts or probabilities before applying the weighted sum? The two attributes are on entirely different scales and thus may not be directly summed together.

      We thank the reviewer for the comment. Amounts and probabilities were indeed both rescaled to the 0-1 interval before being summed, as explained in the methods (Line XXX). Additionally, we have now added and performed model fitting on an additional model with utility curvature based on the prospect theory (Kahneman & Tversky, 1979) and a weighted probability function (Prelec, 1998):

      where  and  represent the reward magnitude and probability (both rescaled to the interval between 0 and 1), respectively.  is the weighted magnitude and  is the weighted probability, while  and  are the corresponding distortion parameters. This prospect theory (PT) model was included along with the four previous models (please refer to Figure 3) in a Bayesian model comparison. Results indicate that the composite model remains as the best account of participants’ choice behaviour (exceedance probability = 1.000, estimated model frequency = 0.720).

      “Supplementary Figure 2 reports an additional Bayesian model comparison performed while including a model with nonlinear utility functions based on Prospect Theory (Kahneman & Tversky, 1979) with the Prelec formula for probability (Prelec, 1998). Consistent with the above finding, the composite model provides the best account of participants’ choice behaviour (exceedance probability = 1.000, estimated model frequency = 0.720).” (Lines 193-198)

      Reviewer #3 (Recommendations For The Authors):

      Reviewer #3 Recommendations 1

      - In the Introduction (around line 48), the authors make the case that distractor effects can co-exist in different parts of the decision space, citing Chau et al. (2020). However, if the distractor effect is calculated relative to the binary baseline this is no longer the case.

      - Relating to the above point, it might be useful for the authors to make a distinction between effects being non-monotonic across the decision space (within individuals) and effects varying across individuals due to different strategies adopted. These two scenarios are conceptually distinct.

      We thank the reviewer for the comment. Indeed, the ideas that distractor effects may vary across decision space and across different individuals are slightly different concepts. We have now revised the manuscript to clarify this:

      “However, as has been argued in other contexts, just because one type of distractor effect is present does not preclude another type from existing (Chau et al., 2020; Kohl et al., 2023). Each type of distractor effect can dominate depending on the dynamics between the distractor and the chooseable options. Moreover, the fact that people have diverse ways of making decisions is often overlooked. Therefore, not only may the type of distractor effect that predominates vary as a function of the relative position of the options in the decision space, but also as a function of each individual’s style of decision making.” (Lines 48-54)

      Reviewer #3 Recommendations 2

      - The idea of mixture models/strategies has strong backing from other Cognitive Science domains and will appeal to most readers. It would be very valuable if the authors could further discuss the potential level at which their composite model might operate. Are the additive and EV quantities computed and weighted (as per the integration coefficient) within a trial giving rise to a composite decision variable? Or does the integration coefficient reflect a probabilistic (perhaps competitive) selection of one strategy on a given trial? Perhaps extant neural data can shed light on this question.

      We thank the reviewer for the comment. The idea is related to whether the observed mixture in integration models derives from value being actually computed in a mixed way within each trial, or each trial involves a probabilistic selection between the additive and multiplicative strategies. We agree that this is an interesting question and to address it would require the use of some independent continuous measures to estimate the subjective values in quantitative terms (instead of using the categorical choice data). This could be done by collecting pupil size data or functional magnetic resonance imaging data, as the reviewer has pointed out. Although the empirical work is beyond the scope of the current behavioural study, it is worth bringing up this point in the Discussion:

      “The current finding involves the use of a composite model that arbitrates between the additive and multiplicative strategies. A general question for such composite models is whether people mix two strategies in a consistent manner on every trial or whether there is some form of probabilistic selection occurring between the two strategies on each trial such that only one strategy is used on any given trial while, on average, one strategy is more probable than the other. To test which is the case requires an independent estimation of subjective values in quantitative terms, such as by pupillometry or functional neuroimaging. Further understanding of this problem will also provide important insight into the precise way in which distractor effects operate at the single-trial level.” (Lines 275-282)

      Reviewer #3 Recommendations 3

      Line 80 "compare pairs of attributes separately, without integration". This additive rule (or the within-attribute comparison) implies integration, it is just not multiplicative integration.

      We thank the reviewer for the comment. We have made adjustments to the manuscript to ensure that the message delivered within this manuscript is consistent.

      “For clarity, we stress that the same mathematical formula for additive value can be interpreted as meaning that 1) subjects first estimate the value of each option in an additive way (value integration) and then compare the options, or 2) subjects compare the two magnitudes and separately compare the two probabilities without integrating dimensions into overall values. On the other hand, the mathematical formula for multiplicative value is only compatible with the first interpretation. In this paper we focus on attribute combination styles (multiplicative vs additive) and do not make claims on the order of the operations. More particularly, we consider whether individual differences in combination styles could be related to different forms of distractor effect.” (Lines 92-100)

      Reviewer #3 Recommendations 4

      - Not clear why the header in line 122 is phrased as a question.

      We thank the reviewer for the suggestion. We have modified the header to the following:

      “The distractor effect was absent on average” (Line 129)

      Reviewer #3 Recommendations 5

      - The discussion and integration of key neural findings with the current thesis are outstanding. It might help the readers if certain statements such as "the distractor effect is mediated by the PPC" (line 229) were further unpacked.

      We thank the reviewer for the suggestion. We have made modifications to the original passage to further elaborate the statement.

      “At the neuroanatomical level, the negative distractor effect is mediated by the PPC, where signal modulation described by divisive normalization has been previously identified (Chau et al., 2014; Louie et al., 2011). The same region is also crucial for perceptual decision making processes (Shadlen & Shohamy, 2016).” (Lines 250-253)

      Reviewer #3 Recommendations 6

      - In Fig. 3c, there seem to be many participants having the integration coefficient close to 0 but the present violin plot doesn't seem to best reflect this highly skewed distribution. A histogram would be perhaps better here.

      We thank the reviewer for the suggestion. We have modified the descriptive plots to use histograms instead of violin plots.

      “Figures 3c, d and e show the fitted parameters of the composite model: , the integration coefficient determining the relative weighting of the additive and multiplicative value ( , ); , the magnitude/probability weighing ratio ( , ); and , the inverse temperature ( , ). Our finding that the average integration coefficient  was 0.325 coincides with previous evidence that people were biased towards using an additive, rather than a multiplicative rule.” (Lines 186-191)

    1. Author response:

      The following is the authors’ response to the current reviews.

      Reviewer #1 (Public Review):

      We thank the reviewer for his careful reading, which enabled us to improve the quality of this manuscript. We have addressed some major criticisms, and in particular, we have now included the characterization of the impact of BMP2 on other lines as well as the study of the impact of reversion of the H3.3K27M mutation (Figure 3 - figure supplement 1C-D). This control, judiciously proposed by the reviewer, seems more relevant than using mutant H3.1K27M / ACVR1 lines, given the possibility of BMP2 action via other receptors.


      The following is the authors’ response to the original reviews.

      Reviewer #1

      Summary:

      Mutational analysis of diffuse midline glioma (DMG) found that ACVR1 mutations, which up-regulate the BMP signaling pathway are found in most H3.1K27M, but not H3.3K27M DMG cases. In this manuscript, Huchede et al attempted to determine whether the BMP signaling pathway has any role in H3.3K27M DMG tumors. They found that the BMP signaling is activated to a similar level in H3.3K27M DMG cells with wild-type ACVR1 compared to ACVR1 DMG cells, likely due to the expression of BMP7 or BMP2. They went on to test whether cells treated with BMP7 or BMP2 treatments affected the gene expression and cell fitness of tumor cells with H3.3K27M mutation. They concluded that BMP2/7 synergizes with H3.3K27M to induce a transcriptomic rewiring associated with a quiescent but invasive cell state. The major issue for this conclusion is that the authors did not use the right models/controls to obtain results to support this conclusion as detailed below. Therefore, in order to strengthen the conclusion, the authors need to address the major concerns below.

      Strength:

      This paper addresses an important question in the DMG field.

      Major concerns/weakness:

      (1) All the results in Fig. 2 utilized two glioma lines SF188 and Res259. The authors should repeat all these experiments in a couple of H3.3K27M DMG lines by deleting the H3.3K27M mutation first.

      We thank the referee for his/her comments that have helped us to strengthen our conclusions. Although we were rather interested in studying how the BMP pathway can participate in installing a particular cell state at the time of expression of the K27M mutation, we have now included the characterization of the native H3.3K27M BT245 and SU-DIPGXIII cell lines, and their counterparts in which the mutation was reverted by CRISPRCas9 (Harutyunyan et al., 2019). As shown in Figure 3-figure supplement D, the growth arrest induced by BMP2 seems indeed to be specific of the K27M epigenetic context, which could also be required to settle a positive regulation loop to activate the BMP pathway, as mentioned in the Discussion.

      (2) Fig. 3. The experiments of BMP2 treatment should be repeated in other H3.3K27M DMG lines using H3.1K27M ACVR1 mutant tumor lines as controls.

      The use of mutant ACVR1 lines is interesting, but their control status seems questionable, as the addition of BMPs could have a cumulative effect on the effect of the mutation, notably by activating other receptors in the pathway. But we have now included 3 different cell lines (HSJD-DIPG-014, BT245 and SU-DIPGXIII), and observed similar impact of BMP2 with growth arrest as a readout (Figure 3-figure supplement C-D)

      Minor concerns

      Fig.2A. BMP2 expression increased in H3.3K27M SF188 cells. Therefore, the statement "whereas BMP2 and BMP4 expressions are not significantly modified (Figure 2A and Figure 2-figure supplement A-B)" is not accurate.

      The referee is absolutely right, and we have corrected this statement.

      Reviewer #2 (Public Review):

      The manuscript by Huchede et al investigates the BMP pathway in H3K27M-mutant gliomas carrying or not activating mutations in ALK2 (ACVR1). Their results in cell lines and in datasets acquired from the literature on patient tumors indicate that the BMP signaling pathway is activated at similar levels between ACVR1 wild-type and mutant tumors. The group further identifies BMP2 and BMP7 as possibly the main activators of the pathway in cells. They then show that BMP2 and 7 crosstalk with the H3 mutation and synergize to induce transcriptomic rewiring leading to an invasive cell state.

      The paper is well-written and easy to follow with a robust experimental plan and datasets supporting the claims. While previous work (acknowledged by the authors) indicated activation of BMP in H3K27M tumors, wild type for the ACVR1 mutation this paper is a nice addition and provides further mechanistic cues as to the importance of the BMP pathway and specific members in these deadly brain cancers. The effect of these BMPs in quiescence and invasion is of particular interest.

      We thank the referee for his/her supportive comments.

      A few suggestions to clarify the message are provided below 1- In thalamic diffuse midline gliomas, the BMP pathway should not be activated as it is in the pons. The authors should identify thalamic tumors in the datasets they explored and patients-derived cell lines from thalamic tumors available to investigate whether this pathway is active across all H3.3K27M mutants in the brain midline or specifically in tumors from the pons.

      The inter-patient variability observed in the level of activation of the BMP pathway may indeed be due, at least in part, to different tumor locations. However, we failed to find this information in the publicly available datasets that we used. We however included this element in the Discussion part.

      (2) There are ~20% H3.3K27M tumors that carry an ACVR1 mutation and similar numbers of H3.1K27M that are wild type for this gene. Can the authors identify these outliers in their datasets and assess the activation of BMP2 and 7 or other BMP pathway members in this context?

      We have now included the outliers present in our datasets in the legends of Figure 1B and Figure 1-figure supplement B and F. From the few samples available to document these outliers in the cohorts that we used, we have not observed major differences regarding the expression levels of BMP2/7 or BMP pathway members and have discussed the fact that it may result from the establishment in all cases of a feedback loop of activation.

      In all this is an interesting paper that provides meaningful data to pursue clinical targeting of the BMP pathway, which would be a nice addition to the field.

      We thank the reviewer for his/her supportive comments.

    1. Author response:

      The following is the authors’ response to the previous reviews.

      Public Reviews:

      Reviewer #1 (Public Review):

      The study by Vengayil et al. presented a role for Ubp3 for mediating inorganic phosphate (Pi) compartmentalization in cytosol and mitochondria, which regulates metabolic flux between cytosolic glycolysis and mitochondrial processes. Although the exact function of increased Pi in mitochondria is not investigated, findings have valuable implications for understanding the metabolic interplay between glycolysis and respiration under glucose-rich conditions. They showed that UBP3 KO cells regulated decreased glycolytic flux by reducing the key Pi-dependent-glycolytic enzyme abundances, consequently increasing Pi compartmentalization to mitochondria. Increased mitochondria Pi increases oxygen consumption and mitochondrial membrane potential, indicative of increased oxidative phosphorylation. In conclusion, the authors reported that the Pi utilization by cytosolic glycolytic enzymes is a key process for mitochondrial repression under glucose conditions.

      Comments on revised version:

      This reviewer appreciates the author's responses addressing some of the concerns.

      (1) However, the concern of reproducibility and experimental methods applied to the study is still valid, particularly considering that many conclusions were drawn from western blot analysis. The authors used separate gel loading controls for western blot analysis, which is not a valid method. Considering loading and other errors/discrepancies during the transfer phase of the assay, the direct control should be analyzing the membrane after transfer or using an internal control antibody on the same membrane. None of the western blots are indicated with marker sizes, and it isn't very clear how many repeats there are and whether those repeats are biological or technical repeats.

      We thank the reviewer for raising this concern. This point requires detailed clarification regarding two key points: the first one regarding the use of Coomassie stained gels over internal ‘housekeeping gene’ antibodies, and the second one regarding the challenges in performing controls for western blots In case of high abundance proteins such as glycolytic enzymes.

      (1) In our western blots, we have used Coomassie stained gel as a loading control for all our western blots. This is performed by cutting one half of the gel and using it for transfer followed by blotting and using the other half for Coomassie staining. I.e. This is not two separate gels that are loaded, but the same gel. Practically, this is no different from cutting a membrane to blot with different antibodies. This method is of course valid method for normalizing western blot data, and is used by multiple studies, for the reasons mentioned below. The historical use of a ‘house-keeping’ gene as a loading control for western blotting assumes that the protein levels of these does not change under different conditions. However, this approach has multiple, severe limitations (since a ‘housekeeping gene’ is entirely contextual, and indeed), and therefore it is correct to use total protein as a loading control. This is indeed recommended for use by multiple studies (Collins et al., 2015). Coomassie staining for total protein is far more reliable than using house-keeping genes as a loading control in western blots (Welinder and Ekblad, 2011). A notable example would be GAPDH itself, which is widely used as a loading control in many studies. As is clear from our data in this manuscript, GAPDH levels itself decrease in ubp3Δ cells. Had we used GAPDH as a loading control, we wouldn’t have identified the decrease in glycolytic enzymes in ubp3Δ cells, and this story would have met with a tragic fate very early on in its inception. We have in fact be very careful with these quantitations, and even before loading samples on gels, they are first normalized using a standard protein estimation assay (Bradford), followed by normalized loading, followed by cutting the gel into two parts - one for coomassie staining and protein normalization, and the other for the western blot for the respective proteins. However, in point (2) below, we clarify on why sometimes we have to load a separate gel with normalized protein, which should resolve this point.

      (2) Glycolytic enzymes are highly abundant proteins and to achieve a signal in the linear range of western blot, the protein extracts have to be diluted (up to 25 or 50 times). As discussed under point 1, an internal control ‘housekeeping gene’ antibody is not a reliable method to use as loading control. Even if we want to use an antibody for an internal protein as a control, there are not many proteins that are as abundant as metabolic enzymes and because of this simple reason, the sample dilution results in these proteins not getting detected in the western blot since the signal will be below the limit of detection. This leaves using a separate gel loading control as the only easy to perform, reliable option.

      We would like to further highlight the fact that the changes in metabolic enzymes and ETC proteins that we observe in the ubp3 mutant by western blot, were also independently observed by large scale untargeted quantitative proteomics study by  (Isasa et al., 2015), which we cite extensively in this manuscript. Since an entirelyindependent study, using a completely different (untargeted) method has also shown very similar  changes in proteins that we observe (mitochondrial, and glycolytic enzymes), there should be no room for doubt regarding the altered glycolytic enzyme and ETC protein  levels that we discover in this study.

      None of the western blots are indicated with marker sizes

      We have clearly indicated the marker sizes in all our western blots. Separately, raw images of the blots and Coomassie stained gels have been provided with the manuscript raw data, and is therefore easily available for any interested reader.

      It isn't very clear how many repeats there are and whether those repeats are biological or technical repeats.

      We have already clearly indicated the details of each blot in the figure legends. For example “A representative blot (out of three biological replicates, n=3) and their quantifications are shown. Data represent mean ± SD.” We kindly request the reviewer to thoroughly go through the figure legends for details regarding the western blots, or any other data. We hope this addresses all the reviewer concerns regarding the credibility of our western blot results and the method of using Coomassie stained gels as loading controls in this study.

      (2) Concern regarding citing the Ouyang et al. paper is still valid. This paper is an essential implication in phosphate metabolism and is directly related to some of the findings associated with mitochondrial function, along with conflicting results, which should be discussed in the discussion section. As a reviewer, I do not request citing any paper from the authors in general; however, considering some of the conflicting results here, citing and discussing paper from Ouyang et al. will improve the interoperation/value of their findings.

      As mentioned in detail in our previous response  letter, we do not believe that the study from Ouyang et al., present ‘conflicting results’ of any kind. Nevertheless, in response to the reviewer's suggestion, we have revised the discussion section of our manuscript and added a few points that  incorporate the insights from Ouyang et al. These are in the discussion section (“It is important to highlight that our experiments, whether involving Pi supplementation or Pi limitations, maintain the cellular Pi concentration within the millimolar range and are conducted within a short timeframe (~ 1 hour). This differs significantly from Pi starvation studies, where cells are subjected to prolonged and complete Pi deprivation, triggering extensive metabolic adjustments to sustain available Pi pools, such as an increase in mitochondrial membrane potential, independent of respiration”). We trust that this modification will enhance the interested readers' understanding of our study's overarching conclusions.

      Reviewer #2 (Public Review):

      Summary:

      Cells cultured in high glucose tend to repress mitochondrial biogenesis and activity, a prevailing phenotype type called Crabree effect that observed in different cell types and cancer. Many signaling pathways have been put forward to explain this effect. Vengayil et al proposed a new mechanism involved in Ubp3/Ubp10 and phosphate that controls the glucose repression of mitochondria. The central hypothesis is that ∆ubp3 shift the glycolysis to trehalose synthesis, therefore lead to the increase of Pi availability in the cytosol, then mitochondrial received more Pi and therefore the glucose repression is reduced.

      Strengths:

      The strength is that the authors used an array of different assays to test their hypothesis. Most assays were well designed and controlled.

      Weaknesses:

      I think the main conclusions are not strongly supported by the current dataset. Here are my comments on authors' response and model.

      (1) The authors addressed some of my concerns related to ∆ubp3. But based on the results they observed and discussed, the ∆ubp3 redirect some glycolytic flux to gluconeogenesis while the 0.1% glucose in WT does not. Similarly, the shift of glycolysis to trehalose synthesis is also not relevant to the WT cells cultured in low glucose situation. This should be discussed in the manuscript to make sure readers are not misled to think ∆ubp3 mimic low glucose. It is likely that ∆ubp3 induce proteostasis stress, which is known to activate respiration and trehalose synthesis.

      But based on the results they observed and discussed, the ∆ubp3 redirect some glycolytic flux to gluconeogenesis while the 0.1% glucose in WT does not. Similarly, the shift of glycolysis to trehalose synthesis is also not relevant to the WT cells cultured in low glucose situation.

      We would like to clarify that we do not observe a redirection of glycolytic flux to gluconeogenesis in ubp3 mutant. What we observe is a rewiring of glycolytic flux into increased trehalose synthesis and PPP, and decreased glycolysis. Also, the shift of glycolysis to trehalose synthesis is relevant to WT cells cultured in low glucose. It is a well-known fact that the trehalose synthesis increases with decrease in media glucose. In case of 0.1% glucose, this increase in trehalose is not due to an increase in gluconeogenesis (since the pathways utilizing alternate carbon sources still remain repressed  in 0.1% glucose (Yin et al., 2003)), but by the increase in glycolytic flux towards trehalose. This is also supported by increase in Tps2 protein levels upon decreasing glucose concentration (Shen et al., 2023). We will also note that there are very few studies that actually estimate gluconeogenic flux in cess (and they only rely on steady state measurements). Estimating gluconeogenic flux appropriately is challenging in itself (eg. see Niphadkar et al 2024). 

      In case of glucose concentrations lower than 0.1%, the shift to trehalose synthesis might not be as relevant. We observe that the glycolysis defective mutant tdh2tdh3 cells does not show an increase in trehalose synthesis (Figure 3-figure supplement 1E). However, in this context, the decrease in the rate of GAPDH catalyzed reaction alone appears to be sufficient to increase the Pi levels (Figure 3F) even without an increase in trehalose. Therefore, there might be differences in the relative contributions of these two arms towards Pi balance, based on whether it is low glucose in the environment, or a mutant such as ubp3Δ that modulates glycolytic flux. In ubp3Δ cells, the combination of low rate of GAPDH catalyzed reaction and high trehalose will happen (based on how glycolytic flux is modulated), vs only the low rate of the GAPDH catalyzed reaction in tdh2tdh3 cells. As an end point the increase in Pi happens in both cases, but this happens via slightly differing outcomes. Also note: in terms of free Pi sources a low-glucose condition (with low glycolytic rate) is very different from a no-glucose, respiratory condition (where cells perform very high gluconeogenesis, at a rate that is an order of magnitude higher than in low glucose). In respiration-reliant conditions such as in ethanol, cells switch to high gluconeogenesis, where there is a large increase in trehalose synthesis as a default (eg see Varahan et al 2019). In this condition, trehalose synthesis could become a major source for Pi (eg see Gupta 2021). This could also support the increased mitochondrial respiration. In an ethanol-only medium, the directionality of the GAPDH reaction is itself reversed (i.e. G-1,3-BP → G-3-P). Therefore, this reaction now becomes an added source of Pi, instead of a net consumer of Pi (see illustration in Figure 3G). Therefore, a very reasonable inference is that a combination of increased trehalose and increased 1,3 BPG to G3P conversion can become a Pi source, supporting increased mitochondrial respiration in a non-glucose, respiratory medium.

      We have now clarified these points in the discussion section in the updated version of our manuscript. Lines xxx. We hope that this updated discussion section satisfies the reviewer’s concern regarding how relevant the increase in trehalose synthesis is for altered Pi balance and increased mitochondrial respiration in WT cells.

      It is likely that ∆ubp3 induce proteostasis stress, which is known to activate respiration and trehalose synthesis.

      Apart from some general changes in metabolism, there are no reports whatsoever that suggest that general proteostasis stress can results in an extensive, precise metabolic rewiring - where there is an increased in respiration, mitochondrial de-repression, precise decrease in two limiting glycolytic enzyme levels, and a precise reduction in glycolytic flux, as observed in the ubp3 mutant. If this was the case, deletion of any deubiquitinase should result in an increase in trehalose and respiration which clearly does not happen (as is already clear from the large screen shown in Figure 1)

      However, in response to this query, we performed experiments to assess the extent of proteostasis stress in ubp3 mutants. For this, we have now estimated the changes in global ubiquitination in WT vs ubp3 mutant, and compared this with conditions of moderate proteostasis stress (mild heat shock at 42C/~1hr). These data are now included in the revised manuscript as Figure 1- figure supplement 1J. Notably, our analysis reveals only very minor  alteration in global ubiquitination levels in ubp3 mutants compared to WT cells. This is in very stark contrast to  limited heat stress, where a clear increase in global ubiquitination can be easily observed. Given these data, we can conclude that there is no significant general proteostatic stress in ubp3 mutants, that could induce substantial metabolic rewiring of such precise nature.

      (2) Pi flux: it is known that vacuole can compensate the reduction of Pi in the cytosol. The paper they cited in the response, especially the Van Heerden et al., 2014 showed that the pulse addition of glucose caused transient Pi reduction and then it came back to normal level after 10min or so. If the authors mean the transient change of glycolysis and respiration, they should point that out clearly in the abstract and introduction. If the authors are trying to put out a general model, then the model must be reconsidered.

      In Van Heerden et al., the pulse addition of glucose causes transient Pi reduction due to rapid Pi consumption in glycolysis. The phosphate levels came back to normal level because of the glucose flux into trehalose synthesis releasing free Pi. This is the entire crux of the study and this is the reason why tps2 mutants which cannot synthesize trehalose exhibit a growth defect and have decreased Pi levels. As explained in detail in our early response, the cellular Pi levels are maintained by a relative balance of reactions that consume and release Pi and therefore a change in this balance can change Pi as well. Indeed, if this were not the case, the tps2 mutants would simply maintain the Pi levels similar to WT cells by increasing Pi transport from the medium, which is clearly not the case (eg see Gupta 2021).

      The cytosol has ~50mM Pi (van Eunen et al., 2010 FEBSJ), while only 1-2mM of glycolysis metabolites, not sure why partial reduction of several glycolysis enzymes will cause significant changes in cytosolic Pi level and make Pi the limiting factor for mitochondrial respiration. In response to this comment, the authors explained the metabolic flux that the rapid, continuous glycolysis will drain the Pi pool even each glycolytic metabolite is only 1-2mM. However, the metabolic flux both consume and release Pi, that's why there is such measurement of overall free Pi concentration amid the active metabolism. One possibility is that the observed cytosolic Pi level changes was caused by the measurement fluctuation.

      The measurement fluctuations that we mentioned in our previous response letter was in case of cells grown in high and low glucose, where there are multiple factors such as mitochondrial amount which complicates the Pi measurements. In case of ubp3 mutants which have a similar amount of total mitochondria as that of WT cells, there is minimal fluctuation for Pi measurement. We have done extensive standardization of mitochondrial isolation and Pi measurement in the isolated mitochondria (as explained in detail in the manuscript) to minimize any such fluctuations. 

      However, the metabolic flux both consume and release Pi, that's why there is such measurement of overall free Pi concentration amid the active metabolism

      The reviewer is correct in pointing out that metabolic flux consume and release Pi. However, in glucose grown yeast cells, the rate of glycolysis which is a Pi consuming reaction is higher than any other metabolic pathway. In fact, the glycolytic rate in glucose-grown S. cerevisiae is one of the highest ever observed in any living system. A decrease in glycolysis and an increase in trehalose therefore shifts the balance in Pi utilization and results in increased free Pi in ubp3 cells. For a more detailed theoretical reasoning on the consumption and production of Pi, see Gupta 2021.

      Importantly, the authors measured Pi inside mito for ethanol and glucose, but not the cytosolic Pi, which is the key hypothesis in their model. The model here is that the glycolysis competes with mito for free cytosolic Pi, so it needs to inhibit glycolysis to free up cytosolic Pi for mitochondrial import to increase respiration. I don't see measurement of cytosolic Pi upon different conditions, only the total Pi or mito Pi. The fact is that in Fig.3C they saw WT+Pi in the medium increase total free Pi more than the ∆ubc3, while WT decrease mito Pi compared to WT control and ∆ubc3 and therefore decrease basal OCR upon Pi supplement. A simple math of Pitotal = Pi cyto + Pi mito tells us that if WT has more Pitotal (Fig.3C) but less Pi mito (fig.5 supp 1C), then it has higher Pi cyto. This is contradictory to what the authors tried to rationalize. Furthermore, as I pointed out previously, the isolated mitochondria can import more Pi when supplemented, so if there is indeed higher Picyto, then the mito in WT should import more Pi. So, to address these contradictory points, the authors must measure Pi in the cytosol, which is a critical experiment not done for their model. For example, they hypothesized that adding 2-DG, or ∆ubp3, suppress glycolysis and thus increase the supply of cytosolic Pi for mito to import, but no cytosolic Pi was measured (need absolute value, not the relative fold changes). It is also important to specific how the experiments are done, was the measurement done shortly after adding 2-DG. Given that the cells response to glucose changes/pulses differently in transient vs stable state, the authors are encouraged to specify that.

      (1) Importantly, the authors measured Pi inside mito for ethanol and glucose, but not the cytosolic Pi, which is the key hypothesis in their model. The model here is that the glycolysis competes with mito for free cytosolic Pi, so it needs to inhibit glycolysis to free up cytosolic Pi for mitochondrial import to increase respiration. I don't see measurement of cytosolic Pi upon different conditions, only the total Pi or mito Pi.

      As clearly described in the manuscript, the key hypothesis that emerges is the role of the availability/accessibility of Pi for the mitochondria, in the context of activity. As discussed in detail in the discussion section, this can come from a combination of available Pi pools in the cytosol and increased transport of this Pi to the mitochondria. While it is true that the decreased glycolysis in ubp3 mutants frees up available Pi pools in the cytosol, measurement of cytosolic Pi in these mutants growing in log phase might not necessarily show an increased cytosolic Pi, if the Pi is being actively transported the the mitochondria at a rate higher that the WT, as indicated by the ~6 fold increase in mitochondrial Pi in ubp3 cells. This would require tools such as intracellular fluorescence based-Pi sensors that could accurately capture temporal changes in cytosolic and mitochondrial Pi following glycolytic inhibition. However, these tools are not available till date for use in yeast and measuring cytosolic Pi following glycolytic inhibition over time using colorimetric Pi assays are extremely difficult.  

      However, the reviewer does correctly state that we had not included measurement of cytosolic Pi. Since the mitochondrial Pi estimate was itself a very challenging (and critical) experiment we had originally thought that data was sufficient. We have therefore now performed a series of new experiments, where we first enrich the cytosolic fraction (without mitochondrial contamination), and estimated cytosolic Pi amounts in WT and ubp3 cells. Our Pi measurements indicate a cytosolic Pi concentration in the range of ~35 mM, which is similar to the earlier reported values in yeast. We further observe that the cytosolic Pi is about ~25% lower in ubp3 mutants (~25-27 mM) compared to WT cells (Figure 4B). As mentioned earlier, this would be consistent with higher transport of Pi from the cytosol to the mitochondria in these cells. Effectively, ubp3 cells have a total increase in cellular Pi, and with a Pi pool distribution such that there is increased Pi availability in mitochondria (Figure 4B). This further substantiates this hypothesis of an increased Pi allocation to mitochondria in ubp3 mutants. The reason for increased rate of Pi transport to mitochondria is not immediately clear, but could also come from changes in cytosolic pH - a possibility that we suggest in our discussion, and is discussed in a later section of this response letter as well.   

      (2) The fact is that in Fig.3C they saw WT+Pi in the medium increase total free Pi more than the ∆ubc3, while WT decrease mito Pi compared to WT control and ∆ubc3 and therefore decrease basal OCR upon Pi supplement. A simple math of Pitotal = Pi cyto + Pi mito tells us that if WT has more Pitotal (Fig.3C) but less Pi mito (fig.5 supp 1C), then it has higher Pi cyto. This is contradictory to what the authors tried to rationalize. Furthermore, as I pointed out previously, the isolated mitochondria can import more Pi when supplemented, so if there is indeed higher Picyto, then the mito in WT should import more Pi.

      a) “The fact is that in Fig.3C they saw WT+Pi in the medium increase total free Pi more than the ∆ubc3, while WT decrease mito Pi compared to WT control and ∆ubc3 and therefore decrease basal OCR upon Pi supplement. A simple math of Pitotal = Pi cyto + Pi mito tells us that if WT has more Pitotal (Fig.3C) but less Pi mito (fig.5 supp 1C), then it has higher Pi cyto.”

      In WT cells supplemented with external Pi (WT+Pi), there is an increased total Pi, but a decreased mitochondrial Pi. As discussed in the discussion section in the manuscript, this could be due to the supplemented Pi not being transported to mitochondria. The reviewer is correct in pointing out that as per simple math this should mean that the cytosolic Pi in WT+Pi should be high. We have now assessed cytosolic Pi upon external Pi supplementation, and this is exactly what we observe in our cytosolic Pi measurements now included in the revised manuscript (Figure 5-figure supplement 5C). There is a higher cytosolic Pi in WT+Pi (~52 mM) compared to WT cells (~35 mM) and ubp3 cells (~27 mM). We have now pointed this out in the discussion section in the revised manuscript “Notably, this increased respiration does not happen upon direct Pi supplementation to highly glycolytic WT cells, where the Pi accumulates in cytosol, without increasing mitochondrial Pi (Figure 5-figure supplement 1C).” We hope that these new data completely addresses the reviewer’s concern regarding the Pi allocations in case of WT+Pi cells.

      b) This is contradictory to what the authors tried to rationalize. Furthermore, as I pointed out previously, the isolated mitochondria can import more Pi when supplemented, so if there is indeed higher Picyto, then the mito in WT should import more Pi.

      We would like to clarify that the Pi measurements in WT+Pi absolutely do not contradict our hypothesis. Furthermore, nowhere do we claim that an increase in cytosolic Pi will increase mitochondrial Pi!! On the contrary, we explain in detail that supplementing Pi to WT cells (which increases cytosolic Pi) will not increase respiration if the increased Pi is not being transported to mitochondria. This is exactly what happens in WT+Pi, where Pi accumulates in the cytosol but does not result in increased mitochondrial Pi. The reviewer argues that if there is higher cyto Pi, mitochondria should import more Pi. This is true in case of transport via diffusion where the external concentration dictates the direction of metabolite transport, but is fundamentally wrong in case of transport of metabolites where active transporters and additional regulators are involved. This is the entire basis of the idea of metabolic compartmentalisation where  cells maintain pools of metabolites in different organelles which regulate the cellular metabolic state. A well-studied example is pyruvate, whose cytosolic concentration is high in glycolytic cells, but it's transport to mitochondria is reduced in glycolysis to maintain cytosolic fermentation. As discussed in the manuscript, a logical explanation for Pi supplementation not increasing respiration and mitochondria Pi is that there might be mechanisms in highly glycolytic cells that restrict the transport of Pi to mitochondria, thereby compartmentalizing Pi in the cytosol. One such possible mechanism is pH (discussed in a later section) and it is possible that there are other mechanisms involved. 

      In case of isolated mitochondria, Pi supplementation results in an increased respiration simply because it is an in vitro set up where we supplement metabolites such as pyruvate, malate and ADP along with phosphate to ensure that mitochondria is actively respiring and in this case Pi will be consumed since it is being used for ATP synthesis. This is entirely different from an in vivo scenario where cells are glycolytic, and mechanisms to prevent mitochondrial transport of metabolites such as pyruvate and phosphate are active. 

      c) It is also important to specific how the experiments are done, was the measurement done shortly after adding 2-DG?

      Cells were treated with 2-DG for one hour and respiration was measured. We have mentioned these details clearly in the figure legends and methods.  

      d) The most likely model to me is that, which is also the consensus in the field, is that no matter 2-DG or ∆ubp3, the cells re-wiring metabolism in both cytosol and mitochondria, and it is the total network shift that cause the mitochondrial respiration increase, which requires the increase of mito import of Pi, ADP, O2, and substrates, but not caused/controlled by the Pi that singled out by the authors in their model.

      The aim of our study is only to highlight the importance of mitochondrial Pi availability as a critical factor in controlling mitochondrial respiration. Of course this would require sufficient other factors such as ADP, substrates and oxygen. It cannot be otherwise. However, as we point out in the discussion, a major limiting factor might be Pi availability. While the altered glycolysis in ubp3 mutants might control availability of other factors such as pyruvate and ADP, this is not the focus of our study. We would also like to point out that prior studies show that even though cytosolic ADP decreases in the presence of glucose, this does  not limit mitochondrial ADP uptake, or decrease respiration, due to the very high affinity of the mitochondrial ADP transporter. This is discussed in our discussion section as well. Further we show that the levels of ETC proteins can be altered by changing Pi levels, which places Pi as a major regulator of respiration. We would like to point out once again that studies in other systems have also highlighted a major role of mitochondrial Pi availability in controlling respiration. These references are included in our manuscript (Scheibye-Knudsen et al., 2009, Seifer et al., 2015). This includes a recent study in T cells that clearly shows increased mitochondrial respiration upon overexpressing mitochondrial Pi transporter SLC25A3 alone (Wu et al., 2023). Our manuscript now in fact provides a contextual explanation of these diverse observations from other cellular systems where mitochondrial Pi transport appears to regulate respiration.

      (3) The explanation that cytosolic pH reduction upon glucose depletion/2DG is a mistake. There are a lot of data in the literature showing the opposite. If the authors do think this is true, then need to show the data. Again, it is important to distinguish transient vs stable state for pH changes.

      We observe that directly supplementing Pi to WT cells growing in high glucose does not result in higher mitochondrial Pi or increased respiration. However, supplementing Pi to WT cells increases mitochondrial respiration in the presence of glycolytic inhibitor 2-DG. We therefore merely suggest that cytosolic pH could be an additional regulator of mitochondrial Pi transport, since this will be consistent with the differences in mitochondrial Pi transport in highly glycolytic cells, and cells with decreased glycolysis ( such as 2-DG addition and ubp3 mutant). This is because in mitochondria, Pi is co-transported along with protons. Therefore, changes in cytosolic pH (which changes the proton gradient) will control the mitochondrial Pi transport (Hamel et al., 2004).  The glycolytic rate is itself a major factor that controls cytosolic pH. The cytosolic pH in highly glycolytic cells is maintained ~7, and decreasing glycolysis results in cytosolic acidification (Orij et al., 2011). Therefore, under conditions of decreased glycolysis (such as loss of Ubp3), cytosolic pH becomes acidic. Since mitochondrial Pi transport depends on the proton gradient, a low cytosolic pH would favour mitochondrial Pi transport. Therefore, under conditions of decreased glycolysis (2DG treatment, or loss of Ubp3), where cytosolic pH would be acidic, increasing cytosolic Pi might indirectly increase mitochondria Pi transport, thereby leading to increased respiration. But we certainly do leave alternate interpretations to the imagination of any reader, and are indeed open to them. These are all exciting future directions this study will enable a contextual interpretation of.

      The explanation that cytosolic pH reduction upon glucose depletion/2DG is a mistake.

      We have cited two independent studies which suggest that cytosolic pH decreases upon a decrease in glycolysis (Orij et al.,2011 ,Dechant et al., 2010). This control of cytosolic pH by the glycolytic rate has been extensively shown using glycolytic mutants, cells in low glucose and cells grown in the presence of glycolytic inhibitors. According to the reviewer, this is a mistake and

      there are a lot of data in the literature showing the opposite.

      In our literature review we did not come across any relevant studies that actually show the opposite. If the  reviewer still thinks this is a mistake, the reviewer is welcome to include some of the relevant literature that clearly shows the opposite in the comments, with actual measurements of cytosolic pH. Additionally,  the possible role of cytosolic pH in this context does not affect the conclusions of our study, and we only include this as a possibility in the discussion. Therefore, this is obviously well beyond the scope of experiments in our current study, and considering the extensive data from multiple studies that shows that cytosolic pH decreases under low glycolysis, there is no relevance  to including experiments to address the same in this study. We leave this as a point for an interested reader to think about, and it certainly can nucleate new directions of future study.

    1. Author response:

      The following is the authors’ response to the original reviews.

      Summary of the changes

      Changes in the manuscript were made to clarify some ambiguities raised by the reviewers and to improve the report following their recommendations. A summary of the main changes is listed below:

      - The title was changed to better reflect the results of this study - Re-training the model on log transformed FACS scores.

      - Testing the specificity of the FEPS to facial expression of pain within this experimental setup by comparing it to the activation maps obtained from the Warm stimulation condition.

      - Testing for sensitization/habituation of the behavioral measures (FACS scores and pain ratings).

      - Adding a section in the discussion to better address the limitations of this study and provide potential directions for future studies.

      Other changes target areas where the original manuscript may have been ambiguous or lacked precision. To address these concerns, additional details have been incorporated, and certain terms have been revised to ensure a more precise and transparent presentation of the information.

      Public Reviews:

      Reviewer #1 (Public Review):

      Picard et al. report a novel neural signature of facial expressions of pain. In other words, they provide evidence that a specific set of brain activations, as measured by means of functional magnetic resonance imaging (fMRI), can tell us when someone is expressing pain via a concerted activation of distinctive facial muscles. They demonstrate that this signature provides a better characterization of this pain behaviour when compared with other signatures of pain reported by past research. The Facial Expression of Pain Signature (FEPS) thus enriches this collection and, if further validated, may allow scientists to identify the neural structures subserving important non-verbal pain behaviour. I have, however, some reservations about the strength of the evidence, relating to insufficient characterization of the underlying processes involved.

      We are thankful for the summary of our work. We are hopeful that the modifications made in the latest version effectively address these concerns. The changes are outlined in the summary above, and detailed in the following point-by-point response.

      Strengths:

      The study relies on a robust machine-learning approach, able to capitalise on the multivariate nature of the fMRI data, an approach pioneered in the field of pain by one of the authors (Dr. Tor Wager). This paper extends Wager's and other colleagues' work attempting to identify specific combinations of brain structures subserving different aspects of the pain experience while examining the extent of similarity/dissimilarity with the other signatures. In doing so, the study provides further methodological insight into fine-grained network characterization that may inspire future work beyond this specific field.

      We are thankful for the positive comments.

      Weaknesses:

      The main weakness concerns the lack of a targeted experimental design aimed to dissect the shared variance explained by activations both specific to facial expressions and to pain reports. In particular, I believe that two elements would have significantly increased the robustness of the findings:

      (1) Control conditions for both the facial expressions and the sensory input. An efficient signature should not be predictive of neutral and emotional facial expressions (e.g., disgust) other than pain expressions, as well as it should not be predictive of sensations originating from innocuous warm stimulation or other unpleasant but non-painful stimulation.

      We do recognize the lack of specificity testing for the FEPS, especially towards negative emotional facial expressions. This would be relevant to test given the behavioural overlap between the facial expressions of pain and disgust, fear, anger, and sadness (Kunz et al., 2013; Williams, 2003). The experimental design used in this study did not include other negative states. However, we fully support the necessity of collecting data throughout those conditions, and we believe that the present study highlights the importance of such a demonstration. Future research should involve recording facial expressions while exposing participants to stimuli that elicit a range of negative emotions but, to our knowledge, such combination of fMRI and behavioural data is currently unavailable. As raised by the reviewer, this approach would allow us to assess the specificity of the FEPS to the facial expression evoked by pain compared to different affective states. We would like to emphasise that specificity and generalizability testing is a massive amount of work, requiring multiple studies to address comprehensively. A Limitations paragraph addressing this research direction has been added to the Discussion. A conclusion was added to the abstract as follows: “Future studies should explore other pain-relevant manifestations and assess the specificity of the FEPS against other types of aversive or emotional states.”

      (2) Graded intensity of the sensory stimulation: different intensities of the thermal stimulation would have caused a graded facial expression (from neutral to pain) and graded verbal reports (from no pain to strong pain), thus offering a sensitive characterisation of the signal associated with this condition (and the warm control condition).

      However, these conditions are missing from the current design, and therefore we cannot make a strong conclusion about the generalisability of the signature (regardless of whether it can predict better than other signatures - which may/may not suffer from similar or other methodological issues - another potential interesting scientific question!). The authors seem to work on the assumption that the trials where warm stimulation was delivered are of no use. I beg to disagree. As per my previous comment, warm trials (and associated neutral expressions) could be incorporated into the statistical model to increase the classification sensitivity and precision of the FEPS decoding.

      The experience of pain can fluctuate for a fixed intensity or after controlling statistically for the intensity of the stimulation (Woo et al., 2017). Consistent with this, the current study focused on spontaneous facial expression in response to noxious thermal stimuli delivered at a constant intensity that produced moderate to strong pain in every participant. As the reviewer points out, this does not allow us to characterise and compare the stimulus-response function of facial expression and pain ratings. The advantage of the approach adopted is to maximise the number of trials where facial expression is more likely to occur, while ensuring that changes in facial expression and pain ratings are not confounded with changes in stimulus intensity. The manuscript has been revised to clarify that point. However, we do agree that it would be interesting to conduct more studies focusing on facial expression in response to a range of stimulus intensities. This discussion has been added to the Limitations paragraph.

      Furthermore, following the reviewer’s suggestion, we performed complementary analyses on the warm trials in the proposed revisions. The dot product (FEPS scores) between the FEPS and the activation maps associated with the warm condition was computed. A linear mixed model was conducted to investigate the association between FEPS scores and the experimental condition (warm vs pain). The trials in the pain condition were divided into two conditions: null FACS scores (painful trials with no facial response; FACS scores = 0) and non-null FACS scores (painful trials with a facial response; FACS > 0). The details of this analysis have been added to the manuscript (see Response of the FEPS to pain and warm section in the Methods; lines 427 to 439) as well as the corresponding results (see Results and Discussion; lines 138 to 158). The FEPS scores were larger in the pain condition where a facial response was expressed, compared to both the pain condition without facial expression and the warm condition. These results confirmed the sensitivity of the FEPS to facial expression of pain.

      Reviewer #2 (Public Review):

      Summary:

      The objective of this study was to further our understanding of the brain mechanisms associated with facial expressions of pain. To achieve this, participants' facial expressions and brain activity were recorded while they received noxious heat stimulation. The authors then used a decoding approach to predict facial expressions from functional magnetic resonance imaging (fMRI) data. They found a distinctive brain signature for pain facial expressions. This signature had minimal overlap with brain signatures reflecting other components of pain phenomenology, such as signatures reflecting subjective pain intensity or negative effects.

      We appreciate this concise and accurate summary of our study.

      Strength:

      The manuscript is clearly written. The authors used a rigorous approach involving multivariate brain decoding to predict the occurrence and intensity of pain facial expressions during noxious heat stimulation. The analyses seem solid and well-conducted. I think that this is an important study of fundamental and clinical relevance.

      Weaknesses:

      Despite those major strengths, I felt that the authors did not suffciently explain their own interpretation of the significance of the findings. What does it mean, according to them, that the brain signature associated with facial expressions of pain shows a minimal overlap with other pain-related brain signatures?

      We express our sincere gratitude for the valuable insights and constructive comments on the strengths and weaknesses of the current study. We thank reviewer 2 for the encouragement to reinforce our interpretation of the significance of the findings, while acknowledging the limitations raised by the three reviewers.

      A few questions also arose during my reading.

      Question 1: Is the FEPS really specific to pain expressions? Is it possible that the signature includes a facial expression signal that would be shared with facial expressions of other emotions, especially since it involves socio-affective regulation processes? Perhaps this question should be discussed as a limit of the study?

      We acknowledge this limitation as outlined in response to Reviewer #1. We have incorporated a Limitations paragraph to provide a more in-depth discussion of this limitation and to explore potential future avenues (lines 225 to 268). Again, please note that the demonstration of specificity is an incremental process that requires a systematic comparison with other conditions where facial expressions are produced without pain. A concluding sentence was added to the abstract to encourage specificity testing in future studies. as indicated above.

      Question 2: All AUs are combined together in a composite score for the regression. Given that the authors have other work showing that different AUs may be associated with different components of pain (affective vs. sensory), is it possible that combining all AUs together has decreased the correlation with other pain signatures? Or that the FEPS actually reflects multiple independent signatures?

      The question raised is consistent with the work of Kunz, Lautenbacher, LeBlanc and Rainville (2012), and Kunz, Chen and Rainville (2020). In the current study, the pain-relevant action units were combined in order to increase the number of trials where a facial response to pain was expressed, thus enhancing the robustness of our analyses. Given the limited sample size, our current dataset is unfortunately insufficient to perform such analysis as there would not be enough trials to look at the action units separately or in subgroups. While the approach of combining the different AUs has proven to be valid and useful, we recognize the value of investigating potential independent signatures associated with the different AUs within the FEPS, and examining whether those signatures can lead to more similar patterns compared to previously developed pain signatures. This discussion has been included in the Limitations paragraph in the Discussion (lines 225 to 268).

      Question 3: Is facial expressivity constant throughout the experiment? Is it possible that the expressivity changes between the beginning and the end of the experiment? For instance, if there is a habituation, or if the participant is less surprised by the pain, or in contrast if they get tired by the end of the experiment and do not inhibit their expression as much as they did at the beginning. If facial expressivity changes, this could perhaps affect the correlation with the pain ratings and/or with the brain signatures; perhaps time (trial number) could be added as one of the variables in the model to address this question.

      The concern raised by the reviewer is legitimate. We conducted a mixed-effects model to assess the impact of successive trials and runs on facial expressivity. Results indicate that the FACS scores did not change significantly throughout the experiment, suggesting no notable effect of habituation or sensitization on the facial expressivity in our study. Details about the analysis and the results have been added to the Facial Expression section in the Methods (lines 335 to 346).

      Reviewer #3 (Public Review):

      In this manuscript, Picard et al. propose a Facial Expression Pain Signature (FEPS) as a distinctive marker of pain processing in the brain. Specifically, they attempt to use functional magnetic resonance imaging (fMRI) data to predict facial expressions associated with painful heat stimulation. The main strengths of the manuscript are that it is built on an extensive foundation of work from the research group, and that experience can be observed in the analysis of fMRI data and the development of the machine learning model. Additionally, it provides a comparative account of the similarities of the FEPS with other proposed pain signatures. The main weaknesses of the manuscript are the absence of a proper control condition to assess the specificity of the facial pain expressions, a few relevant omissions in the methodology regarding the original analysis of the data and its purpose, and a biased interpretation of the results.

      I believe that the authors partially succeed in their aims, as described in the introduction, which are to assess the association between pain facial expression and existing pain-relevant brain signatures, and to develop a predictive brain activation model of the facial responses to painful thermal stimulation. However, I believe that there is a clear difference between those aims and the claim of the title, and that the interpretation of the results needs to be more rigorous.

      We wish to express our appreciation for the insightful and constructive critique provided. The limitation pertaining to the absence of specificity testing had been addressed in response to Reviewer #1, and it has been incorporated into the manuscript (lines 251 to 258).

      The commentary made by Reviewer #3 has drawn our attention to a critical concern, namely the potential misalignment between the study findings and our original title. Consequently, we have changed the title to “A distributed brain response predicting the facial expression of acute nociceptive pain”. We also revised the interpretation of the results in the discussion section and we have added a section on limitations.

      Recommendations for the Authors:

      Reviewer #1 (Recommendations For The Authors):

      I hope the following comments will be useful to improve the manuscript.

      Abstract

      I felt the abstract could be more clear in terms of experimental or scientific questions, hypotheses/expectations, and findings. I also feel the abstract should briefly support the conclusive claim ("is better than...": how better? Or according to what criterion? This may be more relevant than the final conclusive general sentence that does not specifically address the significance of the findings).

      The abstract was revised to reinforce the functional perspective adopted to interpret brain activity produced by noxious stimuli and predicting various pain-relevant manifestations. We also mention explicitly the other pain-relevant signatures against which the FEPS is compared in this report, and we added a concluding sentence highlighting the importance of assessing the specificity of the FEPS in future studies.

      Introduction - background and rationale

      I would postpone the discussion around pain signature and anticipate the one about the brain mechanisms of facial expressions of pain. This will allow you to reinforce the logical flow of rationale, literature gap/question, why the problem is important, and study aims. Only then go for a review of relevant literature on signatures before providing a more specific final paragraph about the study-specific questions, expectations, and implementation. At the moment this is limited to a single very descriptive short paragraph at the end of the intro.

      The introduction was structured to guide the readers through a comprehensive understanding of different pain neurosignatures. The introduction aimed to establish a robust rationale for the subsequent analyses detailed in the results section. Indeed, the presentation of that literature ensured that the discussion around pain signatures is contextualised within a broader continuous framework. We acknowledge the reviewer’s comment on the limited description of the brain mechanisms of facial expression of pain. However, this was addressed in several previous reports of our laboratory (Kunz et al. 2011; Vachon-Presseau et al. 2016; Kunz, Chen, and Rainville 2020). We have added some more details about the brain mechanisms of facial expression, and highlighted those references in the first paragraph of the introduction.

      Methods and Results

      (1) Was there any indication of power based on the previous work or the other signature papers? If yes, how that would inform the present analysis?

      The NPS was trained on 20 participants that experienced 12 trials at each of four different intensities. The assessment of the effect sizes was performed on the Neurological Pain Signature in Han et al. (2022). That study revealed a moderate effect size for predicting between-subject pain reports, and a large one for predicting within-subject pain reports. We trained our model on 34 participants that underwent 16 trials. We expected our results to show a smaller effect size as the current experimental design only allowed us to examine spontaneous changes in the facial expression, as noted in the comments made by Reviewer #1. However, the best way to calculate the unbiased effect size of the results presented in the current study would be to test the unchanged model on new independent datasets (see Reddan, Lindquist, and Wager, 2017). Unfortunately, such datasets do not currently exist.

      (2) I would clarify to the reader what is meant by normal range of thermal pain and why is this relevant. Also, I did not find data about this assessment nor about the assessment of facial expressiveness (or reference to where it can be found).

      We changed this formulation to “All participants included in this study had normal thermal pain sensitivity” and we added a few references. By targeting a healthy population with normal thermal pain sensitivity, our study sought to identify a predictive brain pattern related to facial expression evoked by typical responses to pain that could eventually be generalised to other individuals from the same population. Details about the assessment of facial expressiveness have been added in the appropriate section in the Methods.

      (3) That pain ratings are only weakly associated with facial responses is, in its own right, an interesting finding, as a naïve reader would expect the two to be highly positively correlated. I'd suggest discussing this aspect (in reference to previous research) as it is interesting on both theoretical and empirical grounds.

      The likelihood and the strength of pain facial expression generally increase with pain ratings in response to acute noxious stimuli of increasing physical intensities, thereby leading to a positive association between the two responses that is driven by the stimulus. However, the poor correlation or the dissociation between facial pain expression and pain rating is a very well known phenomenon that can be demonstrated easily using experimental methods where the stimulus intensity is held constant and spontaneous fluctuations are observed in both facial expression and pain ratings. This result was not discussed in the current manuscript as it was already addressed in the work of Kunz et al. (2011) and Kunz, Karos and Vervoot (2018). We added the references to these studies in the revised manuscript (lines 330 to 334).

      (4) It may be worth having CIs throughout the whole set of analyses.

      Thanks for the suggestions, this was an oversight. The confidence intervals have been added in the manuscript where applicable.

      (5) I would clarify if there are two measures of the brain signature: dot-product and activation map. Relatedly, I cannot find where the authors explained what "FEPS pattern expression scores". Can the authors please clarify?

      The clarification has been added in the manuscript (lines 413 to 414).

      (6) There seems to be the assumption that the relationship between pain-relevant brain signatures and facial expressions of pain would be parametric and linear. However, this might not hold true. Did the authors test these assumptions?

      We indeed decided to use a linear regression technique (i.e. LASSO regression) to model the association between the brain activity and the facial expression of pain. The algorithm choice was mainly based on the simplicity and the interpretability of that approach, and our limited number of observations. The choice was also coherent with previous studies in the domain (e.g. Wager et al., 2011; Wager et al., 2013; Krishnan et al. 2016; Woo et al., 2017). Using a linear model, we were able to predict above chance level the facial expression evoked by pain using the fMRI activation. However, it is legitimate to think that more complex non linear models can better capture the brain patterns predictive of that behavioural manifestation of pain.

      (7) Did the authors assess whether the FACS were better to be transformed/normalised? More generally, I would report any data assessment/transformation that has not been reported.

      Thank you for this highly relevant suggestion. FACS scores were indeed not normally distributed and the analyses were conducted again to predict the log transformed FACS scores. This transformation was effective to normalize the distribution (skewness = 0.75, kurtosis = -0.84). The predictive model was confirmed on transformed data.

      (8) Page 12: I am not clear on whether all the signatures are included in the same model (like a multiple regression) or if separate regressions are calculated per signature. The authors seem to imply that several regressions have been computed (possibly one per comparison with each signature?).

      The correlation between the FACS scores and the pain-related signatures was computed separately for each signature. This information has been clarified.

      (9) MVPA: See my main comment about warm trials and experimental/statistical design. For example, the LASSO regression model for the pain trials could be compared with a model using warm trials besides (or instead of) the unfitted model. Otherwise, add the warm trials as another predictor or within the subject level in a dummy fixed factor comprising pain and warm trials.

      The inclusion of warm trials in the model training would be inconsistent with the goal of the main analysis to predict the facial expression of pain when a noxious pain stimulus is presented. Secondary analyses were conducted to compare the response of the FEPS to the warm trials compared to noxious pain trials. The dot product between the FEPS and the activation maps (FEPS scores) associated with the warm condition was computed. A linear mixed model was conducted to investigate the association between FEPS scores and the experimental condition (warm vs pain). Additional contrasts compared the warm trials with the pain trials with and without pain facial expression. The details of this analysis have been added to the manuscript (see Response of the FEPS to pain and warm in the Methods) as well as the corresponding results (see Results and Discussion).

      (10) I would clarify for the reader why the separate M1 analysis has been run. Although obvious, I feel the reader would benefit from the specific hypothesis about this control analysis being spelled out together with the other statistical hypotheses within the statistical design in a more streamlined manner.

      We extended the discussion on the rationale of that analysis and its interpretation taking into account the most recent results using the log transformed FACS scores (lines 125 to 133).

      (11) The mixed model aimed to assess the relationship between pain ratings FEPS scores and facial scores is a crucial finding. I believe it speaks to the importance of a more complete design, which I already highlighted. I have a couple of technical questions: did the authors assess random slopes too? And, what was the strategy used to determine the random effects structure?

      The linear mixed model considered the participants as a random effect, with random intercepts, considering the grouping structure in our data (i.e., each participant completed multiple trials). The reported results in the original manuscript were considering fixed slopes. However, following the reviewer’s comment, we re-computed the mixed linear models allowing the slopes to vary according to the intensity ratings. The results were changed in the manuscript to represent the output of those models.

      (12) The text from lines 63 to 67 could go in the methods.

      We decided to include those lines within the Result and Discussion section to give the reader more specification about the FACS scores, as this term is subsequently referenced in the following part of the Results and Discussion section. We are concerned that putting this information only in the Methods section would disrupt the reading.

      Reviewer #2 (Recommendations For The Authors):

      p. 4-5. When you report the positive weight clusters, you follow up with a sentence specifying which cognitive processes those brain regions are typically associated with. However, when you report the negative weight clusters, you do not specify the cognitive processes typically associated with those brain areas. I think that providing that information would be helpful to the readers.

      Thanks for noticing this omission. The information has been added in the most recent version of the manuscript (lines 119 to 121).

      p. 9. You specify that the degree of expressiveness of participants was evaluated. How did you evaluate expressiveness? Did you use this variable in your analyses? Were participants excluded based on their degree of expressiveness?

      Details about the assessment of facial expressiveness have been added in the appropriate section in the Methods (lines 285 to 289).

      p. 10. You explain that two certified FACS-coders evaluated the video recordings to rate the frequency of AUs. Could you please provide more details about the frequency measure? I think that there are different ways in which this could have been done. For instance, were the videos decomposed into frames, and then the frequency measured by summing the number of frames in which the AU occurred? Or was it "expression-based", so one occurrence of an AU (frequency of 1) would correspond to the whole period between its activation onset and offset? Both ways have pros and cons. For example, if the frequency represents the number of frames, then it controls for the total duration of the AU activation within a trial (pro); but if there were multiple activations/deactivations of the AU within one trial, this will not be controlled for (con). And vice-versa with the second way of calculating frequency.

      Details about the frequency scores have been added to the manuscript (lines 315 to 319).

      p. 11. When you explained how you calculated the association between the facial expression of pain and pain-related brain signatures, I felt that there was some information missing. Did you use the thresholded maps (available in the published articles), or did you somehow have access to the complete, voxel-by-voxel, raw regression coefficient maps?

      The unthresholded maps were used. The information has been clarified in the latest version of the manuscript, as well as the details about the availability of the maps (see Data Availability section at the end of the manuscript).

      Reviewer #3 (Recommendations For The Authors):

      Format

      The authors will notice that many observations about the manuscript are related to missing information and a lack of graphical representations. I believe the topic and the content of the manuscript are too complex to condense into a short report.

      Title

      The claim of the title is simply not substantiated by the content of the manuscript. Demonstrating that the FEPS is a distinctive (i.e., specific) marker of pain processing requires a substantially different experimental design, with more rigorous controls and a broader set of painful stimulations. The manuscript would benefit from a more accurate title.

      We agree that the title could better align with our findings. We modified the title accordingly : “A distributed brain response predicting the facial expression of acute nociceptive pain”.

      Abstract

      I find it puzzling that the authors claim that there is limited knowledge of the neural correlates of facial expression of pain given what they describe in the first paragraph of the introduction. Besides, they propose to reanalyze a dataset that has been extensively described in Kunz et al. (2011), which is unlikely to provide any new significant information.

      We respectfully disagree with that comment. We considered that three articles (i.e., Kunz et al., 2011; Vachon-presseau et al., 2016; Kunz, Chen and Rainville, 2020) on the topic do constitute limited knowledge, especially if we compare it to the very large body of literature on the neural correlates associated with pain ratings. Except for these three studies, all the other citations pertain to behavioral studies on facial expression of pain, and do not examine the brain activity related to it. Furthermore, we believe that the complementary nature of the analyses performed in Kunz et al. (2011) and in this manuscript offers new insights into our understanding of facial expression in the context of pain. Indeed, the multivariate approach used in this study addresses some limitations present in Kunz et al. (2011) univariate analyses, mainly that it provides a quantifiable way to compare the similarity between different predictive patterns (Reddan and Wager, 2017). We submit that the assessment of the FEPS against several other pain-relevant signatures provides new and important information.

      Furthermore, the abstract does not clearly state the aim, and the first line of the results does not match what the authors claim in the preceding line. The take-home message (last sentence) introduces the concept of a biomarker, which, as stated before, cannot be validated with the current data/experimental design. To put it in plain words, a given facial expression (or a composite score derived from a combination of expressions) cannot be a specific biomarker for pain, because a person can always mimic the same expression without feeling pain. Whether a given facial expression can be predicted from brain activity is a different issue, and whether that prediction can differentiate between painful and non-painful origins of the facial expression is another different issue. Unfortunately, neither of those issues can be tested with the current data/experimental design. The abstract would improve if the authors would circumscribe to what they actually tested, which is accurately described in the last sentence of the Introduction.

      The abstract was revised accordingly. The term ‘biomarker’ was used in accordance with preceding studies in the field (see Reddan and Wager, 2017; Lee et al., 2021). Please note that we applied the same reasoning to fluctuations in pain expression as previous studies have applied to pain ratings. Of course, we can not dismiss the possibility of someone mimicking facial expressions. Similar reasoning applies to subjective reports, as individuals can intentionally overestimate their pain experience conveyed through verbal reports. This is another case of specificity testing that cannot be addressed in the present study (see new conclusion of the abstract and discussion of limitations). The challenge of pain assessment is a classical problem within both the scientific and the clinical literature. Here, we suggest that the consideration of multiple manifestations of pain is necessary to address this challenge and will provide a more comprehensive portrait of pain-related brain function.

      Introduction

      I believe that the Introduction would benefit from a strict definition of what is a marker/biomarker/neuromarkers (all those terms are used in the manuscript) and what are its desirable features (validity, reliability, specificity, etc.). I also believe that the Introduction (and the rest of the text) would benefit from a critical assessment of the term "signature". The Introduction describes four existing "signatures", all of them differing in the experimental condition in which acute nociceptive pain is studied, and proposes a fifth one. Keeping with the analogy, I'm wondering whether they should be called (pain) "signatures" if there is a different one for each experimental acute pain condition, and they are so dissimilar between them when they are tested on the same condition (this dataset).

      The last part of that comment raises fundamental methodological potential limitations that should be addressed in more depth in another article. That point goes beyond the scope of a research article. Regarding the stability aspect of the signatures, most of the signatures have not been studied extensively. It is thus difficult to currently assess their reliability. However, Han et al. (2022) showed high within-individual test-retest reliability for the NPS across eight different studies. Given that pain is a multidimensional experience, it is not surprising to find different patterns of activation predictive of different aspects or dimensions of the pain experience (see Čeko et al., 2022 for a similar discussion applied to negative affect).

      The authors state that "As an automatic behavioral manifestation, pain facial expression might be an indicator of activity in nociceptive systems, perceptual and evaluative processes, or general negative affect." Doesn't it reflect all three of them? (and instead of or?) Why "might"?

      The original sentence has been modified as follows: “As an automatic behavioral manifestation, pain facial expression is considered to be an indicator of activity in nociceptive systems, and to reflect perceptual and affective-evaluative processes” (lines 65 to 67).

      Methods

      The pain scale should be described. Kunz et al. used a 0-100 scale, where 50 was the pain threshold. This is crucial to interpret the 75-80/100 score for the painful thermal intensity.

      The description of the pain scale has been added to the manuscript (lines 299 to 300).

      Ratings for warm and painful temperatures should be reported (ideally plotted with individual-trial/subject data). In the same line of reasoning, FACS scores should be reported as well (ideally plotted with individual-trial/subject data). It would be interesting to explore the across-trial variability of pain ratings and FACS scores. That is, do people keep giving the same ratings and making the same facial expression after 16 trials? How much variability is between trials and between subjects?

      The point raised in that comment was already addressed in response to a comment made by Reviewer #1 (also see the new Figures S2 and S4; see also lines 335 to 346).

      How come only painful trials are analyzed? What if the FEPS signature was the same for warm and painful stimulation, thus reflecting the settings (fMRI experiment, stimulation, etc.) rather than the brain response to the stimuli?

      The point raised in that comment was already addressed in response to a comment made by Reviewer #1. There was no pain expression in the warm trials and the FEPS shows no response to warm trials. This is now illustrated in the new Figure S4B (see also lines 138 to 158).

      The authors propose to predict the trial-by-trial FACS composite score from the pain ratings using a LMM. However, it is interesting that they aim for an almost constant within- and between-subject pain score (75-80/100) as stated in the Methods. This should theoretically render the linear model invalid since its first (and main) assumption would be that FACS should vary linearly with the pain score. Even if patients were not aware that the temperatures were constant across trials, the variation in pain scores should be explained by random noise for a constant stimulation intensity.

      Reviewer #3 raises an important point that we need to clarify. Contrary to the expectation that FACS responses should be strongly correlated to pain ratings, we posited that these response channels depend at least in part on separate brain networks that may be differentially sensitive to a variety of modulatory mechanisms (attention, emotion, expectancy, motor priming, social context, etc.). This implies that part of the variance in FACS is independent from pain ratings. We, therefore, consider what Reviewer #3 refers to as random noise to be relevant and meaningful fluctuations reflecting endogenous processes influencing one’s experience of pain and differentially affecting various output responses.

      I noticed that fMRI data was analyzed with SPM5 in the original paper (Kunz et al., 2011) and with SPM8 in this manuscript. Was fMRI data re-processed for this manuscript? Were there any differences between the original analysis and this one that might induce changes in the interpretation of results?

      The data were indeed re-processed using SPM8, which was the most recent version available when we started the analyses reported here. We used trial-by-trial activation maps for MVPA, which differs from what was used in the previous study (contrast maps at the level of the conditions, not the trials). We have no reason to believe that the different versions will change the message of this manuscript since those versions do not differ significantly in terms of the fMRI preprocessing pipeline (see SPM8 release notes; https://www.fil.ion.ucl.ac.uk/spm/software/spm8/). Furthermore, the aim of this present study is not to compare the different analysis parameters implemented in SPM5 vs SPM8.

      What is the rationale for including PVP in the comparison among signatures? The experimental settings in which it was devised are distant from those described here.

      The inclusion of the PVP was aimed at enhancing our comparative analysis with the FEPS, as we sought to investigate the potential functional meaning of the FEPS. The PVP was developed to capture the aversive value of pain, a dimension that is conceptually proximal to the interpretation of the facial expression as a manifestation of the affective response to nociceptive pain.

      The LASSO-PCR approach is, in my opinion, not a procedure for (brain) decoding in this context. It is accurately described in the section title as a method for multivariate pattern analysis, or as a variable selection and regularization method for a prediction model. Here, brain activity in specific areas related to pain processing can hardly be described as "encoded", and the method just helps select those activations relevant for explaining a certain outcome (in this case, facial expressions).

      We understand the point made by reviewer #3. The term brain decoding was changed for multivariate pattern analysis in the latest version of the manuscript.

      Details are missing with regards to the dataset split into training, validation, and testing.

      Details about the training and testing procedure were added in the manuscript (lines 383 to 385).

      This might just be ignorance from me, so I apologize in advance, but what are "contrast" fMRI images? They are mentioned three times in the text but not really described. Are they the "Pain > Warm" contrasts from the original paper?

      We apologize for any confusion caused by the use of the term “contrast images” which suggests a direct comparison between two experimental conditions. We have replaced “contrast images” with “activation maps” to provide a more accurate description of the nature of the data used in the multivariate pattern analysis (lines 388 to 389).

      In the "Facial expression" section, the authors run an LMM to test the association between pain ratings (response variable) and facial responses (explanatory variable). If I understand correctly, in the "Multivariate pattern analysis" section they test the association between facial composite scores (response variable) and pain ratings (explanatory variable), but they obtain different results.

      The analyses were recomputed on the log transformed data, as mentioned previously in the response to reviewers 1-2. The first model (in the “Facial expression” section) used the log transformed FACS scores as a dependent variable, the pain ratings as the fixed effect, and the participants as the random effect. The results of that analysis suggested that the transformed facial expression scores were not significantly associated with the pain ratings (p = .07). The second model uses both the FEPS pattern expression scores and pain ratings as fixed effects to predict facial responses. This analysis showed the significant contribution of the FEPS to the prediction of FACS scores (p < .001) and no significant effect of the pain ratings. However, a significant interaction was found (p = .03) suggesting that the prediction of the pain facial expression by the FEPS may vary with pain ratings (i.e. moderator effect). Those results have been clarified in the “Multivariate pattern analysis” section in the Methods (lines 416 to 426).

      In this same section, what are "FEPS pattern expression scores"? They are used three times in the text, but I could not find their description.

      The FEPS pattern expression scores correspond to the dot product between the trial-by-trial activation maps and the unthresholded FEPS signature. This information has been added to the manuscript (lines 413 to 414).

      It would not be far-fetched to hypothesize that FACS scores could be predicted using solely activity from the motor cortex. The authors attempted to do this, but only with information from M1. Why did they not use the entire motor cortex, or better, regions of the motor cortex directly linked with the AUs described in the manuscript?

      The selection of the primary motor area (M1) was based on the results found in Kunz et al. (2011). In this study, M1 showed the strongest correlation with facial expression of pain. There are numerous possibilities of combinations of multiple brain regions considering a variety of criteria based on distributed networks involved in motor, affective, or pain-related processes. We limited our exploration to the region with the strongest hypothesis due to practical feasibility concerns.

      Results and Discussion

      As a general recommendation, results should present individual data whenever possible. For example, the association between signatures and facial expression should be plotted using scatterplots.

      We have added figures showing individual data when it was applicable (Figure S2; Figure S4).

      The authors state that the LASSO-PCR model accounts for the facial responses to pain. I believe this is an overstatement, considering:

      - A Pearson's r of 0.49 is usually considered low/weak correlation (moderate at best). In the same line, an R2 of 0.17 means that only 17% of the variance is explained by the model.

      More nuanced interpretation of the results has been added to the discussion. A section has been added to highlight the limitations of the study.

      - Figure 1 needs to display individual subject data and the ideal regression line.

      The model was trained using a k-fold cross-validation procedure. The regression lines thus represent the model’s prediction for each one of the 10 folds (i.e. each fold is trained and tested on a different subset of the data). A scatter plot including the ideal regression line computed across all trials and subjects was added in supplementary material to illustrate the relation between the FACS scores and the FEPS pattern expression scores (Figure S4).

      - Looking at Figure 1, it is clear that the model has an intercept different from zero. This means that when the FACS score was zero (i.e., volunteers did not make any distinguishable facial expression), the model predicted a score larger than zero. This is not discussed in the manuscript, and in simple terms, it means that there are brain activation patterns when no discernible facial expression is being made by the volunteers. In the original paper by Kunz et al., two groups of subjects were categorized, and one of them was a facially low- or non-expressive group (n=13). This fact is not even mentioned in the manuscript.

      The categorization in the previous report (Kunz et al., 2012) was based on a pre-experimental session. All subjects were included in the current analysis. This is now indicated in the Methods (lines 287 to 289).

      - On the other end of the range in Figure 1, differences between the FACS scores near the maximum range (40) are underestimated by 23 to 33 points! I guess that the RMSE is smaller (6-7 points), because many FACS scores are concentrated on the low end of the scale.

      This is a very interesting comment. A section discussing the limits of the model to predict the lower and higher FACS scores has been added in the manuscript (lines 232 to 250).

      It is of course acceptable to interpret the low similarity between signatures as a sign that each signature describes a different mechanism related to pain processing. However, I believe that a complete discussion should contemplate other competing hypotheses. Considering that all signatures were developed using a similar painful thermal stimulation protocol, it is reasonable to expect larger similarities between signatures. The fact that they are so dissimilar could be a reflection of model overfit, i.e., all these signatures are just fitted to these particular experimental protocols and data, and do not generalize to brain mechanisms of pain processing.

      We appreciate the pertinent observation. We have included a limitations section in which we discussed, among other considerations, the possible overfitting of models and the necessity of pursuing generalizability studies (lines 225 to 268).

    1. Author response:

      The following is the authors’ response to the original reviews.

      eLife assessment

      This is an important study on the regulation of chlorophyll biosynthesis in rice embryos. It provides insights into the genetic and molecular interactions that underlie chlorophyll accumulation, highlighting the inhibition of OsGLK1 by OsNF-YB7 and the broader implications for understanding chloroplast development and seed maturation in angiosperms. The results presented, including mutation analysis, gene expression profiles, and protein interaction studies, provide convincing evidence for the function of OsNF-YB7 as a repressor in the chlorophyll biosynthesis pathway.

      Thank you very much for your positive assessment of our manuscript. We have carefully revised the manuscript according to the reviewers’ valuable suggestions and comments. For more details, please see the point-to-point response to the reviewers below.

      Public Reviews:

      Reviewer #1 (Public Review):

      Summary:

      This manuscript investigates the regulation of chlorophyll biosynthesis in rice embryos, focusing on the role of OsNF-YB7. The rigorous experimental approach, combining genetic, biochemical, and molecular analyses, provides a robust foundation for these findings. The research achieves its objectives, offering new insights into chlorophyll biosynthesis regulation, with the results convincingly supporting the authors' conclusions.

      Strengths:

      The major strengths include the detailed experimental design and the findings regarding OsNF-YB7's inhibitory role.

      Weaknesses:

      However, the manuscript's discussion on the practical implications for agriculture and the evolutionary analysis of regulatory mechanisms could be expanded.

      Thank you for your insightful comments and suggestions. In the revised manuscript, we discussed the potential application of the chlorophyllous embryo (please see line 270-274). The presence of chlorophyll in the embryo facilitates photosynthesis at early developmental stages, potentially leading to improved seedling growth and vigor (Smolikova and Medvedev, 2016). In crops such as soybean and canola, green embryo is considered as a valuable trait due to its association with enhanced photosynthetic capacity, which consequently promotes fatty acid biosynthesis (Ruuska et al., 2004). However, chlorophyll degradation must be carefully managed during seed maturation to avoid negative effects on seed viability and meal quality (Chung et al., 2006). Interestingly, the green embryo of lotus (Nelumbo nucifera) is widely used as a food ingredient in Asian, Australia, and North America. It is employed in herbal medicine to treat nervous disorders, insomnia, and other conditions (Zhu et al., 2017; Ha et al., 2022), highlighting the significant potential value of the green embryo.

      In many chloroembryophytes, such as Arabidopsis, the embryo occupies a large proportion of the seed. From an evolutionary perspective, the presence of chlorophyll in the embryo may promote adaptation in such chloroembryophytes because more reserves can be accumulated in the seed through active photosynthesis, better supporting the embryo development and subsequent seedling growth (Sela et al., 2020). On the other hand, some leucoembryophytes, such as rice, have persistent endosperm rich in storage reserves to nourish embryo development (Liu et al., 2022). Gaining the ability to accumulate chlorophyll in the embryo is unnecessary for such species. In agreement with this hypothesis, cholorophyllous embryos are more prevalent in non-endospermous seeds (Dahlgren, 1980). However, we would like to emphasize that the evolutionary force driving the divergence of chloroembryophytes and leucoembryophytes is currently almost completely unknown and deserves in-depth investigation in the future. We discussed the possible evolution of the ability to accumulate chlorophyll in the embryo, please find the details in Line 276-295.

      Reviewer #2 (Public Review):

      Summary:

      The authors set out to establish the role of the rice LEC1 homolog OsNF-YB7 in embryo development, especially as it pertains to the development of photosynthetic capacity, with chlorophyll production as a primary focus.

      Strengths:

      The results are well-supported and each approach used complements each other. There are no major questions left unanswered and the central hypothesis is addressed in every figure.

      Weaknesses:

      There are a handful of sections that could use clarifying for readers, but overall this is a solidly composed manuscript.

      The authors clearly achieved their aims; the results compellingly establish a disparity between how this system operates in rice and Arabidopsis. Conclusions are thoroughly supported by the provided data and interpretations. This work will force a reconsideration of the value of Arabidopsis as a model organism for embryo chlorophyll biosynthesis and possibly photosynthesis during embryo maturation more broadly, as rice is a major crop organism and it very clearly does not follow the Arabidopsis model. It will thus be useful to carry out similar tests in other organisms rather than relying on Arabidopsis and attempting to more fully establish the regulatory mechanism in rice.

      Thank you very much for your positive comments. We have carefully revised the manuscript according to your and the other reviewers’ comments and suggestions. Particularly, we emphasized the necessary to carry out similar tests in other organisms rather than relying on Arabidopsis to better understand the regulatory mechanism in rice.

      Reviewer #3 (Public Review):

      Summary:

      In this study, the authors set out to understand the mechanisms behind chlorophyll biosynthesis in rice, focusing in particular on the role of OsNF-YB7, an ortholog of Arabidopsis LEC1, which is a positive regulator of chlorophyll (Chl) biosynthesis in Arabidopsis. They showed that OsNF-YB7 loss-of-function mutants in rice have chlorophyll-rich embryos, in contrast to Arabidopsis LEC1 loss-of-function mutants. This contrasting phenotype led the authors to carry out extensive molecular studies on OsNF-YB7, including in vitro and in vivo protein interaction studies, gene expression profiling, and protein-DNA interaction assays. The evidence provided well supported the core arguments of the authors, emphasising that OsNF-YB7 is a negative regulator of Chl biosynthesis in rice embryos by mediating the expression of OsGLK1, a transcription factor that regulates downstream Chl biosynthesis genes. In addition, they showed that OsNF-YB7 interacts with OsGLK1 to negatively regulate the expression of OsGLK1, demonstrating the broad involvement of OsNF-YB7 in rice Chl biosynthetic pathways.

      Strengths:

      This study clearly demonstrated how OsNF-YB7 regulates its downstream pathways using several in vitro and in vivo approaches. For example, gene expression analysis of OsNF-YB7 loss-of-function and gain-of-function mutants revealed the expression of selected downstream chl biosynthetic genes. This was further validated by EMSA on the gel. The authors also confirmed this using luciferase assays in rice protoplasts. These approaches were used again to show how the interaction of OsNF-YB7 and OsGLK1 regulates downstream genes. The main idea of this study is very well supported by the results and data.

      Weaknesses:

      From an evolutionary perspective, it is interesting to see how two similar genes have come to play opposite roles in Arabidopsis and rice. It would have been more interesting if the authors had carried out a cross-species analysis of AtLEC1 and OsNF-YB7. For example, overexpressing AtLEC1 in an osnf-yb7 mutant to see if the phenotype is restored or enhanced. Such an approach would help us understand how two similar proteins can play opposite roles in the same mechanism within their respective plant species.

      We appreciate your insightful comments and suggestions. It is a very interesting question whether AtLEC1 can fully restore osnf-yb7, given the possible functional divergence between the genes in terms of regulation of chlorophyll biosynthesis in the embryo. We have previously expressed OsNF-YB7 in the lec1-1 background in Arabidopsis, driven by the native promoter of LEC1 (Niu et al., 2021). We found that OsNF-YB7 could almost completely rescue the embryo defects in Arabidopsis, indicating that OsNF-YB7 plays a resemble role in rice as the LEC1 does in Arabidopsis (Niu et al., 2021). We sought to determine whether AtLEC1 can complement the chlorophyll defect in osnf-yb7. However, given the fact that osnf-yb7 shows severe callus induction defect, which is not surprising, because many studies have shown that LEC1 is indispensable for somatic embryo development in various plant species, we are struggling to obtain the genetic materials for analysis. We have to transform OsNF-YB7pro::AtLEC1 into the WT background first, and then cross the transformant with the osnf-yb7 mutant. This is a time-consuming process in rice, but hopefully we will able to isolate a line expressing OsNF-YB7pro::AtLEC1 in the osnf-yb7 background from the resulting segregating population.

      Recommendations for the authors:

      Reviewer #1 (Recommendations For The Authors):

      A minor comment regarding the chlorophyll contents quantification in the study. Line 87: "The results showed that WT had an achlorophyllous embryo throughout embryonic development,...." In the TEM result, chloroplast was not observed in the WT embryo sections, indicating a lack of chlorophyll-containing structures, contrary to what was found in the osnf-yb7 embryos where chloroplasts were observed.

      The authors stated that the embryo morphologies and Chl autofluorescence data showed that WT had an achlorophyllous embryo throughout embryonic development. However, the quantification of Chl levels in Figure 1D and Figure 4C showed that WT does produce some chlorophylls, albeit at lower levels than osnf-yb7 or OSGLK-OX embryos (WT values in the two figures are slightly different). This discrepancy warrants clarification to ensure consistency and accuracy in the manuscript's findings.

      We re-evaluated the Chl content in the embryos of WT and OsGLK1-OX mature seeds. The result confirmed our previous finding that WT embryos produce a small amount of chlorophyll (please see the updated Fig. 4C). Notably, we observed that the dark-grown etiolated plants still have measurable chlorophyll content as reported in many studies (for example, Wang et al., 2017; Yoo et al., 2019), suggesting that there is potential bias in measuring chlorophyll content using an absorbance-based approach. We assume this possibly explains the concern you have raised.

      Reviewer #2 (Recommendations For The Authors):

      Mild editing for grammar is needed throughout, e.g. line 73, "It is still a mysterious why plant species".

      We have carefully edited the grammar.

      As a minor point, the placement of figure panels, such as in Figure 1, is not always intuitive.

      Thank you for your suggestion. This figure has been revised as suggested. Please see the updated Fig. 1.

      What is the significance of the two GFP mutants in Figures 2C and 2D? Is one of those the mislabeled Flag mutant?

      The lines showed in Fig. 2C and D were not mislabeled. They were two independent transgenic events, both of which showed that OsNF-YB7 inhibited the expression of OsPORA and OsLHCB4 in rice. The transgenic lines overexpressing OsNF-YB7 tagging with the 3× Flag (NF-YB7-Flag) were also used for this experiment. In agreement, OsPORA and OsLHCB4 were significantly downregulated in the three independent NF-YB7-Flag lines (Fig. S4C), confirming the results showed in Fig. 2C and D.

      In Figures 2G and 2H, what is that enormous band at the bottom of the gel?

      The bands at the bottom of the gel were free probes. We indicated this in the revised figure.

      Not until the Materials and Methods section did I realize that any of this study was being done in tobacco; the Introduction implies it's rice vs. Arabidopsis and it might be a good idea to mention the organism of study somewhere before Figure 6.

      We apologize for any confusion caused by our previous writing. While the majority of this study was performed with rice plants or protoplasts, the split complementary LUC assays and BiFC assays were performed with tobacco. We have specified these in the revised manuscript as suggested.

      Reviewer #3 (Recommendations For The Authors):

      It would be nice if the author could show what the phenotype is in AtLEC1 OX in osnf-yb7 and also OsNF-YB7 OX in atlec1 mutants.

      Thank you for your suggestion. We have previously expressed OsNF-YB7 in the lec1-1 background of Arabidopsis, driven by the native promoter of Arabidopsis LEC1 (Niu et al., 2021). Since OsNF-YB7 could rescue the embryo morphogenesis defects in Arabidopsis (Niu et al., 2021), we assumed that OsNF-YB7 plays a similar role in rice as the LEC1 does in Arabidopsis. However, it remains unknown whether expression of LEC1 in osnf-yb7 may restore the chlorophyllous embryo phenotype in rice. As the generation of genetic material is time-consuming, and especially given the fact that osnf-yb7 has a severe callus induction defect, we are struggling to obtain the complementary line for analysis. We have to transform OsNF-YB7pro::AtLEC1 in a WT background first, and then cross the transformant with the osnf-yb7 mutant. Hopefully, we will be able to isolate a line expressing OsNF-YB7pro::AtLEC1 in osnf-yb7 background, from the derived segregating population. We discussed the reviewer’s concern in the revised manuscript, please see Line 369-376.

      Line 46, I think it is vague to mention that 'Like most plant species'. Some species might have different copy numbers, for example, a single GLK in liverwort M. polymorpha.

      The statement has been revised. Please see Line 46.

      Figures 2F and 5B, why was only one promoter region used for OsLHCB4? It would be better to have more regions like OsPORA.

      Thank you for your comments. Here, we have examined more promoter regions (P1, P2 and P3) in the revised manuscript as suggested, among which, the previously selected promoter region (P3) contains both the G-box and CCAATC motifs that can be potentially recognized by GLK1. Consistent to our previous report, the results showed that OsNF-YB7 (left) and OsGLK1 (right) were associated with the P3 region, but showed no significant differences in the other probes. Please see the results in Fig. 2F and Fig. 5B of the revised manuscript.

      Legend of Figures 2G, H, OsPORA (I), and OsLHCB (J) should be (G) and (H) respectively.

      Corrected.

      References

      Chung, D.W., Pruzinska, A., Hortensteiner, S., and Ort, D.R. (2006). The role of pheophorbide a oxygenase expression and activity in the canola green seed problem. Plant Physiol 142, 88-97.

      Ha, T., Kim, M.S., Kang, B., Kim, K., Hong, S.S., Kang, T., Woo, J., Han, K., Oh, U., Choi, C.W., and Hong, G.S. (2022). Lotus Seed Green Embryo Extract and a Purified Glycosyloxyflavone Constituent, Narcissoside, Activate TRPV1 Channels in Dorsal Root Ganglion Sensory Neurons. J Agric Food Chem 70, 3969-3978.

      Liu, J., Wu, M.W., and Liu, C.M. (2022). Cereal Endosperms: Development and Storage Product Accumulation. Annu Rev Plant Biol 73, 255-291.

      Niu, B., Zhang, Z., Zhang, J., Zhou, Y., and Chen, C. (2021). The rice LEC1-like transcription factor OsNF-YB9 interacts with SPK, an endosperm-specific sucrose synthase protein kinase, and functions in seed development. Plant J 106, 1233-1246.

      Ruuska, S.A., Schwender, J., and Ohlrogge, J.B. (2004). The capacity of green oilseeds to utilize photosynthesis to drive biosynthetic processes. Plant Physiol 136, 2700-2709.

      Sela, A., Piskurewicz, U., Megies, C., Mene-Saffrane, L., Finazzi, G., and Lopez-Molina, L. (2020). Embryonic Photosynthesis Affects Post-Germination Plant Growth. Plant Physiol 182, 2166-2181.

      Smolikova, G.N., and Medvedev, S.S. (2016). Photosynthesis in the seeds of chloroembryophytes. Russ J Plant Physl+ 63, 1-12.

      Wang, Z., Hong, X., Hu, K., Wang, Y., Wang, X., Du, S., Li, Y., Hu, D., Cheng, K., An, B., and Li, Y. (2017). Impaired Magnesium Protoporphyrin IX Methyltransferase (ChlM) Impedes Chlorophyll Synthesis and Plant Growth in Rice. Front Plant Sci 8, 1694.

      Yoo, C.Y., Pasoreck, E.K., Wang, H., Cao, J., Blaha, G.M., Weigel, D., and Chen, M. (2019). Phytochrome activates the plastid-encoded RNA polymerase for chloroplast biogenesis via nucleus-to-plastid signaling. Nat Commun 10, 2629.

      Zhu, M., Liu, T., Zhang, C., and Guo, M. (2017). Flavonoids of Lotus (Nelumbo nucifera) Seed Embryos and Their Antioxidant Potential. J Food Sci 82, 1834-1841.

    1. Author response:

      The following is the authors’ response to the original reviews.

      Public Reviews:

      Reviewer #1 (Public Review):

      As a reviewer for this manuscript, I recognize its significant contribution to understanding the immune response to saprophytic Leptospira exposure and its implications for leptospirosis prevention strategies. The study is well-conceived, addressing an innovative hypothesis with potentially high impact. However, to fully realize its contribution to the field, the manuscript would benefit greatly from a more detailed elucidation of immune mechanisms at play, including specific cytokine profiles, antigen specificity of the antibody responses, and long-term immunity. Additionally, expanding on the methodological details, such as immunophenotyping panels, qPCR normalization methods, and the rationale behind animal model choice, would enhance the manuscript's clarity and reproducibility. Implementing functional assays to characterize effector T-cell responses and possibly investigating the microbiota's role could offer novel insights into the protective immunity mechanisms. These revisions would not only bolster the current findings but also provide a more comprehensive understanding of the potential for saprophytic Leptospira exposure in leptospirosis vaccine development. Given these considerations, I believe that after substantial revisions, this manuscript could represent a valuable addition to the literature and potentially inform future research and vaccine strategy development in the field of infectious diseases.

      Reviewer #2 (Public Review):

      Summary:

      The authors try to achieve a method of protection against pathogenic strains using saprophytic species. It is undeniable that the saprophytic species, despite not causing the disease, activates an immune response. However, based on these results, using the saprophytic species does not significantly impact the animal's infection by a virulent species.

      Strengths:

      Exposure to the saprophytic strain before the virulent strain reduces animal weight loss, reduces tissue kidney damage, and increases cellular response in mice.

      Weaknesses:

      Even after the challenge with the saprophyte strain, kidney colonization and the release of bacteria through urine continue. Moreover, the authors need to determine the impact on survival if the experiment ends on the 15th.

      Reviewer #3 (Public Review):

      Summary:

      Kundu et al. investigated the effects of pre-exposure to a non-pathogenic Leptospira strain in the prevention of severe disease following subsequent infection by a pathogenic strain. They utilized a single or double exposure method to the non-pathogen prior to challenge with a pathogenic strain. They found that prior exposure to a non-pathogen prevented many of the disease manifestations of the pathogen. Bacteria, however, were able to disseminate, colonize the kidneys, and be shed in the urine. This is an important foundational work to describe a novel method of vaccination against leptospirosis. Numerous studies have attempted to use recombinant proteins to vaccinate against leptospirosis, with limited success. The authors provide a new approach that takes advantage of the homology between a non-pathogen and a pathogen to provide heterologous protection. This will provide a new direction in which we can approach creating vaccines against this re-emerging disease.

      Strengths:

      The major strength of this paper is that it is one of the first studies utilizing a live non-pathogenic strain of Leptospira to immunize against severe disease associated with leptospirosis. They utilize two independent experiments (a single and double vaccination) to define this strategy. This represents a very interesting and novel approach to vaccine development. This is of clear importance to the field.

      The authors use a variety of experiments to show the protection imparted by pre-exposure to the non-pathogen. They look at disease manifestations such as death and weight loss. They define the ability of Leptospira to disseminate and colonize the kidney. They show the effects infection has on kidney architecture and a marker of fibrosis. They also begin to define the immune response in both of these exposure methods. This provides evidence of the numerous advantages this vaccination strategy may have. Thus, this study provides an important foundation for future studies utilizing this method to protect against leptospirosis.

      Weaknesses:

      Although they provide some evidence of the utility of pretreatment with a non-pathogen, there are some areas in which the paper needs to be clarified and expanded.

      The authors draw their conclusions based on the data presented. However, they state the graphs only represent one of two independent experiments. Each experiment utilized 3-4 mice per group. In order to be confident in the conclusions, a power analysis needs to be done to show that there is sufficient power with 3-4 mice per group. In addition, it would be important to show both experiments in one graph which would inherently increase the power by doubling the group size, while also providing evidence that this is a reproducible phenotype between experiments. Overall, this weakens the strength of the conclusions drawn and would require additional statistical analysis or additional replicates to provide confidence in these conclusions.

      A direct comparison between single and double exposure to the non-pathogen is not able to be determined. The ages of mice infected were different between the single (8 weeks) and double (10 weeks) exposure methods, thus the phenotypes associated with LIC infection are different at these two ages. The authors state that this is expected, but do not provide a reasoning for this drastic difference in phenotypes. It is therefore difficult to compare the two exposure methods, and thus determine if one approach provides advantages over the other. An experiment directly comparing the two exposure methods while infecting mice at the same age would be of great relevance to and strengthen this work.

      Recommendations for the authors:

      Reviewer #1 (Recommendations For The Authors):

      Major Comments

      (1) Elucidation of Immune Mechanisms: The manuscript intriguingly suggests that exposure to saprophytic Leptospira primes the host for a Th1-biased immune response, contributing to survival and mitigation of disease severity upon subsequent pathogenic challenge. However, the underlying mechanisms remain broadly defined. A more detailed investigation into the cytokine profiles, particularly the levels of IFN-γ, IL-12, and other Th1-associated cytokines, could clarify the mechanism of Th1 bias. Moreover, exploring the role of antigen-presenting cells (APCs) in priming T cells towards a Th1 phenotype would add valuable insights.

      In this study we continue to elucidate the immune mechanisms engaged by pathogenic and non-pathogenic Leptospira as a follow up to our previous work (Shetty et al, 2021 PMID: 34249775, and Kundu et al 2022 PMID 35392072). We, and others, have shown that saprophytic L. biflexa and pathogenic L. interrogans induce major chemo-cytokines associated with Th1 biased immune responses (Shetty et al. 2021; Cagliero et al. 2022; Krangvichian et al. 2023) and engage myeloid immune cells such as macrophages and dendritic cells. The role of antigen presenting cells such as dendritic cells in priming T cells and activating adaptive response is a separate question and can be addressed in the future. To further address this question, a recent mechanistic study (Krangvichian et al. 2023) showed that non-pathogenic leptospires (L. biflexa) promote MoDC maturation and stimulate the proliferation of IFN-γ-producing CD4+ T cells and potentially elicit a Th1-type response in mice, which also supports our current claim and it is referenced in our manuscript.

      (2) Quantitative Analysis of Kidney Colonization: The manuscript reports that pre-exposure to L. biflexa did not prevent the colonization of kidneys by L. interrogans but led to a more regulated immune response and reduced fibrosis. A more nuanced quantification of bacterial loads in the kidneys, using techniques such as CFU counting or more sensitive qPCR methods, could provide a clearer picture of how saprophytic exposure affects the ability of pathogenic Leptospira to establish infection. Additionally, a time-course study showing the kinetics of bacterial colonization and clearance post-infection would be informative.

      We are currently validating digital PCR to use in the future and plan to do time course studies.

      (3) Characterization of B Cell and T Cell Responses: While the manuscript mentions increased B cell frequencies and effector T helper cell responses, specifics regarding the nature of these responses are lacking. For instance, detailing the isotype and specificity of antibodies produced, the proliferation rates of specific B and T cell subsets, and their functional capabilities (e.g., cytotoxicity, help for B cells) would significantly enrich the understanding of the immune response elicited by pre-exposure to saprophytic Leptospira.

      Indeed, additional experiments need to be conducted to flush out the immune responses engaged after pre-exposure to saprophytic Leptospira followed by LIC challenge.

      (4) Comparative Analysis with Other Models of Pre-exposure: The study primarily focuses on pre-exposure to a live saprophytic Leptospira. Including a comparison with pre-exposure to killed saprophytic bacteria, or even to other non-pathogenic microbes, could help discern whether the observed protective effect is unique to live saprophytic Leptospira exposure or if it represents a more general phenomenon of trained immunity.

      Regarding the use of other non-pathogenic microbes, our lab has shown in the past that oral use of probiotic strain Lactobacillus plantarum (Potula et al 2017) also reduces the severity of Leptospirosis by recruiting myeloid cells. Thus, there may be a general phenomenon of trained immunity involved. We added this to the discussion.

      (5) Assessment of Long-term Immunity: The study provides valuable insights into the short-term outcomes following saprophytic Leptospira exposure and subsequent pathogenic challenge. Extending these observations to assess long-term immunity, including memory B and T cell responses several months post-infection, would be crucial for understanding the potential of saprophytic Leptospira exposure in providing lasting protection against leptospirosis.

      Long term immunity is a complex and separate question that we plan to address later.

      Minor Comments

      (1) Technical Specifics of Flow Cytometry Analysis: The manuscript could benefit from including more details on the flow cytometry gating strategy and the specific markers used to identify different immune cell subsets. This addition would aid in the reproducibility of the results and allow for a clearer interpretation of the immune profiling data.

      We included the technical specifics of the flow-cytometry analysis in the materials and methods section. The gating strategy (Fig S1) and the specific markers (TableS1) used to identify different immune cell subsets were incorporated in the supplementary datasheet. The cell specific markers were incorporated in the figures (Fig 5 and 6) under each representative cell subset which facilitates clarity and reproducibility of immune profiling.

      (2) Statistical Methodology for IgG Subtyping: The analysis of IgG subtypes in response to Leptospira exposure is intriguing but would be strengthened by specifying the statistical tests used to compare IgG1, IgG2a, and IgG3 levels between groups. Additionally, discussing the biological significance of the observed differences in IgG subtype levels would provide a more comprehensive understanding of the immune response.

      We applied the ordinary One-way ANOVA test to compare the IgG subtypes between groups followed by a Tukey’s multiple comparison correction analysis (included in the figure legend of Fig 4). We addressed the biological relevance of the observed differences in IgG subtype levels in the discussion section.

      (3) Details on Animal Welfare and Ethical Approval: While the manuscript mentions compliance with institutional animal care and use committee protocols, providing the specific ethical guidelines followed, such as the 3Rs (Replacement, Reduction, Refinement), would reinforce the commitment to ethical research practices.

      This is addressed in our institutional IACUC which is approved and listed in Methods.

      (4) Clarification of Figure Legends: Some figure legends are brief and could be expanded to more thoroughly describe what the figures show, including details on what specific data points, error bars, and statistical symbols represent.

      We updated and expanded the figure legends (Fig 1-4).

      (5) Revision of Introduction and Background: The introduction provides a good overview of leptospirosis and the rationale behind the study. However, it could be further improved by briefly summarizing current challenges in vaccine development against leptospirosis and how understanding the immune response to saprophytic Leptospira could address these challenges.

      We revised the introduction keeping this comment in mind.

      Reviewer #2 (Recommendations For The Authors):

      - Perform the same challenge experiment with a hamster.

      We clarified throughout the manuscript that all the work was done using the C3H-HeJ mouse model which was developed in our lab for the purpose of measuring differences in sublethal and lethal LIC infections. We leave the experiments using hamster to the investigators that have thoroughly validated the hamster model of lethal Leptospira infection.

      - Review the written part where it is understood that the challenge with saprophyte strain before virulence prevents the disease.

      We reviewed the manuscript to be understood that inoculation of mice with a saprophyte Leptospira before pathogenic challenge prevents severe leptospirosis and promotes kidney homeostasis and increased shedding of Leptospira in urine which is interesting. The last 2 sentences of the abstract read: “Thus, mice exposed to live saprophytic Leptospira before facing a pathogenic serovar may withstand infection with far better outcomes. Furthermore, a status of homeostasis may have been reached after kidney colonization that helps LIC complete its enzootic cycle.”

      Reviewer #3 (Recommendations For The Authors):

      (1) Line 83: The authors refer to the classification of Leptospira by old nomenclature. The bacteria are now categorized into clades P1, P2, S1 and S2. See Vincent et al. Revisiting the taxonomy and evolution of pathogenicity of the genus Leptospira through the prism of genomics. PLoS Negl Trop Dis. 2019 May 23;13(5):e0007270. doi: 10.1371/journal.pntd.0007270. PMID: 31120895; PMCID: PMC6532842.

      We have included the categories (S1 for L. biflexa and P1+ for L. interrogans) in introduction and methods but we did not update the figures because we want to be specific about the species used in these experiments. We also include a few sentences on evolution of Leptospira species in discussion and reference Thibeaux 2018, Vincent 2019 and Giraud-Gatineau, 2024.

      (2) Line 133: Please remove the extra line to be consistent with the rest of the method section format.

      We addressed all formatting issues.

      (3) Line 137: Are these primers specific to pathogenic L. interrogans? Or do they cross react with L. biflexa? If not specific, how long does L. biflexa stick around after infection?

      The primers are specific to the genus Leptospira. Surdel et al. in 2022 used 16s rRNA target sequence to amplify L. biflexa Patoc in mice at 6 hours post infection. We did not detect any positive sample for L. biflexa with the 16s rRNA primer set because we do our analysis 30 days and 45 days post inoculation with L. biflexa. We clarified this issue in methods and results.

      (4) Statistical analysis:

      (a) Some of your graphs have more than 4 points on them (such as Figure 4), while the legend still reads "represents one of two independent experiments". Are these actually combined replicates in the same graph? Combining them would provide strength to your conclusions throughout your manuscript and may provide stronger power for comparisons. If they are not included, why are they not included together? Please clarify what is included in each graph, and why the two experiments were not included together.

      We updated the legends with the total number of mice used in the experiment represented in the figure. Figures 1, 2, 4 and S2 contain the combined results from two independent experiments. Figures 3, 5 and 6 represent data from one of two independent experiments. For Fig 3 it would be redundant to show HE images of two experiments. Regarding Figs 5 and 6, the flow-cytometry equipment acquires data at different voltage every single time and biological samples vary between experiments even if all the markers and procedures are the same. So, we reproduce the experiment and show results from one experiment after confirming that the trend between individual experiments are the same.

      (b) If ANOVA was used, were all columns compared to each other? Why in some graphs are "ns" labeled only for certain comparisons? I would suggest removing the "ns" comparisons and only highlighting the significant differences.

      We have incorporated the comparison analysis between control (PBS) versus the PBS-LIC, LB versus LB-LIC and PBS-LIC versus LB-LIC in both the studies although we have compared significance between all groups.

      (5) Line 165: Bacteria were not plated, extract was plated. Perhaps you mean "extract corresponding to 107-108 bacteria"?

      We addressed it as follows: “Nunc MaxiSorp flat-bottom 96 well plates (eBioscience, San Diego, CA) were coated with extracts prepared from 107-108 bacteria per well and incubated at 4℃ overnight” …

      (6) Line 260: The authors claim that "Exposure to non-pathogenic L. biflexa before pathogenic L. interrogans challenge provided a significant immune cell boost with an increase in overall B and helper T cell frequencies..." However, in Figure 5A, the number of B cells in both the PBS2LIC2 and the LB2LIC2 are not significantly different. Thus, the claim is not supported by the evidence provided. It appears that infection with LIC led to similar increases in B cells regardless of pretreatment.

      We rephrased that title to reflect the finding that increased differences were measured in effector Helper T cells between PBS2LIC2 and LB2LIC2 (Figs 5D and 6B, 6C) and we re-wrote this section for clarity.

      (7) Lines 314-315: The authors claim that it protected against kidney fibrosis, however, the data only supports that only a single exposure to LB reduced levels of a marker associated with kidney fibrosis. Fibrosis was never directly measured.

      Indeed, we didn’t do Mason’s Trichrome stain to get supporting data for kidney fibrosis and only measured a fibrosis marker ColA1. We toned down this section: “ …. it may confer protection against kidney fibrosis.”

      (8) Line 317: Authors state that pre-exposure induced higher antibodies in serum, however, this was never shown. Only an increase in IgG2a was shown. Please word this statement to make it clear total antibodies were never measured.

      We did measure total anti-Leptospira interrogans IgM and IgG antibodies. We added the following sentence to description of these results: “In both experiments, total IgM and IgG were significantly increased in PBS-LIC and LB-LIC when compared to the respective controls, but not between PBS-LIC and LB-LIC.  Regarding IgG isotypes, IgG1…”

      (9) Line 323: The authors state that the exposure "induced antibody responses that provided heterologous protection." There is no evidence that the protection is due to the antibody response in these experiments. In fact, they also showed that it induced increased T cell responses.

      We toned down this statement: “In our study, exposure to a saprophytic Leptospira induced antibody responses that may provide heterologous protection against the pathogenic strain of Leptospira.”

      (10) Line 328: The authors us the term "stark difference", however, only slight differences are seen.

      We toned down that statement as follows:  “Differences in antibody titer among the L. interrogans infected….”

      (11) Line 490: reword this sentence to provide clarity and easier to read: "inoculated once with 10^8 L. biflexa at 6 weeks and they were challenged with 10^8 L. interrogans SEROVAR Copenhageni FioCruz (LIC) at 8 weeks."

      We revised the sentence.

      (12) Figure 1 and 2: Quantifying bacteria in culture after infection is not meaningful, as there are numerous factors that can affect the replication in culture after infection, such as how the organ perhaps was cut before placing it in culture. The comparisons in Figure 2E and F therefore are not interpretable. I would suggest presenting this data as Culture Positive or Culture Negative.

      We added these data to the figure under DFM (dark field microscopy).

      (13) Figure 3A: H&E staining often leads to different qualities of stains. But is there a better image that can be chosen for the PBS1LIC1 that provides a better comparison with the other images chosen? This is not worth repeating the experiment to get one, just make the figure look better if you have one available.

      We screened the images again but the one incorporated in the figure3A for PBS1LIC1 is the best.

      (14) Figure 3D: I agree that the PBS-LIC treatment is significant, but please include P value, as it looks very similar to the LB-LIC group. The two LIC groups are not significantly different, so the conclusion would be pre-exposure does not mitigate renal fibrosis marker ColA in the double-exposure study.

      We included the p-values in this figure. The two LIC groups are significantly different (ColA1) in the single exposure experiment, and the in double exposure we don’t expect to be able to measure ColA1 differences because the mice are older (10 wk) when we do the LIC challenge.

    1. Author response:

      The following is the authors’ response to the original reviews.

      Public Reviews.

      Reviewer #1 (Public Reviews):

      Summary:

      The "optorepressilator", an optically controllable genetic oscillator based on the famous E. coli 3-repressor (LacI, TetR, CI) oscillator "repressilator", was developed. An individual repressilator shows a stable oscillation of the protein levels with a relatively long period that extends a few doubling times of E. coli, but when many cells oscillate, their phases tend to desynchronize. The authors introduced an additional optically controllable promoter through a conformal change of CcaS protein and let it control how much additional CI is produced. By tightly controlling the leak from the added promoter, the authors successfully kept the original repressilator oscillation when the added promoter was not activated. In contrast, the oscillation was stopped by expressing the additional CI. Using this system, the authors showed that it is possible to synchronise the phase of the oscillation, especially when the activation happens as a short pulse at the right phase of the repressilator oscillation. The authors further show that, by changing the frequency of the short pulses, the repressilator was entrained to various ratios to the pulse period, and the author could reconstruct the so-called "Arnold tongues", the signature of entrainment of the nonlinear oscillator to externally added periodic perturbation. The behaviour is consistent with the simplified mathematical model that simulates the protein concentration using ordinary differential equations.

      Strengths:

      Optical control of the oscillation of the protein clock is a powerful and clean tool for studying the synthetic oscillator's response to perturbation in a well-controlled and tunable manner. The article utilizes the plate reader setup for population average measurements and the mother machine setup for single-cell measurements, and they compensate nicely to acquire necessary information.

      Weakness:

      The current paper added the optogenetically controlled perturbation to control the phase of oscillation and entrainment, but there are a few other works that add external perturbation to a collection of cells that individually oscillate to study phase shift and/or entrainment. The current paper lacks discussion about the pros and cons of the current system compared to previously analyzed systems.

      Recommendations

      Even if the main purpose of the current paper is to develop a toolbox, it is beneficial to emphasize the pros and cons of the current system compared to the existing work. In addition to the ref [36] that authors cite but do not discuss concretely, example literature about entrainment includes:

      - Sanchez, P.G.L., Mochulska, V., Denis,  C.M., Mönke, G., Tomita, T., Tsuchida-Straeten, N., Petersen, Y., Sonnen, K., François, P. and Aulehla, A., 2022. Arnold tongue entrainment reveals dynamical principles of the embryonic segmentation clock. Elife, 11, p.e79575.

      - Heltberg M, Kellogg RA, Krishna S, Tay S, Jensen MH. Noise induces hopping between NF-κB entrainment modes. Cell systems. 2016 Dec 21;3(6):532-9.

      There is surely more literature. It is recommended that a solid discussion be added on the relation between existing works and current work.

      We thank the Reviewer for their positive comments on our manuscript. Their main recommendation is to expand literature and discuss how our method compares to previously reported entrainment of genetic oscillators. In summary, we believe that the main advantages of the optorepressilator are the simplicity of the transcriptional network combined with the flexibility of optical control. In the “Discussion” section of the revised manuscript, we now try to highlight this also in connection to the suggested literature.

      Reviewer #2 (Public Reviews):

      Summary

      In this manuscript by Cannarsa et. al., the authors describe the engineering of a light-entrainable synthetic biological oscillator in bacteria. It is based on an upgraded version of one of the first synthetic circuits to be constructed, the repressilator. The authors sought to make this oscillator entrainable by an external forcing signal, analogous to the way natural biological oscillators (like the circadian clock) are synchronized. They reasoned that an optogenetic system would provide a convenient and flexible means of manipulation. To this end, the authors exploited the CcaS-CcaA light-switchable system, which allows activation and deactivation of transcription by green and red light, respectively. They used this system to make the expression of one of the repressilator's transcription factors (lacI) light-controlled, from a construct separated from the main repressilator plasmid. This way, under red light the oscillator runs freely, but exposure to green light causes overexpression of the lacI, pushing the system into a specific state. Consequently, returning to red light will restore the oscillations from the same phase in all cells, effectively synchronizing the cell population.

      After demonstrating the functionality of the basic concept, the authors combined modeling and experiments to show how periodic exposure to green light enables efficient entrainment, and how the frequency of the forcing signal affects the oscillatory behavior (detuning).

      This work provides an important demonstration of engineering tunability into a foundational genetic circuit, expands the synthetic biology toolbox, and provides a platform to address critical questions about synchronization in biological oscillators. Due to the flexibility of the experimental system, it is also expected to provide a fertile ground for future testing of theoretical predictions regarding non-linear oscillators.

      Strengths:

      The study provides a simple and elegant mechanism for the entertainment of a synthetic oscillator. The design relies on optogenetic proteins, which enable efficient experimentation compared to alternative approaches (like using chemical inducers). This way, a static culture (without microfluidics or change of growth media) can be easily exposed to flexible temporal sequences of the zeitgeber, and continuously measured through time.

      The study makes use of both plate-reader-based population-level readout and mother-machine single-cell measurements. Synchronization through entrainment is a single cell level phenomenon, but with a clear population-level manifestation. Thus, this experimental approach combination provides a strong validation to their system. At the same time, differences between the readout from the two systems have emerged, and provided a further opportunity for model refinement and testing.

      The authors correctly identified the main optimization goal, namely the effective leakiness of their construct even under red light. Then, they successfully overcame this issue using synthetic biology approaches.

      The work is supported by a simplified model of the repressilator, which provides a convenient analytical and numerical means to draw testable predictions. The model predictions are well aligned with the experimental evidence.

      Weaknesses:

      Even after optimizing the expression level of the light-sensitive gene, the system is very sensitive, i.e., a very short exposure is sufficient to elicit the strongest entertainment. This limited dynamic range might hamper some model testing and future usage.

      As a result of the previous point, the system is entrained by transiently "breaking" the oscillator: each pulse of green light represents a Hopf bifurcation into a single attractor. it means that the system cannot oscillate in constant green light. In comparison, this is generally not the case for natural zeitgebers like light and temperature for the circadian rhythms. Extreme values might prevent oscillations (not necessarily due to breaking the core oscillator), but usually, free running is possible in a wide range of constant conditions. In some cases, the free-running period length will vary as a function of the constant value. While the approach presented in this manuscript is valid, a comprehensive analysis of more subtle modes of repressilator entrainment could also be of value.

      The entire work makes use of a single intensity and single duration of the green pulse to force entrainment. While the model has clear predictions for how those modalities should affect entrainment, none of the experiments attempted to validate those predictions.

      While we agree with the Reviewer that all reported experiments were performed with pulses of constant amplitude and duration, we do not see this as a necessary limitation for future studies on the optorepressilator. Using pulse-width modulation, green light intensity could be easily and continuously modulated from zero to a maximum value (as in Fig. 4), exploring a wide range of intermediate intensity levels and therefore of mean LacI production rates from the optogenetic promoter. We do not include additional experiments in the revised manuscript but we have greatly expanded the theoretical discussion on the low amplitude regime, both for a constant illumination (new Supplementary Materials Section 5) and the pulsed case (new Supplementary Fig. 8).

      Recommendations for the Authors:

      (1) The introduction emphasized the utility of entrainment as a means to achieve population-wide synchrony. It is worth mentioning also that it enables synchronization of the internal oscillator with an external zeitgeber, to achieve a specific phase-locking between them. Often, this is the main utility attributed to entrainment, e.g., in circadian clocks.

      Following Reviewer’s suggestion we now say in the introduction:

      These oscillations maintain a constant phase relation to the external light cue that can act as a zeitgeber.

      (2) It is sometimes unclear at first glance which of the figure panels show simulation data and which show experimental data (e.g., Figure 5a,b; Figure 6a,b). More explicitly labeling the panels could help.

      We thank the reviewer for pointing this out, we now explicitly label all the panels.

      (3) Figure 3b - please add a color bar to indicate the meaning of the red-green scale, and enlarge the markers so their color is more visible. Also, can add additional controls of (i) sfGFP expression without the ccaR, and (ii) the autofluorescent signal from wild type. Please also provide the raw data (not the time derivatives) in a supplementary figure.

      A colorbar has been added and markers enlarged.

      (i) Unfortunately we do not have a control for GFP expression without ccaR.

      (ii) autofluorescence signal from “a negative control consisting of DHL708 with plasmids pNO286-3 and pSR58-0 (optogenetic plasmids without sfGFP cassette)” has been added for comparison to Fig.3b. This modification was actually very helpful in understanding that the sensitivity threshold in our experiments is mainly determined by autofluorescence. OD600 and fluorescence raw data are now provided in Supplementary Fig. 6.

      (4) Figure 3d - the claim in the text is that the purple optorepressilator and the wildtype repressilator have identical periods and amplitude. However, it seems from the figure that there is a small difference in the period length. This deviation is not problematic in any way, but I wondered whether it might actually be explained by the model, assuming that there is still a very weak leak from the new construct. In other words, would the model predict a bifurcation diagram in which an increasing x' concentration causes a gradual decrease in amplitude and increase in period, before the loss of rhythmicity? If so, Figure 3d can serve not only as a technical optimization demonstration but also as a nice validation of the model.

      We thank the reviewer for raising this interesting point. We now report, in Supplementary Materials Section 5, a theoretical prediction of the period with respect to a constant concentration of x'. For our choice of parameters (adjusted to reproduce the main experimental quantitative features) we find a period that decreases with x'. Leakage would therefore lead to a shorter period, contrary to what is observed experimentally. To explain the longer period observed in the optorepressilator we went back to extract the average growth rates of bacteria in the purple optorepressilator and repressilator curves in Fig.3d. As we now discuss in the main text:

      “The slight difference in period can be explained by the presence of additional plasmids in the optorepressilator strain, which results in a lower growth rate (Supplementary Figures 4 and 5). As found in the digital approximation, the repressilator period is mainly controlled by the inverse growth rate (see Figure 1a and Supplementary Figure 9) meaning a lower growth rate results in a longer oscillation period. When we normalize the time with the growth rate the two oscillations overlap nicely (Supplementary Figure 4).”

      (5) Supplementary Figure 10 has no reference from the main text. it is unclear what's the difference from Figure 3. In general, many items in the supplementary materials are not referenced from the text. In addition, on many occasions, there is a reference to "supplementary information" without a specific address, which is not so useful to the reader. In any case possible, please be more specific. Also, note that there's inconsistency in referring to the supplemental section as "supplementary materials" vs "supplemental information".

      We now explicitly reference all Supplementary Figures in the main text and use consistent reference to Supplementary Materials.

      (6) The discussion at the bottom of p.7 ("Optogenetic entrainment") is missing a reference to the duration and intensity of the zeitgeber: In the example from human circadian rhythms it doesn't indicate light intensity; In the modeling of the PRC, both modalities are absent. it is important at least to indicate the parameters used for the simulation and experiments. It would be even better to explore in the model how these modalities affect the PRC and entrainment. And it would be incredible if the authors could show this also experimentally.

      We now report the light intensity values for:

      - our experiments:

      “We first demonstrate this by monitoring the population signal from CFP (reporting TetR or 𝑦 in the model) in multiwell cultures under constant red illumination (9.82 W/m^2) interrupted by green light pulses (5.64 W/m^2) with a duration of 2 h and period 𝑇 = 18 h.”

      For mother machine experiments “Green and red light stimuli were provided by the two LEDs (Thorlabs M530L4, Thorlabs M660L4) with respective intensities 6 W/m^2 and 26 W/m^2 for the synchronization experiments, and 1.1 W/m^2 and 4.5 W/m^2 for the entrainment experiments.”

      - and simulations:

      “In Fig. 5a we report the phase shift produced by a single pulse (with duration tau=2 h and intensity beta’=80 h-1 fixed for all the simulations) as a function of the pulse arrival phase ϕ.”

      We also added an additional supplementary figure (Supplementary Fig. 7) that explores how the duration and intensity of the light pulses affect the PRC in the model. An approximate analytic result is also derived for the PRC in the digital approximation that compares very well with simulation, providing physical insight into PRC shape (Supplementary Materials Section 7).

      (7) The experimental validation of the PRC can be much more thorough. Notably, an entrainment experiment with repeated pulses does not provide the same level of validation as a proper PRC experiment. This is because many differently shaped PRCs can give rise to the same entrainment pattern, as long as their fixed-point phases are the same.

      Luckily, there might already be a decent amount of data from the mother machine experiments to fit with the PRC prediction, given the authors have pulsed a non-synchronized population that spans the entire x-axis of the PRC. It is possible that a proper PRC experiment wouldn't be too difficult with the plate reader either, given the throughput of the author's system.

      This is a very interesting suggestion but unfortunately, in our mother machine data, the first pulse arrives before the cells have completed a full cycle, so although different cells receive the first pulse at a sufficiently randomized phase, we can’t extract their individual phases at the pulse arrival time.

      Indeed it would be possible to design a plate reader experiment for the specific purpose of directly measuring the PRC. However, our current protocol involves continuous manual dilutions, which makes it rather laborious. We are currently working on an automated procedure that will allow us to systematically address this and other interesting suggestions in the future.

      An indirect experimental validation of the PRC is however still possible using available data. See added red points in Fig.5a and reply to point 10 below.

      (8) The discrepancy between the mother machine and plate reader experiments in Figure 5 is explained by a difference in growth rate variability in the two systems. It is not readily obvious how a difference in variability rather than the mean value of the period length can cause a shifted mean phase. It is only hinted in the text that growth rate has two different effects - on the period as well as the amplitude. I hypothesize that because of this period and amplitude correlation, there is a bias contribution to the sum of trajectories that have resulted in a shifted mean phase. Maybe there is another contribution from the asymmetric waveform of the signal? or from the distribution the alpha is sampled from? A direct discussion on that point will make the results much clearer. If the period-amplitude speculation above is right, please add also a panel that shows it. It will also be helpful to show the predicted PRC for the two parameter regimens.

      We thank the reviewer for highlighting this point. In the previous version of the manuscript we omitted the fact that in order to better match experimental signals we chose slightly different values for T_L/T_0 for simulations in Fig. 5d and 5e. We now report the values of all simulation parameters in the revised manuscript. This difference could also contribute to the shift in the mean phase for the two cases. We added this information in the main text.

      “The bottom panel in Fig. 5d shows the result of a numerical simulation with the same parameters as in Fig. 1b and the addition of a periodic light stimulation, with period $T_L/T_0 = 1$} [...] For the simulations in the lower panel of Fig.5e, all parameters remained the same as in Fig.5d with the exception of the period of the light pulses (T_L/T_0 = 0.97) and the standard deviation of the growth rate distribution, which was increased from 0.034 h^-1 to 0.071 h^-1 to better reproduce the experimental observations in the mother machine.”

      Additionally, we added a supplementary figure (Supplementary Fig. 9) demonstrating the correlation between period and amplitude of the oscillations, for simulations with varying growth rate.

      (9) The results from the detuning experiments are really nice, especially the decomposition in high frequency shown in Figure 6c. However, the experiments explore only the very high forcing amplitude conditions. Is there any way to test the weaker forcing regimens, as these are expected to uncover the interesting areas in between the Arnold's tongues? If this is experimentally difficult, it would be interesting to include at least the model prediction.

      We thank the reviewer for stimulating us to go in this direction. We have performed simulations to explore model predictions for areas between the Arnold’s tongues. We find onset of entrainment as the amplitude increases and also the existence of intermediate plateaus at fractional frequency ratios. These results are now included in the Supplementary Fig. 8.

      (10) Another prediction from the Arnold's tongue would be the relative phase of entrainment in different f/v0 conditions. The text refers to it very briefly, but this is a quantitative prediction that can be demonstrated clearly in a figure - how well do they match? It can be shown, for example, by a plot with f/v0 on the x-axis, the phase difference between the pulse and peak expression on the y-axis, a curve representing the model prediction for that function, and dots (with error bars) representing the calculated values from the experimental data.

      Generally, when suitable, this kind of direct comparison is more useful to the reader than the way the authors chose to compare simulation and experiments throughout the manuscript.

      We thank the reviewer for this very interesting suggestion. We have completely rewritten the discussion on entrainment commenting on how the same PRC (phase shift vs pulse arrival phase) can be interpreted as a T_L/T_0-1 vs phase difference plot. Indeed in the new Fig.5a we plot over the theoretical PRC curve, the values of the relative phase of entrainment for three values of the period of the light pulses (from the data in Fig. 6b). The agreement is remarkably good, providing a further experimental validation of the predicted PRC.

      (11) The raw data can be valuable for the community for reanalysis and further hypothesis testing. Hence, it will be very useful to make all of the data (e.g., the fluorescence signal quantification tables from all the experiments) publicly available.

      We prepared files with all raw data, to be made available to the community.

    1. Author response:

      The following is the authors’ response to the original reviews.

      Public Reviews:

      Reviewer #1 (Public Reviews):

      Summary: 

      The authors use a combination of biochemistry and cryo-EM studies to explore a complex between the cap-binding complex and an RNA binding protein, ALYREF, that coordinates mRNA processing and export.

      Strengths: 

      The biochemistry and structural biology are supported by mutagenesis which tests the model in vitro. The structure provides new insight into how key events in RNA processing and export are likely to be coordinated.

      Weaknesses: 

      The authors provide biochemical studies to confirm the interactions that they identify; however, they do not perform any studies to test these models in cells or explore the consequences of mRNA export from the nucleus. In fact, several of the amino acids that they identified in ALYREF that are critical for the interaction, as determined by their own biochemical studies, are conserved in budding yeast Yra1 (residues E124/E128 are E/Q in budding yeast and residues Y135/V138/P139 are F/S/P), where the impact on poly(A) RNA export from the nucleus could be readily evaluated. The authors could at least mention this point as part of the implications and the need for future studies. No one seems to have yet targeted any of these conserved residues, so this would be a logical extension of the current work.

      We thank the reviewer for the feedback on our work. ALYREF coordinates pre-mRNA processing and export through interactions with a plethora of mRNA biogenesis factors including the DDX39B subunit of the TREX complex, CBC, EJC, and 3’ processing factors. ALYREF mediates the recruitment of the TREX complex on nascent transcripts which depends on its interactions with both CBC and EJC. Our work and studies by others indicate that ALYREF uses overlapping interfaces including both the N-terminal WxHD motif and the RRM domain to bind CBC and EJC. Thus, ALYREF mutants deficient in CBC interaction will also disrupt the ALYREF-EJC interaction and are not ideal for functional studies. In addition, the CBC plays important roles in multiple steps of mRNA metabolism through interactions with a plethora of factors, which often interact competitively with CBC. Identification of separation-of-function mutations on CBC or ALYREF that specifically disrupt their interaction but not other cellular complexes containing CBC or ALYREF would be an important future area to test the model in cells. 

      We appreciate the reviewer’s insightful comments regarding yeast Yra1. Thus far, the physical and functional connection between Yra1 and CBC in yeast has not been demonstrated. There are major differences between yeast Yra1 and human ALYREF. Given the lack of an EJC in S. cerevisiae, it is unclear whether Yra1 acts in a similar manner as human ALYREF. In addition, Yra1 does not contain a WxHD motif in its N-terminal unstructured region, which is involved in CBC and EJC interactions in ALYREF. Characterization of the Yra1-CBC interaction will be an interesting future direction. We now include a discussion about yeast Yra1 in the newly added “Conclusion and perspectives” section. 

      Specific suggestions:

      The authors could put their work in context by speculating how some of the amino acids that they identify as being critical for the interactions they identify could contribute to cancer. For example, they mention mutations of interacting residues in NCBP2 are associated with human cancers, pointing out that NCBP2 R105C amino acid substitution has been reported in colorectal cancer and the NCBP2 I110M mutation has been found in head and neck cancer. Do the authors speculate that these changes would decrease the interaction between NCBP2 and ALYREF and, if so, how would this contribute to cancer? They also mention that a K330N mutation in NCBP1 in human uterine corpus endometrial carcinoma, where Y135 on the α2 helix of mALYREF2 makes a hydrogen bond with K330 of NCBP1. How do they speculate loss of this interaction would contribute to cancer?

      In the revised manuscript, we include a discussion about these CBC mutants found in human cancers in the “Conclusion and perspectives” section. We think some of these CBC mutants, such as NCBP-1 K330N, could reduce interaction with ALYREF. Compromised CBC-ALYREF interaction will affect the recruitment of the TREX complex on nascent transcripts and cause dysregulation of mRNA export. In addition, that could also change the partition of CBC and ALYREF in different cellular complexes and cause perturbation of various steps in mRNA biogenesis that are regulated by CBC and ALYREF. Thus far, it is unclear whether and how loss of the CBC-ALYREF interaction directly contributes to cancer. Our work and that of others provide molecular insights to test in future studies. 

      Reviewer #2 (Public Reviews):

      Summary: 

      In this manuscript, Bradley and his colleagues represented the cryo-EM structure of the nuclear cap-binding complex (CBC) in complex with an mRNA export factor, ALYREF, providing a structural basis for understanding CBC regulating gene expression.

      Strengths: 

      The authors successfully modeled the N-terminal region and the RRM domain of ALYREF (residues 1-183) within the CBC-ALYREF structure, which revealed that both the NCBP1 and NCBP2 subunits of the CBC interact with the RBM domain of ALYREF. Further mutagenesis and pull-down studies provided additional evidence to the observed CBC-ALYREF interface. Additionally, the authors engaged in a comprehensive discussion regarding other cellular complexes containing CBC and/or ALYREF components. They proposed potential models that elucidated coordinated events during mRNA maturation. This study provided good evidence to show how CBC effectively recruits mRNA export factor machinery, enhancing our understanding of CBC regulating gene expression during mRNA transcription, splicing, and export. 

      Weaknesses: 

      No in vivo or in vitro functional data to validate and support the structural observations and the proposed models in this study. Cryo-EM data processing and structural representation need to be strengthened. 

      We appreciate the reviewer’s comments and suggestions. The fact that ALYREF uses highly overlapped binding interfaces for CBC and EJC interactions prevents us from a clear functional dissection of the ALYREF-CBC interaction using in vitro assays or in cells at the current stage. Please also see our response to Reviewer 1. 

      In this revised manuscript, we have reprocessed the cryo-EM data using a different strategy which yields significantly improved maps. We have made improvements to the presentation of the structural work based on the reviewer’s specific comments. 

      Reviewer #3 (Public Reviews):

      Summary: 

      The authors carried out structural and biochemical studies to investigate the multiple functions of CBC and ALYREF in RNA metabolism.

      Strengths: 

      For the structural study part, the authors successfully revealed how NCBP1 and NCBP2 subunits interact with mALYREF (residues 1-155). Their binding interface was then confirmed by biochemical assays (mutagenesis and pull-down assays) presented in this study. 

      Weaknesses: 

      The authors did not provide functional data to support their proposed models. The authors should include more details regarding the workflow of their cryo-EM data processing in the figure. 

      We thank the reviewer for the comments. We completely agree that testing the proposed models in cells would be ideal. However, as we also respond to the other reviewers, functional studies are premature at the current stage because both ALYREF and CBC are components of many cellular complexes that regulate mRNA metabolism. Separation-of-function mutations on CBC or ALYREF first need to be identified in future studies for further investigation. Please also see our response to Reviewer 1. 

      As suggested by the reviewer, we have included more details of the cryo-EM workflow in this revised manuscript. We have also included various validation measures including 3DFSC analyses, map vs model FSC curves, and representative density maps at various protein-protein binding interfaces. 

      Recommendations for the Authors:

      Reviewer #1 (Recommendations for the Authors):

      Major points:

      The authors should take advantage of Figure 1, which shows the domain structures of NCBP1, NCBP2, and ALYREF to indicate for the reader specifically which protein domains are included in the biochemical and structural analyses. In the current version of the manuscript, there is plenty of space to indicate below each domain structure precisely what regions are included.

      In this revised manuscript, we have revised Figure 1A to indicate the protein constructs used in this work. 

      Although it is fine to combine the Results and Discussion, the authors should really offer a concluding paragraph to highlight the novel results from this study and put the results in context.

      We thank the reviewer for the recommendation. We now include a “Conclusion and perspectives” section in this revised manuscript.  

      Minor comments:

      Page 5, last sentence (and others) starts a sentence with the word "Since" when likely "As" which does not imply a time element to the phrase, is the correct word.

      "Since the ALYREF/mALYREF2 interaction with the CBC is conserved and mALYREF2 exhibits better solubility, we focused on mALYREF2 in the cryo-EM investigations."

      Would be more correct as: "As the ALYREF/mALYREF2 interaction with the CBC is conserved and mALYREF2 exhibits better solubility, we focused on mALYREF2 in the cryo-EM investigations."

      We thank the reviewer for the comments. We have made the corrections. 

      The word 'data' is plural so the sentence at the bottom of p.9 that includes the phrase "...in vivo data shows.." should read "..in vivo data show.." 

      Corrected in the revised manuscript.

      Reviewer #2 (Recommendations for the Authors):

      Major points:

      (1) The authors claimed the improved solubility of mouse ALYREF2 (mALYREF2, residues 1-155) compared to the previously employed ALYREF construct. However, human ALYREF has already been purified successfully for pull down assay, indicating soluble human ALYREF obtained, why not use human ALYREF directly? Please clarify. 

      Pull-down studies were performed with GST-tagged ALYREF. For cryo-EM studies, untagged ALYREF is preferred to avoid potential issues that may arise from the expression tag. However, untagged ALYREF is less soluble than GST-tagged ALYREF and is not amenable for structural studies. We have revised the text to clarify this point. 

      (2) The authors confirmed CBC-ALYREF interfaces through mutagenesis and pull-down assays in vitro. However, it would be more informative and interesting to include functional assays in vitro or/and in vivo with mutagenesis. 

      We completely concur with the reviewer that testing the proposed models in vitro and in vivo would be important. However, as we pointed out in our response to public reviews, the highly overlapped binding interfaces on ALYREF for CBC and EJC interactions pose a great challenge for functional studies. Furthermore, both ALYREF and CBC are multifunctional factors and interact with a number of partners. Ideally, separation-of-function mutants that specifically disrupt the CBC-ALYREF interaction but not others need to be identified in future studies in order to perform functional studies. 

      (3) About cryo-EM data processing and structural representation:

      (1) In the description of the cryo-EM data processing, the authors claimed they did heterogeneous refinement, homogenous refinement, and then local refinement. This reviewer is puzzled by this process because the normal procedure should be non-uniform refinement following homogenous refinement. If the authors did not perform non-uniform refinement, they should do it because it would significantly improve the quality and resolution of cryo-EM maps. In addition, the right local refinement should include mask files and only show the density/map of the local region. 

      We thank the reviewer for the suggestions. In response to the reviewer’s comment on the preferred orientation issue (point 5 below), we reprocessed the cryo-EM data and obtained significantly improved cryo-EM maps. In this revised manuscript, the CBC-mALYREF map was refined using homogeneous refinement; the CBC map was refined using homogenous refinement followed by non-uniform refinement. Refinement masks are included in Figure 2-figure supplement1. 

      (2) Further local refinements with signal subtraction should be performed to improve the density and resolution of mALYREF2. 

      We tested local refinement with or without signal subtraction using masks covering mALYREF2 and various regions of CBC. Unfortunately, this approach did not improve the density of mALYREF2. We suspect that the small size of mALYREF2 (77 residues for the RRM domain) and the intrinsic flexibility of CBC are the limiting factors in these attempts. 

      (3) Figures with cryoEM map showing the side chains of the residues on the CBC-mALYREF2 interface should be included to strengthen the claims. Authors could add the map to Figure 3b/c or present it as a supplementary figure.

      We include new supplementary figures (Figure 3-figure supplement 1) to show the electron densities corresponding to the views in Figure 3B and 3C. Residues labeled in Figure 3B and 3C are shown in sticks in these supplementary figures.

      (4) For cryo-EM date processing, the authors have omitted lots of important details. Could the authors elaborate on the data processing with more details in the corresponding Figure and Methods Sections? Only one abi-initial model from the picked good particles was displayed in the figure. Are there any other different conformations of 3D classes for the dataset? In addition, too few classes have been considered in 3D classification, more classes may give a class with better density and resolution.

      We thank the reviewer for the comments. We have reprocessed the cryo-EM data. A major change is to use Topaz for particle picking. We now include more details for data processing in Figure 2-figure supplement 1 and the method section. The cryo-EM sample is relatively uniform. Ab-initio reconstruction and heterogenous refinement yielded only one good class and the other classes are “junk” classes (omitted in the workflow figure). No major conformational changes were observed throughout the multiple rounds of heterogenous refinement for both CBC and CBCmALYREF2. In this revised manuscript, we have been able to obtain significantly improved maps through the new data processing strategy employing Topaz as illustrated in Figure 2-figure supplement 1 to 5.

      (5) Angular distribution plots should be included to show if there is a preferred orientation issue. Based on the presented maps in validation reports, there may exist a preferred orientation issue for the reported two cryo-EM maps. Detailed 3D-Histogram and directional FSC plots for all the cryo-EM maps using 3DFSC web server should be presented to show the overall qualities (https://www.nature.com/articles/nmeth.4347 and https://3dfsc.salk.edu/).

      We thank the reviewer for the recommendations. In response to the reviewer’s comment on the preferred orientation issue, we reprocessed the cryo-EM data. Topaz was used for particle picking instead of template picking. 3DFSC analyses indicate that the new CBC-mALREF2 map has a sphericity of 0.946, which is a significant improvement from the previous map which has a sphericity of 0.815. Consistently, the maps presented in this revised manuscript show significantly improved densities. We now include angular distribution and 3DFSC analyses of the EM maps (Figure 2-figure supplement 2 and 4). 

      (6) Figures of model-to-map FSCs need to be present to demonstrate the quality of the models and the corresponding ones (model resolution when FSC=0.5) should also be included in Table 1. The accuracy of the model is important for structural explanations and description.

      The model-to-map FSCs are now included in Figure 2-figure supplement 3A and 5A. The model resolutions of CBC-mALYREF2 and CBC are estimated to be 3.5 Å and 3.6 Å at an FSC of 0.5. These numbers are now included in Table 1. 

      (7) In addition, figures of local density maps with different regions of the models, showing side chains, are necessary and important to justify the claimed resolutions. 

      We now include density maps overlayed with residue side chains at various regions. For the CBCmALYREF2 map, density maps are shown at the mALYREF2-NCBP1 interfaces (Figure 3-figure supplement 1A and 1B), mALYREF2-NCBP2 interface (Figure 3-figure supplement 1C), NCBP1NCPB2 interface (Figure 2-figure supplement 5B), and the region near m7G (Figure 2-figure supplement 5C). For the CBC map, density maps are shown at the NCBP1-NCPB2 interface (Figure 2-figure supplement 3B) and the region near m7G (Figure 2-figure supplement 3C). 

      Minor points:

      (1) A figure superimposing the models from the CBC-mALYREF2 amp and mALYREF2 alone map is necessary to present that there are no other CBC binding-induced conformational changes in CBC except the claimed by the authors. In addition, a figure showing the density of m7GpppG should be included as well.  

      Overlay of CBC and CBC-mALYREF2 models is now presented in Figure 2-figure supplement 3D. Comparing CBC and CBC-mALYREF2, NCBP1 and NCBP2 have a RMSD of 0.32 Å and 0.30 Å, respectively. The density maps near the M7G cap analog are shown in Figure 2-figure supplement 3C for CBC and Figure 2-figure supplement 5C for CBC-mALYREF2. 

      (2) Authors obtained the two maps from one dataset, so "we first determined" and "we next determined" (page 6) should be replaced with something like "One class of 3D cryo-EM map revealed' and "Another class of 3D cryo-EM map defined". 

      We have revised the text as suggested by the reviewer.  

      (3) In 'Abstract', 'a mRNA export factor' should be 'an mRNA export factor'. 

      Corrected in the revised manuscript.

      (4) In 'Abstract', the final sentence 'Comparison of CBC- ALYREF to other CBC and ALYREF containing cellular complexes provides insights into the coordinated events during mRNA transcription, splicing, and export' doesn't read smoothly, I would suggest revising it to 'Comparing CBC-ALYREF with other cellular complexes containing CBC and/or ALYREF components provides insight into the coordinated events during mRNA transcription, splicing, and export.' 

      We thank the reviewer for the recommendation and have revised accordingly. 

      (5) In paragraph 'CBC-ALYREF and viral hijacking of host mRNA export pathway', line 6, the sentences preceding and following the term 'However' indicate a progressive or parallel relationship, rather than a transitional one. To enhance the coherence, I would suggest replacing 'However' with 'Furthermore' or 'In addition'. 

      Corrected in the revised manuscript.

      (6) In both Figure 5 and Figure 6, the depicted models are proposed and constructed exclusively through the comparison of the CBC-partial ALYREF with other cellular complexes containing components of CBC and/or ALYREF, which need to be confirmed by more studies. To prevent potential confusion and misunderstandings, it is recommended to replace the term 'model' with 'proposed model'. 

      Corrected in the revised manuscript.

      Reviewer #3 (Recommendations for the Authors):

      Major points:

      (1) In the Results and Discussion section, the authors mentioned "Recombinant human ALYREF protein was shown to interact with the CBC in RNase-treated nuclear extracts." However, they used mouse ALYREF for cryo-EM investigations. Can the authors include an explanation for this choice during the revision?  

      In our work, we used a mixture of glutamic acid and arginine to increase the solubility of GSTALYREF. For cryo-EM studies, we use untagged ALYREF to avoid potential issues that may arise from the expression tag. However, untagged ALYREF is less soluble than GST-tagged ALYREF and is not suitable for structural studies in standard buffers. We have made further clarification on this point in this revised manuscript. 

      (2) In the paragraph on "CBC-ALYREF interfaces", the authors stated "For example, E97 forms salt bridges with K330 and K381 of NCBP1. Y135 on the α2 helix of mALYREF2 makes a hydrogen bond with K330 of NCBP1. The importance of this interface between ALYREF and NCBP1 is highlighted by a K330N mutation found in human uterine corpus endometrial carcinoma." I fail to see a strong connection between their structural observations and previous findings regarding the role of a K330N mutation found in human uterine corpus endometrial carcinoma. The authors should add more words to thread these two parts.  

      In response to the reviewer’s comment, we now move the discussion of these CBC mutants to the newly added “Conclusion and perspectives” section. 

      (3) The authors should include side chains of the residues in their figure of Local resolution estimation and FSC curves, especially when they are presenting the binding interface between two components. 

      We have now included density maps that are overlayed with structural models showing side chains of critical residues. These maps include the NCBP1-mALYREF2 interfaces (Figure 3-figure supplement 1A and 1B), NCBP2-mALYREF2 interface (Figure 3-figure supplement 1C), NCBP1NCBP2 interface (Figure 2-figure supplement 3B and 5B), and the m7G cap region (Figure 2figure supplement 3C and 5C). 

      Minor points: 

      (1) Some grammatical mistakes need to be corrected. For example, it is "an mRNA" instead of "a mRNA".  

      Corrected in the revised manuscript.

      (2) The authors can provide more information for the audience to know better about ALYREF when it first appears in the 5th line in the Abstract section. For example, "It promotes mRNA export through direct interaction with ALYREF, a key mRNA export factor, ...". 

      We have revised the sentence based on the reviewer’s comment.

    1. Author response:

      The following is the authors’ response to the original reviews.

      Reviewer #1 (Recommendations For The Authors):

      Some of the data is problematic and does not always support the authors' conclusions:

      (1) Fig. 1K and H are identical.

      Thank you for pointing out this problem in manuscript. We apologize for this unintentional mistake and have replaced Fig. 1K.

      (2) The graph in Figure 2B contradicts the text. It is not obvious how the image was quantified to produce the histological score graph..

      We thank the reviewer for pointing out this problem in manuscript, as the reviewer suggested, we have replaced the Figure 2B.

      (3) In Figures 2C and D, there is no clear pattern of changes in pro-inflammatory or anti-inflammatory cytokines, despite the authors' claims in the text.

      We appreciate the comment, we think the reason is that the level of cytokines in the tissue is low, so the pattern of changes is not obvious.

      (4) It is unclear why the anti-dsDNA antibody does not stain the nucleus in Figure 4B. The staining with anti-dsDNA and DAPI does not match well. Figure 5H shows there is still lots of cytosolic DNA in OGT-/- HCF-1-C, measured by DAPI. These data do not support the authors' conclusion that HCFC600 eliminates cytosolic DNA accumulation (line 229). There is no support for the authors' claim that HCF-1 restrains the cGAS-STING pathway (line 330).

      We thank these insightful comments, the most critical step in staining cytosolic DNA is to proceed to a low-permeabilization as to allow the antibody to cross the cellular membrane but not the nuclear membrane, that’s why the anti-dsDNA antibody does not stain the nucleus. In Figure 5H, we think we used a high concentrated DAPI to do the staining and nucleus DNA get stained, looks like it’s the cytosolic DNA. 

      (5) In Figure 5B, there is no increase in HCF-1 cleavage after OGT over-expression.

      We appreciate the reviewer for his/her comment, we think the reason is that we used the cell line to stably overexpress OGT-GFP and we may have missed the time point when the increase in HCF-1 cleavage occurred, so there is no big increase of it. However, there is a significant increase in Figure 5C.

      (6) In Figure 7, the TNF-a staining does not inspire confidence.

      We thank the reviewer for his/her comment, from both Figure 7K (MC38 tumor model) and Figure 7N (LLC tumor model), we observed a significant increase in TNF-α+ CD8+ T cells in the group treated with the combination of OSMI-1 and anti-PD-L1 compared to the control group, as evidenced by the clear clustering.

      The writing needs significant improvement:

      (1) There are multiple English grammar mistakes throughout the paper. It is recommended that the authors run the manuscript through an editing service.

      We thank the reviewer for his/her suggestion. We apologize for the poor language of our manuscript. We worked on the manuscript for a long time and the repeated addition and removal of sentences and sections obviously led to poor readability. We have now worked on both language and readability and have also involved native English speakers for language corrections. We really hope that the flow and language level have been substantially improved.

      (2) Some passages are misleading -- lines 161-162, line 217, lines 241-242, 263-264, 299-300. They need to be changed substantially.

      We apologize for these mistakes, we have changed them.

      (3) Figure legends should be rewritten. Currently, they are too abbreviated to be understood.

      We apologize for that, we have rewritten them.

      (4) Discussion should also be thoroughly reworked. Currently, it is merely restating the authors' findings. The authors should put their findings in the broader context of the field.

      We apologize for that. For a better understanding of our study, we have reworked the discussion.

      Reviewer #2 (Recommendations For The Authors):

      (1) Previous studies (DOI: 10.1093/nar/gkw663, 10.1016/j.jgg.2015.07.002, 10.1016/j.dnarep.2022.103394) have suggested that OGT deficiency triggers DNA damage, connecting it to DNA repair and maintenance through various mechanisms. This should be acknowledged in the manuscript. Conversely, the role of HCF1 and its cleaved products in maintaining genomic integrity hasn't been previously shown. The authors investigate HCF1's role solely in the context of OGT inhibition. It is unclear whether this is also true under other stimuli that trigger DNA damage, whether fragments of HCF1 specifically reduce DNA damage, or if HSF1 is involved in the basal machinery that would be defective only in the absence of OGT.

      We have acknowledged the manuscript mentioned above. In this paper we focused on the OGT function, which is related to HCF1. The role of HCF1 and its cleaved products in maintaining genomic integrity is an interesting topic, we may focus on it in next project.

      (2) In villin-CRE-deficient mice, the authors observe generic inflammation in the intestine unrelated to tumor development. It's unclear if this also occurs in the presence of OGT inhibitors in mice, whether these inhibitors induce a systemic inflammatory (Type I interferon) response, or if certain tissues like the intestine or proliferating tumor cells are more susceptible to such a response.

      We thank the comment, yes, investigating whether OGT inhibitors induce an inflammatory response, either systemically or tissue-specifically, is a very interesting project to focus on. However, in our current paper, we use a genetic method to identify the role of OGT deficiency in intestine inflammation-induced tumor development. This approach provides convincing evidence for our hypothesis. We may test the effect of OGT inhibitors on inflammation and tumor development in our next project.

      (3) Another critical observation is the magnitude of the interferon response triggered by DNA damage in the OGT-deficient models. While it's known that DNA damage can activate cGAS-STING, the response's extent in the absence of OGT prompts the question of whether additional OGT-specific features could explain this phenomenon. For example, Lamin A, essential for nuclear envelope integrity and shown to be O-glycosylated (DOI: 10.3390/cells7050044), and other components of the nuclear envelope or its repair might be affected by OGT. The impact of OGT inhibition on nuclear envelope integrity compared to other DNA-damaging agents could be explored.

      We appreciate the comment, in this project, we find an OGT binding protein, HCF1, though LC–MS/MS assay, it’s a top one candidate in binding profiles, so we focus on it. Like Lamin A and other components of the nuclear envelope still are good targets to check, we may explore these in our next project.

      (4) The authors also demonstrate a correlation between OGT expression in tumors compared to healthy tissues. However, the reason is unclear, raising questions about whether this is a consequence of proliferation or metabolic deregulation in the cancer. The authors should address this aspect.

      We appreciate the reviewer’s insightful point. It is very good questions and very interesting research. However, in this paper we focused on how OGT influence its downstream molecules to promote tumor, we didn’t check why OGT is increased in tumors, it is not the scope of this current work, we would love to investigate it in the future.

      Minor points

      Please add the legend to Figures S2, S3 and S5.

      We thank the comment, we have added the legend to Figures S2, S3 and S5.

      The sentence line 137 should be clarified as OGT deficiency seems more related to increased inflammation in this model.

      We thank the comment, we have corrected the sentence line 137.

      Line 732 has a ( typo before the number 34.

      We thank the comment, we have corrected the sentence line 732.

    1. Author response:

      The following is the authors’ response to the original reviews.

      eLife assessment

      In this important study, the authors manually assessed randomly selected images published in eLife between 2012 and 2020 to determine whether they were accessible for readers with deuteranopia, the most common form of color vision deficiency. They then developed an automated tool designed to classify figures and images as either "friendly" or "unfriendly" for people with deuteranopia. While such a tool could be used by publishers, editors or researchers to monitor accessibility in the research literature, the evidence supporting the tools' utility was incomplete. The tool would benefit from training on an expanded dataset that includes different image and figure types from many journals, and using more rigorous approaches when training the tool and assessing performance. The authors also provide code that readers can download and run to test their own images. This may be of most use for testing the tool, as there are already several free, user-friendly recoloring programs that allow users to see how images would look to a person with different forms of color vision deficiency. Automated classifications are of most use for assessing many images, when the user does not have the time or resources to assess each image individually.

      Thank you for this assessment. We have responded to the comments and suggestions in detail below. One minor correction to the above statement: the randomly selected images published in eLife were from articles published between 2012 and 2022 (not 2020).

      Public Reviews:

      Reviewer #1 (Public Review):

      Summary:

      The authors of this study developed a software application, which aims to identify images as either "friendly" or "unfriendly" for readers with deuteranopia, the most common color-vision deficiency. Using previously published algorithms that recolor images to approximate how they would appear to a deuteranope (someone with deuteranopia), authors first manually assessed a set of images from biology-oriented research articles published in eLife between 2012 and 2022. The researchers identified 636 out of 4964 images as difficult to interpret ("unfriendly") for deuteranopes. They claim that there was a decrease in "unfriendly" images over time and that articles from cell-oriented research fields were most likely to contain "unfriendly" images. The researchers used the manually classified images to develop, train, and validate an automated screening tool. They also created a user-friendly web application of the tool, where users can upload images and be informed about the status of each image as "friendly" or "unfriendly" for deuteranopes.

      Strengths:

      The authors have identified an important accessibility issue in the scientific literature: the use of color combinations that make figures difficult to interpret for people with color-vision deficiency. The metrics proposed and evaluated in the study are a valuable theoretical contribution. The automated screening tool they provide is well-documented, open source, and relatively easy to install and use. It has the potential to provide a useful service to the scientists who want to make their figures more accessible. The data are open and freely accessible, well documented, and a valuable resource for further research. The manuscript is well written, logically structured, and easy to follow.

      We thank the reviewer for these comments.

      Weaknesses:

      (1) The authors themselves acknowledge the limitations that arise from the way they defined what constitutes an "unfriendly" image. There is a missed chance here to have engaged deuteranopes as stakeholders earlier in the experimental design. This would have allowed [them] to determine to what extent spatial separation and labelling of problematic color combinations responds to their needs and whether setting the bar at a simulated severity of 80% is inclusive enough. A slightly lowered barrier is still a barrier to accessibility.

      We agree with this point in principle. However, different people experience deuteranopia in different ways, so it would require a large effort to characterize these differences and provide empirical evidence about many individuals' interpretations of problematic images in the "real world." In this study, we aimed to establish a starting point that would emphasize the need for greater accessibility, and we have provided tools to begin accomplishing that. We erred on the side of simulating relatively high severity (but not complete deuteranopia). Thus, our findings and tools should be relevant to some (but not all) people with deuteranopia. Furthermore, as noted in the paper, an advantage of our approach is that "by using simulations, the reviewers were capable of seeing two versions of each image: the original and a simulated version." We believe this step is important in assessing the extent to which deuteranopia could confound image interpretations. Conceivably, this could be done with deuteranopes after recoloration, but it is difficult to know whether deuteranopes would see the recolored images in the same way that non-deuteranopes see the original images. It is also true that images simulating deuteranopia may not perfectly reflect how deuteranopes see those images. It is a tradeoff either way. We have added comments along these lines to the paper.

      (2) The use of images from a single journal strongly limits the generalizability of the empirical findings as well as of the automated screening tool itself. Machine-learning algorithms are highly configurable but also notorious for their lack of transparency and for being easily biased by the training data set. A quick and unsystematic test of the web application shows that the classifier works well for electron microscopy images but fails at recognizing red-green scatter plots and even the classical diagnostic images for color-vision deficiency (Ishihara test images) as "unfriendly". A future iteration of the tool should be trained on a wider variety of images from different journals.

      Thank you for these comments. We have reviewed an additional 2,000 images, which were randomly selected from PubMed Central. We used our original model to make predictions for those images. The corresponding results are now included in the paper.

      We agree that many of the images identified as being "unfriendly" are microscope images, which often use red and green dyes. However, many other image types were identified as unfriendly, including heat maps, line charts, maps, three-dimensional structural representations of proteins, photographs, network diagrams, etc. We have uploaded these figures to our Open Science Framework repository so it's easier for readers to review these examples. We have added a comment along these lines to the paper.

      The reviewer mentioned uploading red/green scatter plots and Ishihara test images to our Web application and that it reported they were friendly. Firstly, it depends on the scatter plot. Even though some such plots include green and red, the image's scientific meaning may be clear. Secondly, although the Ishihara images were created as informal tests for humans, these images (and ones similar to them) are not in eLife journal articles (to our knowledge) and thus are not included in our training set. Thus, it is unsurprising that our machine-learning models would not classify such images correctly as unfriendly.

      (3) Focusing the statistical analyses on individual images rather than articles (e.g. in figures 1 and 2) leads to pseudoreplication. Multiple images from the same article should not be treated as statistically independent measures, because they are produced by the same authors. A simple alternative is to instead use articles as the unit of analysis and score an article as "unfriendly" when it contains at least one "unfriendly" image. In addition, collapsing the counts of "unfriendly" images to proportions loses important information about the sample size. For example, the current analysis presented in Fig. 1 gives undue weight to the three images from 2012, two of which came from the same article. If we perform a logistic regression on articles coded as "friendly" and "unfriendly" (rather than the reported linear regression on the proportion of "unfriendly" images), there is still evidence for a decrease in the frequency of "unfriendly" eLife articles over time.

      Thank you for taking the time to provide these careful insights. We have adjusted these statistical analyses to focus on articles rather than individual images. For Figure 1, we treat an article as "Definitely problematic" if any image in the article was categorized as "Definitely problematic." Additionally, we no longer collapse the counts to proportions, and we use logistic regression to summarize the trend over time. The overall conclusions remain the same.

      Another issue concerns the large number of articles (>40%) that are classified as belonging to two subdisciplines, which further compounds the image pseudoreplication. Two alternatives are to either group articles with two subdisciplines into a "multidisciplinary" group or recode them to include both disciplines in the category name.

      Thank you for this insight. We have modified Figure 2 so that it puts all articles that have been assigned two subdisciplines into a "Multidisciplinary" category. The overall conclusions remain the same.

      (4) The low frequency of "unfriendly" images in the data (under 15%) calls for a different performance measure than the AUROC used by the authors. In such imbalanced classification cases the recommended performance measure is precision-recall area under the curve (PR AUC: https://doi.org/10.1371%2Fjournal.pone.0118432) that gives more weight to the classification of the rare class ("unfriendly" images).

      We now calculate the area under the precision-recall curve and provide these numbers (and figures) alongside the AUROC values (and figures). We agree that these numbers are informative; both metrics lead to the same overall conclusions.

      Reviewer #2 (Public Review):

      Summary:

      An analysis of images in the biology literature that are problematic for people with a color-vision deficiency (CVD) is presented, along with a machine learning-based model to identify such images and a web application that uses the model to flag problematic images. Their analysis reveals that about 13% of the images could be problematic for people with CVD and that the frequency of such images decreased over time. Their model yields 0.89 AUC score. It is proposed that their approach could help making biology literature accessible to diverse audiences.

      Strengths:

      The manuscript focuses on an important yet mostly overlooked problem, and makes contributions both in expanding our understanding of the extent of the problem and in developing solutions to mitigate the problem. The paper is generally well-written and clearly organized. Their CVD simulation combines five different metrics. The dataset has been assessed by two researchers and is likely to be of high-quality. Machine learning algorithm used (convolutional neural network, CNN) is an appropriate choice for the problem. The evaluation of various hyperparameters for the CNN model is extensive.

      We thank the reviewer for these comments.

      Weaknesses:

      The focus seems to be on one type of CVD (deuteranopia) and it is unclear whether this would generalize to other types.

      We agree that it would be interesting to perform similar analyses for protanopia and other color-vision deficiencies. But we leave that work for future studies.

      The dataset consists of images from eLife articles. While this is a reasonable starting point, whether this can generalize to other biology/biomedical articles is not assessed.

      This is an important point. We have reviewed an additional 2,000 images, which were randomly selected from PubMed Central, and used our original model to make predictions for those images. The corresponding results are now included in the paper.

      "Probably problematic" and "probably okay" classes are excluded from the analysis and classification, and the effect of this exclusion is not discussed.

      We now address this in the Discussion section.

      Machine learning aspects can be explained better, in a more standard way.

      Thank you. We address this comment in our responses to your comments below.

      The evaluation metrics used for validating the machine learning models seem lacking (e.g., precision, recall, F1 are not reported).

      We now provide these metrics (in a supplementary file).

      The web application is not discussed in any depth.

      The paper includes a paragraph about how the Web application works and which technologies we used to create it. We are unsure which additional aspects should be addressed.

      Reviewer #3 (Public Review):

      Summary:

      This work focuses on accessibility of scientific images for individuals with color vision deficiencies, particularly deuteranopia. The research involved an analysis of images from eLife published in 2012-2022. The authors manually reviewed nearly 5,000 images, comparing them with simulated versions representing the perspective of individuals with deuteranopia, and also evaluated several methods to automatically detect such images including training a machine-learning algorithm to do so, which performed the best. The authors found that nearly 13% of the images could be challenging for people with deuteranopia to interpret. There was a trend toward a decrease in problematic images over time, which is encouraging.

      Strengths:

      The manuscript is well organized and written. It addresses inclusivity and accessibility in scientific communication, and reinforces that there is a problem and that in part technological solutions have potential to assist with this problem.

      The number of manually assessed images for evaluation and training an algorithm is, to my knowledge, much larger than any existing survey. This is a valuable open source dataset beyond the work herein.

      The sequential steps used to classify articles follow best practices for evaluation and training sets.

      We thank the reviewer for these comments.

      Weaknesses:

      I do not see any major issues with the methods. The authors were transparent with the limitations (the need to rely on simulations instead of what deuteranopes see), only capturing a subset of issues related to color vision deficiency, and the focus on one journal that may not be representative of images in other journals and disciplines.

      We thank the reviewer for these comments. Regarding the last point, we have reviewed an additional 2,000 images, which were randomly selected from PubMed Central, and used our original model to make predictions for those images. The corresponding results are now included in the paper.

      Recommendations for the authors:

      Reviewer #1 (Recommendations For The Authors):

      N/A

      Thank you.

      Reviewer #2 (Recommendations For The Authors):

      - The web application link can be provided in the Abstract for more visibility.

      We have added the URL to the Abstract.

      - They focus on deuteranopia in this paper. It seems that protanopia is not considered. Why? What are the challenges in considered this type of CVD?

      We agree that it would be interesting to perform similar analyses for protanopia and other color-vision deficiencies. But we leave that work for future studies. Deuteranopia is the most common color-vision deficiency, so we focused on the needs of these individuals as a starting point.

      - The dataset is limited to eLife articles. More discussion of this limitation is needed. Couldn't one also include some papers from PMC open access dataset for comparison?

      We have reviewed an additional 2,000 images, which we randomly selected from PubMed Central, and used our original model to make predictions for those images. The corresponding results are now included in the paper.

      - An analysis of the effect of selecting a severity value of 0.8 can be included.

      We agree that this would be interesting, but we leave it for future work.

      - "Probably problematic" and "probably okay" classes are excluded from analysis, which may oversimplify the findings and bias the models. It would have been interesting to study these classes as well.

      We agree that this would be interesting, but we leave it for future work. However, we have added a comment to the Discussion on this point.

      - Some machine learning aspects are discussed in a non-standard way. Class weighting or transfer learning would not typically be considered hyperparameters."corpus" is not a model. Description of how fine-tuning was performed could be clearer.

      We have updated this wording to use more appropriate terminology to describe these different "configurations." Additionally, we expanded and clarified our description of fine tuning.

      - Reporting performance on the training set is not very meaningful. Although I understand this is cross-validated, it is unclear what is gained by reporting two results. Maybe there should be more discussion of the difference.

      We used cross validation to compare different machine-learning models and configurations. Providing performance metrics helps to illustrate how we arrived at the final configurations that we used. We have updated the manuscript to clarify this point.

      - True positives, false positives, etc. are described as evaluation metrics. Typically, one would think of these as numbers that are used to calculate evaluation metrics, like precision (PPV), recall (sensitivity), etc. Furthermore, they say they measure precision, recall, precision-recall curves, but I don't see these reported in the manuscript. They should be (especially precision, recall, F1).

      We have clarified this wording in the manuscript.

      - There are many figures in the supplementary material, but not much interpretation/insights provided. What should we learn from these figures?

      We have revised the captions and now provide more explanations about these figures in the manuscript.

      - CVD simulations are mentioned (line 312). It is unclear whether these methods could be used for this work and if so, why they were not used. How do the simulations in this work compare to other simulations?

      This part of the manuscript refers to recolorization techniques, which attempt to make images more friendly to people with color vision deficiencies. For our paper, we used a form of recolorization that simulates how a deuteranope would see a figure in its original form. Therefore, unless we misunderstand the reviewer's question, these two types of simulation have distinct purposes and thus are not comparable.

      - relu -> ReLU

      We have corrected this.

      Reviewer #3 (Recommendations For The Authors):

      The title can be more specific to denote that the survey was done in eLife papers in the years 2012-2022. Similarly, this should be clear in the abstract instead of only "images published in biology-oriented research articles".

      Thank you for this suggestion. Because we have expanded this work to include images from PubMed Central papers, we believe the title is acceptable as it stands. We updated the abstract to say, "images published in biology- and medicine-oriented research articles"

      Two mentions of existing work that I did not see are to Jambor and colleagues' assessment on color accessibility in several fields: https://www.ncbi.nlm.nih.gov/pmc/articles/PMC8041175/, and whether this work overlaps with the 'JetFighter' tool

      (https://elifesciences.org/labs/c2292989/jetfighter-towards-figure-accuracy-and-accessibility).

      Thank you for bringing these to our attention. We have added a citation to Jambor, et al.

      We also mention JetFighter and describe its uses.

      Similarly, on Line 301: Significant prior work has been done to address and improve accessibility for individuals with CVD. This work can be generally categorized into three types of studies: simulation methods, recolorization methods, and estimating the frequency of accessible images.

      - One might mention education as prior work as well, which might in part be contributing to a decrease in problematic images (e.g., https://www.ncbi.nlm.nih.gov/pmc/articles/PMC8041175/)

      We now suggest that there are four categories and include education as one of these.

      Line 361, when discussing resources to make figures suitable, the authors may consider citing this paper about an R package for single-cell data: https://elifesciences.org/articles/82128

      Thank you. We now cite this paper.

      The web application is a good demonstration of how this can be applied, and all code is open so others can apply the CNN in their own uses cases. Still, by itself, it is tedious to upload individual image files to screen them. Future work can implement this into a workflow more typical to researchers, but I understand that this will take additional resources beyond the scope of this project. The demonstration that these algorithms can be run with minimal resources in the browser with tensorflow.js is novel.

      Thank you.

      General:

      It is encouraging that 'definitely problematic' images have been decreasing over time in eLife. Might this have to do with eLife policies? I could not quickly find if eLife has checks in place for this, but given that JetFighter was developed in association with eLife, I wonder if there is an enhanced awareness of this issue here vs. other journals.

      This is possible. We are not aware of a way to test this formally.

    1. Author response:

      The following is the authors’ response to the original reviews.

      Reviewer #1 (Public Review):

      Tang et al present an important manuscript focused on endogenous virus-like particles (eVLP) for cancer vaccination with solid in vivo studies. The author designed eVLP with high protein loading and transfection efficiency by PEG10 self-assembling while packaging neoantigens inside for cancer immunotherapy. The eVLP was further modified with CpG-ODN for enhanced dendritic cell targeting. The final vaccine ePAC was proven to elicit strong immune stimulation with increased killing effect against tumor cells in 2 mouse models. Below are my specific comments:

      Thanks very much to comment our work as “important”. We sincerely appreciate the extremely helpful comments from the reviewer to significantly improve the quality of our manuscript.

      (1) The figures were well prepared with minor flaws, such as missed scale bars in Figures 4B, 4K, 5B, and 5C. The author should also add labels representing statistical analysis for Figures 3C, 3D, and 3E. In Figure 6G, the authors should label which cell type is the data for.

      Thanks very much for the very suggestive comments. The scale bars and statistical analysis have been added in Figures 4B, 4K, 5B, 5C, 3C, 3D, and 3E. For Figure 6G, we have added “CD44+ CD62L- in CD8+ T cells” to explain the cell type.

      (2) In Figure 3H, the antigen-presenting cells (APCs) increased significantly, but there was also a non-negligible 10% of APCs found in the control group, indicating some potential unwanted immune response; the authors need to explain this phenomenon or add a cytotoxic test on the normal liver or other cell lines for confirmation.

      Thanks very much for this extremely helpful suggestion. The antigen-presenting cells (APCs) in Figure 3H were isolated from mouse bone marrow and then cultured in vitro for about 5 days with cytokine stimulation (IL-4 and GM-CSF). Due to the stimulation effects of IL-4 and GM-CSF, a small proportion of the APCs (~10%) was tending to mature (co-expressing CD80 and CD86) in the control group, as pointing out by the reviewer. Similarly, in Figure 3I, these 10% activated APCs can activate T cells in vitro and exhibit certain cytotoxicity. Since APCs must be induced and cultured in vitro before using in this experiment, the background cytotoxicity induced by cytokines is unavoidable, and this has been well documented in literatures.

      (3) In Figure 3I, the ePAC seems to have a very similar effect on cytotoxic T-cell tumor killing compared to the peptides + CpG group. If the concentrations were also the same, based on that, questions will arise as to what is the benefit of using the compact vector other than just free peptide and CpG? Please explain and elaborate.

      Thanks very much for the comment. In vitro experiments indeed demonstrated that peptides + CpG had the same T cell activating ability as ePAC, as pointing out by the reviewer. However, due to the instability of peptides and the lack of targeting, the efficiency of activating the immune system for peptides + CpG after subcutaneous injection is significantly lower than that for ePAC in vivo, as shown in Figure 3D and Figure 2A. Then, as expected, the antitumor efficacy induced by peptides alone + CpG is significantly lower than that induced by ePAC in Figure 5. We have provided a detailed description in “Results” section of “Antitumor effect of ePAC in subcutaneous HCC model” as follows: Furthermore, ePAC with the ability to target DCs and increased stability by encapsulating peptides, exhibited significantly higher tumor growth inhibition efficiency (p=0.0002) comparing with the eVLP + CpG-ODN treated group similar to the simple mixture of neoantigen peptides and adjuvant (Figures 5B and 5C). Meanwhile, the Kaplan-Meier analysis of tumor progression free survival (PFS) also clearly demonstrated the therapeutic advantages of our ePAC (p=0.0194, Figure 5B).

      (4) In the animal experiment in Figures 4F to L, the activation effect of APCs was similar between ePAC and CpG-only groups with no significance, but when it comes to the HCC mouse model in Figure 5, the anti-tumor effect was significantly increased between ePAC and CpG-only group. The authors should explain the difference between these two results.

      Thanks very much for the comment. Since PEG10 protein does not have an adjuvant effect, the adjuvant effect of ePAC mainly comes from the modified CpG. Therefore, although ePAC can effectively deliver tumor neoantigens, it does not have a significant advantage over free CpG in activating APCs. However, CpG only possesses the adjuvant effect and does not carry neoantigens. While it can promote the maturation of APCs, it cannot generate neoantigen-specific T cells. Consequently, the antitumor effect of CpG-only is much lower than that of ePAC in Figure 5.

      Reviewer #2 (Public Review):

      Summary:

      The authors provided a novel antigen delivery system that showed remarkable efficacy in transporting antigens to develop cancer therapeutic vaccines.

      Strengths:

      This manuscript was innovative, meaningful, and had a rich amount of data.

      Weaknesses:

      There are still some issues that need to be addressed and clarified.

      Thanks very much to comment our work as “innovative”. We sincerely appreciate the extremely helpful comments from the reviewer to significantly improve the quality of our manuscript, and the listed weaknesses have been all carefully addressed.

      (1) The format of images and data should be unified. Specifically, as follows: a. The presentation of flow cytometry results; b, The color schemes for different groups of column diagrams.

      Thanks very much. Following the reviewer’s comment, we have unified the format of all images and data as suggested.

      (2) The P-value should be provided in Figures, including Figure 1F, 1H, 3C, 3D, and 3E.

      Thanks very much. We have provided the corresponding P-values in Figure 1F, 1H, 3C, 3D, and 3E.

      (3) The quality of Figure 1C was too low to support the conclusion. The author should provide higher-quality images with no obvious background fluorescent signal. Meanwhile, the fluorescent image results of "Egfp+VSVg" group were inconsistent with the flow cytometry data. Additionally, the reviewer recommends that the authors use a confocal microscope to repeat this experiment to obtain a more convincing result.

      Thanks very much for this comment. Following the reviewer’s suggestion, we uniformly adjusted the original images in Figure 1C to reduce background interference and increase its quality. After eliminating background interference, the fluorescence image of the "Egfp+VSVg" group was consistent with the flow cytometry result.

      (4) The survival situation of the mouse should be provided in Figure 5, Figure 6, and Figure 7 to support the superior tumor therapy effect of ePAC.

      Thanks very much for the extremely helpful comment. Following the reviewer’s suggestion, we have added the progression free survival (PFS) of mice in Figure 5 and described this result in the “Results” section of “Antitumor effect of ePAC in subcutaneous HCC model” as follows: Meanwhile, the Kaplan-Meier analysis of tumor progression free survival (PFS) also clearly demonstrated the therapeutic advantages of our ePAC (p=0.0194, Figure 5B). For Figure 6 and Figure 7, to promptly detect the immune changes in the tumor microenvironment after vaccination, we were unable to conduct long-term observations on tumor-bearing mice, and therefore, we did not provide the survival curve. However, we monitored the tumor volume changes in real-time, which also can serve as an important measure for evaluating antitumor efficacy.

      (5) To demonstrate that ePAC could trigger a strong immune response, the positive control group in Figure 4K should be added.

      Thanks very much for this very helpful comment. Following the reviewer’s suggestion, the mouse anti-CD3 antibody was used as the positive control in vitro to activate splenic T cells for ELISPOT assay, and the corresponding results have been added in revised Figure 4K. To address this, we have provided a detailed description in “Figure legends” section of “Figure 4. ePAC delivery and immune activation in vivo” as follows: The mouse anti-CD3 antibody was used to activate splenic T cells in vitro as the positive control for ELISPOT assay.

      (6) In Figure 6G-I and other figures, the author should indicate the time point of detection. Meanwhile, there was no explanation for the different numbers of mice in Figure 6G-I. If the mouse was absent due to death, it may be necessary to advance the detection time to obtain a more convincing result.

      Thanks very much for the comment. The samples for Figure 6 G-I data were collected and analyzed at the day 28 after the start of treatment. Following the reviewer’s suggestion, we have specifically marked the time point of “Sacrifice for sampling” in Figure 6A. And we have provided a detailed description in “Figure legends” section of “Figure 6. Evaluation ePAC antitumor efficacy in orthotopic HCC model by αTIM-3 combination” as follows: The mice were sacrificed and sampled for analysis on the day of 28 after initiating treatment. In addition, in Figure 6G-I we have clearly indicated the sample size for each group. Although three mice in the PBS group died, we still have obtained enough samples for statistical analysis (n>3).

      (7) In Figure 6B, the rainbow color bar with an accurate number of maximum and minimum fluorescence intensity should be provided. In addition, the corresponding fluorescence intensity in Figure 6B should be noted.

      Thanks very much for this very helpful comment. Following the reviewer’s suggestion, we have added the rainbow color bar with an accurate number of maximum and minimum fluorescence intensity, and the statistic results in revised Figure 6B.

      (8) The quality of images in Figure 1D and Figure S1B could not support the author's conclusion; please provide higher-quality images.

      Thanks very much. In Figure 1D and Figure S1B, to ensure the authenticity of the results, we tried our best to improve the quality of the pictures and provided the WB results with the full membrane scan. Although some non-specific bands appeared in the results, the target bands remained prominent. Additionally, we used two tags (HA and eGFP) for verification, which fully guarantees the reliability of our findings.

      (9) In Figure 2F, the bright field in the overlay photo may disturb the observation. Meanwhile, the scale bar should be provided in enlarged images.

      Thanks very much. Following the reviewer’s suggestion, we have deleted the bright field in revised Figure 2F and added the scale bar in the enlarged images.

      Reviewer #3 (Public Review):

      Summary:

      The authors harnessed the potential of mammalian endogenous virus-like proteins to encapsulate virus-like particles (VLPs), enabling the precise delivery of tumor neoantigens. Through meticulous optimization of the VLP component ratios, they achieved remarkable stability and efficiency in delivering these crucial payloads. Moreover, the incorporation of CpG-ODN further heightened the targeted delivery efficiency and immunogenicity of the VLPs, solidifying their role as a potent tumor vaccine. In a diverse array of tumor mouse models, this novel tumor vaccine, termed ePAC, exhibited profound efficacy in activating the murine immune system. This activation manifested through the stimulation of dendritic cells in lymph nodes, the generation of effector memory T cells within the spleen, and the infiltration of neoantigen-specific T cells into tumors, resulting in robust anti-tumor responses.

      Strengths:

      This study delivered tumor neoantigens using VLPs, pioneering a new method for neoantigen delivery. Additionally, the gag protein of VLP is derived from mammalian endogenous virus-like protein, which offers greater safety compared to virus-derived gag proteins, thereby presenting a strong potential for clinical translation. The study also utilized a humanized mouse model to further validate the vaccine's efficacy and safety. Therefore, the anti-tumor vaccine designed in this study possesses both innovation and practicality.

      Thanks very much to comment our work as “novel”, “innovation” and “practicality”. We sincerely appreciate the extremely helpful comments from the reviewer to significantly improve the quality of our manuscript.

      Weaknesses:

      (1) CpG-ODN is an FDA-approved adjuvant with various sequence structures. Why was CpG-ODN 1826 directly chosen in this study instead of other types of CpG-ODN? Additionally, how does DEC-205 recognize CpG-ODN 1826, and can DEC-205 recognize other types of CpG-ODN?

      Thanks very much for the comment. CpG-ODNs are classified into three main types based on their structural composition: A, B, and C. Among them, only the B-class CpG-ODNs 1668, 1826, and 2006 have been directly proven to effectively bind DEC-205 and activate DC cells [1]. Therefore, in this study, B-class CpG-ODN 1826 was chosen as the ligand targeting DEC-205 on the surface of DC cells. DEC-205 primarily binds sequences containing the CpG motif core in a pH-dependent manner, thus theoretically allowing DEC-205 to bind a wide range of CpG-ODNs.

      [1] Lahoud MH et al. DEC-205 is a cell surface receptor for CpG oligonucleotides. PNAS. 2012

      (2) Why was it necessary to treat DCs with virus-like particles three times during the in vitro activation of T cells? Can this in vitro activation method effectively obtain neoantigen-responsive T cells?

      Thanks very much for the comment. DCs need to be pre-stimulated before being used to activate T cells. Although Single DC stimulation can activate T cells, but the activation efficiency is insufficient. Current research suggests that three DC-T interactions can more effectively activate T cells [2]. Therefore, we prepared virus-like particle stimulated DCs for three times to fully activate T cells. Our results in Figures 3I and 7D also demonstrate that three-time stimulations effectively activated antigen-specific T cells, resulting in stronger tumor cell killing effects.

      [2] Ali M et al. Induction of neoantigen-reactive T cells from healthy donors. Nature protocol. 2019.

      (3) In the humanized mouse model, the authors used Hepa1-6 cells to construct the tumor model. To achieve the vaccine's anti-tumor function, these Hepa1-6 cells were additionally engineered to express HLA-A0201. However, in the in vitro experiments, the authors used the HepG2 cell line, which naturally expresses HLA-A0201. Why did the authors not continue to use HepG2 cells to construct the tumor model, instead of Hepa1-6 cells?

      Thanks very much for the comment. HepG2 cells are derived from human liver cancer. When directly implant into immunocompetent mice, they will be cleared by the mouse immune system and will not form tumors. Therefore, we have not continued to use HepG2 cells to construct the tumor model.

      (4) The advantages of low immunogenicity viruses as vaccines compared with conventional adenovirus and lentivirus, etc. should be discussed.

      Thanks very much for the very suggestive comment. In the introduction starting from line 76, we first described the structure and function of lentiviruses and discussed the design and application of virus-like particles (VLPs) based on lentiviruses. To provide a more comprehensive comparison, we included a discussion on VLPs, lentiviruses, and adenoviruses in the discuss section (from line 441 to line 447) as follows: “Furthermore, comparing to the virus-based delivery vectors, the lentiviruses although can stably integrate into the host genome but carry risks of insertional mutagenesis; adenoviruses although have high transduction efficiency but strong immunogenicity, which leads to fast clearance by the immune system of the host and affects the efficiency of the secondary injection. Instead, our VLPs offer low immunogenicity and superior safety, making them more suitable for repeated use and vaccine development.”

      (5) In Figure 6B, the authors should provide statistical results.

      Thanks very much. We have provided the statistical results in revised Figure 6B following the reviewer’s suggestion.

      (6) The entire article demonstrates a clear logical structure and substantial content in its writing. However, there are still some minor errors, such as the misspelling of "Spleenic" in Figure 3B, and the sentence from line 234 should be revised.

      Thanks very much. We have carefully checked and corrected the typos throughout the whole manuscript as much as possible.

      (7) The authors demonstrated the efficiency of CpG-ODN membrane modification by varying the concentration of DBCO, ultimately determining the optimal modification scheme for eVLP as 3.5 nmol of DBCO. However, in Figure 2B, the author did not provide the modification efficiency when the DBCO concentration is lower than 3.5 nmol. These results should be provided.

      Thanks very much for the suggestion. We have repeated the experiment and reduced the concentration of DBCO to 2.1 nmol and 0.7 nmol, respectively. The results showed that in a 200 µl eVLP reaction system, 3.5 nmol DBCO achieved the highest modification efficiency. We have provided a detailed description in “Results” section of “Envelope decoration of neoantigen-loaded eVLP” as follows: Furthermore, by varying the concentration of DBCO-C6-NHS Ester from 0 to 14 nmol, ePAC exhibited different CpG-ODN loading efficiency as evidenced by agarose gel electrophoresis (Figure 2B and Figure S3). And the results showed that in a 200 µl eVLP reaction system, 3.5 nmol DBCO achieved the highest modification efficiency.

      (8) In Figure 3, the authors presented a series of data demonstrating that ePAC can activate mouse DC2.4 cells and BMDCs in vitro. However, in Figure 7, there is no evidence showing whether human DC cells can be activated by ePAC in vitro. This data should be provided.

      Thanks very much for this very helpful suggestion. We used ePAC to activate human DCs and the results indicate that, compared to the blank control group, both eVLP and ePAC increased the co-expression of CD80 and CD86 in DCs, and ePAC was the most efficient. We have provided a detailed description in the “Results” section of “Antitumor effect by HLA-A*0201 restricted vaccine” as follows: After the stimulation, the DCs in ePAC treated group showed the highest level of maturation comparing to the eVLP treated group and control group (Figure S4), by using flow cytometry analysis.”

    1. Author response:

      The following is the authors’ response to the original reviews.

      Reviewer #1 (Recommendations For The Authors):

      (1) Figure 2B and 2D: unlike what is written in the results part, the results are not consistent, but opposite: LSS has higher activity in 2B, less in 2D. 

      The activities in Figure 2B come from NMR kinetic experiments with pGly, whereas Figure 2D reports on activity towards whole S. aureus cells. The LytM and LSS activities in these two experiments are indeed not directly comparable, but served to highlight the fact that simple pentaglycine is a poor model substrate for M23 enzymes. We carried out a turbidity assay with pristine enzymatic preparation and indeed it is highly consistent both with the kinetic assay using pentaglycine (Fig. 2B) as well as with larger PG fragments (Fig. 2K) indicating that the catalytic domain of LSS is significantly more efficient than LytM in hydrolyzing cells from community acquired methicillin resistant S. aureus strain USA300 as well as synthetic PG fragments.  The corresponding paragraph in Results has now been updated and rephrased.

      (2) Figure 2, panel K missing statistical analysis, which makes it difficult to appreciate if the difference is significant. If it is a one-time experiment or a single value, the value should be presented as a table. The corresponding text in the results part is confusing. The fold change or drop in percentage is unclear in the figure. 

      We have added a table (panel L) to Figure 2, which shows absolute values of LSS and LytM hydrolysis rates. Indeed, most of the values are from single NMR kinetic measurements, however, PG fragment (2) for LSS and PG fragment (3) for LytM were measured as duplicates to verify the reproducibility of the data. This is now mentioned in Figure 3 legend and in the Materials and Methods. Also, the corresponding text in the Results has been updated and rephrased.

      (3) Figure 3H: the cleavage of D-ala-gly is unclear, the cleavage products need to be labeled and quantified. The experiment used purified PG treated with mutanolysin. Presumably, mixed monomers, dimers, trimers, and multimers are used. It would be helpful to show the HPLC profile of the purified muropeptide. It would be informative to analyze which fractions generate D-ala-gly. In addition, the intact murein sacculus should be included. 

      For the sake of clarity, we have moved the 13C-HMBC spectra presented in Figure 3H to Fig. S7 in the Supplementary Material. The full carbonyl carbon region of the reference (prior to addition of enzyme) 13C-HMBC spectrum together with larger expansions of spectra acquired from enzyme-treated muropeptides are now shown. Furthermore, graphical presentations of identified PG fragments due to LSS/LytM activity are included. No HPLC analysis of the muropeptides was performed at this stage. Being insoluble, the intact murein sacculus is not amenable to liquid-state NMR studies, but we envisage studies of this remarkably complex structure also with solid-state NMR.

      Reviewer #2 (Recommendations For The Authors): 

      Overall, the experiments address the question asked by the authors and no additional experiments are required to strengthen the conclusions drawn. 

      Abstract: 

      The abstract is not well written and more specific (and accurate) information should be provided by the authors. 

      We are grateful for the constructive and helpful comments to improve our manuscript. The abstract has now been modified by taking into account the Reviewer’s suggestions.

      Introduction 

      The intro is relatively long and wordy. It could most certainly be shortened and written in a more simple way to make it more impactful.

      The introduction has now been modified by taking into account the Reviewer’s suggestions.

      (2) One of the peptide stems in Figure 1 is missing a pentaglycine side chain; I would recommend increasing the font size; the peptide stem looks like it is attached to the carbon in position 2, it may be a good idea to move it to the left? 

      We thank the Reviewer for this comment. Figure 1 has been improved, the frameshift has been fixed and the non-cross-linked pGly bridge has been included to the lysine side-chain in tetraStem.

      Results 

      Figure 2 is a bit overwhelming and its description is sketchy. Fig 2B shows a much higher activity of LSS on pGly as compared to LytM whilst 2K shows a very similar rate. 

      We have rearranged Figures 1 and 2 by moving the original panel J in Figure 2 (structures of PG fragments) to Figure 1 panel C. The bar graph in Figure 2J now shows absolute rates of substrate hydrolysis for 2 mM LSS and LytM. These indicate that LSS is much more efficient against PG fragments in vitro in comparison to LytM. Rates normalized with respect to pGly are shown in Figure 2K. Also, a table showing absolute rates of hydrolysis for 2 mM LSS and 50 mM LytM has been included in Figure 2, panel L. In this Table, the values for PG fragments 2 and 3 were determined by two independent measurements to test and accredit the reproducibility of the method. This is also now elaborated further in the Materials and Methods.

      Figure 3 is impressive and very informative but again hard to follow. 

      - Panels 3A and 3B are nicely conceived but the resolution is rather poor and it is difficult to know exactly where the arrows point. 

      We very much value suggestions given by the Reviewer to improve readability of our manuscript. In the case of Figure 3, we have now greatly enhanced the resolution and readability of the figure by horizontal scaling of panels A and B.

      Figure 4 shows a comparative analysis of catalytic rate using various substrates, the authors may want to present graphs with the same y-axis to get the most out of the comparison between substrates. 

      The scaling of the y-axis is the same for all the substrates now. In addition, we have reorganized the panels in the figure to enhance readability.

      Figure 5: - The same remark as above, please cite all panels in alphabetical order. 

      Citing to Figure 5 has now been revised.

      Material and methods: 

      - How were the peptide concentrations determined? It may be useful to indicate if specific conditions were required to solubilize some peptides, pGly is particularly insoluble in aqueous solutions. 

      - Page 19, replace cpm by rpm; biological or technical replicates?

      These have now been added and edited accordingly.

    1. Author response:

      The following is the authors’ response to the previous reviews.

      Reviewer #1:

      After reviewing the authors' response letter and the revised manuscript, I believe they have done a commendable job in addressing my comments.

      Additionally, I concur with the concerns raised by Reviewer #2 regarding several potential confounding factors that require better control in their experimental design. These include the differences in physical properties between vocal and nonvocal stimuli, as well as the infant's exposure to the speech/auditory environment. These concerns should be thoroughly and explicitly discussed in the manuscript, ensuring a clearer understanding for the readers.

      Thank you for the suggestion. We have discussion these limitations in our revised manuscript. In this round of revision, we have tempered our conclusion due to these limitations.

      Reviewer #2:

      The revised manuscript does discuss the limitations of the control stimuli, as well as the limitations with regard to conclusions that can be drawn from this data set. I therefore expected the authors to temper a bit their recommendation that this could be a 'screening' signal for autism because these data are not sufficiently strong to make that recommendation. Also, in the same vein, perhaps the title might be adjusted somewhat to suggest less certainty, for example, by using the word "change" rather than "milestone"'? The data are of interest, but the limitations are genuine limitations.

      Thank you for your expert comments and considerations. We have moderated our recommendation for autism screening and softened the statement of “milestone” throughout the manuscript. Please see the updated article title, abstract, significance statement, and discussion.

    1. Author response:

      Reviewer #1 (Public Review):

      Summary:

      A nice study trying to identify the relationship between E. coli O157 from cattle and humans in Alberta, Canada.

      Strengths:

      (1) The combined human and animal sampling is a great foundation for this kind of study.

      (2) Phylogenetic analyses seem to have been carried out in a high-quality fashion.

      Weaknesses:

      I think there may be a problem with the selection of the isolates for the primary analysis. This is what I'm thinking:

      (1) Transmission analyses are strongly influenced by the sampling frame.

      (2) While the authors have randomly selected from their isolate collections, which is fine, the collections themselves are not random.

      (3) The animal isolates are likely to represent a broad swathe of diversity, because of the structured sampling of animal reservoirs undertaken (as I understand it).

      (4) The human isolates are all from clinical cases. Clinical cases of the disease are likely to be closely related to other clinical cases, because of outbreaks (either detected, or undetected), and the high ascertainment rate for serious infections.

      (5) Therefore, taking an equivalent number of animal and clinical isolates, will underestimate the total diversity in the clinical isolates because the sampling of the clinical isolates is less "independent" (in the statistical sense) than sampling from the animal isolates.

      (6) This could lead to over-estimating of transmission from cattle to humans.

      We appreciate the reviewer’s careful thoughts about our sampling strategy. We agree with points (1) and (2), and we will provide additional details on the animal collections as requested.

      We agree with point (3) in theory but not in fact. As shown in Figure 3a, the cattle isolates were very closely related, despite the temporal and geographic breadth of sampling within Alberta. The median SNP distance between cattle sequences was 45 (IQR 36-56), compared to 54 (IQR 43-229) SNPs between human sequences from cases in Alberta during the same years. Additionally, as shown in Figure 2, only clade A and B isolates – clades that diverge substantially from the rest of the tree – were dominated by human cases in Alberta. We will better highlight this evidence in the revision.

      We agree with the reviewer in point (4) that outbreaks can be an important confounder of phylogenetic inference. This is why we down-sampled outbreaks (based on genetic relatedness, not external designation) in our extended analyses (lines 192-194). We did not do this in the primary analysis, because there were no large clusters of identical isolates. Figure 3b shows a limited number of small clusters; however, clustered cattle isolates outnumbered clustered human isolates, suggesting that any bias would be in the opposite direction the reviewer suggests. Regarding severe cases being oversampled among the clinical isolates, this is absolutely true and a limitation of all studies utilizing public health reporting data. We will make this limitation to generalizability clearer in the discussion. However, as noted above, clinical isolates were more variable than cattle isolates, so it does not appear to have heavily biased the analysis.

      We disagree with the reviewer on point (5). While the bias toward severe cases could make the human isolates less independent, the relative sampling proportions are likely to induce greater distance between clinical isolates than cattle isolates, which is exactly what we observe (see response to point (3) above). Cattle are E. coli O157:H7’s primary reservoir, and humans are incidental hosts not able to sustain infection chains long-term. Not only is the bacteria prevalent among cattle, cattle are also highly prevalent in Alberta. Thus, even with 89 sampling points, we are still capturing a small proportion of the E. coli O157:H7 in the province. Being able to sample only a small proportion of cattle’s E. coli O157:H7 increases the likelihood of only sampling from the center of the distribution, making extreme cases such as that shown at the very bottom of the tree in Figure 3b, rare and important. In comparison, sampling from human cases constitutes a higher proportion of human infections relative to cattle, and is therefore more representative of the underlying distribution, including extremes. We will add this point to the limitations. As with the clustering above, if anything, this outcome would have biased the study away from identifying cattle as the primary reservoir. Additionally, the relatively small proportion of cattle sampled makes our finding that 15.7% of clinical isolates were within 5 SNPs of a cattle isolate, the distance most commonly used to indicate transmission for E. coli O157:H7, all the more remarkable.

      Because of the aforementioned points, we disagree with the reviewer’s conclusion in point (6). We believe transmission from cattle-to-humans is likely underestimated for the reasons given above. Not only do all prior studies indicate ruminants as the primary reservoirs of E. coli O157:H7, and humans as only incidental hosts, our specific data do not support the reviewer’s individual contentions. That said, we will conduct a sensitivity analysis as recommended to determine the impact of sampling and inclusion of the small clusters on our primary findings.

      (7) We hypothesize that the large proportion of disease associated with local transmission systems is a principal cause of Alberta's high E. coli O157:H7 incidence" - this seems a bit tautological. There is a lot of O157 because there's a lot of transmission. What part of the fact it is local means that it is a principal cause of high incidence? It seems that they've observed a high rate of local transmission, but the reasons for this are not apparent, and hence the cause of Alberta's incidence is not apparent. Would a better conclusion not be that "X% of STEC in Alberta is the result of transmission of local variants"? And then, this poses a question for future epi studies of what the transmission pathway is.

      The reviewer is correct, and the suggestion for the direction of future studies was our intent with this statement. We will revise it.

      Reviewer #2 (Public Review):

      This study identified multiple locally evolving lineages transmitted between cattle and humans persistently associated with E. coli O157:H7 illnesses for up to 13 years. Furthermore, this study mentions a dramatic shift in the local persistent lineages toward strains with the more virulent stx2a-only profile. The authors hypothesized that this phenomenon is the large proportion of disease associated with local transmission systems is a principal cause of Alberta's high E. coli O157:H7 incidence. These opinions more effectively explain the role of the cattle reservoir in the dynamics of E. coli O157:H7 human infections.

      (1) The authors acknowledge the possibility of intermediate hosts or environmental reservoirs playing a role in transmission. Further discussion on the potential roles of other animal species commonly found in Alberta (e.g., sheep, goats, swine) could enhance the understanding of the transmission dynamics. Were isolates from these species available for analysis? If not, the authors should clearly state this limitation.

      We will expand the discussion of other species in Alberta, as suggested, including other livestock, wildlife, and the potential role of birds and flies. Unfortunately, we did not have sequences available from other species, and we will add this to the limitations. Sequences from other species may be available from sequences collected by others, which as we note in the limitations do not have sufficient metadata to assign them to Alberta vs. the rest of Canada. While we have requested this data, we have been unsuccessful in obtaining it. We will continue to pursue it.

      (2) The focus on E. coli O157:H7 is understandable given its prominence in Alberta and the availability of historical data. However, a brief discussion on the potential applicability of the findings to non-O157 STEC serogroups, and the limitations therein, would be beneficial. Are there reasons to believe the transmission dynamics would be similar or different for other serogroups?

      We appreciate this comment and will expand our discussion of relevance to non-O157 STEC. Other authors have proposed that transmission dynamics differ, and studies of STEC risk factors, including our own, support this. However, there has been very little direct study of non-O157 transmission dynamics and there is even less cross-species genomic and metadata available for non-O157 isolates of concern.

      (3) The authors briefly mention the need for elucidating local transmission systems to inform management strategies. A more detailed discussion on specific public health interventions that could be targeted at the identified LPLs and their potential reservoirs would strengthen the paper's impact.

      We agree with the reviewer that this would be a good addition to the manuscript. The public health implications for control are several and extend to non-STEC reportable zoonotic enteric infections, such as Campylobacter and Salmonella. We will add a discussion of these.

      (4) Understanding the relationship between specific risk factors and E. coli O157:H7 infections is essential for developing effective prevention strategies. Have case-control or cohort studies been conducted to assess the correlation between identified risk factors and the incidence of E. coli O157:H7 infections? What methodologies were employed to control for potential confounders in these studies?

      Yes, there have been several case-control studies of reported cases. Many of these are referenced in the discussion in terms of the contribution of different sources to infection. However, we will add a more explicit discussion of risk factors.

      (5) The study's findings are noteworthy, particularly in the context of E. coli O157:H7 epidemiology. However, the extent to which these results can be replicated across different temporal and geographical settings remains an open question. It would be constructive for the authors to provide additional data that demonstrate the replication of their sampling and sequencing experiments under varied conditions. This would address concerns regarding the specificity of the observed patterns to the initial study's parameters.

      We appreciate the reviewer’s comment, as we are currently building on this analysis with an American dataset with different types of data available than were used in this study. We will add a discussion of this. We will also be adding a sensitivity analysis to the manuscript simulating a different sampling approach, which should also be informative to this question.

    1. Author response:

      Public Reviews:

      Reviewer #1 (Public Review):

      Weaknesses:

      The authors need to discuss their study in the context of previous papers that have shown an important role for E. tarda flagellin in inflammasome activation and test whether flagellin and/or E. tarda T3SSs needle or rod can activate NLRC4.

      We will add discussions on E. tarda flagellin and examine whether E. tarda flagellin or T3SS needle/rod can activate NLRC4.

      The authors show that eseB and its homologs can activate NLRC4, but there are also other translocon proteins that are very different such as YopB or PopB. and share little homology with eseB. It would be nice to include a section comparing the different type 3 secretion systems. are there 2 different families of T3SSs, those that feature translocon components that are recognized by NAIP-NLRC4 and those that cannot be recognized?

      The reviewer raises an interesting question. We will explore this question and provide relevant discussions/hypothesis in the revised manuscript.

      Reviewer #2 (Public Review):

      Weaknesses:

      The functional assessment of EseB homologues is limited to inflammasome activation at the protein level but does not include the effects on cell viability as shown for E. tarda EseB. Confirmation that EseB homologues have similar effects on cell death would strengthen this portion of the manuscript.

      According to the reviewer’s suggestion, we plan to examine the effects of representative EseB homologs on cell death.

    1. Author response:

      Public Reviews:

      Reviewer #1 (Public Review):

      (1) It will be interesting to monitor the levels of another MIM insertase namely, OXA1. This will help to understand whether some of the observed changes in levels of OXPHOS subunits are related to alterations in the amounts of this insertase.

      OXA1 was not detected in the untargeted mass spectrometry analysis, most likely due to the fact that it is a polytopic membrane protein, spanning the membrane five times (1,2). Consequently, we measured OXA1 levels with immunoblotting, comparing patient fibroblast cells to the HC. No significant change in OXA1 steady state levels was observed. 

      See the results below. These results will be added and discussed in the revised manuscript.

      Author response image 1.

      (2) Figure 3: How do the authors explain that although TIMM17 and TIMM23 were found to be significantly reduced by Western analysis they were not detected as such by the Mass Spec. method?

      The untargeted mass spectrometry in the current study failed to detect the presence of TIMM17 for both, patient fibroblasts and mice neurons, while TIMM23 was detected only for mice neurons and a decrease was observed for this protein but was not significant. This is most likely due to the fact that TIMM17 and TIMM23 are both polytopic membrane proteins, spanning the membrane four times, which makes it difficult to extract them in quantities suitable for MS detection (2,3).

      (3) How do the authors explain the higher levels of some proteins in the TIMM50 mutated cells?

      The levels of fully functional TIM23 complex are deceased in patients' fibroblasts. Therefore, the mechanism by which the steady state level of some TIM23 substrate proteins is increased, can only be explained relying on events that occur outside the mitochondria. This could include increase in transcription, translation or post translation modifications, all of which may increase their steady state level albite the decrease in the steady state level of the import complex.

      (4) Can the authors elaborate on why mutated cells are impaired in their ability to switch their energetic emphasis to glycolysis when needed?

      Cellular regulation of the metabolic switch to glycolysis occurs via two known pathways: 1) Activation of AMP-activated protein kinase (AMPK) by increased levels of AMP/ADP (4). 2) Inhibition of pyruvate dehydrogenase (PDH) complexes by pyruvate dehydrogenase kinases (PDK) (5). Therefore, changes in the steady state levels of any of these regulators could push the cells towards anaerobic energy production, when needed. In our model systems, we did not observe changes in any of the AMPK, PDH or PDK subunits that were detected in our untargeted mass spectrometry analysis (see volcano plots below, no PDK subunits were detected in patient fibroblasts). Although this doesn’t directly explain why the cells have an impaired ability to switch their energetic emphasis, it does possibly explain why the switch did not occur de facto.

      Author response image 2.

      Reviewer #2 (Public Review):

      (1) The authors claim in the abstract, the introduction, and the discussion that TIMM50 and the TIM23 translocase might not be relevant for mitochondrial protein import in mammals. This is misleading and certainly wrong!!!

      Indeed, it was not in our intention to claim that the TIM23 complex might not be relevant. We have now rewritten the relevant parts to convey the correct message:

      Abstract – 

      Line 25 - “Strikingly, TIMM50 deficiency had no impact on the steady state levels of most of its putative substrates, suggesting that even low levels of a functional TIM23 complex are sufficient to maintain the majority of complex-dependent mitochondrial proteome.”

      Introduction – 

      Line 87 - Surprisingly, functional and physiological analysis points to the possibility that low levels of TIM23 complex core subunits (TIMM50, TIMM17 and TIMM23) are sufficient for maintaining steady-state levels of most presequence-containing proteins. However, the reduced TIM23CORE component levels do affect some critical mitochondrial properties and neuronal activity.

      Discussion – 

      Line 339 – “…surprising, as normal TIM23 complex levels are suggested to be indispensable for the translocation of presequence-containing mitochondrial proteins…”

      Line 344 – “…it is possible that unlike what occurs in yeast, normal levels of mammalian TIMM50 and TIM23 complex are mainly essential for maintaining the steady state levels of intricate complexes/assemblies.”

      Line 396 – “In summary, our results suggest that even low levels of TIMM50 and TIM23CORE components suffice in maintaining the majority of mitochondrial matrix and inner membrane proteome. Nevertheless, reductions in TIMM50 levels led to a decrease of many OXPHOS and MRP complex subunits, which indicates that normal TIMM50 levels might be mainly essential for maintaining the steady state levels and assembly of intricate complex proteins.”

      (1) Homberg B, Rehling P, Cruz-Zaragoza LD. The multifaceted mitochondrial OXA insertase. Trends Cell Biol. 2023;33(9):765–72. 

      (2) Carroll J, Altman MC, Fearnley IM, Walker JE. Identification of membrane proteins by tandem mass spectrometry of protein ions. Proc Natl Acad Sci U S A.

      2007;104(36):14330–5. 

      (3) Dekker PJT, Keil P, Rassow J, Maarse AC, Pfanner N, Meijer M. Identification of MIM23, a putative component of the protein import machinery of the mitochondrial inner membrane. FEBS Lett. 1993;330(1):66–70. 

      (4) Trefts E, Shaw RJ. AMPK: restoring metabolic homeostasis over space and time. Mol Cell [Internet]. 2021;81(18):3677–90. Available from:

      https://doi.org/10.1016/j.molcel.2021.08.015

      (5) Zhang S, Hulver MW, McMillan RP, Cline MA, Gilbert ER. The pivotal role of pyruvate dehydrogenase kinases in metabolic flexibility. Nutr Metab. 2014;11(1):1–9.

    1. Author response:

      The following is the authors’ response to the previous reviews.

      Public Reviews:

      Reviewer #2 (Public Review):

      Summary:

      The manuscript by Kelbert et al. presents results on the involvement of the yeast transcription factor Sfp1 in the stabilisation of transcripts whose synthesis it stimulates. Sfp1 is known to affect the synthesis of a number of important cellular transcripts, such as many of those that code for ribosomal proteins. The hypothesis that a transcription factor can remain bound to the nascent transcript and affect its cytoplasmic half-life is attractive. However, the association of Sfp1 with cytoplasmic transcripts remains to be validated, as explained in the following comments:

      A two-hybrid based assay for protein-protein interactions identified Sfp1, a transcription factor known for its effects on ribosomal protein gene expression, as interacting with Rpb4, a subunit of RNA polymerase II. Classical two-hybrid experiments depend on the presence of the tested proteins in the nucleus of yeast cells, suggesting that the observed interaction occurs in the nucleus. Unfortunately, the two-hybrid method cannot determine whether the interaction is direct or mediated by nucleic acids. The revised version of the manuscript now states that the observed interaction could be indirect.

      To understand to which RNA Sfp1 might bind, the authors used an N-terminally tagged fusion protein in a cross-linking and purification experiment. This method identified 264 transcripts for which the CRAC signal was considered positive and which mostly correspond to abundant mRNAs, including 74 ribosomal protein mRNAs or metabolic enzyme-abundant mRNAs such as PGK1. The authors did not provide evidence for the specificity of the observed CRAC signal, in particular what would be the background of a similar experiment performed without UV cross-linking. This is crucial, as Figure S2G shows very localized and sharp peaks for the CRAC signal, often associated with over-amplification of weak signal during sequencing library preparation.

      (1) To rule out possible PCR artifacts, we used a UMI (Unique Molecular Identifier) scan. UMIs are short, random sequences added to each molecule by the 5’ adapter to uniquely tag them. After PCR amplification and alignment to the reference genome, groups of reads with identical UMIs represent only one unique original molecule. Thus, UMIs allow distinguishing between original molecules and PCR duplicates, effectively eliminating the duplicates.

      (2) Looking closely at the peaks using the IGV browser, we noticed that the reads are by no means identical. Each carrying a mutation [probably due to the cross-linking] in a different position and having different length. Note that the reads are highly reproducible in two replicate.

      (3) CRAC+ genes do not all fall into the category of highly transcribed genes.  On the contrary, as depicted in Figure 6A (green dots), it is evident that CRAC+ genes exhibit a diverse range of Rpb3 ChIP and GRO signals. Furthermore, as illustrated in Figure 7A, when comparing CRAC+ to Q1 (the most highly transcribed genes), it becomes evident that the Rpb4/Rpb3 profile of CRAC+ genes is not a result of high transcription levels.

      (4) Only a portion of the RiBi mRNAs binds Sfp1, despite similar expression of all RiBi.

      (5) The CRAC+ genes represent a distinct group with many unique features. Moreover, many CRAC+ genes do not fall into the category of highly transcribed genes.

      (6) The biological significance of the 262 CRAC+ mRNAs was demonstrated by various experiments; all are inconsistent with technical flaws. Some examples are:

      a) Fig. 2a and B show that most reads of CRAC+ mRNA were mapped to specific location – close the pA sites.

      b) Fig. 2C shows that most reads of CRAC+ mRNA were mapped to specific RNA motif.

      c) Most RiBi CRAC+ promoter contain Rap1 binding sites (p= 1.9x10⁻²²), whereas the vast majority of RiBi CRAC- promoters do not contain Rap1 binding site. (Fig. 3C).

      d) Fig. 4A shows that RiBi CRAC+ mRNAs become destabilized due to Sfp1 deletion, whereas RiBi CRAC- mRNAs do not. Fig. 4B shows similar results due to

      e) Fig. 6B shows that the impact of Sfp1 on backtracking is substantially higher for CRAC+ than for CRAC- genes. This is most clearly visible in RiBi genes.

      f) Fig. 7A shows that the Sfp1-dependent changes along the transcription units is substantially more rigorous for CRAC+ than for CRAC-.

      g) Fig. S4B Shows that chromatin binding profile of Sfp1 is different for CRAC+ and CRAC- genes

      In a validation experiment, the presence of several mRNAs in a purified SFP1 fraction was measured at levels that reflect the relative levels of RNA in a total RNA extract. Negative controls showing that abundant mRNAs not found in the CRAC experiment were clearly depleted from the purified fraction with Sfp1 would be crucial to assess the specificity of the observed protein-RNA interactions (to complement Fig. 2D).

      GPP1, a highly expressed genes, is not to be pulled down by Sfp1 (Fig. 2D). GPP1 (alias RHR2) was included in our Table S2 as one of the 264 CRAC+ genes, having a low CRAC value. However, when we inspected GPP1 results using the IGV browser, we realized that the few reads mapped to GPP1 are actually anti-sense to GPP1 (perhaps they belong to the neighboring RPL34B genes, which is convergently transcribed to GPP1) (see Fig. 1 at the bottom of the document). Thus, GPP1 is not a CRAC+ gene and would now serve as a control. See  We changed the text accordingly (see page 11 blue sentences). In light of this observation, we checked other CRAC genes and found that, except for ALG2, they all contain sense reads (some contain both sense and anti-sense reads). ALG2 and GPP1 were removed leaving 262 CRAC+ genes.

      The CRAC-selected mRNAs were enriched for genes whose expression was previously shown to be upregulated upon Sfp1 overexpression (Albert et al., 2019). The presence of unspliced RPL30 pre-mRNA in the Sfp1 purification was interpreted as a sign of co-transcriptional assembly of Sfp1 into mRNA, but in the absence of valid negative controls, this hypothesis would require further experimental validation. Also, whether the fraction of mRNA bound by Sfp1 is nuclear or cytoplasmic is unclear.

      Further experimental validation was provided in some of our figures (e.g., Fig. 5C, Fig. 3B).

      We argue that Sfp1 binds RNA co-transcriptionally and accompanies the mRNA till its demise in the cytoplasm: Co-transcriptional binding is shown in: (I) a drop in the Sfp1 ChIP-exo signal that coincides with the position of Sfp1 binding site in the RNA (Fig. 5C), demonstrating a movement of Sfp1 from chromatin to the transcript, (II) the dependence of Sfp1 RNA-binding on the promoter (Fig. 3B) and binding of intron-containing RNA. Taken together these 3 different experiments demonstrate that Sfp1 binds Pol II transcript co-transcriptionally.  Association of Sfp1 with cytoplasmic mRNAs is shown in the following experiments: (I) Figure 2D shows that Sfp1 pulled down full length RNA, strongly suggesting that these RNA are mature cytoplasmic mRNAs. (II) mRNA encoding ribosomal proteins, which belong to the CRAC+ mRNAs group are degraded by Xrn1 in the cytoplasm (Bresson et al., Mol Cell 2020). The capacity of Sfp1 to regulates this process (Fig. 4A-D) is therefore consistent with cytoplasmic activity of Sfp1. (III) The effect of Sfp1 on deadenylation (Fig. 4D), a cytoplasmic process, is also consistent with cytoplasmic activity of Sfp1. 

      To address the important question of whether co-transcriptional assembly of Spf1 with transcripts could alter their stability, the authors first used a reporter system in which the RPL30 transcription unit is transferred to vectors under different transcriptional contexts, as previously described by the Choder laboratory (Bregman et al. 2011). While RPL30 expressed under an ACT1 promoter was barely detectable, the highest levels of RNA were observed in the context of the native upstream RPL30 sequence when Rap1 binding sites were also present. Sfp1 showed better association with reporter mRNAs containing Rap1 binding sites in the promoter region. Removal of the Rap1 binding sites from the reporter vector also led to a drastic decrease in reporter mRNA levels. Co-purification of reporter RNA with Sfp1 was only observed when Rap1 binding sites were included in the reporter. Negative controls for all the purification experiments might be useful.

      In the swapping experiment, the plasmid lacking RapBS serves as the control for the one with RapBS and vice versa (see Bregman et al., 2011). Remember, that all these contracts give rise to identical RNA. Indeed, RabBS affects both mRNA synthesis and decay, therefore the controls are not ideal. However, see next section.

      More importantly, in Fig. 3B “Input” panel, one can see that the RNA level of “construct F” was higher than the level of “construct E”. Despite this difference, only the RNA encoded by construct E was detected in the IP panel. This clearly shows that the detection of the RNA was not merely a result of its expression level.

      To complement the biochemical data presented in the first part of the manuscript, the authors turned to the deletion or rapid depletion of SFP1 and used labelling experiments to assess changes in the rate of synthesis, abundance and decay of mRNAs under these conditions. An important observation was that in the absence of Sfp1, mRNAs encoding ribosomal protein genes not only had a reduced synthesis rate, but also an increased degradation rate. This important observation needs careful validation,

      Indeed, we do provide validations in Fig. 4C Fig. 4D Fig. S3A and during the revision we included an  additional validation as Fig. S3B. Of note, we strongly suspect that GRO is among the most reliable approaches to determine half-lives (see our response in the first revision letter).

      As genomic run-on experiments were used to measure half-lives, and this particular method was found to give results that correlated poorly with other measures of half-life in yeast (e.g. Chappelboim et al., 2022 for a comparison). As an additional validation, a temperature shift to 42{degree sign}C was used to show that , for specific ribosomal protein mRNA, the degradation was faster, assuming that transcription stops at that temperature. It would be important to cite and discuss the work from the Tollervey laboratory showing that a temperature shift to 42{degree sign}C leads to a strong and specific decrease in ribosomal protein mRNA levels, probably through an accelerated RNA degradation (Bresson et al., Mol Cell 2020, e.g. Fig 5E).

      This was cited. Thank you. 

      Finally, the conclusion that mRNA deadenylation rate is altered in the absence of Sfp1, is difficult to assess from the presented results (Fig. 3D).

      This type of experiment was popular in the past. The results in the literature are similar to ours (in fact, ours are nicer). Please check the papers cited in our MS and a number of papers by Roy Parker.

      The effects of SFP1 on transcription were investigated by chromatin purification with Rpb3, a subunit of RNA polymerase, and the results were compared with synthesis rates determined by genomic run-on experiments. The decrease in polII presence on transcripts in the absence of SFP1 was not accompanied by a marked decrease in transcript output, suggesting an effect of Sfp1 in ensuring robust transcription and avoiding RNA polymerase backtracking. To further investigate the phenotypes associated with the depletion or absence of Sfp1, the authors examined the presence of Rpb4 along transcription units compared to Rpb3. An effect of spf1 deficiency was that this ratio, which decreased from the start of transcription towards the end of transcripts, increased slightly. To what extent this result is important for the main message of the manuscript is unclear.

      Suggestions: a) please clearly indicate in the figures when they correspond to reanalyses of published results.

      This was done.

      b) In table S2, it would be important to mention what the results represent and what statistics were used for the selection of "positive" hits. 

      This was discussed in the text.

      Strengths:

      - Diversity of experimental approaches used.

      - Validation of large-scale results with appropriate reporters.

      Weaknesses:

      - Lack of controls for the CRAC results and lack of negative controls for the co-purification experiments that were used to validate specific mRNA targets potentially bound by Sfp1.

      - Several conclusions are derived from complex correlative analyses that fully depend on the validity of the aforementioned Sfp1-mRNA interactions.

      We hope that our responses to Reviewer 2's thoughtful comments have rulled out concerns regarding the lack of controls.

      Recommendations for the authors:

      Reviewer #2 (Recommendations For The Authors):

      Please review the text for spelling errors. While not mandatory, wig or begraph files for the CRAC results would be very useful for the readers.

      Author response image 1.

      A snapshot of IGV GPP1 locus showing that all the reads are anti-sense (pointing at the opposite direction of the gene (the gene arrows [white arrows over blue, at the bottom] are pointing to the right whereas the reads’ orientations are pointing to the left).

    1. Author response:

      The following is the authors’ response to the current reviews.

      The concerns raised during the review have been incorporated into the discussion of the results, and the need for further research is acknowledged in the paper. This is not possible in the present study, as the clinical project has been completed and further patients cannot be enrolled without starting a new project. We are confident that the results are scientifically valid and that the methodology was scientifically sound and up to date. They were obtained on a dataset that was obviously large enough to allow 20% of it to be set aside and a machine-learned classifier to be trained on the remaining 80%, which then assigned samples to neuropathy with an accuracy better than guessing.

      Furthermore, our results are at least tentatively replicated in a completely independent data set from another patient cohort. The strengths and limitations of the study design, in particular the latter, are discussed in the necessary depth. In summary, the machine-learned results provided major hits on one side and probably unimportant lipids on the other side of the variable importance scale. Both could be verified in vitro. We are therefore confident that we have contributed to the advancement of knowledge about cancer therapy-associated neuropathy and look forward to further developments in this area.


      The following is the authors’ response to the original reviews.

      Weaknesses Reviewer 1: 

      There are a number of weaknesses in the study. The small sample size is a significant limitation of the study. Out of 31 patients, only 17 patients were reported to develop neuropathy, with significant neuropathy (grade 2/3) in only 5 patients. The authors acknowledge this limitation in the results and discussion sections of the manuscript, but it limits the interpretation of the results. Also acknowledged is the limited method used to assess neuropathy. 

      We agree with the reviewer that the cohort size and assessment of neuropathy are limitations of our study as we already described in the corresponding section of the manuscript. However, occurrence and grade of the neuropathy are in line with results reported from previous studies. From these studies, the expected occurrence of neuropathy with our therapeutic regimen is around 50-70% (54.9% in our cohort), and most patients (80-90%) are expected to experience Grade 1 neuropathy after 12 weeks (13). In these studies, neuropathy is assessed by using questionnaires or by grading via NCTCTCAE as in our study. In summary, assessment and occurrence of neuropathy of our reported cohort are in line with previous reports.

      Potentially due to this small number of patients with neuropathy, the machine learning algorithms could not distinguish between samples with and without neuropathy. Only selected univariate analyses identified differences in lipid profiles potentially related to neuropathy.  

      The data analysis consistently followed a "mixture of experts" approach, as this seems to be the most successful way to deal with omics data. We have elaborated on this in the Methods section, including several supporting references. Regarding the quoted sentence from the results section, after rereading it, we realized that it was somewhat awkwardly worded. What we mean is now better worded in the results section, namely “Although the three algorithms detected neuropathy in new cases, unseen during training, at balanced accuracy of up to 0.75, while only the guess level of 0.5 was achieved when using permuted data for training, the 95% CI of the performance measures was not separated from guess level”. Therefore, multivariate feature selection was not considered a valid approach, since it requires that the algorithms from which the feature importance is read can successfully perform their task of class assignment (4). Therefore, univariate methods (Cohen's d, FPR, FWE) were preferred, as well as a direct hypothesis transfer of the top hits from the abovementioned day1/2 assessments to neuropathy. Classical statistics consisting of direct group comparisons using Kruskal-Wallis tests (5) were performed.” 

      It was our approach to investigate the data set in an unbiased manner by different machine learning algorithms and select those lipids that the majority of the algorithms considered important for distinguishing the patient groups (majority voting). This way, the inconsistencies and limitations of a single evaluation method, such as regression analysis, that occur in some datasets, can be mitigated. 

      Three sphingolipid mediators including SA1P differed between patients with and without neuropathy at the end of treatment. These sphingolipids were elevated at the end of treatment in the cohort with neuropathy, relative to those without neuropathy. However, across all samples from pre to post-paclitaxel treatment, there was a significant reduction in SA1P levels. It is unclear from the data presented what the underlying mechanism for this result would be. 

      We agree with the reviewer that our study does not identify the mechanism by which paclitaxel treatment alters sphingolipid concentrations in the plasma of patients. It has been reported before that paclitaxel may increase expression and activity of serine palmitoyltransferase (SPT) which is the crucial enzyme and rate-limiting step in the denovo synthesis of sphingolipids. This may be associated with a shift towards increased synthesis of 1-deoxysphingolipids and a decrease of “classical” sphingolipids (6) and may explain the general reduction of SA1P and other sphingolipid levels after paclitaxel treatment in our study. 

      It is also conceivable that paclitaxel reduces the release of sphingolipids into the plasma. Paclitaxel is a microtubule stabilizing agent (7) that may interfere with intracellular transport processes and release of paracrine mediators. 

      The mechanistic details of paclitaxel involvement in sphingolipid metabolism or transport are highly interesting but identifying them is beyond the scope of our manuscript.

      If elevated SA1P is associated with neuropathy development, it would be expected to increase in those who develop neuropathy from pre to post-treatment time points. 

      There is a general trend of reduced plasma SA1P concentrations following paclitaxel treatment. Nevertheless, patients experiencing neuropathy exhibit significantly elevated SA1P levels post-treatment. 

      It has been shown before that paclitaxel-induced neuropathic pain requires activation of the S1P1 receptor in a preclinical study (8). Moreover, a meta-analysis of genome-wide association studies (GWAS) from two clinical cohorts identified multiple regulatory elements and increased activity of S1PR1 associated with paclitaxel-induced neuropathy (9). These data imply that enhanced S1P receptor activity and signaling are key drivers of paclitaxel-induced neuropathy. It seems that both, increased levels of the sphingolipid ligands in combination with enhanced expression and activity of S1P receptors can potentiate paclitaxel-induced neuropathy in patients. This explains why also decreased SA1P concentrations after paclitaxel treatment can still enhance neuropathy via the S1PRTRPV1 axis in sensory neurons.

      We added this paragraph to the discussions section of our manuscript.

      Primary sensory neuron cultures were used to examine the effects of SA1P application.

      SA1P application produced calcium transients in a small proportion of sensory neurons. It is not clear how this experimental model assists in validating the role of SA1P in neuropathy development as there is no assessment of sensory neuron damage or other hallmarks of peripheral neuropathy. These results demonstrate that some sensory neurons respond to SA1P and that this activity is linked to TRPV1 receptors. However, further studies will be required to determine if this is mechanistically related to neuropathy.

      As we detected elevated levels of SA1P in the plasma of PIPN patients, we can assume higher concentrations in the vicinity of sensory neurons. These neurons are the main drivers for neuropathy and neuropathic pain and are strongly affected by paclitaxel in their activity (10-15). Also, TRPV1 shows altered activity patterns in response to paclitaxel treatment (16). Because of its relevance for nociception and pathological pain, TRPV1 activity is a suitable and representative readout for pathological pain states in peripheral sensory neurons (17, 18), which is why we investigated them.

      We would like to point out the potency of SA1P to increase capsaicin-induced calciumtransients in sensory neurons at submicromolar concentrations. 

      We also agree with the reviewer that further studies need to investigate the underlying mechanisms in more detail. We added this sentence to the final paragraph in the discussion section of our manuscript.

      Weaknesses Reviewer 2: 

      The article is poorly written, hindering a clear understanding of core results. While the study's goals are apparent, the interpretation of sphingolipids, particularly SA1P, as key mediators of paclitaxel-induced neuropathy lacks robust evidence. 

      We agree that the relevance of SA1P as key mediator of paclitaxel-induced neuropathy might be overstated and changed the wording throughout the manuscript accordingly. However, we would like to point out the potency of this lipid to increase capsaicin-induced calcium-transients in sensory neurons at submicromolar concentrations. 

      Also, the lipid signature in the plasma of PIPN patients shows a unique pattern and sphingolipids are the group that showed the strongest alterations when comparing the patient groups. We also measured eicosanoids, such as prostaglandins, linoleic acid metabolites, endocannabinoids and other lipid groups that have previously been associated with influences on pain perception or nociceptor sensitization. However, none of these lipids showed significant differences in their concentrations in patient plasma. This is why we consider sphingolipids as contributors to or markers of paclitaxel-induced neuropathy in patients.

      We also revised the entire article to improve its clarity.

      The introduction fails to establish the significance of general neuropathy or peripheral neuropathy in anticancer drug-treated patients, and crucial details, such as the percentage of patients developing general neuropathy or peripheral neuropathy, are omitted. This omission is particularly relevant given that only around 50% of patients developed neuropathy in this study, primarily of mild Grade 1 severity with negligible symptoms, contradicting the study's assertion of CIPN as a significant side effect. 

      As we already described in the introduction, CIPN is a serious dose- and therapy-limiting side effect, which affects up to 80% of treated patients. This depends on dose and combination of chemotherapeutic agents. For paclitaxel, therapeutic doses range from 80 – 225 mg/m². As CIPN symptoms are dose-dependent, the number of PIPN patients that receive a high paclitaxel dose is higher than the number of PIPN patient receiving a low dose.

      In our study, we mainly used a low dose paclitaxel, because this therapeutic regimen is the most widely used paclitaxel monotherapy. From previous studies, the expected occurrence of neuropathy with this therapeutic regimen is around 50-70%, and most patients (8090%) are expected to experience Grade 1 neuropathy after 12 weeks (1-3).

      Our results are within the range reported by these studies (54.9% patients with neuropathy). Also, as we highlight in Table S1, the neuropathy symptoms persist in most cases for several years after chemotherapy, affecting quality of life of these patients which makes it far from being a negligible symptom.

      We added some more information concerning PIPN in the introduction section in which we emphasize the clinical problem.

      The lack of clarity in distinguishing results obtained by lipidomics using machine learning methods and conventional methods adds to the confusion. The poorly written results section fails to specify SA1P's downregulation or upregulation, and the process of narrowing down to sphingolipids and SA1P is inadequately explained. 

      We have tried to keep the machine learning part in the main manuscript short and moved major parts of it to a supplement. However, as this has been claimed to have led to a lack of clarity, we have expanded the description of the data analysis and added extensive explanations and supporting references for the mixed expert approach that was used throughout the analysis. We hope this is now clear.

      Integrating a significant portion of the discussion section into the results section could enhance clarity. An explanation of the utility of machine learning in classifying patient groups over conventional methods and the citation of original research articles, rather than relying on review articles, may also add clarity to the usefulness of the study. 

      As suggested by the reviewer, we moved the relevant parts from the discussion to the results section in the revised version of our manuscript.

      Reviewer #1 (Recommendations For The Authors): 

      Figure 2 should be better explained or removed. In its current form, it does not add to the interpretation of the manuscript.  

      As mentioned above, we have expanded the description of the ESOM/U-matrix method in the Methods section and rewritten the figure legend. In addition, we have annotated the U-matrix in the figure. The method has been reported extensively in the computer science and biomedical literature, and a more detailed description in the referenced papers would go beyond the current focus on lipidomics. However, we believe that this discussion is sufficiently detailed for the readers of this report: "… a second unsupervised approach was used to verify the agreement between the lipidomics data structure and the prior classification, implemented as self-organizing maps (SOM) of artificial neurons (19). In the special form of an “emergent” SOM (ESOM (20)), the present map consisted of 4,000 neurons arranged on a two-dimensional toroidal grid with 50 rows and 80 columns (21, 22). ESOM was used because it has been repeatedly shown to correctly detect subgroup structures in biomedical data sets comparable to the present one (20, 22, 23). The core principle of SOM learning is to adjust the weights of neurons based on their proximity to input data points. In this process, the best matching unit (BMU) is identified as the neuron closest to a given data point. The adaptation of the weights is determined by a learning rate (η) and a neighborhood function (h), both of which gradually decrease during the learning process. Finally, the groups are projected onto separate regions of the map. On top of the trained ESOM, the distance structure in the high-dimensional feature space was visualized in the form of a so-called U-matrix (24) which is the canonical tool for displaying the distance structures of input data on ESOM (21). 

      The visual presentation facilitates data group separation by displaying the distances between BMUs in high-dimensional space in a color-coding that uses a geographical map analogy, where large "heights" represent large distances in feature space, while low "valleys" represent data subsets that are similar. "Mountain ranges" with "snow-covered" heights visually separate the clusters in the data. Further details about ESOM can be found in (24)."

      The second patient cohort is only included in the discussion - with cohort details in the supplementary material and figures included in the main text. Perhaps these data should be removed entirely. The findings are described as trends and not statistically significant and multiple issues with this second cohort are mentioned in the discussion. 

      We agree with the reviewer that including the second patient cohort in the discussion is inadequate. Of course, there are differences between the patient cohorts that do not allow direct comparison and that are highlighted in the section on limitations of the study. However, we still think it is interesting and relevant to show these data, because we used our algorithms trained on the first patient cohort to analyze the second cohort. And these data support the main results. 

      We therefore moved the entire paragraph to the results section of to improve coherence of our manuscript. The passage was introduced with the subheading:  “Support of the main results in an independent second patient cohort”.

      The title does not reflect the content of the paper and should be changed to better reflect the content and its significance. 

      We change the title to “Machine learning and biological validation identify sphingolipids as potential mediators of paclitaxel-induced neuropathy in cancer patients” to avoid overstating the results as suggested by the Reviewer.

      Further, the discussion should be modified to avoid overstating the results. 

      As the reviewer suggests, we changed the wording to avoid overstating the results. 

      Reviewer #2 (Recommendations For The Authors): 

      Please address the absence of clear neuropathy in the majority of patients after treatment with paclitaxel in your discussion. 

      As stated above, occurrence and grade of the neuropathy are in line with the results from previous studies. From these studies, the expected occurrence of neuropathy with our therapeutic regimen is around 50-70%, (the variability is due to differences in the assessment methods) and most patients (80-90%) are expected to experience Grade 1 neuropathy after 12 weeks (1-3). 

      We added this information in the discussion section of the revised manuscript.

      Line 65: Kindly replace review articles with original research articles for proper citation. 

      We replaced the review articles with original publications, focusing on clinical observations. We added the following publications: Jensen et al., Front Neurosci 2020; Chen et al., Neurobiol Aging 2018; Igarashi et al., J Alzheimers Dis. 2011; Kim et al., Oncotarget 2017 as references 17-20 in the revised version of our manuscript.

      Line 260: The mention of SA1P is introduced here without prior reference (do not use words like "again", or "see above", if it is not previously mentioned). Adjust the text for coherence.

      We agree with the reviewer that the introduction of SA1P in this passage in incoherent. We replaced the sentence in line 260 with: 

      The small set of lipid mediators emerging from all three methods as informative for neuropathy included the sphingolipid sphinganine-1-phosphate (SA1P), also known as dihydrosphingosine-1-phosphate (DH-S1P)…”

      Lines 301-315: Consider relocating several lines from this section to the results section for improved clarity. 

      We moved the lines 309-312 explaining the algorithm selection and their validation success in the corresponding results section (Lipid mediators informative for assigning postpaclitaxel therapy samples to neuropathy).

      Lines 382-396: Move this content to the results section to enhance the organization and coherence of the manuscript. 

      We moved the entire paragraph to the results section of our manuscript to improve coherence. The passage was introduced with the subheading:  “Support of the main results in an independent second patient cohort”.

      References

      (1) Barginear M, Dueck AC, Allred JB, Bunnell C, Cohen HJ, Freedman RA, et al. Age and the Risk of Paclitaxel-Induced Neuropathy in Women with Early-Stage Breast Cancer (Alliance A151411): Results from 1,881 Patients from Cancer and Leukemia Group B (CALGB) 40101. Oncologist. 2019;24(5):617-23.

      (2) Mauri D, Kamposioras K, Tsali L, Bristianou M, Valachis A, Karathanasi I, et al. Overall survival benefit for weekly vs. three-weekly taxanes regimens in advanced breast cancer: A metaanalysis. Cancer Treat Rev. 2010;36(1):69-74.

      (3) Budd GT, Barlow WE, Moore HC, Hobday TJ, Stewart JA, Isaacs C, et al. SWOG S0221: a phase III trial comparing chemotherapy schedules in high-risk early-stage breast cancer. J Clin Oncol. 2015;33(1):58-64.

      (4) Lötsch J, and Ultsch A. Pitfalls of Using Multinomial Regression Analysis to Identify ClassStructure-Relevant Variables in Biomedical Data Sets: Why a Mixture of Experts (MOE) Approach Is Better. BioMedInformatics. 2023;3(4):869-84.

      (5) Kruskal WH, and Wallis WA. Use of Ranks in One-Criterion Variance Analysis. J Am Stat Assoc. 1952;47(260):583-621.

      (6) Kramer R, Bielawski J, Kistner-Griffin E, Othman A, Alecu I, Ernst D, et al. Neurotoxic 1deoxysphingolipids and paclitaxel-induced peripheral neuropathy. FASEB J. 2015;29(11):4461-72.

      (7) Field JJ, Diaz JF, and Miller JH. The binding sites of microtubule-stabilizing agents. Chem Biol. 2013;20(3):301-15.

      (8) Janes K, Little JW, Li C, Bryant L, Chen C, Chen Z, et al. The development and maintenance of paclitaxel-induced neuropathic pain require activation of the sphingosine 1-phosphate receptor subtype 1. J Biol Chem. 2014;289(30):21082-97.

      (9) Chua KC, Xiong C, Ho C, Mushiroda T, Jiang C, Mulkey F, et al. Genomewide Meta-Analysis Validates a Role for S1PR1 in Microtubule Targeting Agent-Induced Sensory Peripheral Neuropathy. Clin Pharmacol Ther. 2020;108(3):625-34.

      (10) Kawakami K, Chiba T, Katagiri N, Saduka M, Abe K, Utsunomiya I, et al. Paclitaxel increases high voltage-dependent calcium channel current in dorsal root ganglion neurons of the rat. J Pharmacol Sci. 2012;120(3):187-95.

      (11) Pittman SK, Gracias NG, Vasko MR, and Fehrenbacher JC. Paclitaxel alters the evoked release of calcitonin gene-related peptide from rat sensory neurons in culture. Exp Neurol. 2013.

      (12) Luo H, Liu HZ, Zhang WW, Matsuda M, Lv N, Chen G, et al. Interleukin-17 Regulates NeuronGlial Communications, Synaptic Transmission, and Neuropathic Pain after Chemotherapy.

      Cell reports. 2019;29(8):2384-97 e5.

      (13) Pease-Raissi SE, Pazyra-Murphy MF, Li Y, Wachter F, Fukuda Y, Fenstermacher SJ, et al. Paclitaxel Reduces Axonal Bclw to Initiate IP3R1-Dependent Axon Degeneration. Neuron. 2017;96(2):373-86 e6.

      (14) Duggett NA, Griffiths LA, and Flatters SJL. Paclitaxel-induced painful neuropathy is associated with changes in mitochondrial bioenergetics, glycolysis, and an energy deficit in dorsal root ganglia neurons. Pain. 2017.

      (15) Li Y, Adamek P, Zhang H, Tatsui CE, Rhines LD, Mrozkova P, et al. The Cancer Chemotherapeutic Paclitaxel Increases Human and Rodent Sensory Neuron Responses to TRPV1 by Activation of TLR4. J Neurosci. 2015;35(39):13487-500.

      (16) Hara T, Chiba T, Abe K, Makabe A, Ikeno S, Kawakami K, et al. Effect of paclitaxel on transient receptor potential vanilloid 1 in rat dorsal root ganglion. Pain. 2013;154(6):882-9.

      (17) Jardin I, Lopez JJ, Diez R, Sanchez-Collado J, Cantonero C, Albarran L, et al. TRPs in Pain Sensation. Front Physiol. 2017;8:392.

      (18) Julius D. TRP Channels and Pain. Annual review of cell and developmental biology.

      2013;29:355-84.

      (19) Kohonen T. Self-Organized Formation of Topologically Correct Feature Maps. Biol Cybern. 1982;43(1):59-69.

      (20) Lötsch J, Lerch F, Djaldetti R, Tegder I, and Ultsch A. Identification of disease-distinct complex biomarker patterns by means of unsupervised machine-learning using an interactive R toolbox (Umatrix). Big Data Analytics. 2018;3(1):5.

      (21) Ultsch A. 2003.

      (22) Lotsch J, Geisslinger G, Heinemann S, Lerch F, Oertel BG, and Ultsch A. Quantitative sensory testing response patterns to capsaicin- and ultraviolet-B-induced local skin hypersensitization in healthy subjects: a machine-learned analysis. Pain. 2018;159(1):11-24.

      (23) Lötsch J, Thrun M, Lerch F, Brunkhorst R, Schiffmann S, Thomas D, et al. Machine-Learned Data Structures of Lipid Marker Serum Concentrations in Multiple Sclerosis Patients Differ from Those in Healthy Subjects. Int J Mol Sci. 2017;18(6).

      (24) Lötsch J, and Ultsch A. Cham: Springer International Publishing; 2014:249-57.

    1. Author response:

      Public Reviews:

      Reviewer #1 (Public Review):

      Summary:

      In this manuscript, Wu et al. introduce a novel approach to reactivate the Muller glia cell cycle in the mouse retina by simultaneously reducing p27Kip1 and increasing cyclin D1 using a single AAV vector. The approach effectively promotes Muller glia proliferation and reprograming without disrupting retinal structure or function. Interestingly, reactivation of the Muller glia cell cycle downregulates IFN pathway, which may contribute to the induced retinal regeneration. The results presented in this manuscript may offer a promising approach for developing Müller glia cell-mediated regenerative therapies for retinal diseases.

      Strengths:

      The data are convincing and supported by appropriate, validated methodology. These results are both technically and scientifically exciting and are likely to appeal to retinal specialists and neuroscientists in general.

      Weaknesses:

      There are some data gaps that need to be addressed.

      (1) Please label the time points of AAV injection, EdU labeling, and harvest in Figure 1B.

      We thank the reviewer for highlighting the lack of clarity in our experimental design. We will label all experiment timelines in the figures where appropriate in the revised version.

      (2) What fraction of Müller cells were transduced by AAV under the experimental conditions?

      We apologize for not clearly conveying the transduction efficiency. The retinal region adjacent to the injection site, typically near the central retina, exhibits a transduction efficiency of nearly 100%. In contrast, the peripheral retina shows a lower transduction efficiency compared to the central region. We will include the quantification of AAV transduction efficiency in the revised manuscript.

      The quantification of Edu+ MG or other markers was conducted in the area with the highest efficiency. 

      (3) It seems unusually rapid for MG proliferation to begin as early as the third day after CCA injection. Can the authors provide evidence for cyclin D1 overexpression and p27 Kip1 knockdown three days after CCA injection?

      In our pilot study, we tested the onset time of GFP expression from AAV-GFAP-GFP following intravitreal injection. We observed GFP expression in MG as early as two days post-infection. These findings will be included in the revised manuscript. Additionally, we plan to perform qPCR or Western blot analysis to confirm cyclin D1 overexpression and p27kip1 knockdown at the onset of Müller glia proliferation, which will also be included in the revised manuscript.

      (4) The authors reported that MG proliferation largely ceased two weeks after CCA treatment. While this is an interesting finding, the explanation that it might be due to the dilution of AAV episomal genome copies in the dividing cells seems far-fetched.

      We believe that the lack of durability in high Cyclin D1 and low p27kip1 levels in MG contributes to the cessation of their proliferation. A potential reason for the loss of high Cyclin D1 overexpression and p27kip1 knockdown during MG proliferation could be the dilution of the AAV episomal genome. However, testing this hypothesis is challenging. Instead, we plan to provide direct evidence in the revised manuscript by examining the levels of Cyclin D1 and p27kip1 in the retina treated with CCA before and after the peak of MG proliferation.

      Reviewer #2 (Public Review):

      This manuscript by Wu, Liao et al. reports that simultaneous knockdown of P27Kip1 with overexpression of Cyclin D can stimulate Muller glia to re-enter the cell cycle in the mouse retina. There is intense interest in reprogramming mammalian muller glia into a source for neurogenic progenitors, in the hopes that these cells could be a source for neuronal replacement in neurodegenerative diseases. Previous work in the field has shown ways in which mouse Muller glia can be neurogenically reprogrammed and these studies have shown cell cycle re-entry prior to neurogenesis. In other works, typically, the extent of glial proliferation is limited, and the authors of this study highlight the importance of stimulating large numbers of Muller glia to re-enter the cell cycle with the hopes they will differentiate into neurons. While the evidence for stimulating proliferation in this study is convincing, the evidence for neurogenesis in this study is not convincing or robust, suggesting that stimulating cell cycle-reentry may not be associated with increasing regeneration without another proneural stimulus.

      Below are concerns and suggestions.

      Intro:

      (1) The authors cite past studies showing "direct conversion" of MG into neurons. However, these studies (PMID: 34686336; 36417510) show EdU+ MG-derived neurons suggesting cell cycle re-entry does occur in these strategies of proneural TF overexpression.

      We thank the reviewer for pointing this out. We will revise the statement to "MG neurogenesis," which encompasses both direct conversion and Müller glia proliferation followed by neuronal differentiation.

      (2) Multiple citations are incorrectly listed, using the authors first name only (i.e. Yumi, et al; Levi, et al;). Studies are also incompletely referenced in the references.

      We apologize for the mistake with the reference. We will fix these mistakes in the revised version.

      Figure 1:

      (3) When are these experiments ending? On Figure 1B it says "analysis" on the end of the paradigm without an actual day associated with this. This is the case for many later figures too. The authors should update the paradigms to accurately reflect experimental end points.

      We thank the reviewer for highlighting the lack of clarity in our experimental design. We will label all experiment timelines in the figures where appropriate in the revised version.

      (4) Are there better representative pictures between P27kd and CyclinD OE, the EdU+ counts say there is a 3 fold increase between Figure 1D&E, however the pictures do not reflect this. In fact, most of the Edu+ cells in Figure 1E don't seem to be Sox9+ MG but rather horizontally oriented nuclei in the OPL that are likely microglia.

      Thanks to the reviewer for pointing this out. We will replace the image of Cyclin D1 which a better representative image.

      (5) Is the infection efficacy of these viruses different between different combinations (i.e. CyclinD OE vs. P27kd vs. control vs. CCA combo)? As the counts are shown in Figure 1G only Sox9+/Edu+ cells are shown not divided by virus efficacy. If these are absolute counts blind to where the virus is and how many cells the virus hits, if the virus efficacy varies in efficiency this could drive absolute differences that aren't actually biological.

      Because the AAV-GFAP-Cyclin D1 and AAV-GFAP-Cyclin D1-p27kip1 shRNA viruses do not carry a fluorescent reporter gene, we cannot easily measure viral efficacy in the same experiment. We believe that variations in viral efficacy cannot account for the significant differences in MG proliferation for two reasons: 1) We injected the same titer for all three viruses, and 2) Viral infection efficacy is very high, approaching 100% in the central retina. Nonetheless, to rule out the possibility that the differences in MG proliferation among the Cyclin D overexpression, p27kip1 knockdown, and CCA groups are due to variations in viral efficacy, we will include the p27kip1 knockdown and Cyclin D1 overexpression efficiencies for all four groups using qPCR and/or Western blot analysis in the revised manuscript.

      (6) According to the Jax laboratories, mice aren't considered aged until they are over 18months old. While it is interesting that CCA treatment does not seem to lose efficacy over maturation I would rephrase the findings as the experiment does not test this virus in aged retinas.

      Thank you to the reviewer for bringing this to our attention. We will void using “aged mice” in our revised manuscript.

      (7) Supplemental Figure 2c-d. These viruses do not hit 100% of MG, however 100% of the P27Kip staining is gone in the P27sh1 treatment, even the P27+ cell in the GCL that is likely an astrocyte has no staining in the shRNA 1 picture. Why is this?

      For Supplementary Figure 2c-d, we focused on the central area where knockdown efficiency was high, approaching 100%. We will replace this image with one that includes both high and low Müller glia transduction efficiency regions, clearly demonstrating the complete loss of p27kip1 staining in the area of high transduction efficiency.

      Figure 2

      (8) Would you expect cells to go through two rounds of cell cycle in such a short time? The treatment of giving Edu then BrdU 24 hours later would have to catch a cell going through two rounds of division in a very short amount of time. Again the end point should be added graphically to this figure.

      We thank the reviewer for raising this important point. While the typical cell cycle time for human cells is approximately 24 hours, we hypothesized that 24 hours would be the most likely timepoint to capture cells continuously progressing through the cell cycle. However, we acknowledge that we cannot exclude the possibility of some cells entering a second cell cycle at much later timepoints.

      In the revised manuscript, we will carefully qualify our conclusion to state that the majority of MG do not immediately undergo another cell division, rather than making a definitive statement. This more cautious phrasing will better reflect the limitations of the 24-hour timepoint and allow for the potential of a small subset of cells proceeding through additional rounds of division at later stages.

      Figure 3

      (9) I am confused by the mixing of ratios of viruses to indicate infection success. I know mixtures of viruses containing CCA or control GFP or a control LacZ was injected. Was the idea to probe for GFP or LacZ in the single cell data to see which cells were infected but not treated? This is not shown anywhere?

      The virus infection was not uniform across the entire retina. To mark the infection hotspots, we added 10% GFP virus to the mixture. Regions of the retina with low infection efficiency were removed by dissection and excluded from the scRNA-seq analysis. We apologize for not clearly explaining this methodological detail in the original text, and will update the Methods section accordingly.

      (10) The majority of glia sorted from TdTomato are probably not infected with virus. Can you subset cells that were infected only for analysis? Otherwise it makes it very hard to make population judgements like Figure 3E-H if a large portion are basically WT glia.

      This question is related to the last one. Since the regions with high virus infection efficiency were selectively dissected and isolated for analysis, the percentage of CCA-infected MG should constitute the majority in the scRNA-seq data.

      (11) Figure 3C you can see Rho is expressed everywhere which is common in studies like this because the ambient RNA is so high. This makes it very hard to talk about "Rod-like" MG as this is probably an artifact from the technique. Most all scRNA-seq studies from MG-reprogramming have shown clusters of "rods" with MG hybrid gene expression and these had in the past just been considered an artifact.

      We agree that the low levels of Rho in other MG clusters (such as quiescent, reactivated, and proliferating MG) are likely due to RNA contamination. However, the level of Rho in the rod-like MG is significantly higher than in the other clusters, indicating that this is unlikely to be solely due to contamination.

      As shown in Supplementary Figure 7A-C, a cluster of MG-rod hybrid cells (cluster C4) was present in all three experimental groups at similar ratios, and this hybrid cluster was excluded from further analysis. In contrast, the rod-like Müller glia (cluster C3) were predominantly found in the CCA and CCANT groups, suggesting a genuine response to CCA treatment.

      Furthermore, we will conduct Rho and Gnat1 RNA in situ hybridization on the dissociated retinal cells to further support the conclusion that rod-specific genes are upregulated in a subset of MG in the revised manuscript.

      (12) It is mentioned the "glial" signature is downregulated in response to CCA treatment. Where is this shown convincingly? Figure H has a feature plot of Glul , which is not clear it is changed between treatments. Otherwise MG genes are shown as a function of cluster not treatment.

      We will add box plots of several MG-specific genes to better illustrate the downregulation of the glial signature in the relevant cell cluster in the revised manuscript.

      Figure 4

      (13) The authors should be commended for being very careful in their interpretations. They employ the proper controls (Er-Cre lineage tracing/EdU-pulse chasing/scRNA-seq omics) and were very careful to attempt to see MG-derived rods. This makes the conclusion from the FISH perplexing. The few puncta dots of Rho and GNAT in MG are not convincing to this reviewer, Rho and GNAT dots are dense everywhere throughout the ONL and if you drew any random circle in the ONL it would be full of dots. The rigor of these counts also comes into question because some dots are picked up in MG in the INL even in the control case. This is confusing because baseline healthy MG do not express RNA-transcripts of these Rod genes so what is this picking up? Taken together, the conclusion that there are Rod-like MG are based off scRNA-seq data (which is likely ambient contamination) and these FISH images. I don't think this data warrants the conclusion that MG upregulate Rod genes in response to CCA.

      We performed RNA in situ hybridization on retinal sections because we aimed to correlate cell localization with rod gene expression. We understand the reviewer’s concern that the punctate signals of Rho and GNAT1 in the ONL MG may actually originate from neighboring rods. In the revised manuscript, we will conduct RNAscope on dissociated retinal cells to avoid this issue.

      Figure 5

      (14) Similar point to above but this Glul probe seems odd, why is it throughout the ONL but completely dark through the IPL, this should also be in astrocytes can you see it in the GCL? These retinas look cropped at the INL where below is completely black. The whole retinal section should be shown. Antibodies exist to GS that work in mouse along with many other MG genes, IHC or western blots could be done to better serve this point.

      Indeed, the GCL was cropped out in Figure 5 A-B. We have other images with all retinal layers, which we will use in the revised manuscript. Additionally, we will perform the GS antibody staining to demonstrate partial MG dedifferentiation following CCA treatment.

      Figure 6

      (15) Figure 6D is not a co-labeled OTX2+/ TdTomato+ cell, Otx2 will fill out the whole nucleus as can be seen with examples from other MG-reprogramming papers in the field (Hoang, et al. 2020; Todd, et al. 2020; Palazzo, et al. 2022). You can clearly see in the example in Figure 6D the nucleus extending way beyond Otx2 expression as it is probably overlapping in space. Other examples should be shown, however, considering less than 1% of cells were putatively Otx2+, the safer interpretation is that these cells are not differentiating into neurons. At least 99.5% are not.

      We have additional examples of Otx2+ Tdt+ Edu+ cells, which suggest that MG neurogenesis to Otx2+ cells does occur, despite the low efficiency. We will include these images in the revised manuscript.

      (16) Same as above Figure 6I is not convincingly co-labeled HuC/D is an RNA-binding protein and unfortunately is not always the clearest stain but this looks like background haze in the INL overlapping. Other amacrine markers could be tested, but again due to the very low numbers, I think no neurogenesis is occurring.

      We have additional examples of HuC/D+ Tdt+ Edu+ cells, which we will show in the revised manuscript.

      (17) In the text the authors are accidently referring to Figure 6 as Figure 7.

      We thank the reviewer for pointing out the mistake. We will correct the mistake in the revised manuscript.

      Figure 7

      (18) I like this figure and the concept that you can have additional MG proliferating without destroying the retina or compromising vision. This is reminiscent of the chick MG reprogramming studies in which MG proliferate in large numbers and often do not differentiate into neurons yet still persist de-laminated for long time points.

      General:

      (19) The title should be changed, as I don't believe there is any convincing evidence of regeneration of neurons. Understanding the barriers to MG cell-cycle re-entry are important and I believe the authors did a good job in that respect, however it is an oversell to report regeneration of neurons from this data.

      We thank the reviewer for the suggestion. We will consider changing the title in the revised manuscript.

      (20) This paper uses multiple mouse lines and it is often confusing when the text and figures switch between models. I think it would be helpful to readers if the mouse strain was added to graphical paradigms in each figure when a different mouse line is employed.

      We will label the mouse lines used in each experiment in the figures where appropriate.

    1. Author response:

      The following is the authors’ response to the original reviews.

      Reviewer #1 (Public Review):

      Summary:

      In this manuscript the authors re-examine the developmental origin of cortical oligodendrocyte (OL) lineage cells using a combination of strategies, focussing on the question of whether the LGE generates cortical OL cells. The paper is interesting to myelin biologists, the methods used are appropriate and, in general, the study is well-executed, thorough, and persuasive, but not 100% convincing.

      Thank you very much for approving our paper.

      Strengths, weaknesses, and recommendations:

      The first evidence presented that the LGE does not generate OLs for the cortex is that there are no OL precursors 'streaming' from the LGE during embryogenesis, unlike the MGE (Figure 1A). This in itself is not strong evidence, as they might be more dispersed. In fact, in the images shown, there is no obvious 'streaming' from the MGE either. Note that in Figure 1 there is no reference to the star that is shown in the figure.

      We totally agree with you. While OPC migration stream is not strong evidence to support that the LGE does not generate OPCs for the cortex, when considering our additional evidence, the absence of obvious 'streaming' from LGE to cortex provided supplementary support for this conclusion. Finally, we have removed the star in the figure.

      The authors then electroporate a reporter into the LGE at E13.5 and examine the fate of the electroporated cells (Figures 1C-E). They find that electroporated cells became neurons in the striatum and in the cortex but no OLs for the cortex. There are two issues with this: first, there is no quantification, which means there might indeed be a small contribution from the LGE that is not immediately obvious from snapshot images. Second, it is unexpected to find labelled neurons in the cortex at all since the LGE does not normally generate neurons for the cortex. Electroporations are quite crude experiments as targeting is imprecise and variable and not always discernible at later stages. For example, in Figure 1D, one can see tdTOM+ cells near the AEP, as well as the striatum. Hence, IUE cannot on its own be taken as proof that there is no contribution of the LGE to the cortical OL population.

      Thank you for your constructive suggestions.

      (1) Following the reviewer's suggestion, we have added these statistics, please see Figure 1F.

      (2) The reviewer raised a good point. We occasionally found a very small number of electroporated cells in the MGE/AEP VZ in our IUE system. Therefore, we can identify these electroporated cells in the cortex, most of them expressed the neuronal marker NeuN. We suspect these are MGE-derived cortical interneurons. It's worth noting that these electroporated cells (MGE-derived) are not glia cells. The probable reason may be that MGE/AEP generate cortical OPCs mainly before E13.5 (in this study we performed IUE at E13.5).

      The authors then use an alternative fate-mapping approach, again with E13.5 electroporations (Figure 2). They find only a few GFP+ cells in the cortex at E18 (Figures 2C-D) and P10 (Figure 2E) and these are mainly neurons, not OL lineage cells. Again, there is no quantification.

      Thank you very much for your suggestions. Actually, in this fate-mapping approach, the electroporated cells in the cortex is very few. We analyzed four mice, and found that all GFP positive cells (139 GFP+) did not express OLIG2, SOX10 and PDGFRA.

      Figure 3 is more convincing, but the experiments are incomplete. Here the authors generate triple-transgenic mice expressing Cre in the cortex (Emx1-Cre) and the MGE (Nkx2.1-Cre) as well as a strong nuclear reporter (H2B-GFP). They find that at P0 and P10, 97-98% of OL-lineage cells (SOX10+ or PDGFRA+) in the cortex are labelled with GFP (Figure 3). This is a more convincing argument that the LGE/CGE might not contribute significant numbers of OL lineage cells to the cortex, in contrast to the Kessaris et at. (2006) paper, which showed that Gsh2-Cre mice label ~50% of SOX10+ve cells in the motor cortex at P10. The authors of the present paper suggest that the discrepancy between their study and that of Kessaris et al. (2006) is based on the authors' previous observation (Zhang et al 2020) (https://doi.org/10.1016/j.celrep.2020.03.027) that GSH2 is expressed in intermediate precursors of the cortex from E18 onwards. If correct, then Kessaris et al. might have mistakenly attributed Gsh2-Cre+ lineages to the LGE/CGE when they were in fact intrinsic to the cortex. However, the evidence from Zhang et al 2020 that GSH2 is expressed by cortical intermediate precursors seems to rest solely on their location within the developing cortex; a more convincing demonstration would be to show that the GSH2+ putative cortical precursors co-label for EMX1 (by immunohistochemistry or in situ hybridization), or that they co-label with a reporter in Emx1-driven reporter mice. This demonstration should be simple for the authors as they have all the necessary reagents to hand. Without these additional data, the assertion that GSX2+ve cells in the cortex are derived from the cortical VZ relies partly on an act of faith on the part of the reader. Note that Tripathi et al. (2011, "Dorsally- and ventrally-derived oligodendrocytes have similar electrical properties but myelinate preferred tracts." J. Neurosci. 31, 6809-6819) found that the Gsh-Cre+ OL lineage contributed only ~20% of OLs to the mature cortex, not ~50% as reported by Kessaris et al. (2006). If it is correct that these Gsh2-derived OLs are from the cortical anlagen as the current paper claims, then it would raise the possibility that the ventricular precursors of GSH2+ intermediate progenitors are not uniformly distributed through the cortical VZ but are perhaps localized to some part of it. Then the contribution of Gsh2-derived OLs to the cortical population could depend on precisely where one looks relative to that localized source. It would be a nice addition to the current manuscript if the authors could explore the distribution of their GSH2+ intermediate precursors throughout the developing cortex. In any case, Tripathi et al. (2011) should be cited.

      Thank you for your constructive suggestions.

      (1) We used the Emx1Cre; RosaH2B-GFP mouse and found that nearly all GSX2+ cells in the cortical SVZ are derived from the Emx1+ lineage at P0 (Please see our new Figure 3-supplement 1A-C). 

      (2) According to your suggestion, we have cited this paper (Tripathi et al.) in our revised manuscript.

      (3) The study conducted by Kessaris et al. (2006) revealed that roughly 50% of cortical oligodendrocytes (OLs) originate from the Gsx2 lineage (LGE/CGE-derived). In contrast, Tripathi et al. (2011) observed that Gsx2-derived OLs contribute only around 20% to the corpus callosum (CC). To investigate the reasons behind these disparate findings, we conducted three experiments. Firstly, using Emx1Cre; RosaH2B-GFP mice, we found that approximately 89% of lateral CC (LCC) OLs originate from the Emx1 lineage, with only around 11% derived from the ventral source (refer to Author response image 1A and B below). Secondly, employing Nkx2-1Cre; RosaH2B-GFP mice, we determined that approximately 11% of LCC OLs originate from the Nkx2.1 lineage (refer to pictures C and D below). Finally, we found that approximately 98.3% of lateral LCC OLs originate from both Emx1 and Nkx2.1 lineages, with only around 1.7% possibly derived from the LGE (see Author response image 1E and F below). Taken together, our results indicate that approximately 89% of LCC OLs originate from the Emx1 lineage, while 11% of LCC OLs are derived from the medial ganglionic eminence (MGE).

      It is worth noting that OLs from Emx1 and Nkx2.1 lineages were equally distributed in the medial CC (mCC) (see Author response image 1G below). This finding suggests that MGE-derived OLs exhibit spatial heterogeneity in their distribution within the CC. These results provide evidence that the contribution of the lateral ganglionic eminence (LGE) and caudal ganglionic eminence (CGE) to CC OLs is minimal.

      Author response image 1.

      Finally, the authors deleted Olig2 in the MGE and found a dramatic reduction of PDGFRA+ and SOX10+ cells in the cortex at E14 and E16 (Figure 4A-F). This further supports their conclusion that, at least at E16, there is no significant contribution of OLs from ventral sources other than the MGE/AEP. This does not exclude the possibility that the LGE/CGE generates OLs for the cortex at later stages. Hence, on its own, this is not completely convincing evidence that the LGE generates no OL lineage cells for the cortex.

      There are three reasons why we didn't analyze Olig2-NCKO mice after E16.5. 1. The expression of Nkx2.1Cre is lower within the dorsal-most region of the MGE than other Nkx2.1-expressing regions. Even at E15.5, we can still find a small number of OPCs in the lateral cortex. We speculate that these OPCs are derived from dorsal MGE. 2. Considering the possibility of incomplete recombination in Olig2 gene locus, we guess OPCs (Olig2+) in the lateral cortex are derived from MGE. Indeed, we found a few OPCs in the MGE/AEP in the Olig2-NCKO mice (Figure 4F). 3. The recent study (bioRxiv preprint doi: https://doi.org/10.1101/2024.01.23.576886) showed that the contribution of LGE/CGE to cortical OPCs is minimal, which further supporting our findings. Taken together, our results provide additional evidence supporting the limited contribution of the LGE/CGE to cortical OPCs (OLs).

      Reviewer #2 (Public Review):

      Traditional thinking has been that cortical oligodendrocyte progenitor cells (OPCs) arise in the development of the brain from the medial ganglionic eminence (MGE), lateral/caudal ganglionic eminence (LGE/CGE), and cortical radial glial cells (RGCs). Indeed a landmark study demonstrated some time ago that cortical OPCs are generated in three waves, starting with a ventral wave derived from the medial ganglionic eminence (MGE) or the anterior entopeduncular area (AEP) at embryonic day E12.5 (Nkx2.1+ lineage), followed by a second wave of cortical OLs derived from the lateral/caudal ganglionic eminences (LGE/CGE) at E15.5 (Gsx2+/Nkx2.1- lineage), and then a final wave occurring at P0, when OPCs originate from cortical glial progenitor cells (Emx1+ lineage). However, the authors challenge the idea in this paper that cortical progenitors are produced from the LGE. They have found previously that cortical glial progenitor cells were also found to express Gsx2, suggesting this may not have been the best marker for LGE-derived OPCs. They have used fate mapping experiments and lineage analyses to suggest that cortical OPCs do not derive from the LGE.

      Strengths:

      (1) The data is high quality and very well presented, and experiments are thoughtful and elegant to address the questions being raised.

      (2) The authors use two elegant approaches to lineage trace LGE derived cells, namely fate mapping of LGE-derived OPCs by combining IUE (intrauterine electroporation) with a Cre recombinase-dependent IS reporter, and Lineage tracing of LGE-derived OPCs by combining IUE with the PiggyBac transposon system. Both approaches show convincingly that labelled LGE-derived cells that enter the cortex do not express OPC markers, but that those co-labelling with oligodendrocyte markers remain in the striatum.

      (3) The authors then use further approaches to confirm their findings. Firstly they lineage trace Emx1-Cre; Nkx2.1-Cre; H2B-GFP mice. Emx1-Cre is expressed in cortical RGCs and Nkx2.1-Cre is specifically expressed in MGE/AEP RGCs. They find that close to 98% of OPCs in the cortex co-label with GFP at later times, suggesting the contribution of OPCs from LGE is minimal.

      (4) They use one further approach to strengthen the findings yet further. They cross Nkx2.1-Cre mice with Olig2 F/+ mice to eliminate Olig2 expression in the SVZ/VZ of the MGE/AEP (Figures 4A-B). The generation of MGE/AEP-derived OPCs is inhibited in these Olig2-NCKO conditional mice. They find that the number of cortical progenitors at E16.5 is reduced 10-fold in these mice, suggesting that LGE contribution to cortical OPCs is minimal.

      We thank the reviewer for summarizing the strengths of our manuscript.

      Weaknesses:

      (1) The authors use IUE in experiments mentioned in point 2 of 'Strengths' above (Figures 1 and 2) and claim that the reporter was delivered specifically into LGE VZ at E13.5 using this IUE. It would be nice to see some sort of time course of delivery after IUE to show the reporter is limited to LGE VZ at early times post-IUE.

      Thank you very much for your suggestions. Indeed, when using IUE in our system, we occasionally found a small number of electroporated cells in the MGE/AEP VZ. Thus, we can find very few electroporated cells (MGE/AEP-derived) in the cortex and these electroporated cells are neuron (perhaps interneuron).

      (2) In the experiments mentioned in point 3 of 'Strengths' (Figure 3), statistical analysis showed that only approximately 2% of OPCs were GFP-negative cells. This 2% could possibly be derived from the LGE/CGE so does not totally rule out that LGE contributes some cortical OPCs.

      Thank you for your constructive suggestions. We apologize for any imprecise descriptions. Despite we suspect that this 2% may originate from MGE {Considering the possibility of incomplete recombination in Olig2 gene locus, we guess the OPCs (Olig2+) may be derived from MGE. Indeed, we found a few OPCs in the MGE/AEP in the Olig2-NCKO mice (Figure 4F)} or from the dMGE (The expression of Nkx2.1Cre is lower within the dorsal-most region of the MGE than in other Nkx2.1-expressing regions). Anyway, we have softened the assertion everywhere in our revised manuscript.

      (3) In the experiments mentioned in point 4 of 'Strengths' (Figure 4), they do still find cortical OPCs at E16.5 in the Olig2-NCKO conditional mice. It is unclear whether this is due to the recombination efficiency of the CRE enzyme not being 100%, or whether there is some LGE contribution to the cortical OPCs.

      This experiment alone may not provide strong evidence to support that LGE do not contribute to the cortical OPCs during development. However, when combing our other results with this result, we can confirm that the contribution of LGE to cortical OPCs is minimal. Furthermore, a recent study reported that LGE/CGE-derived OLs make minimum contributions to the neocortex and corpus callosum,which further supporting the reliability of our conclusion.

      We would like to thank the reviewers and editors for their valuable comments and suggestions again.

      Impact of Study:

      The authors show elegantly and convincingly that the contribution of the LGE to the pool of cortical OPCs is minimal. The title should perhaps be that the LGE contribution is minimal rather than no contribution at all, as they are not able to rule out some small contribution from the LGE. These findings challenge the traditional belief that the LGE contributes to the pool of cortical OPCs. The authors do show that the LGE does produce OPCs, but that they tend to remain in the striatum rather than migrate into the cortex. It is interesting to wonder why their migration patterns may be different from the MGE-derived OPCs which migrate to the cortex. The functional significance of these different sources of OPCs for adult cortex in homeostatic or disease states remains unclear though.

      Recommendations for the authors:

      Reviewer #1 (Recommendations for The Authors):

      (1) Change the title to e.g. 'limited contribution of the LGE to cortical oligodendrocytes'. Alternatively, It might be more useful to highlight where they come from, e.g. "Cortical oligodendrocytes originate predominantly or exclusively from the MGE and cortical VZ"

      As suggested, we have changed the old title to the following: The lateral/caudal ganglionic eminence makes a limited contribution to cortical oligodendrocytes

      (2) Demonstrate using lineage tracing that GSH2+ cells in the cortex are derived from the Emx1-lineage, e.g. using immunohistochemistry for GSX2 and a reporter in Emx1-Cre mice crossed to a reporter.

      In our revised manuscript, we have added a new figure (Figure 3-supplement 1A-C) to demonstrate that the GSX2+ cells in the cortex are derived from the Emx1-lineage.

      (3) Make it clear in their discussion that they have not explored the CGE so it is possible that this region generates some OLs.

      The Emx1Cre; Nkx2.1Cre; H2B-GFP mice showed that only ~2% cortical OLs are derived from LGE/CGE. Actually, considering the efficiency of Cre enzyme recombination and the relatively low Cre activity in the dMGE of Nkx2.1Cre, the actual contribution of LGE/CGE-derived cortical OLs could be even lower than our current observation. Therefore, our results demonstrate that the LGE/CGE generate very few,possibly even no,OLs for the cortex.

      (4) Soften the assertion that the LGE does not generate any OL lineage cells that reach the cortex by e.g. changing the word 'sole' to 'predominant' (line 88) and, elsewhere in the paper, leaving open the possibility that small numbers of LGE-derived OLs might enter the cortex, depending on where exactly one looks.

      As suggested, we have softened the assertion everywhere in our manuscript.

      (5) Lines 255-260: 'First, the time window during which the MGE generates OLs is very brief, perhaps occurring before MGE neurogenesis. The high level of SHH in the MGE allows for the production of a small population of cortical OPCs around E12.5. Subsequently, multipotent intermediate progenitors begin to express DLX transcription factors resulting in ending the generation of OPCs in the MGE'. What is the evidence that OL genesis precedes neurogenesis? If there is none (as I suspect) then this statement should be removed.

      The editors raised a good point. We have no strong evidence to support that OL genesis precedes neurogenesis in MGE, thus, we removed these sentences in our manuscript.

      (6) Figure 1E should show quantification of cells as a % of electroporated cells and as a % of PDGFRA+ or OLIG2+ or SOX10+ cells, so that the reader might have a clear view of the extent of labelling.

      Done.

      (7) Figure 4: This is interesting but incomplete. At E14.5 the authors show the presence of PDGFRA+cells in the telencephalon. However, at E16.5 they show images only of the dorsal-most region of the cortex. If the LGE/CGE begins to generate OLPs for the early cortex, they would be expected to appear near the cortico-striatal boundary, as shown in Kessaris 2006 Fig1g-h. In the current manuscript, the authors do not show these regions, or the LGE and CGE, in their images. It is essential to show PDGFRA immunolabelling at the cortico-striatal boundary and also in the LGE and CGE at E16.5 in control and Olig2 mutant mice. It is also necessary to extend this analysis to E18.5, perhaps showing PDGFRA+ cells streaming from the cortical VZ/SVZ.

      There are three reasons why we didn't analyze Olig2-NCKO mice after E16.5. 1.Frankly, the expression of Nkx2.1Cre is lower within the dorsal-most region of the MGE than other Nkx2.1-expressing regions. Even at E15.5, we can still find a small number of OPCs in the lateral cortex. We guess these OPCs are derived from dMGE. 2. Considering the possibility of incomplete recombination in Olig2 gene locus, we guess OPCs (Olig2+) are derived from MGE. In fact, we found a few OPCs in the MGE/AEP in the Olig2-NCKO mice (Figure 4F). 3. The recent study (bioRxiv preprint doi: https://doi.org/10.1101/2024.01.23.576886) showed that the contribution of LGE/CGE to cortical OPCs is minimal. Taken together, our results provide additional evidence supporting the limited contribution of the LGE/CGE to cortical OPCs (OLs).

      (8) Cite Tripathi et al. (2011) and mention the disparity between the findings of that paper and Kessaris et al. (2006) and possible reasons - see main review above.

      Done.

    1. Author response:

      The following is the authors’ response to the previous reviews.

      eLife assessment

      Shore et al. report important effects of a heterozygous mutation in the KCNT1 potassium channel on ion currents and firing behavior of excitatory and inhibitory neurons in the cortex of KCNT1-Y777H mice. The authors provide solid evidence of physiological differences between this heterozygous mutation and their previous work with homozygotes. The reviewers appreciated the inclusion of recordings in ex vivo slices and dissociated cortical neurons, as well as the additional evidence showing an increase in persistent sodium currents (INaP) in parvalbumin-positive interneurons in heterozygotes. However, they were unclear regarding the likelihood of the increased sodium influx through INaP channels increasing sodium-activated potassium currents in these neurons.

      Regarding the last sentence of the eLife assessment, we’ve added a new paragraph to the Discussion section of the paper to address this concern. Please see the response to comment 1B of Reviewer #1 below for more details. We feel that the question of whether an increase in INaP would further increase KCNT1 activity is a valid discussion point but not a limitation of the importance or rigor of the work itself.

      Public Reviews:

      Reviewer #1 (Public Review):

      Summary:

      This manuscript reports the effects of a heterozygous mutation in the KCNT1 potassium channels on the properties of ion currents and firing behavior of excitatory and inhibitory neurons in the cortex of mice expressing KCNT1-Y777H. In humans, this mutation as well as multiple other heterozygotic mutations produce very severe early-onset seizures and produce a major disruption of all intellectual function. In contrast, in mice, this heterozygous mutation appears to have no behavioral phenotype or any increased propensity to seizures. A relevant phenotype is, however, evident in mice with the homozygous mutation, and the authors have previously published the results of similar experiments with the homozygotes. As perhaps expected, the neuronal effects of the heterozygous mutation presented in this manuscript are generally similar but markedly smaller than the previously published findings on homozygotes. There are, however, some interesting differences, particularly on PV+ interneurons, which appear to be more excitable than wild type in the heterozygotes but more excitable in the heterozygotes. This raises the interesting question, which has been explicitly discussed by the authors in the revised manuscript, as to whether the reported changes represent homeostatic events that suppress the seizure phenotype in the mouse heterozygotes or simply changes in excitability that do not reach the threshold for behavioral outcomes.

      Strengths and Weaknesses:

      (1) The authors find that the heterozygous mutation in PV+ interneurons increases their excitability, a result that is opposite from their previous observation in neurons with the corresponding homozygous mutation. They propose that this results from the selective upregulation of a persistent sodium current INaP in the PV+ interneurons. These observations are very interesting ones, and they raised some issues in the original submission:

      A) The protocol for measuring the INaP current could potentially lead to results that could be (mis)interpreted in different ways in different cells. First, neither K currents nor Ca currents are blocked in these experiments. Instead, TTX is applied to the cells relatively rapidly (within 1 second) and the ramp protocol is applied immediately thereafter. It is stated that, at this time, Na currents and INaP are fully blocked but that any effects on Na-activated K currents are minimal. In theory this would allow the pre- to post- difference current to represent a relatively uncontaminated INaP. This would, however, only work if activation of KNa currents following Na entry is very slow, taking many seconds. A good deal of literature has suggested that the kinetics of activation of KNa currents by Na influx vary substantially between cell types, such that single action potentials and single excitatory synaptic events rapidly evoke KNa currents in some cell types. This is, of course, much faster than the time of TTX application. Most importantly, the kinetics of KNa activation may be different in different neuronal types, which would lead to errors that could produce different estimates of INaP in PV+ interneurons vs other cell types.

      In their revised manuscript, the authors have provided good data demonstrating that, at least for the PV and SST neurons, loss of KNa currents after TTX application is slow relative to the time course of loss of INaP, justifying the use of this protocol for these neuronal types.

      B) As the authors recognize, INaP current provides a major source of cytoplasmic sodium ions for the activation. An expected outcome of increased INaP is, therefore, further activation of KNa currents, rather than a compensatory increase in an inward current that counteracts the increase in KNa currents, as is suggested in the discussion.

      The authors comment in the rebuttal that, despite the fact that sodium entry through INaP is known to activate KNa channels, an increase in INaP does not necessarily imply increased KNa current. This issue should be addressed directly somewhere in the text, perhaps most appropriately in the discussion.

      We’ve added the following new paragraph to the Discussion section of the manuscript to address this concern:

      “As the persistent sodium current has been shown to act as a source of cytoplasmic sodium ions for KCNT1 channel activation in some neuron types (Hage & Salkoff, 2012), one might expect that the compensatory increase in INaP in YH-HET PV neurons would further increase, rather than counteract, KNa currents. Unfortunately, there is insufficient information on the relative locations of the INaP and KCNT1 channels, as well as the kinetics of sodium transfer to KCNT1 channels, among cortical neuron subtypes, and even less is known in the context of KCNT1 GOF neurons; thus, it is difficult to predict how alterations in one of these currents may affect the other. One plausible reason that increased INaP would not alter KNa currents in YH-HET PV neurons is that the particular sodium channels that are responsible for the increased INaP are not located within close proximity to the KCNT1 channels. Moreover, homeostatic mechanisms that modify the length and/or location of the sodium channel-enriched axon initial segment (AIS) in neurons in response to altered excitability are well described (Grubb & Burrone, 2010; Kuba et al., 2010); thus, it is possible that in YH-HET PV neurons, the length or location of the AIS is altered, leading to uncoupling of the sodium channels that are responsible for the increased INaP to the KCNT1 channels. Future studies will aim to further investigate potential mechanisms of neuron-type-specific alterations in NaP and KNa currents downstream of KCNT1 GOF.”  

      C) The numerical simulations, in general, provide a very useful way to evaluate the significance of experimental findings. Nevertheless, while the in-silico modeling suggests that increases in INaP can increase firing rate in models of PV+ neurons, there is as yet insufficient information on the relative locations of the INaP channels and the kinetics of sodium transfer to KNa channels to evaluate the validity of this specific model.

      The authors have now put in all of the appropriate caveats on this very nicely in the revised manuscript.

      (2) The effects of the KCNT1 channel blocker VU170 on potassium currents are somewhat larger and different from those of TTX, suggesting that additional sources of sodium may contribute to activating KCNT1, as suggested by the authors. Because VU170 is, however, a novel pharmacological agent, it may be appropriate to make more careful statements on this. While the original published description of this compound reported no effect on a variety of other channels, there are many that were not tested, including Na and cation channels that are known to activate KCNT1, raising the possibility of off-target effects.

      In the revised version, the authors have added more to the manuscript on this issue and have added a very clear discussion of this to the text (in the discussion section).

      This is a very clear and thorough piece of work, and the authors are to be congratulated on this. My one remaining suggestion would be to make an explicit statement about whether increased sodium influx through INaP channels, which is thought to activate KNa channels, would be likely to increase KNa current in these neurons (see comment 1B).

      Please see response to comment 1B.

      Reviewer #2 (Public Review):

      Summary:

      In this manuscript, Shore et al. investigate the consequent changes in excitability and synaptic efficacy of diverse neuronal populations in an animal model of juvenile epilepsy. Using electrophysiological patch-clamp recordings from dissociated neuronal cultures, the authors find diverging changes in two major populations of inhibitory cell types, namely somatostatin (SST)- and parvalbumin (PV)-positive interneurons, in mice expressing a variant of the KCNT1 potassium channel. They further suggest that the differential effects are due to a compensatory increase in the persistent sodium current in PV interneurons in pharmacological and in silico experiments. It remains unclear why this current is selectively enhanced in PV-interneurons.

      Strengths:

      (1) Heterozygous KCNT1 gain of function variant was used which more accurately models the human disorder.

      (2) The manuscript is clearly written, and the flow is easy to follow. The authors explicitly state the similarities and differences between the current findings and the previously published results in the homozygous KCNT1 gain of function variant.

      (3) This study uses a variety of approaches including patch clamp recording, in silico modeling and pharmacology that together make the claims stronger.

      (4) Pharmacological experiments are fraught with off-target effects and thus it bolsters the authors' claims when multiple channel blockers (TTX and VU170) are used to reconstruct the sodium-activated potassium current.

      Weaknesses:

      (1) This study mostly relies on recordings in dissociated cortical neurons. Although specific WT interneurons showed intrinsic membrane properties like those reported for acute brain slices, it is unclear whether the same will be true for those cells expressing KCNT1 variants, especially when the excitability changes are thought to arise from homeostatic compensatory mechanisms. The authors do confirm that mutant SST-interneurons are hypoexcitable using an ex vivo slice preparation which is consistent with work for other KCTN1 gain of function variants (e.g. Gertler et al., 2022). However, the key missing evidence is the excitability state of mutant PV-interneurons, given the discrepant result of reduced excitability of PV cells reported by Gertler et al in acute hippocampal slices.

      Reviewer #3 (Public Review):

      Summary:

      The present manuscript by Shore et al. entitled Reduced GABAergic Neuron Excitability, Altered Synaptic Connectivity, and Seizures in a KCNT1 Gain-of-Function Mouse Model of Childhood Epilepsy" describes in vitro and in silico results obtained in cortical neurons from mice carrying the KCNT1-Y777H gain-of-function (GOF) variant in the KCNT1 gene encoding for a subunit of the Na+-activated K+ (KNa) channel. This variant corresponds to the human Y796H variant found in a family with Autosomal Dominant Nocturnal Frontal lobe epilepsy. The occurrence of GOF variants in potassium channel encoding genes is well known, and among potential pathophysiological mechanisms, impaired inhibition has been documented as responsible for KCNT1-related DEEs. Therefore, building on a previous study by the same group performed in homozygous KI animals, and considering that the largest majority of pathogenic KCNT1 variants in humans occur in heterozygosis, the Authors have investigated the effects of heterozygous Kcnt1-Y777H expression on KNa currents and neuronal physiology among cortical glutamatergic and the 3 main classes of GABAergic neurons, namely those expressing vasoactive intestinal polypeptide (VIP), somatostatin (SST), and parvalbumin (PV), crossing KCNT1-Y777H mice with PV-, SST- and PV-cre mouse lines, and recording from GABAergic neurons identified by their expression of mCherry (but negative for GFP used to mark excitatory neurons).

      The results obtained revealed heterogeneous effects of the variant on KNa and action potential firing rates in distinct neuronal subpopulations, ranging from no change (glutamatergic and VIP GABAergic) to decreased excitability (SST GABAergic) to increased excitability (PV GABAergic). In particular, modelling and in vitro data revealed that an increase in persistent Na current occurring in PV neurons was sufficient to overcome the effects of KCNT1 GOF and cause an overall increase in AP generation.

      Strengths:

      The paper is very well written, the results clearly presented and interpreted, and the discussion focuses on the most relevant points.

      The recordings performed in distinct neuronal subpopulations (both in primary neuronal cultures and, for some subpopulations, in cortical slices, are a clear strength of the paper. The finding that the same variant can cause opposite effects and trigger specific homeostatic mechanisms in distinct neuronal populations is very relevant for the field, as it narrows the existing gap between experimental models and clinical evidence.

      Weaknesses:

      My main concern regarding the epileptic phenotype of the heterozygous mice investigated has been clarified in the revision, where the infrequent occurrence of seizures is more clearly stated. Also, a more detailed statistical analysis of the modeled neurons has been added in the revision.

      Recommendations for the authors:

      Reviewer #1 (Recommendations For The Authors):

      This is a very clear and thorough piece of work, and the authors are to be congratulated on this. My one remaining suggestion would be to make an explicit statement about whether increased sodium influx through INaP channels, which is thought to activate KNa channels, would be likely to increase KNa current in these neurons (see comment 1B).

      Please see response to comment 1B.

      Reviewer #2 (Recommendations For The Authors):

      This revised manuscript is significantly improved and addresses most of my concerns. However, I would still recommend including the ex vivo slice recordings in mutant PV-interneurons as the authors proposed in their rebuttal. The I-V recordings using sequential TTX and VU170 blockade in WT SST and PV-interneurons that are provided in the rebuttal are interesting and may point to a preferential expression of persistent sodium currents in PV-interneurons normally. It would be helpful to readers as a supplemental figure.

      As proposed in the rebuttal, we are currently recording PV neurons using ex vivo slice preparations from WT and Kcnt1-YH Het mice. We look forward to including those data in a future manuscript.

      We agree with the reviewer that the differences in INaP between WT PV and SST neurons are notable. The data provided in the rebuttal were only from 5 neurons/group, and they were meant to illustrate a side-by-side comparison of TTX and VU170 subtraction methods to assess KNa currents. However, in Figure 7 of the manuscript, we performed more robust measurements of INaP and observed differences in the current between WT PV and SST neurons. Thus, we’ve added the following sentence to the Results section:

      “Interestingly, the mean peak amplitude of INaP in WT PV neurons was 70% larger than that in WT SST neurons (-1.42 ± 0.16 vs. -0.85 ± 0.07 pA/pF; Fig. 7B and 7D), suggesting there may be differences in sodium channel expression, localization, or regulation inherent to each neuron type that confer their differential response to KCNT1 GOF.”

      References

      Grubb, M. S., & Burrone, J. (2010). Activity-dependent relocation of the axon initial segment fine-tunes neuronal excitability. Nature, 465(7301), 1070-1074. https://doi.org/10.1038/nature09160

      Hage, T. A., & Salkoff, L. (2012). Sodium-activated potassium channels are functionally coupled to persistent sodium currents. J Neurosci, 32(8), 2714-2721. https://doi.org/10.1523/JNEUROSCI.5088-11.2012

      Kuba, H., Oichi, Y., & Ohmori, H. (2010). Presynaptic activity regulates Na(+) channel distribution at the axon initial segment. Nature, 465(7301), 1075-1078. https://doi.org/10.1038/nature09087

    1. Author response:

      Public Reviews:

      Reviewer #1 (Public Review):

      Summary:

      The authors show for the first time that deleting GLS from rod photoreceptors results in the rapid death of these cells. The death of photoreceptor cells could result from loss of synaptic activity because of a decrease in glutamate, as has been shown in neurons, changes in redox balance, or nutrient deprivation. 

      Strengths: 

      The strength of this manuscript is that the author shows a similar phenotype in the mice when Gls was knocked out early in rod development or the adult rod. They showed that rapid cell death is through apoptosis, and there is an increase in the expression of genes responsive to oxidative stress. 

      We thank the reviewer for their time reviewing the manuscript and their comments regarding the potential mechanism(s) by which rod photoreceptors rapidly degenerate upon knockout of GLS.

      Weaknesses: 

      In this manuscript, the authors show a "metabolic dependency of photoreceptors on glutamine catabolism in vivo". However, there is a potential bias in their thinking that glutamine metabolism in rods is similar to cancer cells where it feeds into the TCA cycle. They should consider that as in neurons, GLS1 activity provides glutamate for synaptic transmission. The modest rescue shown by providing α-ketoglutarate in the drinking water suggests that glutamine isn't a key metabolic substrate for rods when glucose is plentiful. The ERG studies performed on the iCre-Glsflox/flox mice showed a large decrease in the scotopic b wave at saturating flashes which could indicate a decrease in glutamate at the rod synapse as stated by the authors. While EM micrographs of wt and iCre-Glsflox/flox mice were shown for the outer retina at p14, the synapse of the rods needs to be examined by EM. 

      We agree with the reviewer that in the presence of sufficient glucose, it appears a lack of GLS-driven glutamine (Gln) catabolism does not drastically alter the levels of TCA cycle metabolites or mitochondrial function as we demonstrated in Figure 4, and supplementation with alpha-ketoglutarate improved outer nuclear layer thickness by only a small amount as observed in Figure 5e. Hence, as we stated in the Results and Discussion, at least in the mouse where Gls is selectively deleted from rod photoreceptors by crossing Glsfl/fl mice with Rho-Cre mice (Glsfl/fl; Rho-Cre+, cKO), Gln’s role in supporting the TCA cycle is not the major mechanism by which rod photoreceptors utilize Gln to suppress apoptosis.

      With regards to GLS-driven Gln catabolism providing glutamate (Glu) for synaptic transmission, we again agree with the reviewer that Glu is an important excitatory neurotransmitter, but it is also a key metabolite necessary for the synthesis of glutathione, amino acids, and proteins. As noted and discussed at length in the manuscript, a lack of GLS-driven Gln catabolism in rod photoreceptors leads to reduced levels of oxidized glutathione (Figure 4D) possibly signaling an overall reduction in the biosynthesis of glutathione as Glu is directly and indirectly responsible for its synthesis. Furthermore, Gln and GLS-derived Glu play a central role in the biosynthesis of several nonessential amino acids and proteins. To this end, we see a reduction in the level of Glu, which is the product of the GLS reaction and further confirms the loss of GLS function. We also noted a significant decrease in aspartate (Asp), which can be constructed from the carbons and nitrogens of Gln as discussed at length in the manuscript (Figure 6A). Finally, we noted a significant decrease in global protein synthesis in the cKO retina as compared to the wild-type animal as well (Figure 6E). Therefore, the data suggest that GLS-driven Gln catabolism is critical for amino acid metabolism and protein synthesis and to some degree redox balance; although, the small but statistically significant changes in oxidized glutathione, NADP/NADPH, and redox gene expression may not fully account for the rapid and complete photoreceptor degeneration observed. Future studies are necessary to shed light on the role of redox imbalance in this novel transgenic mouse model.

      Glu also plays a role in synaptic transmission, and we considered this scenario as described in Figure 1 – figure supplement 5. Here, the synaptic connectivity between photoreceptors and the inner retina did not demonstrate significant differences in the labeling of photoreceptor synaptic membranes in the outer plexiform layer nor alterations in the labeling of a key protein (Bassoon) in ribbon synapses. These data suggest that the synaptic connectivity between photoreceptors and second-order neurons was unaltered at P14 in the cKO retina, which is the time just prior to rapid photoreceptor degeneration. We agree, though, that to obtain greater insight into the alterations in the ribbon synapse, EM images can be examined. The EM images shown in Figure 1 – figure supplement 4 are from P21 and will be utilized to assess the ribbon synapse for the revised version of the article.

      With regards to the ERG changes noted in Figure 2, we agree with the reviewer that a large decrease was noted in the scotopic b-wave at P21 and P42 in the cKO. However, an even larger reduction in the scotopic a-wave was noted at these ages as well. In animal models that disrupt photoreceptor synaptic function (Dick et al. Neuron. 2003; Johnson et al. J Neuroscience. 2007; Haeseleer et al. Nature Neuroscience. 2004; Chang et al. Vis Neurosci. 2006), a more negative ERG pattern is typically observed with the b-wave altered to a much larger degree than the a-wave. Additionally, in these models that disrupt photoreceptor synaptic transmission, the overall structure of the retina with respect to thickness is maintained (Dick et al. Neuron. 2003) or noted to have modest changes in the outer plexiform layer within the first two months of age with the outer nuclear layer not significantly altered until 8-10 months of age (Haeseleer et al. Nature Neuroscience. 2004). In contrast, a rapid decline in the outer nuclear layer thickness was observed in the cKO retina after P14 likely contributing to the ERG changes noted in Figure 2.  Also, Gln is catabolized to Glu primarily by GLS as suggested by the approximately 50% reduction in Glu levels in the cKO retina (Figure 6A), but other enzymes are also capable of catabolizing Gln to Glu, so Glu levels in the rod photoreceptors are unlikely to be zero. Coupling this with the fact that rods are equipped with a self-sufficient Glu recollecting system at their synaptic terminals (Hasegawa et al. Neuron. 2006; Winkler et al. Vis Neurosci. 1999) and that GLS activity is at least two-fold higher in the photoreceptor inner segments, which support energy production and metabolism, than any other layer in the retina (Ross et al. Brain Res. 1987) suggests that altered synaptic transmission secondary to reduced levels of Glu likely does not account in full for the rapid and robust photoreceptor degeneration observed in the cKO retina.

      The authors note that the outer segments are shorter but they do not address whether there is a decrease in the number of cones. 

      The number of cones will be assessed and provided in the revised version of the article.

      Rod-specific Gls ko mice with an inducible promoter were generated by crossing the Pde6g-CreERT2 and homozygous for either the WT or floxed Gls allele (IND-cKO). In Figure 3 the authors document that by western blots and antibody labeling the GLS1 expression is lost in the IND-cKO 10 days post tamoxifen. OCT images show a decrease in the thickness of the outer nuclear layer between 17 and 38 days post-TAM. Ergs should be performed on the animals at 10 and 30 days post TAM, before and after major structural changes in rod photoreceptor cells, to determine if changes in light-stimulated responses are observed. These studies could help to parse out the cause of photoreceptor cell death. 

      We agree with the reviewer that the IND-cKO is a useful tool to help parse out the cause of photoreceptor cell death in this model as well as shed light on the role of GLS-driven Gln catabolism in photoreceptor synaptic transmission as discussed at length above. Hence, ERG analyses will be provided for these animals in the revised version of the article.

      The studies in Figure 4 were all performed on iCre-Glsflox/flox and control mice at p14, why weren't the IND-cKO mice used for these studies since the findings would not be confounded by development? 

      To gain further insight into the role of GLS-driven Gln catabolism in the maintenance of rod photoreceptors as compared to their development/maturation, we will provide ERG and targeted metabolomic analyses of the IND-cKO retina in the revised version of the article.

      In all rescue studies, the endpoint was an ONL thickness, which only addressed rod cell death. The authors should also determine whether there are small improvements in the ERG, which would distinguish the role of GLS in preventing oxidative stress. 

      Optical coherence tomography (OCT) provides a sensitive in vivo method to detect small changes in retinal thickness without potential artifacts incurred through histological processing. Considering the Gls cKO retina demonstrates significant and rapid photoreceptor degeneration, we wanted to assess pathways that may be critical to photoreceptor survival downstream of GLS-driven Gln catabolism using rescue experiments with pharmacologic treatment or metabolite supplementation. That said, disruption of GLS-driven Gln catabolism may also significantly alter rod photoreceptor function beyond that which is secondary to photoreceptor cell death. As such, changes in ERG will be examined and provided in the revised version of the article for certain rescue experiments that demonstrated a robust change in ONL thickness.

      Reviewer #2 (Public Review): 

      Summary: 

      Photoreceptor neurons are crucial for vision, and discovering pathways necessary for photoreceptor health and survival can open new avenues for therapeutics. Studies have shown that metabolic dysfunction can cause photoreceptor degeneration and vision loss, but the metabolic pathways maintaining photoreceptor health are not well understood. This is a fundamental study that shows that glutamine catabolism is critical for photoreceptor cell health using in vivo model systems. 

      Strengths: 

      The data are compelling, and the consideration of potential confounding factors (such as glutaminase 2 expression) and additional experiments to examine the synaptic connectivity and inner retina added strength to this work. The authors were also careful not to overstate their claims, but to provide solid conclusions that fit the results and data provided in their study. The findings linking asparagine supplementation and the inhibition of the integrated stress response to glutamine catabolism within the rod photoreceptor cell are intriguing and innovative. Overall, the authors provide convincing data to highlight that photoreceptors utilize various fuel sources to meet their metabolic needs, and that glutamine is critical to these cells for their biomass, redox balance, function, and survival. 

      We greatly appreciate the reviewer’s thoughtful comments and time spent reviewing this manuscript.

      Weaknesses: 

      Recent studies have explored the metabolic "crosstalk" that exists within the mammalian retina, where metabolites are transferred between the various retinal cells and the retinal pigment epithelium. It would be of interest to test whether the conditional knockout mice have changes in metabolism (via qPCR such as shown in Figure 4 - Supplemental Figure 1) within the retinal pigment epithelium that may be contributing to the authors' findings in the neural retina. Additionally, the authors have very compelling data to show that inhibition of eIF2a or supplementation with asparagine can delay photoreceptor death via OCT measurements in their conditional knockout mouse model (Figure 6G, H). However, does inhibition of eIF2a or asparagine adversely impact the WT retina? It would also be impactful to know whether this has a prolonged effect, or if it is short-term, as this would provide strength to potential therapeutic targeting of these pathways to maintain photoreceptor health. 

      We agree with the reviewer that metabolic communication in the outer retina is crucial to the function and survival of both photoreceptors and RPE. We will perform qRT-PCR on the eyecups of these mice to assess any changes in the expression of metabolic genes. This data will be provided in the revised manuscript.

      We have data demonstrating systemic treatment with ISRIB does not adversely impact the anatomy of the wild-type retina; this data will be included in the revised manuscript as a supplement to Figure 6. Additionally, we have recent data to suggest that the effect of ISRIB extends beyond P21 in the cKO mouse. This data will be included in the revised manuscript.

      Reviewer #3 (Public Review): 

      Summary: 

      The authors explored the role of GLS, a glutaminase, which is an enzyme that catalyzes the conversion of glutamine to glutamate, in rod photoreceptor function and survival. The loss of GLS was found to cause rapid autonomous death of rod photoreceptors. 

      Strengths: 

      Interesting and novel phenotype. Two types of cre-lines were rigorously used to knockout the Gls gene in rods. Both of the conditional knockouts led to a similar phenotype, i.e. rod death. Histology and ERG were carefully done to characterize the loss of rods over specific ages. A necessary metabolomic study was performed and appreciated. Some rescue experiments were performed and revealed possible mechanisms. 

      We thank the reviewer for their comments and appreciation of the methods utilized herein to address the role of GLS-driven Gln catabolism in rod photoreceptors.

      Weaknesses: 

      No major weaknesses were identified. The mechanism of GLS-loss-induced rod death seems not fully elucidated by this study but could be followed up in the future, and the same for GLS's role in cones.

      We agree with the reviewer that the downstream metabolic and molecular mechanisms by which Gln catabolism impacts rod photoreceptor health are not fully elucidated. Defining these mechanisms will advance our understanding of photoreceptor metabolism and identify therapeutic targets promoting photoreceptor resistance to stress. Future studies are underway to uncover these mechanisms. Additionally, while outside the scope of the current manuscript, we have generated mice lacking GLS in cone photoreceptors specifically and are currently elucidating the role of GLS in cone photoreceptor metabolism, function, and survival. These results will be published in a separate manuscript.

    1. Author response:

      The following is the authors’ response to the original reviews.

      Response to reviewers

      A general comment was that this study left several key questions unanswered, in particular the causal mechanism for the reported ribosomal distributions.  We have been interested in the evolution of asymmetric bacterial growth and aging for many years. However, a motivational difference is that we are more interested in the evolutionary process, and evolution by natural selection works on the phenotype.  Thus, we wanted to start with the phenotype closest to fitness, appropriately defined for the conditions, work downwards.  We examined first the asymmetry of elongation rates in single cells, then gene products, and now ribosomes.  As we have pointed out, our demonstration of ribosomal asymmetry shows that the phenomenon was not peculiar and unique to the gene products we examined.  Rather, the asymmetry is acting higher up in the metabolic network and likely affecting all genes.  We find such conceptual guidance to be important.  In the ideal world, of course we would have liked to have worked out the causal mechanisms in one swoop.  In a less than ideal situation, it is a subjective decision as where to stop.  We believe that the publication of this manuscript is more than appropriate at this juncture.  We work at the interface of evolutionary theory and microbiology.  Our results could appeal to both fields.  If we attract new researchers, progress could be accelerated.  Could the delay caused by publishing only completed stories slow the rate of discovery?  These questions are likely as old as science (e.g., https://telliamedrevisited.wordpress.com/2021/01/28/how-not-to-write-a-response-to-reviewers/).

      We present below our response to specific comments by reviewers.  We have not added a new discussion of papers suggested by Reviewer #1 because we feel that the speculations would have been too unfocused.  We were already criticized for speculation in the Discussion about a link between aggregate size and ribosomal density.

      Respond to Major comments by Reviewer #1.

      a) Fig. 1 only shows 2 divisions (rather than 3 as per Rev1) to avoid an overly elaborate figure.  We have added text to the figure legend that the old and new poles and daughters in the subsequent 3, 4, 5, 6, and 7 generations can be determined by following the same notations and tracking we presented for generations 1 and 2 in Fig. 1.  For example, if we know the old and new poles of any of the four daughters after 2 divisions (as in Fig. 1), and allow that daughter to elongate, become a mother, and divide to produce 2 “grand-daughters”, the polarity of the grand-daughters can also be determined.

      b) Because division times were normalized and analyzed as quartiles, the raw values were never used.  Rather than annotating unused values, we have provided the mean division times in the Material and Methods section on normalization to provide representative values.

      c) We did not quantify in our study the changes over generations for three reasons.  First, the sample sizes for the first generations (cohorts of 1, 2, 4, and 8 cells) are statistically small.  Second, and most importantly, cells on an agar pad in a microscope slide, despite being inoculated as fresh exponentially growing cells, experience a growth lag, as all cells transferred to a new physiological condition.  Thus, to be safe, we do not collect data from cohorts 1, 2, 4, and 8 to ensure that our cells are as much as possible physiologically uniform.  Lastly, as we noted in the Material and Methods they also slow down after 7 generations (128 cells).  Thus, we have collected ribosome and length measurements primarily from cohorts 16, 32, 64, and 128.  Measurable cells from the 128 cohort are actually rare because a colony with that many cells often starts to form double layers, which are not measurable.  Most of our measurements came from the 16, 32, and 64 cohorts, in which case a time series would not be meaningful.  Some of these details were not included in our manuscript but have been added to the Material and Methods (Microscopy and time-lapse movies).  For these reasons we have not added a time series as requested by the reviewer.

      d) We have added the additional figure as requested, but as a supplement rather than in the main article (Supplemental Materials Fig. S1).  This figure showed the normalized density of ribosomes along the normalized length of old and new daughters.  The density was continuous rather than quartiles.  This figure was included in the original manuscript, but readers recommended that it be removed because the all the analyzed data had been done with quartiles.  Readers felt mislead and confused.

    1. Author response:

      The following is the authors’ response to the previous reviews.

      Public Reviews:

      Reviewer #1 (Public Review):

      Summary:

      This study presents careful biochemical experiments to understand the relationship between LRRK2 GTP hydrolysis parameters and LRRK2 kinase activity. The authors report that incubation of LRRK2 with ATP increases the KM for GTP and decreases the kcat. From this they suppose an autophosphorylation process is responsible for enzyme inhibition. LRRK2 T1343A showed no change, consistent with it needing to be phosphorylated to explain the changes in G-domain properties. The authors propose that phosphorylation of T1343 inhibits kinase activity and influences monomer-dimer transitions.

      Strengths:

      Strengths of the work are the very careful biochemical analyses and interesting result for wild type LRRK2.

      Weaknesses:

      The conclusions related to involvement of a monomer-dimer transition are to this reviewer, premature and an independent method needs to be utilized to bolster this aspect of the story.

      The monomer-dimer transition has been described in detail in our recent preprint Guaitoli et al., 2023 (doi: 10.1101/2023.08.11.549911). Where we in addition to mass-photometry have used blue-native page. Furthermore, to better elucidate the mechanistic impact of the phosphorylation, we have provided AlphaFold3 models. As the new AlphaFold version allows to consider PTMs as well as small molecules, we compared the models of the GDP vs the GTP-state of pT1343 LRRK2. Interestingly, the AF3 model suggests, that the phosphate of the pT1343 is orientated inwards thereby substituting the gamma phosphate (see Supplementary Figure 5). This finding is in well agreement with MD simulations published recently (Stormer et al., 2023, doi: 10.1042/BCJ20230126). As we are determining GTP hydrolysis in a multi turnover situation, the pT1343 might hamper the hydrolysis by competing with GTP re-binding. Final models have been deposited on Zenodo (https://doi.org/10.5281/zenodo.11242230).

      Reviewer #2 (Public Review):

      As discussed in the original review, this manuscript is an important contribution to a mechanistic understanding of LRRK2 kinase. Kinetic parameters for the GTPase activity of the ROC domain have been determined in the absence/presence of kinase activity. A feedback mechanism from the kinase domain to GTP/GDP hydrolysis by the ROC domain is convincingly demonstrated through these kinetic analyses. However, a regulatory mechanism directly linking the T1343 phosphosite and a monomer/dimer equilibrium is not fully supported. The T1343A mutant has reduced catalytic activity and can form similar levels of dimer as WT. The revised manuscript does point out that other regulatory mechanisms can also play a role in kinase activity and GTP/GDP hydrolysis (Discussion section). The environmental context in cells cannot be captured from the kinetic assays performed in this manuscript, and the introduction contains some citations regarding these regulatory factors. This is not a criticism, the detailed kinetics here are rigorous, but it is simply a limitation of the approach. Caveats concerning effects of membrane localization, Rab/14-3-3 proteins, WD40 domain oligomers, etc... should be given more prominence than a brief (and vague) allusion to 'allosteric targeting' near the end of the Discussion.

      We thank the reviewer for the evaluation of the manuscript and suggestions made. With respect to the mentioned caveats regarding the complex regulation of LRRK2 in its native cellular environment by effectors, localization and effector binding, we have revised the discussion, accordingly. We nevertheless, want to emphasize that the phospho-null mutant T1343A leads to an increase in Rab10 phosphorylation in cells, demonstrating a relevance of this regulatory mechanism under near physiological conditions (shown in Figure 6). In addition, to further elucidate the molecular mechanisms of the p-loop phosphorylation at T1343, we have performed AlphaFold3 modelling allowing to include phosphoresidues (see comment above, Supplemental Figure 5).

      Specific comments

      (1) The revised version is better organized with respect to the significance of monomer/dimer equilibrium and the relevance of the GTP-binding region of ROC domain that encompasses the T1343 phospho-site. The relevance of monomers/dimers of LRRK2 from previous studies is better articulated and readers are able to follow the reasoning for the various mutations.

      We thank the reviewer for the positive feedback. 

      (2) As a suggestion I would change the following on page 6 to clarify for readers: "...would show no change in kcat and KM values upon in vitro ATP treatment" to:

      "...would show no change in kcat and KM values for GTP hydrolysis upon in vitro

      ATP treatment"

      (3) The levels of dimer in WT (+ATP) and T1343A (+/- ATP) are the same, about 40-45%. These data are cited when the authors state that ATP-induced monomerization is 'abolished' (page 6). My suggestion is to re-phrase this conclusion for consistency with data (Fig 5). For example, one can state that 'ATP incubation does not affect the percentage of dimer for the T1343A variant of LRRK2'. This would be similar to the authors' description of these data on page 8 - 'no difference in dimer formation upon ATP treatment'.

      We thank the reviewer for the suggestions. We revised the manuscript accordingly. Changes have been highlighted in the version provided for reviewing purposes.

      Recommendations for the authors:

      Reviewer #2 (Recommendations For The Authors):

      Minor revisions

      -change 'Although functional work on LRRK2 has been made significant progress...' to 'Although there is significant progress toward functional characterization of LRRK2...'

      -change 'exact mechanisms' to 'precise mechanisms', and similarly 'exact interplay' to 'precise interplay'

      -change 'On a contrary' to 'On the contrary' in Discussion

      -change remained to be unchanged' to 'remains unchanged', page 8

      We thank the reviewer for having noticed this. We have revised the manuscript accordingly.

    1. Author response:

      The following is the authors’ response to the original reviews.

      Public Reviews:

      Reviewer #1 (Public Review):

      Summary:

      In this paper, the researchers aimed to address whether bees causally understand string-pulling through a series of experiments. I first briefly summarize what they did:

      - In experiment 1, the researchers trained bees without string and then presented them with flowers in the test phase that either had connected or disconnected strings, to determine what their preference was without any training. Bees did not show any preference.

      - In experiment 2, bees were trained to have experience with string and then tested on their choice between connected vs. disconnected string.

      - experiment 3 was similar except that instead of having one option which was an attached string broken in the middle, the string was completely disconnected from the flower.

      - In experiment 4, bees were trained on green strings and tested on white strings to determine if they generalize across color.

      - In experiment 5, bees were trained on blue strings and tested on white strings.

      - In experiment 6, bees were trained where black tape covered the area between the string and the flower (i.e. so they would not be able to see/ learn whether it was connected or disconnected).

      - In experiments 2-6, bees chose the connected string in the test phase.

      - In experiment 7, bees were trained as in experiment 3 and then tested where the string was either disconnected or coiled i.e. still being 'functional' but appearing different.

      - In experiment 8, bees were trained as before and then tested on a string that was in a different coiled orientation, either connected or disconnected.

      - In experiments 7 and 8 the bees showed no preference.

      Strengths:

      I appreciate the amount of work that has gone into this study and think it contains a nice, thorough set of experiments. I enjoyed reading the paper and felt that overall it was well-written and clear. I think experiment 1 shows that bees do not have an untrained understanding of the function of the string in this context. The rest of the experiments indicate that with training, bees have a preference for unbroken over broken string and likely use visual cues learned during training to make this choice. They also show that as in other contexts, bees readily generalize across different colors.

      Weaknesses:

      (1) I think there are 2 key pieces of information that can be taken from the test phase - the bees' first choice and then their behavior across the whole test. I think the first choice is critical in terms of what the bee has learned from the training phase - then their behavior from this point is informed by the feedback they obtain during the test phase. I think both pieces of information are worth considering, but their behavior across the entire test phase is giving different information than their first choice, and this distinction could be made more explicit. In addition, while the bees' first choice is reported, no statistics are presented for their preferences.

      We agree with the reviewer that the first choice is critical in terms of what the bumblebees have learned from the training phase. We analyzed the bees’ first choice in Table 1, and we added the tested videos. The entire connected and disconnected strings were glued to the floor, the bees were unable to move either the connected or disconnected strings, and avoid learning behavior during the tests. We added the data of bee's each choice in the Supplementary table.

      (2) It seemed to me that the bees might not only be using visual feedback but also motor feedback. This would not explain their behavior in the first test choice, but could explain some of their subsequent behavior. For example, bees might learn during training that there is some friction/weight associated with pulling the string, but in cases where the string is separated from the flower, this would presumably feel different to the bee in terms of the physical feedback it is receiving. I'd be interested to see some of these test videos (perhaps these could be shared as supplementary material, in addition to the training videos already uploaded), to see what the bees' behavior looks like after they attempt to pull a disconnected string.

      We added supplementary videos of testing phase. As noted in General Methods, both connected and disconnected strings were glued to the floor to prevent the air flow generated by flying bumblebees’ wings from changing the position of the string during the testing phase. The bees were unable to move either the connected or disconnected strings during the tests, and only attempted to pull them. Therefore, the difference in the friction/weight of pulling the both strings cannot be a factor in the test.

      (3) I think the statistics section needs to be made clearer (more in private comments).

      We changed the statistical analysis section as suggested by the reviewer.

      (4) I think the paper would be made stronger by considering the natural context in which the bee performs this behavior. Bees manipulate flowers in all kinds of contexts and scrabble with their legs to achieve nectar rewards. Rather than thinking that it is pulling a string, my guess would be that the bee learns that a particular motor pattern within their usual foraging repertoire (scrabbling with legs), leads to a reward. I don't think this makes the behavior any less interesting - in fact, I think considering the behavior through an ecological lens can help make better sense of it.

      Here we respectfully disagree. The solving of Rubik’s cube by humans could be said to be version of finger-movements naturally required to open nuts or remove ticks from fur, but this is somewhat beside the point: it’s not the motor sequences that are of interest, but the cognition involved. A general approach in work on animal intelligence and cognition is to deliberately choose paradigms that are outside the animals’ daily routines-this is what we have done here, in asking whether there is means-end comprehension in bee problem solving. Like comparable studies on this question in other animals, the experiments are designed to probe this question, not one of ecological validity.

      Reviewer #2 (Public Review):

      Summary:

      The authors wanted to see if bumblebees could succeed in the string-pulling paradigm with broken strings. They found that bumblebees can learn to pull strings and that they have a preference to pull on intact strings vs broken ones. The authors conclude that bumblebees use image matching to complete the string-pulling task.

      Strengths:

      The study has an excellent experimental design and contributes to our understanding of what information bumblebees use to solve a string-pulling task.

      Weaknesses:

      Overall, I think the manuscript is good, but it is missing some context. Why do bumblebees rely on image matching rather than causal reasoning? Could it have something to do with their ecology? And how is the task relevant for bumblebees in the wild? Does the test translate to any real-life situations? Is pulling a natural behaviour that bees do? Does image matching have adaptive significance?

      We appreciate the valuable comment from the reviewer. Our explanation, which we have now added to the manuscript, is as follows:

      “Different flower species offer varying profitability in terms of nectar and pollen to bumblebees; they need to make careful choices and learn to use floral cues to predict rewards (Chittka, 2017). Bumblebees can easily learn visual patterns and shapes of flower (Meyer-Rochow, 2019); they can detect stimuli and discriminate between differently coloured stimuli when presented as briefly as 25 ms (Nityananda et al., 2014). In contrast, causal reasoning involves understanding and responding to causal relationships. Bumblebees might favor, or be limited to, a visual approach, likely due to the efficiency and simplicity of processing visual cues to solve the string-pulling task. ”

      As above, it worth noting that our work is not designed as an ecological study, but one about the question of whether causal reasoning can explain how bees solve a string-pulling puzzle. We have a cognitive focus, in line with comparable studies on other animals. We deliberately chose a paradigm that is to some extent outside of the daily challenges of the animal.

      Reviewer #3 (Public Review):

      Summary:

      This paper presents bees with varying levels of experience with a choice task where bees have to choose to pull either a connected or unconnected string, each attached to a yellow flower containing sugar water. Bees without experience of string pulling did not choose the connected string above chance (experiment 1), but with experience of horizontal string pulling (as in the right-hand panel of Figure 4) bees did choose the connected string above chance (experiments 2-3), even when the string colour changed between training and test (experiments 4-5). Bees that were not provided with perceptual-motor feedback (i.e they could not observe that each pull of the string moved the flower) during training still learned to string pull and then chose the connected string option above chance (experiment 6). Bees with normal experience of string pulling then failed to discriminate between connected and unconnected strings when the strings were coiled or looped, rather than presented straight (experiments 7-8).

      Weaknesses:

      The authors have only provided video of some of the conditions where the bees succeeded. In general, I think a video explaining each condition and then showing a clip of a typical performance would make it much easier to follow the study designs for scholars. Videos of the conditions bees failed at would be highly useful in order to compare different hypotheses for how the bees are solving this problem. I also think it is highly important to code the videos for switching behaviours. When solving the connected vs unconnected string tasks, when bees were observed pulling the unconnected string, did they quickly switch to the other string? Or did they continue to pull the wrong string? This would help discriminate the use of perceptual-motor feedback from other hypotheses.

      We added the test videos as suggested by the reviewer, and we added the data for each bee's choice. However, both connected and disconnected strings were glued to the floor, and therefore perceptual-motor feedback was equal and irrelevant between the choices during the test.

      The experiments are also not described well, for my below comments I have assumed that different groups of bees were tested for experiments 1-8, and that experiment 6 was run as described in line 331, where bees were given string-pulling training without perceptual feedback rather than how it is described in Figure 4B, which describes bees as receiving string pulling training with feedback.

      We now added figures of Experiment 6 and 7 in the Figure 1B, and we mentioned that different groups of bees were tested for Experiments 1-9.

      The authors suggest the bees' performance is best explained by what they term 'image matching'. However, experiment 6 does not seem to support this without assuming retroactive image matching after the problem is solved. The logic of experiment 6 is described as "This was to ensure that the bees could not see the familiar "lollipop shape" while pulling strings....If the bees prefer to pull the connected strings, this would indicate that bees memorize the arrangement of strings-connected flowers in this task." I disagree with this second sentence, removing perceptual feedback during training would prevent bees memorising the lollipop shape, because, while solving the task, they don't actually see a string connected to a yellow flower, due to the black barrier. At the end of the task, the string is now behind the bee, so unless the bee is turning around and encoding this object retrospectively as the image to match, it seems hard to imagine how the bee learns the lollipop shape.

      We agree with the reviewer that while solving the task in the last step during training, the bees don't actually see a string connected to a yellow flower, due to the black barrier. Since the full shape is only visible after the pulling is completed and this requires the bee to “check back” on the entire display after feeding, to basically conclude “ this is the shape that I need to be looking for later”.

      Another possibility is that bumblebees might remember the image of the “lollipop shape” while training the bees in the first step, in which the “lollipop shape” was directly presented to the bumblebee in the early step of the training.

      We added the experiment suggested by the reviewer, and the result showed that when a green table was placed behind the string to obscure the “lollipop shape” at any point during the training phase, the bees were unable to identify the connected string. The result further supports that bumblebees learn to choose the connected string through image matching.

      Despite this, the authors go on to describe image matching as one of their main findings. For this claim, I would suggest the authors run another experiment, identical to experiment 6 but with a black panel behind the bee, such that the string the bee pulls behind itself disappears from view. There is now no image to match at any point from the bee's perspective so it should now fail the connectivity task.

      Strengths:

      Despite these issues, this is a fascinating dataset. Experiments 1 and 2 show that the bees are not learning to discriminate between connected and unconnected stimuli rapidly in the first trials of the test. Instead, it is clear that experience in string pulling is needed to discriminate between connected and unconnected strings. What aspect of this experience is important? Experiment 6 suggests it is not image matching (when no image is provided during problem-solving, but only afterward, bees still attend to string connectivity) and casts doubt on perceptual-motor feedback (unless from the bee's perspective, they do actually get feedback that pulling the string moves the flower, video is needed here). Experiments 7 and 8 rule out means-end understanding because if the bees are capable of imagining the effect of their actions on the string and then planning out their actions (as hypotheses such as insight, means-end understanding and string connectivity suggest), they should solve these tasks. If the authors can compare the bees' performance in a more detailed way to other species, and run the experiment suggested, this will be a highly exciting paper

      We appreciate the valuable comment from the reviewer. We compared the bees' performance to other species, and conducted the experiment as suggested by the reviewer.

      Recommendations for the authors:

      Reviewer #1 (Recommendations For The Authors):

      Smaller comments:

      Line 64: is the word 'simple' needed here? It could also be explained by more complex forms of associative learning, no?

      We deleted “simple”.

      Methods:

      Line 230: was it checked that this was high-contrast for the bees?

      We added the relevant reference in the revised manuscript.

      Line 240: how much sucrose solution was present in the flowers?

      We added 25 microliters sucrose solution in the flowers. We added the information in the revised manuscript.

      Line 266: check grammar.

      We checked the grammar as follows: “During tests, both strings were glued to the floor of the arena to prevent the air flow generated by flying bumblebees’ wings from changing the position of the string.”

      Statistical analysis:

      - What does it mean that "Bees identity and colony were analyzed with likelihood ratio tests"?

      Bees identity and colony was set as a random variable. We changed the analysis methods in the revised manuscript, and results of the all the experiments did not changed.

      - Line 359: do you mean proportion rather than percentage?

      We mean the percentage.

      - "the number of total choices as weights" - this should be explained further. This is the number of choices that each bee made? What was the variation and mean of this number? If bees varied a lot in this metric, it might make more sense to analyze their first choice (as I see you've done) and their first 10 choices or something like that - for consistency.

      This refers to the total number of choices made by each bumblebee. We added the mean and standard error of each bee’s number of choices in Table 1. Some bees pulled the string fewer than 10 times; we chose to include all choices made by each bee.

      - More generally I think the first test is more informative than the subsequent choices, since every choice after their first could be affected by feedback they are getting in that test phase. Or rather, they are telling you different things.

      All the bees were tested only once, however, you might be referring to the first choice. We used Chi-square test to analyze the bumblebees’ first choices in the test. It is worth noting that both connected and disconnected strings were glued to the floor. The bees were unable to move either the connected or disconnected strings during the tests, and only attempted to pull them. Therefore,the feedback from pulling either the connected or disconnected strings is the same.

      - Line 362: I think I know what you mean, but this should be re-phrased because the "number of" sounds more appropriate for a Poisson distribution. I think what you are testing is whether each individual bee chose the connected or the disconnected string - i.e. a 0 or 1 response for each bee?

      We agree with the reviewer that each bee chose the connected or the disconnected string - i.e. a 0 or 1 response for each bee, but not the number. We clarify this as: “The total number of the choices made by each bee was set as weights.” 

      - Line 364-365: here and elsewhere, every time you mention a model, make it clear what the dependent and independent variables are. i.e. for the mixed model, the 'bee' is the random factor? Or also the colony that the bee came from? Were these nested etc?

      We clarify this in the revised manuscript. The bee identity and colony is the random factor in the mixed model.

      - Line 368: "Latency to the first choice of each bee was recorded" - why? What were the hypotheses/ predictions here?

      The latency to the first choice was intended to see if the bumblebees were familiarizing with the testing pattern. A shorter delay time might indicate that the bumblebees were more familiar with the pattern.

      - Line 371: "Multiple comparisons among experiments were.." - do you mean 'within' experiments? It seems that treatments should not be compared between different experiments.

      We mean multiple comparisons among different experiments; we clarify this in the revised manuscript.

      Results

      Experiment 1: From the methods, it sounded like you both analyzed the bees' first choice and their total no. of choices, but in the results section (and Figure 1) I only see the data for all choices combined here.

      In table 1 and in the text you report the number of bees that chose each option on their first choice, but there are no statistical results associated with these results. At the very least, a chi square or binomial test could be run.

      Line 138: "Interestingly, ten out of fifteen bees pulled the connected string in their first choice" - this is presented like it is a significant majority of bees, but a chi-square test of 10 vs 5 has a p-value = 0.1967

      We used the Chi square test to analyzed of the bees’ first choice. We also added the analyzed data in the Table 1.

      Line 143: "It makes sense because the bees could see the "lollipop shape" once they pulled it out from the table." - this feels more like interpretation (i.e. Discussion) rather than results.

      We moved the sentence to the discussion.

      Line 162: again this feels more like interpretation/ conjecture than results.

      We removed the sentence in the results.

      Line 184: check grammar.

      We checked the grammar. We changed “task” to “tasks”.

      Figures

      I really appreciated the overview in Figure 5 - though I think this should be Figure 1? Even if the methods come later in eLife, I think it would be nice to have that cited earlier on (e.g. at the start of the results) to draw the reader's attention to it quickly, since it's so helpful. It also then makes the images at the bottom of what is currently Figure 1 make more sense. I also think that the authors could make it clearer in Figure 5 which strings are connected vs disconnected in the figure (even if it means exaggerating the distance more than it was in real life). I had to zoom in quite a bit to see which were connected vs. not. Alternatively, you could have an arrow to the string with the words "connected" "disconnected" the first time you draw it - and similar labels for the other string conditions.

      We appreciate the valuable comment from the reviewer. We changed Figure 5 to Figure 2, and Figure 4 to Figure 1. We cited the Figures at the start of the results. We also changed the gap distance between the disconnected strings. Additionally, we added arrows to indicate “connected” and “disconnected” strings in the Figure.

      Figure 1 - I think you could make it clearer that the bars refer to experiments (e.g. have an x-axis with this as a label). Also, check the grammar of the y-axis.

      We added the experiments number in the Figures. Additionally, we checked the grammar of the y-axis. We changed “percentages” to “parentage”. 

      I also think it's really helpful to see the supplementary videos but I think it would be nice to see some examples of the test phase, and not just the training examples.

      We added Supplementary videos of the testing phase.

      Reviewer #2 (Recommendations For The Authors):

      Below are also some minor comments:

      L40: "approaches".

      We changed “approach” to “approaches”.

      L42: but likely mainly due to sampling bias of mammals and birds.

      We changed the sentence as follows: String pulling is one of the most extensively used approaches in comparative psychology to evaluate the understanding of causal relationships (Jacobs & Osvath, 2015), with most research focused on mammals and birds, where a food item is visible to the animal but accessible only by pulling on a string attached to the reward (Taylor, 2010; Range et al., 2012; Jacobs & Osvath, 2015; Wakonig et al., 2021).

      L64: remove "in this study"

      We removed “in this study”.

      L64: simple associative learning of what? Isn't your image matching associative too?

      We removed “ simple”.

      L97: remove "a" before "connected".

      We removed “a” before “connected”.

      L136-138: but maybe they could still feel the weight of the flower when pulling?

      Because both strings were glued to the floor in the test phase, the feedback was the same and therefore irrelevant. This information is noted in the General Methods.

      L161: what are these numbers?

      We removed the latency in the revised manuscript.

      L167/ Table 1: I realise that the authors never tried slanted strings to check if bumblebees used proximity as a cue. Why?

      This was simply because we wanted to focus on whether bumblebees could recognize the connectivity of the string.

      Discussion: Why did you only control for colour of the string? What if you had used strings with different textures or smells? Unclear if the authors controlled for "bumblebee smell" on the strings, i.e., after a bee had used the string, was the string replaced by a new one or was the same one used multiple times?

      We used different colors to investigate featural generalization of the visual display of the string connected to the flower in this task. We controlled for color because it is a feature that bumblebees can easily distinguish.

      Both the flowers and the strings were used only once, to prevent the use of chemosensory cues. We clarify this in the revised manuscript.

      L182: since what?

      We deleted “since” in the revised manuscript.

      L182-188: might be worth mentioning that some crows and parrots known for complex cognition perform poorly on broken strings (e.g., https://doi.org/10.1098/rspb.2012.1998 ; https://doi.org/10.1163/1568539X-00003511 ; https://doi.org/10.1038/s41598-021-94879-x ) and Australian magpies use trial and error (https://doi.org/10.1007/s00265-023-03326-6).

      We added the following sentences as suggested by the reviewer: “It is worth noting that some crows and parrots known for complex cognition perform poorly on the broken string task without perceptual feedback or learning. For example, New Caledonian crows use perceptual feedback strategies to solve the broken string-pulling task, and no individual showed a significant preference for the connected string when perceptual feedback was restricted (Taylor et al., 2012). Some Australian magpies and African grey parrots can solve the broken string task, but they required a high number of trials, indicating that learning plays a crucial role in solving this task (Molina et al., 2019; Johnsson et al., 2023).”

      L193: maybe expand on this to put the task into a natural context?

      We added the following sentences as suggested by the reviewer:

      “Different flower species offer varying profitability in terms of nectar and pollen to bumblebees; they need to make careful choices and learn to use floral cues to predict rewards (Chittka, 2017). Bumblebees can easily learn visual patterns and shapes of flower (Meyer-Rochow, 2019); they can detect stimuli and discriminate between differently coloured stimuli when presented as briefly as 25 ms (Nityananda et al., 2014). In contrast, causal reasoning involves understanding and responding to causal relationships. Bumblebees might favor, or be limited to, a visual approach, likely due to the efficiency and simplicity of processing visual cues to solve the string-pulling task. ”

      L204: is causal understanding the same as means-end understanding?

      Means-end understanding is expressed as goal-directed behavior, which involves the deliberate and planned execution of a sequence of steps to achieve a goal. Includes some understanding of the causal relationship (Jacobs & Osvath, 2015; Ortiz et al., 2019). .

      L235: this is a very big span of time. Why not control for motivation? Cognitive performance can vary significantly across the day (at least in humans).

      Bumblebee motivation is understood to be rather consistent, as those that were trained and tested came to the flight arena of their own volition and were foragers looking to fill their crop load each time to return it to the colony.

      L232: what is "(w/w)" ? This occurs throughout the manuscript.

      “w/w” represents the weight-to-weight percentage of sugar.

      L250: this sentence sounds odd. "containing in the central well.." ?? Perhaps rephrase? Unclear what central well refers to? Did the flowers have multiple wells?

      We rephrased the sentence as follows: For each experiment, bumblebees were trained to retrieve a flower with an inverted Eppendorf cap at the center, containing 25 microliters of 50% sucrose solution, from underneath a transparent acrylic table

      L268: why euthanise?

      The reason for euthanizing the bees is that new foragers will typically only become active after the current ones were removed from the hive.

      L270: chemosensory cues answer my concern above. Maybe make it clear earlier.

      We moved this sentence earlier in the result.

      L273: did different individuals use different pulling strategies? Do you have the data to analyse this? This has been done on birds and would offer a nice comparison.

      We analyzed the string-pulling strategies among different individuals, and provided Supplementary Table 1 to display the performances of each individual in different string-pulling experiments.

      L365: unclear why both models. Would be nice to see a GLM output table.

      The duration of pulling different kinds of strings were first tested with the Shapiro-Wilk test to assess data normality. The duration data that conforms to a normal distribution was compared using linear mixed-effects models (LMM), while the data that deviates from normality were examined with a generalized linear-mixed model (GLMM). We added a GLM and GLMM output table in the revised manuscript.

      L377: should be a space between the "." and "This".

      We added a space between the “.” and “This”.

      L383-390: some commas and semicolons are in the wrong places.

      We carefully checked the commas and semicolons in this sentence.

      Reviewer #3 (Recommendations For The Authors):

      Minor comments

      Line 32: seems to be missing a word, suggest "the bumblebees' ability to distinguish".

      we added “the” in the revised manuscript.

      Line 47: it would be good to reference other scholars here, this is the central focus of all work in comparative psychology.

      We added the reference in the revised manuscript.

      Line 50-61: I think the string-pulling literature could be described in more detail here, with mention of perceptual-motor feedback loops as a competing hypothesis to means-end understanding (see Taylor et al 2010, 2012). It seems a stretch to suggest that "String-pulling studies have directly tested means-end comprehension in various species", when perceptual-motor feedback is a competing hypothesis that we have positive evidence for in several species.

      We mentioned the perceptual-motor feedback in the introduction as follow:

      “Multiple mechanisms can be involved in the string-pulling task, including the proximity principle, perceptual feedback and means-end understanding (Taylor et al., 2012; Wasserman et al., 2013; Jacobs & Osvath, 2015; Wang et al., 2020). The principle of proximity refers to animals preferring to pull the reward that is closest to them (Jacobs & Osvath, 2015). Taylor et al. (2012) proposed that the success of New Caledonian crows in string-pulling tasks is based on a perceptual-motor feedback loop, where the reward gradually moves closer to the animal as they pull the strings. If the visual signal of the reward approaching is restricted, crows with no prior string-pulling experience are unable to solve the broken string task (Taylor et al., 2012).

      However, when a green table was placed behind the string to obscure the “lollipop” structure during the training, the bees could not see the “lollipop” during the initial training stage or after pulling the string from under the table. In this situation, the bees were unable to identify the connected string, further proving that bumblebees chose the connected string based on image matching.

      Line 68: suggest remove 'meticulously'.

      We removed “meticulously”.

      Line 99: This is an exciting finding, can the authors please provide a video of a bee solving this task on its first trial?

      We added videos in the supplementary materials.

      Line 133: perceptual-motor feedback loops should be introduced in the introduction.

      We introduced perceptual-motor feedback loops in the revised manuscript.

      Line 136: please clarify the prior experience of these bees, it is not clear from the text.

      We clarified the prior experience of these bees as follow: Bumblebees were initially attracted to feed on yellow artificial flowers, and then trained with transparent tables covered by black tape (S7 video) through a four-step process.

      Line 138: from the video it is not possible to see the bee's perspective of this occlusion. Do the authors have a video or image showing the feedback the bees received? I think this is highly important if they wish to argue that this condition prevents the use of both image matching and a perceptual-motor feedback loop.

      We prevented the use of image matching: the bees were unable to see the flower moving towards them above the table during the training phase in this condition. But the bees may receive visual image both after pulling the string out from the table and in the initial stages of training in this condition.

      Line 147: please clarify what experience these bees had before this test.

      We added the prior experience of bumblebees before training as follow: We therefore designed further experiments based on Taylor et al. (2012) to test this hypothesis. Bumblebees were first trained to feed on yellow artificial, and then trained with the same procedure as Experiment 2, but the connected strings were coiled in the test.

      Line 155: This is a highly similar test to that used in Taylor et al 2012, have the authors seen this study?

      We mentioned the reference in the revised manuscript as follows: We therefore designed further experiments based on Taylor et al. (2012) to test this hypothesis.

      Line 183: This sentence needs rewriting "Since the vast majority of animals, including dogs 183 (Osthaus et al., 2005), cats (Whitt et al., 2009), western scrub-jays (Hofmann et al.,2016) and azure-winged magpies (Wang et al., 2019) are failing in such tasks spontaneously".

      We changed the sentence as suggested by the reviewer as follow:  Some animals, including dogs (Osthaus et al., 2005), cats (Whitt et al., 2009), western scrub-jays (Hofmann et al., 2016) and azure-winged magpies (Wang et al., 2019) fail in such task spontaneously.

      Line 186: "complete comprehension of the functionality of strings is rare" I am not sure the evidence in the current literature supports any animal showing full understanding, can the authors explain how they reach this conclusion?

      We wished to say that few animal species could distinguish between connected and disconnected strings without trial and error learning. We revised the sentence as follows:

      It is worth noting that some crows and parrots known for complex cognition perform poorly on broken string task without perceptual feedback or learning. For example, New Caledonian crows use perceptual feedback strategies to solve broken string-pulling task, and no individual showed a significant preference for the connected string when perceptual feedback is restricted (Taylor et al., 2012). Some Australian magpies and African grey parrots can solve the broken string task, but it required a high number of trials, indicating that learning plays a crucial role in solving this task (Molina et al., 2019; Johnsson et al., 2023).

      Line 190: the authors need to clarify which part of their study provides positive evidence for this conclusion.

      We added the evidence for this conclusion as follows: Our findings suggest that bumblebees with experience of string pulling prefer the connected strings, but they failed to identify the interrupted strings when the string was coiled in the test.

      Line 265: was the far end of the string glued only?

      The entire string was glued to the floor, not just the far ends of the string.

    1. Author response:

      The following is the authors’ response to the original reviews.

      Public Reviews: 

      Reviewer #1 (Public Review):

      Summary: 

      In this paper, the authors used target agnostic MBC sorting and activation methods to identify B cells and antibodies against sexual stages of Plasmodium falciparum. While they isolated some Mabs against PFs48/45 and PFs230, two well-known candidates for "transmission blocking" vaccines, these antibodies' efficacies, as measured by TRA, did not perform as well as other known antibodies. They also isolated one cross-reactive mAb to proteins containing glutamic acid-rich repetitive elements, that express at different stages of the parasite life cycle. They then determined the structure of the Fab with the highest protein binder they could determine through protein microarray, RESA, and observed homotypic interactions. 

      Strengths: 

      -  Target agnostic B cell isolation (although not a novel methodology). 

      -  New cross-reactive antibody with some "efficacy" (TRA) and mechanism (homotypic interactions) as demonstrated by structural data and other biophysical data. 

      Weaknesses: 

      The paper lacks clarity at times and could benefit from more transparency (showing all the data) and explanations. 

      We have added the oocyst count data from the SMFA experiments as Supplementary Table 2, and ELISA binding curves underlying Figure 4B as Supplementary Figure 5.

      In particular: 

      - define SIFA 

      - define TRAbs 

      We have carefully gone through the manuscript and have introduced abbreviations at first use, removed unnecessary abbreviations and removed unnecessary jargon to increase readability.

      - it is not possible to read the Figure 6B and C panels. 

      We regret that the labels in Supplementary Figures 6 and 7 were of poor quality and have now included higher resolution images to solve this issue.

      Reviewer #2 (Public Review): 

      This manuscript by Amen, Yoo, Fabra-Garcia et al describes a human monoclonal antibody B1E11K, targeting EENV repeats which are present in parasite antigens such as Pfs230, RESAs, and 11.1. The authors isolated B1E11K using an initial target agnostic approach for antibodies that would bind gamete/gametocyte lysate which they made 14 mAbs. Following a suite of highly appropriate characterization methods from Western blotting of recombinant proteins to native parasite material, use of knockout lines to validate specificity, ITC, peptide mapping, SEC-MALS, negative stain EM, and crystallography, the authors have built a compelling case that B1E11K does indeed bind EENV repeats. In addition, using X-ray crystallography they show that two B1E11K Fabs bind to a 16 aa RESA repeat in a head-to-head conformation using homotypic interactions and provide a separate example from CSP, of affinity-matured homotypic interactions. 

      There are some minor comments and considerations identified by this reviewer, These include that one of the main conclusions in the paper is the binding of B1E11K to RESAs which are blood stage antigens that are exported to the infected parasite surface. It would have been interesting if immunofluorescence assays with B1E11K mAb were performed with blood-stage parasites to understand its cellular localization in those stages. 

      In the current manuscript, we provide multiple lines of evidence that B1E11K binds (with high affinity) to repeats that are present in RESAs, i.e. through micro-array studies, in vitro binding experiments such as Western blot, ELISA and BLI, and through X-ray crystallography studies on B1E11k – repeat peptide complexes. Taken together, we think we provide compelling evidence that B1E11k binds to repeats present in RESA proteins. We do agree that studies on the function of this mAb against other stages of the parasite could be of interest, but as our manuscript focuses on the sexual stage of the parasite, we feel that this is beyond scope of the current work. However, this line of inquiry will be strongly considered in follow up studies.   

      Reviewer #3 (Public Review): 

      The manuscript from Amen et al reports the isolation and characterization of human antibodies that recognize proteins expressed at different sexual stages of Plasmodium falciparum. The isolation approach was antigen agnostic and based on the sorting, activation, and screening of memory B cells from a donor whose serum displays high transmission-reducing activity. From this effort, 14 antibodies were produced and further characterized. The antibodies displayed a range of transmission-reducing activities and recognized different Pf sexual stage proteins. However, none of these antibodies had substantially lower TRA than previously described antibodies. 

      The authors then performed further characterization of antibody B1E11K, which was unique in that it recognized multiple proteins expressed during sexual and asexual stages. Using protein microarrays, B1E11K was shown to recognize glutamate-rich repeats, following an EE-XX-EE pattern. An impressive set of biophysical experiments was performed to extensively characterize the interactions of B1E11K with various repeat motifs and lengths. Ultimately, the authors succeeded in determining a 2.6 A resolution crystal structure of B1E11K bound to a 16AA repeat-containing peptide. Excitingly, the structure revealed that two Fabs bound simultaneously to the peptide and made homotypic antibody-antibody contacts. This had only previously been observed with antibodies directed against CSP repeats. 

      Overall I found the manuscript to be very well written, although there are some sections that are heavy on field-specific jargon and abbreviations that make reading unnecessarily difficult. For instance, 'SIFA' is never defined. 

      We have carefully gone through the manuscript and have introduced abbreviations at first use, removed unnecessary abbreviations and removed unnecessary jargon to increase readability.

      Strengths of the manuscript include the target-agnostic screening approach and the thorough characterization of antibodies. The demonstration that B1E11K is cross-reactive to multiple proteins containing glutamate-rich repeats, and that the antibody recognizes the repeats via homotypic interactions, similar to what has been observed for CSP repeat-directed antibodies, should be of interest to many in the field. 

      Recommendations for the authors:

      Reviewer #1 (Recommendations For The Authors): 

      Figure 1 - why only gametes ELISA and Spz or others?  

      The volumes of the single B cell supernatants were too small to screen against multiple antigens/parasite stages. As we aimed to isolate antibodies against the sexual stages of the parasite, our assay focused on this stage and supernatants were not tested against other stages. Furthermore, we screened for reactivity against gametes as TRA mAbs likely target gametes rather than other forms of sexual stage parasites.

      Figure 2 A 

      (a) Wild type (WT) and Pfs48/45 knock-out (KO) gametes.

      (b) I am a bit confused about what GMT is vs Pfs48/45 

      We have changed the column titles in Figure 2A to “wild-type gametes” and “Pfs48/45 knockout gametes” to improve clarity.  

      (c) Binding is high % why is it red? 

      We chose to present the results in a heatmap format with a graded color scale, from strong binders in red to weak binders in green. It has now been clarified in the legend of the figure. 

      Please state acronyms clearly 

      TRA - transmission reducing activity 

      SMFA - standard membrane feeding assay 

      We have added the full terms to clarify the acronyms.

      1123- VRC01 (not O1)

      We have corrected this.

      Figure 2 C bottom panels, clarify which ones are TRAbs (Assuming the Mabs with over 80% TRA at 500 ug/ml) (right gel) and the ones that are not (left gel)? 

      In the Western blot in Figure 2c, we have marked the antibodies with >80% TRA with an asterisk.

      Furthermore, we have replaced ‘TRAbs’ by ‘mAbs with >80% TRA at 500 µg/mL’ in the figure legend.

      ITC show the same affinity of the Fab to the 2 peptides but not the ELISA, not the BLI/SPR would be more appropriate. Any potential explanation?  

      The way binding affinity is determined across various techniques can result in slight differences in determined values. For instance, ELISAs utilize long incubation times with extensive washing steps and involve a spectroscopic signal, isothermal titration calorimetry (ITC) uses calorimetric signal at different concentration equilibriums to extract a KD, and BLI determines kinetic parameters for KD determination. Discrepancies in binding affinities between orthologous techniques have indeed been observed previously in the context of peptide-antibody binding (e.g. PMID: 34788599).

      Despite this, regardless of technique, the relative relationships in all three sets of data is the same - higher binding affinity is observed to the longer P2 peptide. This is the main takeaway of the section. As the reviewer suggests, BLI is likely the most appropriate readout here and is the only value explicitly mentioned in the main text. We primarily use ITC to support our proposed binding stoichiometry which is important to substantiate the SEC-MALS and nsEM data in Figure 4H-I. We added the following sentences to help reinforce these points: “The determined binding affinity from our ITC experiments (Table 1) differed from our BLI experiments (Fig. 4D and 4E), which can occur when measuring antibody-peptide interactions. Regardless, our data across techniques all trend toward the same finding in which a stronger binding affinity is observed toward the longer RESA P2 (16AA) peptide.”

      Figure 5C - would be helpful to have the peptide sequence above referring to what is E1, E2 etc... 

      We added two panels (Figure 5C-D) showcasing the binding interface that shows the peptide numbering in the context of the overall complex. We hope that this will help better orient the reader. 

      Figure S4 - maybe highlight in different colors the EENVV, EEIEE, Etc, etc 

      Repeats found in the sequence of the various proteins in Figure S4 have now been highlighted with different colors.

      Line 163 - why 14 mabs if 11 wells? Isn't it 1 B cell per well? The authors should explain right away that some wells have more than 1 B cell and some have 1 HC, 1LC, and 1 KC. 

      We agree that this was somewhat confusing and have modified the text which now reads: “We obtained and cloned heavy and light chain sequences for 11 out of 84 wells. For three wells we obtained a kappa light chain sequence and for five wells a lambda light chain sequence. For three wells we obtained both a lambda and kappa light chain sequence suggesting that either both chains were present in a single B cell or that two B cells were present in the well. For all 14 wells we retrieved a single heavy chain sequence. Following amplification and cloning, 14 mAbs, from 11 wells, were expressed as full human IgG1s (Table S1) (Dataset S1).”

      Line 166-167 - were they multiple HC (different ones) as well when Lambda and kappa were present?

      This is not clear at first. 

      We clarified this point in the text, see also comment above.

      Line 177 - expressed Pfs48/45 and Pfs230, is it lacking both or just Pfs48/45 (as stated on line 172)? 

      Pfs48/45 binds to the gamete surface via a GPI anchor, while Pfs230 is retained to the surface through binding to Pfs48/45. Hence, the Pfs48/45 knockout parasite will therefore also lack surfacebound Pfs230. We have added a sentence to the Results clarifying this: “The mAbs were also tested for binding to Pfs48/45 knock-out female gametes, which lack surface-bound Pfs48/45 and Pfs230”.

      Show the ELISA data used to calculate EC50 in Figure 3. 

      ELISA binding curves are now shown as Figure S5.

      Line 313-315 - what if you reverse, capture the Fab (peptide too small even if biotinylated?) 

      As anticipated by the Reviewer, immobilizing the Fab and dipping into peptide did not yield appreciable signal for kinetic analysis and thus the experiment from this setup is not reported. 

      Line 341 - add crystal structure 

      This has now been added.

      There is a bit too much speculation in the discussion. For e.g. "The B1C5L and B1C5K mAbs were shown to recognize Domain 2 of Pfs48/45 and exhibited moderate potency, as previously described for Abs with such specificity (27). These 2 mAbs were isolated from the same well and shared the same heavy chain; their three similar characteristics thus suggest that their binding is primarily mediated by the heavy chain". Actual data will reinforce this statement. 

      As B1C5L and B1C5K recognized domain 2 of Pfs48/45 with similar affinity, this strongly suggests that binding is mediated though the heavy chain. Structural analysis could confirm this statement, but this is out of the scope of this study.  

      Reviewer #2 (Recommendations For The Authors): 

      Figure 1: This figure provides a description of the workflow. To make it more relevant for the paper, the authors could add relevant numbers as the workflow proceeds. 

      (a) For example, how many memory B cells were sorted, how many supernatants were positive, and then how many mAbs were produced? These numbers can be attached to the relevant images in the workflow. 

      We modified the figure to include the numbers. 

      (b) For the "Supernatant screening via gamete extract ELISA", please change to "Supernatant screening via gamete/gametocyte extract ELISA". 

      We modified the statement as suggested. 

      Line 155: The manuscript states that 84 wells reacted with gamete/gametocyte lysate. The following sentence states that "Out of the 21 supernatants that were positive...". Can the authors provide the summary of data for all 84 wells or why focus on only 21 supernatants? 

      We screened all supernatants against gamete lysate, and only a subset against gametocyte lysate. In total, we found 84 positive supernatants that were reactive to at least one of the two lysates. 21 of those 84 positive were screened against both lysates. We have modified the text to clarify the numbers:

      “After activation, single cell culture supernatants potentially containing secreted IgGs were screened in a high-throughput 384-well ELISA for their reactivity against a crude Pf gamete lysate (Fig. S1B). A subset of supernatants was also screened against gametocyte lysate (S1C). In total, supernatants from 84 wells reacted with gamete and/or gametocyte lysate proteins, representing 5.6% of the total memory B cells. Of the 21 supernatants that were screened against both gamete and gametocyte lysates, six recognized both, while nine appeared to recognize exclusively gamete proteins, and six exclusively gametocyte proteins.”

      Please note that all 84 positive wells were taken forward for B cell sequencing and cloning. 

      Line 171: SIFA is introduced for the first time and should be completely spelled out.

      We have corrected this. 

      Figure 2: 

      (a) In Figure 2A, can you change the column title from "% pos KO GMT" to "% pos Pfs48/45 KO GMT"?

      We have changed the column titles.  

      (b) In Figure 2B, the SMFA results have been converted to %TRA. Can the authors please provide the raw data for the oocyst counts and number of mosquitoes infected in Supplementary Materials? 

      We have added oocyst count data in Table S2, to which we refer in the figure legend. 

      (c) For Figure 2F, the authors do have other domains to Pfs230 as described in Inklaar et al, NPJ Vaccines 2023. An ELISA/Western to the other domains could identify the binding site for B2C10L, though we appreciate this is not the central result of this manuscript. 

      We thank the reviewer for this suggestion. We are indeed planning to identify the target domain of B2C10L using the previously described fragments, but agree with the reviewer that this not the focus of the current manuscript and decided to therefore not include it in the current report.

      Line 116: The word sporozoites appears in subscript and should be corrected to be normal text. 

      We have corrected this.

      Line 216: Typo "B1E11K" 

      We have corrected this.

      Materials and Methods: 

      (a) PBMC sampling: Please add the ethics approval codes in this section. 

      Donor A visited the hospital with a clinical malaria infection and provided informed consent for collection of PBMCs. We have modified the method section to clarify this. 

      “Donor A had lived in Central Africa for approximately 30 years and reported multiple malaria infections during that period. At the time of sampling PBMCs, Donor A had recently returned to the Netherlands and visited the hospital with a clinical malaria infection. After providing informed consent, PBMCs were collected, but gametocyte prevalence and density were not recorded.”

      (b) Gamete/Gametocyte extract ELISA: Can the authors please provide the concentration of antibodies used for the positive and negative controls (TB31F, 2544, and 399) 

      We have added the concentrations for these mAbs in the methods section.

      Recombinant Pfs48/45 and Pfs230 ELISA: Please state the concentration or molarity used for the coating of recombinant Pfs48/45 and Pfs230CMB. 

      We have added the concentrations, i.e. 0.5 µg/mL, to the methods section.

      Western Blotting: The protocol states that DTT was added to gametocyte extracts (Line 594), but Western Blots in Figures 2 and 3 were performed in non-reducing conditions. Please confirm whether DTT was added or not. 

      Thank you for noting this. We did not use DTT for the western blots and have removed this line from the methods section.

      Reviewer #3 (Recommendations For The Authors): 

      Below are a few minor comments to help improve the manuscript. 

      (1) In Figure 4E, are the BLI data fit to a 1:1 binding model? The fits seem a bit off, and from ITC and X-ray studies it is known that 2 Fabs bind 1 peptide. The second Fab should presumably have higher affinity than the first Fab since the second Fab will make interactions with both the peptide and the first Fab. It may be better to fit the BLI data to a 2:1 binding model. 

      The 2:1 (heterogeneous ligand) model assumes that there are two different independent binding sites. However, the second binding event described is dependent on the first binding event and thus this model also does not accurately reflect the system. Given that there is not an ideal model to fit, we instead are careful about the language used in the main text to describe these results. Additionally, we also include a sentence to the results section to ensure that the proper findings/interpretations are highlighted: “…our data all trend toward the same finding in which a stronger binding affinity is observed toward the longer RESA P2 (16AA) peptide.”

      (2) The sidechain interactions shown in Figures 5C and D could probably be improved. The individual residues are just 'floating' in space, causing them to lack context and orientation. 

      We added two panels (Fig. 5C-D) showcasing the binding interface that shows the peptide numbering in the context of the overall complex. We hope that this will help orient the reader.  

      (3) The percentage of Ramachandran outliers should be listed in Table 2. Presumably, the value is 0.2%, but this is omitted in the current table. 

      Table 2 has been modified to include the requested information explicitly.

    1. Author response:

      The following is the authors’ response to the original reviews.

      Reviewer #1 (Public Review):

      This manuscript introduced a new behavioral apparatus to regulate the animal's behavioral state naturally. It is a thermal maze where different sectors of the maze can be set to different temperatures; once the rest area of the animal is cooled down, it will start searching for a warmer alternative region to settle down again. They recorded with silicon probes from the hippocampus in the maze and found that the incidence of SWRs was higher at the rest areas and place cells representing a rest area were preferentially active during rest-SWRs as well but not during non-REM sleep.

      We thank the reviewer for carefully reading our manuscript and providing useful and constructive comments.

      Strengths:

      The maze can have many future applications, e.g., see how the duration of waking immobility can influence learning, future memory recall, or sleep reactivation. It represents an out-of-the-box thinking to study and control less-studies aspects of the animals' behavior.

      Weaknesses:

      The impact is only within behavioral research and hippocampal electrophysiology.

      We agree with this assessment but would like to add that the intersection of electrophysiological recordings in behaving animals is a very large field. Behavioral thermoregulation is a hotly researched area also by investigators using molecular tools as well. The ThermoMaze can be used for juxtacellular/intracellular recordings in behaving animals. Restricting the animal’s movement during these recordings can improve the length of recording time and recorded single unit yield in these experiments. 

      Moreover, the fact that animals can sleep within the task can open up new possibilities to compare the role of sleep in learning without having to move the animal from a maze back into its home cage. The cooling procedure can be easily adapted to head-fixed virtual reality experiments as well.

      I have only a few questions and suggestions for future analysis if data is available.

      Comment-1: Could you observe a relationship between the duration of immobility and the preferred SWR activation of place cells coding for the current (SWR) location of the animal? In the cited O'Neill et al. paper, they found that the 'spatial selectivity' of SWR activity gradually diminished within a 2-5min period, and after about 5min, SWR activity was no longer influenced by the current location of the animal. Of course, I can imagine that overall, animals are more alert here, so even over more extended immobility periods, SWRs may recruit place cells coding for the current location of the animal.

      We thank the reviewer for raising this question, which is a fundamental issue that we attempted to address using the ThermoMaze. First, we indeed observed persistent place-specific firing of CA1 neurons for up to around 5 minutes, which was the maximal duration of each warm spot epoch, as shown by the decoding analysis (based on firing rate map templates constructed during SPW-Rs) in Figure 5C and D. However, we did not observe above-chance-level decoding of the current position of the animal during sharp-wave ripples using templates constructed during theta, which aligns with previous observation that CA1 neurons during “iSWRs” (15–30 s time windows surrounding theta oscillations) did not show significant differences in their peak firing rate inside versus outside the place field (O’Neil et al., 2006). We reasoned that this could be potentially explained by a different (although correlated, see Figure 5E) neuronal representation of space during theta and during awake SPW-R.

      Comment-2: Following the logic above, if possible, it would be interesting to compare immobility periods on the thermal maze and the home cage beyond SWRs, as it could give further insights into differences in rest states associated with different alertness levels. E.g., power spectra may show a stronger theta band or reduced delta band compared to the home cage.

      If we are correct the Reviewer would like to know whether the brain state of the animal was similar in the ThermoMaze (warm spot location) and in the home cage during immobility. A comparison of the time-evolved power spectra shows similar changes from walking to immobility in both situations without notable differences. This analysis was performed on a subset of animals (n = 17 sessions in 7 mice) that were equipped with an accelerometer (home cage behavior was not monitored by video). We detected rest epochs that lasted at least 2 seconds during wakefulness in both the home cage and ThermoMaze. Using these time points we calculated the event-triggered power spectra for the delta and theta band (±2 s around the transition time) and found no difference between the home cage and ThermoMaze (Suppl. Fig. 4D).

      Prompted by the Reviewer’s question, we further quantified the changes in LFP in the two environments. We did not find any significant change in the frequencies between 1-40 Hz during Awake periods, but we did find higher delta power (1-4 Hz) in some animals in the ThermoMaze (Suppl. Fig. 4A, B). 

      We have also quantified the delta and theta power spectra in the few cases, when the warm spot was maintained, and the animal fell asleep. The time-resolved spectra classified the brain state as NREM, similar to sleeping in the home cage. Both delta and theta power were higher in the ThermoMaze following Awake-NREM transitions (±30 seconds around the transition, Suppl. Fig. 4C). It might well be that immobility/sleep outside the mouse’s nest might reflect some minor (but important) differences but our experiments with only a single camera recording do not have the needed resolution to reveal minor differences in posture.

      We added these results to the revised Supplementary material (Suppl. Fig. 4).

      Comment-3: Was there any behavioral tracking performed on naïve animals that were placed the first time in the thermal maze? I would expect some degree of learning to take place as the animal realizes that it can find another warm zone and that it is worth settling down in that area for a while. Perhaps such a learning effect could be quantified.

      Unfortunately, we did not record videos during the first few sessions in the ThermoMaze. Typically, we transferred a naïve animal into the ThermoMaze for an hour on the first day to acclimatize them to the environment. This was performed without video analysis. In addition, because the current version of the maze is relatively small (20 x 20 cm), the animal usually walked around the edges of the maze before settling down at a heated warm spot. It appeared to us that there was only a very weak drive to learn the sequence and location of the warm spot, and therefore we did not quantified learning in the current experiment. We agree with the reviewer that in future studies, it will be interesting to explore whether the ThermoMaze could be adapted to a land-version of the Morris water maze by increasing the size of the maze and performing more controlled behavioral training and testing.

      Comment-4: There may be a mislabeling in Figure 6g because the figure does not agree with the result text - the figure compares the population vector similarly of waking SWR vs sleep SWRs to exploration vs waking SWR and exploration vs sleep SWRs.

      We thank the reviewer for raising the point, we have updated the labels accordingly.

      Reviewer #2 (Public Review):

      In this manuscript, Vöröslakos and colleagues describe a new behavioural testing apparatus called ThermoMaze, which should facilitate controlling when a mouse is exploring the environment vs. remaining immobile. The floor of the apparatus is tiled with 25 plates, which can be individually heated, whereas the rest of the environment is cooled. The mouse avoids cooled areas and stays immobile on a heated tile. The authors systematically changed the location of the heated tile to trigger the mouse's exploratory behaviours. The authors showed that if the same plate stays heated longer, the mouse falls into an NREM sleep state. The authors conclude their apparatus allows easy control of triggering behaviours such as running/exploration, immobility and NREM sleep. The authors also carried out single-unit recordings of CA1 hippocampal cells using various silicone probes. They show that the location of a mouse can be decoded with above-chance accuracy from cell activity during sharp wave ripples, which tend to occur when the mouse is immobile or asleep. The authors suggest that consistent with some previous results, SPW-Rs encode the mouse's current location and any other information they may encode (such as past and future locations, usually associated with them).

      We thank the reviewer for carefully reading our manuscript and providing useful and constructive comments.

      Strengths:

      Overall, the apparatus may open fruitful avenues for future research to uncover the physiology of transitions from different behavioural states such as locomotion, immobility, and sleep. The setup is compatible with neural recordings. No training is required.

      Weaknesses:

      I have a few concerns related to the authors' methodology and some limitations of the apparatus's current form. Although the authors suggest that switching between the plates forces animal behaviour into an exploratory mode, leading to a better sampling of the enclosure, their example position heat maps and trajectories suggest that the behaviour is still very stereotypical, restricted mostly to the trajectories along the walls or the diagonal ones (between two opposite corners). This may not be ideal for studying spatial responses known to be affected by the stereotypicity of the animal's trajectories. Moreover, given such stereotypicity of the trajectories mice take before and after reaching a specific plate, it may be that the stable activity of SWR-P ripples used for decoding different quadrants may be representing future and/or past trajectories rather than the current locations suggested by the authors. If this is the case, it may be confusing/misleading to call such activity ' place-selective firing', since they don't necessarily encode a given place per se (line 281).

      We agree with the reviewer that the current version of the ThermoMaze does not necessarily motivate the mice to sample the entire maze during warm spot transitions. However, we did show correlational evidence that neuronal firing during awake sharp-wave ripples is place-selective. Both firing rate ratios and population vectors of CA1 neurons showed a reliable correlation between those during movement and awake sharp-wave ripples (Figure 5 E and F), indicating that spatial coding during movement persists into awake SWR-P state. This finding rejects the hypothesis that neuronal firing during ripples throughout the Cooling sub-session encodes past/future trajectories, which could be explained by a lack of goal-directed behavior in order to perform the task. We hope to test whether such place-specific firing during ripples can be causally involved in maintaining an egocentric representation of space in a future study.

      Besides, we have attempted to motivate the animal to visit the center of the maze during the Cooling sub-session. Moving the location of warm spots from the corners can shape the animals’ behavior and promote more exploration of the environment as we show in Suppl. Fig. 5. We agree with the Reviewer that the current size of the ThermoMaze poses these limitations. However, an example future application could be to warm the floor of a radial-arm maze by heating Peltier elements at the ends of maze arms and center in an otherwise cold room, allowing the experimenter to induce ambulation in the 1-dimensional arms, followed by extended immobility and sleep at designated areas.

      Another main study limitation is the reported instability of the location cells in the Thermomaze. This may be related to the heating procedure, differences in stereotypical sampling of the enclosure, or the enclosure size (too small to properly reveal the place code). It would be helpful if the authors separate pyramidal cells into place and non-place cells to better understand how stable place cell activity is. This information may also help to disambiguate the SPW-R-related limitations outlined above and may help to solve the poor decoding problem reported by the authors (lines 218-221).

      The ThermoMaze is a relatively small enclosure (20 x 20 cm) compared to typical 2D arenas (60 x 60 cm) used in hippocampal spatial studies. Due to the small environment, one possibility is that CA1 neurons encode less spatial information and only a small number of place cells could be found. Therefore, we identified place cells in each sub-session. We found 40.90%, 45.32%, and 41.26% of pyramidal cells to be place cells in the Pre-cooling, Cooling, and Post-cooling sub-sessions, respectively. Furthermore, we found on average 17.36% of pyramidal neurons pass the place cell criteria in all three sub-sessions in a daily session. Therefore, the strong decorrelation of spatial firing maps across sub-sessions cannot be explained by poor recording quality or weak neuronal encoding of spatial information but is potentially due to changes in environmental conditions.

      Some additional points/queries:

      Comment-1: Since the authors managed to induce sleeping on the warm pads during the prolonged stays, can they check their hypothesis that the difference in the mean ripple peak frequency (Fig. 4D) between the home cage and Thermomaze was due to the sleep vs. non-sleep states?

      In response to the reviewer’s comment, we compared the ripple peak frequency that occurred during wakefulness and NREM epochs in the home cage and ThermoMaze (n = 7 sessions in 4 mice). We found that the peak frequency of the awake ripples was higher compared to both home cage and ThermoMaze NREM sleep (one-way ANOVA with Tukey’s posthoc test, ripple frequencies were: 171.63 ± 11.69, 172.21 ± 11.86, 168.19 ± 11.10 and 168.26 ± 11.08 Hz mean±SD for home cage awake, ThermoMaze awake, home cage NREM and ThermoMaze NREM conditions, p < 0.001 between awake and NREM states). We added this quantification to the revised manuscript.

      Author response image 1.

      NREM sleep either in home cage or in ThermoMaze affects ripple mean peak frequency similarly.

      Comment-2: How many cells per mouse were recorded? How many of them were place cells? How many place cells at the same time on average? What are the place field size, peak, and mean firing rate distributions in these various conditions? It would be helpful if they could report this.

      For each animal on a given day, the average number of cells recorded was 57.5, which depended on the electrodes and duration after implantation. We first applied peak firing rate and spatial information thresholds to identify place cells in each sub-session (see more details in the revised Methods section for place cell definition). We found 40.90%, 45.32%, and 41.26% of pyramidal cells to be place cells in the Pre-cooling, Cooling, and Post-cooling sub-sessions respectively. Furthermore, we found on average 17.36% of pyramidal neurons pass the place cell criteria in all three sub-sessions in a daily session.

      For place cells identified in each sub-session, their place fields size is on average 61.03, 79.86, and 57.51 cm2 (standard deviation = 60.13, 69.98, and 49.64 cm2; Pre-cooling, Cooling, and Post-cooling correspondingly). A place field was defined to be a contiguous region of at least 20 cm2 (20 spatial bins) in which the firing rate was above 60% of the peak firing rate of the cell in the maze (Roux and Buzsaki et al., 2017). A place field also needs to contain at least one bin above 80% of the peak firing rate in the maze. With such definition, the average place field peak firing rate is 5.84, 5.22, and 6.48 Hz (standard deviation = 5.11, 4.65, and 5.83 Hz) and the average mean firing rate within the place fields is 4.54, 4.05, and 5.07 Hz (standard deviation = 4.00, 3.60, and 4.60).

      We would like to point out that these values depend strongly on the definition of place fields, which vary widely across studies. We reason that the ThermoMaze paradigm induced place field remapping which has been reported to occur upon changes in the environment such as visual cues (Leutgeb et al., 2009). We hypothesize that temperature gradient is an important aspect among the environmental cues, thus remapping is expected. Overall, we did not aim for biological discoveries in the first presentation of the ThermoMaze. Instead, our limited goal was the detailed description of the method and its validation for behavioral and physiological experiments.

      References

      (1) Mizuseki K, Royer S, Diba K, Buzsáki G. Activity dynamics and behavioral correlates of CA3 and CA1 hippocampal pyramidal neurons. Hippocampus. 2012 Aug;22(8):1659-80. doi: 10.1002/hipo.22002. Epub 2012 Feb 27. PMID: 22367959; PMCID: PMC3718552.

      (2) Skaggs WE,McNaughton BL,Gothard KM,Markus EJ. 1993. An information-theoretic approach to deciphering the hippocampal code. In: SJ Hanson, JD Cowan, CL Giles, editors. Advances in Neural Information Processing Systems, Vol. 5. San Francisco, CA: Morgan Kaufmann. pp 1030–1037.

      (3) Roux L, Hu B, Eichler R, Stark E, Buzsáki G. Sharp wave ripples during learning stabilize the hippocampal spatial map. Nat Neurosci. 2017 Jun;20(6):845-853. doi: 10.1038/nn.4543. Epub 2017 Apr 10. PMID: 28394323; PMCID: PMC5446786.

      (4) Markus, E.J., Barnes, C.A., McNaughton, B.L., Gladden, V.L. & Skaggs, W.E. Spatial information content and reliability of hippocampal CA1 neurons: effects of visual input. Hippocampus 4, 410–421 (1994).

    1. Author response:

      The following is the authors’ response to the original reviews.

      Recommendations for the authors:

      Reviewer #1 (Recommendations For The Authors): 

      The work is well performed and thoroughly convincing. 

      However, a few points could be improved, by adjusting the manuscript: 

      (1) The wording of the abstract is confusing for the casual reader. The initial impression is that the 2-copy complexes contain the majority of the PSD95 copies. This is not the case, as shown in panel cii. It would be important for the authors to explain in the abstract the exact percentage of molecules found within 2-copy complexes. 

      We have now amended the abstract, making it clear that it’s not most of the complexes.  

      (2) Did the authors find a sizeable population of 2-copy complexes by investigating wild-type proteins, using nanobody labeling (Figure S2)? It would be important to quantify and discuss these data. 

      It was not possible to perform this analysis on the wild-type proteins. The quantification would rely on all the PSD95 molecules being bound by the antibody, which we cannot guarantee. Furthermore, the nanobody labeling would need to be stoichiometric. 

      (3) The authors quote the separation value of 12.7 nm throughout their text, including the abstract. This may be somewhat misleading since the authors investigate the PSD95-GFP molecules, labeled using anti-GFP nanobodies. The large size of the two GFP molecules (~3 nm), and that of the nanobodies, will influence the readout. Two groups have already reported a separation of ~7-8 nm between neighboring PSD95 molecules in synapses, using PSD95 nanobodies, to minimize the linkage

      error: https://doi.org/10.1101/2022.08.03.502284 and https://doi.org/10.1101/2023.10.18.562 700  

      The difference observed here is consistent with an effect of the additional GFP moieties; the authors should cite these works (albeit they are now only provided as biorXiv pre-prints) and should mention this discrepancy, and its potential tagging-related explanation. 

      We have now referenced the work and referred to this in the discussion.

      (4) The authors may want to re-check the manuscript; some minor problems should be corrected, such as the mislabeling of Figure 2 and "Figure 5". 

      This has now been corrected.  

      Reviewer #2 (Recommendations For The Authors): 

      The authors suggest that the stability of the PSD95 dimeric complex correlates with memory formation. However, the turnover experiments were conducted only on three-month-old animals, which can be considered to be at a stage of lower synaptic functionality turnover. It would be appropriate to study dimer turnover during the memory formation period at three to four weeks of age, for example in comparison to the oldest mice. 

      Alternatively, it might be interesting to study the turnover in the hippocampus following exposure to a memory test. 

      Whilst potentially useful, these experiments are outside of the scope of this manuscript.   

      It is not clear whether the different turnover identified in various brain areas is statistically significant, as apparently no statistical analysis has been conducted. 

      The findings were significant, and the SI table containing the p-values has been emphasized further in the manuscript.  

      Reviewer #3 (Recommendations For The Authors): 

      (1) In the last paragraph of the Results section, it could be made clearer what the nature is of the correlation between PSD95 half-life and mixed supercomplexes to understand how to interpret this correlation. In the discussion, it is concluded that stable synapses have long protein lifetimes and slow replacement of scaffolding proteins. However, this is based on the correlation of protein lifetime and mixed supercomplexes in the cortex, which does not provide any evidence that this relation is true in single synapses or is specific for stable synapses. To make this statement, the authors could for instance directly correlate the stoichiometry of supercomplexes with the protein lifetime and size of individual synapses. 

      Unfortunately, we can’t directly measure the lifetime of each complex, and so it’s only possible to compare region-to-region. In doing so, we found that there was a correlation between the protein lifetime and the “mixed” population.  

      (2) Some essential parts seem missing: the materials and methods and Figure 2 are not included. Also, the numbering of figures is incorrect. Both in the figure legends and the text. 

      This has been added. 

      (3) Figure 1a could contain more details of the experimental procedures. For example, it could be made clearer how PSD95 supercomplexes are isolated from brain homogenate. 

      This is now presents in the methods. 

      (4) In Figure 1c, single molecules of PSD95 are identified using PALM with a resolution of 30 nm. However, in Figure 1d it is shown that PSD95 molecules reside on average 13 nm apart, indicating that a resolution of 30 nm is not sufficient to resolve single PSD95 molecules. In addition, it would be of interest to show the distribution of fluorophore separation (assessed with MINFLUX) of only the supercomplexes with two PSD95 molecules, since only these were used to calculate the average distance. 

      The 13 nm distance was measured using MINFLUX, as stated in the text. The fluorophore separation distances are shown in Figure 1dii.

      (5) In the introduction, the authors could be more explicit in their explanation of memory formation and storage and how the presented study contributes to that field. 

      We thank the reviewer for the suggestion, but feel that such a discussion in the introduction would detract from the main points of the manuscript.  

      (6) Throughout the manuscript the authors prominently cite their own work, but relevant literature on synaptic plasticity and synapse nanostructure (EM and super-resolution studies) is lacking. 

      Further references have now been added.  

      (7) The results depicted in Figure 4b would be easier to interpret if a stacked histogram (including error bars) was used. 

      We agree that the data could be presented in such a way, but that would prevent the results from the biological repeats, along with the variation, being presented.

    1. Author response:

      The following is the authors’ response to the previous reviews.

      Intro. 

      47-48 rewrite sentence

      This sentence has been rewritten as: Photoreceptor synapses are specialized with a vesicle-associated ribbon organelle and postsynaptic neurites of horizontal and bipolar cells that invaginate deep within the terminal

      Results 

      Major comment. Lines 100-103 

      The new rod data presented here looks like an n = 1. Neither the Results section nor Supp Fig S1, describe the number of cells used. Nor do the authors offer a statistical description with averages, etc.. In addition, the single traces are much improved over their previous study (Maddox et al eLife 2020), but the authors have not described any new approach or trick that improved their rod Ica. Neither Methods section nor Supp section describes the procedure for patching rods (solutions, or Vh which is critical for assessing T-type currents). 

      Suggestion, if more data exists, then present it. Otherwise, drop the argument. 

      The recording methodology for recording rods was like that for cones and this has been clarified in the Methods section (lines 725-752). Averaged data (n= at least 5 per group) and statistical analyses have been added to Fig.S1 (renamed Figure 2-Figure Supplement 1), and clearly show that no Ca2+ currents are present in the KI rods.

      Supp Fig S2. The legend needs to be fixed. Conversion to PDF file may have created these formatting errors. 

      This has been corrected (renamed Figure 3-Figure Supplement 2).

      Fig 8 a. The position of the light stimulus bar in the KO panel appears to be out of place, shifted too far to the left. 

      This has been corrected.

      Major comments. 219-221 

      The use of Fluo3-AM is not properly stated here. The text reads "cone pedicles filled with the Ca2+ indicator Fluo3". The wording used could be wrongly interpreted as: whole-cell filling of the cones via patch electrode. However, the Methods section describes bathing the retina in Fluo3-AM, which presumably fills PRs, HCs tips, Mueller glia and bpc dendrites. The Results section should acknowledge that the retina was loaded with Fluo3-AM. 

      The cell types, and their processes (Muellers, HCs, bpc, PRs), present in a cone pedicle ROI will likely contribute to the Fluo3 readout of Ca2+ in the OPL, because 1) the EM images in Fig 7 highlight how interdigitated the processes are with the presynapse, 2) all express Cav channels, and many if not all express L-Type Cavs in their processes (glia, HC, on-bcs and PRs), and 3) all are depolarized with the addition of high extracellular KCl. The inclusion of Isradipine will inhibit L-type Cavs on pre- and post-synaptic targets, failing to specifically isolate PR Ca2+. Furthermore, Glu Receptor blockers are used here, which would be a great idea if the cones were stimulated with light; however, KCl bypasses the excitatory synaptic pathway and depolarizes all processes within the ROI. Hence, all cellular parts in the ROI will potentially contribute to Fluo3-Ca2+ signals. 

      Suggestions for presentation of these findings. Ultimately your conclusion is suitable " 233 to 234...... Taken together, our results suggest that Cav3 channels nominally support Ca2+ signals and synaptic transmission in cones of G369i KI mice". The dramatic reduction in Fluo3-Ca2+ signals in the OPL G369i retinas (Fig 9) is a valuable finding for the following reasons: 1) the results do not show a clear compensation from intracellular stores that could potentially supersede the T-type currents in the G369i (which is an argument you make), and 2) there is a massive loss of Ca2+ influx in the OPL of G369i retinas. Since G369i is specific to the PRs, and only cones are present in the mutant G369i, the loss of Fluo3-Ca2+ signal in the mutant ROI reflects in large part loss of cone Fluo3-Ca2+ signals. Your findings illustrate the severity of the mutation, which has also been addressed in the various electro-physio sections of the MS. 

      Figure 9 also needs to be more clear about 1) the loading of the cells with AM-dye, and 2) the presence of glia, HCs and bc dendrites in the PNA demarcated ROIs. 

      We regret that we did not make this more clear, but our Fluo 3 loading protocol of whole retina followed by vertical slicing allowed for loading primarily of photoreceptors in the portion of the outer retina that we imaged. We clarified this with the following edit to the text (lines 220-226):

      “To test if the diminished HC light responses correlated with lower presynaptic Ca2+ signals in G369i KI cones, we performed 2-photon imaging of vertical slices prepared from whole retina that was incubated  with the Ca2+ indicator Fluo3-AM and  Alexa-568-conjugated peanut agglutinin (PNA) to demarcate regions of interest (ROIs) corresponding to cone pedicles. With this approach Fluo3 fluorescence was detected only in photoreceptors and ganglion cells and not inner retinal cell-types (e.g., horizontal cells, bipolar cells, Mueller cell soma). Thus, Ca2+ signals reported by Fluo3 fluorescence near PNA-labeling originated primarily from cones.”

      We also note that given the considerably larger volume of the cone pedicle relative to the postsynaptic neurites of horizontal and bipolar cells, as well as neighboring glia, it seems unlikely that the latter would contribute significantly to the isradipine-sensitive Ca2+ signal measured in the ROI above the PNA labeling. Moreover, to our knowledge the contribution of Cav1 L-type channels to postsynaptic Ca2+ signals in the dendritic tips of horizontal cells and bipolar cells has not been demonstrated.

    1. Author response:

      The following is the authors’ response to the current reviews.

      Reviewer #1 (Public Review):

      Major shortcomings include the unusual normalization strategies used for many experiments and the lack of quantification/statistical analyses for several experiments. Because of these omissions, it is difficult to conclude that the data justify the conclusions. The significance of the data presented is overstated, as many of the experiments presented confirm/support previously published work. The study provides a modest advance in the understanding of the complex issue of SHH membrane extraction.

      Major shortcomings include the unusual normalization strategies used for many experiments and the lack of quantification/statistical analysis for several experiments.

      This statement is not correct for the revised manuscript: The normalization strategies used are clearly described in the manuscript and are not unusual. Each experiment is now statistically analyzed.

      The significance of the data presented is overstated, as many of the experiments presented confirm/support previously published work.

      As reviewer 2 correctly points out, there are many competing models for Hedgehog release. Our study cannot possibly support them all - the reviewer's statement is therefore misleading. In fact, our careful biochemical analysis of the mechanistics of Dispatched- mediated Shh export supports only two of them: The model of proteolytic processing of Shh lipid anchors (shedding) and the model of lipoprotein-mediated Shh transport. In contrast, our study does not support the predominant model of Dispatched-mediated extraction of dual-lipidated Shh and delivery to Scube2, which is currently thought to act as a soluble Shh chaperone. We also do not support Dispatched function in Shh endocytic recycling and cytoneme loading, or any of the other models such as exosome-mediated or micelle Shh transport.

      Reviewer #2 (Public Review):

      A novel and surprising finding of the present study is the differential removal of Shh N- or C- terminal lipid anchors depending on the presence of HDL and/or Disp. In particular, the identification of a non-palmitoylated but cholesterol-modified Shh variant that associates with lipoproteins is potentially important. The authors use RP-HPLC and defined controls to assess the properties of processed forms of Shh, but their precise molecular identity remains to be defined. One caveat is the heavy reliance on overexpression of Shh in a single cell line. The authors detect Shh variants that are released independently of Disp and Scube2 in secretion assays, but these are excluded from interpretation as experimental artifacts. Therefore, it would be important to demonstrate key findings in cells that endogenously secrete Shh.

      We would like to respond as follows:

      The authors use RP-HPLC and defined controls to assess the properties of processed forms of Shh, but their precise molecular identity remains to be defined.

      This is the original reviewers statement regarding our original manuscript submission. We believe that the biochemical and functional data presented in the VOR clearly describe the molecular identity of solubilized Shh: it is monolipidated, lipoprotein-associated, and highly biologically active in two established Shh bioassays.

      One caveat is the heavy reliance on overexpression of Shh in a single cell line.

      As stated by reviewer 1, the strength of our work is the use of a bicistronic SHH-Hhat system to consistently generate doubly lipidated ligand to determine the amount and lipidation status of SHH released into cell culture media. This unique system therefore eliminates the artifacts of protein overexpression. We have also added two other cell lines to our VOR that produce the same results (including Panc1 cells that endogenously produce Shh, Supplementary Figure 1).

      The authors detect Shh variants that are released independently of Disp and Scube2 in secretion assays, but these are excluded from interpretation as experimental artifacts.

      As the reviewer correctly points out, these variants are released independently of Disp and Scube2, both of which are known as essential release factors in vivo. These variants are therefore by definition experimental artifacts. The forms we have included in our analysis are the alternative forms that are clearly dependent on Dispatched and Scube2 for their release - as shown in the first figure in the manuscript, and in pretty much every other figure after that.


      The following is the authors’ response to the previous reviews.

      Reviewer #1 (Public Review):

      Key shortcomings include the unusual normalization strategies used for many experiments and the lack of quantification/statistical analyses for several experiments.

      In the updated version of the paper, we have addressed all of this reviewer's criticisms. Most importantly, we have performed several additional experiments to address the concern that unusual normalization strategies were used in our paper and that quantification and statistical analyses were lacking for several experiments. We have now analyzed the full set of release conditions for Shh and engineered proteins from Disp-expressing n.t. control cells and Disp-/- cells both in the presence and absence of Scube2 (Figure 1A'-D', Figure 2E added to the paper, Figure 3B'-D', Figure 5C and Figure S2F-H). Previously, we had only quantified protein release from n.t. controls and Disp-/- cells in the presence but not in the absence of Scube2 under serum-depleted conditions. Quantifications of serum-free protein release and Shh release under conditions ranging from 0.05% FCS to 10% FCS were completely missing from the earlier versions of the manuscript, but have now been added to our paper. In addition, we have reanalyzed all of the data sets in the above figures, as well as Figures 2C and S1B, to address the issue of "unusual normalization strategies": unlike previous assays in which the highest amount of protein detected in the media was set to 100% and all other proteins in that experiment were expressed relative to that value, we now directly compare the relative amounts of cellular and corresponding solubilized proteins as a method to quantify release without the need for data normalization (Figs. 1A'-D', 2C,E, 3B'-D', E, 5C, Fig. S1B, S2F-H).

      We have also repeated the qPCR analyses in C3H10T1/2 cells and now show that the same Shh/C25AShh activities can be observed when using another Shh responsive cell line, NIH3T3 cells (Fig. 4B, 6B, fig. S5B).

      We would like to point out that if the criticism refers to the presentation of our RP-HPLC and SEC data, the normalization of the strongest eluted protein signal to 100% for all proteins tested is necessary to put their behavior in a clearer relationship. This is because only the relative positions of protein elution, and not their amounts, are important in these experiments.

      The significance of the data provided is overstated because many of the presented experiments confirm/support previously published work.

      To mitigate the first reviewer's comment that the significance of the data presented is overstated, we now clearly distinguish between our novel results and the known aspect of Hh release on lipoproteins throughout our paper. We now clearly describe what is new and important in our paper: First, contrary to the general perception in the field, Disp and Scube2 are not sufficient to solubilize Shh, casting doubt on the currently accepted model that Scube2 accepts dual-lipidated Shh from Disp and transports it to the receptor Ptch. Second, lipoproteins shift dual Shh processing to N-terminal peptide processing only to generate different soluble Hh forms with different activities (as shown in Figure 4C). Third, and again contrary to popular belief, this new release mode does not inactivate Shh, as we now show in two established cellular assays for Hh biofunction (Figures 4A-C, 5B'', 6B and S5C-G). Fourth, and most importantly, we show that spatiotemporally controlled, Disp-, Scube2- and HDL-mediated Shh release absolutely requires dual lipidation of the membrane-associated Shh precursor prior to its release. This finding (as shown in Figures 1 and S2) changes the interpretation of previously published in vivo data that have long been interpreted as evidence for the requirement of dual Shh lipidation for full receptor binding and activation.

      The study provides a modest advance in our understanding of the complex issue of Shh membrane extraction.

      Although we agree that our results integrate our novel observations into previously established concepts of Hh release and trafficking, we also hope that our data cast well-founded doubt on the current view that the issue of Hh release and trafficking is largely resolved by the model of Disp-mediated Shh hand-over to Scube2 and then to Ptch, which requires interactions with both Shh lipids. Our data show that this is clearly not the case in the presence of lipoproteins. Thus, the significance of our data is that models of Shh lipid-regulated signaling to Ptch obtained using the dual-lipidated Shh precursor prior to its Disp- and Scube2-mediated conversion into a delipidated or monolipidated, HDL-associated soluble ligand are likely to describe a non-physiological interaction. Instead, our work describes a highly bioactive soluble ligand with only one lipid still attached, which has not been described before in the literature. The in vivo endpoint analyses presented in Fig. S8 suggest that this new protein variant is likely to play an important role during development.

      Reviewer #2 (Public Review):

      The precise molecular identity (of the released Shh) remains to be defined.

      We would like to respond that the direct comparison of soluble proteins and their well-defined double-lipidated precursors side-by-side in the same experiment, as shown in our paper, determines all relevant molecular changes in the Shh release process. Most importantly, we show by SDS-PAGE and RP-HPLC that HDL restricts Shh processing to the N-terminus and that the absence of HDL results in double processing of Shh during its release. We also show by SEC that the C-terminus binds the protein to HDL. In addition, the fly experiments confirm the requirement for N-terminal Hh processing, but not for processing of the C-terminal peptide, and suggest that the N-terminal Cardin-Weintraub sequence replaced by the functionally blocking tag represents the physiological cleavage site.

      It would be important to demonstrate key findings in cells that secrete Shh endogenously.

      We now confirm the key findings of our study in Panc1 cells that endogenously produce and secrete Shh: As shown in Fig. S1D, we find that soluble proteins are processed but retain the C-cholesterol, which we now directly confirm by RP-HPLC (Fig. S4F-H). The in vivo analyses shown in Fig. S8 suggest that the key finding - that N-terminal but not C-terminal Hh shedding is required for release - can be supported, at least in the fly: here, Hh variants impaired in their ability to be processed N-terminally strongly repress the endogenous protein, whereas the same protein impaired in its ability to be processed C-terminally does not.

      The authors detect Shh variants that are expressed independently of Disp and Scube2 in secretion assays, but are excluded from interpretation as experimental artifacts.

      We agree with the reviewer's criticism that the amounts of Shh released independently of Disp and Scube2 in secretion assays were not quantified and analyzed statistically to justify their proposed status as not physiologically relevant. We now show that these forms are indeed secretion artifacts (Fig. 3E and Fig. S2F-H show quantification of the lower electrophoretic mobility protein fraction (i.e., the "top" band representing the double-lipidated soluble protein fraction)) because this fraction is released independently of Disp and Scube2.

    1. Author response:

      The following is the authors’ response to the original reviews.

      Public Reviews:

      Reviewer #1 (Public Review):

      Summary:

      This interesting study explores the mechanism behind an increased susceptibility of daf-18/PTEN mutant nematodes to paralyzing drugs that exacerbate cholinergic transmission. The authors use state-of-theart genetics and neurogenetics coupled with locomotor behavior monitoring and neuroanatomical observations using gene expression reporters to show that the susceptibility occurs due to low levels of DAF-18/PTEN in developing inhibitory GABAergic neurons early during larval development (specifically, during the larval L1 stage). DAF-18/PTEN is convincingly shown to act cell-autonomously in these cells upstream of the PI3K-PDK-1-AKT-DAF-16/FOXO pathway, consistent with its well-known role as an antagonist of this conserved signaling pathway. The authors exclude a role for the TOR pathway in this process and present evidence implicating selectivity towards developing GABAergic neurons. Finally, the authors show that a diet supplemented with a ketogenic body, β-hydroxybutyrate, which also counteracts the PI3K-PDK-1-AKT pathway, promoting DAF-16/FOXO activity, partially rescues the proper development (morphology and function) of GABAergic neurons in daf-18/PTEN mutants, but only if the diet is provided early during larval development. This strongly suggests that the critical function of DAF18/PTEN in developing inhibitory GABAergic neurons is to prevent excessive PI3K-PDK-1-AKT activity during this critical and particularly sensitive period of their development in juvenile L1 stage worms. Whether or not the sensitivity of GABAergic neurons to DAF-18/PTEN function is a defining and widespread characteristic of this class of neurons in C. elegans and other animals, or rather a particularity of the unique early-stage GABAergic neurons investigated remains to be determined.

      Strengths:

      The study reports interesting and important findings, advancing the knowledge of how daf-18/PTEN and the PI3K-PDK-1-AKT pathway can influence neurodevelopment, and providing a valuable paradigm to study the selectivity of gene activities towards certain neurons. It also defines a solid paradigm to study the potential of dietary interventions (such as ketogenic diets) or other drug treatments to counteract (prevent or revert?) neurodevelopment defects and stimulate DAF-16/FOXO activity.

      Weaknesses:

      (1) Insufficiently detailed methods and some inconsistencies between Figure 4 and the text undermine the full understanding of the work and its implications.

      The incomplete methods presented, the imprecise display of Figure 4, and the inconsistency between this figure and the text, make it presently unclear what are the precise timings of observations and treatments around the L1 stage. What exactly do E-L1 and L1-L2 mean in the figure? The timing information is critical for the understanding of the implications of the findings because important changes take place with the whole inhibitory GABAergic neuronal system during the L1 stage into the L2 stage. The precise timing of the events such as neuronal births and remodelling events are welldescribed (e.g., Figure 2 in Hallam and Jin, Nature 1998; Fig 7 in Mulcahy et al., Curr Biol, 2022). Likewise, for proper interpretation of the implication of the findings, it is important to describe the nature of the defects observed in L1 larvae reported in Figure 1E - at present, a representative figure is shown of a branched commissure. What other types of defects, if any, are observed in early L1 larvae? The nature of the defects will be informative. Are they similar or not to the defects observed in older larvae?

      We thank the reviewer for highlighting these areas for improvement. We have updated and clarified the timing of observation in the text, figures, and methodology section accordingly.

      All experiments were conducted using age-synchronized animals. Gravid worms were placed on NGM plates and removed after two hours. The assays were then carried out on animals that hatched from the eggs laid during this specific timeframe.

      Regarding the detailed timings outlined in the original Figure 4 (now Figure 5 in the revised version), we provided the following information in the revised version: For experiments involving continuous exposure to βHB throughout development, the gravid worms were placed on NGM plates containing the ketone body and removed after two hours. Therefore, this exposure covered the ex-utero embryonic development period up to the L4-Young adult stage when the experiments were conducted.

      In experiments involving exposure at different developmental stages as those depicted in Figure 4 of the original version, (now Figure 5, revised version), animals were transferred between plates with and without βHB as required. We exposed daf-18/PTEN mutant animals to βHB-supplemented diets for 18-hour periods at different developmental stages (Figure 5A, revised version). The earliest exposure occurred during the 18 hours following egg laying, covering ex-utero embryonic development and the first 8-9 hours of the L1 stage. The second exposure period encompassed the latter part of the L1 stage, the entire L2 stage, and most of the L3 stage. The third exposure spanned the latter part of the L3 stage (~1-2 hours), the entire L4 stage, and the first 6-7 hours of the adult stage.

      All this information has been conveniently included in Figure 5, text (Page13, lines 259-276), and in methodology (Page 4, Lines 85-90, Revised Methods and Supplementary information) of the revised manuscript.

      In response to the reviewer's suggestion, we have also included photos of daf-18 worms at the L1 stage (30 min/1h post-hatching). Defects are already present at this early stage, such as handedness and abnormal branching commissures, which are also observed in adult worm neurons (see Supplementary Figure 4, revised version). 

      These defects manifest in DD neurons shortly after larval birth. The prevalence of animals with errors is higher in L4 worms (when both VDs and DDs are formed) compared to early L1s (Figures 3 C-E and Supplementary Figure 4, revised version). This suggests that defects in VD neurons also occur in daf-18 mutants. Indeed, when we analyzed the neuronal morphology of several wild-type and daf-18 mutant animals, we found defects in the commissures corresponding to both DD and VD neurons (Supplementary Figure 3, revised version). 

      These data are now included in the revised version (Results (Page 10, lines 177-196), Discussion (Pages 14-16), Main Figure 3, and Supplementary Figures 3, 4 and 7 revised version)

      (2) The claim of proof of concept for a reversal of neurodevelopment defects is not fully substantiated by data.

      The authors state that the work "constitutes a proof of concept of the ability to revert a neurodevelopmental defect with a dietary intervention" (Abstract, Line 56), however, the authors do not present sufficient evidence to distinguish between a "reversal" or prevention of the neurodevelopment defect by the dietary intervention. This clarification is critical for therapeutic purposes and claims of proof-of-concept. From the best of my understanding, reversal formally means the defect was present at the time of therapy, which is then reverted to a "normal" state with the therapy. On the other hand, prevention would imply an intervention that does not allow the defect to develop to begin with, i.e., the altered or defective state never arises. In the context of this study, the authors do not convincingly show reversal. This would require showing "embryonic" GABAergic neuron defects or showing convincing data in newly hatched L1 (0-1h), which is unclear if they do so or not, as I have failed to find this information in the manuscript. Again, the method description needs to be improved and the implications can be very different if the data presented in Figure 2D-E regard newly born L1 animals (0-1h) or L1 animals at say 5-7h after hatching. This is critical because the development of the embryonically-born GABAergic DD neurons, for instance, is not finalized embryonically. Their neurites still undergo outgrowth (albeit limited) upon L1 birth (see DataS2 in Mulcahy et al., Curr Biol 2022), hence they are susceptible to both committing developmental errors and to responding to nutritional interventions to prevent them. In contrast to embryonic GABAergic neurons, embryonic cholinergic neurons (DA/DB) do not undergo neurite outgrowth post-embryonically (Mulcahy et al., Curr Biol 2022), a fact which could provide some mechanistic insight considering the data presented. However, neurites from other post-embryonically-born neurons also undergo outgrowth postembryonically, but mostly during the second half of the L1 stage following their birth up to mid-L2, with significant growth occurring during the L1-L2 transition. These are the cholinergic (VA/VB and AS neurons) and GABAergic (VD) neurons. The fact that AS neurons undergo a similar amount of outgrowth as VD neurons is informative if VD neurons are or are not susceptible to daf-18/PTEN activity. Independently, DD neurons are still quite unique on other aspects (see below), which could also bring insight into their selective response.

      Finally, even adjusting the claim to "constitutes a proof-of-concept of the ability of preventing a neurodevelpmental defect with a dietary intervention" would not be completely precise, because it is unclear how much this work "constitutes a proof of concept". This is because, unless I misunderstood something, dietary interventions are already applied to prevent neurodevelopment defects, such as when folic acid supplementation is recommended to pregnant women to prevent neural tube defects in newborns.

      Thank you very much for pointing out this issue and highlighting the need to further investigate the ameliorative capacity of βHB on GABAergic defects in daf-18 mutants. In the revised version, we have included experiments to address this point.

      Our microscopy analyses strongly indicate that the development of DD neurons is affected, with errors observed as early as one-hour post-hatching (Main Figure 3, and Supplementary Figures  4 and 7, revised version). Additionally, based on the position of the commissures in L4s, our results strongly suggest that VD neurons are also affected (Supplementary Figure 3, revised version). Both, the frequency of animals with errors and the number of errors per animal are higher in L4s compared to L1 larvae (Main Figures 3,  and Supplementary Figure 4 and 7, revised version). It is very likely that the errors in VD neurons, which are born in the late L1 stage, are responsible for the higher frequency of defects observed in L4 animals. 

      As the reviewer noted, GABAergic DD neurons, which are born embryonically, do not complete their development during the embryonic stages. Some defects in DD neurons may arise during the postembryonic period. Following the reviewer's suggestion, we analyzed L1 larvae at different times before the appearance of VDs (1 hour post-hatching and 6 hours post-hatching). We did not observe an increase in error prevalence, suggesting that DD defects in daf-18 mutants are mostly embryonic (Supplementary Fig 4B, Revised Version). 

      Our findings suggest that βHB's enhancement is not due to preventive effects in DDs, as defects persist in newly hatched larvae regardless of βHB presence (Supplementary Figure 7, revised version), and postembryonic DD growth does not introduce new errors (Supplementary Figure 4, revised version). This lack of preventive effect could be due to βHB's limited penetration into the embryonic environment. Unlike early L1s, significant improvement occurs in L4s upon βHB early exposure (Supplementary Figure 7, revised version). This could be explained by a reversing effect on malformed DD neurons and/or a protective influence on VD neuron development. While we cannot rule out the first option, even if all errors in DDs in L1 were repaired (which is very unlikely), it wouldn't explain the level of improvement in L4 (Supplementary Figure 7, revised version). Therefore, we speculate that VDs may be targeted by βHB. The notion that exposure to βHB during early L1 can ameliorate defects in neurons primarily emerging in late L1s (VDs) is intriguing. We may hypothesize that residual βHB or a metabolite from prior exposure could forestall these defects in VD neurons. Notably, βHB has demonstrated a capacity for long-lasting effects through epigenetic modifications (Reviewed in He et al, 2023, https://doi.org/10.1016%2Fj.heliyon.2023.e21098). More work is needed to elucidate the underlying fundamental mechanisms regarding the ameliorating effects of βHB supplementation. We have now discussed these possibilities under discussion (Page 17, lines 369-383, revised version).

      We agree with the reviewer that the term "reversal" is not accurate, and we have avoided using this terminology throughout the text. Furthermore, in the title, we have decided to change the word "rescue" to "ameliorate," as our experiments support the latter term but not the former. Additionally, the reviewer is correct that folic acid administration to pregnant women is already a metabolic intervention to prevent neural tube defects. In light of this, we have avoided claiming this as proof of concept in the revised manuscript 

      (3) The data presented do not warrant the dismissal of DD remodeling as a contributing factor to the daf-18/PTEN defects.

      Inhibitory GABAergic DD neurons are quite unique cells. They are well-known for their very particular property of remodeling their synaptic polarity (DD neurons switch the nature of their pre- and postsynaptic targets without changing their wiring). This process is called DD remodeling. It starts in the second half of the L1 stage and finishes during the L2 stage. Unfortunately, the fact that the authors find a specific defect in early GABAergic neurons (which are very likely these unique DD neurons) is not explored in sufficient detail and depth. The facts that these neurons are not fully developed at L1, that they still undergo limited neurite growth, and that they are poised for striking synaptic plasticity in a few hours set them apart from the other explored neurons, such as early cholinergic neurons, which show a more stable dynamics and connectivity at L1 (see Mulcahy et al., Curr Biol 2022).

      The authors use their observation that daf-18/PTEN mutants present morphological defects in GABAergic neurons prior to DD remodeling to dismiss the possibility that the DAF-18/PTEN-dependent effects are "not a consequence of deficient rearrangement during the early larval stages". However, DD remodeling is just another cell-fate-determined process and as such, its timing, for instance, can be affected by mutations in genes that affect cell fates and developmental decisions, such as daf-18 and daf-16, which affect developmental fates such as those related with the dauer fate. Specifically, the authors do not exclude the possibility that the defects observed in the absence of either gene could be explained by precocious DD remodeling. Precocious DD remodeling can occur when certain pathways, such as the lin-14 heterochronic pathway, are affected. Interestingly, lin-14 has been linked with daf16/FOXO in at least two ways: during lifespan determination (Boehm and Slack, Science 2005) and in the

      L1/L2 stages via the direct negative regulation of an insulin-like peptide gene ins-33 (Hristova et al., Mol Cell Bio 2005). It is likely that the prevention of DD dysfunction requires keeping insulin signaling in check (downregulated) in DD neurons in early larval stages, which seems to coincide with the critical timing and function of daf-18/PTEN. Hence, it will be interesting to test the involvement of these genes in the daf-18/daf-16 effects observed by the authors.

      This is another interesting point raised by the reviewer. We have demonstrated that defects manifest in early L1 (30 min-1 hour post-hatching) which corresponds to a pre-remodeling time in wild-type worms.

      We acknowledge the possibility of early remodeling in specific mutants as pointed out by the reviewer.

      However, the following points suggest that the effects of these mutations may extend beyond the particularity of DD remodeling: i) Our experiments also show defects in VD neurons in daf-18 mutants (Supplementary Figure 3, revised version), as discussed in our previous response. These neurons do not undergo significant remodeling during their development. ii) DAF-18 and DAF-16 deficiencies produce neurodevelopmental alteration on other Non-Remodeling Neurons: Severe neurite defects in neurons that are nearly fully formed at larval hatching, such as AIY in daf-18 and daf-16 mutants, have been previously reported (Christensen et al., 2011). Additionally, the migration of another neuron, HSN, is severely affected in these mutants (Kennedy et al., 2013). iii) To the best of our knowledge, DD remodeling only alters synaptic polarity without forming new commissures or significant altering the trajectory of the formed ones. Thus, it is unlikely (though not impossible) for remodeling defects to cause the observed commissural branching and handedness abnormalities in DD neurons. Therefore, we think that the impact of daf-18 mutations on GABAergic neurons is not primarily linked to DD remodeling but extends to various neuron types. It is intriguing and requires further exploration in the future, the apparent resilience of cholinergic motor neurons to these mutations. This resilience is not limited to daf18/PTEN animals since mutants in certain genes expressed in both neuron types (such as neuronal integrin ina-1 or eel-1, the C. elegans ortholog of HUWE1) alter the function or morphology of GABAergic neurons but not cholinergic motor neurons (Kowalski, J. R. et al. Mol Cell Neurosci 2014; Oliver, D. et al. J Dev Biol (2019); Opperman, K. J. et al. Cell Rep 2017). These points are discussed in the manuscript (Discussion, page 15, lines 311-322, revised version) and reveal the existence of compensatory or redundant mechanisms in these excitatory neurons, rendering them much more resistant to both morphological and functional abnormalities.

      Discussion on the impact of the work on the field and beyond:

      The authors significantly advance the field by bringing insight into how DAF-18/PTEN affects neurodevelopment, but fall short of understanding the mechanism of selectivity towards GABAergic neurons, and most importantly, of properly contextualizing their findings within the state-of-the-art C. elegans biology.

      For instance, the authors do not pinpoint which type of GABAergic neuron is affected, despite the fact that there are two very well-described populations of ventral nerve cord inhibitory GABAergic neurons with clear temporal and cell fate differences: the embryonically-born DD neurons and the postembryonically-born VD neurons. The time point of the critical period apparently defined by the authors (pending clarifications of methods, presentation of all data, and confirmation of inconsistencies between the text and figures in the submitted manuscript) could suggest that DAF-18/PTEN is required in either or both populations, which would have important and different implications. An effect on DD neurons seems more likely because an image is presented (Figure 2D) of a defect in an L1 daf-18/PTEN mutant larva with 6 neurons (which means the larva was processed at a time when VD neurons were not yet born or expressing pUnc-47, so supposedly it is an image of a larva in the first half of the L1 stage (0-~7h?)). DD neurons are also likely the critical cells here because the neurodevelopment errors are partially suppressed when the ketogenic diet is provided at an "early" L1 stage, but not later (e.g., from L2-L3, according to the text, L2-L4 according to the figure? ).

      Thank you for this insightful input. As previously mentioned, we conducted experiments in this revision to clarify the specificity of GABAergic errors in daf-18/PTEN mutants, in particular, whether they affect DDs, VDs, or both. Our results suggest that commissural defects are not limited to DD neurons but also occur in VD neurons (Supplementary Figure 3). Regarding the effect of βHB, our findings suggest that VD neurons are targets of βHB action. As mentioned in the previous response and the discussion section (Page 17, lines 369-383, revised version), we might speculate that lingering βHB or a metabolite from prior exposure could mitigate these defects in VD neurons that are born in Late L1s-Early L2s. Additionally, βHB has been noted for its capacity to induce long-term epigenetic changes. Therefore, it could act on precursor cells of VD neurons, with the resulting changes manifesting during VD development independently of whether exposure has ceased. All these possibilities are now discussed in the manuscript.

      Acknowledging that our work raises several questions that we aim to address in the future, we believe our manuscript provides valuable information regarding how the PI3K pathway modulates neuronal development and how dietary interventions can influence this process.

      This study brings important contributions to the understanding of GABAergic neuron development in C. elegans, but unfortunately, it is justified and contextualized mostly in distantly-related fields - where the study has a dubious impact at this stage rather than in the central field of the work (post-embryonic development of C. elegans inhibitory circuits) where the study has stronger impact. This study is fundamentally about a cell fate determination event that occurs in a nutritionally-sensitive

      developmental stage (post-embryonic L1 larval stage) yet the introduction and discussion are focused on more distantly related problems such as excitatory/inhibitory (E/I) balance, pathophysiology of human diseases, and treatments for them. Whereas speculation is warranted in the discussion, the reduced indepth consideration of the known biology of these neurons and organisms weakens the impact of the study as redacted. For instance, the critical role of DAF-18/PTEN seems to occur at the early L1 larval stage, a stage that is particularly sensitive to nutritional conditions. The developmental progression of L1 larvae is well-known to be sensitive to nutrition - eg, L1 larvae arrest development in the absence of food, something that is explored in nematode labs to synchronize animals at the L1 stage by allowing embryos to hatch into starvation conditions (water). Development resumes when they are exposed to food. Hence, the extensive postembryonic developmental trajectory that GABAergic neurons need to complete is expected to be highly susceptible to nutrition. Is it? The sensitivity towards the ketogenic diet intervention seems to favor this. In this sense, the attribution of the findings to issues with the nutrition-sensitive insulin-like signaling pathway seems quite plausible, yet this possibility seems insufficiently considered and discussed.

      We greatly appreciate the reviewer's emphasis on the sensitivity of the L1 stage to nutritional status. As the reviewer points out, C. elegans adjusts its development based on food availability, potentially arresting development in L1 in the absence of food. It is therefore reasonable that both the completion of DD neuron trajectories and the initial development steps of VD neurons are particularly sensitive to dietary modulation of the insulin pathway, in which both DAF-18 and DAF-16 play roles. This important point has also been included in the discussion (Page 18, lines 384-407, revised version).

      Finally, the fact that imbalances in excitatory/inhibitory (E/I) inputs are linked to Autism Spectrum Disorders (ASD) is used to justify the relevance of the study and its findings. Maybe at this stage, the speculation would be more appropriate if restricted to the discussion. In order to be relevant to ASD, for instance, the selectivity of PTEN towards inhibitory neurons should occur in humans too. However, at present, the E/I balance alteration caused by the absence of daf-18/PTEN in C. elegans could simply be a coincidence due to the uniqueness of the post-embryonic developmental program of GABAergic neurons in C. elegans. To be relevant, human GABAergic neurons should also pass through a unique developmental stage that is critically susceptible to the PI3K-PDK1-AKT pathway in order for DAF18/PTEN to have any role in determining their function. Is this the case? Hence, even in the discussion, where the authors state that "this study provides universally relevant information on.... the mechanisms underlying the positive effects of ketogenic diets on neuronal disorders characterized by GABA dysfunction and altered E/I ratios", this claim seems unsubstantiated as written particularly without acknowledging/mentioning the criteria that would have to be fulfilled and demonstrated for this claim to be true.

      Our results suggest that defects in GABAergic neurons are not limited to DDs, which, as the reviewer rightly notes, are quite unique in their post-embryonic development primarily due to the synaptic remodeling process they undergo. These defects also extend to VD neurons, which do not exhibit significant developmental peculiarities once they are born. Therefore, we think that the defects are not specific to the developmental program of DD neurons but are more related to all GABAergic motoneurons. Additionally, the observation of defects in non-GABAergic neurons in C. elegans daf-18 mutants supports the hypothesis that the role of daf-18 is not limited to DD neurons (Christensen et al., 2011; Kennedy et al., 2013).

      In mammals, Pten conditional knockout (cKO) animals have been extensively studied for synaptic connectivity and plasticity, revealing an imbalance between synaptic excitation and inhibition (E/I balance) (Reviewed in Rademacher and Eickholt, 2019, Cold Spring Harbor Perspect Med, https://doi.org/10.1101%2Fcshperspect.a036780). This imbalance is now widely accepted as a key pathological mechanism linked to the development of ASD-related behavior (Lee et al, 2017; Biological Psychiatry, https://doi.org/10.1016/j.biopsych.2016.05.011) . The importance of PTEN in the development of GABAergic neurons in mammals is well-documented. For instance, embryonic PTEN deletion from inhibitory neurons impacts the establishment of appropriate numbers of parvalbumin and somatostatin-expressing interneurons, indicating a central role for PTEN in inhibitory cell development (Vogt et al, 2015, Cell Rep, https://doi.org/10.1016%2Fj.celrep.2015.04.019). Additionally, conditional PTEN knockout in GABAergic neurons is sufficient to generate mice with seizures and autism-related behavioral phenotypes (Shin et al, 2021, Molecular Brain, https://doi.org/10.1186%2Fs13041-02100731-8). Moreover, while mice in which PV GABAergic neurons lacked both copies of Pten experienced seizures and died, heterozygous animals (PV-Pten+/−) showed impaired formation of perisomatic inhibition (Baohan et al, 2016, Nature Comm, OI: 10.1038/ncomms12829). Therefore, there is substantial evidence in mammals linking PTEN mutations to neurodevelopmental disorders in general and affecting GABAergic neurons in particular. Hence, we believe that the role of daf-18/PTEN in GABAergic development could be a more widespread phenomenon across the animal kingdom rather than a specific process unique to C. elegans.

      Beyond the points discussed, we have addressed the reviewer's comment regarding the last sentence of the abstract. We have revised it to more cautiously frame the relationship between our findings, ASD, and mammalian neurodevelopmental disorders.

      Reviewer #2 (Public Review):

      Summary:

      Disruption of the excitatory/inhibitory (E/I) balance has been reported in Autism Spectrum Disorders

      (ASD), with which PTEN mutations have been associated. Giunti et al choose to explore the impact of PTEN mutations on the balance between E/I signaling using as a platform the C. elegans neuromuscular system where both cholinergic (E) and GABAergic (I) motor neurons regulate muscle contraction and relaxation. Mutations in daf-18/PTEN specifically affect morphologically and functionally the GABAergic (I) system, while leaving the cholinergic (E) system unaffected. The study further reveals that the observed defects in the GABAergic system in daf-18/PTEN mutants are attributed to reduced activity of DAF-16/FOXO during development.

      Moreover, ketogenic diets (KGDs), known for their effectiveness in disorders associated with E/I imbalances such as epilepsy and ASD, are found to induce DAF-16/FOXO during early development. Supplementation with β-hydroxybutyrate in the nematode at early developmental stages proves to be both necessary and sufficient to correct the effects on GABAergic signaling in daf-18/PTEN mutants.

      Strengths:

      The authors combined pharmacological, behavioral, and optogenetic experiments to show the

      GABAergic signaling impairment at the C. elegans neuromuscular junction in DAF-18/PTEN and DAF-

      16/FOXO mutants. Moreover, by studying the neuron morphology, they point towards

      neurodevelopmental defects in the GABAergic motoneurons involved in locomotion. Using the same set of experiments, they demonstrate that a ketogenic diet can rescue the inhibitory defect in the daf18/PTEN mutant at an early stage.

      Weaknesses:

      The morphological experiments hint towards a pre-synaptic defect to explain the GABAergic signaling impairment, but it would have also been interesting to check the post-synaptic part of the inhibitory neuromuscular junctions such as the GABA receptor clusters to assess if the impairment is only presynaptic or both post and presynaptic.

      Moreover, all observations done at the L4 stage and /or adult stage don't discriminate between the different GABAergic neurons of the ventral nerve cord, ie the DDs which are born embryonically and undergo remodeling at the late L1 stage, and VDs which are born post-embryonically at the end of the L1 stage. Those additional elements would provide information on the mechanism of action of the FOXO pathway and the ketone bodies.

      Thank you for your insightful suggestions. 

      This is an initial study that serves as a cornerstone, demonstrating the sensitivity of GABAergic neuron development to alterations in the PI3K pathway and how these alterations can be mitigated by a dietary intervention with a ketone body. While we have determined that the transcription factor DAF-16/FOXO is essential in the neurodevelopmental process and is the target of ketone bodies to alleviate defects, there are still underlying mechanisms to be elucidated. This is only the first step that opens many avenues for further investigation, including the study of post-synaptic partners.

      While our current study primarily focuses on neuronal alterations without delving into potential postsynaptic effects, we do plan to investigate this aspect in future research. This includes examining GABAergic receptors as well as cholinergic receptors, as exacerbation of cholinergic signaling cannot be ruled out. To conduct a comprehensive study of post-synaptic structure and functionality, we would need strains with fluorescent markers for both pre- and post-synaptic components (such as rab-3, unc-49, unc29, acr-16 fusion to GFP or mCherry). Unfortunately, most of these strains are not currently available in our laboratory. Unlike the US or Europe, acquiring these strains from the C. elegans CGC repository in Argentina is challenging due to common customs delays, which require significant time and resources to navigate. Discussions at the Latin American C. elegans conference with CGC administrators, such as Ann Rougvie, have been initiated to address this issue, but a solution has not been reached yet.  Additionally, to analyze post-synaptic functionality in-depth, studying the response to perfusion with various agonists using electrophysiology would be beneficial. We are in the process of acquiring the capability to conduct electrophysiology experiments in our laboratory, but progress is slow due to limited funding.

      While we believe these experiments are very informative, they will require a considerable amount of time due to our current circumstances. We consider them non-essential to the primary message of the paper, which focuses on neuronal developmental defects leading to functional alterations in daf-18/PTEN mutants and the novel finding that these can be mitigated by supplementing food with hydroxybutyrate. We will study the structure and functionality of the post-synapse in our future projects and also plan to extend this investigation to mutants with deficiencies in genes closely related to neurodevelopmental defects, such as neuroligin, neurexin, or shank-3, which have been implicated in synaptic architecture.

      We also agree that discriminating between DD and VD neurons provides significant insights into the neurodevelopmental phenomena dependent on the FOXO pathway and the action of βHB. In this revised version, we present evidence that not only DD neurons are affected but also VD neurons (see

      Supplementary Figure 3, revised version). This allows us to suggest that daf-18 affects the development of GABAergic neurons regardless of whether they are born embryonically (DDs) or post-embryonically (VDs) (see also our response to the previous reviewer). We hope to distinguish the defects observed in each type of neuron in future studies. For this, we would need to use strains specifically marked in one neuronal type or another, which, for the same reasons mentioned earlier, would take a considerable amount of time under current conditions. 

      Conclusion:

      Giunti et al provide fundamental insights into the connection between PTEN mutations and neurodevelopmental defects through DAF-16/FOXO and shed light on the mechanisms through which ketogenic diets positively impact neuronal disorders characterized by E/I imbalances.  

      Reviewer #3 (Public Review):

      Summary:

      This is a conceptually appealing study by Giunti et al in which the authors identify a role for PTEN/daf-18 and daf-16/FOXO in the development of inhibitory GABA neurons, and then demonstrate that a diet rich in ketone body β-hydroxybutyrate partially suppresses the PTEN mutant phenotypes. The authors use three assays to assess their phenotypes: (1) pharmacological assays (with levamisole and aldicarb); (2) locomotory assays and (3) cell morphological assays. These assays are carefully performed and the article is clearly written. While neurodevelopmental phenotypes had been previously demonstrated for PTEN/daf-18 and daf-16/FOXO (in other neurons), and while KB β-hydroxybutyrate had been previously shown to increase daf-16/FOXO activity (in the context of aging), this study is significant because it demonstrates the importance of KB β-hydroxybutyrate and DAF-16 in the context of neurodevelopment. Conceptually, and to my knowledge, this is the first evidence I have seen of a rescue of a developmental defect with dietary metabolic intervention, linking, in an elegant way, the underpinning genetic mechanisms with novel metabolic pathways that could be used to circumvent the defects.

      Strengths:

      What their data clearly demonstrate, is conceptually appealing, and in my opinion, the biggest contribution of the study is the ability of reverting a neurodevelopmental defect with a dietary intervention that acts upstream or in parallel to DAF-16/FOXO.

      Weaknesses:

      The model shows AKT-1 as an inhibitor of DAF-16, yet their studies show no differences from wildtype in akt-1 and akt-2 mutants. AKT is not a major protein studied in this paper, and it can be removed from the model to avoid confusion, or the result can be discussed in the context of the model to clarify interpretation.

      Thank you very much for the suggestion. We agree with the reviewer's appreciation that the study of AKT's action itself is too limited in this study to draw conclusions that would allow its inclusion in the proposed model. Therefore, following the reviewer's suggestion, we have removed this protein from our model

      When testing additional genes in the DAF-18/FOXO pathway, there were no significant differences from wild-type in most cases. This should be discussed. Could there be an alternate pathway via DAF-18/DAF16, excluding the PI3K pathway or are there variations in activity of PI3K genes during a ketogenic diet that are hard to detect with current assays?

      Thank you for bringing up this point. Our pharmacological experiments indeed demonstrate that all mutants associated with an exacerbation of the PI3K pathway, which typically inhibits nuclear translocation and activity of the transcription factor DAF-16, lead to imbalances in E/I

      (excitation/inhibition) that manifest as hypersensitivity to cholinergic drugs. This includes the gain of function of pdk-1 and the loss of function of daf-18 and daf-16 itself. In our subsequent experiments, we demonstrate that this exacerbation of the PI3K pathway leads to errors in the neurodevelopment of GABAergic neurons, which explains the hypersensitivity to aldicarb and levamisole.

      As the reviewer remarks, it is intriguing why mutants inhibiting this pathway do not show differences in their sensitivity to cholinergic drugs compared to wild-type animals. We can speculate, for instance, that during neurodevelopment, there is a critical period where the PI3K pathway must remain with very low activity (or even deactivated) for proper development of GABAergic neurons. This could explain why there are no differences in sensitivity to cholinergic drugs between mutants that inhibit the PI3K pathway and the wild type. The PI3K pathway depends on insulin-like signals, which are in turn positively modulated by molecules associated with the presence of food. Interestingly, larval stage 1 is particularly sensitive to nutritional status, being able to completely arrest development in the absence of food. Therefore, dietary intervention with BHB may generate a signal of dietary restriction (as seen in mammals) and, as a consequence of this dietary restriction, the PI3K pathway is inhibited, resulting in increased DAF-16 activity. This could restore the proper neurodevelopment of GABAergic neurons. However, this is mere speculation, and further deeper experiments (than the pharmacology ones we performed here) with mutants in different genes within the PI3K pathway may shed light on this point.

      Following the reviewer's suggestion, this point has been discussed in the revised version of the manuscript. (Discussion Page 18, Lines 384-407).

      The consequence of SOD-3 expression in the broader context of GABA neurons was not discussed. SOD3 was also measured in the pharynx but measuring it in neurons would bolster the claims.

      SOD-3 is a known target of DAF-16. Previous studies have shown that βHB induces SOD-3 expression through the induction of DAF-16 (Edwards et al, 2014, Aging,

      https://doi.org/10.18632%2Faging.100683). The highest levels of SOD-3 expression are typically observed in the pharynx or intestine (DeRosa et al, 2019 https://doi.org/10.1038/s41586-019-1524-5;  Zheng et al., 2021, PNAS, https://doi.org/10.1073/pnas.2021063118), and it is often used as a measure of general upregulation of DAF-16. Therefore, we used this parameter as a measure of βHB upregulating systemic DAF-16 activity.  While we agree with the reviewer that observing variations in SOD-3 expression in neurons would further support our conclusions, unfortunately, we did not detect measurable signals of SOD-3 in motor neurons in either the control condition or the daf-18 background even upon stress or BHB-exposure. This may be because SOD-3 is a minor target of DAF-16 in these neurons, or its modulation may not correspond to the timing of fluorescence measurements (L4-adults).

      Despite this, our genetic experiments and neuron-specific rescue experiments lead us to conclude that DAF-16 must act autonomously in GABAergic neurons to ensure proper neurodevelopment.

      If they want to include AKT-1, seeing its effect on SOD-3 expression could be meaningful to the model.

      Thank you for this suggestion. We believe that even measuring SOD-3 levels in akt mutant backgrounds would still provide limited information to give it a predominant value in our work. Additionally, to have a complete understanding of the total role of AKT, it would be necessary to measure it in a double mutant background of akt-1; akt-2, and these double mutants generate 100 % dauers even at 15C (Oh et al., PNAS 2005, https://doi.org/10.1073/pnas.0500749102; Quevedo et al., Current Biology 2007, http://dx.doi.org/10.1016/j.cub.2006.12.038; Gatzi et al., PLOS ONE 2014,

      https://doi.org/10.1371/journal.pone.0107671), greatly complicating the execution of these experiments. Therefore, following the first advice of this reviewer, we have decided to modify our model by excluding AKT.

      Recommendations for the authors:

      Reviewer #1 (Recommendations For The Authors):

      ⁃ Please include earlier in the main text the rationale for using unc-25 as a control/reference already when mentioning Figure 1A.

      Thank you for pointing out the need to reference this control earlier. We have included the following paragraph in the description of Figure 1 (Page 5, line 71, revised version):

      “Hypersensitivity to cholinergic drugs is typical of animals with an increased E/I ratio in the neuromuscular system, such as mutants in unc-25 (the C. elegans orthologue for glutamic acid decarboxylase, an essential enzyme for synthesizing GABA). While daf-18/PTEN mutants become paralyzed earlier than wild-type animals, their hypersensitivity to cholinergic drugs is not as severe as that observed in animals completely deficient in GABA synthesis, such unc-25 null mutants (Figures 1B and 1C) indicating a less pronounced imbalance between excitatory and inhibitory signals.”

      ⁃ Please discuss the greater sensitivity of pdk-1(gf) animals to levamisole than to aldicarb.

      Thank you for bringing up this subtle point.  We understand that the reviewer is referring to the paralysis curve in response to aldicarb in pdk-1(gf), which is closer to unc-25 than the curve for levamisole (in both cases, they are more sensitive than the wild type). Therefore, pdk-1(gf) animals seem to be more sensitive to aldicarb than to levamisole. These results are now shown in Figure 1D (revised version).

      The PI3K pathway does not only act in neurons but also in muscles. Gain of function in pdk-1 has been shown to modulate muscle protein degradation (Szewczyk et al, EMBO Journal, 2008. https://doi.org/10.1038/sj.emboj.7601540). In contrast,  no effect on protein degradation has been reported for null mutants in this gene. Several studies have demonstrated that protein degradation levels can differentially affect receptor subunits, particularly acetylcholine receptors (Reviewed in Crespi et al, Br J Pharmacol, 2018). C. elegans is characterized by a wide repertoire of AChR subunits, and there are at least two subtypes of ACh receptors in muscles (one multimeric sensitive to levamisole and one homomeric (ACR-16) insensitive to levamisole) (Richmond et al, 1999 Nature Neuroscience http://dx.doi.org/10.1038/12160; Touroutine D, JBC 2005 https://doi.org/10.1074/jbc.M502818200).

      Interestingly, acr-16 null mutants are hypersensitive to aldicarb (Zeng et al, JCB, 2023, https://doi.org/10.1083/jcb.202301117) while the electrophysiological response to levamisole in this mutant remains similar to that of wild-type (Tourorutine et al, 2005). Therefore, it may be that the gain of function in pdk-1 induces a change in the expression of AChR subtypes in muscle that differentially affect sensitivity to levamisole and ACh. This is purely speculative, and there may be many other explanations. While it would be interesting to explore this difference further, it goes far beyond the scope of this study. The cholinergic drug sensitivity assay is purely exploratory and allowed us to delve into the GABAergic and cholinergic signals in daf-18 mutants. In this sense, the hypersensitivity of pdk-1(gf) to both drugs supports the idea that an increase in PI3K signaling leads to an increased E/I ratio.

      ⁃ Please explain the rationale to perform akt-1 and akt-2 assays separated. Why not test doublemutants? Has their lack of redundancy been determined?.  

      Our pharmacological assays are conducted at the L4 larval stage, making it impossible to analyze the potential redundancy of akt-1 and akt-2 in sensitivity to levamisole and aldicarb. This impossibility arises because the akt-1;akt-2 double mutant exhibits nearly 100% arrest as dauer even at 15°C, as reported in several prior studies (Oh et al., PNAS 2005, https://doi.org/10.1073/pnas.0500749102; Quevedo et al., Current Biology 2007, http://dx.doi.org/10.1016/j.cub.2006.12.038; Gatzi et al., PLOS ONE 2014, https://doi.org/10.1371/journal.pone.0107671). While the increased dauer arrest in the double mutant compared to the single mutants might suggest redundant functions in dauer entry, there are also reports indicating the absence of redundancy in other processes, such as vulval development (Nakdimon et al., PLOS Genetics 2012, https://doi.org/10.1371%2Fjournal.pgen.1002881).

      The complete Dauer arrest likely underlies why other studies focusing on the role of the PI3K pathway in neurodevelopment utilize both mutants separately (Christensen et al, Development 2011,

      https://doi.org/10.1242/dev.069062). While determining the potential redundancy of these genes is not feasible for this assay, we utilized various mutants of the pathway (age-1, pdk-1, daf-18, daf-16 and daf16;daf-18 in addition to the akt-s) that support the conclusion, which is that exacerbating the PI3K pathway activity makes animals hypersensitive to cholinergic drugs.

      In response to the reviewer's concern, we have added a sentence in the text explaining the impossibility of performing the assay in the akt-1;akt-2 double mutant (Page 6, lines90-92) 

      Figure 1C and D (This applies to all similarly presented bar figures). Please show data points and dispersion (preferably data, median+- 25-75% or average+-SD). 

      Thank you. Done

      ⁃ Line 112 -maybe "and resumes"? 

      Thank you. Done (Line 126, revised version)

      ⁃ Figure 1E and F. Please present mean +-SD (not SEM) of fluctuations. Please change slightly the tones so that the dispersion is easier to distinguish on the "blue light on" box.

      Thank you for the suggestion. We have adjusted the tones as recommended to enhance the visualization of the "blue light on" box. For visualization purposes, we present the shading of the standard error of the mean (SEM), as is usual in these types of optogenetic experiments where traces of animal length variations are measured (Liewald et al, Nature Methods, 2008, doi: 10.1038/nmeth.1252; Schulstheis et al, J. Neurophysiology, 2011, doi: 10.1152/jn.00578.2010; Koopman et al, BMC Biology 2021, https://doi.org/10.1186/s12915-021-01085-2; Seidhenthal et al, Micro Publication Biology, 2022, https://doi.org/10.17912%2Fmicropub.biology.000607 ).

      For the revised version, we have also included bar graphs for each optogenetic experiment, representing the mean of the length average of each worm measured from the first second after the blue light was turned on until the second before the light was turned off (in the graph, this corresponds to the period between seconds 6 and 9 of the traces). These graphs include the standard deviation and the corresponding significance levels. All of this has been included in the new legend (Figure 2D, 2E, 4E-J).

      ⁃ Figure 1A&1B & Supplementary Figure 1D x Supplementary Figure 1E&1F. What is the difference between these experiments? Whereas the unc-25 mutants paralyze in the same amount of time, the WT animals paralyze ~1 h later in Supplementary Figure 1E-1F in response to either drug. Please revise experimental conditions to see if anything can be learned eg, maybe this is a nutritional response from experiments done at different timepoints? Maybe different food recipes affected sensitivity to paralysis?

      Thank you for pointing this out. While the experiments with daf-18 (in both alleles) and daf-16 were conducted at the beginning of this project (2019-2020), the assays with the other mutants in the PI3K and mTOR pathways were performed years later. Changes in the reagents used (agar, peptone, cholesterol, etc.) to grow the worms have occurred, potentially altering the animals' response directly or through the nutritional quality of the bacteria they grow on. In addition, the difference may be attributed to the fact that experiments at the project's outset were conducted by one author, while more recent experiments were carried out by another. The goal is to quantify paralysis in non-responsive worms after touch stimulation. The force of this probing or the thickness of the hair used for touching can be slightly operator-dependent and can lead to variable responses. In addition, always the presence of wild-type and unc-25 strain is included as internal control in every experiment. Nevertheless, despite this userdependent variation, the experiments were always conducted blindly (except for unc-25, whose uncoordinated phenotype is easily identifiable), thus we trust in the outcomes.

      ⁃ Supplementary Figure 1G - Length and Width appear to be switched in both left and right panels - please revise and include a description of N and of statistics depicted. 

      Unfortunately, we don't see the switching error that the reviewer mentioned. In the left panel, we demonstrate that optogenetic activation of GABAergic neurons leads to an increase in length without modifying the width of the animal. Therefore, we conclude that the increase in area, as observed in our Fiji macro for optogenetic response analysis, is due to an increase in the animal's length. In the cholinergic activation shown in the right panel, the animal shortens (decreasing length) without modifying the width, resulting in the reduction of the total body area. 

      We have included information about N (sample size) and the statistical test used in the legends as suggested. These graphs are now shown as Figures 2F and G, revised version.

      ⁃ Supplementary Figure 1G legend lines 779-780. Please describe the post-hoc test applied following ANOVA to obtain the denoted p values. This applies to all datasets where ANOVA or Krusal-Wallis tests were applied.

      Following reviewer´s suggestion, all the post-hoc tests applied after ANOVA or Kruskal-Wallis analysis were included in the legend of each figure and Materials and Methods (statistical analysis section).

      ⁃ Line 174 maybe "arises *from* the hyperactivation" instead of *for*?.

      Corrected. Thank you. Line 190, revised version.

      ⁃ Supplementary Figure 4. On line 816 it says n=40-90, but please check the n of the daf-18, daf-16 samples, which seem to have less than 40 animals.

      We understand that the reviewer is referring to Supplementary Figure 3 from the original version (now Supplementary Figure 5 in the revised version). We have now included the number of observations below each data point cloud to clearly indicate the sample size for each condition

      ⁃ Supplementary Figure 4 - please state what are the bars on the graphs. Please state which post-hoc test was performed after Kruskal-Wallis and present at least the p values obtained between treated controls and each genotype. Alternatively, present the whole truth table in supplementary daita.

      We understand that the reviewer is referring to Supplementary Figure 3 from the original version (now Supplementary Figure 5 in the revised version). There was an error in the original legend (thank you for bringing this to our attention) since the statistics were not performed using Kruskall-Wallis in this case, but rather each treated condition was compared to its own untreated control using Mann-Whitney test. We have now added the p-values to the graph. All raw data for this figure, as well as for all other figures, are available in Open Science Framework (https://osf.io/mdpgc/?view_only=3edb6edf2298421e94982268d9802050).

      ⁃ Please cite the figure panels in order: eg, Figure 3E is mentioned in the text after panels Figure 3F-K.

      Done. We have rearranged the figures to adapt them to the text order (Figure 4, revised version)

      ⁃ Figure 4 - line 610 please revise "(n=20-30 (n: 20-25 animals per genotype/trial)."

      Thank you. Corrected.

      ⁃ Figure 4 - there appears to be an inconsistency in the figure with the text (lines 223-225). In figures it says E-L1, but in the text, it says "solely in L1". Does E-L1 include the whole L1 stage? If not- E-L1 can be interpreted only as during the embryonic stage, hence, no exposure to betaHB due to the impermeable chitin eggshell. Then there is L1-L2, which should cover the L1 stage and the L2 or something else. Please revise. The text mentions L2-L3 or L3-L4 and these categories are not in the figures. This clarification is key for the interpretation of the results. The precise developmental time of the exposures is not defined either in the methods or in the figures. Please provide precise times relative to hours and/or molts and revise the text/figure for consistency.

      The reviewer is entirely correct in pointing out the lack of relevant data regarding the exposure time to βHB. We have now clarified the information For the revised version, we have adjusted the nomenclature of each exposure period to precisely reflect the developmental stages involved.

      For the experiments involving continuous exposure to βHB throughout development, the NGM plate contained the ketone body. Therefore, the exposure encompassed, in principle, the ex-utero embryonic development period up to L4-Young adults (E-L4/YA, in Figure 5A) when the experiments were conducted. Since it could be a restriction to drug penetration through the chitin shell of the eggs (see Supplementary Figure 7), we can ensure βHB exposure from hatching.

      In experiments involving exposure at different developmental stages as those depicted in Figure 4 of the original version, (now Figure 5), animals were transferred between plates with and without βHB as required. We exposed daf-18/PTEN mutant animals to βHB-supplemented diets for 18-hour periods at different developmental stages (Figure 5A). The earliest exposure occurred during the 18 hours following egg laying, covering ex-utero embryonic development and the first 8-9 hours of the L1 stage (This period is called E-L1, in figure 5 revised version). The second exposure period encompassed the latter part of the L1 stage, the entire L2 stage, and most of the L3 stage (L1-L3). The third exposure spanned the latter part of the L3 stage (~1-2 hours), the entire L4 stage, and the first 6-7 hours of the adult stage (L3-YA).

      All this information has been conveniently included in Figure 5 (and its legend), text (Page 13, lines 259276), and Material and Methods of the revised manuscript.

      ⁃ Some methods are not sufficiently well described. Specifically, how the animals were exposed to treatments and how stages were obtained for each experiment. Was synchronization involved? If so, in which experiments and how exactly was it performed?

      As mentioned in previous responses all the experiments were performed in age-synchronized animals. We include the following sentence in Materials and Methods (C. elegans culture and maintenance section): “All experiments were conducted on age-synchronized animals. This was achieved by placing gravid worms on NGM plates and removing them after two hours. The assays were performed on the animals hatched from the eggs laid in these two hours”.

      Reviewer #2 (Recommendations For The Authors):

      Major points

      (1) To complete the study on the GABAergic signaling at the NMJs, it would be interesting to assess the status of the post-synaptic part of the synapse such as the GABAR clustering. It would also tell if the impairment is only presynaptic or both post and presynaptic.

      Thank you for your insightful suggestion. We agree that exploring post-synaptic elements can shed light on whether the impairment is solely presynaptic or involves both pre and post-synaptic components.

      While our current study primarily focuses on neuronal alterations without delving into potential postsynaptic effects, we do plan to investigate this aspect in the future. This includes not only examining GABAergic receptors but also exploring cholinergic receptors, as exacerbation of cholinergic signaling cannot be ruled out. To conduct a comprehensive study of post-synaptic structure and functionality, we would need strains with fluorescent markers for both pre and post-synaptic components (rab-3, unc-49, unc-29, acr-16 driving GFP or mCherry). However, most of these strains are not currently available in our laboratory. Unlike the US or Europe, acquiring these strains from the C. elegans CGC repository in Argentina is challenging due to common customs delays, requiring significant time and resources to navigate. Discussions at the Latin American C. elegans conference with CGC administrators, such as Ann Rougvie, have been initiated to address this issue, but a solution has not been reached yet. 

      Additionally, to analyze post-synaptic functionality in-depth, studying the response to perfusion with various agonists using electrophysiology would be beneficial. We are in the process of acquiring the capability to conduct electrophysiology experiments in our laboratory, but progress is slow due to limited funding.

      While we believe these experiments are very informative, they will require a considerable amount of time due to our current circumstances. We consider them non-essential to the primary message of the paper, which focuses on neuronal morphological defects leading to functional alterations in daf-18/PTEN mutants.

      We will include these experiments in our future projects, also planning to extend this investigation to mutants with deficiencies in genes closely related to neurodevelopmental defects, such as neuroligin, neurexin, or shank-3, which have been implicated in synaptic architecture.

      (2) The author always referred to unc-47 promoter or unc-17 promoter, never specifying where those promoters are driving the expression (and in the Materials & Methods, no information on the corresponding sequence). Depending on the promoters they may not only be expressed in the motoneurons involved in locomotion (VA, VB, DA, DB, VD, and DD), but they could also be expressed in other neurons which could be of importance for the conclusions of the optogenetic assays but also the daf-18 expression in GABAergic neurons.

      We appreciate the reviewer's insight regarding the broader expression patterns of the unc-17 and unc-47 promoters in all cholinergic and GABAergic neurons, respectively. The strains expressing constructs with these promoters were obtained from the CGC or other labs and have been widely used in previous papers (Liewald et al, Nature Methods, https://www.nature.com/articles/nmeth.1252 (2008); Byrne, A. B. et al. Neuron 81, 561-573, doi:10.1016/j.neuron.2013.11.019 (2014).

      Regarding the optogenetic assays, the readout utilized (body length elongation or contraction) is primarily associated with the activity of cholinergic and GABAergic motor neurons and has been used in numerous studies to measure motor neuron functionality (Liewald et al, Nature Methods, https://www.nature.com/articles/nmeth.1252 (2008);Hwang, H. et al. Sci Rep 6, 19900, doi:10.1038/srep19900 (2016); Schultheis et al,  . J Neurophysiol 106, 817-827, doi:10.1152/jn.00578.2010 (2011); Koopman, M., Janssen, L. & Nollen, E. A. BMC Biol 19, 170, doi:10.1186/s12915-021-01085-2 (2021);). It has previously been established that the shortening observed after optogenetic activation of the unc-17 promoter, while active in various interneurons, depends on the activity of cholinergic motor neurons (Liewald et al., Nature Methods, https://www.nature.com/articles/nmeth.1252 (2008)). This was demonstrated by examining transgenic worms expressing ChR2-YFP from another cholinergic, motoneuronspecific but weaker promoter, Punc-4. They observed contraction and coiling upon illumination, albeit to a milder degree.

      In terms of GABAergic neurons, only 3 do not directly synapse to body wall muscles (AVL, PDV, and RIS) and are primarily involved in defecation. Of the 23 GABAergic motor neurons, 19 are Dtype motoneurons, while the remaining 4 innervate head muscles (Pereira et al, eLife 2015, https://doi.org/10.7554/eLife.12432). It is therefore expected that while there may be some contribution from these latter neurons to the elongation after optogenetic activation in animals containing punc-47::ChR2, the main contribution should be from the D-type neurons. Additionally, while there may be some influence on D-type neuron development due to daf-18 rescue in neurons like RME, DVB or AVL, the most direct explanation for the rescue is that daf-18 acts autonomously in D-type cells.  Additionally, we have pharmacological and behavioral assays that support the findings of optogenetics and enable us to reach final conclusions.

      (3) DD neurons are born during embryogenesis and newborn L1s have neurites even though less than at a later stage. If possible, it would be interesting to take a look at them to see if βHB has an effect or not. It will corroborate the hypothesis that βHB action is prevented by the impermeable eggshell on a system that can respond at a later stage. Moreover, using a specific DD, DA, and DB promoter, it would be possible to check if there is a difference in the morphological defects between embryonic and post-embryonic neurons.

      This is a very interesting point raised by the reviewer. We conducted experiments to analyze the morphology of GABAergic neurons in animals exposed to βHB only during the ex-utero embryonic development (in their laid egg state). We observed that this incubation was not sufficient to rescue the defects in GABAergic neurons (Supplementary Figure 7, revised version). As reported by other authors and discussed in our paper, the chitinous eggshell might act as an impermeable barrier to most drugs. However, we cannot rule out that incubation during this period is necessary but not sufficient to mitigate the defects. We have included these experiments in Supplementary Figure 7 and in the text (Page 13, lines 272-276)

      Additionally, we analyzed confocal images where, based on their position, we could identify and assess errors in DD (embryonic) and VD (Post-embryonic) neurons (Supplementary Figure 3, revised version). These experiments show that the effects are observed in both types of neurons, and we did not observe any differential alterations in neuronal morphology between the two types of neurons.

      Minor points

      (1)   Expression of daf-18/PTEN in muscle or hypodermis, could it ensure a proper development? It could give insights into the action mechanism of βHB.

      The reviewer's observation is indeed very intriguing. Previous studies from the Grishok lab (Kennedy et al, 2013) have demonstrated that the expression of daf-18 or daf-16 in extraneuronal tissues, specifically in the hypodermis, can rescue migratory defects in the serotoninergic neuron HSN in daf-18 or daf-16 null mutants of C. elegans. Clearly, this could also be an option for rescuing the morphological and functional defects of GABAergic motoneurons.

      However, the fact that the expression of daf-18 in GABAergic neurons rescues these defects strongly suggests an autonomous effect. In this regard, autonomous effects of DAF-18 or DAF-16 on neurodevelopmental defects have also been reported in interneurons in C. elegans (Christensen et al, 2011). This is included in the discussion (Page 15, lines 330-335)

      (2) Re-organise the introduction. The paragraph on ketogenic diets (lines 35-38) is not logically linked.

      Following reviewer´s suggestion we have reorganized the introduction and changed the order of explanation regarding the significance of ketogenic diets, linking it with their proven effectiveness in alleviating symptoms of diseases with E/I imbalance (Lines 23-60, revised version)

      (3) Incorporate titles in the result section to guide the reader.

      Done. Thank you

      (4) Systematically add PTEN or FOXO when daf-18 or daf-16 are mentioned (for example lines 69, 84, 85).

      Done. Thank you  

      (5) Strain lists: lines 646 to 653: some information is missing on the different transgenes used in this study (integrated (Is) or extrachromosomal (Ex) with their numbers).

      Thank you for bringing this to our attention. We have now included all the information regarding the different transgenes used in this study, including whether they are integrated (Is) or extrachromosomal (Ex) and their respective numbers. This information can be found in the revised version of the manuscript (Materials and Methods, C. elegans culture and maintenance section highlighted in yellow).

      Reviewer #3 (Recommendations For The Authors):

      In Figure 1, some experiments were done with the unc-25 control while others, such as the optogenetic experiments, were done without those controls.

      Thank you for pointing this out. In the optogenetic experiments, we waited for the worm to move forward for 5 seconds at a sustained speed before exposing it to blue light to standardize the experiment, as the response can vary if the animal is in reverse, going forward, or stationary. Due to the severity of the uncoordinated movement in unc-25 mutants, achieving this forward movement before exposure is very difficult. Additionally, this lack of coordination prevents these animals from performing the escape response tests, as they barely move. Therefore, we limited the use of this severe GABAergic-deficient control to pharmacological or post-prodding shortening experiments.

    1. Author response:

      The following is the authors’ response to the original reviews.

      Reviewer #1 (Recommendations For The Authors):

      Additional experiments to characterize what this novel cell type becomes in older animals would be ideal to strengthen the manuscript, but the authors should at least address this in the Discussion.

      The manuscript could be significantly improved if the authors included, for example, a timeline and/or cartoon contextualizing these cells relative to the formation of other CN neurons and their locations, perhaps as a summary figure at the end. Furthermore, the logic of each figure could be enhanced if the authors graphically show - again, perhaps with a schematic/cartoon - the question being tested for each figure. Furthermore, making the figure titles less descriptive and more explanatory would also help a reader follow the logic of the experiments.

      These are indeed valid and important questions for our research, and understanding the distribution, fate, and connectivity of this new cell type in the cerebellar nuclei postnatally is a focus of ongoing investigation in our lab. To address these questions, we are currently utilizing SNCA-GFP mice, a project led by a PhD student in my lab. While this work will be the subject of a full-length research paper, we do add a sentence to the paper concerning a recent report about the presence of SNCA neurons in the adult CN.  We have included a reference to the postnatal expression of SNCA (“In adult mice, postnatal expression of SNCA has been reported in medial CN neurons. PMID: 32639229”.) on page 8 of our manuscript (highlighted in yellow). In addition, we have included a cartoon as a summary figure (Fig. 9) illustrating the origin of cerebellar nuclei from the caudal and rostral ends in both Atoh1+/+ and Atoh1-/- mice. Thank you once again, we have revised and improved the Fig. titles accordingly.

      Reviewer #2 (Recommendations For The Authors):

      Figure 3:

      (1) If most SNCA+ cells are OTX2+ based on the IHCs, why are there so many SNCA+ Otx2- cells in the sort?

      In each group, 350,000 cells were sorted. Due to the relatively small population size of this subset of cerebellar nuclei neurons, the sorting procedure could not perfectly mirror our immunohistochemistry results. In each group, 350,000 cells were sorted. Due to the relatively small population size of this subset of cerebellar nuclei neurons, the sorting procedure could not perfectly mirror our immunohistochemistry results. However, it is noteworthy that a portion of sorted cells expressed SNCA or Otx2 while a smaller population co-expressed both Otx2 and SNCA in the cerebellar primordium.

      (2) Panel 3F: FACS graphs - the resolution of the figures is too poor on the PDF to read any of the text of these graphs. What are the axes?

      We thank the reviewer for this comment. In the revision a high resolution of the FACS graph has replaced the lower quality graph in panel 3F. This clearly identifies the axes and text for this panel.

      Figure 4:

      (1) Arrowheads are making a subset of + cerebellar cells -Why? Not defined in the legend.

      The population of cells indicated by the arrowheads are now defined in the legend. We have added the statement “Examples of Otx2 expressing cells are indicated by arrowheads in panels B, D, E, and F.”

      (2) The orientation of panels E and F is unclear - please provide low mag panel insets.

      An orientation marker (ie, (r-c and d-v; rostral caudal and dorsal ventral, respectively)) has been added to panel A, which applies to all panels, including panels E and F. Furthermore, the isthmus is noted with an “i” to provide further orientation.

      (3) G - and throughout the paper - whisker plots (not simple box plots) are required. Also, it is unclear from the methods how Otx2+ cells were counted - how many embryos/age? The description of 10 sections across 3 slides is incomplete. Are these cells distributed equally across the mediolateral axis of the anlage? Where are comparable M/L sections compared across ages? Is the increase in # across time because these cells are proliferative or are more migrating into the anlage?

      The plot has been replaced with whisker plots. A more detailed description of the Method used has been on page 15; “To assess the number of OTX2-positive cells, we conducted immunohistochemistry (IHC) labeling on slides containing serial sections from embryonic days 12, 13, 14, and 15 (n=3 at each timepoint). Under the microscope, we systematically counted OTX2-positive cells within the cerebellar primordium. This analysis encompassed a minimum of 10 sections, spread across at least 3 slides, ensuring comprehensive coverage of OTX2 expression along the mediolateral axis of the cerebellar primordium. For each slide, the counts of OTX2-positive cells from all sections were cumulatively calculated to determine the total number of positive cells per slide. Subsequently, statistical analysis was employed to compare the results obtained different developmental time points.”

      Figure 5:

      The use of confocal microscopy creates clear data re Otx2-GFP expression, but I cannot understand the origin of the panels. How do they relate to E/F and H/I? Different sections?

      In Figure 5, panels A-D display Otx2 expressing cells in the cerebellar primordium of Otx2-GFP transgenic mice, whereas panels E-J depict RNAscope fluorescence in situ hybridization (FISH) for the Otx2 probe in wild type mice. These represent complementary approaches to map Otx2+ cells in the developing cerebellum. This is made clear in a revised legend in Fig 5.

      Figure 6:

      The justification for the in-culture experiments, particularly the long (4 and 21DIV) times is unclear and needs to be strengthened or the in vitro data should be removed.

      Thank you for the respected reviewer’s comment. The E-H panels, show the co-expression of SNCA and p75NTR, highlight a significant role in the differentiation of specific neuronal populations during development. These findings validate our previous results (PMID: 31509576) and are consistent with the results of our current study. Therefore, we have chosen to keep these panels. However, in line with the suggestion from the reviewer, we have removed panels I-L from Fig. 6.

      Figure 7:

      SNCA expression in panels A and G is not specific nor is the Otx2 staining in panel B making the data in panels C and I uninterpretable and these panels need to be replaced. The Meis2 data however is much better and I agree this data shows that the dorsal RL-derived cells are deleted in Atoh1-/- while the SNCA+ cells remain. This is strong data supporting the dual origins of NTZ.

      Thank you for the points, Panel A and G have been replaced with high-resolution images. In addition, panels A-C have been carefully cropped to enhance focus on the NTZ area, to improve the quality and visibility of panels.  To enhance clarity, we have included a summary fig. 9 for clarification.

      Figure 8:

      The diI experiments are a key addition to this paper and clearly show the direct movement of some cells from the mesencephalon into the developing cerebellum, but data presentation must be considerably strengthened.

      (1) What is the inset in panel A? Low mag of embryo? Perhaps conversion of image to PDF degraded resolution - add a description in the legend. Arrowhead and arrow identities are reversed in the legend. The arrow points to the isthmus.

      Thank you for the comment, for clarification we have included information in the Fig. legend (highlighted in yellow). In addition, the issues with the arrows have been addressed and corrected.

      (2) Panels B and C are also shown in Supplementary Figure 2 with arrows indicating rostral and caudal movement - these arrows need to be added here. There is no need to replicate these same panels in the supplement.

      Thanks, arrows have been added in panels B, C of Fig. 8.

      (3) The text states that "almost all DiI cells migrated caudally into the cerebellum" and refers to Figure 8E and Suppementl 3 but there is no evidence/support shown for this, just a few + cells in 8E and some very difficult-to-see positive cells in sections in Supplement E-F. Given the importance of this data, I am surprised that the authors chose bright field/phase microscopy to show this. This section's data is not convincing data at all. I find it very difficult to see specific staining. These panels must be improved. This is key data for paper conclusions.

      These are valid points, and we acknowledge that this experiment alone may not provide conclusive evidence regarding the subset of CN originating from mesencephalon. At this stage of the study, we do not claim definitively that the SNCA/OTX2/MEIS2 positive cells originate from the mesencephalon. As stated in our manuscript, "In conclusion, our study indicates that the SNCA+/ OTX2+/ MEIS2+/ p75NTR+/ LMX1A- rostroventral subset of CN neurons do not originate from the well-known distinct germinative zones of the cerebellar primordium. Instead, our findings suggest the existence of a previously unidentified extrinsic germinal zone, potentially the mesencephalon."  We have also discussed embryonic culture approaches in the manuscript, which could involve the use of other agents such as plasmid/viral vectors, hinting at the possibility of origin from the mesencephalon. While tracing the origin from the mesencephalon in vivo and in vitro is promising and on our to-do list, the data will not be available for this manuscript. To prevent confusion, we have eliminated redundant panels of Fig. 8 with Supplementary Fig. 2 and 3. However, if the reviewer deems it necessary to remove these panels, we are prepared to do so.

    1. Author response:

      The following is the authors’ response to the previous reviews.

      Reviewer #1 (Recommendations For The Authors):

      The revised manuscript addressed my minor concerns adequately, and the manuscript is now further improved. I have no remaining criticisms.

      Reviewer #2 (Recommendations For The Authors):

      Abstract:

      line 45 The abbreviation "SytI" should perhaps be introduced above.

      done

      Results:

      line 139 "RRP kinetics" should perhaps read "RRP depletion kinetics" or "secretion kinetics".

      We replaced “RRP kinetics” with “RRP secretion kinetics”

      line 325ff and Figure 8

      As far as I understand, SytI 875 R233Q ki cells shown in violet express wt CplxII. Perhaps this should be explicitly stated?

      To accommodate this suggestion: We now state on page 13 line 302: “Overexpression of the CpxII DN mutant in SytI R233Q ki cells, which is expected to outcompete the function of endogenous CpxII in these cells (Dhara et al., 2014), further slowed down the rate of synchronized release and restored the EB size to the wt level (Figure 7C, D)”

      line 332ff and Figure 8

      What is plotted in Figure 8B bottom and in Figure 8D is not a "rate" but rather a "unitary rate", more commonly referred to as a "rate constant".

      The y-axis label of Figures 8B and 8D should therefore better be changed to "rate constant". See also line 528 of the Discussion.

      Figure (y-axis label) and text were changed accordingly

    1. Author response:

      The following is the authors’ response to the original reviews.

      Public Reviews: 

      Reviewer #1 (Public Review): 

      Summary: 

      Glaser et al present ExA-SPIM, a light-sheet microscope platform with large volumetric coverage (Field of view 85mm^2, working distance 35mm), designed to image expanded mouse brains in their entirety. The authors also present an expansion method optimized for whole mouse brains and an acquisition software suite. The microscope is employed in imaging an expanded mouse brain, the macaque motor cortex, and human brain slices of white matter. 

      This is impressive work and represents a leap over existing light-sheet microscopes. As an example, it offers a fivefold higher resolution than mesoSPIM (https://mesospim.org/), a popular platform for imaging large cleared samples. Thus while this work is rooted in optical engineering, it manifests a huge step forward and has the potential to become an important tool in the neurosciences. 

      Strengths: 

      - ExA-SPIM features an exceptional combination of field of view, working distance, resolution, and throughput. 

      - An expanded mouse brain can be acquired with only 15 tiles, lowering the burden on computational stitching. That the brain does not need to be mechanically sectioned is also seen as an important capability. 

      - The image data is compelling, and tracing of neurons has been performed. This demonstrates the potential of the microscope platform. 

      Weaknesses: 

      - There is a general question about the scaling laws of lenses, and expansion microscopy, which in my opinion remained unanswered: In the context of whole brain imaging, a larger expansion factor requires a microscope system with larger volumetric coverage, which in turn will have lower resolution (Figure 1B). So what is optimal? Could one alternatively image a cleared (non-expanded) brain with a high-resolution ASLM system (Chakraborty, Tonmoy, Nature Methods 2019, potentially upgraded with custom objectives) and get a similar effective resolution as the authors get with expansion? This is not meant to diminish the achievement, but it was unclear if the gains in resolution from the expansion factor are traded off by the scaling laws of current optical systems. 

      Paraphrasing the reviewer: Expanding the tissue requires imaging larger volumes and allows lower optical resolution. What has been gained?

      The answer to the reviewer’s question is nuanced and contains four parts. 

      First, optical engineering requirements are more forgiving for lenses with lower resolution. Lower resolution lenses can have much larger fields of view (in real terms: the number of resolvable elements, proportional to ‘etendue’) and much longer working distances. In other words, it is currently more feasible to engineer lower resolution lenses with larger volumetric coverage, even when accounting for the expansion factor. 

      Second, these lenses are also much better corrected compared to higher resolution (NA) lenses. They have a flat field of view, negligible pincushion distortions, and constant resolution across the field of view. We are not aware of comparable performance for high NA objectives, even when correcting for expansion.

      Third, although clearing and expansion render tissues ‘transparent’, there still exist refractive index inhomogeneities which deteriorate image quality, especially at larger imaging depths. These effects are more severe for higher optical resolutions (NA), because the rays entering the objective at higher angles have longer paths in the tissue and will see more aberrations. For lower NA systems, such as ExaSPIM, the differences in paths between the extreme and axial rays are relatively small and image formation is less sensitive to aberrations. 

      Fourth, aberrations are proportional to the index of refraction inhomogeneities (dn/dx). Since the index of refraction is roughly proportional to density, scattering and aberration of light decreases as M^3, where M is the expansion factor. In contrast, the imaging path length through the tissue only increases as M. This produces a huge win for imaging larger samples with lower resolutions. 

      To our knowledge there are no convincing demonstrations in the literature of diffraction-limited ASLM imaging at a depth of 1 cm in cleared mouse brain tissue, which would be equivalent to the ExA-SPIM imaging results presented in this manuscript.  

      In the discussion of the revised manuscript we discuss these factors in more depth. 

      - It was unclear if 300 nm lateral and 800 nm axial resolution is enough for many questions in neuroscience. Segmenting spines, distinguishing pre- and postsynaptic densities, or tracing densely labeled neurons might be challenging. A discussion about the necessary resolution levels in neuroscience would be appreciated. 

      We have previously shown good results in tracing the thinnest (100 nm thick) axons over cm scales with 1.5 um axial resolution. It is the contrast (SNR) that matters, and the ExaSPIM contrast exceeds the block-face 2-photon contrast, not to mention imaging speed (> 10x).  

      Indeed, for some questions, like distinguishing fluorescence in pre- and postsynaptic structures, higher resolutions will be required (0.2 um isotropic; Rah et al Frontiers Neurosci, 2013). This could be achieved with higher expansion factors.

      This is not within the intended scope of the current manuscript. As mentioned in the discussion section, we are working towards ExA-SPIM-based concepts to achieve better resolution through the design and fabrication of a customized imaging lens that maintains a high volumetric coverage with increased numerical aperture.  

      - Would it be possible to characterize the aberrations that might be still present after whole brain expansion? One approach could be to image small fluorescent nanospheres behind the expanded brain and recover the pupil function via phase retrieval. But even full width half maximum (FWHM) measurements of the nanospheres' images would give some idea of the magnitude of the aberrations. 

      We now included a supplementary figure highlighting images of small axon segments within distal regions of the brain.  

      Reviewer #2 (Public Review)

      Summary: 

      In this manuscript, Glaser et al. describe a new selective plane illumination microscope designed to image a large field of view that is optimized for expanded and cleared tissue samples. For the most part, the microscope design follows a standard formula that is common among many systems (e.g. Keller PJ et al Science 2008, Pitrone PG et al. Nature Methods 2013, Dean KM et al. Biophys J 2015, and Voigt FF et al. Nature Methods 2019). The primary conceptual and technical novelty is to use a detection objective from the metrology industry that has a large field of view and a large area camera. The authors characterize the system resolution, field curvature, and chromatic focal shift by measuring fluorescent beads in a hydrogel and then show example images of expanded samples from mouse, macaque, and human brain tissue. 

      Strengths: 

      I commend the authors for making all of the documentation, models, and acquisition software openly accessible and believe that this will help assist others who would like to replicate the instrument. I anticipate that the protocols for imaging large expanded tissues (such as an entire mouse brain) will also be useful to the community. 

      Weaknesses: 

      The characterization of the instrument needs to be improved to validate the claims. If the manuscript claims that the instrument allows for robust automated neuronal tracing, then this should be included in the data. 

      The reviewer raises a valid concern. Our assertion that the resolution and contrast is sufficient for robust automated neuronal tracing is overstated based on the data in the paper. We are hard at work on automated tracing of datasets from the ExA-SPIM microscope. We have demonstrated full reconstruction of axonal arbors encompassing >20 cm of axonal length.  But including these methods and results is out of the scope of the current manuscript. 

      The claims of robust automated neuronal tracing have been appropriately modified.  

      Recommendations for the authors:

      Reviewer #1 (Recommendations For The Authors): 

      Smaller questions to the authors: 

      - Would a multi-directional illumination and detection architecture help? Was there a particular reason the authors did not go that route?

      Despite the clarity of the expanded tissue, and the lower numerical aperture of the ExA-SPIM microscope, image quality still degrades slightly towards the distal regions of the brain relative to both the excitation and detection objective. Therefore, multi-directional illumination and detection would be advantageous. Since the initial submission of the manuscript, we have undertaken re-designing the optics and mechanics of the system. This includes provisions for multi-directional illumination and detection. However, this new design is beyond the scope of this manuscript. We now mention this in L254-255 of the Discussion section.

      - Why did the authors not use the same objective for illumination and detection, which would allow isotropic resolution in ASLM? 

      The current implementation of ASLM requires an infinity corrected objective (i.e. conjugating the axial sweeping mechanism to the back focal plane). This is not possible due to the finite conjugate design of the ExA-SPIM detection lens.

      More fundamentally, pushing the excitation NA higher would result in a shorter light sheet Rayleigh length, which would require a smaller detection slit (shorter exposure time, lower signal to noise ratio). For our purposes an excitation NA of 0.1 is an excellent compromise between axial resolution, signal to noise ratio, and imaging speed. 

      For other potentially brighter biological structures, it may be possible to design a custom infinity corrected objective that enables ASLM with NA > 0.1.

      - Have the authors made any attempt to characterize distortions of the brain tissue that can occur due to expansion? 

      We have not systematically characterized the distortions of the brain tissue pre and post expansion. Imaged mouse brain volumes are registered to the Allen CCF regardless of whether or not the tissue was expanded. It is beyond the scope of this manuscript to include these results and processing methods, but we have confirmed that the ExA-SPIM mouse brain volumes contain only modest deformation that is easily accounted for during registration to the Allen CCF. 

      - The authors state that a custom lens with NA 0.5-0.6 lens can be designed, featuring similar specifications. Is there a practical design? Wouldn't such a lens be more prone to Field curvature? 

      This custom lens has already been designed and is currently being fabricated. The lens maintains a similar space bandwidth product as the current lens (increased numerical aperture but over a proportionally smaller field of view). Over the designed field of view, field curvature is <1 µm. However, including additional discussion or results of this customized lens is beyond the scope of this manuscript.

      Reviewer #2 (Recommendations For The Authors): 

      • System characterization: 

      - Please state what wavelength was used for the resolution measurements in Figure 2.

      An excitation wavelength of 561 nm was used. This has been added to the manuscript text.

      - The manuscript highlights that a key advance for the microscope is the ability to image over a very large 13 mm diameter field of view. Can the authors clarify why they chose to characterize resolution over an 8diameter mm field rather than the full area? 

      The 13 mm diameter field of view refers to the diagonal of the 10.6 x 8.0 mm field of view. The results presented in Figure 1c are with respect to the horizontal x direction and vertical y direction. A note indicating that the 13 mm is with respect to the diagonal of the rectangular imaging field has been added to the manuscript text. The results were presented in this way to present the axial and lateral resolution as a function of y (the axial sweeping direction).

      - The resolution estimates seem lower than I would expect for a 0.30 NA lens (which should be closer to ~850 nm for 515 nm emission). Could the authors clarify the discrepancy? Is this predicted by the Zemax model and due to using the lens in immersion media, related to sampling size on the camera, or something else? It would be helpful if the authors could overlay the expected diffraction-limited performance together with the plots in Figure 2C. 

      As mentioned previously, the resolution measurements were performed with 561 nm excitation and an emission bandpass of ~573 – 616 nm (595 nm average). Based on this we would expect the full width half maximum resolution to be ~975 nm. The resolution is in fact limited by sampling on the camera. The 3.76 µm pixel size, combined with the 5.0X magnification results in a sampling of 752 nm. Based on the Nyquist the resolution is limited to ~1.5 µm. We have added clarifying statements to the text.

      - I'm confused about the characterization of light sheet thickness and how it relates to the measured detection field curvature. The authors state that they "deliver a light sheet with NA = 0.10 which has a width of 12.5 mm (FWHM)." If we estimate that light fills the 0.10 NA, it should have a beam waist (2wo) of ~3 microns (assuming Gaussian beam approximations). Although field curvature is described as "minimal" in the text, it is still ~10-15 microns at the edge of the field for the emission bands for GFP and RFP proteins. Given that this is 5X larger than the light sheet thickness, how do the authors deal with this? 

      The generated light sheet is flat, with a thickness of ~ 3 µm. This flat light sheet will be captured in focus over the depth of focus of the detection objective. The stated field curvature is within 2.5X the depth of focus of the detection lens, which is equivalent to the “Plan” specification of standard microscope objectives.

      - In Figure 2E, it would be helpful if the authors could list the exposure times as well as the total voxels/second for the two-camera comparison. It's also worth noting that the Sony chip used in the VP151MX camera was released last year whereas the Orca Flash V3 chosen for comparison is over a decade old now. I'm confused as to why the authors chose this camera for comparison when they appear to have a more recent Orca BT-Fusion that they show in a picture in the supplement (indicated as Figure S2 in the text, but I believe this is a typo and should be Figure S3). 

      This is a useful addition, and we have added exposure times to the plot. We have also added a note that the Orca Flash V3 is an older generation sCMOS camera and that newer variants exist. Including the Orca BT-Fusion. The BT-Fusion has a read noise of 1.0 e- rms versus 1.6 e- rms, and a peak quantum efficiency of ~95% vs. 85%. Based on the discussion in Supplementary Note S1, we do not expect that these differences in specifications would dramatically change the data presented in the plot. In addition, the typo in Figure S2 has been corrected to Figure S3.

      - In Table S1, the authors note that they only compare their work to prior modalities that are capable of providing <= 1 micron resolution. I'm a bit confused by this choice given that Figure 2 seems to show the resolution of ExA-SPIM as ~1.5 microns at 4 mm off center (1/2 their stated radial field of view). It also excludes a comparison with the mesoSPIM project which at least to me seems to be the most relevant prior to this manuscript. This system is designed for imaging large cleared tissues like the ones shown here. While the original publication in 2019 had a substantially lower lateral resolution, a newer variant, Nikita et al bioRxiv (which is cited in general terms in this manuscript, but not explicitly discussed) also provides 1.5-micron lateral resolution over a comparable field of view. 

      We have updated the table to include the benchtop mesoSPIM from Nikita et al., Nature Communications, 2024. Based on this published version of the manuscript, the lateral resolution is 1.5 µm and axial resolution is 3.3 µm. Assuming the Iris 15 camera sensor, with the stated 2.5 fps, the volumetric rate (megavoxels/sec) is 37.41.

      - The authors state that, "We systematically evaluated dehydration agents, including methanol, ethanol, and tetrahydrofuran (THF), followed by delipidation with commonly used protocols on 1 mm thick brain slices. Slices were expanded and examined for clarity under a macroscope." It would be useful to include some data from this evaluation in the manuscript to make it clear how the authors arrived at their final protocol. 

      Additional details on the expansion protocol may be included in another manuscript.

      General comments: 

      • There is a tendency in the manuscript to use negative qualitative terms when describing prior work and positive qualitative terms when describing the work here. Examples include: 

      - "Throughput is limited in part by cumbersome and error-prone microscopy methods". While I agree that performing single neuron reconstructions at a large scale is a difficult challenge, the terms cumbersome and error-prone are qualitative and lacking objective metrics.

      We have revised this statement to be more precise, stating that throughput is limited in part by the speed and image quality of existing microscopy methods.

      - The resolution of the system is described in several places as "near-isotropic" whereas prior methods were described as "highly anisotropic". I agree that the ~1:3 lateral to axial ratio here is more isotropic than the 1:6 ratio of the other cited publications. However, I'm not sure I'd consider 3-fold worse axial resolution than lateral to be considered "near" isotropic.

      We agree that the term near-isotropic is ambiguous. We have modified the text accordingly, removing the term near-isotropic and where appropriate stating that the resolution is more isotropic than that of other cited publications.

      - exposures (which in the caption is described as "modest"). I'd suggest removing these qualitative terms and just stating the values.

      We agree and have changed the text accordingly.

      • The results section for Figure 5 is titled "Tracing axons in human neocortex and white matter". Although this section states "larger axons (>1 um) are well separated... allowing for robust automated and manual tracing" there is no data for any tracing in the manuscript. Although I agree that the images are visually impressive, I'm not sure that this claim is backed by data.

      We have now removed the text in this section referring to automated and manual tracing.

    1. Author response:

      The following is the authors’ response to the original reviews.

      eLife assessment

      The paper investigates a potential cause of a type of severe epilepsy that develops in early life because of a defect in a gene called KCNQ2. The significance is fundamental because it substantially advances our understanding of a major research question. The strength of the evidence is convincing because appropriate methods are used that are in line with the state-of-the art, although there are some revisions/corrections that would strengthen the evidence further.

      Thank you for the expert, thorough, and helpful review.  We believe that addressing the reviewers’ points has improved our paper greatly.   

      Public Reviews:

      Reviewer #1 (Public Review):

      Abreo et al. performed a detailed multidisciplinary analysis of a pathogenic variant of the KCNQ2 ion channel subunit identified in a child with neonatal-onset epilepsy and neurodevelopmental disorders. These analyses revealed multiple molecular and cellular mechanisms associated with this variant and provided important insights into what distinguishes distinct pathogenic variants of KCNQ2 associated with self-limited familial neonatal epilepsy versus those leading to developmental and epileptic encephalopathy, and how they may mechanistically differ, to result in different extents of developmental impairment.

      The authors first provide a detailed clinical description of the patient heterozygous for a novel pathogenic variant encoding KCNQ2 G256W. They then model the structure of the G256W variant based on recent cryo-EM structures of KCNQ2 and other ion channel subunits and find that while the affected position is quite distinct from the channel pore, it participates in a novel, evolutionarily conserved set of amino acids that form a network of hydrogen bonds that stabilize the structure of the pore domain.

      They then undertake a series of rigorous and quantitative laboratory experiments in which the KCNQ2 G256W variant is coexpressed exogenously with WT KCNQ2 and KCNQ3 subunits in heterologous cells, and endogenously in novel gene-edited mice generated for this study. This includes detailed electrophysiological analyses in the transfected heterologous cells revealing the dominant-negative phenotype of KCNQ2 G256W. They found altered firing properties in hippocampal CA1 neurons in brain slices from the heterozygous KCNQ2 G256W mice.

      They next showed that the expression and localization of KCNQ channels are altered in brain neurons from heterozygous KCNQ2 G256W mice, suggesting that this variant impacts KCNQ2 trafficking and stability.

      Together, these laboratory studies reveal that the molecular and cellular mechanisms shaping KCNQ channel expression, localization, and function are impacted at multiple levels by the variant encoding KCNQ2 G256W, likely contributing to the clinical features of the child heterozygous for this variant relative to patients harboring distinct KCNQ2 pathogenic variants.

      Thank you for the thorough summary and estimation of the initial submission, we are very glad that our approach, analytical methods, and conclusions were convincing.   

      Reviewer #2 (Public Review):

      Summary:

      The paper entitled "Plural molecular and cellular mechanisms of pore domain KCNQ2 encephalopathy" by Abreo et al. is a complex and integrated paper that is well-written with a focus on a single gene variant that causes a severe developmental

      encephalopathy. The paper collates clinical outcomes from 4 individuals and investigates a variant causing KCNQ2-DEE using a wide range of experimental techniques including structural biology, in vitro electrophysiology, generation of genetically modified animal models, immunofluorescence, and brain slice recordings. The overall results provide a plausible explanation of the pathophysiology of the G265W variant and provide important findings to the KCNQ2-DEE field as well as beginning to separate the understanding between seizures and encephalopathies.

      Strengths:

      (1) The authors describe in detail how the structural biology of the channel with a mutation changes the movement of the protein and adds insights into how one variant can change the function of the M-current. The proposed model linking this change to pathogenic consequences should help pave the way for additional studies to further support this type of approach.

      (2) The multiple co-expression ratio experiments drill down to the complex nature of the assembly of channels in over-expression systems and help to move toward an understanding of heterozygosity. It might have been interesting if TEA was tested as a blocker to better understand the assembly of the transfected subunits or possibly use vectors to force desired configurations.

      (3) The immunofluorescent approach to understanding re-distribution is another component of understanding the function of this critical current. The demonstration that Q2 and Q3 are diminished at the AIS is an important finding and a strength to the totality of the data presented in the paper.

      (4) Brain slice work is an important component of studying genetically modified animals as it brings in the systems approach, and helps to explain seizure generation and EEG recordings. The finding that G265W/+ neurons were more sensitive to current injections is a critical component of the paper.

      (5) The strength of this body of work is how the authors integrated different scientific approaches to knitting together a compelling set of experiments to better explain how a single variant, and likely extrapolation to other variants, can cause a severe neonatal developmental encephalopathy with a poor clinical outcome.

      Thank you for the thorough and encouraging reading of our work and its strengths, we are very glad that, excepting the issues mentioned which we have addressed, our approach and conclusions were convincing.

      Weaknesses:

      (1) Minor comment: Under the clinical history it is unclear whether the mother was on Leviracetam for suspected in-utero seizures or if Leviracetam was given to individual 1.

      The latter seems more likely, and if so this should be reworded.

      We revised the results text to clarify that the drug was begun postnatally, after epilepsy was diagnosed in the child.   

      (2) As described in the clinical history of patient 1, treatment with ezogabine was encouraging with rapid onset by a parental global impression with difficulty in weaning off the drug. When studying the genetically modified mice, it would have been beneficial to the paper to talk about any ezogabine effects on the genetically modified mice.

      We agree this is of great interest, but sampling and metrics are challenging due to the very low frequency of seizures and delayed mortality in the heterozygous G256 mice.  Accordingly, we have not performed ezogabine treatment experiments in the mice described in this study, which model a human variant associated with a brief neonatal window of frequent seizures.  We hope to return this issue using other transgenic mice with higher seizure frequency, but such results are outside the current scope.

      (3) It is a bit surprising that CA1 pyramidal neurons from the heterozygous G256W mice have no difference in resting membrane potential. The discussion section might explore this in a bit more detail.

      Thank you for raising this issue. This combination of outcomes has been seen previously and is interpreted as an outcome of low somatodendritic surface expression of the channels.  Relatively higher expression within the AIS membrane, with its the relatively small surface area and electrical isolation from the soma, allow the KCNQ2/3 channels to influence AIS excitability with little or (in this instance) undetectable influence on the RMP (see e.g., Otto et al. 2006, PMID: 16481438; Singh et al. 2008, PMID 16481438  for KCNQ2 mutant mice.  See Hu and Bean, 2018, figure 2; PMID: 29526554 for explicit testing via focal AIS vs. somatic blocker perfusion).  Additionally, in previous work, we did not find any changes to the RMP of CA1 pyramidal neurons in either Kcnq2 knockout mice (PMID: 24719109) or mice expressing a Kcnq2 GOF variant (PMID: 37607817).  We modified the discussion including adding references to prior studies combining experimental and multicompartmental computational models.

      (4) It was mentioned in the paper about a direct comparison between SLFNE and G256W.

      However, in the slice recordings, there was no comparison. Having these data comparing

      SLFNE to G256W would have been a more fulsome story and would have added to the concept around susceptibility to action potential firing.

      Thank you for this point. We agree that such side-by-side recordings would be interesting.  However, slice recordings were not performed on the SLFNE mice. The study design was based on the fact that extensive prior studies of both haploinsufficient and missense human SLFNE variant mice have been published (Otto et al. 2006 J Neuroscience, PMID: 16481438; Singh et al. 2008, PMID 16481438; Kim et al 2020 PMID: 31283873) and show good agreement, but DEE missense variants have not been previously studied. We revised the discussion, to place the current DEE model results in the context of the prior SNFLE model slice work. We contrast the similarity of the CA1 cellular hyperexcitability phenotype ex vivo (at least in CA1 pyramidal cells) across models to the differences in electrographic and behavioral seizures (i.e., network level physiology).  

      Reviewer #3 (Public Review):

      Summary:

      This manuscript describes the symptoms of patients harboring KCNQ2 mutation G256W, functional changes of the mutant channel in exogenous expression, and phenotypes of G256W/+ mice. The patients presented seizures, the mutation reduced currents of the channel, and the G256W/+ mice showed seizures, increased firing frequency in neurons, reduced KCNQ2 expression, and altered subcellular distribution.

      Strengths:

      This is a large amount of work and all results corroborated the pathogenicity of the mutation in KCNQ2, providing an interesting example of KCNQ2-associated neurological disorder's impact on functions at all levels including molecular, cellular, tissue, animal model, and patients.

      Weaknesses:

      The manuscript described observations of changes in association with the mutation at molecular cellular functions and animal phenotype, but the results in some aspects are not as strong as in others. Nevertheless, the manuscript made overarching conclusions even when the evidence was not sufficiently strong.

      Thank you for your review.  In our revision (as listed in the recommendations to authors section) we have attempted to better justify the conclusions you mention there.

      Recommendations for the authors: 

      Reviewer #1 (Recommendations For The Authors):

      Suggestions for improved or additional experiments, data, or analyses.

      Page 7: the authors' statement that G256 could be intolerant to substitution would be strengthened by a straightforward analysis of available genome- and exome-wide sequencing data to determine the level of genic intolerance at this position in the human population, as has been used previously to highlight critical residues including those impacted by pathogenic variants in many other proteins including ion channels (e.g., Genome Biology 17:9, 2016; Am J Hum Genet 99:1261, 2016; Biochim Biophys Acta Biomemb 1862:183058, 2020).

      Thank you for this suggestion, we have revised the opening of this section to point out the low ratio of benign to pathogenic variants in the region surrounding G256 shown by prior work. We have added citations to the papers describing the MTR and gnomAD tools that highlight these data and calculations.   

      The overall interpretation of the CHO cell results would be enhanced by the authors including in their discussion an explicit statement that they did not attempt to evaluate the overall and plasma membrane expression levels of the exogenously expressed WT and mutant KCNQ2 subunits, nor that of KCNQ3, in the transfected CHO cells. They could also highlight that this is an important future experiment to determine whether the dominant negative effects are due to impaired expression/trafficking or impaired function of plasma membrane channels, as this may be an important consideration for designing therapeutic strategies.

      We agree.  We revised the discussion to explicitly mention this additional direction.  We agree this topic has therapeutic implications, especially given our in vivo protein localization results.  We added a mention that combinations of molecules enhancing surface localization with channel openers could be a therapeutic strategy, analogous to approved therapies for cystic fibrosis.  

      The authors conclude that the impact of ezogabine treatment is reduced in the cells expressing G256+/W versus those expressing WT KCNQ2. However, the delta pA/pF graph in panel 3G expresses the effects of ezogabine as absolute increases in current density. Determining the relative increase (i.e., fold change) in current density in ezogabine-treated versus control conditions is a more valid way to analyze these data. This provides a better reflection of the impact of ezogabine as the control currents already have a much larger amplitude than the G256+/W currents. By eye the impact of ezogabine looks comparable or even larger for the G256+/W condition than for WT, fundamentally changing the interpretation of these results.

      Thank you for this helpful comment.  The reviewer calls attention to the fact that although G256W/+ mean whole cell currents from are less than WT, before and after application of ezogabine, it appeared from Fig. 3G that ezogabine enhanced currents to a “proportionally equivalent extent” in G256W/+ and WT cells.  We revised panel 3G to try to make this more clear.  It now shows WT currents +/- ezogabine currents normalized to (WT, no ezogabine at +40 mV), along with G256W/+ cells +/- ezogabine currents, normalized to (G256W/+, no ezogabine at +40 mV).  This normalization shows that the mixed population of channels expressed by G256W/+ cells are equally augmented (with a trend toward greater augmentation), compared to controls.  This is a striking result given that channels lacking WT KCNQ2 subunits do not respond to ezogabine (i.e., the “homozygous heteromer” condition, Fig. 3F) do not respond to ezogabine.  Although the underlying data are unchanged, we agree with the reviewers’ conclusion about emphasizing the effect “per channel”.  This reframing is mechanistically and clinically important.  We have made changes to the results text and discussion to highlight related issues.   

      Figure 7: it is not clear from the information presented whether the qPCR would only measure WT KCNQ2 mRNA levels or detect levels of both WT and E254fs transcripts. The authors assume nonsense-mediated decay, but they did [not] determine experimentally that this occurred. The sequencing in the supplemental figure shows the presence of E254fs transcripts but does not allow for insights into their abundance. It should be straightforward to develop primer sets that could then be used to selectively amplify WT and E254fs transcripts for quantitation. 

      Thank you for this helpful suggestion.  The assay used in the initial submission measures total Kcnq2 mRNA. We developed and performed a new assay where the probe binding site is the WT sequence, centered on the mutations. New Figure 7-Figure supplement 1, panel A is a cartoon showing the differences between the assays.  Using the WT alleleselective RT-qPCR assay, both  G256W/+ and E254fs/+ samples showed a 50% loss of WT Kcnq2.   We now can conclude that NMD is absent for G256W and incomplete for E254fs mRNA. Neither mutant heterozygous line shows a compensatory increase in WT Kcnq2 expression.  These conclusions are much more specific than previously, and documenting incomplete NMD of KCNQ2 is novel and of potential clinical significance.  The KCNQ2 protein (western blot) and WT mRNA (qPCR) results now agree, both showing ~50% loss.   

      For reporting transparency, the authors should provide the sequences of each of the primers used. Perhaps this is in the "key reagents" section, but this was missing from the manuscript. I note the authors use NMD in this section without defining it. and added a reference to a review where “incomplete NMD” is discussed.

      We have added the assay catalogue numbers to the key reagents table.  We eliminated the use of the NMD abbreviation. We added citations to the “incomplete NMD” literature including an excellent recent review and a directly relevant primary paper.  These show how NMD efficiency may differ: between genes, transcripts, cells, tissues and, remarkably, between human individuals (see doi: 10.1093/hmg/ddz028, cited in the review—caffeine inhibits NMD!).  The revised discussion mentions this, and relevance to future studies of novel KCNQ2 variant pathogenicity and severity prediction.  

      Recommendations for improving the writing and presentation.

      I found the presentation of the IHC images deficient in terms of accessibility and transparency. While the movies provided are also useful, it is important the authors also provide conventional static merged images of each of their multiplex labeling images in the body of the paper. This allows a reader to see the labeling with the different antibodies in the context of each other (one of the major advantages of multiplex labeling), instead of trying to remember the pattern each label gave in prior sections of the movie.

      [We queried the reviewer via the eLife editorial staff]: To clarify my suggestion to improve Figure 8, the authors should generate from their movies static images that are basically what they already did in Fig8S3 for the G256W Het panel of the Fig8 movie. This involves revising Fig8S3 to include WT panels, and adding two new supplemental figures that show WT/Het panels with the separate antibodies and then a merged image from Fig8S1 and Fig8S2, just like they did in Fig8S3 for the mutant part of the Fig8 movie.

      Thank you for this comment. As suggested by the reviewer, for each IHC movie (Fig. 8, Fig. 8-figure supplement 1 and Fig. 8-figure supplement 2), we added a new supplementary  figure showing WT and mutant animal static images corresponding to the movies.  For main Figure 8 (CA1, G256W/+ comparison), the new static images enable evaluating the patterns of colocalization by providing selected portions of the images at the highest useful magnification.  These show  each individual antibody in greyscale (best for comparing) and 4 different green-red merged images to show overlap (yellow) vs non-overlap.  The merged images demonstrate colocalization of KCNQ2 and KCNQ3 at the distal portions of AnkG-labelled CA1 pyramidal cell AISs, in agreement with prior publications.  In G256W/+ but not E254fs/+ images, KCNQ2 and KCNQ3 show reduced relative labeling of AISs and increased relative labeling of somata in the pyramidal cell layer.   For CA3, the merged views show the redistributed relative labeling of KCNQ2 and KCNQ3 between stratum lucidum and stratum pyramidale.  

      We also revised Fig. 8 supplement 3 (CA1) to include WT panels, On reexamination, all WT interneurons  in the small sample lacked somatic KCNQ2 and KCNQ3 labeling.  Some s. oriens and radiatum AISs of both WT and G256W/+ sections showed KCNQ2 and KCNQ3 labeling, as shown in the revised figure.  Counting statistics are included in the supporting data.  Importantly, our belief that the images shown are representative is supported by the blinded analysis of a much larger sample (Figure 9, unchanged in revision).  

      Dragging the movie viewer “slider” allows the viewer to move  back and forth between color channels.  It works well in eLife if used in that way.   This is a way of seeing the “representativeness” of the merges shown in the CA1 conventional static images, which necessarily include a smaller x-y area and include only a few AISs.   We also added a KCNQ2/KCNQ3 merge to the movies. 

      Western blot results in Figure 9 - Supplement 1: for transparency, the authors need to show the entire blot, as they did in Figure 4 - Supplement 2. This is required in many journals, and in the case of KCNQ2 it provides crucial information as to the different forms of KCNQ2 present on SDS gels in these samples that contain different KCNQ2 isoforms. Given the surprising decrease in levels of KCNQ2 monomer in the G256+/W mice, it is important to present and analyze the levels of the monomer, dimer, and higher oligomeric forms of KCNQ in these samples, to determine whether protein "missing" in the monomeric form is not present in the dimeric or higher oligomeric form. This is especially important as the G256W mutant could lead to misfolding and aggregation leading to a higher proportion of both WT and G256W subunits being present in a higher-order oligomeric form. I note that it is odd that the figure legend states "Images of entire filter used for western blot of lysates, probed for KCNQ2 and KCNQ3.", even though only selected portions are shown.

      Thank you for this suggestion. We agree that the wording of the legend needed improvement.  

      In revision, the western blots are renumbered as Figure 10, and Figure 10-Figure supplement 1. In the main figure, monomer bands and densitometry are shown, as previously.  In the new Figure 10-Figure supplement 1,  we show (1) the ECL image of the entire filter probed with rabbit anti-KCNQ2, (2) the same blot, stripped, and reprobed with guinea pig KCNQ3, (3) the lower portion, probed with mouse anti-tubulin. The revised Fig. 10-fig supplement 1 shows 3 genotypes x 3 individual (male) p21 mice, with all steps performed in parallel from homogenization to ECL detection.  As suggested, we performed new analysis of the immunoreactive bands corresponding to (apparent) monomer, dimer, and higher oligomeric forms of KCNQ2. Analysis of the sum of those bands showed loss of KCNQ2 protein in both mutant lines.  

      The methods are sufficiently detailed with the exception that there is inconsistent inclusion of catalog numbers and RRIDs. Having these would improve transparency as to specific reagents used and would allow for enhanced reproducibility of the lab research performed here.

      The revised submission includes the key resources table, which we understood was not requested from eLife at initial submission. 

      Minor corrections to the text and figures.

      Typos/mistakes as to antibodies used in the IHC methods section "anti-AnkG36 N106/36 " should be "anti-AnkG N106/36", and "mouse anti-PanNav IgG1 supernatant" should be mouse anti-PanNav IgG1 purified antibody". 

      Thank you, corrections made.

      It would facilitate a reader's interpretation of the IHC results if the authors explicitly stated in the IHC results section that the KCNQ2 antibody used is against the N-terminus and therefore should recognize both mutant isoforms as the mutations are downstream of this.

      We added this point to the results section in relation to Figure 4-figure supplement 2 (western), and in IHC methods.

      PV is not defined when used in the discussion, nor is why knowing that somatic KCNQ2 immunolabeling is present in both PV and non- PV interneurons of WT mice of value to the reader.

      We revised these sentences for clarity.

      The IHC methods state that "mice were transcardially perfused with....ice cold 2% paraformaldehyde in PBS, freshly prepared from a 20% stock (Electron Microscopy Sciences).". The authors presumably mean "formaldehyde" as paraformaldehyde is the inert polymeric storage form of active depolymerized monomeric formaldehyde that is a fixative.

      The reviewer is correct regarding the chemistry; the manufacturer’s product name is “Paraformaldehyde 20% aqueous solution”.  We revised accordingly.

      Reviewer #3 (Recommendations For The Authors):

      Some comments regarding the presentation are as follows.

      (1) The section "G256W lies atop a dome-shaped hydrogen bond network linking helix S5 to the turret and selectivity filter" is entirely based on structural observations without functional validation. This may be more appropriate in Discussion. The emphasis on the "turret arch" bonding should be tuned down due to the lack of functional support.

      We understand and agree with this concern about the distinction between structural analysis and implied function.  However, we believe that the structural model reinterpretation and phylogenetic sequence analysis in our submission are results.  Structures as complex as those of KCNQ channels necessarily cannot be fully shown or analyzed in an initial publication. To our knowledge, the word “turret” has not appeared in a KCNQ channel cryoEM paper to date.  Bringing clinical motivation to prioritize study of an overlooked spot on the channel is creditworthy. The comprehensive heterologous patch clamp results in our study (including absence of effects on voltage-dependence, evidence of partial functional activity of channels containing one mutant subunit per channel shown for KCNQ2 homomers, KCNQ2/3 heteromers, and via acute ezogabine rescue experiments in the biologically most relevant heteromers) are functional evidence consistent with G256W acting through disruption of the SF.  

      However, we agree that more support is needed. The words “dome” and “arch”, though accurate for describing shape, tend to imply a mechanical “load bearing and distributing” function --our study does not prove this. Accordingly, we have toned down the emphasis by removing the words “keystone”, “turret dome bonding”, and  “as a structural novelty” from the abstract.   The revised discussion section replaces arch with “arch-shaped”, calls the idea that the turret functions as a stabilizing arch a “novel hypothesis”, and proposes next experiments (with relevant citations).

      Section title "Heterozygous G256W mice have neonatal seizures" does not seem to match the results since there was only one mouse that showed neonatal seizures.

      Thank you, we have revised the section title.  The text is transparent regarding sample size. The discussion highlights that these seizures are rare (indeed, not previously shown for any heterozygous missense model, to our knowledge).

      (2) It will be nice for the non-expert readers if the observations of "discrete seizures", "clusters", "diffuse bilateral onset", "unilateral onset" etc. are marked in Figure 1.

      Thank you for making this point. Figure 1 shows key excerpts of one bilateral onset seizure; a unilateral onset example isn’t shown since previous KCNQ2 DEE papers we cite have emphasized and illustrated focal onset seizures (Weckhuysen et al., 2013; Numis et al., 2014).    We revised the results section (p. 4) and Figure 1 and supplement captions to improve clarity for all readers including non-specialists.  

      (3) Figure 5 and page 10 first paragraph. Please specify the number of cells and the number of mice that were studied.

      Thank you, this information has been added to legend.

    1. Author response:

      The following is the authors’ response to the original reviews.

      Reviewer #1 (Public Review):

      […]

      (1) The authors claim that the negative frequency dependence that maintains polymorphism in their model results from a non-linear relationship between the display trait and sexual success [...] Maybe I missed something, but the authors do not provide support for their claim about the negative frequency-dependence of sexual selection in their simulations. To do so they could (1) extract the relationship between the relative mating success of the two male types from the simulations and (2) demonstrate that polymorphism is not maintained if the relationship between male display trait and mating success is linear.

      We believe that there is a confusion of terminology here. We agree that for the two alleles at a locus impacting male display in our model, the allele conferring inferior display quality will have a fitness that increases as its frequency increases, so this allele displays positive frequency dependent fitness. And, the alternate, display-favoring allele at the locus does display negative frequency dependence. Our use of the terminology ‘negative frequency dependence’ was meant to refer to the negative dependence of the fitness of the display-favoring allele with respect to its own frequency. However, a significant body of literature instead discusses models in which both an allele and its alternate(s) are beneficial when at low frequency and deleterious when at high frequency under the same selective challenge, entailing negative frequency dependence of fitness for all alleles involved. This benefit-when-rare model of a single trait is often described simply as negative frequency dependence, and generates balancing selection at the locus, but is not the model we are presenting here, and does not encompass all models involving negative frequency dependent fitness. This lexical expectation may make the interpretation of our work more difficult, and we have amended the manuscript to make our model clearer (lines 227-231). In this model, we have a negative frequency dependence for the fitness of the display-favoring allele in mate competition, but the net selective disadvantage of this allele at high frequency is due to a cost in another, pleiotropic, fitness challenge: the constant survival effect. So, the alleles are under balancing selection where alternate alleles are favored by selection when rare, but not due solely to selection during mate competition. Instead, our model relies on pleiotropy for an emergent form of frequency-dependent balancing selection (in the sense that each allele is predicted to be beneficial on balance when rare).

      In the reviewer’s model of the success of two alleles at one locus, the ratio of success is vaguely linear with allele frequency for n=3, though it starts quite convex and has an inflection point between convex and concave segments (for the disfavored allele) at p≈0.532. This is visualized easily by plotting the function and its derivatives in Wolfram-Alpha. For n>=4, the fitness function with respect to the display-favoring/disfavoring allele becomes increasingly concave/convex respectively, and this specific nonlinearity is needed to act along with the antagonistic pleiotropy to maintain balancing selection, rather than being maintained by a model that favors any rare allele on the basis of its rarity in some manner. In an attempt to make the importance of the encounter number parameter clearer, we’ve generated new panels for Figure S1 which simulate encounter numbers 2, 3, and 4, and we have updated corresponding text and figure references in lines 335-338.

      For (1-2), it is not clear how to modify the simulation such that the relationship between the trait value and mating success can be perfectly linear - either linear with respect to allele frequency in a one locus model or linear with respect to trait value at a specific population composition, without removing the simulation of mate competition altogether. While it may be of interest to explore a more comprehensive range of biological trade-offs in future studies, we are not able to meaningfully do so within the context of the present manuscript.

      (2) The authors only explore versions of the model where the survival costs are paid by females or by both sexes. We do not know if polymorphism would be maintained or not if the survival cost only affected males, and thus if sexual antagonism is crucial.

      We now present simulations with male costs only as added panels to Figure S1 and mention these results in the main text (lines 334-335). Maintenance of the polymorphism is significantly reduced or completely absent in such simulations.

      (3) The authors assume no cost to aneuploidy, with no justification. Biologically, investment in aneuploid eggs would not be recoverable by Drosophila females and thus would potentially act against inversions when they are rare.

      We did offer some discussion and justification of our decision to model no inherent fitness of the inversion mutation itself, specifically aneuploidy, in lines 36-39 and 78-80 of the original reviewed preprint. Previous research suggests that D. melanogaster females may not actually invest in aneuploid eggs generated from crossover within paracentric inversions. While surprising, and potentially limited to a subset of clades, many ‘r-selected’ taxa or those in which maternal investment is spread out over time may have some degree of reproductive compensation for non-viable offspring, which can reduce the costs of generating aneuploids significantly (for example, t-haplotypes in mice). We have added this example and citation to lines 34ff in the current draft.

      (4) The authors appear to define balanced polymorphism as a situation in which the average allele frequency from multiple simulation runs is intermediate between zero and one (e.g., Figure 3). However, a situation where 50% of simulation runs end up with the fixation of allele A and the rest with the fixation of allele B (average frequency of 0.5) is not a balanced polymorphism. The conditions for balanced polymorphism require that selection favors either variant when it is rare.

      We originally chose mean final frequency for presenting the single locus simulations based on the ease of generating a visual plot that included information on fixation vs loss and equilibrium frequency. Figure 3 and related supplemental images have been changed to now also represent the proportion of simulations retaining polymorphism at the locus in the final generation.

      (5) Possibly the most striking result of the experiment is the fact that for 14 out of 16 combinations of inversion x maternal background, the changes in allele frequencies between embryo and adult appear greater in magnitude in females than in males irrespective of the direction of change, being the same in the remaining two combinations. The authors interpret this as consistent with sexually antagonistic pleiotropy in the case of In(3L)Ok and In(3R)K. The frequencies of adult inversion frequencies were, however, measured at the age of 2 months, at which point 80% of flies had died. For all we know, this may have been 90% of females and 70% of males that died at this point. If so, it might well be that the effects of inversion on longevity do not systematically differ between the ages and the difference in Figure 9B results from the fact that the sample includes 30% longest-lived males and 10% longest-lived females.

      This critique deserves some consideration. The aging adults were separated by sex during aging, but while we recorded the number of survivors, we did not record the numbers of eclosed adults and their sexes initially collected out of an interest in maintaining high throughput collection. We therefore cannot directly calculate the associated survival proportions, but we can estimate them. We collected 1960 females and 3156 males, and we can very roughly estimate survival if we assume that equal numbers of each sex eclosed, and that the survivors represent 20% of the original population. That gives 12790 individuals per sex, or 84.7% female mortality and 75.3% male mortality.

      So, we have added a qualification discussing the possibility of stronger selection on females and its influence on observed sex-specific frequency changes, on lines 602-605.

      (6) Irrespective of the above problem, survival until the age of 2 months is arguably irrelevant from the viewpoint of fitness consequences and thus maintenance of inversion polymorphism in nature. It would seem that trade-offs in egg-to-adult survival (as assumed in the model), female fecundity, and possibly traits such as females resistance to male harm would be much more relevant to the maintenance of inversion polymorphisms.

      Adult Drosophila will continue to reproduce in good conditions until mortality, and the estimated age of a mean reproductive event for a Drosophila melanogaster individual is 24 days (Pool 2015), and likewise for D. simulans (Turelli and Hoffman 1995). Given that reproduction is centered around 24 days, we expect sampling at 2 months of age to still be relevant to fitness. In seasonally varying climates, either temperate or with long dry season, survival through challenging conditions is expected to require several months. In many such cases, females are in reproductive diapause, and so longevity is the main selective pressure. See lines 931-936 in the revised manuscript.

      As we agreed above, it would of interest to investigate a wider range of trade-offs in future studies. We focused here on the balanced between survival and male reproductive success because the latter trait generates negative frequency dependence for display-favoring alleles and a disproportionate skew towards higher quality competitors, whereas many other fitness-relevant traits lack that property.

      (7) The experiment is rather minimalistic in size, with four cages in total; given that each cage contains a different female strain, it essentially means N=1. The lack of replication makes statements like " In(2L)t and In(2R)NS each showed elevated survival with all maternal strains except ZI418N" (l. 493) unsubstantiated because the claimed special effect of ZI418N is based on a single cage subject to genetic drift and sampling error. The same applies to statements on inversion x female background interac7on (e.g., l. 550), as this is inseparable from residual variation. It is fortunate that the most interesting effects appear largely consistent across the cages/female backgrounds. Still, I am wondering why more replicates had not been included.

      Our experimental approach might be described as “diversity replication”. Essentially, the four maternal genetic backgrounds are serving dual purposes – both to assess experimental consistency and to ensure that our conclusions are not solely driven by a single non-representative genotype (which in so many published studies, can not be ruled out). It would indeed be interesting if we could have quadrupled the size of our experiment by having four replicates per maternal background. However, we suspect the reviewer may not recognize the substantial effort involved in our four existing experiments. Each of these involved collecting 500+ virgin females, hand-picking thousands of embryos during the duration of egg-laying, and repeatedly transferring offspring to maintain conditions during aging, such that cages had to be staggered by more than a month. These four cages took a year of benchwork just to collect frozen samples, before any preparation and quality control of the associated amplicon libraries for sequencing. Adding a further multiplier would take it well beyond the scope of a single PhD thesis.  Fortunately, we were able to obtain the key results of interest without that additional effort, even if clearer insights into the role of maternal background would also be of strong interest.

      We do agree that no firm conclusions about maternal background can be reached without further replication, and so we have qualified or removed relevant statements accordingly (lines 568ff, 620-622).

      Reviewer #1 (Recommendations For The Authors):

      The description of the model is confusing and incomplete, e.g., the values of several parameters used to obtain the numerical results are not given. It is first stated (l. 223) that the model is haploid, but text elsewhere talks about homozygotes and heterozygotes. If the model is diploid (this in itself is not clear), what is assumed about dominance?

      We are not presenting results for a mathematical model estimated numerically. We have now clarified our transition from a conceptual depiction of our model, in which we use haploid representations for simplified presentation, to our forward population genetic simulations, which are entirely diploid. More broadly, we have improved our communication of the assumptions and parameters used in our simulations. The scenarios we investigate involve purely additive trait effects within and between loci (except that survival probabilities are multiplicative to avoid negative values). We think that considering other dominance scenarios would be a worthy subject for a follow-up study, whereas the present manuscript is already covering a great deal of ground.   

      Similarly, it is hard to understand the design (l.442ff). I was confused as to whether a population was set up for each inversion or for all of them and what the unit or replication was. I found the description in Methods (l. 763-771) much clearer and only slightly longer; I suggest the authors transfer it to the Results. Also, Figure 8 should contain the entire crossing scheme; the current version is misleading in that it implies males with only two genotypes.

      All four tested inversions were segregating within the same karyotypically diverse population of males, and were assayed from the same experiments. We have attempted to improve the relevant description. For Figure 8, we had trouble conceiving a graphic update that contained a more complete cross scheme without seeming much more confused and cluttered. We have tried to clarify in the relevant text and the figure caption instead.

      There are a number of small issues that should be addressed:

      - No epistasis for viability assumed - what would be the consequence?

      We explored a model in which we intentionally included no terms for epistatic effects on phenotype. All epistasis with regard to fitness is emergent from competition between individuals with phenotypes composed of non-epistatic, non-dominant genetic effects. So, the simplest model of antagonism would have no epistasis for viability whatsoever. One could explore a model that has emergent viability epistasis in a similar way, by implementing stabilizing selection on a quantitative trait with a gaussian or similar non-linear phenotype-to-fitness map, but that might be better served as a topic for a future study. We have, however, tried to make this intent clearer in the text.

      l. 750 implies that aneuploidy generated by the inversion has no cost (aneuploid games are resampled)

      Yes, as addressed in public review item (3). Alternately see lines 34ff, 293, 369, 392 for in-text edits.

      l. 24-25: unclear; is this to mean that there is haplotype x sex interaction for survival?

      l. 25: success in what? (I assume this will be explained in the paper, but the abstract should stand on its own).

      l. 193-4: "producing among most competitive males": something missing or a word too much?? Figure 1B,C: a tiny detail, but the plots would be more intuitive if the blue (average) bars were ager (i.e., to the right) of the male and female ones, given that the average is derived from the two sex-specific values.

      Each of the above have been edited or implemented as suggested

      l. 205. It is convex function, but I do not understand what the authors mean by "convex distribution".

      Hopefully the updated text is clearer: “yielding a distribution of male reproductive output that follows a relatively convex trend”.

      l. 223ff: some references to Fig 1 panels in this paragraph seem off by one letter (i.e., A should be B, etc.).

      l. 231 "fitness...are equally fit": rephrase 

      l. 260: maybe "thrown out" is not the most fortunate term, maybe "eliminated" would be better?

      Each of the above have been edited or implemented as suggested

      Figure 3: I do not understand the meaning of "additive" and "multiplicative" in the case of a single locus haploid model

      All presented simulations are diploid, and these refer to the interactions between the two alleles at the locus. Hopefully the language is overall clearer in this draft.

      l. 274: "Mutation of new nucleotide" meaning what? Or is it mutation _to_ a new nucleotide?

      Hopefully the revised text is clearer.

      Figure 5. The right panel of figure 5A implies that, with the inversion, the population evolves to an extreme display trait that is so costly that it fills 95% of all individuals (or of all females?

      What is assumed about this here?). Apart from the biological realism of this result, what does it say about the accumulation of polymorphism and maintenance of the inversion? The graphs in fig 5B do plot a divergence between haplotypes, but it is not clear how they relate to those in panel A - the parameter values used to generate these plots are again not listed. Furthermore, from the viewpoint of the polymorphism, it would be good to report the frequencies at the steady-state.

      We have now clarified the figure description, including the parameter values used. The distribution of frequencies at the end of the simulation is represented in figure 6. Given that we set up the simulation with assumptions that are otherwise common to population models, what biological process would prevent this extreme? Why isn’t this extreme observed in natural populations? One possible explanation is that they become sex chromosomes, with increasing likelihood as the cost increases. Or other compensatory changes may occur that we don’t simulate, like regulatory evolution giving a complementary phenotype. Maybe genetic constraints in natural populations prevent the mutation of the kind of pleiotropic mutations that drive this dynamic. The populations still survive, though they are parameterized by relative fitness. What would an absolute fitness population function be? Would it go extinct or not? It would be of interest to explore a wider range of models, but it is the purpose of this paper to establish that this is a viable model for the maintenance of sexually antagonistic polymorphism and association with inversions. We have added a paragraph motivated by this comment to the Discussion starting on line 765.

      l. 401-2: Z-like, W-like : please specify you are talking about patterns resembling sex chromosomes. 

      l. 738: "population calculates"?

      l. 743-4 and 746-7: is this the same thing said twice, or are there two components of noise?  l. 357: there is no figure 5C.

      Each of the above have been addressed with text edits.

      L. 473-5: Yes, the offspring did not contain inversion homozygotes, but the sire pool did, didn't it? So homozygous inversions may have affected male reproductive success. Anyway, most of this paragraph (from line 473) seems to belong in Discussion rather than Results.

      We have revised this sentence to focus on offspring survival. 

      We can understand the reviewer’s suggestion about Results vs. Discussion text. While this can often be a challenging balance, we find that papers are often clearer if some initial interpretation is offered within the Results text. However, we moved the portion of this paragraph relating our findings to the published literature to the Discussion.

      l. 516: " In(3L)Ok favored male survival": this is misleading/confusing given the data, " In(3L)Ok reduced female survival more strongly than male survival..."

      Hopefully the phrasing is clearer now.

      l. 663ff: I did not have an impression that this section added anything new and could safely be cut.

      We have done some editing to make this more concise and emphasize what we think is essential, but we believe that the model of an autosomal, sexually antagonistic inversion differentiating before contributing to the origin of a sex chromosome is novel and interesting. And, that this additional emphasis is worthwhile to encourage thought and consideration of this idea in future research and among interested researchers.

      l. 751: "flat probability per locus": do the authors mean a constant probability?

      Edited.

      Reviewer #2 (Public Review):

      The manuscript lacks clarity of writing. It is impossible to fully grasp what the authors did in this study and how they reached their conclusions. Therefore, I will highlight some cases that I found problematic.

      Hopefully the revised manuscript improves writing clarity. 

      Although this is an interesting idea, it clearly cannot explain the apparent influence of seasonal and clinal variation on inversion frequencies.

      We do not believe that our model predicts a non-existence of temporal and spatial dependence of the fitness of inverted haplotypes, nor do we seek to identify the manner in which seasonal and clinal differences affect fitness of inverted haplotypes. Rather, we argued that the influence of seasonal and clinal selection on inversions does not on its own predict the observed maintenance of inversions at low to intermediate frequencies across such a diverse geographic range, along with the higher frequencies of many derived inversions in more ancestral environments. 

      We might imagine that trade-offs between life history traits such as mate competition and survival should be universal across the range of an organism. But in practice, the fitness benefits and costs of a pleiotropic variant (or haplotype) may be heavily dependent on the environment. A harsh environment such as a temperate winter may both reduce the number of females that a male encounters (decreasing the benefit of display-enhancing variants) and also increase the likelihood that survival-costly variants lead to mortality (thus increasing their survival penalty). In light of such dynamics, our model would predict that equilibrium inversion frequencies should be spatially and temporally variable, in agreement with a number of empirical observations regarding D. melanogaster inversions.

      We have edited the introduction to emphasize that inversion frequencies vary temporally as well as seasonally, on lines 144ff. We also note relevant discussion of the potential interplay between the environment and trade-offs such as those we investigate, on lines 153-155.

      The simulations are highly specific and make very strong assumptions, which are not well-justified.

      We respond to all specific concerns expressed in the Recommendations For The Authors section below. We also note that we have made further clarifications throughout the text regarding the assumptions made in our analysis and their justification.  

      Reviewer #2 (Recommendations For The Authors):

      I think that the manuscript would greatly benefit from a major rewrite and probably also a reanalysis of the empirical data.

      In particular, a genome-wide analysis of differences in SNP frequencies between sexes and developmental stages would help the reader to appreciate that inversions are special.

      [moved up within this section for clarity] We are lacking a genomic null model-how often do the authors see similar allele frequency differences when looking at the entire genome? This could be easily done with whole genome Pool-Seq and would tell us whether inversions are really different from the genomic background. I think that this information would be essential given the many uncertainties about the statistical tests performed. 

      We expect that autosome-wide SNP frequencies will be heavily influenced by the frequencies of inversions, which occur on all four major autosomal chromosome arms. These inversions often show moderate disequilibrium with distant variants (e.g. Corbett-Detig & Hartl 2012).

      Furthermore, the limited number of haplotypes present, given that the paternal population was founded from 10 inbred lines, would further enhance associations between inversions and distant variants. Therefore, we do not expect that whole-genome Pool-Seq data would provide an appropriate empirical null distribution for frequency changes. Instead, we have generated appropriate null predictions by accounting for both sampling effects and experimental variance, and we have aimed to make this methodology clearer in the current draft. 

      Some basic questions:

      why start at a frequency of 50% (line 287)?

      Isn't it obvious that in this scenario strong alleles with sexually antagonistic effects can survive?

      The initial goal of the associated Figure 4 was not to show that a strongly antagonistic variant could persist. Instead, we wanted to test the linkage conditions in which a second, relatively weaker antagonistic variant survived – which did not occur in the absence of strong linkage. 

      We have now added simulations with relatively lower initial frequencies, in which the weaker variant and the inversion both start at 0.05 frequency, while the stronger variant is still initialized at 0.5 to reflect the initial presence of one balanced locus with a strongly antagonistic variant. Here, the weaker antagonistic variant is still usually maintained when it is close to the stronger variant, and while the inversion-mediated maintenance of the weaker variant at greater distance from the stronger variant because less frequent than the original investigated case, it still happens often enough to hypothetically allow for such outcomes over evolutionary time-scales.

      Still, we should also emphasize that the goals of this proof-of-concept analysis are to establish and convey some basic elements of our model. Subsequently, analyses such as those presented in Figures 5 and 6 provide clearer evidence that the hypothesized dynamics of inversions facilitating the accumulation of sexual antagonism actually occur in our simulations.

      The experiments seem to be conducted in replicate (which is of course essential), but I could not find a clear statement of how many replicates were done for each maternal line cross.

      How did the authors arrive at 16 binomial trials (line 473)? 4 inversions, 4 maternal genotypes?

      How were replicates dealt with?

      In Figure 9, it would be important to visualize the variation among replicates.

      Unfortunately, we did not have the bandwidth to perform replicates of each maternal line. Instead, we use four maternal backgrounds to simultaneously establish consistency across independent experiments and genetic backgrounds (see our response to Reviewer 1, point 7). We’ve edited the draft to make this clearer and more clearly delineate what is supported and not supported by our data. Replicate variation for the control replicates of the extraction and sequencing process, and the exact read counts of the experiment, are available in Supplemental Tables S5, S6, and S7.

      The statistical analysis of trade-off is not clear: which null model was tested? No frequency change? In my opinion, two significances are needed: a significant difference between parental and embryo and then embryo and adult offspring. The issue with this is, however, that the embryo data are used twice and an error in estimating the frequency of the embryos could be easily mistaken as antagonistic selection.

      Hopefully the description of our null model is clearer in the text, now starting around line 967 in the Methods. We are aware of the positive dependence when performing tests comparing the paternal to embryo and then embryo to offspring frequencies, and this is accounted for by our analysis strategy - see lines 1009-1012.

      It was not clear how the authors adjusted their chi-squared test expectations. Were they reinventing the wheel? There is an improved version of the chi-squared test, which accounts for sampling variation.

      We did not actually perform chi-square tests. Instead, we used the chi statistic from the chi-squared test as a quantitative summary of the differences in read counts between samples. We compared an observed value of chi to values for this statistic obtained from simulated replicates of the experiment. Sampling from this simulation generated our ‘expected’ distribution of read counts, sampled to match sources of variance introduced in the experimental procedure, but without any effect of natural selection, per lines 825ff in the original submission. Hence, we are approximating the likelihood of observing an empirical chi statistic by generating random draws from a model of the experiment and comparing values calculated from each draw to the experimental value: a Monte Carlo method of approximating a p-value for our data. We have attempted to make the structure of these simulations and their use as a null-model clearer in this draft.

      It is not sufficiently motivated why the authors model differences in the extraction procedure with a binomial distribution.

      Adding a source of variance here seemed necessary as running control sequencing replicates revealed that there was residual variance not fully recapitulated by sample-size-dependent resampling. Given that we were still sampling a number of draws from a binomial outcome (the read being from the inverted or standard arrangement), a binomial distribution seemed a reasonable model, and we fit the level of this additional noise source to an experiment-wide constant, read-count or genome-count independent parameter that best fit the variance observed in the controls (lines 830ff in the original draft). Clarification is made in this manuscript draft, lines 979-989.

      How many reads were obtained from each amplicon? It looks like the authors tried to mimic differences between technical replicates by a binomial distribution, which matches the noise for a given sample size, but this depends on the sequence coverage of the technical replicates.

      We provide read counts in Supplemental Tables S6 and S7. The relevant paragraph in the methods has been edited for clarity, lines 972ff. Accounting for sampling differences between replicates used a hypergeometric distribution for paternal samples to account for paternal mortality before collection, and the rest were resampled with a binomial distribution. There were two additional binomial samplings, to account for resampling the read counts and to capture further residual variance in the library prep that did not seem to depend on either allele or read counts.

      It would be good to see an estimate for the strength of selection: 10% difference in a single generation appears rather high to me.

      Estimates of selection strength based on solving for a Wright-Fisher selection coefficient for each tested comparison can now be found in Table S8, mentioned in text on lines 589-590. The mean magnitude of selection coefficients for all paternal to embryo comparisons was 0.322, and for embryo to all adult offspring it was 0.648. For In(3L)Ok the mean selection coefficients were 0.479 and -0.53, and for In(3R)K they were -0.189 and 1.28, respectively. Some are of quite large magnitude, but we emphasize that the coefficients for embryo to adult are based on survival to old age, rather than developmental viability. That factor, in addition to the laboratory environment, makes these estimates distinct from selection coefficients that might be experienced in natural populations.

      Reviewer #3 (Public Review):

      Strengths:

      (1) …the authors developed and used a new simulator (although it was not 100% clear as to why SLiM could not have been used as SLiM has been used to study inversions).

      Before SLiM 3.7 or so (and including when we did the bulk of our simulation work), we do not think it would have been feasible to use SLiM to model the mutation of inversions with random breakpoints and recombination between without altering the SLiM internals. Separately, needing to script custom selection, mutation, and recombination functions in Eidos would have slowed SLiM down significantly. Given our greater familiarity with python and numpy, and the ability to implement a similar efficiency simulator more quickly than through learning C++ and Eidos, we chose to write our own.

      It should be a fair bit easier to implement comparable simulations in SLiM now, but it will still require scripting custom mutation, selection, and recombination functions and would still result in a similarly slow runtime. The current script recipe recommended by SLiM for simulating inversions uses constants to specify the breakpoints of a single inversion, without the ability to draw multiple inversions from a mutational distribution, or model recombination between more complicated karyotypes. Hence, our simulator still seems to be a more versatile and functional option for the purposes of this study.

      Weaknesses:

      [Comments 1 through 4 on Weaknesses included numerous citation suggestions, and some discussion recommendations as well. In our revised manuscript, we have substantially implemented these suggestions. In particular, we have deepened our introduction of mechanisms of balancing selection and prior work on inversion polymorphism, integrating many

      suggested references. While especially helpful, these suggestions are too extensive to completely quote and respond to in this already-copious document. Therefore, we focus our response on two select topics from these comments, and then proceed to comment 5 thereafter.]

      (2) The general reduction principle and inversion polymorphism. In Section 1.2., the authors state that "there has not been a proposed mechanism whereby alleles at multiple linked loci would directly benefit from linkage and thereby maintain an associated inversion polymorphism under indirect selection." Perhaps I am misunderstanding something, but in my reading, this statement is factually incorrect. In fact, the simplest version of Dobzhansky's epistatic coadaptation model

      (see Charlesworth 1974; also see Charlesworth and Charlesworth 1973 and discussion in Charlesworth & Flatt 2021; Berdan et al. 2023) seems to be an example of exactly what the authors seem to have in mind here: two loci experiencing overdominance, with the double heterozygote possessing the highest fitness (i.,e., 2 loci under epistatic selection, inducing some degree of LD between these loci), with subsequent capture by an inversion; in such a situation, a new inversion might capture a haplotype that is present in excess of random expectation (and which is thus filer than average)…

      We agree that the quoted statement could be misleading and have rewritten it. We intended to point out that we are presenting a model in which all loci contribute additively (with respect to display) or multiplicatively (with respect to survival probability), without any dominance relationships or genetic interaction terms. And yet, the model generates epistatic balancing selection in a panmictic population under a constant environment. This represents a novel mechanism by which (the life-history characteristics of) a population would generate epistatic balancing selection as an emergent property, instead of assuming a priori that there is some balancing mechanism and representing frequency dependence, dominance effects, or epistatic interactions directly using model parameters. We have therefore refined the scope of the statement in question (lines 155-158). 

      (4) Hearn et al. 2022 on Littorina saxatilis snails. 

      A good reference. There is considerable work on ecotype-associated inversions in L. saxatalis, but we previously cut some discussion of this and of other populations with high gene flow but identifiable spatial structure for inversion-associated phenotypes (e.g. butterfly mimicry polymorphisms, Mimulus, etc.). Due to the spatially discrete environmental preferences and sampled ranges of the inversions in these populations, we considered these examples to be somewhat distinct from explaining inversion polymorphism in a potentially homogenous and panmictic environment. 

      (4) cont. A very interesting paper that may be worth discussing is Connallon & Chenoweth (2019) about dominance reversals of antagonistically selected alleles (even though C&C do not discuss inversions): AP alleles (with dominance reversals) affecting two or more life-history traits provide one example of such antagonistically selected alleles (also see Rose 1982, 1985; Curtsinger et al. 1994) and sexually antagonistically selected alleles provide another. The two are of course not necessarily mutually exclusive, thus making a conceptual connection to what the authors model here.

      We had removed a previously drafted discussion of dominance reversal for brevity’s sake, but this topic is once again represented in the updated draft of the manuscript with a short reference in the introduction, lines 76-80. We also mention ‘segregation lift’ (Wittmann et al. 2017) involving a similar reversal of dominance for fitness between temporally fluctuating conditions, as opposed to between sexes or life history stages. 

      (5) The model. In general, the description of the model and of the simulation results was somewhat hard to follow and vague. There are several aspects that could be improved:  [5](1) it would help the reader if the terminology and distinction of inverted vs. standard arrangements and of the three karyotypes would be used throughout, wherever appropriate.

      We have attempted to do so, using the suggested heterokaryotypic/homokaryotypic terminology.

      [5](2) The mention of haploid populations/situations and haploid loci (e.g., legend to Figure 1) is somewhat confusing: the mechanism modelled here, of course, requires suppressed recombination in the inversion/standard heterokaryotype; and thus, while it may make sense to speak of haplotypes, we're dealing with an inherently diploid situation. 

      While eukaryotes with haploid-dominant life history may still experience similar dynamics, we do expect that most male display competition is in diploid animals, and we are only simulating diploid fitnesses and experimenting with diploid Drosophila. We have tried to minimize the discussion of haploids in this draft.

      [5](3) The authors have a situation in mind where the 2 karyotypes (INV vs. STD) in the heterokaryotype carry distinct sets of loci in LD with each other, with one karyotype/haplotype carrying antagonistic variants favoring high male display success and with the other karyotype/haplotype carrying non-antagonistic alternative alleles at these loci and which favor survival. Thus, at each of the linked loci, we have antagonistic alleles and non-antagonistic alleles - however, the authors don't mention or discuss the degree of dominance of these alleles. The degree of dominance of the alleles could be an important consideration, and I found it curious that this was not mentioned (or, for that matter, examined). 

      In this study, our goal was to show that the investigated model could produce balanced and increasing antagonism without the need to invoke dominance. We think there would be a strong case for a follow-up study that more investigates how dominance and other variables impact the parameter space of balanced antagonism, but this goal is beyond our capacity to pursue in this initial study. We’ve added several lines clarifying the absence of dominance from our investigated models, and pointing out that dominance could modulate the predictions of these models (lines 211-213, 278-282).  

      [5](4) In many cases, the authors do not provide sufficient detail (in the main text and the main figures) about which parameter values they used for simulations; the same is true for the Materials & Methods section that describes the simulations. Conversely, when the text does mention specific values (e.g., 20N generations, 0.22-0.25M, etc.), little or no clear context or justification is being provided. 

      We have sought to clarify in this draft that 20N was chosen as an ample time frame to establish equilibrium levels and frequencies of genetic variation under neutrality. We present a time sequence in Figure 5, and these results indicate that that antagonism has stabilized in models without inversions or with higher recombination rates, whereas its rate of increase has slowed in a model with inversions and lower levels of crossing over. 

      The inversion breakpoints and the position of the locus with stronger antagonistic effects in Figure 4 were chosen arbitrarily for this simple proof of concept demonstration, with the intent that this locus was close to one breakpoint. Hopefully these and other parameters are clearer in the revised manuscript.

      [5](5) The authors sometimes refer to "inversion mutation(s)" - the meaning of this terminology is rather ambiguous.

      Edited, hopefully the wording is clearer now. The quoted phrase had uniformly referred to the origin of new inversions by a mutagenic process. 

      (6) Throughout the manuscript, especially in the description and the discussion of the model and simulations, a clearer conceptual distinction between initial "capture" and subsequent accumulation / "gain" of variants by an inversion should be made. This distinction is important in terms of understanding the initial establishment of an inversion polymorphism and its subsequent short- as well as long-term fate. For example, it is clear from the model/simulations that an inversion accumulates (sexually) antagonistic variants over time - but barely anything is said about the initial capture of such loci by a new inversion.

      We do not have a good method of assessing a transition between these two phases for the simulations in which both antagonistic alleles and inversions arise stochastically by a mutagenic process. However, we have tried to be clearer on the distinction in this draft: we have included simulations in Figure 4 with variants starting at lower frequencies, and we have tried to better contextualize the temporal trajectories in Figure 5 as (in part) modeling the accumulation of variants after such an origin.

      Reviewer #3 (Recommendations For The Authors):

      - In general: the whole paper is quite long, and I felt that many parts could be written more clearly and succinctly - the whole manuscript would benefit from shortening, polishing, and making the wording maximally precise. Especially the Introduction (> 8 pages) and Discussion (7.5 pages) sections are quite long, and the description of the model and model results was quite hard to follow.

      We have attempted to condense some portions of the manuscript, but inevitably added to others based on important reviewer suggestions. Regarding the length Introduction and Discussion, we are covering a lot of intellectual territory in this study, and we aim to make it accessible to readers with less prior familiarity. At this point, we have well over 100 citations – far more than a typical primary research paper – in part thanks to the relevant sources provided by this reviewer. We are therefore optimistic that our text will provide a valuable reference point for future studies. We have also made significant efforts to clarify the Results and Methods text in this draft without notably expanding these sections.

      - In general: the conceptual parts of the paper (introduction, discussion) could be better connected to previous work - this concerns e.g. the theoretical mechanisms of balancing selection that might be involved in maintaining inversions; the general, theoretical role of antagonistic pleiotropy (AP) and trade-offs in maintaining polymorphisms; previously made empirical connections between inversions and AP/trade-offs; previously made empirical connections between inversions and sexual antagonism.

      In the revised manuscript, we have improved the connection of these topics to prior work.

      - L3: "accumulate". A clearer distinction could be made, throughout, between initial capture of alleles/haplotypes by an inversion vs. subsequent gain.

      Please see point 6 in the response to the Public Review, above.

      - L29: I basically agree about the enigma, however, there are quite many empirical examples in D. melanogaster / D. pseudoobscura and other species where we do know something about the nature of selection involved, e.g., cases of NFDS, spatially and temporally varying selection, fitness trade-offs, etc.

      At least for our focal species, we have emphasized that geographic (and now temporal) associations have been found for some inversions. For the sake of length and focus, we probably should not go down the road of documenting each phenotypic association that has been reported for these inversions, or say too much about specific inversions found in other species. As indicated in our response to reviewer 2, some previously documented inversion-associated trade-offs may be compatible with the model presented here. However, we did locate and add to our Discussion one report of frequency-dependent selection on a D. melanogaster inversion (Nassar et al. 1973).

      - L43: it is actually rather unlikely, though not impossible, that new inversions are ever completely neutral (see the review by Berdan et al. 2023).

      This line was intended to convey that, in line with Said et al. 2018’s results, the structural alterations involved in common segregating inversions are not expected to contribute significantly to the phenotype and fitness (as indicated by lack of strong regulatory effects), and that their phenotypic consequences are instead due to linked variation. We have rewritten this passage to better communicate this point, now lines 44-52. Interpreting Section 2 and Figure 1 of Berdan et al. 2023, the linked variation may be what is in mind when saying that inversions are almost never neutral. We have also added a line referencing the expected linked variation of a new inversion (lines 49-52).

      - L51-73: I felt this overview should be more comprehensive. The model by Kirkpatrick & Barton (2016 ) is in many ways less generic than the one of Charlesworth (1974) which essentially represents one way of modeling Dobzhansky's epistatic coadaptation. Also, the AOD mechanism is perhaps given too much weight here as this mechanism is very unlikely to be able to explain the establishment of a balanced inversion polymorphism (see Charlesworth 2023 preprint on bioRxiv). NFDS, spatially varying selection and temporally varying selection (for all of which there is quite good empirical evidence) should all be mentioned here, including the classical study of Wright and Dobzhansky (1946) which found evidence for NFDS (also see Chevin et al. 2021 in Evol. Lett.)

      On reflection, we agree that we put too much emphasis on AOD and have edited the section to be more representative.

      - L57. Two earlier Dobzhansky references, about epistatic coadaptation, would be: Dobzhansky, T. (1949). Observations and experiments on natural selection in Drosophila. Hereditas, 35(S1), 210-224. hlps://doi.org/10.1111/j.1601-5223.1949.tb033 34.xM; Dobzhansky, T. (1950). Genetics of natural populations. XIX. Origin of heterosis through natural selection in populations of Drosophila pseudoobscura. Genetics, 35, 288-302.hlps://doi.org/10.1093/gene7cs/35.3.288 - In general, in the introduction, the classical chapter by Lemeunier and Aulard (1992) should be cited as the primary reference and most comprehensive review of D. melanogaster inversion polymorphisms.

      - L101: this is of course true, though there are some exceptions, such as In(3R)Mo.

      - L110: the papers by Knibb, the chapter by Lemeunier and Aulard (1992), and the meta-analysis of INV frequencies by Kapun & Flatt (2019) could be cited here as well.

      Citation suggestions integrated.

      - L123 and elsewhere: the common D. melanogaster inversions are old but perhaps not THAT old - if we take the Corbett-Detig & Hartl (2012) es7mates, then most of them do not really exceed an age of Ne generations, or at least not by much. I mean: yes, they are somewhat old but not super-old (cf. discussion in Andolfatto et al. 2001).

      Edited to curb any hyperbole. We agree that there are much more ancient polymorphisms in populations.

      - L133-135. This needs to be rewritten: this claim is incorrect, to my mind (Charlesworth 1974; also see Charlesworth and Charlesworth 1973; discussion in Charlesworth & Flatt 2021).

      Edited. See public review response (2).

      - L154: the example of inversion polymorphism is actually explicitly discussed in Altenberg's and Feldman's (1987) paper on the reduction principle.

      Edited to mention this. Inversions are also mentioned in Feldman et al. 1980, Feldman and Balkau 1973, Feldman 1972, and have been in discussion since the origins of the idea.

      - L162ff: see Connallon & Chenoweth (2019).

      Citation suggestion integrated, along with Cox & Calsbeek 2009 which seems more directly applicable, now line 185ff.

      - L169: why? There is much evidence for other important trade-offs in this system.

      Reworded.

      - L178-179: other studies have found that trade-offs/AP contribute to the maintenance of inversion polymorphisms, e.g. Mérot et al. 2020 and Betrán et al. 1998, etc.

      Added Betrán et al. 1998 - a good reference. Moved up mention of Mérot et al. 2020 from later in the text and directed readers to the Discussion, lines 202-205.

      - L198. "alternate inversion karyotypes" - you mean INV vs. STD? It would be good to adopt a maximally clear, uniform terminology throughout.

      Edited to communicate this better.

      - L215-217: this is a theoretically well-known result due to Hazel (1943); Dickerson (1955); Robertson (1955); e.g., see the discussion in the quantative genetics book by Roff (1997) or in the review of Flatt (2020).

      Citations integrated, now lines 232ff.

      - L223 and L245: "haploid" - somewhat confusing (see public review). 

      - L259-260: This may need some explanation. 

      - L261-262: simply state that there is no recombination in D. melanogaster males.

      Edited for increased clarity.

      - L274 (and elsewhere): the meaning of "mutation...of new..inversion polymorphisms" is ambiguous - do you mean a polymorphic inversion and hence a new inversion polymorphism or do you mean polymorphisms/variants accumulating in an inversion?

      - L275: maybe better heterokaryotypic instead of heterozygous? (note that INV homokaryotypes or STD homokaryotypes can be homo- or heterozygous, so when referring to chromosomal heterozygotes instead of heterozygous chromosomes it may be best to refer to heterokaryotypes).

      Per [5](1) and [5](5) in the public review, we have edited our terminology.

      - L276: referral to M&M - I found the description of the model/simulation details there to be somewhat vague, e.g. in terms of parameter settings, etc.

      Further described.

      - L281-282: would SLiM not have worked?

      See public review response.

      - L286-287: why these parameters?

      Further described.

      - L296ff: it is not immediately clear that the loci under consideration are polymorphic for antagonistic alleles vs. non-antagonistic alternative alleles - maybe this could be made clear very explicitly.

      Edited to be explicit as suggested.

      - L341, 343: "inversion mutation" - meaning ambiguous.

      - L348, 352: "specified rate" - vague.

      - L354-357: initial capture and/or accumulation/gain? 

      - L401, 402, 404: Z-, W- and Y- are brought up here without sufficient context/explanation.

      The above have been addressed by edits in the text.

      - L523, 557, 639, 646, and elsewhere: not the first evidence - see the paper by Mérot et al. (2020) (and e.g. also by Yifan Pei et al. (2023)). 

      Citations integrated in the introduction and discussion. Mérot et al. (2020) was cited (L486 in original) but discussion was curtailed in the previous draft. 

      - L558-559. I agree but it is clear that there are many mechanisms of balancing selection that can achieve this, at least in principle; for some of them (NFDS, etc.) we have pretty good evidence. 

      - L576-577. This is correct but for In(3R)C that study did find a differential hot vs. cold selection response.

      Addressed with text edit. 

      - L584-L586: cf. Betrán et al. (1998), Mérot et al. (2020), Pei et al. (2023), etc.

      - L591. "other forms of balancing selection": yes! This should be stressed throughout. Multiple forms of balancing selection exist and they are not mutually exclusive. 

      - L593: consider adding Dobzhansky (1943), Machado et al. (2021) 

      - L596-597: this is rather unlikely, at least in terms of inversion establishment (see Charlesworth 2023; hlps://www.biorxiv.org/content/10.1101/2023.10.16.562579v1).

      - L608: consider adding Kapun & Flal (2019). 

      - L611-612: see studies by Mukai & Yamaguchi, 1974; and Watanabe et al., 1976. 

      - L639, 646: AP - see general literature on AP as a factor in maintaining polymorphism (Rose

      1982, 1985; Curtsinger et al. 1994; Charlesworth & Hughes 2000 chapter in Lewontin Festschrift; Conallon & Chenoweth 2019 - this latter paper is par7cularly relevant in terms of AP effects in the context of sexual antagonism) 

      Citation suggestions integrated.

      - L657: inversion polymorphism is explicitly discussed in Altenberg's and Feldman's (1987) paper on the reduction principle.

      Hopefully this is better communicated.

      - L724-755: I felt that this section generally lacks sufficient details, especially in terms of parameter choices and settings for the simula7ons. 

      - L732L: why not state these rates?

      Parameter values are now given a fuller description in figure legends and in the methods.  

      - L746: but we know that mutational effect sizes are not uniformly distributed (?).

      We made this choice for simplicity and to avoid invoking seemingly arbitrary distribution, but one could instead simulate trait effects with some gamma distribution. Display values would still have variable fitness effects that fluctuate with population composition, but we agree that distribution shifted toward small effects would be more realistic.

      - L765: In(3R)P is not mentioned elsewhere - is this really correct?

      That was incorrect, fixed.

    1. Author response:

      Public Reviews:

      Reviewer #1 (Public Review):

      Malaria parasites detoxify free heme molecules released from digested host hemoglobins by biomineralizing them into inert hemozoin. Thus, why malaria parasites retain PfHO, a dead enzyme that loses the capacity of catabolizing heme, is an outstanding question that has puzzled researchers for more than a decade. In the current manuscript, the authors addressed this question by first solving the crystal structure of PfHO and aligning it with structures of other heme oxygenase (HO) proteins. They found that the N-terminal 95 residues of PfHO, which failed to crystalize due to their disordered nature, may serve as signal and transit peptides for PfHO subcellular localization. This was confirmed by subsequent microscopic analysis with episomally expressed PfHO-GFP and a GFP reporter fused to the first 83 residues of PfHO (PfHO N-term-GFP). To investigate the functional importance of PfHO, the authors generated an anhydrotetracycline (aTC) controlled PfHO knockdown strain. Strikingly, the parasites lacking PfHO failed to grow and lost their apicoplast. Finally, by chromatin immunoprecipitation (ChIP), quantitative PCR/RT-PCR, and growth assays, the authors showed that both the cognate N-terminus and HO-like domain were required for PfHO function as an apicoplast DNA interacting protein.

      The authors systemically performed multidisciplinary approaches to address this difficult question: what is the function of this enzymatically dead PfHO? I enjoyed reading this manuscript and its thoughtful discussion. This study is not of clinical importance for antimalarial treatments but also deepens our understanding of protein function evolution. While I understand these experiments are challenging to conduct in malaria parasites, the data quality of some of the experiments could be improved. For example, most of the Western blots and Southern blots are not of high quality.

      We thank the reviewer for the positive comments but are a bit puzzled by the final statement about western and Southern blot quality. We agree that the two anti-PfHO western blots probed with custom antibody (Fig. 3- source data 2 and 8) have substantial background signal in the higher molecular mass region >75 kDa. However, we note that the critical region <50 kDa is clear in both cases and readily enables target band visualization. All other western blots probing GFP or HA epitopes are of high quality with minimal off-target background. We present two Southern blot images. We agree that the signal is somewhat faint for the Southern blot demonstrating on-target integration of the aptamer/TetR-DOZI plasmid (Fig. 3- fig. supplement 4), although we note that the correct band pattern for integration is visible. We also note that the accompanying genomic PCR data is unambiguous. The Southern blot for GFP-DHFRDD incorporation into the PfHO locus (Fig. 3- fig. supplement 1) has clear signal and strongly supports on-target integration. The minor background signal in the lower left region of the image does not extend into nor impact interpretation of correct clonal integration.

      Reviewer #2 (Public Review):

      Summary:

      Blackwell et al. investigated the structure, localization, and physiological function of Plasmodium falciparum (Pf) heme oxygenase (HO). Pf and other malaria parasites scavenge and digest large amounts of hemoglobin from red cells for sustenance. To counter the potentially cytotoxic effects of heme, it is biomineralized into hemozoin and stored in the food vacuole. Another mechanism to counteract heme toxicity is through its enzymatic degradation via heme oxygenases. However, it was previously found by the authors that PfHO lacks the ability to catalyze heme degradation, raising the intriguing question of what the physiological function of PfHO is. In the current contribution, the authors determine that PfHO localizes to the apicoplast, determine its targeting sequence, establish the essentiality of PfHO for parasite viability, and determine that PfHO is required for proper maintenance of apicoplasts and apicoplast gene expression. In sum, the authors establish an essential physiological function for PfHO, thereby providing new insights into the role of PfHO in plasmodium metabolism.

      Strengths:

      The studies are rigorously conducted and the results of the experiments unambiguously support a role for PfHO as being an apicoplast-targeted protein required for parasite viability and maintenance of apicoplasts.

      Weaknesses:

      While the studies conducted are rigorous and support the primary conclusions, the lack of experiments probing the molecular function of PfHO limits the impact of the work. Nevertheless, the knowledge that PfHO is required for parasite viability and plays a role in the maintenance of apicoplasts is still an important advance.

      We appreciate the positive assessment. We agree that further mechanistic understanding of PfHO function remains a key future challenge. Indeed, we made extensive efforts to unravel PfHO interactions that underpin its critical function. We elucidated key interactions with the apicoplast genome, reliance on the electropositive N-terminus, association with DNA-binding proteins, and a specific defect in apicoplast mRNA levels. The major limitation we faced in further defining PfHO function is the general lack of understanding of apicoplast transcription and broader gene expression. That limitation and the challenges to overcome it go well beyond our study and will require concerted efforts across several manuscripts (likely by multiple groups) to define the mechanistic features of apicoplast gene expression. We look forward to contributing further molecular understanding of PfHO function as broader understanding of apicoplast transcription emerges.

    1. Author response:

      Public Reviews:

      Reviewer #1 (Public Review):

      Summary:

      This paper investigates the effects of the explicit recognition of statistical structure and sleep consolidation on the transfer of learned structure to novel stimuli. The results show a striking dissociation in transfer ability between explicit and implicit learning of structure, finding that only explicit learners transfer structure immediately. Implicit learners, on the other hand, show an intriguing immediate structural interference effect (better learning of novel structure) followed by successful transfer only after a period of sleep.

      Strengths:

      This paper is very well written and motivated, and the data are presented clearly with a logical flow. There are several replications and control experiments and analyses that make the pattern of results very compelling. The results are novel and intriguing, providing important constraints on theories of consolidation. The discussion of relevant literature is thorough. In summary, this work makes an exciting and important contribution to the literature.

      Weaknesses:

      There have been several recent papers that have identified issues with alternative forced choice (AFC) tests as a method of assessing statistical learning (e.g. Isbilen et al. 2020, Cognitive Science). A key argument is that while statistical learning is typically implicit, AFC involves explicit deliberation and therefore does not match the learning process well. The use of AFC in this study thus leaves open the question of whether the AFC measure benefits the explicit learners in particular, given the congruence between knowledge and testing format, and whether, more generally, the results would have been different had the method of assessing generalization been implicit. Prior work has shown that explicit and implicit measures of statistical learning do not always produce the same results (eg. Kiai & Melloni, 2021, bioRxiv; Liu et al. 2023, Cognition).

      We agree that numerous papers in the Statistical Learning literature discuss how different test measures can lead to different results and, in principle, using a different measure could have led to varying results in our study. In addition, we believe there are numerous additional factors relevant to this issue including the dichotomous vs. continuous nature of implicit vs. explicit learning and the complexity of the interactions between the (degree of) explicitness of the participants' knowledge and the applied test method that transcend a simple labeling of tests as implicit or explicit and that strongly constrains the type of variations the results of  different test would produce. Therefore, running the same experiments with different learning measures in future studies could provide additional interesting data with potentially different results.

      However, the most important aspect of our reply concerning the reviewer's comment is that although quantitative differences between the learning rate of explicit and implicit learners are reported in our study, they are not of central importance to our interpretations. What is central are the different qualitative patterns of performance shown by the explicit and the implicit learners, i.e., the opposite directions of learning differences for “novel” and “same” structure pairs, which are seen in comparisons within the explicit group vs. within the implicit group and in the reported interaction. Following the reviewer's concern, any advantage an explicit participant might have in responding to 2AFC trials using “novel” structure pairs should also be present in the replies of 2AFC trials using the “same” structure pairs and this effect, at best, could modulate the overall magnitude of the across groups (Expl/Impl.) effect but not the relative magnitudes within one group. Therefore, we see no parsimonious reason to believe that any additional interaction between the explicitness level of participants and the chosen test type would impede our results and their interpretation. We will make a note of this argument in the revised manuscript.

      Given that the explicit/implicit classification was based on an exit survey, it is unclear when participants who are labeled "explicit" gained that explicit knowledge. This might have occurred during or after either of the sessions, which could impact the interpretation of the effects.

      We agree that this is a shortcoming of the current design, and obtaining the information about participants’ learning immediately after Phase 1 would have been preferred. However, we made this choice deliberately as the disadvantage of assessing the level of learning at the end of the experiment is far less damaging than the alternative of exposing the participants to the exit survey question earlier and thereby letting them achieve explicitness or influence their mindset otherwise through contemplating the survey questions before Phase 2. Our Experiment 5 shows how realistic this danger of unwanted influence is: with a single sentence alluding to pairs in the instructions of Exp 5, we  could completely change participants' quantitative performance and qualitative response pattern. Unfortunately, there is no implicit assessment of explicitness we could use in our experimental setup. We also note that given the cumulative nature of statistical learning, we expect that the effect of using an exit survey for this assessment only shifts absolute magnitudes (i.e. the fraction of people who would fall into the explicit vs. implicit groups) but not aspects of the results that would influence our conclusions.

      Reviewer #2 (Public Review):

      Summary:

      Sleep has not only been shown to support the strengthening of memory traces but also their transformation. A special form of such transformation is the abstraction of general rules from the presentation of individual exemplars. The current work used large online experiments with hundreds of participants to shed further light on this question. In the training phase, participants saw composite items (scenes) that were made up of pairs of spatially coupled (i.e., they were next to each other) abstract shapes. In the initial training, they saw scenes made up of six horizontally structured pairs, and in the second training phase, which took place after a retention phase (2 min awake, 12 h incl. sleep, 12 h only wake, 24 h incl.

      sleep), they saw pairs that were horizontally or vertically coupled. After the second training phase, a two-alternatives-forced-choice (2-AFC) paradigm, where participants had to identify true pairs versus randomly assembled foils, was used to measure the performance of all pairs. Finally, participants were asked five questions to identify, if they had insight into the pair structure, and post-hoc groups were assigned based on this. Mainly the authors find that participants in the 2-minute retention experiment without explicit knowledge of the task structure were at chance level performance for the same structure in the second training phase, but had above chance performance for the vertical structure. The opposite was true for both sleep conditions. In the 12 h wake condition these participants showed no ability to discriminate the pairs from the second training phase at all.

      Strengths:

      All in all, the study was performed to a high standard and the sample size in the implicit condition was large enough to draw robust conclusions. The authors make several important statistical comparisons and also report an interesting resampling approach. There is also a lot of supplemental data regarding robustness.

      Weaknesses:

      My main concern regards the small sample size in the explicit group and the lack of experimental control.  

      The sample sizes of the explicit participants in our experiments are, indeed, much smaller than those of the implicit participants due to the process of how we obtain the members of the two groups. However, these sample sizes of the explicit groups are not small at all compared to typical experiments reported in Visual Statistical Learning studies, rather they tend to be average to large sizes. It is the sizes of the implicit subgroups that are unusually high due to the aforementioned data collecting process. Moreover, the explicit subgroups have significantly larger effect sizes than the implicit subgroup, bolstering the achieved power that is also confirmed by the reported Bayes Factors that support the “effect” or the “no effect” conclusions in the various tests ranging in value from substantial to very strong.  Based on these statistical measures,  we think the sample sizes of the explicit participants in our studies are adequate.

      However, we do agree that the unbalanced nature of the sample and effect sizes can be problematic for the between-group comparisons. We aim to replace the student’s t-tests that directly compares explicit and implicit participants with Welch’s t-tests that are better suited for unequal sample sizes and variances.

      As for the lack of experimental control, indeed, we could not fully randomize consolidation condition assignment. Instead, the assignment was a product of when the study was made available on the online platform Prolific. This method could, in theory, lead to an unobserved covariate, such as morningness, being unbalanced between conditions. We do not have any reasons to believe that such a condition would critically alter the effects reported in our study, but as it follows from the nature of unobserved variables, we obviously cannot state this with certainty. Therefore, we will explicitly discuss these potential pitfalls in the revised version of the manuscript.  

      Reviewer #3 (Public Review):

      In this project, Garber and Fiser examined how the structure of incidentally learned regularities influences subsequent learning of regularities, that either have the same structure or a different one. Over a series of six online experiments, it was found that the structure (spatial arrangement) of the first set of regularities affected the learning of the second set, indicating that it has indeed been abstracted away from the specific items that have been learned. The effect was found to depend on the explicitness of the original learning: Participants who noticed regularities in the stimuli were better at learning subsequent regularities of the same structure than of a different one. On the other hand, participants whose learning was only implicit had an opposite pattern: they were better in learning regularities of a novel structure than of the same one. This opposite effect was reversed and came to match the pattern of the explicit group when an overnight sleep separated the first and second learning phases, suggesting that the abstraction and transfer in the implicit case were aided by memory consolidation.

      These results are interesting and can bridge several open gaps between different areas of study in learning and memory. However, I feel that a few issues in the manuscript need addressing for the results to be completely convincing:

      (1) The reported studies have a wonderful and complex design. The complexity is warranted, as it aims to address several questions at once, and the data is robust enough to support such an endeavor. However, this work would benefit from more statistical rigor. First, the authors base their results on multiple t-tests conducted on different variables in the data. Analysis of a complex design should begin with a large model incorporating all variables of interest. Only then, significant findings would warrant further follow-up investigation into simple effects (e.g., first find an interaction effect between group and novelty, and only then dive into what drives that interaction). Furthermore, regardless of the statistical strategy used, a correction for multiple comparisons is needed here. Otherwise, it is hard to be convinced that none of these effects are spurious. Last, there is considerable variation in sample size between experiments. As the authors have conducted a power analysis, it would be good to report that information per each experiment, so readers know what power to expect in each.

      Answering the questions we were interested in required us to investigate two related but separate types of effects within our data: general above-chance performance in learning, and within- and across-group differences.

      Above-chance performance: As typical in SL studies, we needed to assess whether learning happened at all and which types of items were learned. For this, a comparison to the chance level is crucial and, therefore, one-sample t-test is the statistical test of choice. Note that all our t-tests were subject to experiment-wise correction for multiple comparisons using the Holm-Bonferroni procedure, as reported in the Supplementary Materials.

      Within- and across-group differences: To obtain our results regarding group and partype differences and their interactions, we used mixed ANOVAs and appropriate post-hoc tests as the reviewer suggested. These results are reported in the method section.

      Concerning power analysis, we will add the requested information on achieved power by experiment to the revised version of the manuscript.  

      (2) Some methodological details in this manuscript I found murky, which makes it hard to interpret results. For example, the secondary results section of Exp1 (under Methods) states that phase 2 foils for one structure were made of items of the other structure. This is an important detail, as it may make testing in phase 2 easier, and tie learning of one structure to the other. As a result, the authors infer a "consistency effect", and only 8 test trials are said to be used in all subsequent analyses of all experiments. I found the details, interpretation, and decision in this paragraph to lack sufficient detail, justification, and visibility. I could not find either of these important design and analysis decisions reflected in the main text of the manuscript or in the design figure. I would also expect to see a report of results when using all the data as originally planned.  

      We thank the reviewer for pointing out these critical open questions our manuscript that need further clarification. The inferred “consistency effect” is based on patterns found in the data, which show an increase in negative correlation between test types during the test phase. As this is apparently an effect of the design of the test phase and not an effect of the training phase, which we were interested in, we decided to minimize this effect as far as possible by focusing on the early test trials. For the revised version of the manuscript, we will revamp and expand how this issue was handled and also add a short comment in the main text, mentioning the use of only a subset of test trials and pointing the interested reader to the details.

      Similarly, the matched sample analysis is a great addition, but details are missing. Most importantly, it was not clear to me why the same matching method should be used for all experiments instead of choosing the best matching subgroup (regardless of how it was arrived at), and why the nearest-neighbor method with replacement was chosen, as it is not evident from the numbers in Supplementary Table 1 that it was indeed the best-performing method overall. Such omissions hinder interpreting the work.

      Since our approach provided four different balanced metrics (see Supp. Tables 1-4) for each matching method, it is not completely straightforward to make a principled decision across the methods. In addition, selecting the best method for each experiment separately carries the suspicion of cherry-picking the most suitable results for our purposes. For the revised version, we will expand on our description of the matching and decision process and add additional descriptive plots showing what our data looks like under each matching method for each experiment. These plots highlight that the matching techniques produce qualitatively roughly identical results and picking one of them over the other does not alter the conclusions of the test.  The plots will give the interested reader all the necessary information to assess the extent our design decisions influence our results.

      (3) To me, the most surprising result in this work relates to the performance of implicit participants when phase 2 followed phase 1 almost immediately (Experiment 1 and Supplementary Experiment 1). These participants had a deficit in learning the same structure but a benefit in learning the novel one. The first part is easier to reconcile, as primacy effects have been reported in statistical learning literature, and so new learning in this second phase could be expected to be worse. However, a simultaneous benefit in learning pairs of a new structure ("structural novelty effect") is harder to explain, and I could not find a satisfactory explanation in the manuscript.  

      Although we might not have worded it clearly, we do not claim that our "structural novelty effect" comes from a “benefit” in learning pairs of the novel structure. Rather, we used the term “interference” and lack of this interference. In other words, we believe that one possible explanation is that there is no actual benefit for learning pairs of the novel structure but simply unhindered learning for pairs of the novel structure and simultaneous inference for learning pairs of the same structure. Stronger interference for the same compared to the novel structure items seems as a reasonable interpretation as similarity-based interference is well established in the general (not SL-specific) literature under the label of proactive interference. We will clarify these ideas in the revised manuscript.

      After possible design and statistical confounds (my previous comments) are ruled out, a deeper treatment of this finding would be warranted, both empirically (e.g., do explicit participants collapse across Experiments 1 and Supplementary Experiment 1 show the same effect?) and theoretically (e.g., why would this phenomenon be unique only to implicit learning, and why would it dissipate after a long awake break?).

      Across all experiments, the explicit participants showed the same pattern of results but no significant difference between pair types, probably due to insufficiency of the available  sample sizes. We already included in the main text the collapsed explicit results across Experiments 1-4 and Supplementary Experiment 1 (p. 16).  This analysis confirmed that, indeed, there was a significant generalization for explicit participants across the two learning phases. We could re-run the same analysis for only Experiment 1 and

      Supplementary Experiment 1, but due to the small sample of  N=12 in Suppl. Exp. 1, this test will be likely completely underpowered. Obtaining the sufficient sample size for this one test would require an excessive number (several hundreds) of new participants.  

      In terms of theoretical treatment, we already presented our interpretation of our results in the discussion section, which we can expand on in the revised manuscript.

    1. Author response:

      eLife assessment

      This study presents valuable findings on the role of a well-studied signal transduction pathway, the Slit/Robo system, in the context of the assembly of the hematopoietic niche in the Drosophila embryo. The evidence supporting the claims of the authors is solid. However, one aspect that needs attention is whether the cells are migrating and not being pushed to a more dorsal position through dorsal closure and/or other similar large-scale embryo movement. This does not detract from the very interesting analysis of PSC morphogenesis and will interest developmental biologists working on molecular mechanisms of tissue morphogenesis.

      We appreciate the thoughtful and quite useful comments provided by each of the referees. Our responses are noted below each referee’s comment.

      Public Reviews:

      Reviewer #1 (Public Review):

      Summary:

      The study by Nelson et al. is focused on the formation of the Drosophila Posterior Signaling Center (PSC) which ultimately acts as a niche to support hematopoietic stem cells of the lymph gland (LG). Using a combination of genetics and live imaging, the authors show that PSC cells migrate as a tight collective and associate with multiple tissues during a trajectory that positions them at the posterior of the LG.

      This is an important study that identifies Slit-Robo signaling as a regulator of PSC morphogenesis, and highlights the complex relationship of interacting cell types - PSC, visceral mesoderm (VM), and cardioblasts (CBs) - in the coordinated development of these three tissues during organ development. However, one point requiring clarification is the idea that PSC cells exhibit a collective cell migration; it is not clear that the cells are migrating rather than being pushed to a more dorsal position through dorsal closure and/or other similar large-scale embryo movement. This does not detract from the very interesting analysis of PSC morphogenesis as presented.

      Since each referee asked for clarification concerning collective cell migration, we present a combined response further below, placed after the comments from Reviewer #3.

      Strengths:

      (1) Using the expression of Hid or Grim to ablate associated tissues, they find evidence that the VM and CB of the dorsal vessel affect PSC migration/morphology whereas the alary muscles do not. Slit is expressed by both VM and CBs, and therefore Slit-Robo signaling was investigated as PSCs express Robo.

      (2) Using a combination of approaches, the authors convincingly demonstrate that Slit expression in the CBs and VM acts to support PSC positioning. A strength is the ability to knockdown slit levels in particular tissue types using the Gal4 system and RNAi.

      (3) Although in the analysis of robo mutants, the PSC positioning phenotype is weaker in the individual mutants (robo1 and robo2) with only the double mutant (robo1,robo2) exhibiting a phenotype comparable to the slit RNAi. The authors make a reasonable argument that Slit-Robo signaling has an intrinsic effect, likely acting within PSCs because PSCs show a phenotype even when CBs do not (Figure 4G).

      (4) New insight into dorsal vessel formation by VM is presented in Figure 4A, B, as loss of the VM can affect dorsal vessel morphogenesis. This result additionally points to the VM as important.

      Weaknesses:

      (1) The authors are cautioned to temper the result that Slit-Robo signaling is intrinsic to PSC since the loss of robo may affect other cell types (besides CBs and PSCs) to indirectly affect PSC migration/morphogenesis. In fact, in the robo2, robo1 mutant, the VM appears to be incorrectly positioned (Figure 4G).

      We have reexamined our wording in the relevant Results section and, given that this referee agrees that we, “make a reasonable argument that Slit-Robo signaling has an intrinsic effect, likely acting within PSCs because PSCs show a phenotype even when CBs do not (Figure 4G)”, it was not clear how we might temper our conclusions more. Given that PSC cells express Robo1 and Robo2, and that the Vm does not contact the PSC, our ‘reasonable argument’ appears fair and parsimonious. Since we agree with the referee that a reader should be made as aware as possible of alternatives, we will add a comment to the Discussion, reminding the reader of the possibility of a secondary defect.

      (2) If possible, the authors should use RNAi to knockdown Robo1 and Robo2 levels specifically in the PSCs if a Gal4 is available; might Antp.Gal4 (Fig 1K) be useful? Even if knockdown is achieved in PSCs+CBs, this would be a better/complementary experiment to support the approach outlined in Figure 4D.

      While we agree that PSC-specific knockdown of Robo1 and Robo2 simultaneously would be ideal, this is not possible. First, the most-effective UAS-RNAi transgenes (that is, those in a Valium 20 backbone) are both integrated at the same chromosomal position; these cannot be simultaneously crossed with a GAL4 transgenic line to attempt double knock down. Additionally, as with all RNAi approaches that must rely on efficient knockdown over the rapid embryonic period, even having facile access to the above does not ensure the RNAi approach will cause as effective depletion as the genetic null condition that we use. Second, as the referee concedes, there is no embryonic PSC-specific GAL4. The proposed use of Antp-GAL4 would cause knockdown in many tissues (PSC, CB, Vm, epidermis and amnioserosa). This would lead to a reservation similar to that caused by our use of the straight genetic double mutant, as regards potential indirect requirement for Robo function.

      (3) Movies are hard to interpret, as it seems unclear that the PSCs actively migrate rather than being pushed/moved indirectly due to association with VM and CBs/dorsal vessel.

      First, the Vm does not directly contact the PSC, so it cannot be pushing the PSC dorsally. We will re-examine our text to be certain to make this clear. Second, in our analysis of bin mutants, which lack Vm, LGs and PSCs are able to reach the dorsal midline region in the absence of Vm. Finally, please see our response to Reviewer #3, point 2, for why we maintain that PSC cells are “migrating” even though some PSC cells are attached to CBs.

      Reviewer #2 (Public Review):

      The paper by Nelson KA, et al. explored the collective migration, coalescence, and positioning of the posterior signaling center (PSC) cells in Drosophila embryo. With live imaging, the authors observed the dynamic progress of PSC migration. Throughout this process, visceral mesoderm (VM), alary muscles (Ams), and cardioblasts (CBs) are in proximity to PSC. Genetic ablation of these tissues reveals the requirement for VM and CBs, but not AMs in this process. Genetic manipulations further demonstrated that Slit-Robo signaling was critical during PSC migration and positioning. While the genetic mechanisms of positioning the PSC were explored in much detail, including using live imaging, the functional consequence of mispositioning or (partial) absence of PSC cells has not been addressed, but would much increase the relevance of their findings. A few additional issues need to be addressed as well in this otherwise well-done study.

      Major points:

      (1) The only readout in their experiments is the relative correctness of PSC positioning. Importantly, what is the functional consequence if PSC is not properly positioned? This would be particularly important with robo-sli manipulations, where the PSC is present but some cells are misplaced. What is the consequence? Are the LGs affected, like the specification of their cell types, structure, and function? To address this for at least the robo-slit requirement in the PSC, it may be important to manipulate them directly in the PSC with a split Gal4 system, using Antp and Odd promoters.

      We agree that the functional consequence of PSC mis-positioning is important and a relevant question to eventually address. However, virtually all markers and reagents used to assess the effect of the PSC on progenitor cells and their differentiated descendants are restricted to analyses carried out on the third larval instar - some three days after the experiments reported here. Most of the manipulated conditions in our work are no longer viable at this phase and, thus, addressing the functional consequences of a malformed PSC will require the field to develop new tools. 

      As we noted in the Introduction, the consistency with which the wildtype PSC forms as a coalesced collective at the posterior of the LG strongly suggests importance of its specific positioning and shape, as has now been found for other niches (citations in manuscript). Additionally, in the Discussion we mention the existence of a gap junction-dependent calcium signaling network in the PSC that is important for progenitor maintenance. Without continuity of this network amongst all PSC cells (under conditions of PSC mis-positioning), we strongly anticipate that the balance of progenitors to differentiated hemocytes will be mis-managed, either constitutively, and / or under immune challenge conditions. 

      Finally, to our knowledge, the tools do not exist to build a “split Gal4 system using Antp and Odd promoters”. The expression pattern observed using the genomic Antp-GAL4 line must be driven by endogenous enhancers–none of which have been defined by the field, and thus cannot be used in constructing second order drivers. Similarly, for odd skipped, in the embryo the extant Odd-GAL4 driver expresses only in the epidermis, with no expression in the embryonic LG. Thus, the cis regulatory element controlling Odd expression in the embryonic LG is unknown. In the future, the discovery of an embryonic PSC-specific driver will aid in addressing the specific functional consequences of PSC mis-positioning.

      (2) The densely, parallel aligned fibers in the part of Figure 1J seemed to be visceral mesoderm, but further up (dorsally) that may be epidermis. It is possible that the PSC migrate together with the epidermis? This should be addressed.

      See response to Reviewer #3.

      (3) Although the authors described the standards of assessing PSC positioning as "normal" or "abnormal", it is rather subtle at times and variable in the mutant or KD/OE examples. The criteria should be more clearly delineated and analyzed double-blind, also since this is the only readout. Further examples of abnormal positioning in supplementary figures would also help.

      We appreciate the Reviewer’s concern and acknowledge that the phenotypes we observed were indeed variable, and, at times subtle. As we show and discuss in the paper, our results revealed that the signaling requirements for proper PSC positioning are complex; this was favorably commented upon by Reviewer #1 (“...highlights the complex relationship of interacting cell types - PSC, visceral mesoderm (VM), and cardioblasts (CBs) - in the coordinated development of these three tissues during organ development.…”). We suspect the phenotypic variability is attributable to any number of biological differences such as heterogeneity of PSC cells and an accompanying difference in the timing of their competence to receive and respond to Slit-Robo signaling, the timing of release of Slit from CBs and Vm, number of cells in a given PSC, which PSC cells in the cluster respond to too little or too much signaling, and/or typical variability between organisms. Furthermore, PSC positioning analyses were conducted by two of the authors, who independently came to the same conclusions. For many of the manipulations double blinding was not possible since the genotype of the embryo was discernible due to the obvious phenotype of the manipulated tissue.

      (4) The Discussion is very lengthy and should [be] shortened.

      We will re-examine the prose and emphasize more conciseness, while maintaining clarity for the reader.

      Reviewer #3 (Public Review):

      Summary:

      This work is a detailed and thorough analysis of the morphogenesis of the posterior signaling center (PSC), a hematopoietic niche in the Drosophila larva. Live imaging is performed from the stage of PSC determination until the appearance of a compact lymph gland and PSC in the stage 16 embryo. This analysis is combined with genetic studies that clarify the involvement of adjacent tissue, including the visceral mesoderm, alary muscle, and cardioblasts/dorsal vessels. Lastly, the Slit/Robo signaling system is clearly implicated in the normal formation of the PSC.

      Strengths:

      The data are clearly presented, well documented, and fully support the conclusions drawn from the different experiments. The manuscript differs in character from the mainstay of "big data" papers (for example, no sets of single-cell RNAseq data of, for instance, PSC cells with more or less Slit input, are offered), but what it lacks in this regard, it makes up in carefully planned and executed visualizations and genetic manipulations.

      Weaknesses:

      A few suggestions concerning improvement of the way the story is told and contextualized.

      (1) The minute cluster of PSC progenitors (5 or so cells per side) is embedded (as known before and shown nicely in this study) in other "migrating" cell pools, like the cardioblasts, pericardial cells, lymph gland progenitors, alary muscle progenitors. These all appear to move more or less synchronously. What should also be mentioned is another tissue, the dorsal epidermis, which also "moves" (better: stretches?) towards the dorsal midline during dorsal closure. Would it be reasonable to speculate (based on previously published data) that without the force of dorsal closure, operating in the epidermis, at least the lateral>medial component of the "migration" of the PSC (and neighboring tissues) would be missing? If dorsal closure is blocked, do essential components of PSC and lymph gland morphogenesis (except for the coming-together of the left and right halves) still occur? Are there any published data on this?

      Each of the Reviewers is interested in our response to this very relevant question, and, thus, we will address the issue en bloc here. First, we will add a Supplementary Figure showing that LG and CBs are still able to progress medially towards the dorsal midline when dorsal closure stalls.  This rules out any major effect for the most prominent “large-scale embryo cell sheet movement” in positioning the PSC. Second, published work by Haack et. al. and Balaghi et. al. shows that CBs and leading edge epidermal cells are independently migratory, and we will add this context to the manuscript for the reader.

      (2) Along similar lines: the process of PSC formation is characterized as "migration". To be fair: the authors bring up the possibility that some of the phenotypes they observe could be "passive"/secondary: "Thus, it became important to test whether all PSC phenotypes might be 'passive', explained by PSC attachment to a malforming dorsal vessel. Alternatively, the PSC defects could reflect a requirement for Robo activation directly in PSC cells." And the issue is resolved satisfactorily. But more generally, "cell migration" implies active displacement (by cytoskeletal forces) of cells relative to a substrate or to their neighbors (like for example migration of hemocytes). This to me doesn't seem really clearly to happen here for the dorsal mesodermal structures. Couldn't one rather characterize the assembly of PSC, lymph gland, pericardial cells, and dorsal vessel in terms of differential adhesion, on top of a more general adhesion of cells to each other and the epidermis, and then dorsal closure as a driving force for cell displacement? The authors should bring in the published literature to provide a background that does (or does not) justify the term "migration".

      Before addressing this specifically, we remind readers of our response above that states the rationale ruling out large, embryo-scale movements, such as epidermal dorsal closure, in driving PSC positioning. So, how are PSC cells arriving at their reproducible position? This manuscript reports the first live-imaging of the PSC as it comes to be positioned in the embryo. We interpret these movies to suggest strongly that these cells are a ‘collective’ that migrates. Neither the data, nor we, are asserting that each PSC cell is ‘individually’ migrating to its final position. Rather, our data suggest that the PSC migrates as a collective. The most paradigmatic example of directed, collective cell migration, is of Drosophila ovarian border cells. That cell cluster is surrounded at all times by other cells (nurse cells, in that case), and for the collective to traverse through the tissue, the process requires constant remodeling of associations amongst the migrating cells in the collective (the border cells), as well as between cells in the collective and those outside of it (the nurse cells). In fact, the nurse cells are considered the substrate upon which border cells migrate. Note also that in collective border cell migration cells within the collective can switch neighbors, suggesting dynamic changes to cell associations and adhesions. 

      In our analysis, the PSC cells exhibit qualities reminiscent of the border cells, and thus we infer that the PSC constitutes a migratory cell collective.  We also show in Figure 1H that PSC cells exhibit cellular extensions, and thus have a very active, intrinsic actin-based cytoskeleton. In fact, in Figure 1I, we point out that PSC cells shift position within the collective, which is not only a direct feature of migration, but also occurs within the border cell collective as that collective migrates. Additionally, the fact that the lateral-most PSC cells shift position in the collective while remaining a part of the collective–and they do this while executing net directional movement–makes a strong argument that the PSC is migratory, as no cell types other than PSCs are contacting the surfaces of those shifting PSC cells. Lastly, the Reviewer’s supposition that, rather than migration, dorsal mesoderm structures form via “differential adhesion, on top of a more general adhesion of cells to each other” is, actually, precisely an inherent aspect of collective cell migration as summarized above for the ovarian border collective.

      In our resubmission we will adjust text citing the existing literature to better put into context the reasoning for why PSC formation based on our data is an example of collective cell migration.

      (3) That brings up the mechanistic centerpiece of this story, the Slit/Robo system. First: I suggest adding more detailed data from the study by Morin-Poulard et al 2016, in the Introduction, since these authors had already implicated Slit-Robo in PSC function and offered a concrete molecular mechanism: "vascular cells produce Slit that activates Robo receptors in the PSC. Robo activation controls proliferation and clustering of PSC cells by regulating Myc, and small GTPase and DE-cadherin activity, respectively". As stated in the Discussion: the mechanism of Slit/Robo action on the PSC in the embryo is likely different, since DE-cadherin is not expressed in the embryonic PSC; however, it maybe not be THAT different: it could also act on adhesion between PSC cells themselves and their neighbors. What are other adhesion proteins that appear in the late lateral mesodermal structures? Could DN-cadherin or Fasciclins be involved?

      We agree with the Reviewer that Slit-Robo signaling likely acts in part on the PSC by affecting PSC cell adhesion to each other and/or to CBs (lines 428-435). As stated in the Discussion, we do not observe Fasciclin III expression in the PSC until late stages when the PSC has already been positioned, suggesting that Fasciclin III is not an active player in PSC formation. Assessing whether the PSC expresses any other of the suite of potential cell adhesion molecules such as DN-Cadherin or other Fasciclins, and then study their potential involvement in the Slit-Robo pathway in PSC cells, would be part of a follow-up study.

    1. Author response:

      Public Reviews:

      Reviewer #1 (Public Review):

      The authors describe a massively parallel reporter assays (MPRA) screen focused on identifying polymorphisms in 5' and 3' UTRs that affect translation efficiency and thus might have a functional impact on cells. The topic is of timely interest, and indeed, several related efforts have recently been published and preprinted (e.g., https://pubmed.ncbi.nlm.nih.gov/37516102/ and https://www.ncbi.nlm.nih.gov/pmc/articles/PMC10635273/). This study has several major issues with the results and their presentation.

      Major comments:

      (1) The main issue is that it appears that the screen has largely failed, yet the reasons for that are unclear, which makes it difficult to interpret. The authors start with a library that includes approximately 6,000 variants, which makes it a medium-sized MPRA. But then, only 483 pairs of WT/mutated UTRs yield high-confidence information, which is already a small number for any downstream statistical analysis, particularly since most don't actually affect translation in the reporter screen setting (which is not unexpected). It is unclear why >90% of the library did not give highconfidence information. The profiles presented as base-case examples in Figure 2B don't look very informative or convincing. All the subsequent analysis is done on a very small set of UTRs that have an effect, and it is unclear to this reviewer how these can yield statistically significant and/or biologically relevant associations.

      To make sure our final results are technically and statistically sound, we applied stringent selection criteria and cutoffs in our analytics workflow. First, from our RNA-seq dataset, we filtered the UTRs with at least 20 reads in a polysome profile across all three repeated experiments. Secondly, in the following main analysis using a negative binomial generalized linear model (GLM), we further excluded the UTRs that displayed batch effect, i.e. their batch-related main effect and interaction are significant. We believe our measure has safeguarded the filtered observations (UTRs) from the (potential) high variation of our massively parallel translation assays and thus gives high confidence to our results.

      Regarding the interpretation of Figure 2B, since we aimed to identify the UTRs whose interaction term of genotype and fractions is significant in our generalized linear model, it is statistically conventional to double-check the interaction of the two variables using such a graph. For instance, in the top left panel of Figure 2B (5'UTR of ANK2:c.-39G>T), we can see that read counts of WT samples congruously decreased from Mono to Light, whereas the read counts of mutant samples were roughly the same in the two fractions – the trend is different between WT and mutant. Ergo, the distinct distribution patterns of two genotypes across three fractions in Figure 2B offer the readers a convincing visual supplement to our statistics from GLM.

      In contrast to Figure 2B, the graphs of nonsignificant UTRs (shown below) reveal that the trends between the two genotypes are similar across the 'Mono and Light' and 'Light and Heavy' polysome fractions. Importantly, our analysis remains unaffected by differential expression levels between WT and mutant, as it specifically distinguishes polysome profiles with different distributions. This consistent trend further supports the lack of interaction between genotype and polysome fractions for these UTRs.

      Author response image 1.

      Figure: Examples of non-significant UTR pairs in massively parallel polysome profiling assays.

      (2) From the variants that had an effect, the authors go on to carry out some protein-level validations and see some changes, but it is not clear if those changes are in the same direction as observed in the screen.

      To infer the directionality of translation efficiency from polysome profiles, a common approach involves pooling polysome fractions and comparing them with free or monosome fractions to identify 'translating' fractions. However, this method has two major potential pitfalls: (i) it sacrifices resolution and does not account for potential bias toward light or heavy polysomes, and (ii) it fails to account for discrepancies between polysome load and actual protein output (as discussed in https://doi.org/10.1016/j.celrep.2024.114098 and https://doi.org/10.1038/s41598-019-47424-w). Therefore, our analysis focused on the changes within polysome profiles themselves. 'Significant' candidates were identified based on a significant interaction between genotype and polysome distribution using a negative binomial generalized linear model, without presupposing the direction of change on protein output. 

      (3) The authors follow up on specific motifs and specific RBPs predicted to bind them, but it is unclear how many of the hits in the screen actually have these motifs, or how significant motifs can arise from such a small sample size.

      We calculated the Δmotif enrichment in significant UTRs versus nonsignificant UTRs using Fisher’s exact test. For example, the enrichment of the Δ‘AGGG’ motif in 3’ UTRs is shown below:

      Author response table 1.

      This test yields a P-value of 0.004167 by Fisher’s exact test. The P-values and Odds ratios of Δmotifs in relation to polysome shifting are included in Supplementary Table S4, and we will update the detailed motif information in the revised Supplementary Table S4.

      (4) It is particularly puzzling how the authors can build a machine learning predictor with >3,000 features when the dataset they use for training the model has just a few dozens of translation-shifting variants.

      We understand the concern regarding the relatively small number of translation-shifting variants compared to the large number of features. To address this, we employed LASSO regression, which, according to The Elements of Statistical Learning by Hastie, Tibshirani, and Friedman, is particularly suitable for datasets where the number of features 𝑝𝑝 is much larger than the number of samples 𝑁𝑁. LASSO effectively performs feature selection by shrinking less important coefficients to zero, allowing us to build a robust and generalizable model despite the limited number of variants.

      (5) The lack of meaningful validation experiments altering the SNPs in the endogenous loci by genome editing limits the impact of the results.

      We plan to assess the endogenous effect by generating CRISPR knock-in clones carrying the UTR variant.

      Reviewer #2 (Public Review):

      Summary:

      In their paper "Massively Parallel Polyribosome Profiling Reveals Translation Defects of Human Disease‐Relevant UTR Mutations" the authors use massively parallel polysome profiling to determine the effects of 5' and 3' UTR SNPs (from dbSNP/ClinVar) on translational output. They show that some UTR SNPs cause a change in the polysome profile with respect to the wild-type and that pathogenic SNPs are enriched in the polysome-shifting group. They validate that some changes in polysome profiles are predictive of differences in translational output using transiently expressed luciferase reporters. Additionally, they identify sequence motifs enriched in the polysome-shifting group. They show that 2 enriched 5' UTR motifs increase the translation of a luciferase reporter in a proteindependent manner, highlighting the use of their method to identify translational control elements.

      Strengths:

      This is a useful method and approach, as UTR variants have been more difficult to study than coding variants. Additionally, their evidence that pathogenic mutations are more likely to cause changes in polysome association is well supported.

      Weaknesses:

      The authors acknowledge that they "did not intend to immediately translate the altered polysome profile into an increase or decrease in translation efficiency, as the direction of the shift was not readily evident. Additionally, sedimentation in the sucrose gradient may have been partially affected by heavy particles other than ribosomes." However, shifted polysome distribution is used as a category for many downstream analyses. Without further clarity or subdivision, it is very difficult to interpret the results (for example in Figure 5A, is it surprising that the polysome shifting mutants decrease structure? Are the polysome "shifts" towards the untranslated or heavy fractions?)

      Our approach, combining polysome fractionation of the UTR library with negative binomial generalized linear model (GLM) analysis of RNA-seq data, systematically identifies variants that affect translational efficiency. The GLM model is specifically designed to detect UTR pairs with significant interactions between genotype and polysome fractions, relying solely on changes in polysome profiles to identify variants that disrupt translation. Consequently, our analytical method does not determine the direction of translation alteration.

      Following the massively parallel polysome profiling, we sought to understand how these polysomeshifting variants influence the translation process. To do this, we examined their effects on RNA characteristics related to translation, such as RBP binding and RNA structure. In Figure 5A, we observed a notable trend in significant hits within 5’ UTRs—they tend to increase ΔG (weaker folding energy) in response to changes in polysome profiles, regardless of whether protein production increases or decreases (Fig. 3).

    1. Author response:

      The following is the authors’ response to the original reviews.

      eLife assessment

      The authors develop a self-returning self-avoiding polymer model of chromosome organization and show that their framework can recapitulate at the same time local density and large-scale contact structural properties observed experimentally by various technologies. The presented theoretical framework and the results are valuable for the community of modelers working on 3D genomics. The work provides solid evidence that such a framework can be used, is reliable in describing chromatin organization at multiple scales, and could represent an interesting alternative to standard molecular dynamics simulations of chromatin polymer models.

      We appreciate the editor for an accurate description of the scope of the paper.

      Public Reviews:

      Reviewer #1 (Public Review):

      Carignano et al propose an extension of the self-returning random walk (SRRW) model for chromatin to include excluded volume aspects and use it to investigate generic local and global properties of the chromosome 3D organization inside eukaryotic nuclei. In particular, they focus on chromatin volumic density, contact probability, and domain size and suggest that their framework can recapitulate several experimental observations and predict the effect of some perturbations.

      We thanks the reviewer for the attention paid to the manuscript and all the relevant comments.

      Strengths:

      - The developed methodology is convincing and may offer an alternative - less computationally demanding - framework to investigate the single-cell and population structural properties of 3D genome organization at multiple scales.

      - Compared to the previous SRRW model, it allows for investigation of the role of excluded volume locally.

      Excluded volume is accounted for everywhere, not locally. We emphasized this on page 3, line 182:

      “The method that we employ to remove overlaps is a low-temperature-controlled molecular dynamics simulation using a soft repulsive interaction potential between initially overlapping beads, that is terminated as soon as all overlaps have been resolved, as described in the Appendix 3.”


      - They perform some experiments to compare with model predictions and show consistency between the two.

      Weaknesses:

      - The model is a homopolymer model and currently cannot fully account for specific mechanisms that may shape the heterogeneous, complex organization of chromosomes (TAD at specific positions, A/B compartmentalization, promoter-enhancer loops, etc.).

      The SR-EV model is definitely not a homo-polymer, as it is not a regular concatenation of a single monomeric unit.

      The model includes loops, which may happen in two ways: 1) As in the SRRW, branching structures emerging from the configuration backbone can be interpreted as nested loops and 2) A relatively long forward step followed by a return is a single loop. The model induces the formation of packing domains, which are not TADs, and are quantitatively in agreement with ChromSTEM experiments.

      We consider convenient to add a new figure that will further clarify the structures obtained with the SR-EV model. The following paragraph and figure has been added in page 5:

      “The density heterogeneity displayed by the SR-EV configurations can be analyzed in terms of the accessibility. One way to reveal this accessibility is by calculating the coordinations number (CN) for each nucleosome, using a coordination radius of 11.5 nm, along the SR-EV configuration. CN values range from 0 for an isolated nucleosome to 12 for a nucleosome immersed in a packing domain. In Figure 3 we show the SR-EV configuration showed in Figure 2, but colored according to CN. CN can be also considered as a measure to discriminate heterochromatin (red) and euchromatin (blue). Figure 3-A shows how the density inhomogeneity is coupled to different CN, with high CN represented in red and low CN represented in blue. Figure 3-B show a 50 nm thick slab obtained from the same configuration that clearly show the nucleosomes at the center of each packing domains are almost completely inaccesible, while those outside are open and accessible. It is also clear that the surface of the packing domains are characterized by nearly white nucleosomes, i.e. coordinated towards the center of the domain and open in the opposite direction.”

      - By construction of their framework, the effect of excluded volume is only local and larger-scale properties for which excluded volume could be a main actor (formation of chromosome territories [Rosa & Everaers, PLoS CB 2009], bottle-brush effects due to loop extrusion [Polovnikov et al, PRX 2023], etc.) cannot be captured.

      Excluded volume is considered for all nucleosomes, including overlapping beads distant along the polymer chain. Chromosome territories can be treated, but it is not in this case because we look at a single model chromosome.

      - Apart from being a computationally interesting approach to generating realistic 3D chromosome organization, the method offers fewer possibilities than standard polymer models (eg, MD simulations) of chromatin (no dynamics, no specific mechanisms, etc.) with likely the same predictive power under the same hypotheses. In particular, authors often claim the superiority of their approach to describing the local chromatin compaction compared to previous polymer models without showing it or citing any relevant references that would show it.

      We apologize if the text transmit an idea of superiority over other methods that was not intended. SR-EV is an alternative tool that may give a different, even complementary point of view, to standard polymer models.

      - Comparisons with experiments are solid but are not quantified.

      The comparisons that we have presented are quantitative. We do not have so far a way to characterize alpha or phi, a priori, for a particular system.

      Impact:

      Building on the presented framework in the future to incorporate TAD and compartments may offer an interesting model to study the single-cell heterogeneity of chromatin organization. But currently, in this reviewer's opinion, standard polymer modeling frameworks may offer more possibilities.

      We thank the reviewer for the positive opinion on the potential of the presented method. The incorporation of TADs and compartments is left for a future evolution of the model as its complexity will make this work extremely long.

      Reviewer #2 (Public Review):

      Summary:

      The authors introduce a simple Self Returning Excluded Volume (SR-EV) model to investigate the 3D organization of chromatin. This is a random walk with a probability to self-return accounting for the excluded volume effects. The authors use this method to study the statistical properties of chromatin organization in 3D. They compute contact probabilities, 3D distances, and packing properties of chromatin and compare them with a set of experimental data.

      We thank the reviewer for the attention paid to our manuscript.

      Strengths:

      (1) Typically, to generate a polymer with excluded volume interactions, one needs to run long simulations with computationally expensive repulsive potentials like the WeeksChanlder-Anderson potential. However, here, instead of performing long simulations, the authors have devised a method where they can grow polymer, enabling quick generation of configurations.

      (2) Authors show that the chromatin configurations generated from their models do satisfy many of the experimentally known statistical properties of chromatin. Contact probability scalings and packing properties are comparable with Chromatin Scanning Transmission Electron Microscopy (ChromSTEM)  experimental data from some of the cell types.

      Weaknesses:

      This can only generate broad statistical distributions. This method cannot generate sequence-dependent effects, specific TAD structures, or compartments without a prior model for the folding parameter alpha. It cannot generate a 3D distance between specific sets of genes. This is an interesting soft-matter physics study. However, the output is only as good as the alpha value one provides as input.

      We proposed a model to create realistic chromatin configuration that we have contrasted with specific single cell experiments, and also reproducing ensemble average properties. 3D distances between genes can be calculated after mapping the genome to the SR-EV configuration. The future incorporation of the genome sequence will also allow us to describe TADs and A/B compartments. See added paragraph in the Discussion section:

      “The incorporation of genomic character to the SR-EV model will allow us to study all individual single chromosomes properties, and also topological associated domains and A/B compartmentalization from ensemble of configurations as in HiC experiments. “

      Recommendations for the authors:

      Reviewer #1 (Recommendations For The Authors):

      Major:

      - In the introduction and along the text, the authors are often making strong criticisms of previous works (mostly polymer simulation-based) to emphasize the need for an alternative approach or to emphasize the outcomes of their model. Most of these statements (see below) are incomplete if not wrong. I would suggest tuning down or completely removing them unless they are explicitly demonstrated (eg, by explicit quantitative comparisons). There is no need to claim any - fake - superiority over other approaches to demonstrate the usefulness of an approach. Complementarity or redundance in the approaches could also be beneficial.

      We regret if we unintentionally transmitted a claim of superiority. We have made several small edits to change that.

      - Line 42-43: at least there exist many works towards that direction (including polymer modeling, but also statistical modeling). For eg, see the recent review of Franck Alber.

      Line removed. Citation to Franck Alber included below in the text.

      - Line 54-57: Point 1 is correct but is it a fair limitation? These models can predict TADs & compartments while SR-EV no. Point 2 is wrong, it depends on the resolution of the model and computer capacity but it is not an intrinsic limitation. Point 3 is wrong, such models can predict very well single-cell properties, and again it is not an intrinsic limitation of the model. Point 4 is incorrect. The space-filling/fractal organization was an (unfortunate) picture to emphasize the typical organization of chromosomes in the early times (2009), but crumpled polymers which are a more realistic description are not space-filling (see Halverson et al, 2013).

      Text involving points 1 to 4 removed. It was unnecessary and does not change the line of the paper.

      - L400-402 + 409-411: in such a model, the biphasic structure may emerge from loop extrusion but also naturally from the crumpled polymer organization. Simple crumpled polymer without loop extrusion and phase separation would also produce biphasic structures.

      Yes, we agree. Also SR-EV leads to biphasic structures.

      - L 448-449: any data to show that existing polymer modeling would predict a strong dependency of C_p(n) on the volumic fraction (in the range studied here)?

      No, I don’t know a work predicting that.

      - Fig. 4:

      - Large-scale structural properties (R^2(n) and C_p(n)) are not dependent on phi. Is it surprising that by construction, SR-EV only relaxes the system locally after SRRW application?

      Excluded volume is considered at all length scales. However, as the decreasing C_p curves observed in theories and experiments imply, the fraction of overlap (or contacts) is more important at small separations (local) than at large separations. Yet, it was a surprise for us to observed negligible effect on phi.

      - Why not make a quantitative comparison between predicted and measured C_p(n)? Or at least plotting them on the same panel.

      Panels B and C are in the same scale and show a good agreement between SR-EV and experiments. However, it is not perfectly quantitative agreement. SR-EV represents the generic structure of chromatin and perfect agreement should not be expected.

      - Comparison with an average C_p(n) over all the chromosomes would be better.

      Possibly, but we don’t think it adds anything to the paper.

      - In Figure 5,6,7 (and related text): authors often describe some parameter values that are 'closest to experiment findings'. Can the authors quantify/justify this? The various 'closest' parameters are different. Can the authors comment?

      The folding parameter and average volume fraction are chose so that the agreement is best with the displayed experimental system, different cell for each case.

      - Figure 5: why not show the experimental distribution from Ou et al?

      - Figure 6 & 7: experimental results. Can the authors show images from their own experiments? Can they show that cohesion/RAD21 is really depleted after auxin treatment?

      It is currently under review in a different journal.

      - In the Discussion, a fair discussion on the limitations of the methods (dynamics, etc) is missing.

      Minor

      - Line 34-36: the logical relationship between this sentence and the ones before and after is very unclear.

      - Along the text, authors use the term 'connectivity' to describe 3D (Hi-C) contacts between different regions of the same chromosome/polymer. This is misleading as connectivity in polymer physics describes the connection along the polymer and not in the 3D space.

      No. I don’t think we used connectivity in that sense. We agree with your statement on the use of connectivity in polymer physics, and is what we always had in mind for this model.

      - Line 92: typo.

      - On the SR-EV method: does the relaxation process create local knots in the structure?

      We have not checked for knots.

      - Table 1: the good correspondence with linker length is remarkable but likely 'fortunate', other chosen resolutions would have led to other results. Moreover, the model cannot account for the fine structure of chromatin fiber. Can the authors comment on that?

      Fortunate to the extent that we sample the model parameter to overall catch the structure of chromatin.

      - Line 211: 'without the need of imposing any parameter': alpha is a parameter, no?

      Correct. Phrase deleted.

      - L267-269 & 450-451: actually in Liu & Dekker, they do observe an effect on Hi-C map (C_p(n)), weak but significant and not negligible.

      Our statements read ‘minimal’ and ‘relatively insensitive’. It is observed, but very small.

      - L283-286: This is a perspective statement that should be in the discussion.

      Moved to the Discussion, as suggested.

      - L239-241: The authors seem to emphasize some contradictions with recent results on phase separation. This is unclear and should be relocated to discussion.

      We just pointed out recent experiments, as stated. No intention to generate a discussion with any of them.

      - L311-313: Unclear statement.

      - L316-325: This is not results but discussion/speculation.

      Moved to Discussion

      - Along the text: 'promotor'-> 'promoter'. 

      - Corrected.

      - L364: explain more in detail PWS microscopy.

      Reviewer #2 (Recommendations For The Authors):

      Even though there are claims about nucleosome-resolution chromatin polymer, it is not clear that this work can generate structures with known nucleosome-resolution features. Nucleosome-level structure is much beyond a random walk with excluded volume and is driven by specific interactions. The authors should clarify this.

    1. Author response:

      The following is the authors’ response to the original reviews.

      Public Reviews:

      Reviewer #1 (Public Review):

      Summary:

      Yang, Hu et al. examined the molecular mechanisms underlying astrocyte activation and its implications for multiple sclerosis. This study shows that the glycolytic enzyme PKM2 relocates to astrocyte nuclei upon activation in EAE mice. Inhibiting PKM2's nuclear import reduces astrocyte activation, as evidenced by decreased proliferation, glycolysis, and inflammatory cytokine release. Crucially, the study identifies TRIM21 as pivotal in regulating PKM2 nuclear import via ubiquitination. TRIM21 interacts with PKM2, promoting its nuclear translocation and enhancing its activity, affecting multiple signaling pathways. Confirmatory analyses using single-cell RNA sequencing and immunofluorescence demonstrate TRIM21 upregulation in EAE astrocytes. Modulating TRIM21 expression in primary astrocytes impacts PKM2-dependent glycolysis and proliferation. In vivo experiments targeting this mechanism effectively mitigate disease severity, CNS inflammation, and demyelination in EAE.

      The authors supported their claims with various experimental approaches, however, some results should be supported with higher-quality images clearly depicting the conclusions and additional quantitative analyses of Western blots.

      Thanks for the reviewer’s comments. We agree with the reviewer and have added higher magnification images, for example Fig.2A to better visualize the localization of PKM2 in DASA-treated conditions, and Fig. 3A and Fig.3B to better visualize the pSTAT3 and pp65. Moreover, we have added quantitative analyses of Western blots for some key experiments, for example quantitative results for Fig.2D is added in Fig.S3 to show the change of PKM2 and p-c-myc in DASA-58-treated conditions and quantitative results for Fig. 3D are added in Fig.S4B and S4C to show the change of nuclear and cytoplasmic PKM2, STAT3 and NF-κB in different conditions.

      Strength:

      This study presents a comprehensive investigation into the function and molecular mechanism of metabolic reprogramming in the activation of astrocytes, a critical aspect of various neurological diseases, especially multiple sclerosis. The study uses the EAE mouse model, which closely resembles MS. This makes the results relevant and potentially translational. The research clarifies how TRIM21 regulates the nuclear import of PKM2 through ubiquitination by integrating advanced techniques. Targeting this axis may have therapeutic benefits since lentiviral vector-mediated knockdown of TRIM21 in vivo significantly reduces disease severity, CNS inflammation, and demyelination in EAE animals.

      We thank the reviewer for their positive and constructive comments on the manuscript.

      Weaknesses:

      The authors reported that PKM2 levels are elevated in the nucleus of astrocytes at different EAE phases compared to cytoplasmic localization. However, Figure 1 also shows elevated cytoplasmic expression of PKM2. The authors should clarify the nuclear localization of PKM2 by providing zoomed-in images. An explanation for the increased cytoplasmic PKM2 expression should provided. Similarly, while PKM2 translocation is inhibited by DASA-58, in addition to its nuclear localization, a decrease in the cytoplasmic localization of PKM2 is also observed. This situation brings to mind the possibility of a degradation mechanism being involved when its nuclear translocation of PKM2 is inhibited.

      According to the results of immunofluorescence staining of PKM2 in spinal cord of EAE mice and in cultured primary astrocytes, in addition to the observation of PKM2 nuclear translocation in EAE conditions, we showed an elevated expression of PKM2 in astrocytes, including the cytoplasmic and nuclear expression. In neurological diseases, various studies showed consistent results, for example, following spinal cord injury (SCI), not only the upregulated expressing of PKM2 but also nuclear translocation was observed in astrocytes (Zhang et al., 2015). In EAE conditions, CNS inflammation is elevated and several proinflammatory cytokines and chemokines might contribute to the upregulated expression of PKM2 in astrocytes. We have tested TNFα and IL-1β, which are recognized to play important roles in EAE and MS (Lin and Edelson, 2017, Wheeler et al., 2020), and results from western blots showed the increased expression of PKM2 upon stimulation with TNFα and IL-1β (Author response image 1). Moreover, according to the reviewer’s suggestions, we have added zoomed-in images for figure 2A.

      Additionally, the reviewer has noted the decrease in the cytoplasmic PKM2 level, degradation-related mechanism and other mechanisms might be involved in this process.

      Author response image 1.

      Upregulated expression of PKM2 in astrocytes following stimulation with TNF-α and IL-1β. Primary astrocytes were stimulated with TNF-α and IL-1β (50 ng/mL) for 48 h and western blotting analysis were performed.

      In Figure 3D, the authors claim that PKM2 expression causes nuclear retention of STAT3, p65, and p50, and inhibiting PKM2 localization with DASA-58 suppresses this retention. The western blot results for the MOG-stimulated group show high levels of STAT3, p50, and p65 in nuclear localization. However, in the MOG and DASA-58 treated group, one would expect high levels of p50, p65, and STAT3 proteins in the cytoplasm, while their levels decrease in the nucleus. These western blot results could be expanded. Additionally, intensity quantification for these results would be beneficial to see the statistical difference in their expressions, especially to observe the nuclear localization of PKM2.

      We agree with the reviewer’s comments and we have incorporated the quantification of STAT3,p50 and p65 for Fig.3D and Fig.S4B and Fig.S4C. Nevertheless, given that DASA-58 did not trigger a notable increase in the cytoplasmic level of PKM2, we did not detect an upregulation of STAT3, p50, or p65 in the cytoplasm of the MOG and DASA-58-treated groups. With the quantification results, it is more obvious to see the changes of these proteins in different conditions.

      The discrepancy between Figure 7A and its explaining text is confusing. The expectation from the knocking down of TRIM21 is the amelioration of activated astrocytes, leading to a decrease in inflammation and the disease state. The presented results support these expectations, while the images showing demyelination in EAE animals are not highly supportive. Clearly labeling demyelinated areas would enhance readers' understanding of the important impact of TRIM21 knockdown on reducing the disease severity.

      Thank you for pointing this out. We sincerely apologize for our carelessness. Based on your comments, we have made the corrections in the manuscript. As there is indeed a statistical difference in the mean clinical scores between shTRIM21-treated group and shVec group, we have accordingly revised the sentence for Figure 7A to state, “At the end time point at day 22 p.i., shTRIM21-treated group showed reduced disease scores compared to control groups (Fig. 7A).” .

      Additionally, we have added the whole image of the spinal cord for MBP in Author Response image 2. Moreover, we have labelled the demyelinated areas to facilitate readers’ understanding.

      Author response image 2.

      MBP staining of the whole spinal cord in EAE mice from shVec and shTRIM21 group. Scale bar: 100 μm. Demyelinated areas are marked with dashed lines.

      Reviewer #2 (Public Review):

      This study significantly advances our understanding of the metabolic reprogramming underlying astrocyte activation in neurological diseases such as multiple sclerosis. By employing an experimental autoimmune encephalomyelitis (EAE) mouse model, the authors discovered a notable nuclear translocation of PKM2, a key enzyme in glycolysis, within astrocytes.

      Preventing this nuclear import via DASA 58 substantially attenuated primary astrocyte activation, characterized by reduced proliferation, glycolysis, and inflammatory cytokine secretion.<br /> Moreover, the authors uncovered a novel regulatory mechanism involving the ubiquitin ligase TRIM21, which mediates PKM2 nuclear import. TRIM21 interaction with PKM2 facilitated its nuclear translocation, enhancing its activity in phosphorylating STAT3, NFκB, and c-myc. Single-cell RNA sequencing and immunofluorescence staining further supported the upregulation of TRIM21 expression in astrocytes during EAE.

      Manipulating this pathway, either through TRIM21 overexpression in primary astrocytes or knockdown of TRIM21 in vivo, had profound effects on disease severity, CNS inflammation, and demyelination in EAE mice. This comprehensive study provides invaluable insights into the pathological role of nuclear PKM2 and the ubiquitination-mediated regulatory mechanism driving astrocyte activation.

      The author's use of diverse techniques, including single-cell RNA sequencing, immunofluorescence staining, and lentiviral vector knockdown, underscores the robustness of their findings and interpretations. Ultimately, targeting this PKM2-TRIM21 axis emerges as a promising therapeutic strategy for neurological diseases involving astrocyte dysfunction.

      While the strengths of this piece of work are undeniable, some concerns could be addressed to refine its impact and clarity further; as outlined in the recommendations for the authors.

      Thanks for the reviewer’s comment and positive evaluation of our present work. We have further answered each question in recommendations section.

      Reviewer #3 (Public Review):

      Summary:

      Pyruvate kinase M2 (PKM2) is a rate-limiting enzyme in glycolysis and its translocation to the nucleus in astrocytes in various nervous system pathologies has been associated with a metabolic switch to glycolysis which is a sign of reactive astrogliosis. The authors investigated whether this occurs in experimental autoimmune encephalomyelitis (EAA), an animal model of multiple sclerosis (MS). They show that in EAA, PKM2 is ubiquitinated by TRIM21 and transferred to the nucleus in astrocytes. Inhibition of TRIM21-PKM2 axis efficiently blocks reactive gliosis and partially alleviates symptoms of EAA. Authors conclude that this axis can be a potential new therapeutic target in the treatment of MS.

      Strengths:

      The study is well-designed, controls are appropriate and a comprehensive battery of experiments has been successfully performed. Results of in vitro assays, single-cell RNA sequencing, immunoprecipitation, RNA interference, molecular docking, and in vivo modeling etc. complement and support each other.

      Weaknesses:

      Though EAA is a valid model of MS, a proposed new therapeutic strategy based on this study needs to have support from human studies.

      We agree that although we have clarified the therapeutic potential of targeting TRIM21 or PKM2 in the treatment of EAE, a mouse model of MS, the application in human studies warrants further studies. While considering the use of TRIM21 as a target for treating multiple sclerosis in clinical trials, several issues need to be addressed to ensure the safety, efficacy and feasibility. One such aspect is the development of drug that specifically target TRIM21 in brain, capable of crossing the blood-brain barrier and have minimal off-target effects. The translation of preclinical finding into clinical trials poses a significant challenge. To provide evidence for the similarities between the EAE model and multiple sclerosis, we have screened GEO databases (Author response image 3). In GSE214334 which analyzed transcriptional profiles of normal-appearing white matter from non-MS and different subtypes of disease (RRMS, SPMS and PPMS). Although no statistical difference was observed among different groups, the TRIM21 expression has tendency to increase in SPMS (secondary progressive MS) and PPMS (primary progressive MS) patients. In GSE83670, astrocytes from 3 control white matter and 4 multiple sclerosis normal appearing white matter (NAWM) were analyzed. TRIM21 mRNA expression is higher in MS group (78.73 ± 10.44) compared to control group (46.67 ± 24.15). Although these two GEO databases did not yield statistically significant differences, TRIM21 expression appears to be elevated in the white matter of MS patients compared to controls.

      To address this limitation, we have incorporated the following statement in the discussion section: “However, whether TRIM21-PKM2 could potentially serve as therapeutic targets in multiple sclerosis warrants further studies.”

      Author response image 3.

      TRIM21 expression in control and MS patients based on published GEO database. (A) The expression of TRIM21 in normal-appearing white matter in non-MS (Ctl) and different clinical subtypes of MS (RRMS, SPMS, PPMS) based on GSE214334 (one-way ANOVA). (B) The expression of TRIM21 from multiple sclerosis normal appearing white matter (NAWM) and control WM based on GSE83670. RRMS, relapsing--remitting MS; SPMS, secondary progressive MS; PPMS, primary progressive MS (unpaired Student's t test). Data are represented as the means ± SEM.

      Reviewer #4 (Public Review):

      Summary:

      The authors report the role of the Pyruvate Kinase M2 (PKM2) enzyme nuclear translocation as fundamental in the activation of astrocytes in a model of autoimmune encephalitis (EAE). They show that astrocytes, activated through culturing in EAE splenocytes medium, increase their nuclear PKM2 with consequent activation of NFkB and STAT3 pathways. Prevention of PKM2 nuclear translocation decreases astrocyte counteracts this activation. The authors found that the E3 ubiquitin ligase TRIM21 interacts with PKM2 and promotes its nuclear translocation. In vivo, either silencing of TRIM21 or inhibition of PKM2 nuclear translocation ameliorates the severity of the disease in the EAE model.

      Strengths:

      This work contributes to the knowledge of the complex action of the PKM2 enzyme in the context of an autoimmune-neurological disease, highlighting its nuclear role and a novel partner, TRIM21, and thus adding a novel rationale for therapeutic targeting.

      Weaknesses:

      Despite the relevance of the work and its goals, some of the conclusions drawn would require more thorough proof:

      I believe that the major weakness is the fact that TRIM21 is known to have per se many roles in autoimmune and immune pathways and some of the effects observed might be due to a PKM2-independent action. Some of the experiments to link the two proteins, besides their interaction, do not completely clarify the issue. On top of that, the in vivo experiments address the role of TRIM21 and the nuclear localisation of PKM2 independently, thus leaving the matter unsolved.

      We agree that TRIM21 has multifunctional roles and only some of their effects are due to PKM2-independent action. It is obvious that TRIM21 functions as ubiquitin ligases and its substrate are various. Here we identify PKM2 as one of its interacting proteins and our focus is the relationship between TRIM21 and the nuclear translocation PKM2, we have used diverse experiments to clarify their relationships, for example immunoprecipitation, western blotting, immunofluorescence, cyto-nuclear protein extraction. These aforementioned experiments are key points of our studies. From the results of in vitro experiments, targeting either TRIM21 or PKM2 might be potential targets for EAE treatment. Expectedly, from in vivo experiments, either targeting TRIM21 or PKM2 nuclear transport ameliorated EAE. In order to test the relationship of TRIM21 and PKM2 nuclear transport in vivo, we have stained PKM2 in shVec and shTRIM21-treated mice. Expectedly, knocking down TRIM21 led to a decrease in the nuclear staining of PKM2 in spinal cord astrocytes in EAE models (Figure S7A). This observation underscores that the therapeutic potential of inhibiting TRIM21 in astrocytes in vivo might be partially due to its role in triggering the reduced nuclear translocation of PKM2.

      Some experimental settings are not described to a level that is necessary to fully understand the data, especially for a non-expert audience: e.g. the EAE model and MOG treatment; action and reference of the different nuclear import inhibitors; use of splenocyte culture medium and the possible effect of non-EAE splenocytes.

      According to the reviewer’s suggestions, we have added more detailed descriptions in the materials and methods section, for example, the use of splenocytes culture medium, mass spectrometry, HE and LFB staining have been added. More details are incorporated in the part for “EAE induction and isolation and culture of primary astrocytes”. Moreover, the reference of DASA-58 in vitro and TEPP-46 in vivo as inhibitors of PKM2 nuclear transport were added.

      The statement that PKM2 is a substrate of TRIM21 ubiquitin ligase activity is an overinterpretation. There is no evidence that this interaction results in ubiquitin modification of PKM2; the ubiquitination experiment is minimal and is not performed in conditions that would allow us to see ubiquitination of PKM2 (e.g. denaturing conditions, reciprocal pull-down, catalytically inactive TRIM21, etc.).

      To prevent the misunderstanding, we have revised certain statements in the manuscript. In the updated version, the description is as follows: Hereby, we recognized PKM2 as an interacting protein of TRIM21, and further studies are required to determine if it is a substrate of E3 ligase TRIM21.

      Recommendations for the authors:

      Reviewer #1 (Recommendations For The Authors):

      General recommendations:

      - The whole manuscript needs language editing.

      We appreciate the comments of the reviewers. We have improved the writing of the manuscript. All modifications are underlined.

      - Details of many experiments are not given in the materials and methods.

      According to the reviewer’s suggestions, we have added more details for experiments in the materials and methods. For example, “Splenocyte isolation and supernatant of MOG35-55-stimulated-splenocytes”, “mass spectrometry”, “Hematoxylin-Eosin (HE) and Luxol Fast Blue (LFB) staining” were added in the section of Materials and Methods. More detailed information is given for EAE induction and isolation and culture of primary astrocytes.

      - Line properties in graphics should be corrected, some lines in box plots and error bars are very weak and hardly visible. Statistical tests should be included in figure legends as well. Statistical differences should be mentioned for control vs DASA-58 (alone) in all related figures.

      We have revised the figures to enhance their visibility by thickening the lines and error bars. In accordance with the reviewer’s suggestions, we have incorporated statistical tests in figure legends. Moreover, statistical analysis has been made among all groups, if there is no asterisk indicated in the figure legend and figure panels, it means there is no statistical difference between the control vs DASA-58 groups. For most of the experiments conducted in our studies, including lactate production, glucose consumption, the EdU analysis and CCK8 analysis, the change of STAT3 and NF-κB pathways, no statistical difference was observed between the control and DASA-58 group. The reason might be due to that in unstimulated astrocytes, the expression of PKM2 is low and nuclear translocation of PKM2 are few, which may explain why DASA-58 did not exert the anticipated effect. Thus, in our experiments, we have used MOGsup to stimulate astrocytes, enabling us to observe the impact of DASA-58 on the astrocyte proliferation and glycolysis in this condition.

      - Scale bars, arrows, and labeling in the images are not visible.

      We have improved the images according to the reviewer’s suggestions. The scale bars, arrows are made thicker and labeling are larger. The updated figures are visible.

      - Quantitative analysis of all western blot results and their statistics could be provided in every image and for every protein.

      For western blotting results which are further processed with quantitative analysis, for example, Fig.2D, fig. 5G, Fig. 6A and 6B, Fig. S4, we have added their statistics in the raw data sections. The other western blot results, for example, IP analysis, which are used to analyze protein-protein binding are not further processed with quantitative analysis.

      - Proteins that are used for normalizations in western blots should be stated in the text.

      We have added description of proteins that are used for normalization in western blots in figure legends. Moreover, in figure panels, proteins used for normalization are indicated. Globally, whole protein level is normalized to protein level of β-actin. For nuclear and cytoplasmic proteins, nuclear protein is normalized to the expression of lamin, cytoplasmic protein is normalized to the expression of tubulin. 

      - The manuscript investigates the role of TRIM21 in the nuclear localization of PKM2 in astrocytes in EAE mice, however almost no information is given about TRIM21 in the introduction. Extra information is given for PKM2, yet can be concisely explained.

      We have added a paragraph that describes the information of TRIM21 in the introduction section. The description is as follows: “TRIM21 belongs to the TRIM protein family which possess the E3 ubiquitin ligase activity. In addition to its well-recognized function in antiviral responses, emerging evidences have documented the multifaceted role of TRIM21 in cell cycle regulation, inflammation and metabolism (Chen et al., 2022). Nevertheless, the precise mechanisms underlying the involvement of TRIM21 in CNS diseases remain largely unexplored.”

      - "As such, deciphering glycolysis-dominant metabolic switch in astrocytes is the basis for understanding astrogliosis and the development of neurological diseases such as multiple sclerosis." The sentence could be supported by references.

      To support this sentence, we have added the following references:

      (1) Xiong XY, Tang Y, Yang QW. Metabolic changes favor the activity and heterogeneity of reactive astrocytes. Trends in endocrinology and metabolism: TEM 2022;33(6):390-400.

      (2) das Neves SP, Sousa JC, Magalhães R, Gao F, Coppola G, Mériaux S, et al. Astrocytes Undergo Metabolic Reprogramming in the Multiple Sclerosis Animal Model. Cells 2023;12(20):2484.

      Figure 1/Result 1:

      - Figure 1A-B: Quality of the images should be improved.

      According to the reviewer’s suggestion, we have improved the quality of the image, images with higher resolution were added in figure 1A and figure 1B.

      - Control images of Figure 1B are not satisfying. GFAP staining is very dim. Images from control cells should be renewed.

      As mentioned by the reviewer’s, we have renewed the control images and added the DAPI staining figures for all groups. Compared with MOGsup stimulated astrocytes, the control cells are not in activated state and GFAP are relatively low.

      - Labelings on the images are not sufficient, arrows and scale bars are not visible.

      We have improved the images including labels, arrows and scale bars in all figures.

      - How splenocytes were obtained from MOG induced mice were not given in the material and methods section. Thus, it should be clearly stated how splenocyte supernatant is generated (treatment details).

      We have added the detailed information relating to splenocyte isolation and splenocyte supernatant entitled “Splenocyte isolation and supernatant of MOG35-55-stimulated-splenocytes” in the section of Materials and methods. “Splenocytes were isolated from EAE mice 15 d (disease onset) after MOG35-55 immunization. Briefly, spleen cells were suspended in RPMI-1640 medium containing 10% FBS. Splenocytes were plated in 12-well plates at 1x10⁶ cells/well containing 50 μg/mL MOG35-55 and cultured at 37°C in 5% CO2. After stimulation for 60 h, cell suspension was centrifuged at 3000 rpm for 5 min and supernatants were collected. For the culture of MOGsup-stimulated astrocytes, astrocytes were grown in medium containing 70% DMEM supplemented with 10% FBS and 30% supernatant from MOG35-55-stimulated-splenocytes.”

      - For general astrocyte morphology: authors showed the cells are GFAP+ astrocytes. It is surprising that these cells do not bear classical astrocyte morphology in cell culture. How long do you culture astrocytes before treatment? How do you explain their morphological difference?

      Astrocytes were cultured for 2 to 3 weeks which correspond to 2-3 passages before treatment. There are several possible reasons for the morphological differences observed between GFAP+ astrocytes and their classical morphology. Firstly, the cell density. In low-density culture just as shown in Figure 1B, we have observed that astrocytes adopt a more flattened morphology. In high-density cultures, they adopt a stellate shape. Moreover, variations in culture conditions, such as the use of different fetal bovine serum, can also influence the morphology of astrocytes. In addition, the mechanical injury induced by the isolation procedures for astrocytes might contribute to variations in their morphology during in vitro cultivation. In summary, the morphological differences observed in GFAP+ astrocytes in cell culture likely result from a combination of culture conditions, cell density, and mechanical injury occured during astrocyte isolation etc.

      - Additional verification of reactive astrocytes could be performed by different reactive astrocyte markers, such as GLAST, Sox9, S100ß. Thus, quantitative analysis of activated astrocytes can be done by counting DAPI vs GLAST, Sox9 or S100ß positive cells.

      We really agree with the reviewer that there are other markers of reactive astrocytes such as GLAST, sox9 and S100β. However, numerous evidences support that GFAP is the most commonly used reactive astrocyte markers. Most of the cases, reactive astrocytes undergo GFAP overexpression. GFAP is one the most consistently induced gene in transcriptomic datasets of reactive astrocytes, confirming its usefulness as a reactive marker (Escartin et al., 2019). Thus, we have used GFAP as the marker of astrocyte activation in our study.

      - How you performed quantifications for Figures 1C and 1D should be clearly explained, details are not given.

      Quantification for Figure 1C and 1D were added in the figure legend. In general, Mean fluorescence intensity of PKM2 in different groups of (B) was calculated by ImageJ. The number of nuclear PKM2 was quantified by Image-Pro Plus software manually (eg. nuclear or cytoplasmic based on DAPI blue staining). The proportion of nuclear P KM2 is determined by normalizing the count of nuclear PKM2 to the count of nuclear DAPI, which represents the number of cell nuclei.

      - "Together, these data demonstrated the nuclear translocation of PKM2 in astrocytes from EAE mice." Here the usage of "suggests" instead of "demonstrated".

      Based on the reviewer's suggestion, we have revised the use of "demonstrated" to "suggest" in this sentence.

      Result 2 and 3:

      - In the literature, DASA-58 is shown to be the activator of PKM2 (https://www.nature.com/articles/nchembio.1060https://doi.org/10.1016/j.cmet.2019.10.015).

      - Providing references for the inhibitory use of DASA-58 for PKM2 would be appreciated.

      DASA-58 is referred to as “PKM2 activator” due to its ability to enforce the tetramerization of PKM2, enhancing the enzymatic ability of PKM2 to catalyze PEP to pyruvate conversion. However, the enforced conversion of tetramerization of PKM2 inhibited the dimer form of PKM2, thereby inhibiting its nuclear translocation. For this reason, DASA-58 is also used as the inhibitor of nuclear translocation of PKM2. In primary BMDMs, LPS induced nuclear PKM2. However, driving PKM2 into tetramers using DASA-58 and TEPP-46 inhibited LPS-induced PKM2 nuclear translocation (Palsson-McDermott et al., 2015). Consistently, FSTL1 induced PKM2 nuclear translocation was inhibited by DASA-58 in BMDMs (Rao et al., 2022). Accordingly, we have added these references in the manuscript.

      - Western blot results and statistics for PKM2 should be quantitatively given for all groups.

      According to the reviewer’s suggestions, we have added the quantification of PKM2 for western blots in figure 2 and figure 3. Quantification of PKM2 in figure 2D is added in Fig S3. Quantification of PKM2 in figure 3D is added in Fig.S4B and Fig. S4C.

      - Figure 3A-B: staining method/details are not mentioned in materials and methods.

      Staining methods is in the paragraph entitled “Immunofluorescence” in the section of materials and methods. The descriptions are as follows:

      For cell immunochemistry, cells cultured on glass coverslips were fixed with 4% PFA for 10 min at RT, followed by permeabilization with 0.3% Triton X-100. Non-specific binding was blocked with buffer containing 3% BSA for 30 min at RT. Briefly, samples were then incubated with primary antibodies and secondary antibodies. DAPI was used to stain the nuclei. Tissues and cells were observed and images were acquired using an EVOS FL Auto 2 Cell image system (Invitrogen). The fluorescence intensity was measured by ImageJ.

      - In Figure 3A, in only DASA-58 treated cells, it looks like GFAP staining is decreased. It would be better to include MFI analysis for GFAP in the supplementary information.

      We have added the MFI analysis for GFAP in Figure 3A in Fig.S4A. GFAP expression is decreased after DASA-58 treatment (in both control and MOGsup condition), the reason might be due to the effect of DASA-58 on inhibition of PKM2 nuclear transport, which subsequently suppress the activation of astrocytes, leading to the decreased expression of GFAP.

      Result 4

      - Detailed explanation of the mass spectrometry and IP experiments should be given in materials and methods. What are the conditions of the cells? Which groups were analyzed? Are they only MOG stimulated, MOG-DASA-58 treated, or only primary astrocytes without any treatment? The results should be interpreted according to the experimental group that has been analyzed.

      We have added the detailed information relating to mass spectrometry and immunoprecipitation in the materials and methods. In general, two groups of cells were subjected to mass spectrometry analysis, primary astrocytes without any treatment and MOGsup-stimulated primary astrocytes. These two groups were immunoprecipitated with anti-PKM2 antibody. Moreover, in the manuscript, we have revised the sentence concerning the description of mass spectrometry. The description is as follows: “To illustrate underlying mechanism accounting for nuclear translocation of PKM2 in astrocytes, we sought to identify PKM2-interacting proteins. Here, unstimulated and MOGsup-stimulated primary astrocytes were subjected to PKM2 immunoprecipitation, followed by mass spectrometry”. Furthermore, the description of these two groups of cells were added in the figure legend of Fig.4.

      Result 5:

      - For the reader, it would be better to start this part by explaining the role of TRIM21 in cells by referring to the literature.

      We agreed with the reviewer that beginning this part by explaining the role of TRIM21 would be better. Accordingly, we have added the following descriptions at the beginning of this part: “TRIM21 is a multifunctional E3 ubiquitin ligase that plays a crucial role in orchestrating diverse biological processes, including cell proliferation, antiviral responses, cell metabolism and inflammatory processes (Chen X. et al., 2022).” The relevant literature has been included: Chen X, Cao M, Wang P, Chu S, Li M, Hou P, et al. The emerging roles of TRIM21 in coordinating cancer metabolism, immunity and cancer treatment. Front Immunol 2022;13:968755.

      - The source and the state of the cells (control vs MOG induced) should be stated (Figure 5A).

      In figure 5A to 5D, single-cell RNA-seq were performed from CNS tissues of naive and different phases of EAE mice (peak and chronic). We have added this detailed information in the figure legend of Figure 5.

      - Figure 5D can be placed after 5A. Data in Figure 5A is probably from naive animals, if so, it should be stated in the legend where A is explained. The group details of the data shown in Figure 5 should be clearly stated.

      According to the reviewer’s suggestions, we have placed 5D after 5A. Single-cell RNA seq analysis were performed from CNS tissues of naïve mice and EAE mice. This information is stated in the legend of Figure 5A-D. “Single-cell RNA-seq profiles from naive and EAE mice (peak and chronic phase) CNS tissues. Naive (n=2); peak (dpi 14–24, n=3); chronic (dpi 21–26, n=2).”

      - Immunofluorescence images should be replaced with better quality images, in control images, stainings are not visible.

      We have replaced with better quality images in figure 5H and in control images, the staining is now visible.

      Result 6:

      - Experimental procedures should be given in detail in materials and methods.

      We have revised the section of materials and methods, and more details are added. Detailed information was added for astrocyte isolation, immunoprecipitation. Moreover, mass spectrometry, Hematoxylin-Eosin (HE) and Luxol Fast Blue (LFB) staining, Splenocyte isolation and supernatant of MOG35-55-stimulated-splenocytes were added in materials and methods.

      Result 7:

      - In Figure 7A, the mean clinical score seems significantly reduced in the shTRIM21-treated group, although it is explained in the result text that it is not significant. Explain to us the difference between Figure 7A and the explaining text?

      Thank you for pointing this out. We sincerely apologize for our carelessness. Based on your comments, we have made the corrections in the manuscript. As there is indeed a statistical difference in the mean clinical scores between shTRIM21-treated group and shVec group, we have accordingly revised the sentence for Figure 7A to state, “At the end time point at day 22 p.i., shTRIM21-treated group showed reduced disease scores compared to control groups (Fig. 7A).” .

      - The staining methods for luxury fast blue and HE are not given in materials and methods.

      According to the reviewer’s comments, we have added the staining methods for HE and LFB in materials and methods.

      - In Figure 7E, authors claim that MBP staining is low in an image, however the image covers approximately 500 um area. One would like to see the demyelinated areas in dashed lines, and also the whole area of the spinal cord sections.

      In Author response image 2, we have added the images for MBP staining of the whole area of spinal cord sections. Demyelinated areas are marked with dashed lines.

      - "TEPP-46 is an allosteric activator that blocks the nuclear translocation of PKM2 by promoting its tetramerization." should be supported by references.

      We have added two references for this sentence. Anastasiou D et al. showed that TEPP-46 acts as an activator by stabilizing subunit interactions and promoting tetramer formation of PKM2. Angiari S et al. showed that TEPP-46 prevented the nuclear transport of PKM2 by promoting its tetramerization in T cells.

      These two references are added:

      Angiari S, Runtsch MC, Sutton CE, Palsson-McDermott EM, Kelly B, Rana N, et al. Pharmacological Activation of Pyruvate Kinase M2 Inhibits CD4(+) T Cell Pathogenicity and Suppresses Autoimmunity. Cell metabolism 2020;31(2):391-405.e8.

      Anastasiou D, Yu Y, Israelsen WJ, Jiang JK, Boxer MB, Hong BS, et al. Pyruvate kinase M2 activators promote tetramer formation and suppress tumorigenesis. Nature chemical biology 2012;8(10):839-47.

      - Could you explain what the prevention stage is?

      The term “prevention stage” was used to describe the administration of TEPP-46 before disease onset. To be more accurate, we have revised the phrase from “prevention stage” to “preventive treatment” as described in other references. For example, Ferrara et al. (Ferrara et al., 2020) used “preventive” and “preventive treatment” to mean administration before disease onset.

      The revised sentences are as follows: “To test the effect of TEPP-46 on the development of EAE, the “preventive treatment” (i.e, administration before disease onset) was administered. Intraperitoneal treatment with TEPP-46 at a dosage of 50 mg/kg every other day from day 0 to day 8 post-immunization with MOG35-55 resulted in decreased disease severity (Fig. S8A).”

      - In in vitro experiments, authors used DASA-58, and in vivo they used TEPP-46. What might be the reason that DASA-58 is not applied in vivo?

      The effects of DASA-58 and TEPP-46 in promoting PKM2 tetramerization have been tested in vitro and has been documented. Based on in vitro absorption, distribution, metabolism and excretion profiling studies, Anastasiou et al. predicted that TEPP-46 had better in vivo drug exposure compared to DASA-58. Moreover, TEPP-46, but not DASA-58, is pharmacokinetically validated in vivo (Anastasiou et al., 2012). Thus, we used TEPP-46 for in vivo studies.

      - Authors claim that TEPP-46 activates PKM2 and leads it its nuclear translocation, however, they did not verify PKM2 expression in the nucleus.

      To support that TEPP-46 exerts effects in inhibiting PKM2 nuclear translocation both in vivo and in vitro, we have performed western blotting analysis and immunofluorescence staining. In vitro, TEPP-46 administration inhibited the MOGsup-induced PKM2 nuclear translocation, which exerts similar effects as DASA-58 (Author response image 4). The in vivo effects of TEPP-46 was analyzed by co-immunostaining of PKM2 and GFAP. The results showed reduced nuclear staining of PKM2 in spinal cord astrocytes in TEPP-46-treated EAE mice compared with control EAE mice (Figure S7B).

      Author response image 4.

      TEPP-46 inhibited the nuclear transport of PKM2 in primary astrocytes. Nuclear-cytoplasmic protein extraction analysis showed the nuclear and cytoplasmic changes of PKM2 in TEPP-46 treated astrocytes and MOGsup-stimulated astrocytes. Primary astrocytes were pretreated with 50 μM TEPP-46 for 30 min and stimulated with MOGsup for 24 h.

      Supplementary Figure 3:

      - In Figure 3D, merge should be stated on top of the merged images, it is confusing to the reader.

      According to the reviewer’s comments, we have added merge on top of the merged images.

      Discussion:

      All results should be discussed in detail by interpreting them according to the literature.

      We have further discussed the results in the discussion n section. Firstly, we added a paragraph describing the role of nuclear translocation of PKM2 in diverse CNS diseases. Moreover, a paragraph discussing the nuclear function of PKM2 as a protein kinase or transcriptional co-activator was added. Now the discussion section is more comprehensive, which nearly discuss all the results by interpreting them according to the literature in detail.

      Reviewer #2 (Recommendations For The Authors):

      The authors could address the following points:

      (1) In Figure 1A, the authors present immunofluorescence staining of PKM2 in both control mice and MOG35-725 55-induced EAE mice across different stages of disease progression: onset, peak, and chronic stages. Observing the representative images suggests a notable increase in PKM2 levels, particularly within the nucleus of MOG35-725 55-induced EAE mice. However, to provide a more comprehensive analysis, it would be beneficial for the authors to include statistical data, such as average intensities {plus minus} standard deviation (SD), along with the nuclear PKM2 ratio, akin to the presentation for cultured primary astrocytes in vitro in panels B-D. Additionally, the authors should clearly specify the number of technical repeats and the total number of animals utilized for these data sets to ensure transparency and reproducibility of the findings.

      Thanks for the reviewer’s suggestion. Accordingly, for figure 1A, we have added the nuclear PKM2 ratio in astrocytes in control and different stages of EAE mice in Supplementary figure S1A. Moreover, the quantification of mean fluorescence intensity (MFI) for PKM2 was added in figure S1B. Moreover, we have added the number of animals used in each group in figure legend.

      (2) The blue hue observed in the merged images of Figure 1B (lower panel) presents a challenge for interpretation. The source of this coloration remains unclear from the provided information. Did the authors also include a co-stain for the nucleus in their imaging? To enhance clarity, especially for individuals with color vision deficiency, the authors might consider utilizing different color combinations, such as presenting PKM2 in green and GFAP in magenta, which would aid in distinguishing the two components. Furthermore, for in vitro cell analysis, incorporating a nuclear stain could provide valuable insights into estimating the cytosolic-to-nuclear ratio of PKM2.

      For the question relating to the merged images in figure 1B, PKM2 was presented in green, GFAP was presented in red and blue represents the nuclear staining by DAPI. “Merge” represents the merged images of these three colors. To enhance the clarity, we have added the images for the nuclear staining of DAPI.

      (3) To substantiate the conclusion of the authors regarding the enhancement of aerobic glycolysis due to PKM2 expression and nuclear translocation in MOGsup-stimulated astrocytes, employing supplementary methodologies such as high-resolution respirometry and metabolomics could offer valuable insights. These techniques would provide a more comprehensive understanding of metabolic alterations and further validate the observed changes in glycolytic activity.

      While we recognize the merits of techniques such as high-resolution respirometry and metabolomics, we believe that the conclusions regarding the enhancement of aerobic glycolysis due to PKM2 expression and nuclear translocation in MOGsup-stimulated astrocytes are sufficiently supported by the current experimental evidence. Our study has relied on a robust set of experiments, including lactate production, glucose consumption, cyto-nuclear localization analysis and western blotting analysis of key enzymes in glycolysis. These results, in conjunction with the literature on the role of PKM2 in various cancer cells, keratinocytes and immune cells, provide a strong foundation for our conclusions. Although metabolomics could offer a global view of the changes in metabolic states in astrocytes, as the end product of aerobic glycolysis is lactate, our study, which analyze the change of lactate levels in different experimental conditions might be more direct. However, we fully acknowledge that future studies employing these advanced methodologies could provide further insights into the precise mechanisms underlying PKM2's effects on aerobic glycolysis.

      (4) Minor: Why is the style of the columns different in Gig 2 panel D compared to those shown in panels B, C, and G of Figure 2.

      To maintain consistency in the column style across figure 2, we have updated the column in figure 2D. Now, we use same style of columns in Fig 2B, C, D and G.

      (5) The effect of stimulating astrocytes with MOGsup on cell proliferation, as shown in Figure 2E, is very moderate. Does DASA-58 reduce the proliferation of control cells in this assay?

      In response to the reviewer’s questions, we conducted a CCK8 analysis in astrocytes subjected to DASA-58 treatment. As depicted in Author response image 5, administration of DASA-58 did not reduce the proliferation of control cells. This result aligns with our other findings in the glycolysis assays and EdU analysis, where there is no statistical difference between control group and DASA-58-treated group. One plausible explanation for this is that in their steady state, astrocytes in the control group are not in a hyperproliferative state. Under such conditions, inhibiting the translocation of PKM2 via DASA-58 or other inhibitors did not significantly affect the proliferation of astrocytes.

      Author response image 5.

      CCK8 analysis of astrocyte proliferation. Primary astrocytes were pretreated with 50 μM DASA-58 for 30 min before stimulation with MOGsup. Data are represented as mean ± SEM. ***P<0.001. SEM, standard error of the mean.

      (6) The tables and lists in Figure 4, panels A-D, are notably small, hindering readability and comprehension. Consider relocating these components to the supplementary materials as larger versions.

      We have updated the tables and lists, the lines are made thicker. As suggested by the reviewer, we relocate theses components in Supplementary Figure S5.

      Reviewer #3 (Recommendations For The Authors):

      Higher magnification images that more clearly show nuclear translocation of PKM2 and pp65 and pSTAT3 immunoreactivity should be added to the figures panels, for example as inlets.

      Thank you for pointing out this issue in the manuscript. According to the reviewer’s comments we have included higher magnification images as inlets for Figure 3A, Figure 3B and Figure 2A. These enlarged images now provide a clearer visualization of the nuclear translocation state of PKM2, pp65, and pSTAT3.

      There are seldom wording errors like features => feathers at line 364.

      We are very sorry for our incorrect writing. We have corrected this spelling mistake in the manuscript.

      Reviewer #4 (Recommendations For The Authors):

      Here below are major and minor concerns on the data presented:

      (1) It is not clear from the Methods section what are the culture conditions defined as 'control' in Figure 1B-D. I believe the control should be culturing with the conditioned medium of normal (non-EAE) mice splenocytes to be sure the effect is not from cytokines naturally secreted by these cells.

      Thanks for the reviewer’s comments and we totally understand the reviewer's concern. The control means non-treated primary astrocytes cultured with traditional DMEM medium supplemented with 10% FBS. In fact, we have performed experiments to exclude the possibility that the observed effect of MOGsup on the activation of astrocytes is from cytokines secreted by splenocytes. Splenocytes from normal (non-EAE) mice were isolated, cultured in RPMI-1640 medium containing 10% FBS for 60 hours, and supernatant was collected. Immunofluorescence staining of PKM2 and GFAP were performed in non-treated primary astrocytes and astrocytes stimulated with supernatant from control splenocytes. As shown in Figure S1C, in both groups, no difference was observed in PKM2 expression and localization, PKM2 was located mainly in the cytoplasm in theses conditions. These results indicate that observed effect of PKM2 in MOGsup-stimulated condition is not due to the cytokines secreted from splenocytes. Thus, we used non-treated primary astrocytes as controls in our study. To clarify the control group, we have revised the description in the figure legend, The revised expression is as follows: “Immunofluorescence staining of PKM2 (green) with GFAP (red) in non-treated primary astrocytes (control) or primary astrocytes cultured with splenocytes supernatants of MOG35–55-induced EAE mice (MOGsup) for different time points (6 h, 12 h and 24 h). ”

      (2) Figure 3D: the presence of PMK2 in the nuclear fraction upon MOGSUP together with the DASA-58 (last lane of Figure 3D) is not supporting the hypothesis proposed and further may indicate that the reduction of pSTAT3, pp65, etc. observed is independent of PMK2 nuclear translocation/astrocyte activation being observed even in absence of MOGSUP.

      Thank you for pointing out this problem in manuscript. The representing image of nuclear level of PKM2 in Figure 3D is not obvious, as shown by figure 3D, which has raised doubts among the reviewers. To strengthen our conclusion that the reduction of STAT3 and p65 pathway is related to the inhibited nuclear level of PKM2 induced by DASA-58, nuclear PKM2 level was quantified and added in Figure S4B. From the quantification results, it is evident that DASA-58 administration decreased the nuclear level of PKM2 in MOGsup-stimulated astrocytes. To address this concern, we have updated the immunoblot image for PKM2 in figure 3D and incorporated quantification results in supplementary Figure S4.

      (3) Molecular docking indication and deletion co-immunoprecipitation reported in Figure 4 data are not concordant on TRIM21: N-terminal Phe23 and Thr87 (Figure 4E) predicted by MD to bind PMK2 are not in the PRY-SPRY domain suggested by the co-IP experiment (Figure 4I).

      The discrepancy between the molecular docking prediction and the co-immunoprecipitation can be explained as follows:

      Firstly, molecular docking is computational methods that predicts protein-protein interaction based on 3-D structures of the proteins. However, the accuracy of this predication can be influenced by the different models of 3D structures of TRIM21 and PKM2, as well as by factors such as post-translational modifications and flexibility of the proteins. Proteins in vivo are subject to post-translational modifications that can affect their interactions. These modifications are not fully captured in molecular docking analysis. For example, in our analysis, the predicted N-terminal Phe23 and Thr87 in TRIM21 hold the potential to interact with PKM2 by hydrogen bonds. However, such binding can be influenced by diverse biological environments, such as different cells and pathological conditions. Molecular docking predication may suggest the specific residues and binding pocked within the protein complex, however, the accuracy should be verified by experimental techniques such as immunoprecipitation. To address the predication results of molecular docking, the description has been revised as follows: “TRIM21 is predicted to bound to PKM2 via hydrogen bonds between the amino acids of the two molecules.”

      Co-immunoprecipitation that involves the use of truncated domains of TRIM21 and PKM2, is an experimental technique relies on the specific interaction between antibody and targeted proteins. This technique can provide insights into the precise binding domains between TRIM21 and PKM2. As demonstrated in our study, PRY-SPRY domain of TRIM21 is involved in this binding. In summary, while molecular docking and Co-IP are valuable tools for studying protein-protein interactions, their differing focus and limitations may result in discrepancies between the predicted interaction sites and the experimentally identified interaction domains.

      (4) The Authors state that PMK2 is a substrate of TRIM21 E3 ligase activity, however, this is not proved: i) interaction does not imply a ligase-substrate relationship; ii) the ubiquitination shown in Figure 6C is not performed in denaturing conditions thus the K63-Ub antibody can detect also interacting FLAG-IPed proteins (besides, only a single strong band is seen, not a chain; molecular weights in immunoblot should be indicated); iii) use of a catalytically inactive TRIM21 would be required as well.

      We appreciate the reviewer’s comments regarding the limitations of the immunoprecipitation and K63-antibody test, which could not lead to the conclusion that PKM2 is a substrate of TRIM21. To avoid any misunderstandings, we have revised the relevant sentence from “Hereby, we recognized PKM2 as a substrate of TRIM21” to “Hereby, we recognized PKM2 as an interacting protein of TRIM21, and further studies are required to determine if it is a substrate of E3 ligase TRIM21”. Moreover, we have revised the title of the relevant part in the results section, the previous title, “TRIM21 ubiquitylates and promotes the nuclear translocation of PKM2” has been replaced with “TRIM21 promotes ubiquitylation and the nuclear translocation of PKM2”. Moreover, molecular weights for all proteins in western blotting were indicated.

      (5) As above, molecular weights should always be indicated in immunoblot.

      Thanks for pointing out this problem in the figures. Accordingly, we have added the molecular weights for every protein tested in immunoblot.

      (6) The authors should describe the EAE mouse model in the text and in the material and methods as it may not be so well known to the entire reader audience, and the basic principle of MOG35-55 stimulation, in order to understand the experimental plan meaning.

      We appreciate the reviewer’s comments highlighting the importance of clarifying EAE model for a broader understanding of the reader audience. In response, we have described the EAE model both in the text and in the materials and methods section. In the text, the description of EAE model was added at the beginning of the first paragraph in the Results section. The description is as follows: “EAE is widely used as a mouse model of multiple sclerosis, which is typically induced by active immunization with different myelin-derived antigens along with adjuvants such as pertussis toxin (PTX). One widely used antigen is the myelin oligodendrocyte glycoprotein (MOG) 35-55 peptide (Nitsch et al., 2021), which was adopted in our current studies.”

      We have also added the detailed experimental procedures for EAE induction in the materials and methods section.

      (7) The authors should better explain and give the rationale for the use of splenocytes and why directly activated astrocytes (isolated from the EAE model) cannot be employed to confirm/prove some of the presented data.

      Firstly, splenocytes offer a heterogenous cell population, encompassing T cells and antigen presenting cells (APC), which may better mimic the microenvironment and complex immune responses observed in vivo.

      Myelin oligodendrocyte glycoprotein (MOG) 35-55 peptide is one widely used antigen for EAE induction. MOG35-55 elicits strong T responses and is highly encephalitogenic. Moreover, MOG35-55 induces T cell-mediated phenotype of multiple sclerosis in animal models. Thus, by isolating splenocytes from the onset stage of EAE mice, which contains APC and effector T cells, followed by stimulation with antigen MOG35-55 in vitro for 60 hours, the T-cell response in the acute stage of EAE diseases could be mimicked in vitro. The supernatant from MOG35-55 stimulated splenocytes has high levels of IFN-γ and IL-17A, which in part mimic the pathological process and environment in EAE, and this technique has been documented in the references (Chen et al., 2009, Kozela et al., 2015).

      Correspondingly, we have revised sentence for the use of MOG35-55 stimulates splenocytes in EAE mice and add the relevant references: “Supernatant of MOG35-55-stimulated splenocytes isolated from EAE mice were previously shown to elicit a T-cell response in the acute stage of EAE and are frequently used as an in vitro autoimmune model to investigate MS and EAE pathophysiology (Chen et al., 2009, Du et al., 2019, Kozela et al., 2015).”

      Secondly, activated astrocytes (isolated from the EAE model) can not be employed for in vitro culture for the following reasons:

      (1) Low cell viability. Compared to embryonic or neonatal mice, adult mice yield a limited number of viable cells. The is mainly because that adult tissues possess less proliferative capacity.

      (2) Disease changes. Astrocytes in EAE mice are exposed to microenvironment including inflammatory cytokines, antigens and other pathological factors. Without this environment, the function and morphology of astrocytes undergo changes, which make it difficult to interpret the results in vitro.

      For these reasons, the in vitro cultured primary astrocytes used the neonatal mice.

      (8) The authors should indicate the phosphorylation sites they are referring to when analysing p-c-myc, pSTAT3, pp65, etc...

      According to the reviewer’s suggestions, we have added the phosphorylation sites for pSTAT3 (Y705), pp65 (S536), p-c-myc (S62) and pIKK (S176+S180) in the figure panels.

      (9) Reference of DASA-58 and TEPP-46 inhibitors and their specificity should be given.

      According to the reviewer’s comments, we have added the relevant references for the use of DASA-58 and TEPP-46 as inhibitors of PKM2 nuclear transport. In primary BMDMs, LPS induced nuclear PKM2. However, driving PKM2 into tetramers using DASA-58 and TEPP-46 inhibited LPS-induced PKM2 nuclear translocation (Palsson-McDermott et al., 2015). Consistently, FSTL1 induced PKM2 nuclear translocation was inhibited by DASA-58 in BMDMs (Rao et al., 2022). Accordingly, we have added these references in the manuscript.

      To address the selectivity of TEPP-46 and add the references, the relevant sentence has been revised from “TEPP-46 is an allosteric activator that blocks the nuclear translocation of PKM2 by promoting its tetramerization” to “TEPP-46 is a selective allosteric activator for PKM2, showing little or no effect on other pyruvate isoforms. It promotes the tetramerization of PKM2, thereby diminishing its nuclear translocation (Anastasiou et al., 2012, Angiari et al., 2020).”

      Reviewing Editor (Recommendations For The Authors):

      The reviewing editor would appreciate it if the original blots from the western blot analysis, which were used to generate the final figures, could be provided.

      Thanks for the reviewing editor’s comment, accordingly, we will add the original blots for the western blots analysis.

      References

      Anastasiou D, Yu Y, Israelsen WJ, Jiang JK, Boxer MB, Hong BS, et al. Pyruvate kinase M2 activators promote tetramer formation and suppress tumorigenesis. Nature chemical biology 2012;8(10):839-47.

      Escartin C, Guillemaud O, Carrillo-de Sauvage M-A. Questions and (some) answers on reactive astrocytes. Glia 2019;67(12):2221-47.

      Ferrara G, Benzi A, Sturla L, Marubbi D, Frumento D, Spinelli S, et al. Sirt6 inhibition delays the onset of experimental autoimmune encephalomyelitis by reducing dendritic cell migration. Journal of neuroinflammation 2020;17(1):228.

      Lin CC, Edelson BT. New Insights into the Role of IL-1β in Experimental Autoimmune Encephalomyelitis and Multiple Sclerosis. Journal of immunology (Baltimore, Md : 1950) 2017;198(12):4553-60.

      Palsson-McDermott Eva M, Curtis Anne M, Goel G, Lauterbach Mario AR, Sheedy Frederick J, Gleeson Laura E, et al. Pyruvate Kinase M2 Regulates Hif-1α Activity and IL-1β Induction and Is a Critical Determinant of the Warburg Effect in LPS-Activated Macrophages. Cell metabolism 2015;21(1):65-80.Rao J, Wang H, Ni M, Wang Z, Wang Z, Wei S, et al. FSTL1 promotes liver fibrosis by reprogramming macrophage function through modulating the intracellular function of PKM2. Gut 2022;71(12):2539-50.

      Wheeler MA, Clark IC, Tjon EC, Li Z, Zandee SEJ, Couturier CP, et al. MAFG-driven astrocytes promote CNS inflammation. Nature 2020;578(7796):593-9.

      Zhang J, Feng G, Bao G, Xu G, Sun Y, Li W, et al. Nuclear translocation of PKM2 modulates astrocyte proliferation via p27 and -catenin pathway after spinal cord injury. Cell Cycle 2015;14(16):2609-18.

    1. Author response:

      We thank the editor and reviewers for their supportive comments about our modeling approach and conclusions, and for raising several valid concerns; we address them briefly below.

      Concerns about model’s biological realism and impact on interpretations

      The goal of this paper was to use an interpretable and modular model to investigate the impact of varying sensorimotor delays. Aspects of the model (e.g. layered architecture, modularity) are inspired by biology; at the same time, necessary abstractions and simplifications (e.g. using an optimal controller) are made for interpretability and generalizability, and they reflect common approaches from past work. The hypothesized effects of certain simplifying assumptions are discussed in detail in Section 3.5. Furthermore, the modularity of our model allows us to readily incorporate additional biological realism (e.g. biomechanics, connectomics, and neural dynamics) in future work. In the revision, we will add citations and edits to the text to clarify these points.

      Concerns that the model is overly complex

      To investigate the impact of sensorimotor delays on locomotion, we built a closed-loop model that recapitulates the complex joint trajectories of fly walking. We agree that locomotion models face a tradeoff between simplicity/interpretability and realism — therefore, we developed a model that was as simple and interpretable as possible, while still reasonably recapitulating joint trajectories and generalizing to novel simulation scenarios. Along these lines, we also did not select a model that primarily recreates empirical data, as this would hinder generalizability and add unnecessary complexity to the model. We do not think these design choices are significant weaknesses of this model; in fact, few comparable models account for all joints involved in locomotion, and fewer explicitly compare model kinematics with kinematics from data. We will add citations and edits to the text to clarify these points in the revision.

      Concerns about the validity of the Kinematic Similarity (KS) metric to evaluate walking

      We chose to incorporate only the first two PCA modes dimensions in the KS metric because the kernel density estimator performs poorly for high dimensional data. Our primary use of this metric was to indicate whether the simulated fly continues walking in the presence of perturbations. For technical reasons, it is not feasible to perform equivalent experiments on real walking flies, which is one of the reasons we explore this phenomenon with the model. We note the dramatic shift from walking to non-walking as delay increases (Figure 5). To be thorough, in the revision, we will investigate the effect of incorporating additional PCA modes, and whether this affects the interpretation of our results. We will additionally edit the discussion and presentation of the KS metric to clarify its purpose in this study. We agree with the reviewers that the KS metric is too coarse to reflect fine details of joint kinematics; indeed, in the unperturbed case, we evaluate our model’s performance using other metrics based on comparisons with empirical data (Figures 2, 7, 8).

    1. Author response:

      We thank the reviewers for their engagement and constructive comments. This provisional response aims to clarify key misconceptions, address major criticisms, and outline our revision plans.

      A primary concern of the reviewers appears to be our model's limitations in addressing a broad range of empirical findings. This, however, misinterprets our core contribution. Our work centers on a cautionary tale that before advocating for newly discovered cell types and their purported special roles in spatial cognition—an approach prevalent in the field—such claims must be tested against alternative (null) hypotheses that may contradict intuitive expectations. We present such an alternative hypothesis regarding spatial cells and their assumed privileged roles. We show that key findings in the field - spatial “cell types”,  arise in a set of null models without spatial grounding (including untrained variants) despite the models not being a model for spatial processing, and we also found that they had no privileged role for representing spatial information.

      Our proposal is not a new model attempting to explain the brain, and therefore we do not aim to capture every empirical finding. Indeed, we would not expect an object recognition model (and its untrained variant) with no explicit spatial grounding to account for all phenomena in spatial cognition. This underscores our key point: if there exists a basic, spatially agnostic model that can explain certain degrees of empirical findings using criteria from the literature (i.e. place, head-direction and border cells), what implications does this have for the more complex theories and models proposed as underlying mechanisms of special cell types?

      Regarding concerns about the limited scope and generalizability of our setting, we will clarify that we considered multiple DNN architectures, both trained and untrained, on multiple decoding tasks (position, head direction, and nearest-wall distance). We plan to extend our experiments further as detailed in the revision plan below.

      Further, there was a methodological concern about using a linear decoder on a fixed DNN for spatial decoding tasks being a form of "hacking". However, linear readout is standard practice in neuroscience to characterize information available in a neural population. Moreover, our tests on untrained networks also showed spatial decoding capabilities, suggesting it's not solely due to the linear readout.

      For our full revision plan:

      (1) We will revise the manuscript to better reflect these above points, clarifying our paper's stance and improving the writing to reduce misconceptions.

      (2) We will address individual public reviews in more detail.

      (3) We intend to address key reviewer recommendations, focusing on better situating our work within the broader context of the existing literature whilst emphasizing the null hypothesis perspective.

      (4) In general, we will consider additional aspects of the literature and conduct new experiments to strengthen the relevance of our work to existing work. We highlight a number of potential experiments which we believe can address reviewer concerns:

      a. Blurring the visual inputs to DNNs to match rodent perception.

      b. Vary environmental settings to verify whether our findings are more

      generalizable (which we predict to be the case).

      c. Vary the environment to assess remapping effects, which will strengthen the

      connection of our work to the literature.

    1. Author response:

      The following is the authors’ response to the original reviews.

      Public Reviews

      Reviewer #1 (Public Review):

      Summary:

      Federer et al. tested AAVs designed to target GABAergic cells and parvalbumin-expressing cells in marmoset V1. Several new results were obtained. First, AAV-h56D targeted GABAergic cells with >90% specificity, and this varied with serotype and layer. Second, AAV-PHP.eB.S5E2 targeted parvalbumin-expressing neurons with up to 98% specificity. Third, the immunohistochemical detection of GABA and PV was attenuated near viral injection sites.

      Strengths:

      Vormstein-Schneider et al. (2020) tested their AAV-S5E2 vector in marmosets by intravenous injection. The data presented in this manuscript are valuable in part because they show the transduction pattern produced by intraparenchymal injections, which are more conventional and efficient.

      Our manuscript additionally provides detailed information on the laminar specificity and coverage of these viral vectors, which was not investigated in the original studies.

      Weaknesses:

      The conclusions regarding the effects of serotype are based on data from single injection tracks in a single animal. I understand that ethical and financial constraints preclude high throughput testing, but these limitations do not change what can be inferred from the measurements. The text asserts that "...serotype 9 is a better choice when high specificity and coverage across all layers are required". The data presented are consistent with this idea but do not make a strong case for it.

      We are aware of the limitations of our results on the AAV-h56D. We agree with the Reviewer that a single injection per serotype does not allow us to make strong statements about differences between the 3 serotypes. Therefore, in the revised version of the manuscript we have tempered our claims about such differences and use more caution in the interpretation of these data (Results p. 6 and Discussion p.10). Despite this weakness, we feel that these data still demonstrate high efficiency and specificity across cortical layers of transgene expression in GABA cells using the h56D promoter, at least with two of the 3 AAV serotypes we tested. We feel that in itself this is sufficiently useful information for the primate community, worthy of being reported. Due to cost, time and ethical considerations related to the use of primates, we chose not to perform additional experiments to determine precise differences among serotypes. Thus, for example, while it is possible that had we replicated these experiments, serotype 7 could have proven equally efficient and specific as the other two serotypes, we felt answering this question did not warrant additional experiments in this precious species.

      A related criticism extends to the analysis of Injection volume on viral specificity. Some replication was performed here, but reliability across injections was not reported. My understanding is that individual ROIs were treated as independent observations. These are not biological replicates (arguably, neither are multiple injection tracks in a single animal, but they are certainly closer). Idiosyncrasies between animals or injections (e.g., if one injection happened to hit one layer more than another) could have substantial impacts on the measurements. It remains unclear which results regarding injection volume or serotype would hold up had a large number of injections been made into a large number of marmosets.

      For the AAV-S5E2, we made a total of 7 injections (at least 2 at each volume), all of which, irrespective of volume, resulted in high specificity and efficiency for PV interneurons. Our conclusion is that larger volumes are slightly less specific, but the differences are minimal and do not warrant additional injections. Additionally, we kept all the other parameters across animals constant (see new Supplementary Table 1), all of our injections involved all cortical layers, and the ROIs we selected for counts encompassed reporter protein expression across all layers. To provide a better sense of the reliability of the results across injections, in the revised version of the manuscript we now provide results for each of the AAV-S5E2 injection case separately in a new Supplementary Table 2. The results in this table indicate the results are indeed rather consistent across cases with slightly greater specificity for injection volumes in the range of 105-180 nl.

      Reviewer #2 (Public Review):

      This is a straightforward manuscript assessing the specificity and efficiency of transgene expression in marmoset primary visual cortex (V1), for 4 different AAV vectors known to target transgene expression to either inhibitory cortical neurons (3 serotypes of AAV-h56D-tdTomato) or parvalbumin (PV)+ inhibitory cortical neurons in mice. Vectors are injected into the marmoset cortex and then postmortem tissue is analyzed following antibody labeling against GABA and PV. It is reported that: "in marmoset V1 AAV-h56D induces transgene expression in GABAergic cells with up to 91-94% specificity and 80% efficiency, depending on viral serotype and cortical layer. AAV-PHP.eB-S5E2 induces transgene expression in PV cells across all cortical layers with up to 98% specificity and 86-90% efficiency."

      These claims are largely supported but slightly exaggerated relative to the actual values in the results presented. In particular, the overall efficiency for the best h56D vectors described in the results is: "Overall, across all layers, AAV9 and AAV1 showed significantly higher coverage (66.1{plus minus}3.9 and 64.9%{plus minus}3.7)". The highest coverage observed is just in middle layers and is also less than 80%: "(AAV9: 78.5%{plus minus}9.1; AAV1: 76.9%{plus minus}7.4)".

      In the abstract, we indeed summarize the overall data and round up the decimals, and state that these percentages are upper bound but that they vary by serotype and layer while in the Results we report the detailed counts with decimals. To clarify this, in the revised version of the Abstract we have changed 80% to 79% and emphasize even more clearly the dependence on serotype and layer. We have amended this sentence of the Abstract as follows: “We show that in marmoset V1 AAV-h56D induces transgene expression in GABAergic cells with up to 91-94% specificity and 79% efficiency, but this depends on viral serotype and cortical layer.”

      For the AAV-PHP.eB-S5E2 the efficiency reported in the abstract (“86-90%) is also slightly exaggerated relative to the results: “Overall, across all layers coverage ranged from 78%{plus minus}1.9 for injection volumes >300nl to 81.6%{plus minus}1.8 for injection volumes of 100nl.”

      Indeed, the numbers in the Abstract are upper bounds, for example efficiency in L4A/B with S5E2 reaches 90%. To further clarify this important point, in the revised abstract we now state ”AAV-PHP.eB-S5E2 induces transgene expression in PV cells across all cortical layers with up to 98% specificity and 86-90% efficiency, depending on layer”.

      These data will be useful to others who might be interested in targeting transgene expression in these cell types in monkeys. Suggestions for improvement are to include more details about the vectors injected and to delete some comments about results that are not documented based on vectors that are not described (see below).

      Major comments:

      Details provided about the AAV vectors used with the h56D enhancer are not sufficient to allow assessment of their potential utility relative to the results presented. All that is provided is: "The fourth animal received 3 injections, each of a different AAV serotype (1, 7, and 9) of the AAV-h56D-tdTomato (Mehta et al., 2019), obtained from the Zemelman laboratory (UT Austin)." At a minimum, it is necessary to provide the titers of each of the vectors. It would also be helpful to provide more information about viral preparation for both these vectors and the AAVPHP.eB-S5E2.tdTomato. Notably, what purification methods were used, and what specific methods were used to measure the titers?

      We thank the Reviewer for this comment. In the revised version of the manuscript, we now provide a new Supplementary Table 1 with titers and other information for each viral vector injection. We also provide information regarding viral preparation in a new sections in the Methods entitled “ Viral Preparation”  (p12).

      The first paragraph of the results includes brief anecdotal claims without any data to support them and without any details about the relevant vectors that would allow any data that might have been collected to be critically assessed. These statements should be deleted. Specifically, delete: “as well as 3 different kinds of PV-specific AAVs, specifically a mixture of AAV1-PaqR4-Flp and AAV1-h56D-mCherry-FRT (Mehta et al., 2019), an AAV1-PV1-ChR2-eYFP (donated by G. Horwitz, University of Washington),” and delete “Here we report results only from those vectors that were deemed to be most promising for use in primate cortex, based on infectivity and specificity. These were the 3 serotypes of the GABA-specific pAAV-h56D-tdTomato, and the PV-specific AAVPHP.eB-S5E2.tdTomato.” These tools might in fact be just as useful or even better than what is actually tested and reported here, but maybe the viral titer was too low to expect any expression.

      These data are indeed anecdotal, but we felt this could be useful information, potentially preventing other primate labs from wasting resources, animals and time, particularly, as some of these vectors have been reported to be selective and efficient in primate cortex, which we have not been able to confirm. We made several injections in several animals of those vectors that failed either to infect a sufficient number of cells or turned out to be poorly specific. Therefore, the negative results have been consistent in our hands. But we agree with the Reviewer that our negative results could have depended on factors such as titer. In the revised version of the manuscript, following the reviewer’s suggestion, we have deleted this information.

      Based on the description in the Methods it seems that no antibody labeling against TdTomato was used to amplify the detection of the transgenes expressed from the AAV vectors. It should be verified that this is the case - a statement could be added to the Methods.

      That is indeed the case. We used no immunohistochemistry to enhance the reporter proteins as this was unnecessary. The native/ non-amplified tdT signal was strong. This is now stated in the methods (p.12).

      Reviewer #3 (Public Review):

      Summary:

      Federer et al. describe the laminar profiles of GABA+ and of PV+ neurons in marmoset V1. They also report on the selectivity and efficiency of expression of a PV-selective enhancer (S5E2). Three further viruses were tested, with a view to characterizing the expression profiles of a GABA-selective enhancer (h56d), but these results are preliminary.

      Strengths:

      The derivation of cell-type specific enhancers is key for translating the types of circuit analyses that can be performed in mice - which rely on germline modifications for access to cell-type specific manipulation - in higher-order mammals. Federer et al. further validate the utility of S5E2 as a PV-selective enhancer in NHPs.

      Additionally, the authors characterize the laminar distribution pattern of GABA+ and PV+ cells in V1. This survey may prove valuable to researchers seeking to understand and manipulate the microcircuitry mediating the excitation-inhibition balance in this region of the marmoset brain.

      Weaknesses:

      Enhancer/promoter specificity and efficiency cannot be directly compared, because they were packaged in different serotypes of AAV.

      The three different serotypes of AAV expressing reporter under the h56D promoter were only tested once each, and all in the same animal. There are many variables that can contribute to the success (or failure) of a viral injection, so observations with an n=1 cannot be considered reliable.

      This is an important point that was also brough up by Reviewer 1, which we have addressed in our reply-to-Reviewer 1. For clarity and convenience, below we copy our response to Reviewer 1.

      “We are aware of the limitations of our results on the AAV-h56D. We agree with the Reviewer that a single injection per serotype does not allow us to make strong statements about differences between the 3 serotypes. Therefore, in the revised version of the manuscript we will temper our claims about such differences and use more caution in the interpretation of these data. Despite this weakness, we feel that these data still demonstrate high efficiency and specificity across cortical layers of transgene expression in GABA cells using the h56D promoter, at least with two of the 3 AAV serotypes we tested. We feel that in itself this is sufficiently useful information for the primate community, worthy of being reported. Due to cost, time and ethical considerations related to the use of primates, we chose not to perform additional experiments to determine precise differences among serotypes. Thus, for example, while it is possible that had we replicated these experiments, serotype 7 would have proven equally efficient and specific as the other two serotypes, we felt answering this question did not warrant additional experiments in this precious species.”

      The language used throughout conflates the cell-type specificity conferred by the regulatory elements with that conferred by the serotype of the virus.

      Authors’ reply. In the revised version of the manuscript, we have corrected ambiguous language throughout.

      Recommendations for the authors

      Reviewer #1 (Recommendations For The Authors):

      My Public Review comments can be addressed by dialing down the interpretation of the data or providing appropriate caveats in the presentation of the relevant results and their discussion.

      We have done so. See text additions on p. 6 of the Results and p.10 of the Discussion.

      Minor comments:

      92% of PV+ neurons in the marmoset cortex were GABAergic. Can the authors speculate on the identity of the 8% PV+/GABA- neurons (e.g., on the basis of morphology)? Are they likely excitatory? Are they more likely to represent failures of GABA staining?

      We do not know what the other 8% of PV+/GABA- neurons are because we did not perform any other kind of IHC staining. Our best guess is that at least to some extent these represent failures of GABA staining, which is always challenging to perform in primate cortex. However, in mouse PV expression has been demonstrated in a minority of excitatory neurons.

      "Coverage of the PV-AAV was high, did not depend on injection volume.." The fact that the coverage did not depend on injection volume presumably depends, at least in part, on how ROIs were selected. Surely different volumes of injection transduce different numbers of neurons at different distances from the injection track. This should be clarified.

      The ROIs were selected at the center of the injected site/expression core from sections in which the expression region encompassed all cortical layers. Of course, larger volumes of injection resulted in larger transduced regions and therefore overall larger number of transduced neurons, but we counted cells only withing 100 µm wide ROIs at the center of the injection and the percent of transduced PV cells in this core region did not vary significantly across volumes. We have clarified the methods of ROI selection (see Methods pp. 13).

      Figure 2. What is meant by “absolute” in the legend for Figure 2? (How does “mean absolute density” differ from “mean density?”)

      We meant not relative, but this is obvious from the units, so we have removed the word “absolute” in the legend.

      Some non-significant p-values are indicated by "p>0.05" whereas others are given precisely (e.g., p = 1). Please provide precise p-values throughout. Also, the p-value from a surprisingly large number of comparisons in the first section of the results is "1". Is this due to rounding? Is it possible to get significance in a Bonferroni-corrected Kruskal-Wallis test with only 6 observations per condition?

      We now report exact p values throughout the manuscript (with a couple of exceptions where, in order to avoid reporting a large number of p values which interrupts the flow of the manuscript) we provide the upper bound value and state all those comparisons were below that value). The minimum sample size for Kruskall Wallis is 5, for each group being compared, and we our sample is 6 per group.

      Figure 3: The density of tdTomato-expressing cells appears to be greater at the AAV9 injection site than at the AAV1 injection site in the example sections shown. Might some of the differences between serotypes be due to this difference? I would imagine that resolving individual cells with certainty becomes more difficult as the amount of tdTomato expression increases.

      There was an error in the scale bar of Fig. 3C, so that the AAV1 injection site was shown at higher magnification than indicated by the wrong scale bar. Hence the density of tdTomato appeared lower than it is. Moreover, the tdT expression region shown in Fig. 3A is a merge of two sections, while it is only from a single section in panels B and C, leading to the impression of higher density of infected cells in panel A. The pipette used for the injection in panel A was not inserted perfectly vertical to the cortical surface, resulting in an injection site that did not span all layers in a single section; thus, to demonstrate that the injection indeed encompassed all layers (and that the virus infected cells in all layers), we collapsed label from two sections. We have now corrected the magnification of panel C so that it matches the scale bar in panel A, and specify in the figure legend that panel A label is from two sections.

      Text regarding Figure 3: The term “injection sizes” is confusing. I think it is intended to mean “the area over which tdTomato-expressing cells were found” but this should be clarified.

      Throughout the manuscript, we have changed the term injection site to “viral-expression region”.

      Figure 3: What were the titers of the three AAV-h56D vectors?

      Titers are now reported in the new Supplementary Table 1.

      Figure 3: The yellow box in Figure 3C is slightly larger than the yellow boxes in 3A and 3B. Is this an error or should the inset of Figure 3 have a scale bar that differs from the 50 µm scale bar in 3A?

      There were indeed errors in scale bars in this figure, which we have now corrected. Now all boxes have the same scale bar.

      Was MM423 one of the animals that received the AAV-h56D injections or one of the three that received AAV-S5E2 injection?

      This is an animal that received a 315nl injection of AAV-PHP.eB-S5E2.tdTomato. This is now specified in the Methods (see p. 12) and in the new Supplementary Table 1.

      Please provide raw cell counts and post-injection survival times for each animal.

      We now provide this information in Supplementary Tables 1 and 2.

      How were the different injection volumes of the AAV-S5E2 virus arranged by animal? Which volume of the AAV-S5E2 virus was injected into the two animals who received single injections?

      We now provide this information in Supplementary Table 1.

      Figure 6A: the point is made in the text that "[the distribution of tdT+ and PV+ neurons] did not differ significantly... peaking in L2/3 and 4C " Is the fact that the number of tdT+ and PV+ peak in layers 2/3 and 4C a consequence of these layers being thicker than the others? If so, this statement seems trivial.

      No, and this is the reason why we measured density in addition to percent of cells across layers in Figure 2. Figure 2B shows that even when measuring density, therefore normalizing by area, GABA+ and PV+ cell density still peaks in L2/3 and 4. Thus, these peaks do not simply reflect the greater thickness of these layers.

      Do the authors have permission to use data from Xu et al. 2010?

      Yes, we do.

      Reviewer #2 (Recommendations For The Authors):

      Minor comments:

      "Viral strategies to restrict gene expression to PV neurons have also been recently developed (Mehta et al., 2019; Vormstein-Schneider et al., 2020)." Mich et al. should also be cited here. Cell Rep. 2021;34(13):108754.

      We thank the reviewer for pointing out this missing references. This is now cited.

      “GABA density in L4C did not differ from any other layers, but the percent of GABA+ cells in L4C was significantly higher than in L1 (p=0.009) and 4A/B (p=<0.0001).” This and other similar observations depend on calculating the percentage of cells relative to the total number of DAPI-labeled cells in each layer. Since it is apparent that there must be considerable variability between layers, it would be helpful to add a histogram showing the densities of all DAPI-labeled cells for each layer.

      This is not how we calculated density. Density, as now clarified in the Results on p. 4, was defined as the number of cells per unit area. Counts in each layer were divided by each layers’ counting area. This corrects for differences in number of total labeled cells per layer. Therefore, reporting DAPI density is not necessary (we did not count DAPI cell density per layer).

      "Identical injection volumes of each serotype, delivered at 3 different cortical depths (see Methods), resulted in different injection sizes, suggesting the different serotypes have different capacity of infecting cortical neurons. AAV7 produced the smallest injection site, which additionally was biased to the superficial and deep layers, with only few cells expressing tdT in the middle layers (Fig. 3B). AAV9 (Fig. 3A) and AAV1 (Fig. 3C) resulted in larger injection sites and infected all cortical layers." Differences noted here might reflect either differences related to the AAV serotype or to differences in titers. Please add details about titers for each vector and add comments as appropriate. Another interpretation would be that there are differences in viral spread within the tissue.

      We have now added Supplementary Table 1 which reports titers in addition to other information about injections. The titers and volumes used for AAV9 and AAV7 were identical, while the titer for AAV1 was higher. Therefore, the differences in infectivity, particularly the much smaller expression region obtained with AAV7 cannot be attributed to titer. Likely this is due to differences in tropism and/or viral spread among serotypes. This is now discussed (see Results p. 5bottom and 6 top).

      “Recently, several viral vectors have been identified that selectively and efficiently restrict gene expression to GABAergic neurons and their subtypes across several species, but a thorough validation and characterization of these vectors in primate cortex has lacked.” Is this really a fair statement, or is the characterization presented here also lacking? Methods used by others for quantifying specificity and efficiency are essentially the same as used here. See for example Mich et al. (which is not cited).

      The original validation in primates of the vectors examined in our study was based on small tissue samples and did not examine the laminar expression profile of transgene expression induced by these enhancer-AAVs. For example, the validation of the h56D-AAV in marmoset cortex in the original paper by Mehta et al (2019) was performed on a tissue biopsy with no knowledge of which cortical layers were included in the tissue sample. The only study that shows laminar expression in primate cortex (Mich et al., which is now cited), only shows qualitative images of viral expression across layers, reporting total specificity and coverage pooled across samples; moreover, the study by Mich et al.  deals with different PV-specific enhancers than the ones characterized in our study. Unlike any of the previous studies, here we have quantified specificity and coverage across layers.

      "Specifically, we have shown that the GABA-specific AAV9-h56D (Mehta et al., 2019) induces transgene expression in GABAergic cells with up to 91-94% specificity and 80% coverage, and the PV-specific AAV-PHP.eB-S5E2 (Vormstein-Schneider et al., 2020) induces transgene expression in PV cells with up to 98% specificity and 86-90% coverage." These statements in the discussion repeat the somewhat exaggerated coverage numbers noted above for the Abstract.

      The averages across all layers are reported in the Results. The Discussion, abstract and discussion report upper limits, and this is made clear by stating “up to”, and now we have also added “depending on layer”.

      Reviewer #3 (Recommendations For The Authors):

      Abstract:

      • Ln 2: Can you be more specific about what you mean by the 'various functions of inhibition'? e.g. do you mean 'the various inhibitory influences on the local microcircuit' or similar?

      These are listed in the introduction to the paper but there is no space in the abstract to do so. Now the sentence reads: “various computational functions of…”.

      • Ln 5: 'has' to 'is'/'has been'.

      The grammar here is correct “has derived”.

      • Ln 6: humans are primates! Maybe change this to 'nonhuman primates'?

      We have added “non-human”

      • Ln n-1: 'viral vectors represent' -> 'viral vectors are'.

      We have changed it to “are”

      Intro:

      • Many readers may expect 'VIP' to be listed as the third major sub-class of interneurons. Could you note that the 5HT3a receptor-expressing group includes VIP cells?

      Done (p.3).

      • "Understanding cortical inhibitory neuron function in the primate is critical for understanding cortical function and dysfunction in the model system closest to humans" - this seems close to being circular logic (not quite, but close). Could you modify this sentence to reflect why understanding cortical function and dysfunction in NHP may be of interest?

      This sentence now reads (p.3):” Understanding cortical inhibitory neuron function in the primate is critical for understanding cortical function and dysfunction in the model system closest to humans, where cortical inhibitory neuron dysfunction has been implicated in many neurological and psychiatric disorders, such as epilepsy, schizophrenia and Alzheimer’s disease (Cheah et al., 2012; Verret et al., 2012; Mukherjee et al., 2019)”. We also note that this was already stated in the previous version of the paper but in the Discussion section which read (and still reads on p. 9 2nd paragraph): “It is important to study inhibitory neuron function in the primate, because it is unclear whether findings in mice apply to higher species, and inhibitory neuron dysfunction in humans has been implicated in several neurological and psychiatric disorders (Marin, 2012; Goldberg and Coulter, 2013; Lewis, 2014).”.

      • "In particular, two recent studies have developed recombinant adeno-associated viral vectors (AAV) that restrict gene expression to GABAergic neurons". This sentence places the emphasis on the wrong component of the technology. The fact that AAV was used is irrelevant; these constructs could equally have been packaged in a lenti, CAV, HSV, rabies, etc. The emphasis should be on the recently developed regulatory elements (the enhancers/promoters).

      Same problem with the following excerpts; this text implies that the serotype/vector confers cell-type selectivity, but the results presented do not support this assertion (the promoter/enhancer is what confers the selectivity).

      • "specifically, three serotypes of an AAV that restricts gene expression to GABAergic neurons".

      • "one serotype of an AAV that restricts gene expression to PV cells".

      • "GABA- and PV-specific AAVs".

      • "GABA-specific AAV" (in results).

      • "PV-specific AAVs".

      • "In this study, we have characterized several AAV vectors designed to restrict expression to GABAergic cells" (in discussion).

      • "GABA-virus". GABA is a NT, not a virus.

      We have modified the language in all these sections and throughout the manuscript.

      Results:

      • Enhancer specificity and efficiency cannot be directly compared, because they were packaged in different serotypes of AAV.

      We agree, and in fact we are not making comparisons between different enhancers (i.e., S5E2 and h56D).

      The three different serotypes of AAV expressing reporter under the h56D promoter were only tested once each, and all in the same animal. There are many variables that can contribute to the success (or failure) of a viral injection, so observations with an n=1 cannot be considered reliable.

      The authors need to either: (1) replicate the h56D virus injections in (at least) a second animal, or (2) rewrite the paper to focus on the AAV.PhP mDlx virus alone - for which they have adequate data - and mention the h56D data as an anecdotal result, with clear warnings about the preliminary nature of the observations due to lack of replication.

      We agree about the lack of sufficient data to make strong statements about the differences between serotypes for the h56D-AAV. In the revised version of the manuscript, following the Reviewers’ suggestion, we have chosen to temper our claims about differences between serotypes for the h56D enhancer and use more caution in the interpretation of these data. We feel that these data still demonstrate sufficiently high efficiency and specificity across cortical layers of transgene expression in GABA cells using the h56D promoter, at least with two of the 3 AAV serotypes we tested, to warrant their use in primates. Due to cost, time and ethical considerations related to the use of primates, we chose not to perform additional experiments to determine precise differences among serotypes. Thus, for example, while it is possible that had we replicated these experiments, serotype 7 could have proven equally efficient and specific as the other two serotypes, we felt answering this question did not warrant additional experiments in this precious species. Our edits in regard to this point can be found in the Results on p. 6 and Discussion on p. 10.

      • Did the authors compare h56D vs mDlx? This would be a useful and interesting comparison.

      We did not.

      • 3 tissue sections were used for analysis. How were these selected? Did the authors use a stereological approach?

      For the analysis in Fig. 2, the 3 sections were randomly selected and for the positioning of the ROIs we selected a region in dorsal V1 anterior to the posterior pole  (to avoid laminar distortions due to the curvature of the brain). This is now specified (see p. 4).

      • "both GABA+ and PV+ cells peak in layers" revise for clarity (e.g., the counts peak).

      In now reads “GABA+ and PV+ cell percent and density” (see p.4).

      • "we refer to this virus as GABA-AAV" these are 3 different viruses!

      The idea here was to use an abbreviation instead of using the full viral name every single time. Clearly the reviewer does not like this, so we have removed this convention throughout the paper and now specify the entire viral name each time.

      • "Identical injection volumes of each serotype, delivered at 3 different cortical depths (see Methods), resulted in different injection sizes". Do you mean 'resulted in different volumes of expression'?

      Yes. We have now rephrased this as follows: “…resulted in viral expression regions that differed in both size as well as laminar distribution” (p.5).

      • “suggesting the different serotypes have different capacity of infecting cortical neurons”. You can’t draw any firm conclusions from a single injection. The rest of this section of the results, along with the whole of Figure 4, and Figure 7a-d, is in danger of being misleading. Please remove. The best you can do here is to say ‘we injected 3 different viruses that express reporter under the h56D promoter. The results are shown in Figure 3, but these are anecdotal, as only a single injection of each virus was performed’. You could then note in the discussion to what extent these results are consistent with the existing literature (e.g., AAV9 often produces good coverage in NHP – anterograde and retrograde, AAV1 also works well in the CNS, although generally doesn’t infect as aggressively as AAV9. I’m not familiar with any attempts to use AAV7).

      With respect to Fig. 4, our approach in the revised version is detailed above. For convenience we copy it below here. With respect to Fig 7A-D, we feel the results are more robust as the data from the 3 serotypes here were pooled together, as the 3 serotype similarly downregulated GABA and PV expression at the injection site, and we do not make any statement about differences among serotypes for the data shown in Fig. 7A-D.

      “In the revised version of the manuscript, following the Reviewer ’s suggestion, we have chosen to temper our claims about differences between serotypes for the h56D enhancer and use more caution in the interpretation of these data (see revised text in the Results on p. 6 and in the Discussion on p. 10). We feel that these data still demonstrate sufficiently high efficiency and specificity across cortical layers of transgene expression in GABA cells using the h56D promoter, at least with two of the 3 AAV serotypes we tested, to warrant their use in primates. Due to cost, time and ethical considerations related to the use of primates, we chose not to perform additional experiments to determine precise differences among serotypes. Thus, for example, while it is possible that had we replicated these experiments, serotype 7 could have proven equally efficient and specific as the other two serotypes, we felt answering this question did not warrant additional experiments in this precious species.”

      • Figure 3: why the large variation in tissue quality? Are the 3 upper images taken at the same magnification? If not, they need different scale bars. The cells in A (upper row) look much smaller than those in B and C, and the size of the 'inset' box varies.

      We thank the reviewer for noticing this. We discovered an error in the scale bar of Fig. 3C, so that the AAV1 injection site was shown at higher magnification than indicated by the wrong scale bar. We have now corrected the error in scale bars. We have also fixed the different box sizes.

      • "Overall, across all layers coverage ranged from 78%{plus minus}1.9 for injection volumes >300nl to 81.6%{plus minus}1.8 for injection volumes of 100nl." Coverage didn't differ between layers, so revise this to: "Overall, across all layers coverage ranged from 78% to 81.6%." or give an overall mean (~80%).

      We have corrected the sentence as suggested by the Reviewer (see p. 8 first paragraph).

      • "extending farther from the borders" -> "extending beyond the borders".

      We have corrected the sentence as suggested by the Reviewer (see p. 8).

      • "The reduced GABA and PV immunoreactivity caused by the viruses implies that the specificity of the viruses we have validated in this study is likely higher than estimated". Yes, but for balance you should also note that they may harm the physiology of the cell.

      We have added a sentence acknowledging this to the Discussion. Specifically, on p. 10, we now state: “However, this reduced immunoreactivity raises concerns about the virus or high levels of reporter protein possibly harming the cell physiology.”

      Discussion:

      • "but a thorough validation and characterization of these vectors in primate cortex has lacked" better to say "has been limited", because Dimidschstein 2016 (marmoset V1) and Vormstein-schneider 2020 (macaque S1 and PFC) both reported expression in NHP.

      We have added the following sentence to this paragraph of the Discussion. “In particular, previous studies have not characterized the specificity and coverage of these vectors across cortical layers.”(see p. 8).

      • "whether finding in mice" -> 'whether findings in mice'.

      Corrected, thanks.

      • The discussion re: species differences is missing reference to Kreinen 2020 (10.1038/s41586-020-2781-z).

      This reference has been added. Thanks.

      • “Injections of about 200nl volume resulted in higher specificity (95% across layers) and coverage” – this is misleading. The coverage was not statistically different among injection volumes.

      We have added the following sentence: ”although coverage did not differ significantly across volumes.” (see p. 10).

      • "it is possible that subtle alteration of the cortical circuit upon parenchymal injection of viruses (including AAVs) leads to alteration of activity-dependent expression of PV and GABA." Or (and I would argue, more likely) the expression of large quantities of your big reporter protein compromised the function of the cell, leading to reduced expression of native proteins. You don't mention any IHC to amplify the RFP signal, so I'm assuming that your images are of direct expression. If so, you are expressing A LOT of reporter protein.

      We have added a sentence acknowledging this to the Discussion. Specifically, on p. 10, we now state: “However, this reduced immunoreactivity raises concerns about the virus or high levels of reporter protein possibly harming the cell physiology.”

      Methods:

      • It's difficult to piece together which viruses were injected in which monkeys, at what volumes, and at what titer. Please compile this info into a table for ease of reference (including any other relevant parameters).

      We now provide a Supplementary Table 1.

    1. Author response:

      The following is the authors’ response to the original reviews.

      Public Reviews:

      Reviewer #1 (Public Review):

      Summary:

      The authors of this manuscript characterize new anion conducting that is more red-shifted in its spectrum than prior variants called MsACR1. An additional mutant variant of MsACR1 that is renamed raACR has a 20 nm red-shifted spectral response with faster kinetics. Due to the spectral shift of these variants, the authors proposed that it is possible to inhibit the expression of MsACR1 and raACR with lights at 635 nm in vivo and in vitro. The authors were able to demonstrate some inhibition in vitro and in vivo with 635 nm light. Overall the new variants with unique properties should be able to suppress neuronal activities with red-shifted light stimulation.

      Strengths:

      The authors were able to identify a new class of anion conducting channelrhodopsin and have variants that respond strongly to lights with wavelength >550 nm. The authors were able to demonstrate this variant, MsACR1, can alter behavior in vivo with 635 nm light. The second major strength of the study is the development of a red-shifted mutant of MsACR1 that has faster kinetics and 20 nm red-shifted from a single mutation.

      Weaknesses:

      The red-shifted raACR appears to work much less efficiently than MsACR1 even with 635 nm light illumination both in vivo (Figure 4) and in vitro (Figure 3E) despite the 20 nm red-shift. This is inconsistent with the benefits and effects of red-shifting the spectrum in raACR. This usually would suggest raACR either has a lower conductance than MsACR1 or that the membrane/overall expression of raACR is much weaker than MsACR1. Neither of these is measured in the current manuscript.

      Thank you for addressing this crucial issue. We posit that the diminished efficiency of raACR in comparison to MsACR1 WT can be attributed to the tenfold acceleration of its photocycle. As noted by Reviewer 1, the anticipated advantages associated with a red-shifted opsin, particularly in in vivo preparations, are offset by its accelerated off-kinetics. Consequently, the shorter dwell time of the open state leads to a reduced number of conducted ions per photon. Nevertheless, the operational light sensitivity is not drastically altered compared to MsACR WT (Fig. 3C). We believe that the rapid kinetics offer interesting applications, such as the precise inhibition of single action potentials through holography.

      There are limited comparisons to existing variants of ACRs under the same conditions in the manuscript overall. There should be more parallel comparison with gtACR1, ZipACR, and RubyACR in identical conditions in cultured cell lines, cultured neurons, and in vivo. This should be in terms of overall performance, efficiency, and expression in identical conditions. Without this information, it is unclear whether the effects at 635 nm are due to the expression level which can compensate for the spectral shift.

      We compared MsACR1 and raACR with GtACR1 in ND cells in supplemental figure 4. We concur that further comparisons could be useful to emphasise both the strengths of MsACRs and applications where they may not be as suitable. We are currently in the process of outlining a separate article. We firmly believe that each ACR variant occupies a distinct application niche, which necessitates a more comprehensive electrophysiological comparison to provide valuable insights to the scientific community.

      There should be more raw traces from the recordings of the different variants in response to short pulse stimulation and long pulse stimulation to different wavelengths. It is difficult to judge what the response would be like when these types of information are missing.

      We appreciate Reviewer 1's feedback and have compiled a collection of raw photoresponses, encompassing various pulse widths and wavelengths, which can be found in the Supplementary materials (Supplementary Figures 4 and 5).

      Despite being able to activate the channelrhodopsin with 635 nm light, the main utility of the variant should be transcranial stimulation which was not demonstrated here.

      We concur with Reviewer 1's assessment that MsACR prime application is indeed transcranial stimulation. However, it's worth emphasising that the full advantages of transcranial optical stimulation become most apparent when animals are truly freely moving without any tethered patch cords. Our ongoing research in the laboratory is dedicated to the development of a wireless LED system that can be securely affixed to the animal's skull. We aim to demonstrate the potential of these novell optogenetic approaches in the field of behavioural neuroscience in the coming year.

      Figure 3B is not clearly annotated and is difficult to match the explanation in the figure legend to the figure. The action potential spikings of neurons expressing raACR in this panel are inhibited as strongly as MsACR1.

      We have enhanced the figure caption and annotations for clarity. The traces presented in Figure 3B are intended to demonstrate the overall effectiveness of each variant. However, it is in the population data analysis, as depicted in Figure 3E, where the meaningful insights are revealed.

      For many characterizations, the number of 'n's are quite low (3-7).

      We acknowledge Reviewer 1's suggestion regarding the in vivo data and agree with the importance of including more animals, as well as control animals. However, we are committed to adhering to the principles of the 3Rs (Replacement, Reduction, Refinement) in animal research, and given the robustness of our observed effects, we will add animals to reach the minimal number of animals per condition (n = 2) to minimise unnecessary animal usage while ensuring statistical power.

      We will continue to adhere to the established standards in the field, aiming for a range of 3 to 7 cells per condition, sourced from at least two independent preparations, to ensure the robustness and reliability of our in vitro data.

      Reviewer #2 (Public Review):

      Summary:

      The authors identified a new chloride-conducting Channelrhodopsin (MsACR1) that can be activated at low light intensities and within the red part of the visible spectrum. Additional engineering of MsACR1 yielded a variant (raACR1) with increased current amplitudes, accelerated kinetics, and a 20nm red-shifted peak excitation wavelength. Stimulation of MsACR1 and raACR1 expressing neurons with 635nm in mice's primary motor cortices inhibited the animals' locomotion.

      Strengths:

      The in vitro characterization of the newly identified ACRs is very detailed and confirms the biophysical properties as described by the authors. Notably, the ACRs are very light sensitive and allow for efficient in vitro inhibition of neurons in the nano Watt/mm^2 range. These new ACRs give neuroscientists and cell biologists a new tool to control chloride flux over biological membranes with high temporal and spatial precision. The red-shifted excitation peaks of these ACRs could allow for multiplexed application with blue-light excited optogenetic tools such as cation-conducting channelrhodopsins or green-fluorescent calcium indicators such as GCaMP.

      Weaknesses:

      The in-vivo characterization of MsACR1 and raACR1 lacks critical control experiments and is, therefore, too preliminary. The experimental conditions differ fundamentally between in vitro and in vivo characterizations. For example, chloride gradients differ within neurons which can weaken inhibition or even cause excitation at synapses, as pointed out by the authors. Notably, the patch pipettes for the in vitro characterization contained low chloride concentrations that might not reflect possible conditions found in the in vivo preparations, i.e., increasing chloride gradients from dendrites to synapses.

      We appreciate Reviewer 2’s feedback regarding missing control experiments. We will respond to these concerns in another section of our manuscript, as suggested.

      Regarding the chloride gradient, we understand the concerns of Reviewer 2, yet we chose these ionic conditions, particularly as they were used in the initial electrical characterization of GtACR1 in a neuronal context (Mahn et al., 2016). We will make sure to provide this context in our manuscript to justify our choice of ionic conditions.

      Interestingly, the authors used soma-targeted (st) MsACR1 and raACR1 for some of their in vitro characterization yielding more efficient inhibition and reduction of co-incidental "on-set" spiking. Still, the authors do not seem to have utilized st-variants in vivo.

      At the time of submission, due to the long-term absence of our lab technician, we were not able to produce purified viruses. Therefore, we decided to move on with the submission. We now produced the virus externally, and will provide the experiments.

      Most importantly, critical in vivo control experiments, such as negative controls like GFP or positive controls like NpHR, are missing. These controls would exclude potential behavioral effects due to experimental artifacts. Moreover, in vivo electrophysiology could have confirmed whether targeted neurons were inhibited under optogenetic stimulations.

      We have several non-injected control animals that we used to calibrate this particular paradigm and never saw similar responses. However, we acknowledge the suggestion of Reviewer 2 and will include the GFP-injected control as recommended.

      Some of these concerns stem from the fact that the pulsed raACR stimulation at 635 nm at 10Hz (Fig. 3E) was far less efficient compared to MsACR1, yet the in vivo comparison yielded very similar results (Fig. 4D).

      As outlined previously, the accelerated photocycle of raACR results in a reduction in photocurrent amplitude, consequently diminishing the potency of inhibition per photon. In the context of in vitro stimulation, where single action potentials are recorded, this reduction in inhibition efficiency is resolved. However, in the realm of in vivo behavioural analysis, the observed effect is not contingent on single action potentials but rather stems from the disruption of the entire M1 motor network. In this context, despite the reduced efficiency of the fast-cycling raACR, it still manages to interrupt the M1 network, leading to similar behavioural outcomes.

      Also, the cortex is highly heterogeneous and comprises excitatory and inhibitory neurons. Using the synapsin promoter, the viral expression paradigm could target both types and cause differential effects, which has not been investigated further, for example, by immunohistochemistry. An alternative expression system, for example, under VGLUT1 control, could have mitigated some of these concerns.

      Indeed, we acknowledge the limitations of our current experimental approach. We are in the process of planning and conducting additional experiments involving cre-dependent expression of st-MSACR and st-raACR in PV-Cre mice.

      Furthermore, the authors applied different light intensities, wavelengths, and stimulation frequencies during the in vitro characterization, causing varying spike inhibition efficiencies. The in vivo characterization is notably lacking this type of control. Thus, it is unclear why the 635nm, 2s at 20Hz every 5s stimulation protocol, which has no equivalent in the in vitro characterization, was chosen.

      We appreciate the valuable comment from the reviewer. The objective of our in vitro characterization is to elucidate the general effects of specific stimulation parameters on the efficiency of neuronal inhibition. For instance, we aim to demonstrate that lower light intensities result in less efficient inhibition, or that pulse stimulation may lead to a less complete inhibition, albeit significantly reducing the energy input into the system.

      In the in vivo characterization, we face constraints such as animal welfare considerations and limitations in available laser lines, which prevent us from exploring the entire parameter space as comprehensively as in the in vitro preparation. Additionally, it is important to note that membrane capacitance tends to be higher in vivo compared to dissociated hippocampal neurons. Consequently, we have opted for a doubled stimulation frequency from 10 Hz to 20 Hz and the stimulation pattern of 2 seconds ”on” and 5 seconds “off”. This approach allows the animals to spend less time in an arrested state while still demonstrating the effect of MsACR and variants.

      In summary, the in vivo experiments did not confirm whether the observed inhibition of mouse locomotion occurred due to the inhibition of neurons or experimental artifacts.

      In addition, the author's main claim of more efficient neuronal inhibition would require them to threshold MsACR1 and raACR1 against alternative methods such as the red-shifted NpHR variant Jaws or other ACRs to give readers meaningful guidance when choosing an inhibitory tool.

      The light sensitivity of MsACR1 and raACR1 are impressive and well characterized in vitro. However, the authors only reported the overall light output at the fiber tip for the in vivo experiments: 0.5 mW. Without context, it is difficult to evaluate this value. Calculating the light power density at certain distances from the light fiber or thresholding against alternative tools such as NpHR, Jaws, or other ACRs would allow for a more meaningful evaluation.

      We thank the reviewers for their comments.

      Reviewer #1 (Recommendations For The Authors):

      The study would be much strengthened if the authors can perform more experiments and characterization to support their claims, in addition to showing more raw electrophysiological traces/results and not just summary charts and graphs.

      As outlined above, further experiments are planned. We appreciate the suggestion to include more raw electrophysiological traces. Photocurrent traces of all included mutants of MsACR1 measured in ND cells and traces of hippocampal neuronal measurements of non- and soma-targeted MsACR1 and raACR will be included as supplemental figures.

      Reviewer #2 (Recommendations For The Authors):

      Major concern:

      It is unclear if the optogenetic light stimulation in Fig. 4 caused direct inhibition of neuronal activity in M1, which cell types were targeted, and how MsACR1 and raACR1 compare to other optogenetic inhibitors.

      Also, the rationale for the light stimulation (635 nm, 2s, 20Hz, every 5s) is not clear.

      I would suggest the following to address these concerns:

      (1) M1 expression and stimulation of a negative control such as GFP to exclude that experimental artifacts cause the observed behavioral outcomes.

      We are now preparing the required GFP control, and will add it to the new version of the manuscript.

      (2) Expression and stimulation of NpHR as a positive control.

      We will use st-GtACR1 as a positive control.

      (3) Electrophysiological measurements of neuronal activity under optogenetic stimulation to confirm the effectiveness of neuronal inhibition, i.e. suppression of spontaneous firing under light etc.

      We concur with Reviewer 2 regarding the potential value of incorporating such in vivo optrode recordings into our manuscript to enable readers to assess the effectiveness of MsACR. As part of our plan for the next version of the manuscript, we intend to conduct these experiments.

      (4) ChR2 or other cation-conducting channelrhodopsins with the same expression paradigm could be used to observe diametrically opposite effects.

      As Reviewer 2 has already pointed out, the complex interactions that can occur in our viral strategy when an inhibitory opsin is expressed in both excitatory and inhibitory neurons make us sceptical about the possibility of an excitatory opsin leading to opposing effects.

      Considering the non-linear input-output function of cortical circuits, optogenetic activation of neurons, even when expressed in either inhibitory or excitatory neurons, is likely to result in the perturbation of the cortical network, which will likely also lead to locomotor arrest.

      (5) The authors should confirm whether the expression under synapsin preferentially targeted excitatory and inhibitory cells because inhibiting inhibitory cells could lead to the disinhibition of the principal cells. Synapsin promoters can drive expression in glutamatergic and GABAergic neurons. An alternative expression system under VGLUT1 promoter could yield better targeting.

      We concur with Reviewer 2 and will conduct the next set of experiments using the PV-Cre mouse line. Additionally, we will employ in vivo electrophysiology to further confirm the inhibition of the motor cortex network.

      (6) Titrating of optogenetic stimulation: The author should test whether increasing or decreasing light intensities and stimulation frequencies as well as different wavelengths (550 nm vs 635 nm) cause differences in inhibiting locomotion in vivo as it did for inhibiting the neuronal firing in vitro (Fig. 3B-E).

      The non-linear input-output function within cortical networks, coupled with our sole reliance on behaviour as a readout, will pose challenges in resolving subtle effects on locomotion arrest across various stimulation parameters.

      For our planned in vivo electrophysiology recordings, we will measure cortical firing rates as a proxy rather than relying solely on behavioural observations. This approach will allow us to map the fundamental axes of our parameter space in vivo, considering factors such as wavelength, light intensity, and frequency

      (7) Explanation of why the 20Hz/2s light stimulation protocol was chosen.

      As outlined above, considering animal welfare and increased membrane capacitance in vivo, we opted for the outlined stimulation protocol. This approach allows the animals to spend less time in an arrested state while still demonstrating the effect of MsACR and variants.

      (8) In vivo thresholding against other inhibitory tools, such as RubyACRs, Jaws, etc would provide critical guidance for the audience and potential users. It would be particularly important to compare the necessary light intensities for reaching similar behavioral outcomes.

      We concur with Reviewer 2 and will prepare data using GtACR1 as a reference.

      (9) The author should calculate or reasonably estimate the in vivo light intensity during optogenetic stimulation to provide a meaningful comparison to their in vitro characterization. Ideally, they can provide an estimated volume for efficient stimulation of MsACR1 and raACR1 and compare it to other optogenetic tools.

      We will conduct a Monte Carlo simulation and offer a comparison of the effective activation volume across various classes of optogenetic tools.

      Minor concerns:

      (1) Why were st- MsACR1 and raACR1 used in vitro but not in vivo? The viral constructs were described as AAV/DJ-hSyn1-MsACR-mCerulean and AAV/DJ-hSyn1-raACR-mCerulean.

      As mentioned earlier, we were unable to produce purified soma-targeted MsACR variants before the manuscript submission. We will now provide these measurements.

      (2) Light intensities for the spectral measurements are missing.

      During action spectra measurements, a motorised neutral density filter wheel is used to have equal photon flux for all tested wavelengths. Additionally, the light intensity is further reduced by using additional neutral density filters to ensure sufficiently low photocurrents to determine the spectral maximum. Therefore, the light intensity varied between constructs and sometimes measurements. We added the following line to the respective methods section to further clarify this: “(typically in the low µW-range at 𝜆max)”.

      (3) MsACR1 is slower and probably more light-sensitive than raACR1, which is faster but has larger photocurrents. These are complementary tradeoffs, and the audience might wonder how MsACR1 and raACR1 photocurrents compare under similar conditions. Therefore, I suggest an alternative representation in Fig. 2C. That is, the presentation of the excitation spectra under similar light intensities and with absolute photocurrent values.

      Unfortunately, due to the reasons stated above, MsACR1 and raACR action spectra were not recorded with the same light intensity. However, MsACR1 and raACR are compared under the same conditions for Fig. 2B, E, and F (560 nm light at ~3.2 mW/mm2) as well as in Supp. Fig. 4C.

      (4) Figure legends for figures 3F and G are missing details for describing the stimulation paradigm.

      We added more details about the stimulation paradigm.

    1. Author response:

      The following is the authors’ response to the original reviews.

      Public Reviews:

      Reviewer #1 (Public Review):

      Summary:

      This paper presents a compelling and comprehensive study of decision-making under uncertainty. It addresses a fundamental distinction between belief-based (cognitive neuroscience) formulations of choice behaviour with reward-based (behavioural psychology) accounts. Specifically, it asks whether active inference provides a better account of planning and decision-making, relative to reinforcement learning. To do this, the authors use a simple but elegant paradigm that includes choices about whether to seek both information and rewards. They then assess the evidence for active inference and reinforcement learning models of choice behaviour, respectively. After demonstrating that active inference provides a better explanation of behavioural responses, the neuronal correlates of epistemic and instrumental value (under an optimised active inference model) are characterised using EEG. Significant neuronal correlates of both kinds of value were found in sensor and source space. The source space correlates are then discussed sensibly, in relation to the existing literature on the functional anatomy of perceptual and instrumental decision-making under uncertainty.

      Strengths:

      The strengths of this work rest upon the theoretical underpinnings and careful deconstruction of the various determinants of choice behaviour using active inference. A particular strength here is that the experimental paradigm is designed carefully to elicit both information-seeking and reward-seeking behaviour; where the information-seeking is itself separated into resolving uncertainty about the context (i.e., latent states) and the contingencies (i.e., latent parameters), under which choices are made. In other words, the paradigm - and its subsequent modelling - addresses both inference and learning as necessary belief and knowledge-updating processes that underwrite decisions.

      The authors were then able to model belief updating using active inference and then look for the neuronal correlates of the implicit planning or policy selection. This speaks to a further strength of this study; it provides some construct validity for the modelling of belief updating and decision-making; in terms of the functional anatomy as revealed by EEG. Empirically, the source space analysis of the neuronal correlates licences some discussion of functional specialisation and integration at various stages in the choices and decision-making.

      In short, the strengths of this work rest upon a (first) principles account of decision-making under uncertainty in terms of belief updating that allows them to model or fit choice behaviour in terms of Bayesian belief updating - and then use relatively state-of-the-art source reconstruction to examine the neuronal correlates of the implicit cognitive processing.

      Response: We are deeply grateful for your careful review of our work and for the thoughtful feedback you have provided. Your dedication to ensuring the quality and clarity of the work is truly admirable. Your comments have been invaluable in guiding us towards improving the paper, and We appreciate your time and effort in not just offering suggestions but also providing specific revisions that I can implement. Your insights have helped us identify areas where I can strengthen the arguments and clarify the methodology.

      Comment 1:

      The main weaknesses of this report lies in the communication of the ideas and procedures. Although the language is generally excellent, there are some grammatical lapses that make the text difficult to read. More importantly, the authors are not consistent in their use of some terms; for example, uncertainty and information gain are sometimes conflated in a way that might confuse readers. Furthermore, the descriptions of the modelling and data analysis are incomplete. These shortcomings could be addressed in the following way.

      First, it would be useful to unpack the various interpretations of information and goal-seeking offered in the (active inference) framework examined in this study. For example, it will be good to include the following paragraph:

      "In contrast to behaviourist approaches to planning and decision-making, active inference formulates the requisite cognitive processing in terms of belief updating in which choices are made based upon their expected free energy. Expected free energy can be regarded as a universal objective function, specifying the relative likelihood of alternative choices. In brief, expected free energy can be regarded as the surprise expected following some action, where the expected surprise comes in two flavours. First, the expected surprise is uncertainty, which means that policies with a low expected free energy resolve uncertainty and promote information seeking. However, one can also minimise expected surprise by avoiding surprising, aversive outcomes. This leads to goal-seeking behaviour, where the goals can be regarded as prior preferences or rewarding outcomes.

      Technically, expected free energy can be expressed in terms of risk plus ambiguity - or rearranged to be expressed in terms of expected information gain plus expected value, where value corresponds to (log) prior preferences. We will refer to both decompositions in what follows; noting that both decompositions accommodate information and goal-seeking imperatives. That is, resolving ambiguity and maximising information gain have epistemic value, while minimising risk or maximising expected value have pragmatic or instrumental value. These two kinds of values are sometimes referred to in terms of intrinsic and extrinsic value, respectively [1-4]."

      Response 1: We deeply thank you for your comments and corresponding suggestions about our interpretations of active inference. In response to your identified weaknesses and suggestions, we have added corresponding paragraphs in the Methods section (The free energy principle and active inference, line 95-106):

      “Active inference formulates the necessary cognitive processing as a process of belief updating, where choices depend on agents' expected free energy. Expected free energy serves as a universal objective function, guiding both perception and action. In brief, expected free energy can be seen as the expected surprise following some policies. The expected surprise can be reduced by resolving uncertainty, and one can select policies with lower expected free energy which can encourage information-seeking and resolve uncertainty. Additionally, one can minimize expected surprise by avoiding surprising or aversive outcomes (oudeyer et al., 2007; Schmidhuber et al., 2010). This leads to goal-seeking behavior, where goals can be viewed as prior preferences or rewarding outcomes.

      Technically, expected free energy can also be expressed as expected information gain plus expected value, where the value corresponds to (log) prior preferences. We will refer to both formulations in what follows. Resolving ambiguity, minimizing risk, and maximizing information gain has epistemic value while maximizing expected value have pragmatic or instrumental value. These two types of values can be referred to in terms of intrinsic and extrinsic value, respectively (Barto et al., 2013; Schwartenbeck et al., 2019).”

      Oudeyer, P. Y., & Kaplan, F. (2007). What is intrinsic motivation? A typology of computational approaches. Frontiers in neurorobotics, 1, 108.

      Schmidhuber, J. (2010). Formal theory of creativity, fun, and intrinsic motivation (1990–2010). IEEE transactions on autonomous mental development, 2(3), 230-247.

      Barto, A., Mirolli, M., & Baldassarre, G. (2013). Novelty or surprise?. Frontiers in psychology, 4, 61898.

      Schwartenbeck, P., Passecker, J., Hauser, T. U., FitzGerald, T. H., Kronbichler, M., & Friston, K. J. (2019). Computational mechanisms of curiosity and goal-directed exploration. elife, 8, e41703.

      Comment 2:

      The description of the modelling of choice behaviour needs to be unpacked and motivated more carefully. Perhaps along the following lines:

      "To assess the evidence for active inference over reinforcement learning, we fit active inference and reinforcement learning models to the choice behaviour of each subject. Effectively, this involved optimising the free parameters of active inference and reinforcement learning models to maximise the likelihood of empirical choices. The resulting (marginal) likelihood was then used as the evidence for each model. The free parameters for the active inference model scaled the contribution of the three terms that constitute the expected free energy (in Equation 6). These coefficients can be regarded as precisions that characterise each subjects' prior beliefs about contingencies and rewards. For example, increasing the precision or the epistemic value associated with model parameters means the subject would update her beliefs about reward contingencies more quickly than a subject who has precise prior beliefs about reward distributions. Similarly, subjects with a high precision over prior preferences or extrinsic value can be read as having more precise beliefs that she will be rewarded. The free parameters for the reinforcement learning model included..."

      Response 2: We deeply thank you for your comments and corresponding suggestions about our description of the behavioral modelling. In response to your identified weaknesses and suggestions, we have added corresponding content in the Results section (Behavioral results, line 279-293):

      “To assess the evidence for active inference over reinforcement learning, we fit active inference (Eq.9), model-free reinforcement learning, and model-based reinforcement learning models to the behavioral data of each participant. This involved optimizing the free parameters of active inference and reinforcement learning models. The resulting likelihood was used to calculate the Bayesian Information Criterion (BIC) (Vrieze 2012) as the evidence for each model. The free parameters for the active inference model (AL, AI, EX, prior, and α) scaled the contribution of the three terms that constitute the expected free energy in Eq.9. These coefficients can be regarded as precisions that characterize each participant's prior beliefs about contingencies and rewards. For example, increasing α means participants would update their beliefs about reward contingencies more quickly, increasing AL means participants would like to reduce ambiguity more, and increasing AI means participants would like to learn the hidden state of the environment and avoid risk more. The free parameters for the model-free reinforcement learning model are the learning rate α and the temperature parameter γ and the free parameters for the model-based are the learning rate α, the temperature parameter γ and prior (the details for the model-free reinforcement learning model can be seen in Eq.S1-11 and the details for the model-based reinforcement learning model can be seen Eq.S12-23 in the Supplementary Method). The parameter fitting for these three models was conducted using the `BayesianOptimization' package in Python (Frazire 2018), first randomly sampling 1000 times and then iterating for an additional 1000 times.”

      Vrieze, S. I. (2012). Model selection and psychological theory: a discussion of the differences between the Akaike information criterion (AIC) and the Bayesian information criterion (BIC). Psychological methods, 17(2), 228.

      Frazier, P. I. (2018). A tutorial on Bayesian optimization. arXiv preprint arXiv:1807.02811.

      Comment 3:

      In terms of the time-dependent correlations with expected free energy - and its constituent terms - I think the report would benefit from overviewing these analyses with something like the following:

      "In the final analysis of the neuronal correlates of belief updating - as quantified by the epistemic and intrinsic values of expected free energy - we present a series of analyses in source space. These analyses tested for correlations between constituent terms in expected free energy and neuronal responses in source space. These correlations were over trials (and subjects). Because we were dealing with two-second timeseries, we were able to identify the periods of time during decision-making when the correlates were expressed.

      In these analyses, we focused on the induced power of neuronal activity at each point in time, at each brain source. To illustrate the functional specialisation of these neuronal correlates, we present whole-brain maps of correlation coefficients and pick out the most significant correlation for reporting fluctuations in selected correlations over two-second periods. These analyses are presented in a descriptive fashion to highlight the nature and variety of the neuronal correlates, which we unpack in relation to the existing EEG literature in the discussion. Note that we did not attempt to correct for multiple comparisons; largely, because the correlations observed were sustained over considerable time periods, which would be almost impossible under the null hypothesis of no correlations."

      Response 3: We deeply thank you for your comments and corresponding suggestions about our description of the regression analysis in the source space. In response to your suggestions, we have added corresponding content in the Results section (EEG results at source level, line 331-347):

      “In the final analysis of the neural correlates of the decision-making process, as quantified by the epistemic and intrinsic values of expected free energy, we presented a series of linear regressions in source space. These analyses tested for correlations over trials between constituent terms in expected free energy (the value of avoiding risk, the value of reducing ambiguity, extrinsic value, and expected free energy itself) and neural responses in source space. Additionally, we also investigated the neural correlate of (the degree of) risk, (the degree of) ambiguity, and prediction error. Because we were dealing with a two-second time series, we were able to identify the periods of time during decision-making when the correlates were expressed. The linear regression was run by the "mne.stats.linear regression" function in the MNE package (Activity ~ Regressor + Intercept). Activity is the activity amplitude of the EEG signal in the source space and regressor is one of the regressors that we mentioned (e.g., expected free energy, the value of reducing ambiguity, etc.).

      In these analyses, we focused on the induced power of neural activity at each time point, in the brain source space. To illustrate the functional specialization of these neural correlates, we presented whole-brain maps of correlation coefficients and picked out the brain region with the most significant correlation for reporting fluctuations in selected correlations over two-second periods. These analyses were presented in a descriptive fashion to highlight the nature and variety of the neural correlates, which we unpacked in relation to the existing EEG literature in the discussion. Note that we did not attempt to correct for multiple comparisons; largely, because the correlations observed were sustained over considerable time periods, which would be almost impossible under the null hypothesis of no correlations.”

      Comment 4:

      There was a slight misdirection in the discussion of priors in the active inference framework. The notion that active inference requires a pre-specification of priors is a common misconception. Furthermore, it misses the point that the utility of Bayesian modelling is to identify the priors that each subject brings to the table. This could be easily addressed with something like the following in the discussion:

      "It is a common misconception that Bayesian approaches to choice behaviour (including active inference) are limited by a particular choice of priors. As illustrated in our fitting of choice behaviour above, priors are a strength of Bayesian approaches in the following sense: under the complete class theorem [5, 6], any pair of choice behaviours and reward functions can be described in terms of ideal Bayesian decision-making with particular priors. In other words, there always exists a description of choice behaviour in terms of some priors. This means that one can, in principle, characterise any given behaviour in terms of the priors that explain that behaviour. In our example, these were effectively priors over the precision of various preferences or beliefs about contingencies that underwrite expected free energy."

      Response 4: We deeply thank you for your comments and corresponding suggestions about the prior of Bayesian methods. In response to your suggestions, we have added corresponding content in the Discussion section (The strength of the active inference framework in decision-making, line 447-453):

      “However, it may be the opposite. As illustrated in our fitting results, priors can be a strength of Bayesian approaches. Under the complete class theorem (Wald 1947; Brown 1981), any pair of behavioral data and reward functions can be described in terms of ideal Bayesian decision-making with particular priors. In other words, there always exists a description of behavioral data in terms of some priors. This means that one can, in principle, characterize any given behavioral data in terms of the priors that explain that behavior. In our example, these were effectively priors over the precision of various preferences or beliefs about contingencies that underwrite expected free energy.”

      Wald, A. (1947). An essentially complete class of admissible decision functions. The Annals of Mathematical Statistics, 549-555.

      Brown, L. D. (1981). A complete class theorem for statistical problems with finite sample spaces. The Annals of Statistics, 1289-1300.

      Reviewer #2 (Public Review):

      Summary:

      Zhang and colleagues use a combination of behavioral, neural, and computational analyses to test an active inference model of exploration in a novel reinforcement learning task.

      Strengths:

      The paper addresses an important question (validation of active inference models of exploration). The combination of behavior, neuroimaging, and modeling is potentially powerful for answering this question.

      Response: We want to express our sincere gratitude for your thorough review of our work and for the valuable comments you have provided. Your attention to detail and dedication to improving the quality of the work are truly commendable. Your feedback has been invaluable in guiding us towards revisions that will strengthen the work. We have made targeted modifications based on most of the comments. However, due to factors such as time and energy constraints, we have not added corresponding analyses for several comments.

      Comment 1:

      The paper does not discuss relevant work on contextual bandits by Schulz, Collins, and others. It also does not mention the neuroimaging study of Tomov et al. (2020) using a risky/safe bandit task.

      Response 1:

      We deeply thank you for your suggestions about the relevant work. We now discussion and cite these representative papers in the Introduction section (line 42-55):

      “The decision-making process frequently involves grappling with varying forms of uncertainty, such as ambiguity - the kind of uncertainty that can be reduced through sampling, and risk - the inherent uncertainty (variance) presented by a stable environment. Studies have investigated these different forms of uncertainty in decision-making, focusing on their neural correlates (Daw et al., 2006; Badre et al., 2012; Cavanagh et al., 2012).

      These studies utilized different forms of multi-armed bandit tasks, e.g the restless multi-armed bandit tasks (Daw et al., 2006; Guha et al., 2010), risky/safe bandit tasks (Tomov et al., 2020; Fan et al., 2022; Payzan et al., 2013), contextual multi-armed bandit tasks (Schulz et al., 2015; Schulz et al., 2015; Molinaro et al., 2023). However, these tasks either separate risk from ambiguity in uncertainty, or separate action from state (perception). In our work, we develop a contextual multi-armed bandit task to enable participants to actively reduce ambiguity, avoid risk, and maximize rewards using various policies (see Section 2.2) and Figure 4(a)). Our task makes it possible to study whether the brain represents these different types of uncertainty distinctly (Levy et al., 2010) and whether the brain represents both the value of reducing uncertainty and the degree of uncertainty. The active inference framework presents a theoretical approach to investigate these questions. Within this framework, uncertainties can be reduced to ambiguity and risk. Ambiguity is represented by the uncertainty about model parameters associated with choosing a particular action, while risk is signified by the variance of the environment's hidden states. The value of reducing ambiguity, the value of avoiding risk, and extrinsic value together constitute expected free energy (see Section 2.1).”

      Daw, N. D., O'doherty, J. P., Dayan, P., Seymour, B., & Dolan, R. J. (2006). Cortical substrates for exploratory decisions in humans. Nature, 441(7095), 876-879.

      Badre, D., Doll, B. B., Long, N. M., & Frank, M. J. (2012). Rostrolateral prefrontal cortex and individual differences in uncertainty-driven exploration. Neuron, 73(3), 595-607.

      Cavanagh, J. F., Figueroa, C. M., Cohen, M. X., & Frank, M. J. (2012). Frontal theta reflects uncertainty and unexpectedness during exploration and exploitation. Cerebral cortex, 22(11), 2575-2586.

      Guha, S., Munagala, K., & Shi, P. (2010). Approximation algorithms for restless bandit problems. Journal of the ACM (JACM), 58(1), 1-50.

      Tomov, M. S., Truong, V. Q., Hundia, R. A., & Gershman, S. J. (2020). Dissociable neural correlates of uncertainty underlie different exploration strategies. Nature communications, 11(1), 2371.

      Fan, H., Gershman, S. J., & Phelps, E. A. (2023). Trait somatic anxiety is associated with reduced directed exploration and underestimation of uncertainty. Nature Human Behaviour, 7(1), 102-113.

      Payzan-LeNestour, E., Dunne, S., Bossaerts, P., & O’Doherty, J. P. (2013). The neural representation of unexpected uncertainty during value-based decision making. Neuron, 79(1), 191-201.

      Schulz, E., Konstantinidis, E., & Speekenbrink, M. (2015, April). Exploration-exploitation in a contextual multi-armed bandit task. In International conference on cognitive modeling (pp. 118-123).

      Schulz, E., Konstantinidis, E., & Speekenbrink, M. (2015, November). Learning and decisions in contextual multi-armed bandit tasks. In CogSci.

      Molinaro, G., & Collins, A. G. (2023). Intrinsic rewards explain context-sensitive valuation in reinforcement learning. PLoS Biology, 21(7), e3002201.

      Levy, I., Snell, J., Nelson, A. J., Rustichini, A., & Glimcher, P. W. (2010). Neural representation of subjective value under risk and ambiguity. Journal of neurophysiology, 103(2), 1036-1047.

      Comment 2:

      The statistical reporting is inadequate. In most cases, only p-values are reported, not the relevant statistics, degrees of freedom, etc. It was also not clear if any corrections for multiple comparisons were applied. Many of the EEG results are described as "strong" or "robust" with significance levels of p<0.05; I am skeptical in the absence of more details, particularly given the fact that the corresponding plots do not seem particularly strong to me.

      Response 2: We deeply thank you for your comments about our statistical reporting. We have optimized the fitting model and rerun all the statistical analyses. As can be seen (Figure 6, 7, 8, S3, S4, S5), the new regression results are significantly improved compared to the previous ones. Due to the limitation of space, we place the other relevant statistical results, including t-values, std err, etc., on our GitHub (https://github.com/andlab-um/FreeEnergyEEG). Currently, we have not conducted multiple comparison corrections based on Reviewer 1’s comments (Comments 3) “Note that we did not attempt to correct for multiple comparisons; largely, because the correlations observed were sustained over considerable time periods, which would be almost impossible under the null hypothesis of no correlations”.

      Author response image 1.

      Comment 3:

      The authors compare their active inference model to a "model-free RL" model. This model is not described anywhere, as far as I can tell. Thus, I have no idea how it was fit, how many parameters it has, etc. The active inference model fitting is also not described anywhere. Moreover, you cannot compare models based on log-likelihood, unless you are talking about held-out data. You need to penalize for model complexity. Finally, even if active inference outperforms a model-free RL model (doubtful given the error bars in Fig. 4c), I don't see how this is strong evidence for active inference per se. I would want to see a much more extensive model comparison, including model-based RL algorithms which are not based on active inference, as well as model recovery analyses confirming that the models can actually be distinguished on the basis of the experimental data.

      Response 3: We deeply thank you for your comments about the model comparison details. We previously omitted some information about the comparison model, as classical reinforcement learning is not the focus of our work, so we put the specific details in the supplementary materials. Now we have placed relevant information in the main text (see the part we have highlighted in yellow). We have now added the relevant information regarding the model comparison in the Results section (Behavioral results, line 279-293):

      “To assess the evidence for active inference over reinforcement learning, we fit active inference (Eq.9), model-free reinforcement learning, and model-based reinforcement learning models to the behavioral data of each participant. This involved optimizing the free parameters of active inference and reinforcement learning models. The resulting likelihood was used to calculate the Bayesian Information Criterion (BIC) as the evidence for each model. The free parameters for the active inference model (AL, AI, EX, prior, and α) scaled the contribution of the three terms that constitute the expected free energy in Eq.9. These coefficients can be regarded as precisions that characterize each participant's prior beliefs about contingencies and rewards. For example, increasing α means participants would update their beliefs about reward contingencies more quickly, increasing AL means participants would like to reduce ambiguity more, and increasing AI means participants would like to learn the hidden state of the environment and avoid risk more. The free parameters for the model-free reinforcement learning model are the learning rate α and the temperature parameter γ and the free parameters for the model-based are the learning rate α, the temperature parameter γ and prior (the details for the model-free reinforcement learning model can be found in Eq.S1-11 and the details for the model-based reinforcement learning model can be found in Eq.S12-23 in the Supplementary Method). The parameter fitting for these three models was conducted using the `BayesianOptimization' package in Python, first randomly sampling 1000 times and then iterating for an additional 1000 times.”

      We have now incorporated model-based reinforcement learning into our comparison models and placed the descriptions of both model-free and model-based reinforcement learning algorithms in the supplementary materials. We have also changed the criterion for model comparison to Bayesian Information Criterion. As indicated by the results, the performance of the active inference model significantly outperforms both comparison models.

      Sorry, we didn't do model recovery before, but now we have placed the relevant results in the supplementary materials. From the result figures, we can see that each model fits its own generated simulated data well:

      “To demonstrate how reliable our models are (the active inference model, model-free reinforcement learning model, and model-based reinforcement learning model), we run some simulation experiments for model recovery. We use these three models, with their own fitting parameters, to generate some simulated data. Then we will fit all three sets of data using these three models.

      The model recovery results are shown in Fig.S6. This is the confusion matrix of models: the percentage of all subjects simulated based on a certain model that is fitted best by a certain model. The goodness-of-fit was compared using the Bayesian Information Criterion. We can see that the result of model recovery is very good, and the simulated data generated by a model can be best explained by this model.”

      Author response image 2.

      Comment 4:

      Another aspect of the behavioral modeling that's missing is a direct descriptive comparison between model and human behavior, beyond just plotting log-likelihoods (which are a very impoverished measure of what's going on).

      Response 4: We deeply thank you for your comments about the comparison between the model and human behavior. Due to the slight differences between our simulation experiments and real behavioral experiments (the "you can ask" stage), we cannot directly compare the model and participants' behaviors. However, we can observe that in the main text's simulation experiment (Figure 3), the active inference agent's behavior is highly consistent with humans (Figure 4), exhibiting an effective exploration strategy and a desire to reduce uncertainty. Moreover, we have included two additional simulation experiments in the supplementary materials, which demonstrate that active inference may potentially fit a wide range of participants' behavioral strategies.

      Author response image 3.

      (An active inference agent with AL=AI=EX=0. It can accomplish tasks efficiently like a human being, reducing the uncertainty of the environment and maximizing the reward.)

      Author response image 4.

      (An active inference agent with AL=AI=0, EX=10. It will only pursue immediate rewards (not choosing the "Cue" option due to additional costs), but it can also gradually optimize its strategy due to random effects.)

      Author response image 5.

      (An active inference agent with EX=0, AI=AL=10. It will only pursue environmental information to reduce the uncertainty of the environment. Even in "Context 2" where immediate rewards are scarce, it will continue to explore.)

      Figure (a) shows the decision-making of active inference agents in the Stay-Cue choice. Blue corresponds to agents choosing the "Cue" option and acquiring "Context 1"; orange corresponds to agents choosing the "Cue" option and acquiring "Context 2"; purple corresponds to agents choosing the "Stay" option and not knowing the information about the hidden state of the environment. The shaded areas below correspond to the probability of the agents making the respective choices.

      Figure (b) shows the decision-making of active inference agents in the Stay-Cue choice. The shaded areas below correspond to the probability of the agents making the respective choices.

      Figure (c) shows the rewards obtained by active inference agents.

      Figure (d) shows the reward prediction errors of active inference agents.

      Figure (e) shows the reward predictions of active inference agents for the "Risky" path in "Context 1" and "Context 2".

      Comment 5:

      The EEG results are intriguing, but it wasn't clear that these provide strong evidence specifically for the active inference model. No alternative models of the EEG data are evaluated.

      Overall, the central claim in the Discussion ("we demonstrated that the active inference model framework effectively describes real-world decision-making") remains unvalidated in my opinion.

      Response 5: We deeply thank you for your comments. We applied the active inference model to analyze EEG results because it best fit the participants' behavioral data among our models, including the new added results. Further, our EEG results serve only to verify that the active inference model can be used to analyze the neural mechanisms of decision-making in uncertain environments (if possible, we could certainly design a more excellent reinforcement learning model with a similar exploration strategy). We aim to emphasize the consistency between active inference and human decision-making in uncertain environments, as we have discussed in the article. Active inference emphasizes both perception and action, which is also what we wish to highlight: during the decision-making process, participants not only passively receive information, but also actively adopt different strategies to reduce uncertainty and maximize rewards.

      Reviewer #3 (Public Review):

      Summary:

      This paper aims to investigate how the human brain represents different forms of value and uncertainty that participate in active inference within a free-energy framework, in a two-stage decision task involving contextual information sampling, and choices between safe and risky rewards, which promotes a shift from exploration to exploitation. They examine neural correlates by recording EEG and comparing activity in the first vs second half of trials and between trials in which subjects did and did not sample contextual information, and perform a regression with free-energy-related regressors against data "mapped to source space." Their results show effects in various regions, which they take to indicate that the brain does perform this task through the theorised active inference scheme.

      Strengths:

      This is an interesting two-stage paradigm that incorporates several interesting processes of learning, exploration/exploitation, and information sampling. Although scalp/brain regions showing sensitivity to the active-inference-related quantities do not necessarily suggest what role they play, it can be illuminating and useful to search for such effects as candidates for further investigation. The aims are ambitious, and methodologically it is impressive to include extensive free-energy theory, behavioural modelling, and EEG source-level analysis in one paper.

      Response: We would like to express our heartfelt thanks to you for carefully reviewing our work and offering insightful feedback. Your attention to detail and commitment to enhancing the overall quality of our work are deeply admirable. Your input has been extremely helpful in guiding us through the necessary revisions to enhance the work. We have implemented focused changes based on a majority of your comments. Nevertheless, owing to limitations such as time and resources, we have not included corresponding analyses for a few comments.

      Comment 1:

      Though I could surmise the above general aims, I could not follow the important details of what quantities were being distinguished and sought in the EEG and why. Some of this is down to theoretical complexity - the dizzying array of constructs and terms with complex interrelationships, which may simply be part and parcel of free-energy-based theories of active inference - but much of it is down to missing or ambiguous details.

      Response 1: We deeply thank you for your comments about our work’s readability. We have significantly revised the descriptions of active inference, models, research questions, etc. Focusing on active inference and the free energy principle, we have added relevant basic descriptions and unified the terminology. We have added information related to model comparison in the main text and supplementary materials. We presented our regression results in clearer language. Our research focused on the brain's representation of decision-making in uncertain environments, including expected free energy, the value of reducing ambiguity, the value of avoiding risk, extrinsic value, ambiguity, and risk.

      Comment 2:

      In general, an insufficient effort has been made to make the paper accessible to readers not steeped in the free energy principle and active inference. There are critical inconsistencies in key terminology; for example, the introduction states that aim 1 is to distinguish the EEG correlates of three different types of uncertainty: ambiguity, risk, and unexpected uncertainty. But the abstract instead highlights distinctions in EEG correlates between "uncertainty... and... risk" and between "expected free energy .. and ... uncertainty." There are also inconsistencies in mathematical labelling (e.g. in one place 'p(s|o)' and 'q(s)' swap their meanings from one sentence to the very next).

      Response 2: We deeply thank you for your comments about the problem of inconsistent terminology. First, we have unified the symbols and letters (P, Q, s, o, etc.) that appeared in the article and described their respective meanings more clearly. We have also revised the relevant expressions of "uncertainty" throughout the text. In our work, uncertainty refers to ambiguity and risk. Ambiguity can be reduced through continuous sampling and is referred to as uncertainty about model parameters in our work. Risk, on the other hand, is the inherent variance of the environment and cannot be reduced through sampling, which is referred to as uncertainty about hidden states in our work. In the analysis of the results, we focused on how the brain encodes the value of reducing ambiguity (Figure 8), the value of avoiding risk (Figure 6), and (the degree of) ambiguity (Figure S5) during action selection. We also analyzed how the brain encodes reducing ambiguity and avoiding risk during belief update (Figure 7).

      Comment 3:

      Some basic but important task information is missing, and makes a huge difference to how decision quantities can be decoded from EEG. For example:

      - How do the subjects press the left/right buttons - with different hands or different fingers on the same hand?

      Response 3: We deeply thank you for your comments about the missing task information. We have added the relevant content in the Methods section (Contextual two-armed bandit task and Data collection, line 251-253):

      “Each stage was separated by a jitter ranging from 0.6 to 1.0 seconds. The entire experiment consists of a single block with a total of 120 trials. The participants are required to use any two fingers of one hand to press the buttons (left arrow and right arrow on the keyboard).”

      Comment 4:

      - Was the presentation of the Stay/cue and safe/risky options on the left/right sides counterbalanced? If not, decisions can be formed well in advance especially once a policy is in place.

      Response 4: The presentation of the Stay/cue and safe/risky options on the left/right sides was not counterbalanced. It is true that participants may have made decisions ahead of time. However, to better study the state of participants during decision-making, our choice stages consist of two parts. In the first two seconds, we ask participants to consider which option they would choose, and after these two seconds, participants are allowed to make their choice (by pressing the button).

      We also updated the figure of the experiment procedure as below (We circled the time that the participants spent on making decisions).

      Author response image 6.

      Comment 5:

      - What were the actual reward distributions ("magnitude X with probability p, magnitude y with probability 1-p") in the risky option?

      Response 5: We deeply thank you for your comments about the missing task information. We have placed the relevant content in the Methods section (Contextual two-armed bandit task and Data collection, line 188-191):

      “The actual reward distribution of the risky path in "Context 1" was [+12 (55%), +9 (25%), +6 (10%), +3 (5%), +0 (5%)] and the actual reward distribution of the risky path in "Context 2" was [+12 (5%), +9 (5%), +6 (10%), +3 (25%), +0 (55%)].”

      Comment 6:

      The EEG analysis is not sufficiently detailed and motivated.

      For example,

      - why the high lower-filter cutoff of 1 Hz, and shouldn't it be acknowledged that this removes from the EEG any sustained, iteratively updated representation that evolves with learning across trials?

      Response 6: We deeply thank you for your comments about our EEG analysis. The 1Hz high-pass filter may indeed filter out some useful information. We chose a 1Hz high-pass filter to filter out most of the noise and prevent the noise from affecting our results analysis. Additionally, there are also many decision-related works that have applied 1Hz high-pass filtering in EEG data preprocessing (Yau et al., 2021; Cortes et al., 2021; Wischnewski et al., 2022; Schutte et al., 2017; Mennella et al., 2020; Giustiniani et al., 2020).

      Yau, Y., Hinault, T., Taylor, M., Cisek, P., Fellows, L. K., & Dagher, A. (2021). Evidence and urgency related EEG signals during dynamic decision-making in humans. Journal of Neuroscience, 41(26), 5711-5722.

      Cortes, P. M., García-Hernández, J. P., Iribe-Burgos, F. A., Hernández-González, M., Sotelo-Tapia, C., & Guevara, M. A. (2021). Temporal division of the decision-making process: An EEG study. Brain Research, 1769, 147592.

      Wischnewski, M., & Compen, B. (2022). Effects of theta transcranial alternating current stimulation (tACS) on exploration and exploitation during uncertain decision-making. Behavioural Brain Research, 426, 113840.

      Schutte, I., Kenemans, J. L., & Schutter, D. J. (2017). Resting-state theta/beta EEG ratio is associated with reward-and punishment-related reversal learning. Cognitive, Affective, & Behavioral Neuroscience, 17, 754-763.

      Mennella, R., Vilarem, E., & Grèzes, J. (2020). Rapid approach-avoidance responses to emotional displays reflect value-based decisions: Neural evidence from an EEG study. NeuroImage, 222, 117253.

      Giustiniani, J., Nicolier, M., Teti Mayer, J., Chabin, T., Masse, C., Galmès, N., ... & Gabriel, D. (2020). Behavioral and neural arguments of motivational influence on decision making during uncertainty. Frontiers in Neuroscience, 14, 583.

      Comment 7:

      - Since the EEG analysis was done using an array of free-energy-related variables in a regression, was multicollinearity checked between these variables?

      Response 7: We deeply thank you for your comments about our regression. Indeed, we didn't specify our regression formula in the main text. We conducted regression on one variable each time, so there was no need for a multicollinearity check. We have now added the relevant content in the Results section (“EEG results at source level” section, line 337-340):

      “The linear regression was run by the "mne.stats.linear regression" function in the MNE package (Activity ~ Regressor + Intercept). Activity is the activity amplitude of the EEG signal in the source space and regressor is one of the regressors that we mentioned (e.g., expected free energy, the value of reducing ambiguity, etc.).”

      Comment 8:

      - In the initial comparison of the first/second half, why just 5 clusters of electrodes, and why these particular clusters?

      Response 8: We deeply thank you for your comments about our sensor-level analysis. These five clusters are relatively common scalp EEG regions to analyze (left frontal, right frontal, central, left parietal, and right parietal), and we referred previous work analyzed these five clusters of electrodes (Laufs et al., 2006; Ray et al., 1985; Cole et al., 1985). In addition, our work pays more attention to the analysis in source space, exploring the corresponding functions of specific brain regions based on active inference models.

      Laufs, H., Holt, J. L., Elfont, R., Krams, M., Paul, J. S., Krakow, K., & Kleinschmidt, A. (2006). Where the BOLD signal goes when alpha EEG leaves. Neuroimage, 31(4), 1408-1418.

      Ray, W. J., & Cole, H. W. (1985). EEG activity during cognitive processing: influence of attentional factors. International Journal of Psychophysiology, 3(1), 43-48.

      Cole, H. W., & Ray, W. J. (1985). EEG correlates of emotional tasks related to attentional demands. International Journal of Psychophysiology, 3(1), 33-41.

      Comment 9:

      How many different variables are systematically different in the first vs second half, and how do you rule out less interesting time-on-task effects such as engagement or alertness? In what time windows are these amplitudes being measured?

      Response 9 (and the Response for Weaknesses 11): There were no systematic differences between the first half and the second half of the trials, with the only difference being the participants' experience. In the second half, participants had a better understanding of the reward distribution of the task (less ambiguity). The simulation results can well describe these.

      Author response image 7.

      As shown in Figure (a), agents can only learn about the hidden state of the environment ("Context 1" (green) or "Context 2" (orange)) by choosing the "Cue" option. If agents choose the "Stay" option, they will not be able to know the hidden state of the environment (purple). The risk of agents is only related to wh

      ether they choose the "Cue" option, not the number of rounds. Figure (b) shows the Safe-Risky choices of agents, and Figure (e) is the reward prediction of agents for the "Risky" path in "Context 1" and "Context 2". We can see that agents update the expected reward and reduce ambiguity by sampling the "Risky" path. The ambiguity of agents is not related to the "Cue" option, but to the number of times they sample the "Risky" path (rounds).

      In our choosing stages, participants were required to think about their choices for the first two seconds (during which they could not press buttons). Then, they were asked to make their choices (press buttons) within the next two seconds. This setup effectively kept participants' attention focused on the task. And the two second during the “Second choice” stage when participants decide which option to choose (they cannot press buttons) are measured for the analysis of the sensor-level results.

      Comment 10:

      In the comparison of asked and not-asked trials, what trial stage and time window is being measured?

      Response 10: We have added relevant descriptions in the main text. The two second during the “Second choice” stage when participants decide which option to choose (they cannot press buttons) are measured for the analysis of the sensor-level results.

      Author response image 8.

      Comment 11:

      Again, how many different variables, of the many estimated per trial in the active inference model, are different in the asked and not-asked trials, and how can you know which of these differences is the one reflected in the EEG effects?

      Response 11: The difference between asked trials and not-asked trials lies only in whether participants know the specific context of the risky path (the level of risk for the participants). A simple comparison indeed cannot tell us which of these differences is reflected in the EEG effects. Therefore, we subsequently conducted model-based regression analysis in the source space.

      Comment 12:

      The authors choose to interpret that on not-asked trials the subjects are more uncertain because the cue doesn't give them the context, but you could equally argue that they don't ask because they are more certain of the possible hidden states.

      Response 12: Our task design involves randomly varying the context of the risky path. Only by choosing to inquire can participants learn about the context. Participants can only become increasingly certain about the reward distribution of different contexts of the risky path, but cannot determine which specific context it is. Here are the instructions for the task that we will tell the participants (line 226-231).

      "You are on a quest for apples in a forest, beginning with 5 apples. You encounter two paths: 1) The left path offers a fixed yield of 6 apples per excursion. 2) The right path offers a probabilistic reward of 0/3/6/9/12 apples, and it has two distinct contexts, labeled "Context 1" and "Context 2," each with a different reward distribution. Note that the context associated with the right path will randomly change in each trial. Before selecting a path, a ranger will provide information about the context of the right path ("Context 1" or "Context 2") in exchange for an apple. The more apples you collect, the greater your monetary reward will be."

      Comment 13:

      - The EEG regressors are not fully explained. For example, an "active learning" regressor is listed as one of the 4 at the beginning of section 3.3, but it is the first mention of this term in the paper and the term does not arise once in the methods.

      Response 13: We have accordingly revised the relevant content in the main text (as in Eq.8). Our regressors now include expected free energy, the value of reducing ambiguity, the value of avoiding risk, extrinsic value, prediction error, (the degree of) ambiguity, reducing ambiguity, and avoiding risk.

      Comment 14:

      - In general, it is not clear how one can know that the EEG results reflect that the brain is purposefully encoding these very parameters while implementing this very mechanism, and not other, possibly simpler, factors that correlate with them since there is no engagement with such potential confounds or alternative models. For example, a model-free reinforcement learning model is fit to behaviour for comparison. Why not the EEG?

      Response 14: We deeply thank you for your comments. Due to factors such as time and effort, and because the active inference model best fits the behavioral data of the participants, we did not use other models to analyze the EEG data. At both the sensor and source level, we observed the EEG signal and brain regions that can encode different levels of uncertainties (risk and ambiguity). The brain's uncertainty driven exploration mechanism cannot be explained solely by a simple model-free reinforcement learning approach.

      Recommendations for the authors:

      Response: We have made point-to-point revisions according to the reviewer's recommendations, and as these revisions are relatively minor, we have only responded to the longer recommendations here.

      Reviewer #1 (Recommendations For The Authors)

      I enjoyed reading this sophisticated study of decision-making. I thought your implementation of active inference and the subsequent fitting to choice behaviour - and study of the neuronal (EEG) correlates - was impressive. As noted in my comments on strengths and weaknesses, some parts of your manuscript with difficult to read because of slight collapses in grammar and an inconsistent use of terms when referring to the mathematical quantities. In addition to the paragraphs I have suggested, I would recommend the following minor revisions to your text. In addition, you will have to fill in some of the details that were missing from the current version of the manuscript. For example:

      Recommendation 1:

      Which RL model did you use to fit the behavioural data? What were its free parameters?

      Response 1: We have now added information related to the comparison models in the behavioral results and supplementary materials. We applied both simple model-free reinforcement learning and model-based reinforcement learning. The free parameters for the model-free reinforcement learning model are the learning rate α and the temperature parameter γ, while the free parameters for the model-based approach are the learning rate α, the temperature parameter γ, and the prior.

      Recommendation 2:

      When you talk about neuronal activity in the final analyses (of time-dependent correlations) what was used to measure the neuronal activity? Was this global power over frequencies? Was it at a particular frequency band? Was it the maximum amplitude within some small window et cetera? In other words, you need to provide the details of your analysis that would enable somebody to reproduce your study at a certain level of detail.

      Response 2: In the final analyses, we used the activity amplitude at each point in the source space for our analysis. Previously, we had planned to make our data and models available on GitHub to facilitate easier replication of our work.

      Reviewer #3 (Recommendations For The Authors)

      Recommendation 1:

      It might help to explain the complex concepts up front, to use the concrete example of the task itself - presumably, it was designed so that the crucial elements of the active inference framework come to the fore. One could use hypothetical choice patterns in this task to exemplify different factors such as expected free energy and unexpected uncertainty at work. It would also be illuminating to explain why behaviour on this task is fit better by the active inference model than a model-free reinforcement learning model.

      Response 1: Thank you for your suggestions. We have given clearer explanations to the three terms in the active inference formula: the value of reducing ambiguity, the value of avoiding risk, and the extrinsic value (Eq.8), which makes it easier for readers to understand active inference.

      In addition, we can simply view active inference as a computational model similar to model-based reinforcement learning, where the expected free energy represents a subjective value, without needing to understand its underlying computational principles or neurobiological background. In our discussion, we have argued why the active inference model fits the participants' behavior better than our reinforcement learning model, as the active inference model has an inherent exploration mechanism that is consistent with humans, who instinctively want to reduce environmental uncertainty (line 435-442).

      “Active inference offers a superior exploration mechanism compared with basic model-free reinforcement learning  (Figure 4 (c)). Since traditional reinforcement learning models determine their policies solely on the state, this setting leads to difficulty in extracting temporal information (Laskin et al., 2020) and increases the likelihood of entrapment within local minima. In contrast, the policies in active inference are determined by both time and state. This dependence on time (Wang et al., 2016) enables policies to adapt efficiently, such as emphasizing exploration in the initial stages and exploitation later on. Moreover, this mechanism prompts more exploratory behavior in instances of state ambiguity. A further advantage of active inference lies in its adaptability to different task environments (Friston et al., 2017). It can configure different generative models to address distinct tasks, and compute varied forms of free energy and expected free energy.”

      Laskin, M., Lee, K., Stooke, A., Pinto, L., Abbeel, P., & Srinivas, A. (2020). Reinforcement learning with augmented data. Advances in neural information processing systems, 33, 19884-19895.

      Wang, J. X., Kurth-Nelson, Z., Tirumala, D., Soyer, H., Leibo, J. Z., Munos, R., ... & Botvinick, M. (2016). Learning to reinforcement learn. arXiv preprint arXiv:1611.05763.

      Friston, K., FitzGerald, T., Rigoli, F., Schwartenbeck, P., & Pezzulo, G. (2017). Active inference: a process theory. Neural computation, 29(1), 1-49.

      Recommendation 2:

      Figure 1A provides a key example of the lack of effort to help the reader understand. It suggests the possibility of a concrete example but falls short of providing one. From the caption and text, applied to the figure, I gather that by choosing either to run or to raise one's arms, one can control whether it is daytime or nighttime. This is clearly wrong but it is what I am led to think by the paper.

      Response 2: Thank you for your suggestion, which we had not considered before. In this figure, we aim to illustrate that "the agent receives observations and optimizes his cognitive model by minimizing variational free energy → the agent makes the optimal action by minimizing expected free energy → the action changes the environment → the environment generates new observations for the agent." We have now modified the image to be simpler to prevent any possible confusion for readers. Correspondingly, we removed the figure of a person raising their hand and the shadowed house in Figure a.

      Author response image 9.

      Recommendation 3:

      I recommend an overhaul in the labelling and methodological explanations for consistency and full reporting. For example, line 73 says sensory input is 's' and the cognitive model is 'q(s),' and the cause of the sensory input is 'p(s|o)' but on the very next line, the cognitive model is 'p(s|o)' and the causes of sensory input are 'q(s).' How this sensory input s relates to 'observations' or 'o' is unclear, and meanwhile, capital S is the set of environmental states. P seems to refer to the generative distribution, but it also means probability.

      Response 3: Thank you for your advice. Now we have revised the corresponding labeling and methodological explanations in our work to make them consistent. However, we are not sure how to make a good modification to P here. In many works, P can refer to a certain probability distribution or some specific probabilities.

      Recommendation 4:

      Even the conception of a "policy" is unclear (Figure 2B). They list 4 possible policies, which are simply the 4 possible sequences of steps, stay-safe, cue-risky, etc, but with no contingencies in them. Surely a complete policy that lists 'cue' as the first step would entail a specification of how they would choose the safe or risky option BASED on the information in that cue

      Response 4: Thank you for your suggestion. In active inference, a policy actually corresponds to a sequence of actions. The policy of "first choosing 'Cue' and then making the next decision based on specific information" differs from the meaning of policy in active inference.

      Recommendation 5:

      I assume that the heavy high pass filtering of the EEG (1 Hz) is to avoid having to baseline-correct the epochs (of which there is no mention), but the authors should directly acknowledge that this eradicates any component of decision formation that may evolve in any way gradually within or across the stages of the trial. To take an extreme example, as Figure 3E shows, the expected rewards for the risky path evolve slowly over the course of 60 trials. The filter would eliminate this.

      Response 5: Thank you for your suggestion. The heavy high pass filtering of the EEG (1 Hz) is to minimize the noise in the EEG data as much as possible.

      Recommendation 6:

      There is no mention of the regression itself in the Methods section - the section is incomplete.

      Response 6: Thank you for your suggestion. We have now added the relevant content in the Results section (EEG results at source level, line 337-340):

      “The linear regression was run by the "mne.stats.linear regression" function in the MNE package (Activity ∼ Regressor + Intercept, Activity is the activity amplitude of the EEG signal in the source space and regressor is one of the regressors that we mentioned).”

      Recommendation 7:

      On Lines 260-270 the same results are given twice.

      Response 7: Thank you for your suggestion. We have now deleted redundant content.

      Recommendation 8:

      Frequency bands are displayed in Figure 5 but there is no mention of those in the Methods. In Figure 5b Theta in the 2nd half is compared to Delta in the 1st half- is this an error?

      Response 8: Thank you for your suggestion. It indeed was an error (they should all be Theta) and now we have corrected it.

      Author response image 10.

    1. Author response:

      Reviewer #1 (Public Review):

      Summary:

      This work sets out to elucidate mechanistic intricacies in inflammatory responses in pneumonia in the context of the aging process (Terc deficiency - telomerase functionality).

      Strengths:

      Very interesting, conceptually speaking, approach that is by all means worth pursuing. An overall proper approach to the posited aim.

      We want to thank the reviewer for taking the time to review our manuscript and for providing positive feedback regarding our research question.

      Weaknesses:

      The work is heavily underpowered and may have statistical deficits. This precludes it in its current state from drawing unequivocal conclusions.

      Thank you for this essential and valuable comment. We fully accept that the small sample size of the Tercko/ko mice is a major limitation of our study and transparently discuss this in our manuscript.

      However, due to Animal Welfare regulations, only a reduced number of mice were approved because of the strong burden of disease. Consequently, only three non-infected and five infected mice were available to us. This reduced number of mice presents a clear limitation to our study. However, due to ethical considerations related to animal welfare and sustainability, as well as compliance with German animal welfare regulations, it is not possible to obtain additional Tercko/ko mice to increase the dataset. The animal studies are an important aspect of our study; however, our hypothesis was also investigated at multiple levels, including in an in vitro co-culture model (Figure 5), to ensure comprehensive analysis.

      Thus, we clearly demonstrated that S. aureus pneumonia in Tercko/ko mice leads to a more severe phenotype, orchestrated by the dysregulation of both innate and adaptive immune response.

      Reviewer #2 (Public Review):

      Summary:

      The authors demonstrate heightened susceptibility of Terc-KO mice to S. aureus-induced pneumonia, perform gene expression analysis from the infected lungs, find an elevated inflammatory (NLRP3) signature in some Terc-KO but not control mice, and some reduction in T cell signatures. Based on that, They conclude that disregulated inflammation and T-cell dysfunction play a major role in these phenomena.

      Strengths:

      The strengths of the work include a problem not previously addressed (the role of the Terc component of the telomerase complex) in certain aspects of resistance to bacterial infection and innate (and maybe adaptive) immune function.

      We would like to thank the reviewer for the positive feedback regarding our aim to investigate the impact of Terc deletion on the pulmonary immune response to S. aureus.

      Weaknesses:

      The weaknesses outweigh the strengths, dominantly because conclusions are plagued by flaws in experimental design, by lack of rigorous controls, and by incomplete and inadequate approaches to testing immune function. These weaknesses are as follows

      (1)  Terc-KO mice are a genomic knockout model, and therefore the authors need to carefully consider the impact of this KO on a wide range of tissues. This, however, is not the case. There are no attempts to perform cell transfers or use irradiation chimera or crosses that would be informative.

      We thank the reviewer for bringing up this important point. The aim of our study, however; was to investigate the impact of Terc deletion in the lung and on the response to bacterial pneumonia, rather than to provide a comprehensive characterization of the Tercko/ko model itself. This characterization of different tissues and cell types has already been conducted by previous studies. For instance, studies that characterize the general phenotype of the model (Herrera et al., 1999; Lee et al., 1998; Rudolph et al., 1999) but also investigations that shed light on the impact of Terc deletion on specific cell types such as microglia (Khan et al., 2015) or T cells (Matthe et al., 2022). The impact of Terc deletion on T cells is also discussed in our manuscript in lines 89 to 105. Furthermore, a section about the general phenotype of the Terc deletion model is included in the introduction in lines 126 to 138. Thus we discussed the relevant literature regarding Tercko/ko mice in our manuscript and attempted to provide a more in-depth characterization of the lung by investigating the inflammatory response to infection as well as changes in the gene expression (Figure 2-4).

      (2)  Throughout the manuscript the authors invoke the role of telomere shortening in aging, and according to them, their Terc-KO mice should be one potential model for aging. Yet the authors consistently describe major differences between young Terc-KO and naturally aging old mice, with no discussion of the implications. This further confuses the biological significance of this work as presented.

      Thank you for mentioning this relevant point. We want to apologize for the confusion regarding this matter. While Tercko/ko mice are a well-established model for premature aging, these effects become more apparent with increasing generations (G) and thus, G5 and 6 mice are the most affected by Terc deletion (Lee et al., 1998; Wong et al., 2008).

      Thus, while Tercko/ko mice are a common model for premature aging, this accelerated aging phenotype is predominantly apparent in later-generation Tercko/ko (G5 and 6) or aged Tercko/ko mice (Lee et al., 1998; Wong et al., 2008). Since the aim of this study was to analyze the impact of Terc deletion on the lung and its immune response to bacterial infections instead of the impact of telomere shortening and telomerase dysfunction, young G3 Tercko/ko mice (8 weeks) were used in this study. This is also mentioned in the lines 131-134. In this study, Tercko/ko mice were used not as a model of aging, but rather as a model specifically for Terc deletion. The old WT mice function as a control cohort to observe possible common but also deviating effects between aging and Terc deletion. In our sequencing data, we observe that uninfected young WT mice are very similar to uninfected Tercko/ko mice. Other studies have also reported this lack of major differences between uninfected WT and Tercko/ko mice in the G3 knockout mice (Kang et al., 2018). Conversely, uninfected young WT and Tercko/ko mice exhibited great differences, for instance, regarding the numbers of differentially expressed genes (Supplemental Figure 1H). Thus, differences between naturally aged mice and young G3 Tercko/ko mice are not surprising. To clarify this aspect we reconstructed the paragraph discussing the Tercko/ko mice (lines 126-134). Additionally we added a paragraph explaining the purpose of the naturally aged mice to the lines 134 to 138:

      “As control cohort age-matched young WT mice were utilized. To investigate whether Terc deletion, beyond critical telomere shortening, impacts the pulmonary immune response, we used young Tercko/ko mice. Additionally, naturally aged mice (2 years old) were infected to explore the potential link to a fully developed aging phenotype.”

      (3)  Related to #2, group design for comparisons lacks a clear rationale. The authors stipulate that Terc- KO will mimic natural aging, but in fact, the only significant differences seen between groups in susceptibility to S. aureus are, contrary to the authors' expectation, between young Terc-KO and naturally old mice (Figures 1A and B, no difference between young Terc-KO and young wt); or there are no significant differences at all between groups (Figures 1, C, D,).

      We thank the reviewer for this essential comment. As mentioned above the Tercko/ko mice in this study are not selected to model natural aging. To model telomerase dysfunction and accelerated aging selection of later generation or aged Tercko/ko mice would have been more suitable.

      The lack of statistical significance in some figures is likely due to the heterogeneity of disease phenotype of S. aureus infection in mice, which is a limitation of our study that we discuss in our discussion section in lines 577-583. The phenotype of S. aureus infection can vary greatly within a mouse population, highlighting the limitations of mice as a model for S. aureus infections. To account for this heterogeneity we divided the infected Tercko/ko mice cohort into different degrees of severity based on the clinical score and the presence of bacteria in organs other than the lung (mice with systemic infection).

      Despite the heterogeneity especially within the Tercko/ko mice cohort the differences between the knockout and young as well as old WT mice were striking. Including the fatal infections, 80% of the Tercko/ko mice had a severe course of disease, while none of the WT mice displayed a severe course (Figure 1A, B and Supplemental Figure 1A, B). This hints towards a clear role of Terc in the response to S. aureus infection in mice. Thus while in some figures the differences are not significant, strong trends towards a more severe phenotype of S. aureus infection in the Tercko/ko mice regarding bacterial load, score and inflammatory response could be observed in our study.

      Another example of inadequate group design is when the authors begin dividing their Terc-KO groups by clinical score into animals with or without "systemic infection" (the condition where a bacterium spreads uncontrollably across the many organs and via blood, which should be properly called sepsis), and then compare this sepsis group to other groups (Supplementary Figures 1G; Figure 2; lines 374-376 and 389- 391). This gives them significant differences in several figures, but because they did not clearly indicate where they applied this stratification in the figure legends, the data are somewhat confusing. Most importantly, methodologically it is highly inappropriate to compare one mouse with sepsis to another one without. If Terc-KO mice with sepsis are a comparator group, then their controls have to be wild-type mice with sepsis, who are dealing with the same high bacterial load across the body and are presumably forced to deploy the same set of immune defenses.

      We sincerely appreciate the significant time and effort you have invested in reviewing our manuscript. However, with all due respect, we must point out that the definition of sepsis you have referenced is considered outdated. According to the Third International Consensus Definitions for Sepsis and Septic Shock (Sepsis-3), sepsis is defined as "a life-threatening organ dysfunction caused by a dysregulated host response to infection" (Marvin Singer, 2016, JAMA). Given this fundamental misunderstanding of our findings, we find the comment regarding the inadequacy of our groups to be both dismissive and lacking in scientific merit. We would like to emphasize that the group size used in our study is consistent with accepted standards in infection research. We strongly reject any insinuations of inadequacy that have been repeatedly mentioned throughout the review.

      In order to provide a nuanced investigation of disease severity in Tercko/ko mice, we added the term “systemic infection” to the figures whenever the mice were divided into groups of mice with and without systemic infection. This is the case for Figure 2A and Supplemental Figure 1C-E. The division into mice with and without systemic infection is also mentioned in the figure legend of Figure 2A in lines 933 to 936 and for Supplemental Figure 1 in lines 1053-1054. We agree that Supplemental Figure 1G is somewhat confusing as the mice with systemic infection are highlighted in this graph but not included as a separate group within our sequencing analysis. We added a sentence to the figure legend clarifying this (lines 1042-1045):

      “Nevertheless, the infected Tercko/ko mice were considered one group for the expression analysis and not split into separate groups for the subsequent analysis.”

      Additionally, we revised the section regarding this grouping in different degrees of severity in our Material and Methods section to clarify that this division was only performed for specific analysis (line 191):

      “…for the indicated analysis.”

      Furthermore, the mice which were classified as systemically infected mice were not septic mice, as mentioned above. Those mice were classified by us as systemically infected based on their clinical score and the presence of bacteria in other organs than the lung as stated in the lines 188-191 and 377-382.

      Bacteremia is a symptom of very severe cases of hospital-acquired pneumonia with a very high mortality (De la Calle et al., 2016).

      Therefore, the systemically infected mice or rather mice with bacteremia display an especially severe pneumonia phenotype, which is distinct from sepsis. The presence of this symptom in our Tercko/ko mice further highlights the clinical relevance of our study. This aspect was added to the manuscript in the lines 569-571.

      “The detection of bacteria in extra pulmonary organs is of particular interest, as bacteremia is a symptom of severe pneumonia and is associated with high mortality (De la Calle et al., 2016).”

      (4)  The authors conclude that disregulated inflammation and T-cell dysfunction play a major role in S. aureus susceptibility. This may or may not be an important observation, because many KO mice are abnormal for a variety of reasons, and until such reasons are mechanistically dissected, the physiological importance of the observation will remain unclear.

      Two points are important here. First, there is no natural counterpart to a Terc-KO, which is a complete loss of a key non-enzymatic component of the telomerase complex starting in utero.

      Second, the authors truly did not examine the key basic features of their model, including the features of basic and induced inflammatory and immune responses. This analysis could be done either using model antigens in adjuvants, defined innate immune stimuli (e.g. TLR, RLR, or NLR agonists), or microbial challenge. The only data provided along these lines are the baseline frequencies of total T cells in the spleen of the three groups of mice examined (not statistically significant, Figure 4B). We do not know if the composition of naïve to memory T cell subsets may have been different, and more importantly, we have no data to evaluate whether recruitment of the immune response (including T cells) to the lung upon microbial challenge is similar or different. So, what are the numbers and percentages of T cells and alveolar macrophages in the lung following S. aureus challenge and are they even comparable or are there issues in mobilizing the T cell response to the site of infection? If, for example, Terc-KO mice do not mobilize enough T cells to the lung during infection, that would explain the paucity in many T-cell- associated genes in their transcriptomic set that the authors report. That in turn may not mean dysfunction of T cells but potentially a whole different set of defects in coordinating the response in Terc-KO mice.

      We thank the reviewer for highlighting these important aspects. Regarding the first point, indeed there is no naturally occurring deletion of Terc in humans. However, studies reported reduced expression of Terc and Tert in the tissues of aged mice and rats (Tarry-Adkins et al., 2021; Zhang et al., 2018). Terc itself has been found to have several important immunomodulatory functions such as the activation of the NF- κB or PI3-kinase pathway (Liu et al., 2019; Wu et al., 2022). As those aforementioned pathways are relevant for the immune response to S. aureus infections, the authors were interested in exploring the impact of Terc deletion on the pulmonary immune response. The potential immunomodulatory functions of Terc are discussed in lines 106-121. To further clarify our rationale we added a sentence to the introduction in lines 121-125.

      “Interestingly, downregulation of Terc and Tert expression in tissues of aged mice and rats has been found (Tarry-Adkins, Aiken, Dearden, Fernandez-Twinn, & Ozanne, 2021; Zhang et al., 2018).

      Therefore, as a potential immunomodulatory factor reduced Terc expression could be connected to age- related pathologies.”

      Regarding the second point, as we focused on the effect of Terc deletion in the lung and its role in S. aureus infection, we investigated inflammatory and immune response parameters relevant to this setting. For instance, inflammation parameters in the lungs of all three mice cohorts were measured to investigate differences in the inflammatory response in the non-infected and infected mice (Figure 2A). Those measurements showed no baseline difference in key inflammatory parameters between young WT and Tercko/ko mice, which is consistent with previous findings (Kang et al., 2018). The inflammatory response to infection with S. aureus in the Tercko/ko mice cohort differed significantly from the other cohorts (Figure 2A), hinting towards a dysregulated inflammatory response due to Terc deletion. Furthermore, we investigated general immune cell frequencies such as dendritic cells, macrophages, and B cells in the spleen of all three mice cohorts to gather a baseline understanding of the general immune cell populations. In our manuscript only total T cell frequencies were included due to its relevance for our data regarding T cells (Figure 4B). This data could show that there was no difference of total amount of T cells in the spleen of all three mice cohorts. For a more detailed insight into our analysis we added the frequencies of the other immune cell populations analyzed in the spleen as a Supplemental Figure 3B-F. Additionally, a figure legend for the graphs was added.

      Therefore, while we did not analyze baseline frequencies of specific populations of T cells, we analyzed and characterized the inflammatory and immune response of our model in a way relevant to our research question.

      The differences observed in T cell marker and TCR gene expression was also partly present between the uninfected and infected Tercko/ko mice such as the complete absence of CD247 expression in infected Tercko/ko, which is however expressed in uninfected mice of this cohort (Figure 4A, C and D). Thus, this effect cannot be solely attributed to an inadequate mobilization of T cells to the lung after infectious challenge. However, we agree that a more detailed insight into recruited immune cells to the lung or frequencies of different T cell populations could contribute to a better understanding of the proposed mechanism and would be an interesting experiment to conduct in further studies. We accept this as a limitation of our study and included it in our discussion section in lines 720-724:

      “As total CD4+ T cells were analyzed in this study, it would be useful to investigate specific T cell populations such as memory and effector T cells to elucidate the potential mechanism leading to T cell dysfunctionality in further detail. Additionally, analysis of differences in immune cell recruitment to the lungs between young WT and Tercko/ko mice would be relevant.”

      (5)  Related to that, immunological analysis is also inadequate. First, the authors pull signatures from the total lung tissue, which is both imprecise and potentially skewed by differences, not in gene expression but in types of cells present and/or their abundance, a feature known to be affected by aging and perhaps by Terc deficiency during infection. Second, to draw any conclusions about immune responses, the authors would have to track antigen-specific T cells, which is possible for a wide range of microbial pathogens using peptide-MHC multimers. This would allow highly precise analysis of phenomena the authors are trying to conclude about. Moreover, it would allow them to confirm their gene expression data in populations of physiological interest

      We thank the reviewer for highlighting this important and relevant point. In our study, we aimed to investigate the role of Terc expression in modulating inflammation and the immune response to S. aureus infection in the lung. To address this, we examined the overall impact of age, genotype, and infection on lung inflammation and gene expression. Therefore, sequencing of total lung tissue was essential for addressing the research question posed. Our findings demonstrate that Tercko/ko mice exhibit a more severe phenotype following S. aureus infection, characterized by an increased bacterial load and heightened lung inflammation (Figures 1 and 2). Furthermore, our data suggest that Terc plays a role in regulating inflammation through activation of the NLRP3 inflammasome, along with the dysregulation of several T cell marker genes (Figures 2, 4, and 5). However, this study lacks a detailed analysis of distinct T cell populations, including antigen-specific T cells, as noted earlier. Investigating these aspects in future studies would be valuable to validate and expand upon our findings. We have incorporated these suggestions into the discussion section (lines 720-724)

      “As total CD4+ T cells were analyzed in this study, it would be useful to investigate specific T cell populations such as memory and effector T cells to elucidate the potential mechanism leading to T cell dysfunctionality in further detail. Additionally, analysis of differences in immune cell recruitment to the lungs between young WT and Tercko/ko mice would be relevant.”

      Nevertheless, our study provides first evidence of a potential connection between T cell functionality and Terc expression.

      Third, the authors co-incubate AM and T cells with S. aureus. There is no information here about the phenotype of T cells used. Were they naïve, and how many S. aureus-specific T cells did they contain? Or were they a mix of different cell types, which we know will change with aging (fewer naïve and many more memory cells of different flavors), and maybe even with a Terc-KO? Naïve T cells do not interact with AM; only effector and memory cells would be able to do so, once they have been primed by contact with dendritic cells bringing antigen into the lymphoid tissues, so it is unclear what the authors are modeling here. Mature primed effector T cells would go to the lung and would interact with AM, but it is almost certain that the authors did not generate these cells for their experiment (or at least nothing like that was described in the methods or the text).

      Thank you for bringing up this important question. For the co-cultivation experiment of T cells and alveolar macrophages, total CD4+ T cells of both young WT and Tercko/ko were used. We did not select for a specific population of T cells. Our sequencing data indicated the complete downregulation of CD247 expression, which is an important part of the T cell receptor, in the lungs of infected Tercko/ko mice (Figure 4A, C and D). Given that this factor is downregulated under chronic inflammatory conditions, we investigated the impact of the inflammatory response in alveolar macrophages on the expression of various T cell-derived cytokines, as well as CD247 expression (Figure 5D, E) (Dexiu et al., 2022). This aspect is also highlighted in the discussion in lines 623-637. Therefore, a co-cultivation model of T cells and alveolar macrophages was established and confronted with heat-killed S. aureus to elicit an inflammatory response of the macrophages. To emphasize this purpose, we have revised our statement about the model setup in lines 517-519 of the manuscript:

      “An overactive inflammatory response could be a potential explanation for the dysregulated TCR signaling.”

      The authors hope this will clarify the intent behind the model setup.

      (6)  Overall, the authors began to address the role of Terc in bacterial susceptibility, but to what extent that specifically involves inflammation and macrophages, T cell immunity, or aging remains unclear at present.

      We thank the reviewer for the helpful and relevant comments. The authors accept the limitations of the presented study such as the reduced number of Tercko/ko mice and the limitations of murine models for S. aureus infection itself and discuss those in the discussion section in the lines 559-561; 577-583; 690-692 and 720-726. However, we hope that our responses have provided sufficient evidence to convince the reviewer that our data supports a clear role for Terc expression in regulating the immune response to bacterial infections, particularly with respect to inflammation and its potential connection to T cell functionality.

    1. Author response:

      The following is the authors’ response to the original reviews.

      Public Reviews:

      Reviewer #1 (Public Review):

      Summary:<br /> I really enjoyed this manuscript from Torsekar et al on "Contrasting responses to aridity by

      different-sized decomposers cause similar decomposition rates across a precipitation gradient". The authors aimed to examine how climate interacts with decomposers of different size categories to influence litter decomposition. They proposed a new hypothesis: "The opposing climatic dependencies of macrofauna and that of microorganisms and mesofauna should lead to similar overall decomposition rates across precipitation gradients".

      This study emphasizes the importance as well as the contribution of different groups of organisms (micro, meso, macro, and whole community) across different seasons (summer with the following characteristics: hot with no precipitation, and winter with the following characteristics: cooler and wetter winter) along a precipitation gradient. The authors made use of 1050 litter baskets with different mesh sizes to capture decomposers contribution. They proposed a new hypothesis that was aiming to understand the "dryland decomposition conundrum". They combined their decomposition experiment with the sampling of decomposers by using pittfall traps across both experiment seasons. This study was carried out in Israel and based on a single litter species that is native to all seven sites. The authors found that microorganism contribution dominated in winter while macrofauna decomposition dominated the overall decomposition in summer. These seasonality differences combined with the differences in different decomposers groups fluctuation along precipitation resulted in similar overall decomposition rates across sites.<br /> I believe this manuscript has a potential to advance our knowledge on litter decomposition.

      Strengths:

      Well design study with combination of different approaches (methods) and consideration of seasonality to generalize pattern.

      The study expands to current understanding of litter decomposition and interaction between factors affecting the process (here climate and decomposers).

      Weaknesses:

      The study was only based on a single litter species.

      We now discuss the advantages and limitations of this approach in the methods and devote a completely new paragraph to this important point in the discussion (lines 394-401).

      Reviewer #2 (Public Review):

      Summary: Torsekar et al. use a leaf litter decomposition experiment across seasons, and in an aridity gradient, to provide a careful test of the role of different-sized soil invertebrates in shaping the rates of leaf litter decomposition. The authors found that large-sized invertebrates are more active in the summer and small-sized invertebrates in the winter. The summed effects of all invets then translated into similar levels of decomposition across seasons. The system breaks down in hyper-arid sites.

      Strengths: This is a well-written manuscript that provides a complete statistical analysis of a nice dataset. The authors provide a complete discussion of their results in the current literature.

      Weaknesses:

      I have only three minor comments. Please standardize the color across ALL figures (use the same color always for the same thing, and be friendly to color-blind people).

      Thank you for this important suggestion. We have now changed all figures to standardize all colors and chose a more color-blind friendly pallete.

      Fig 1 may benefit from separating the orange line (micro and meso) into two lines that reflect your experimental setup and results. I would mention the dryland decomposition conundrum earlier in the Introduction.

      We based our novel hypotheses on a thorough literature search. Accordingly, decomposition is expected to be positively associated with moisture, regardless of the decomposer body size. Our contribution to theory was to suggest that macro-detritivores may respond very differently to climatic conditions and dominate litter decomposition in warm arid-lands (we listed the reasons in the text). Consequently, we did not distinguish between microorganisms and mesofauna. We assumed that both groups inhabit the litter substrate and have limited adaptation to dry conditions. Our results provide strong evidence that this presumption is likely wrong and that mesofauna respond to climate very differently from micro-decomposers. Yet, we cannot use hindsight understanding to improve our original hypothesis. We now emphasize this important point at the discussion as important future direction. 

      Although we are very appreciative and pleased with the reviewer enthusiasm to highlight the importance of our work as a possible solution to the longstanding dryland decomposition conundrum, we decided not to move it to the introduction. This is because we think that our work is not centred on resolving the DDC but provides more general principles that may lead to a paradigm shift in the way ecologists study nutrient cycling across ecosystems.

      And the manuscript is full of minor grammatical errors. Some careful reading and fixing of all these minor mistakes here and there would be needed.

      We apologize and did our best to find and fix those mistakes

      Recommendations for the authors:

      Reviewer #1 (Recommendations For The Authors):

      I really enjoyed this manuscript from Torsekar et al on "Contrasting responses to aridity by different-sized decomposers cause similar decomposition rates across a precipitation gradient". The authors aimed to examine how climate interacts with decomposers of different size categories to influence litter decomposition. They proposed a new hypothesis: "The opposing climatic dependencies of macrofauna and that of microorganisms and mesofauna should lead to similar overall decomposition rates across precipitation gradients".

      This study emphasizes the importance as well as the contribution of different groups of organisms (micro, meso, macro, and whole community) across different seasons (summer with the following characteristics: hot with no precipitation, and winter with the following characteristics: cooler and wetter winter) along a precipitation gradient. The authors made use of 1050 litter baskets with different mesh sizes to capture decomposers contribution. They proposed a new hypothesis that was aiming to understand the "dryland decomposition conundrum". They combined their decomposition experiment with the sampling of decomposers by using pitfall traps across both experiment seasons. This study was carried out in Israel and based on a single litter species that is native to all seven sites. The authors found that microorganism contribution dominated in winter while macrofauna decomposition dominated the overall decomposition in summer. These seasonality differences combined with the differences in different decomposers groups fluctuation along precipitation resulted in similar overall decomposition rates across sites.

      I believe this manuscript has the potential to advance our knowledge on litter decomposition. Below i provide my general and specific comments.

      General comments:

      (1) Study in general is well designed and well thought beforehand,

      (2) Study aims to expand the current understanding of the dryland decomposition conundrum

      (3) The should put a caveat to the fact they only use one litter species and call for examining litter mixture in the same gradient.

      (4) Please check the way you reduce the random effects from your initial model, I have provided a better way to do so in my specific comments

      (5) For Figure 1, authors can check my comment on this and see if they could revise the figure.

      Thank you for the positive feedback and your valuable comments. We have tried to best address all comments and suggestions for improvement and clarification

      Specific comments

      Line # 57 Please write "Theory suggests" instead of "Theory suggest"

      We changed the text as suggested

      Line # 70, please write "Indeed, handful evidence shows" instead of "Indeed, handful evidence show"

      We changed the text as suggested

      Figure 1: I like this conceptual framework. I have a silly question, why is it that the slopes of the whole community at the beginning (between Hyperarid and Arid) is the same as the Macro fauna, I would think the slope should be higher as this is adding up right? and also the same goes for the decomposition of whole community later on. For me this should reflect the adding or summing up (if i am right) then the authors should think about how this could be reflected in the figure.

      We agree with your interpretation that the whole community decomposition reflects the addition by constituent decomposers. The slope of the whole community decomposition between hyper-arid and arid is slightly higher than the one of macro decomposition to reflect the additive effect of macro with meso+micro decomposition. We have now changed the figure slightly to make this point more visible (Line 106).

      Line # 111 Please make "Methods" bold as well to be consistent with others headings.

      We changed the formatting as suggested

      Line #125 and in other lines as well please replace "X" by "x" to denote multiplication.

      We changed the formatting as suggested

      Table 1 Please add "*" to climate like this "Climate*" so that the end note of the table could make sense

      Thank you for this suggestion. We have now added the asterisk referring to the note below the Table.

      Figure 2, please consider putting at line #133, mean annual precipitation (MAP), as such for line # 135 You can directly says The precipitation map ....

      We made both changes as suggested.

      Line # 138 I would not use the different units for the same values. I do understand that you want to emphasize the accuracy but i would write instead 3 +- 0.001 g

      We changed the units as suggested.

      Line # 145, how is the litter basket customized to rest at 1 cm above ground level?

      We have now clarified –that we cut-open windows one centimeter above the cage floor. The cages were positioned on the soil (line 144).

      Lines # 181-183, I like the approach of checking the necessity of having the random effects. However, it has been reported that likelihood ratio test (LRT) are not really reliable to test for random effects. I will suggest you rather use permutations instead. I think the function is confint(MODEL) you need to specify the number of permutation the higher the better but you should start with 99 first and see how the results look like if promising then you can even go to 9999. But it will need computation power and and time.

      Thank you for the suggestion. We now used a simulation-based exact test, instead of a LRT, to examine the random effect, as recommended by the authors from the “lme4” package. As recommended, we used 9999 simulations. The simulation test yielded a similar result to those originally reported (see lines 181-183).

      Line # 187, 188, 188, please do not use capital letter to start mesofauna, macrofauna and whole-community

      We changed the formatting as suggested

      Line # 205 Please add the version number of R in the text.

      We now included the version number as suggested.

      Line # 209-211, could you please check whether "then" is the word you want to use or "than"

      Our bad- we indeed meant “than” and have made the appropriate changes.

      Line # 227 and in other places as well please provide the second degree of freedom of the F test.

      Thank you for this important comment. We have now added the second degree of freedom to the relevant results (lines 229, 232).

      Figure 3 and Figure 4 show some results that are negative, can you please explain what might be the reasons behind this?

      We now explain this important point in the figures’ captions.

      Figure 5 Please add label to the x-axis.

      Thank you-we have now included a label.

      Line # 357, the sentence "... meso-decomposition, like microbial decomposition,...", I don't understand which criteria authors used to classify microbial decomposition as "meso-decomposition"?

      We now remove this potential cause of confusion by using the term ‘meso-decomposition’ to distinguish from microbial decomposition (Line 366).

      Line # 380 Kindly put "per se" in italic.

      We changed the formatting as suggested

      References

      The references format are not consistent. For example for the same journal (say Trends in Ecology and Evolution) the authors sometimes wrote the full name like at line # 36 (and also realize that "vol" should not be written as such) but wrote the abbreviations at line #42

      Our bad- we apologize and carefully checked all references to make sure the style is consistent.

    1. Author response:

      The following is the authors’ response to the original reviews.

      (1) Combined Public Reviews:

      Strengths:

      This work investigates the role of DNAH3 in sperm mobility and male infertility and utilised gold-standard molecular biology techniques, showing strong evidence of its role in male infertility. All aspects of the study design and methods are well described and appropriate to address the main question of the manuscript. The conclusions drawn are consistent with the analyses conducted and supported by the data.

      We extend our sincere gratitude to the expert reviewers for their valuable comments and insightful suggestions.

      Weaknesses:

      (1.1) The manuscript lacks a comparison with previous studies on DNAH3 in the Discussion section.

      We thank the reviewers' comments.

      Recently, Meng et al. identified bi-allelic variants in DNAH3 from patients diagnosed with asthenoteratozoospermia, revealing multiple morphological defects and a disrupted "9+2" arrangement in the patients' sperm (https://doi.org/10.1093/hropen/hoae003, PMID: 38312775). Furthermore, they generated Dnah3 KO mice, which were infertile, and exhibited moderate morphological abnormalities with a normally structured “9 + 2” microtubule arrangement. In our study, we also observed similar phenotypic differences between the phenotypes of DNAH3-deficient patients and Dnah3 KO mice. These findings indicate that DNAH3 may play crucial yet distinct roles in human and mouse male reproduction. Additionally, our TEM analysis demonstrated a notable absence of IDAs in sperm from both DNAH3-deficent patients and Dnah3 KO mice, resembling the findings of Meng et al. To further investigate, we conducted immunofluorescent staining and western blotting to assess the levels of IDA-associated proteins (DNAH1, DNAH6 and DNALI1) and ODA-associated proteins (DNAH8, DNAH17 and DNAI1) in sperm samples from both our DNAH3-deficient patients and Dnah3 KO mice. Our data revealed a reduction in IDA-associated protein levels and comparable ODA-associated protein levels in comparison to normal controls and WT mice, respectively, thus corroborating the TEM observations. These results suggest that DNAH3 is involved in sperm flagellar development in human and mice, specifically through its role in the assembly of IDAs.

      Intriguingly, in our study, none of the patients with DNAH3 deficiency reported experiencing any of the principal symptoms associated with PCD. Additionally, our Dnah3 KO mice exhibited normal ciliary development in the lung, brain, eye, and oviduct. Similarly, Meng et al. did not mention any PCD symptoms in their DNAH3-deficient patients, and their Dnah3 KO mice also demonstrated normal ciliary morphology in the trachea and brain. These combined observations suggest that DNAH3 may play a more significant role in sperm flagellar development than in other motile cilia functions. Given that DNAH3 is expressed in ciliary tissues, its role in these tissues remains intriguing and could be elucidated through sequencing of larger cohorts of individuals with PCD.

      We have added these discussions in line 267 to 283, and line 300 to 303.

      (1.2) The variants of DNAH3 in four infertile men were identified through whole-exome sequencing. Providing an overview of the WES data would be beneficial to offer additional insights into whether other variants may contribute the infertility. This could also help explain why ICSI only works for two out of four patients with DNAH3 variants.

      We thank the reviewer's helpful suggestions.

      We have deposited the raw whole-exome sequencing data in the National Genomics Data Center (NGDC) (https://ngdc.cncb.ac.cn/, accession number: HRA007467). The clean reads, sequencing depth, sequencing coverage, and mapping quality of the WES on the patients are listed below (Table R1). A summary of WES has been presented in Table S1.

      Author response table 1.

      Quality of whole exome sequencing on infertile men.

      The variants identified through WES were annotated and filtered using Exomiser. Next, the variants were screened to obtain candidate variants based on the following criteria: (1) the allele frequency in the East Asian population was less than 1% in any database, including the ExAC Browser, gnomAD, and the 1000 Genomes Project; (2) the variants affected coding exons or canonical splice sites; (3) the variants were predicted to be possibly pathogenic or damaging.

      Following filtering and screening, the numbers of candidate variants obtained were as follows: Patient 1: 98, Patient 2: 101, Patient 3: 67, and Patient 4: 91(Table S1). Subsequently, we utilized the Human Protein Atlas (HPA) database (https://www.proteinatlas.org/) and Mouse Genome Informatics (MGI) database (https://informatics.jax.org/) to analyze the expression patterns of corresponding genes. Variants whose corresponding genes were not expressed in the human or mouse testis were excluded from further consideration. We also consulted OMIM database and reviewed relevant literature to exclude variants associated with diseases unrelated to male infertility. Additionally, considering the assumption of a recessive inheritance pattern, we excluded all monoallelic variants. Ultimately, only bi-allelic variants in DNAH3 (NG_052617.1, NM_017539.2, NP_060009.1) remained, suggesting as the pathogenic variants responsible for the infertility of the patients (Table S1). These DNAH3 variants were verified by Sanger sequencing on DNA from the patients' families.

      We have added the overview of the WES in Table S1 and supplemented the analysis process of WES data in line 100 to 106, and line 348 to 360.

      Additionally, we did not identify any pathogenic variants that associated with fertilization failure and early embryonic development in the two patients with failed ICSI outcomes. Therefore, these different ICSI outcomes might be attributed to additional unexplained factors from the female partners.

      (1.3) Quantification of images would help substantiate the conclusions, particularly in Figures 2, 3, 4, and 6. Improved images in Figures 3A, 4B, and 4C, would help increase confidence in the claims made.

      In response to reviewer’s valuable suggestions. We presume that the reviewer means quantification of images in Figure S6, but not Figure 6.

      We have compiled statistics for results shown in Figures 2, 3, 4, and S6. Specifically:

      - The percentages of abnormal flagellar morphology in normal control and patients, associated with the observations in Figure 2A, have been shown in Figure S1A.

      - The percentages of aberrant axonemal ultrastructure in different cross-sections of sperm from in normal control and patients, correspond to the findings in Figure 3A, have been presented in Figure S1B.

      - The percentages of abnormal flagellar morphology in WT mice and Dnah3 KO mice have been shown in Figure S7A.

      - The percentages of aberrant axonemal arrangement in different cross-sections of sperm from WT mice and Dnah3 KO mice, corresponding to the findings in Figure 4B, have been presented in Figure S7C.

      - The percentages of microtubule doublets presenting IDAs in sperm from WT mice and Dnah3 KO mice, related to Figure 4B, have been detailed in Figure S7D.

      - The percentages of malformed mitochondria in the midpiece of sperm from WT mice and Dnah3 KO mice, associated with the observations in Figure 4C, have been presented in Figure S7E.

      Moreover, we have revised Figures 3A, 4B, and 4C by replacing the unclear TEM images.

      (2) Reviewer #1 (Recommendations for The Authors):

      (2.1) Please add reference(s) that support what is claimed in lines 83-84.

      We are very grateful for the reviewer's careful comments, we have added a reference that describing the homology and expression of DNAH3.

      (2.2) In line 286, change "suggested" to "suggest".

      Thanks for the reviewer's comments. We have corrected the grammar.

      (2.3) Please add reference(s) that support what is claimed in lines 359-360.

      According to the reviewer’s suggestions, we have included references detailing the STA-PUT velocity sedimentation for isolation of single human and mouse testicular cells.

      (2.4) In line 365, change "in" to "into".

      Thanks for the reviewer’s careful comments, we have corrected this word.

      (2.5) In Figure 7, I suggest changing "patients" to "wife or partners of patient". Given that the results are indeed from the spouses of the infertile men, I suggest making this small change to keep the consistency and clarity of what the authors did.

      In response to reviewer’s kind suggestions, we have replaced “Patient” by “partners of Patient” and revised Figure 7.

      (3) Reviewer #2 (Recommendations for The Authors):

      (3.1) A summary of the WES data would be needed (i.e. number of reads, mapping quality, etc). As mentioned in the public review, it would be beneficial to present a summary of all variants identified in the data and clarify whether DNAH3 is the only gene that contains variants and whether these variants have been validated.

      Many thanks for reviewer’s kind suggestions.

      The clean reads, sequencing depth, sequencing coverage, and mapping quality of the WES on the patients are listed (see author response table 1) A summary of WES has been presented in Table S1.

      The variants identified through WES were annotated and filtered using Exomiser. Next, the variants were screened to obtain candidate variants based on the following criteria: (1) the allele frequency in the East Asian population was less than 1% in any database, including the ExAC Browser, gnomAD, and the 1000 Genomes Project; (2) the variants affected coding exons or canonical splice sites; (3) the variants were predicted to be possibly pathogenic or damaging.

      Following filtering and screening, the numbers of candidate variants obtained were as follows: Patient 1: 98, Patient 2: 101, Patient 3: 67, and Patient 4: 91(Table S1). Subsequently, we utilized the Human Protein Atlas (HPA) database (https://www.proteinatlas.org/) and Mouse Genome Informatics (MGI) database (https://informatics.jax.org/) to analyze the expression patterns of corresponding genes. Variants whose corresponding genes were not expressed in the human or mouse testis were excluded from further consideration. We also consulted OMIM database and reviewed relevant literature to exclude variants associated with diseases unrelated to male infertility. Additionally, considering the assumption of a recessive inheritance pattern, we excluded all monoallelic variants. Ultimately, only bi-allelic variants in DNAH3 (NG_052617.1, NM_017539.2, NP_060009.1) remained, suggesting as the pathogenic variants responsible for the infertility of the patients (Table S1). These DNAH3 variants were verified by Sanger sequencing on DNA from the patients' families.

      We have added the overview of the WES in Table S1 and supplemented the analysis process of WES data in line 100 to 106, and line 348 to 360.

      (3.2) It would be beneficial to the scientific community if the raw data of WES could be uploaded to a public data repository, such as GEO.

      According to the reviewer's suggestion, we have deposited the raw whole-exome sequencing data in the National Genomics Data Center (NGDC) (https://ngdc.cncb.ac.cn/, accession number: HRA007467) and described its availability in the "Data Availability" section.

      (3.3) In line 115, it is not clear how the prediction was made. Clarifying them by adding citations or describing methods that predict these pathways/functions would help strengthen it.

      Thanks for the reviewer's comments.

      SIFT, PolyPhen-2, MutationTaster and CADD assess the deleteriousness of genetic variants by considering genomic features and evolutionary constraint of the surrounding sequence or structural and chemical property altercations by the amino acid substitutions. We have added websites and references of these tools in the manuscript (line 116 to 118).

      Here are the principles of these tools.

      - The SIFT considers the position at which the change occurred and the type of amino acid change, and then to predict whether an amino acid substitution in a protein will affect protein function [https://sift.bii.a-star.edu.sg/, PMID: 12824425].

      - The PolyPhen-2 predicts the impact of an amino acid substitution on a human protein by considering several features, including sequence, phylogenetic, and structural information [http://genetics.bwh.harvard.edu/pph2/, PMID: 20354512].

      - The MutationTaster utilizes a Bayes classifier to predict the functional consequences of amino acid substitutions, intronic and synonymous changes, short insertions/deletions (indels), etc. [https://www.mutationtaster.org/, PMID: 24681721].

      - The CADD scores are based on diverse genomic features derived from surrounding sequence context, gene model annotations, evolutionary constraint, epigenetic measurements, and functional predictions [https://cadd.gs.washington.edu/, PMID: 30371827].

      (4) Reviewer #3 (Recommendations for The Authors):

      (4.1) Please ensure that all gene names used in your manuscript have been approved by the HUGO nomenclature committee. For example, "c.3590C>T (p.P1197L)" should be described as "c.3590C>T (Pro1197Leu)".

      In response to the reviewer's suggestion, we have improved all the names of gene and variants according to the HUGO nomenclature committee and HGVS Variant Nomenclature Committee, respectively.

      (4.2) For Table 1, the authors should provide the rates of abnormal sperm morphologies using the sperm cells from normal male controls.

      Thanks for the reviewer’s careful comments. Consistent with the WHO laboratory manual (World Health Organization. WHO laboratory manual for the examination and processing of human semen. World Health Organization, 2021.), our routine semen analysis establishes 4% as the minimum rate of sperm with normal morphology but does not define the maximum rate of various tail defects. However, we reviewed the routine semen analysis on the normal controls in our study, and the approximate distribution of sperm with various flagellar in the normal controls was as follows: normal flagella, 78.6%; absent flagella, 1.7%; short flagella, 0.6%; coiled flagella, 12.5%; bent flagella, 7.9%; irregular flagella, 1.8%.

      (4.3) In Table 2, "Mutation Tester" or "Mutation Taster"?

      We thank the reviewer’s comments. It should be "MutationTaster", and we have corrected this mistake in Table 2 and the manuscript.

      (4.4) In Figure 2B, the bars for patient 1 should be aligned. 

      Following the reviewer's valuable suggestion, we have ensured consistent scar bar alignment in Figure 2B and implemented this alignment throughout all other figures.

      (4.5) In Figure 3A, what about the ultrastructure for sperm heads in DNAH3 deficient sperm cell? The authors previously mentioned abnormalities in sperm head morphologies (Figure 2B) in patients with DNAH3 mutations.

      We thank the reviewers for their kind comments. A small fraction of abnormal sperm head of our patients was captured under TEM, manifested by round head with loose chromatin (Author response image 1)

      Author response image 1.

      Ultrastructure of sperm head from DNAH3-deficient infertile men. TEM analysis revealed a fraction of round head with loose chromatin in patients harboring DNAH3 variants. Scale bars, 200 nm.

      (4.6) In Figure S6, the authors should provide the rates of abnormal sperm morphologies for Dnah3 KO male mice.

      In response to the reviewer's valuable suggestion, we have quantified morphological defects in spermatozoa from both Dnah3 KO and WT mice. Compared to about 17% morphological abnormalities in sperm from WT mice, the morphological abnormalities in sperm from Dnah3 KO mice were about 37%. The results are presented in the revised Figure S7.

    1. Author response:

      The following is the authors’ response to the original reviews.

      eLife assessment

      This important study provides solid evidence that both psychiatric dimensions (e.g. anhedonia, apathy, or depression) and chronotype (i.e., being a morning or evening person) influence effort-based decision-making. Notably, the current study does not elucidate whether there may be interactive effects of chronotype and psychiatric dimensions on decision-making. This work is of importance to researchers and clinicians alike, who may make inferences about behaviour and cognition without taking into account whether the individual may be tested or observed out-of-sync with their phenotype.

      We thank the three reviewers for their comments, and the Editors at eLife. We have taken the opportunity to revise our manuscript considerably from its original form, not least because we feel a number of the reviewers’ suggested analyses strengthen our manuscript considerably (in one instance even clarifying our conclusions, leading us to change our title)—for which we are very appreciative indeed. 

      Public Reviews:

      Reviewer #1 (Public Review):

      Summary:

      This study uses an online cognitive task to assess how reward and effort are integrated in a motivated decision-making task. In particular the authors were looking to explore how neuropsychiatric symptoms, in particular apathy and anhedonia, and circadian rhythms affect behavior in this task. Amongst many results, they found that choice bias (the degree to which integrated reward and effort affects decisions) is reduced in individuals with greater neuropsychiatric symptoms, and late chronotypes (being an 'evening person').

      Strengths:

      The authors recruited participants to perform the cognitive task both in and out of sync with their chronotypes, allowing for the important insight that individuals with late chronotypes show a more reduced choice bias when tested in the morning.<br /> Overall, this is a well-designed and controlled online experimental study. The modelling approach is robust, with care being taken to both perform and explain to the readers the various tests used to ensure the models allow the authors to sufficiently test their hypotheses.

      Weaknesses:

      This study was not designed to test the interactions of neuropsychiatric symptoms and chronotypes on decision making, and thus can only make preliminary suggestions regarding how symptoms, chronotypes and time-of-assessment interact.

      We appreciate the Reviewer’s positive view of our research and agree with their assessment of its weaknesses; the study was not designed to assess chronotype-mental health interactions. We hope that our new title and contextualisation makes this clearer. We respond in more detail point-by-point below.

      Reviewer #2 (Public Review):

      Summary:

      The study combines computational modeling of choice behavior with an economic, effort-based decision-making task to assess how willingness to exert physical effort for a reward varies as a function of individual differences in apathy and anhedonia, or depression, as well as chronotype. They find an overall reduction in effort selection that scales with apathy and anhedonia and depression. They also find that later chronotypes are less likely to choose effort than earlier chronotypes and, interestingly, an interaction whereby later chronotypes are especially unwilling to exert effort in the morning versus the evening.

      Strengths:

      This study uses state-of-the-art tools for model fitting and validation and regression methods which rule out multicollinearity among symptom measures and Bayesian methods which estimate effects and uncertainty about those estimates. The replication of results across two different kinds of samples is another strength. Finally, the study provides new information about the effects not only of chronotype but also chronotype by timepoint interactions which are previously unknown in the subfield of effort-based decision-making.

      Weaknesses:

      The study has few weaknesses. One potential concern is that the range of models which were tested was narrow, and other models might have been considered. For example, the Authors might have also tried to fit models with an overall inverse temperature parameter to capture decision noise. One reason for doing so is that some variance in the bias parameter might be attributed to noise, which was not modeled here. Another concern is that the manuscripts discuss effort-based choice as a transdiagnostic feature - and there is evidence in other studies that effort deficits are a transdiagnostic feature of multiple disorders. However, because the present study does not investigate multiple diagnostic categories, it doesn't provide evidence for transdiagnosticity, per se.

      We appreciate Reviewer 2’s assessment of our research and agree generally with its weaknesses. We have now addressed the Reviewer’s comments regarding transdiagnosticity in the discussion of our revised version and have addressed their detailed recommendations below (see point-by-point responses).

      In addition to the below specific changes, in our Discussion section, we now have also added the following (lines 538 – 540):

      “Finally, we would like to note that as our study is based on a general population sample, rather than a clinical one. Hence, we cannot speak to transdiagnosticity on the level of multiple diagnostic categories.”

      Reviewer #3 (Public Review):

      Summary:

      In this manuscript, Mehrhof and Nord study a large dataset of participants collected online (n=958 after exclusions) who performed a simple effort-based choice task. They report that the level of effort and reward influence choices in a way that is expected from prior work. They then relate choice preferences to neuropsychiatric syndromes and, in a smaller sample (n<200), to people's circadian preferences, i.e., whether they are a morning-preferring or evening-preferring chronotype. They find relationships between the choice bias (a model parameter capturing the likelihood to accept effort-reward challenges, like an intercept) and anhedonia and apathy, as well as chronotype. People with higher anhedonia and apathy and an evening chronotype are less likely to accept challenges (more negative choice bias). People with an evening chronotype are also more reward sensitive and more likely to accept challenges in the evening, compared to the morning.

      Strengths:

      This is an interesting and well-written manuscript which replicates some known results and introduces a new consideration related to potential chronotype relationships which have not been explored before. It uses a large sample size and includes analyses related to transdiagnostic as well as diagnostic criteria. I have some suggestions for improvements.

      Weaknesses:

      (1) The novel findings in this manuscript are those pertaining to transdiagnostic and circadian phenotypes. The authors report two separate but "overlapping" effects: individuals high on anhedonia/apathy are less willing to accept offers in the task, and similarly, individuals tested off their chronotype are less willing to accept offers in the task. The authors claim that the latter has implications for studying the former. In other words, because individuals high on anhedonia/apathy predominantly have a late chronotype (but might be tested early in the day), they might accept less offers, which could spuriously look like a link between anhedonia/apathy and choices but might in fact be an effect of the interaction between chronotype and time-of-testing. The authors therefore argue that chronotype needs to be accounted for when studying links between depression and effort tasks.

      The authors argue that, if X is associated with Y and Z is associated with Y, X and Z might confound each other. That is possible, but not necessarily true. It would need to be tested explicitly by having X (anhedonia/apathy) and Z (chronotype) in the same regression model. Does the effect of anhedonia/apathy on choices disappear when accounting for chronotype (and time-of-testing)? Similarly, when adding the interaction between anhedonia/apathy, chronotype, and time-of-testing, within the subsample of people tested off their chronotype, is there a residual effect of anhedonia/apathy on choices or not?

      If the effect of anhedonia/apathy disappeared (or got weaker) while accounting for chronotype, this result would suggest that chronotype mediates the effect of anhedonia/apathy on effort choices. However, I am not sure it renders the direct effect of anhedonia/apathy on choices entirely spurious. Late chronotype might be a feature (induced by other symptoms) of depression (such as fatigue and insomnia), and the association between anhedonia/apathy and effort choices might be a true and meaningful one. For example, if the effect of anhedonia/apathy on effort choices was mediated by altered connectivity of the dorsal ACC, we would not say that ACC connectivity renders the link between depression and effort choices "spurious", but we would speak of a mechanism that explains this effect. The authors should discuss in a more nuanced way what a significant mediation by the chronotype/time-of-testing congruency means for interpreting effects of depression in computational psychiatry.

      We thank the Reviewer for pointing out this crucial weakness in the original version of our manuscript. We have now thought deeply about this and agree with the Reviewer that our original results did not warrant our interpretation that reported effects of anhedonia and apathy on measures of effort-based decision-making could potentially be spurious. At the Reviewer’s suggestion, we decided to test this explicitly in our revised version—a decision that has now deepened our understanding of our results, and changed our interpretation thereof.  

      To investigate how the effects of neuropsychiatric symptoms and the effects of circadian measures relate to each other, we have followed the Reviewer’s advice and conducted an additional series of analyses (see below). Surprisingly (to us, but perhaps not the Reviewer) we discovered that all three symptom measures (two of anhedonia, one of apathy) have separable effects from circadian measures on the decision to expend effort (note we have also re-named our key parameter ‘motivational tendency’ to address this Reviewer’s next comment that the term ‘choice bias’ was unclear). In model comparisons (based on leave-one-out information criterion which penalises for model complexity) the models including both circadian and psychiatric measures always win against the models including either circadian or psychiatric measures. In essence, this strengthens our claims about the importance of measuring circadian rhythm in effort-based tasks generally, as circadian rhythm clearly plays an important role even when considering neuropsychiatric symptoms, but crucially does not support the idea of spurious effects: statistically, circadian measures contributes separably from neuropsychiatric symptoms to the variance in effort-based decision-making. We think this is very interesting indeed, and certainly clarifies (and corrects the inaccuracy in) our original interpretation—and can only express our thanks to the Reviewer for helping us understand our effect more fully.

      In response to these new insights, we have made numerous edits to our manuscript. First, we changed the title from “Overlapping effects of neuropsychiatric symptoms and circadian rhythm on effort-based decision-making” to “Both neuropsychiatric symptoms and circadian rhythm alter effort-based decision-making”. In the remaining manuscript we now refrain from using the word ‘overlapping’ (which could be interpreted as overlapping in explained variance), and instead opted to describe the effects as parallel. We hope our new analyses, title, and clarified/improved interpretations together address the Reviewer’s valid concern about our manuscript’s main weakness.

      We detail these new analyses in the Methods section as follows (lines 800 – 814):

      “4.5.2. Differentiating between the effects of neuropsychiatric symptoms and circadian measures on motivational tendency

      To investigate how the effects of neuropsychiatric symptoms on motivational tendency (2.3.1) relate to effects of chronotype and time-of-day on motivational tendency we conducted exploratory analyses. In the subsamples of participants with an early or late chronotype (including additionally collected data), we first ran Bayesian GLMs with neuropsychiatric questionnaire scores (SHAPS, DARS, AES respectively) predicting motivational tendency, controlling for age and gender. We next added an interaction term of chronotype and time-of-day into the GLMs, testing how this changes previously observed neuropsychiatric and circadian effects on motivational tendency. Finally, we conducted a model comparison using LOO, comparing between motivational tendency predicted by a neuropsychiatric questionnaire, motivational tendency predicted by chronotype and time-of-day, and motivational tendency predicted by a neuropsychiatric questionnaire and time-of-day (for each neuropsychiatric questionnaire, and controlling for age and gender).”

      Results of the outlined analyses are reported in the results section as follows (lines 356 – 383):

      “2.5.2.1 Neuropsychiatric symptoms and circadian measures have separable effects on motivational tendency

      Exploratory analyses testing for the effects of neuropsychiatric questionnaires on motivational tendency in the subsamples of early and late chronotypes confirmed the predictive value of the SHAPS (M=-0.24, 95% HDI=[-0.42,-0.06]), the DARS (M=-0.16, 95% HDI=[-0.31,-0.01]), and the AES (M=-0.18, 95% HDI=[-0.32,-0.02]) on motivational tendency.

      For the SHAPS, we find that when adding the measures of chronotype and time-of-day back into the GLMs, the main effect of the SHAPS (M=-0.26, 95% HDI=[-0.43,-0.07]), the main effect of chronotype (M=-0.11, 95% HDI=[-0.22,-0.01]), and the interaction effect of chronotype and time-of-day (M=0.20, 95% HDI=[0.07,0.34]) on motivational tendency remain. Model comparison by LOOIC reveals motivational tendency is best predicted by the model including the SHAPS, chronotype and time-of-day as predictors, followed by the model including only the SHAPS. Note that this approach to model comparison penalizes models for increasing complexity.

      Repeating these steps with the DARS, the main effect of the DARS is found numerically, but the 95% HDI just includes 0 (M=-0.15, 95% HDI=[-0.30,0.002]). The main effect of chronotype (M=-0.11, 95% HDI=[-0.21,-0.01]), and the interaction effect of chronotype and time-of-day (M=0.18, 95% HDI=[0.05,0.33]) on motivational tendency remain. Model comparison identifies the model including the DARS and circadian measures as the best model, followed by the model including only the DARS.

      For the AES, the main effect of the AES is found (M=-0.19, 95% HDI=[-0.35,-0.04]). For the main effect of chronotype, the 95% narrowly includes 0 (M=-0.10, 95% HDI=[-0.21,0.002]), while the interaction effect of chronotype and time-of-day (M=0.20, 95% HDI=[0.07,0.34]) on motivational tendency remains. Model comparison identifies the model including the AES and circadian measures as the best model, followed by the model including only the AES.”

      We have now edited parts of our Discussion to discuss and reflect these new insights, including the following.

      Lines 399 – 402:

      “Various neuropsychiatric disorders are marked by disruptions in circadian rhythm, such as a late chronotype. However, research has rarely investigated how transdiagnostic mechanisms underlying neuropsychiatric conditions may relate to inter-individual differences in circadian rhythm.”

      Lines 475 – 480:

      “It is striking that the effects of neuropsychiatric symptoms on effort-based decision-making largely are paralleled by circadian effects on the same neurocomputational parameter. Exploratory analyses predicting motivational tendency by neuropsychiatric symptoms and circadian measures simultaneously indicate the effects go beyond recapitulating each other, but rather explain separable parts of the variance in motivational tendency.”

      Lines 528 – 532:

      “Our reported analyses investigating neuropsychiatric and circadian effects on effort-based decision-making simultaneously are exploratory, as our study design was not ideally set out to examine this. Further work is needed to disentangle separable effects of neuropsychiatric and circadian measures on effort-based decision-making.”

      Lines 543 – 550:

      “We demonstrate that neuropsychiatric effects on effort-based decision-making are paralleled by effects of circadian rhythm and time-of-day. Exploratory analyses suggest these effects account for separable parts of the variance in effort-based decision-making. It unlikely that effects of neuropsychiatric effects on effort-based decision-making reported here and in previous literature are a spurious result due to multicollinearity with chronotype. Yet, not accounting for chronotype and time of testing, which is the predominant practice in the field, could affect results.”

      (2) It seems that all key results relate to the choice bias in the model (as opposed to reward or effort sensitivity). It would therefore be helpful to understand what fundamental process the choice bias is really capturing in this task. This is not discussed, and the direction of effects is not discussed either, but potentially quite important. It seems that the choice bias captures how many effortful reward challenges are accepted overall which maybe captures general motivation or task engagement. Maybe it is then quite expected that this could be linked with questionnaires measuring general motivation/pleasure/task engagement. Formally, the choice bias is the constant term or intercept in the model for p(accept), but the authors never comment on what its sign means. If I'm not mistaken, people with higher anhedonia but also higher apathy are less likely to accept challenges and thus engage in the task (more negative choice bias). I could not find any discussion or even mention of what these results mean. This similarly pertains to the results on chronotype. In general, "choice bias" may not be the most intuitive term and the authors may want to consider renaming it. Also, given the sign of what the choice bias means could be flipped with a simple sign flip in the model equation (i.e., equating to accepting more vs accepting less offers), it would be helpful to show some basic plots to illustrate the identified differences (e.g., plotting the % accepted for people in the upper and lower tertile for the SHAPS score etc).

      We apologise that this was not made clear previously: the meaning and directionality of “choice bias” is indeed central to our results. We also thank the Reviewer for pointing out the previousely-used term “choice bias” itself might not be intuitive. We have now changed this to ‘motivational tendency’ (see below) as well as added substantial details on this parameter to the manuscript, including additional explanations and visualisations of the model as suggested by the Reviewer (new Figure 3) and model-agnostic results to aid interpretation (new Figure S3). Note the latter is complex due to our staircasing procedure (see new figure panel D further detailing our staircasing procedure in Figure 2). This shows that participants with more pronounced anhedonia are less likely to accept offers than those with low anhedonia (Fig. S3A), a model-agnostic version of our central result.

      Our changes are detailed below:

      After careful evaluation we have decided to term the parameter “motivational tendency”, hoping that this will present a more intuitive description of the parameter.

      To aid with the understanding and interpretation of the model parameters, and motivational tendency in particular, we have added the following explanation to the main text:

      Lines 149 – 155:

      “The models posit efforts and rewards are joined into a subjective value (SV), weighed by individual effort (and reward sensitivity (parameters. The subjective value is then integrated with an individual motivational tendency (a) parameter to guide decision-making. Specifically, the motivational tendency parameter determines the range at which subjective values are translated to acceptance probabilities: the same subjective value will translate to a higher acceptance probability the higher the motivational tendency.”

      Further, we have included a new figure, visualizing the model. This demonstrates how the different model parameters contribute to the model (A), and how different values on each parameter affects the model (B-D).

      We agree that plotting model agnostic effects in our data may help the reader gain intuition of what our task results mean. We hope to address this with our added section on “Model agnostic task measures relating to questionnaires”. We first followed the reviewer’s suggestion of extracting subsamples with higher and low anhedonia (as measured with the SHAPS, highest and lowest quantile) and plotted the acceptance proportion across effort and reward levels (panel A in figure below). However, due to our implemented task design, this only shows part of the picture: the staircasing procedure individualises which effort-reward combination a participant is presented with. Therefore, group differences in choice behaviour will lead to differences in the development of the staircases implemented in our task. Thus, we plotted the count of offered effort-reward combinations for the subsamples of participants with high vs. low SHAPS scores by the end of the task, averaged across staircases and participants.

      As the aspect of task development due to the implemented staircasing may not have been explained sufficiently in the main text, we have included panel (D) in figure 2.

      Further, we have added the following figure reference to the main text (lines 189 – 193):

      “The development of offered effort and reward levels across trials is shown in figure 2D; this shows that as participants generally tend to accept challenges rather than reject them, the implemented staircasing procedure develops toward higher effort and lover reward challenges.”

      To statistically test effects of model-agnostic task measures on the neuropsychiatric questionnaires, we performed Bayesian GLMs with the proportion of accepted trials predicted by SHAPS and AES. This is reported in the text as follows.

      Supplement, lines 172 – 189:

      “To explore the relationship between model agnostic task measures to questionnaire measures of neuropsychiatric symptoms, we conducted Bayesian GLMs, with the proportion of accepted trials predicted by SHAPS scores, controlling for age and gender. The proportion of accepted trials averaged across effort and reward levels was predicted by the Snaith-Hamilton Pleasure Scale (SHAPS) sum scores (M=-0.07; 95%HDI=[-0.12,-0.03]) and the Apathy Evaluation Scale (AES) sum scores (M=-0.05; 95%HDI=[-0.10,-0.002]). Note that this was not driven only by higher effort levels; even confining data to the lowest two effort levels, SHAPS has a predictive value for the proportion of accepted trials: M=-0.05; 95%HDI=[-0.07,-0.02].<br /> A visualisation of model agnostic task measures relating to symptoms is given in Fig. S4, comparing subgroups of participants scoring in the highest and lowest quartile on the SHAPS. This shows that participants with a high SHAPS score (i.e., more pronounced anhedonia) are less likely to accept offers than those with a low SHAPS score (Fig. S4A). Due to the implemented staircasing procedure, group differences can also be seen in the effort-reward combinations offered per trial. While for both groups, the staircasing procedure seems to devolve towards high effort – low reward offers, this is more pronounced in the subgroup of participants with a lower SHAPS score (Fig S4B).”

      (3) None of the key effects relate to effort or reward sensitivity which is somewhat surprising given the previous literature and also means that it is hard to know if choice bias results would be equally found in tasks without any effort component. (The only analysis related to effort sensitivity is exploratory and in a subsample of N=56 per group looking at people meeting criteria for MDD vs matched controls.) Were stimuli constructed such that effort and reward sensitivity could be separated (i.e., are uncorrelated/orthogonal)? Maybe it would be worth looking at the % accepted in the largest or two largest effort value bins in an exploratory analysis. It seems the lowest and 2nd lowest effort level generally lead to accepting the challenge pretty much all the time, so including those effort levels might not be sensitive to individual difference analyses?

      We too were initially surprised by the lack of effect of neuropsychiatric symptoms on reward and effort sensitivity. To address the Reviewer’s first comment, the nature of the ‘choice bias’ parameter (now motivational tendency) is its critical importance in the context of effort-based decision-making: it is not modelled or measured explicitly in tasks without effort (such as typical reward tasks), so it would be impossible to test this in tasks without an effort component. 

      For the Reviewer’s second comment, the exploratory MDD analysis is not our only one related to effort sensitivity: the effort sensitivity parameter is included in all of our central analyses, and (like reward sensitivity), does not relate to our measured neuropsychiatric symptoms (e.g., see page 15). Note most previous effort tasks do not include a ‘choice bias’/motivational tendency parameter, potentially explaining this discrepancy. However, our model was quantitatively superior to models without this parameter, for example with only effort- and reward-sensitivity (page 11, Fig. 3).

      Our three model parameters (reward sensitivity, effort sensitivity, and choice bias/motivational tendency) were indeed uncorrelated/orthogonal to one another (see parameter orthogonality analyses below), making it unlikely that the variance and effect captured by our motivational tendency parameter (previously termed “choice bias”) should really be attributed to reward sensitivity. As per the Reviewer’s suggestion, we also examined whether the lowest two effort levels might not be sensitive to individual differences; in fact, we found out proportion of accepted trials on the lowest effort levels alone was nevertheless predicted by anhedonia (see ceiling effect analyses below).

      Specifically, in terms of parameter orthogonality:

      When developing our task design and computational modelling approach we were careful to ensure that meaningful neurocomputational parameters could be estimated and that no spurious correlations between parameters would be introduced by modelling. By conducting parameter recoveries for all models, we showed that our modelling approach could reliably estimate parameters, and that estimated parameters are orthogonal to the other underlying parameters (as can be seen in Figure S1 in the supplement). It is thus unlikely that the variance and effect captured by our motivational tendency parameter (previously termed “choice bias”) should really be attributed to reward sensitivity.

      And finally, regarding the possibility of a ceiling effect for low effort levels:

      We agree that visual inspection of the proportion of accepted results across effort and reward values can lead to the belief that a ceiling effect prevents the two lowest effort levels from capturing any inter-individual differences. To test whether this is the case, we ran a Bayesian GLM with the SHAPS sum score predicting the proportion of accepted trials (controlling for age and gender), in a subset of the data including only trials with an effort level of 1 or 2. We found the SHAPS has a predictive value for the proportion of accepted trials in the lowest two effort levels: M=-0.05; 95%HDI=[-0.07,-0.02]). This is noted in the text as follows.

      Supplement, lines 175 – 180:

      “The proportion of accepted trials averaged across effort and reward levels was predicted by the Snaith-Hamilton Pleasure Scale (SHAPS) sum scores (M=-0.07; 95%HDI=[-0.12,-0.03]) and the Apathy Evaluation Scale (AES) sum scores (M=-0.05; 95%HDI=[-0.10,-0.002]). Note that this was not driven only by higher effort levels; even confining data to the lowest two effort levels, SHAPS has a predictive value for the proportion of accepted trials: M=-0.05; 95%HDI=[-0.07,-0.02].”

      (4) The abstract and discussion seem overstated (implications for the school system and statements on circadian rhythms which were not measured here). They should be toned down to reflect conclusions supported by the data.

      We thank the Reviewer for pointing this out, and have now removed these claims from the abstract and Discussion; we hope they now better reflect conclusions supported by these data directly.

      Recommendations for the authors:

      Reviewer #1 (Recommendations For The Authors):

      (1) Suggestions for improved or additional experiments, data or analyses.

      - For a non-computational audience, it would be useful to unpack the influence of the choice bias on behavior, as it is less clear how this would affect decision-making than sensitivity to effort or reward. Perhaps a figure showing accept/reject decisions when sensitivities are held and choice bias is high would be beneficial.

      We thank the Reviewer for suggesting additional explanations of the choice bias parameter to aid interpretation for non-computational readers; as per the Reviewer’s suggestion, we have now included additional explanations and visualisations (Figure 3) to make this as clear as possible. Please note also that, in response to one of the other Reviewers and after careful considerations, we have decided to rename the “choice bias” parameter to “motivational tendency”, hoping this will prove more intuitive.

      To aid with the understanding and interpretation of this and the other model parameters, we have added the following explanation to the main text.

      Lines 149 – 155:

      “The models posit efforts and rewards are joined into a subjective value (SV), weighed by individual effort (and reward sensitivity (parameters. The subjective value is then integrated with an individual motivational tendency (a) parameter to guide decision-making. Specifically, the motivational tendency parameter determines the range at which subjective values are translated to acceptance probabilities: the same subjective value will translate to a higher acceptance probability the higher the motivational tendency.”

      Additionally, we add the following explanation to the Methods section.

      Lines 698 – 709:

      First, a cost function transforms costs and rewards associated with an action into a subjective value (SV):

      with and for reward and effort sensitivity, and ℛ and 𝐸 for reward and effort. Higher effort and reward sensitivity mean the SV is more strongly influenced by changes in effort and reward, respectively (Fig. 3B-C). Hence, low effort and reward sensitivity mean the SV, and with that decision-making, is less guided by effort and reward offers, as would be in random decision-making.

      This SV is then transformed to an acceptance probability by a softmax function:

      with for the predicted acceptance probability and 𝛼 for the intercept representing motivational tendency. A high motivational tendency means a subjects has a tendency, or bias, to accept rather than reject offers (Fig. 3D).

      Our new figure (panels A-D in figure 3) visualizes the model. This demonstrates how the different model parameters come at play in the model (A), and how different values on each parameter affects the model (B-D).

      - The early and late chronotype groups have significant differences in ages and gender. Additional supplementary analysis here may mitigate any concerns from readers.

      The Reviewer is right to notice that our subsamples of early and late chronotypes differ significantly in age and gender, but it important to note that all our analyses comparing these two groups take this into account, statistically controlling for age and gender. We regret that this was previously only mentioned in the Methods section, so this information was not accessible where most relevant. To remedy this, we have amended the Results section as follows.

      Lines 317 – 323:

      “Bayesian GLMs, controlling for age and gender, predicting task parameters by time-of-day and chronotype showed effects of chronotype on reward sensitivity (i.e. those with a late chronotype had a higher reward sensitivity; M= 0.325, 95% HDI=[0.19,0.46]) and motivational tendency (higher in early chronotypes; M=-0.248, 95% HDI=[-0.37,-0.11]), as well as an interaction between chronotype and time-of-day on motivational tendency (M=0.309, 95% HDI=[0.15,0.48]).”

      (2) Recommendations for improving the writing and presentation.

      - I found the term 'overlapping' a little jarring. I think the authors use it to mean both neuropsychiatric symptoms and chronotypes affect task parameters, but they are are not tested to be 'separable', nor is an interaction tested. Perhaps being upfront about how interactions are not being tested here (in the introduction, and not waiting until the discussion) would give an opportunity to operationalize this term.

      We agree with the Reviewer that our previously-used term “overlapping” was not ideal: it may have been misleading, and was not necessarily reflective of the nature of our findings. We now state explicitly that we are not testing an interaction between neuropsychiatric symptoms and chronotypes in our primary analyses. Additionally, following suggestions made by Reviewer 3, we ran new exploratory analyses to investigate how the effects of neuropsychiatric symptoms and circadian measures on motivational tendency relate to one another. These results in fact show that all three symptom measures have separable effects from circadian measures on motivational tendency. This supports the Reviewer’s view that ‘overlapping’ was entirely the wrong word—although it nevertheless shows the important contribution of circadian rhythm as well as neuropsychiatric symptoms in effort-based decision-making. We have changed the manuscript throughout to better describe this important, more accurate interpretation of our findings, including replacing the term “overlapping”. We changed the title from “Overlapping effects of neuropsychiatric symptoms and circadian rhythm on effort-based decision-making” to “Both neuropsychiatric symptoms and circadian rhythm alter effort-based decision-making”.

      To clarify the intention of our primary analyses, we have added the following to the last paragraph of the introduction.

      Lines 107 – 112:

      “Next, we pre-registered a follow-up experiment to directly investigate how circadian preference interacts with time-of-day on motivational decision-making, using the same task and computational modelling approach. While this allows us to test how circadian effects on motivational decision-making compare to neuropsychiatric effects, we do not test for possible interactions between neuropsychiatric symptoms and chronobiology.”

      We detail our new analyses in the Methods section as follows.

      Lines 800 – 814:

      “4.5.2 Differentiating between the effects of neuropsychiatric symptoms and circadian measures on motivational tendency

      To investigate how the effects of neuropsychiatric symptoms on motivational tendency (2.3.1) relate to effects of chronotype and time-of-day on motivational tendency we conducted exploratory analyses. In the subsamples of participants with an early or late chronotype (including additionally collected data), we first ran Bayesian GLMs with neuropsychiatric questionnaire scores (SHAPS, DARS, AES respectively) predicting motivational tendency, controlling for age and gender. We next added an interaction term of chronotype and time-of-day into the GLMs, testing how this changes previously observed neuropsychiatric and circadian effects on motivational tendency. Finally, we conducted a model comparison using LOO, comparing between motivational tendency predicted by a neuropsychiatric questionnaire, motivational tendency predicted by chronotype and time-of-day, and motivational tendency predicted by a neuropsychiatric questionnaire and time-of-day (for each neuropsychiatric questionnaire, and controlling for age and gender).”

      Results of the outlined analyses are reported in the Results section as follows.

      Lines 356 – 383:

      “2.5.2.1 Neuropsychiatric symptoms and circadian measures have separable effects on motivational tendency

      Exploratory analyses testing for the effects of neuropsychiatric questionnaires on motivational tendency in the subsamples of early and late chronotypes confirmed the predictive value of the SHAPS (M=-0.24, 95% HDI=[-0.42,-0.06]), the DARS (M=-0.16, 95% HDI=[-0.31,-0.01]), and the AES (M=-0.18, 95% HDI=[-0.32,-0.02]) on motivational tendency.

      For the SHAPS, we find that when adding the measures of chronotype and time-of-day back into the GLMs, the main effect of the SHAPS (M=-0.26, 95% HDI=[-0.43,-0.07]), the main effect of chronotype (M=-0.11, 95% HDI=[-0.22,-0.01]), and the interaction effect of chronotype and time-of-day (M=0.20, 95% HDI=[0.07,0.34]) on motivational tendency remain. Model comparison by LOOIC reveals motivational tendency is best predicted by the model including the SHAPS, chronotype and time-of-day as predictors, followed by the model including only the SHAPS. Note that this approach to model comparison penalizes models for increasing complexity.

      Repeating these steps with the DARS, the main effect of the DARS is found numerically, but the 95% HDI just includes 0 (M=-0.15, 95% HDI=[-0.30,0.002]). The main effect of chronotype (M=-0.11, 95% HDI=[-0.21,-0.01]), and the interaction effect of chronotype and time-of-day (M=0.18, 95% HDI=[0.05,0.33]) on motivational tendency remain. Model comparison identifies the model including the DARS and circadian measures as the best model, followed by the model including only the DARS.

      For the AES, the main effect of the AES is found (M=-0.19, 95% HDI=[-0.35,-0.04]). For the main effect of chronotype, the 95% narrowly includes 0 (M=-0.10, 95% HDI=[-0.21,0.002]), while the interaction effect of chronotype and time-of-day (M=0.20, 95% HDI=[0.07,0.34]) on motivational tendency remains. Model comparison identifies the model including the AES and circadian measures as the best model, followed by the model including only the AES.”

      In addition to the title change, we edited our Discussion to discuss and reflect these new insights, including the following.

      Lines 399 – 402:

      “Various neuropsychiatric disorders are marked by disruptions in circadian rhythm, such as a late chronotype. However, research has rarely investigated how transdiagnostic mechanisms underlying neuropsychiatric conditions may relate to inter-individual differences in circadian rhythm.”

      Lines 475 – 480:

      “It is striking that the effects of neuropsychiatric symptoms on effort-based decision-making largely are paralleled by circadian effects on the same neurocomputational parameter. Exploratory analyses predicting motivational tendency by neuropsychiatric symptoms and circadian measures simultaneously indicate the effects go beyond recapitulating each other, but rather explain separable parts of the variance in motivational tendency.”

      Lines 528 – 532:

      “Our reported analyses investigating neuropsychiatric and circadian effects on effort-based decision-making simultaneously are exploratory, as our study design was not ideally set out to examine this. Further work is needed to disentangle separable effects of neuropsychiatric and circadian measures on effort-based decision-making.”

      Lines 543 – 550:

      “We demonstrate that neuropsychiatric effects on effort-based decision-making are paralleled by effects of circadian rhythm and time-of-day. Exploratory analyses suggest these effects account for separable parts of the variance in effort-based decision-making. It unlikely that effects of neuropsychiatric effects on effort-based decision-making reported here and in previous literature are a spurious result due to multicollinearity with chronotype. Yet, not accounting for chronotype and time of testing, which is the predominant practice in the field, could affect results.”

      - A minor point, but it could be made clearer that many neurotransmitters have circadian rhythms (and not just dopamine).

      We agree this should have been made clearer, and have added the following to the Introduction.

      Lines 83 – 84:

      “Bi-directional links between chronobiology and several neurotransmitter systems have been reported, including dopamine47.

      (47) Kiehn, J.-T., Faltraco, F., Palm, D., Thome, J. & Oster, H. Circadian Clocks in the Regulation of Neurotransmitter Systems. Pharmacopsychiatry 56, 108–117 (2023).”

      - Making reference to other studies which have explored circadian rhythms in cognitive tasks would allow interested readers to explore the broader field. One such paper is: Bedder, R. L., Vaghi, M. M., Dolan, R. J., & Rutledge, R. B. (2023). Risk taking for potential losses but not gains increases with time of day. Scientific reports, 13(1), 5534, which also includes references to other similar studies in the discussion.

      We thank the Reviewer for pointing out that we failed to cite this relevant work. We have now included it in the Introduction as follows.

      Lines 97 – 98:

      “A circadian effect on decision-making under risk is reported, with the sensitivity to losses decreasing with time-of-day66.

      (66) Bedder, R. L., Vaghi, M. M., Dolan, R. J. & Rutledge, R. B. Risk taking for potential losses but not gains increases with time of day. Sci Rep 13, 5534 (2023).”

      (3) Minor corrections to the text and figures.

      None, clearly written and structured. Figures are high quality and significantly aid understanding.

      Reviewer #2 (Recommendations For The Authors):

      I did have a few more minor comments:

      - The manuscript doesn't clarify whether trials had time limits - so that participants might fail to earn points - or instead they did not and participants had to continue exerting effort until they were done. This is important to know since it impacts on decision-strategies and behavioral outcomes that might be analyzed. For example, if there is no time limit, it might be useful to examine the amount of time it took participants to complete their effort - and whether that had any relationship to choice patterns or symptomatology. Or, if they did, it might be interesting to test whether the relationship between choices and exerted effort depended on symptoms. For example, someone with depression might be less willing to choose effort, but just as, if not more likely to successfully complete a trial once it is selected.

      We thank the Reviewer for pointing out this important detail in the task design, which we should have made clearer. The trials did indeed have a time limit which was dependent on the effort level. To clarify this in the manuscript, we have made changes to Figure 2 and the Methods section. We agree it would be interesting to explore whether the exerted effort in the task related to symptoms. We explored this in our data by predicting the participant average proportion of accepted but failed trials by SHAPS score (controlling for age and gender). We found no relationship: M=0.01, 95% HDI=[-0.001,0.02]. However, it should be noted that the measure of proportion of failed trials may not be suitable here, as there are only few accepted but failed trials (M = 1.3% trials failed, SD = 3.50). This results from several task design characteristics aimed at preventing subjects from failing accepted trials, to avoid confounding of effort discounting with risk discounting. As an alternative measure, we explored the extent to which participants went “above and beyond” the target in accepted trials. Specifically, considering only accepted and succeeded trials, we computed the factor by which the required number of clicks was exceeded (i.e., if a subject clicked 15 times when 10 clicks were required the factor would be 1.3), averaging across effort and reward level. We then conducted a Bayesian GLM to test whether this subject wise click-exceedance measure can be predicted by apathy or anhedonia, controlling for age and gender. We found neither the SHAPS (M=-0.14, 95% HDI=[-0.43,0.17]) nor the AES (M=0.07, 95% HDI=[-0.26,0.41]) had a predictive value for the amount to which subjects exert “extra effort”. We have now added this to the manuscript.

      In Figure 2, which explains the task design in the results section, we have added the following to the figure description.

      Lines 161 – 165:

      “Each trial consists of an offer with a reward (2,3,4, or 5 points) and an effort level (1,2,3, or 4, scaled to the required clicking speed and time the clicking must be sustained for) that subjects accept or reject. If accepted, a challenge at the respective effort level must be fulfilled for the required time to win the points.”

      In the Methods section, we have added the following.

      Lines 617 – 622:

      “We used four effort-levels, corresponding to a clicking speed at 30% of a participant’s maximal capacity for 8 seconds (level 1), 50% for 11 seconds (level 2), 70% for 14 seconds (level 3), and 90% for 17 seconds (level 4). Therefore, in each trial, participants had to fulfil a certain number of mouse clicks (dependent on their capacity and the effort level) in a specific time (dependent on the effort level).”

      In the Supplement, we have added the additional analyses suggested by the Reviewer.

      Lines 195 – 213:

      “3.2 Proportion of accepted but failed trials

      For each participant, we computed the proportion of trial in which an offer was accepted, but the required effort then not fulfilled (i.e., failed trials). There was no relationship between average proportion of accepted but failed trials and SHAPS score (controlling for age and gender): M=0.01, 95% HDI=[-0.001,0.02]. However, there are intentionally few accepted but failed trials (M = 1.3% trials failed, SD = 3.50). This results from several task design characteristics aimed at preventing subjects from failing accepted trials, to avoid confounding of effort discounting with risk discounting.”

      “3.3 Exertion of “extra effort”

      We also explored the extent to which participants went “above and beyond” the target in accepted trials. Specifically, considering only accepted and succeeded trials, we computed the factor by which the required number of clicks was exceeded (i.e., if a subject clicked 15 times when 10 clicks were required the factor would be 1.3), averaging across effort and reward level. We then conducted a Bayesian GLM to test whether this subject wise click-exceedance measure can be predicted by apathy or anhedonia, controlling for age and gender. We found neither the SHAPS (M=-0.14, 95% HDI=[-0.43,0.17]) nor the AES (M=0.07, 95% HDI=[-0.26,0.41]) had a predictive value for the amount to which subjects exert “extra effort”.”

      - Perhaps relatedly, there is evidence that people with depression show less of an optimism bias in their predictions about future outcomes. As such, they show more "rational" choices in probabilistic decision tasks. I'm curious whether the Authors think that a weaker choice bias among those with stronger depression/anhedonia/apathy might be related. Also, are choices better matched with actual effort production among those with depression?

      We think this is a very interesting comment, but unfortunately feel our manuscript cannot properly speak to it: as in our response to the previous comment, our exploratory analysis linking the proportion of accepted but failed trials to anhedonia symptoms (i.e. less anhedonic people making more optimistic judgments of their likelihood of success) did not show a relationship between the two. However, this null finding may be the result of our task design which is not laid out to capture such an effect (in fact to minimize trials of this nature). We have added to the Discussion section.

      Lines 442 – 445:

      “It is possible that a higher motivational tendency reflects a more optimistic assessment of future task success, in line with work on the optimism bias95; however our task intentionally minimized unsuccessful trials by titrating effort and reward; future studies should explore this more directly.

      (95) Korn, C. W., Sharot, T., Walter, H., Heekeren, H. R. & Dolan, R. J. Depression is related to an absence of optimistically biased belief updating about future life events. Psychological Medicine 44, 579–592 (2014).”

      - The manuscript does not clarify: How did the Authors ensure that each subject received each effort-reward combination at least once if a given subject always accepted or always rejected offers?

      We have made the following edit to the Methods section to better explain this aspect of our task design.

      Lines 642 – 655:

      “For each subject, trial-by-trial presentation of effort-reward combinations were made semi-adaptively by 16 randomly interleaved staircases. Each of the 16 possible offers (4 effort-levels x 4 reward-levels) served as the starting point of one of the 16 staircase. Within each staircase, after a subject accepted a challenge, the next trial’s offer on that staircase was adjusted (by increasing effort or decreasing reward). After a subject rejected a challenge, the next offer on that staircase was adjusted by decreasing effort or increasing reward. This ensured subjects received each effort-reward combination at least once (as each participant completed all 16 staircases), while individualizing trial presentation to maximize the trials’ informative value. Therefore, in practice, even in the case of a subject rejecing all offers (and hence the staircasing procedures always adapting by decreasing effort or increasing reward), the full range of effort-reward combinations will be represented in the task across the startingpoints of all staircases (and therefore before adaption takeplace).”

      - The word "metabolic" is misspelled in Table 1

      - Figure 2 is missing panel label "C"

      - The word "effort" is repeated on line 448.

      We thank the Reviewer for their attentive reading of our manuscript and have corrected the mistakes mentioned.

      Reviewer #3 (Recommendations For The Authors):

      It is a bit difficult to get a sense of people's discounting from the plots provided. Could the authors show a few example individuals and their fits (i.e., how steep was effort discounting on average and how much variance was there across individuals; maybe they could show the mean discount function or some examples etc)

      We appreciate very much the Reviewer's suggestion to visualise our parameter estimates within and across individuals. We have implemented this in Figure .S2

      It would be helpful if correlations between the various markers used as dependent variables (SHAPS, DARS, AES, chronotype etc) could plotted as part of each related figure (e.g., next to the relevant effects shown).

      We agree with the Reviewer that a visual representation of the various correlations between dependent variables would be a better and more assessable communication than our current paragraph listing the correlations. We have implemented this by adding a new figure plotting all correlations in a heat map, with asterisks indicating significance.

      The authors use the term "meaningful relationship" - how is this defined? If undefined, maybe consider changing (do they mean significant?)

      We understand how our use of the term “(no) meaningful relationship” was confusing here. As we conducted most analyses in a Bayesian fashion, this is a formal definition of ‘meaningful’: the 95% highest density interval does not span across 0. However, we do not want this to be misunderstood as frequentist “significance” and agree clarity can be improved here, To avoid confusion, we have amended the manuscript where relevant (i.e., we now state “we found a (/no) relationship / effect” rather than “we found a meaningful relationship”.

      The authors do not include an inverse temperature parameter in their discounting models-can they motivate why? If a participant chose nearly randomly, which set of parameter values would they get assigned?

      Our decision to not include an inverse temperature parameter was made after an extensive simulation-based investigation of different models and task designs. A series of parameter recovery studies including models with an inverse temperature parameter revealed the inverse temperature parameter could not be distinguished from the reward sensitivity parameter. Specifically, inverse temperature seemed to capture the variance of the true underlying reward sensitivity parameter, leading to confounding between the two. Hence, including both reward sensitivity and inverse temperature would not have allowed us to reliably estimate either parameter. As our pre-registered hypotheses related to the reward sensitivity parameter, we opted to include models with the reward sensitivity parameter rather than the inverse temperature parameter in our model space. We have now added these simulations to our supplement.

      Nevertheless, we believe our models can capture random decision-making. The parameters of effort and reward sensitivity capture how sensitive one is to changes in effort/reward level. Hence, random decision-making can be interpreted as low effort and reward sensitivity, such that one’s decision-making is not guided by changes in effort and reward magnitude. With low effort/reward sensitivity, the motivational tendency parameter (previously “choice bias”) would capture to what extend this random decision-making is biased toward accepting or rejecting offers.

      The simulation results are now detailed in the Supplement.

      Lines 25 – 46:

      “1.2.1 Parameter recoveries including inverse temperature

      In the process of task and model space development, we also considered models incorportating an inverse temperature paramater. To this end, we conducted parameter recoveries for four models, defined in Table S3.

      Parameter recoveries indicated that, parameters can be recovered reliably in model 1, which includes only effort sensitivity ( ) and inverse temperature as free parameters (on-diagonal correlations: .98 > r > .89, off-diagonal correlations: .04 > |r| > .004). However, as a reward sensitivity parameter is added to the model (model 2), parameter recovery seems to be compromised, as parameters are estimated less accurately (on-diagonal correlations: .80 > r > .68), and spurious correlations between parameters emerge (off-diagonal correlations: .40 > |r| > .17). This issue remains when motivational tendency is added to the model (model 4; on-diagonal correlations: .90 > r > .65; off-diagonal correlations: .28 > |r| > .03), but not when inverse temperature is modelled with effort sensitivity and motivational tendency, but not reward sensitivity (model 3; on-diagonal correlations: .96 > r > .73; off-diagonal correlations: .05 > |r| > .003).

      As our pre-registered hypotheses related to the reward sensitivity parameter, we opted to include models with the reward sensitivity parameter rather than the inverse temperature parameter in our model space.”

      And we now discuss random decision-making specifically in the Methods section.

      Lines 698 – 709:

      “First, a cost function transforms costs and rewards associated with an action into a subjective value (SV):

      with and for reward and effort sensitivity, and  and  for reward and effort. Higher effort and reward sensitivity mean the SV is more strongly influenced by changes in effort and reward, respectively (Fig. 3B-C). Hence, low effort and reward sensitivity mean the SV, and with that decision-making, is less guided by effort and reward offers, as would be in random decision-making.

      This SV is then transformed to an acceptance probability by a softmax function:

      with for the predicted acceptance probability and  for the intercept representing motivational tendency. A high motivational tendency means a subjects has a tendency, or bias, to accept rather than reject offers (Fig. 3D).”

      The pre-registration mentions effects of BMI and risk of metabolic disease-those are briefly reported the in factor loadings, but not discussed afterwards-although the authors stated hypotheses regarding these measures in their preregistration. Were those hypotheses supported?

      We reported these results (albeit only briefly) in the factor loadings resulting from our PLS regression and results from follow-up GLMs (see below). We have now amended the Discussion to enable further elaboration on whether they confirmed our hypotheses (this evidence was unclear, but we have subsequently followed up in a sample with type-2 diabetes, who also show reduced motivational tendency).

      Lines 258 – 261:

      “For the MEQ (95%HDI=[-0.09,0.06]), MCTQ (95%HDI=[-0.17,0.05]), BMI (95%HDI=[-0.19,0.01]), and FINDRISC (95%HDI=[-0.09,0.03]) no relationship with motivational tendency was found, consistent with the smaller magnitude of reported component loadings from the PLS regression.”

      We have added the following paragraph to our discussion.

      Lines 491 – 502:

      “To our surprise, we did not find statistical evidence for a relationship between effort-based decision-making and measures of metabolic health (BMI and risk for type-2 diabetes). Our analyses linking BMI to motivational tendency reveal a numeric effect in line with our hypothesis: a higher BMI relating to a lower motivational tendency. However, the 95% HDI for this effect narrowly included zero (95%HDI=[-0.19,0.01]). Possibly, our sample did not have sufficient variance in metabolic health to detect dimensional metabolic effects in a current general population sample. A recent study by our group investigates the same neurocomputational parameters of effort-based decision-making in participants with type-2 diabetes and non-diabetic controls matched by age, gender, and physical activity105. We report a group effect on the motivational tendency parameter, with type-2 diabetic patients showing a lower tendency to exert effort for reward.”

      “(105) Mehrhof, S. Z., Fleming, H. A. & Nord, C. A cognitive signature of metabolic health in effort-based decision-making. Preprint at https://doi.org/10.31234/osf.io/4bkm9 (2024).”

      R-values are indicated as a range (e.g., from 0.07-0.72 for the last one in 2.1 which is a large range). As mentioned above, the full correlation matrix should be reported in figures as heatmaps.

      We agree with the Reviewer that a heatmap is a better way of conveying this information – see Figure 1 in response to their previous comment.  

      The answer on whether data was already collected is missing on the second preregistration link. Maybe this is worth commenting on somewhere in the manuscript.

      This question appears missing because, as detailed in the manuscript, we felt that technically some data *was* already collected by the time our second pre-registration was posted. This is because the second pre-registration detailed an additional data collection, with the goal of extending data from the original dataset to include extreme chronotypes and increase precision of analyses. To avoid any confusion regarding the lack of reply to this question in the pre-registration, we have added the following disclaimer to the description of the second pre-registration:

      “Please note the lack of response to the question regarding already collected data. This is because the data collection in the current pre-registration extends data from the original dataset to increase the precision of analyses. While this original data is already collected, none of the data collection described here has taken place.”

      Some referencing is not reflective of the current state of the field (e.g., for effort discounting: Sugiwaka et al., 2004 is cited). There are multiple labs that have published on this since then including Philippe Tobler's and Sven Bestmann's groups (e.g., Hartmann et al., 2013; Klein-Flügge et al., Plos CB, 2015).

      We agree absolutely, and have added additional, more recent references on effort discounting.

      Lines 67 – 68:

      “Higher costs devalue associated rewards, an effect referred to as effort-discounting33–37.”

      (33) Sugiwaka, H. & Okouchi, H. Reformative self-control and discounting of reward value by delay or effort1. Japanese Psychological Research 46, 1–9 (2004).

      (34) Hartmann, M. N., Hager, O. M., Tobler, P. N. & Kaiser, S. Parabolic discounting of monetary rewards by physical effort. Behavioural Processes 100, 192–196 (2013).

      (35) Klein-Flügge, M. C., Kennerley, S. W., Saraiva, A. C., Penny, W. D. & Bestmann, S. Behavioral Modeling of Human Choices Reveals Dissociable Effects of Physical Effort and Temporal Delay on Reward Devaluation. PLOS Computational Biology 11, e1004116 (2015).

      (36) Białaszek, W., Marcowski, P. & Ostaszewski, P. Physical and cognitive effort discounting across different reward magnitudes: Tests of discounting models. PLOS ONE 12, e0182353 (2017).

      (37) Ostaszewski, P., Bąbel, P. & Swebodziński, B. Physical and cognitive effort discounting of hypothetical monetary rewards. Japanese Psychological Research 55, 329–337 (2013).

      There are lots of typos throughout (e.g., Supplementary martial, Mornignness etc)

      We thank the Reviewer for their attentive reading of our manuscript and have corrected our mistakes.

      In Table 1, it is not clear what the numbers given in parentheses are. The figure note mentions SD, IQR, and those are explicitly specified for some rows, but not all.

      After reviewing Table 1 we understand the comment regarding the clarity of the number in parentheses. In our original manuscript, for some variables, numbers were given per category (e.g. for gender and ethnicity), rather than per row, in which case the parenthetical statistic was indicated in the header row only. However, we now see that the clarity of the table would have been improved by adding the reported statistic for each row—we have corrected this.

      In Figure 1C, it would be much more helpful if the different panels were combined into one single panel (using differently coloured dots/lines instead of bars).

      We agree visualizing the proportion of accepted trials across effort and reward levels in one single panel aids interpretability. We have implemented it in the following plot (now Figure 2C).

      In Sections 2.2.1 and 4.2.1, the authors mention "mixed-effects analysis of variance (ANOVA) of repeated measures" (same in the preregistration). It is not clear if this is a standard RM-ANOVA (aggregating data per participant per condition) or a mixed-effects model (analysing data on a trial-by-trial level). This model seems to only include within-subjects variable, so it isn't a "mixed ANOVA" mixing within and between subjects effects.

      We apologise that our use of the term "mixed-effects analysis of variance (ANOVA) of repeated measures" is indeed incorrectly applied here. We aggregate data per participant and effort-by-reward combination, meaning there are no between-subject effects tested. We have corrected this to “repeated measures ANOVA”.

      In Section 2.2.2, the authors write "R-hats>1.002" but probably mean "R-hats < 1.002". ESS is hard to evaluate unless the total number of samples is given.

      We thank the Reviewer for noticing this mistake and have corrected it in the manuscript.

      In Section 2.3, the inference criterion is unclear. The authors first report "factor loadings" and then perform a permutation test that is not further explained. Which of these factors are actually needed for predicting choice bias out of chance? The permutation test suggests that the null hypothesis is just "none of these measures contributes anything to predicting choice bias", which is already falsified if only one of them shows an association with choice bias. It would be relevant to know for which measures this is the case. Specifically, it would be relevant to know whether adding circadian measures into a model that already contains apathy/anhedonia improves predictive performance.

      We understand the Reviewer’s concerns regarding the detail of explanation we have provided for this part of our analysis, but we believe there may have been a misunderstanding regarding the partial least squares (PLS) regression. Rather than identifying a number of factors to predict the outcome variable, a PLS regression identifies a model with one or multiple components, with various factor loadings of differing magnitude. In our case, the PLS regression identified a model with one component to best predict our outcome variable (motivational tendency, which in our previous various we called choice bias). This one component had factor loadings of our questionnaire-based measures, with measures of apathy and anhedonia having highest weights, followed by lesser weighted factor loadings by measures of circadian rhythm and metabolic health. The permutation test tests whether this component (consisting of the combination of factor loadings) can predict the outcome variable out of sample.

      We hope we have improved clarity on this in the manuscript by making the following edits to the Results section.

      Lines 248 – 251:

      “Permutation testing indicated the predictive value of the resulting component (with factor loadings described above) was significant out-of-sample (root-mean-squared error [RMSE]=0.203, p=.001).”

      Further, we hope to provide a more in-depth explanation of these results in the Methods section.

      Lines 755 – 759:

      “Statistical significance of obtained effects (i.e., the predictive accuracy of the identified component and factor loadings) was assessed by permutation tests, probing the proportion of root-mean-squared errors (RMSEs) indicating stronger or equally strong predictive accuracy under the null hypothesis.”

      In Section 2.5, the authors simply report "that chronotype showed effects of chronotype on reward sensitivity", but the direction of the effect (higher reward sensitivity in early vs. late chronotype) remains unclear.

      We thank the Reviewer for pointing this out. While we did report the direction of effect, this was only presented in the subsequent parentheticals and could have been made much clearer. To assist with this, we have made the following addition to the text.

      Lines 317 – 320:

      “Bayesian GLMs, controlling for age and gender, predicting task parameters by time-of-day and chronotype showed effects of chronotype on reward sensitivity (i.e. those with a late chronotype had a higher reward sensitivity; M= 0.325, 95% HDI=[0.19,0.46])”

      In Section 4.2, the authors write that they "implemented a previously-described procedure using Prolific pre-screeners", but no reference to this previous description is given.

      We thank the Reviewer for bringing our attention to this missing reference, which has now been added to the manuscript.

      In Supplementary Table S2, only the "on-diagonal correlations" are given, but off-diagonal correlations (indicative of trade-offs between parameters) would also be informative.

      We agree with the Reviewer that off-diagonal correlations between underlying and recovered parameters are crucial to assess confounding between parameters during model estimation. We reported this in figure S1D, where we present the full correlation matric between underlying and recovered parameters in a heatmap. We have now noticed that this plot was missing axis labels, which have been added now.

      I found it somewhat difficult to follow the results section without having read the methods section beforehand. At the beginning of the Results section, could the authors briefly sketch the outline of their study? Also, given they have a pre-registration, could the authors introduce each section with a statement of what they expected to find, and close with whether the data confirmed their expectations? In the current version of the manuscript, many results are presented without much context of what they mean.

      We agree a brief outline of the study procedure before reporting the results would be beneficial to following the subsequently text and have added the following to the end of our Introduction.

      Lines 101 – 106:

      “Here, we tested the relationship between motivational decision-making and three key neuropsychiatric syndromes: anhedonia, apathy, and depression, taking both a transdiagnostic and categorical (diagnostic) approach. To do this, we validate a newly developed effort-expenditure task, designed for online testing, and gamified to increase engagement. Participants completed the effort-expenditure task online, followed by a series of self-report questionnaires.”

      We have added references to our pre-registered hypotheses at multiple points in our manuscript.

      Lines 185 – 187:

      “In line with our pre-registered hypotheses, we found significant main effects for effort (F(1,14367)=4961.07, p<.0001) and reward (F(1,14367)=3037.91, p<.001), and a significant interaction between the two (F(1,14367)=1703.24, p<.001).”

      Lines 215 – 221:

      “Model comparison by out-of-sample predictive accuracy identified the model implementing three parameters (motivational tendency a, reward sensitivity , and effort sensitivity ), with a parabolic cost function (subsequently referred to as the full parabolic model) as the winning model (leave-one-out information criterion [LOOIC; lower is better] = 29734.8; expected log posterior density [ELPD; higher is better] = -14867.4; Fig. 31ED). This was in line with our pre-registered hypotheses.”

      Lines 252 – 258:

      “Bayesian GLMs confirmed evidence for psychiatric questionnaire measures predicting motivational tendency (SHAPS: M=-0.109; 95% highest density interval (HDI)=[-0.17,-0.04]; AES: M=-0.096; 95%HDI=[-0.15,-0.03]; DARS: M=-0.061; 95%HDI=[-0.13,-0.01]; Fig. 4A). Post-hoc GLMs on DARS sub-scales showed an effect for the sensory subscale (M=-0.050; 95%HDI=[-0.10,-0.01]). This result of neuropsychiatric symptoms predicting a lower motivational tendency is in line with our pre-registered hypothesis.”

      Lines 258 – 263:

      “For the MEQ (95%HDI=[-0.09,0.06]), MCTQ (95%HDI=[-0.17,0.05]), BMI (95%HDI=[-0.19,0.01]), and FINDRISC (95%HDI=[-0.09,0.03]) no meaningful relationship with choice biasmotivational tendency was found, consistent with the smaller magnitude of reported component loadings from the PLS regression. This null finding for dimensional measures of circadian rhythm and metabolic health was not in line with our pre-registered hypotheses.”

      Lines 268 – 270:

      “For reward sensitivity, the intercept-only model outperformed models incorporating questionnaire predictors based on RMSE. This result was not in line with our pre-registered expectations.”

      Lines 295 – 298:

      “As in our transdiagnostic analyses of continuous neuropsychiatric measures (Results 2.3), we found evidence for a lower motivational tendency parameter in the MDD group compared to HCs (M=-0.111, 95% HDI=[ -0.20,-0.03]) (Fig. 4B). This result confirmed our pre-registered hypothesis.”

      Lines 344 – 355:

      “Late chronotypes showed a lower motivational tendency than early chronotypes (M=-0.11, 95% HDI=[-0.22,-0.02])—comparable to effects of transdiagnostic measures of apathy and anhedonia, as well as diagnostic criteria for depression. Crucially, we found motivational tendency was modulated by an interaction between chronotype and time-of-day (M=0.19, 95% HDI=[0.05,0.33]): post-hoc GLMs in each chronotype group showed this was driven by a time-of-day effect within late, rather than early, chronotype participants (M=0.12, 95% HDI=[0.02,0.22], such that late chronotype participants showed a lower motivational tendency in the morning testing sessions, and a higher motivational tendency in the evening testing sessions; early chronotype: 95% HDI=[-0.16,0.04]) (Fig. 5A). These results of a main effect and an interaction effect of chronotype on motivational tendency confirmed our pre-registered hypothesis.”

      Lines 390 – 393:

      “Participants with an early chronotype had a lower reward sensitivity parameter than those with a late chronotype (M=0.27, 95% HDI=[0.16,0.38]). We found no effect of time-of-day on reward sensitivity (95%HDI=[-0.09,0.11]) (Fig. 5B). These results were in line with our pre-registered hypotheses.”

    1. Author response:

      The following is the authors’ response to the original reviews.

      Public Reviews:

      Reviewer #1 (Public Review):

      Strengths: 

      Overall the work is novel and moves the field of Alzheimer's disease forward in a significant way. The manuscript reports a novel concept of aberrant activity in VIP interneurons during the early stages of AD thus contributing to dysfunctions of the CA1 microcircuit. This results in the enhancement of the inhibitory tone on the primary cells of CA1. Thus, the disinhibition by VIP interneurons of Principal Cells is dampened. The manuscript was skillfully composed, and the study was of strong scientific rigor featuring well-designed experiments. Necessary controls were present. Both sexes were included.

      We express our gratitude to the reviewer for their keen appreciation of our efforts and their enthusiasm for the outcomes of this research.

      Limitations:

      (1) The authors attributed aberrant circuit activity to the accumulation of "Abeta intracellularly" inside IS-3 cells. That is problematic. 6E10 antibody recognizes amyloid plaques in addition to Amyloid Precursor Protein (APP) as well as the C99 fragment. There are no plaques at the ages 3xTg mice were examined. Thus, the staining shown in Figure 1a is of APP/C99 inside neurons, not abeta accumulations in neurons. At the ages of 3-6 months, 3xTg starts producing abeta oligomers and potentially tau oligomers as well (Takeda et al., 2013 PMID: 23640054; Takeda et al., 2015 PMID: 26458742 and others). Emerging literature suggests that abeta and tau oligomers disrupt circuit function. Thus, a more likely explanation of abeta and tau oligomers disrupting the activity of VIP neurons is plausible.

      The Reviewer correctly points out that 3xTg-AD mice typically do not exhibit plaques before 6 months of age, with limited amounts even up to 12 months, particularly in the hippocampus. To the best of our knowledge, the 6E10 antibody binds to an epitope in APP (682-687) that is also present in the Abeta (3-8) peptide. Consequently, 6E10 detects full-length APP, α-APP (soluble alpha-secretase-cleaved APP), and Abeta (LaFerla et al., 2007). Nonetheless, we concur with the Reviewer's observation that the detected signal includes Abeta oligomers and the C99 fragment, which is currently considered an early marker of AD pathology (Takasugi et al., 2023; Tanuma et al., 2023). Studies have demonstrated intracellular accumulation of C99 in 3-month-old 3xTg mice (Lauritzen et al., 2012), and its binding to the Kv7 potassium channel family, which results in inhibiting their activity (Manville and Abbott, 2021). If a similar mechanism operates in IS-3 cells, it could explain the changes in their firing properties observed in our study. Consequently, we have revised the manuscript to include this crucial information in both the Results and Discussion sections.

      (2) Authors suggest that their animals do not exhibit loss of synaptic connections and show Figure 3d in support of that suggestion. However, imaging with confocal microscopy of 70micron thick sections would not allow the resolution of pre- and post-synaptic terminals. More sensitive measures such as electron microscopy or array tomography are the appropriate techniques to pursue. It is important for the authors to either remove that data from the manuscript or address the limitations of their technique in the discussion section. There is a possibility of loss of synaptic connections in their mouse model at the ages examined.

      We appreciate the Reviewer’s perspective on the techniques used for imaging synaptic connections. While we acknowledge the limitations of confocal microscopy for resolving pre- and post-synaptic structures in thick sections, we respectfully disagree regarding the exclusive suitability of electron microscopy (EM). Our approach involved confocal 3D image acquisition using a 63x objective at 0.2 um lateral resolution and 0.25 Z-step, providing valuable quantitative insights into synaptic bouton density. Despite the challenges posed by thick sections, this method together with automatic analysis allows for careful quantification. Although EM offers unparalleled resolution, it presents challenges in quantification. We have included the important details regarding image acquisition and analysis in the revised manuscript.

      Reviewer #2 (Public Review):

      Summary:

      The submitted manuscript by Michaud and Francavilla et al., is a very interesting study describing early disruptions in the disinhibitory modulation exerted by VIP+ interneurons in CA1, in a triple transgenic model of Alzheimer's disease. They provide a comprehensive analysis at the cellular, synaptic, network, and behavioral level on how these changes correlate and might be related to behavioral impairments during these early stages of the disease.

      Main findings:

      - 3xTg mice show early Aß accumulation in VIP-positive interneurons.

      - 3xTg mice show deficits in a spatially modified version of the novel object recognition test. - 3xTg mice VIP cells present slower action potentials and diminished firing frequency upon current injection.

      - 3xTg mice show diminished spontaneous IPSC frequency with slower kinetics in Oriens / Alveus interneurons.

      - 3xTg mice show increased O/A interneuron activity during specific behavioral conditions. - 3xTg mice show decreased pyramidal cell activity during specific behavioral conditions.

      Strengths:

      This study is very important for understanding the pathophysiology of Alzheimer´s disease and the crucial role of interneurons in the hippocampus in healthy and pathological conditions.

      We are thankful to the reviewer for their insightful recognition of our efforts and their enthusiasm for the results of this research.

      Weaknesses:

      Although results nicely suggest that deficits in VIP physiological properties are related to the differences in network activity, there is no demonstration of causality.

      We completely agree with the reviewer's observation regarding the lack of demonstration of causality in our results. Investigating causality in the relationship between deficits in VIP physiological properties and differences in network activity is indeed a crucial aspect of this project. However, achieving this goal will require a significant amount of time and dedicated manipulations in a new mouse model (VIP-Cre-3xTg). We appreciate the importance of this line of investigation and consider it as a priority for our future research endeavors.

      Recommendations for the authors:

      Reviewer #1 (Recommendations for the authors):

      Limitations:

      (1) The authors should describe their model and state the age at which these mice start depositing amyloid plaques and neurofibrillary tangles. Readers might not be familiar with this model. It is also important to mention that circuit disruptions are assessed prior to plaque and tangle formation.

      We have included a detailed description of the 3xTg-AD mouse model in the Introduction section, including information on the age at which amyloid plaques and neurofibrillary tangles begin to appear. Additionally, we have clarified that circuit disruptions were assessed before the formation of plaques and tangles. These details have been added to both the Introduction and the Results sections to ensure clarity for readers unfamiliar with the model.

      (2) Ns are presented in Supplemental Table 1. Units are presented in a note to Supplementary Table 1. It would be advisable to specify Ns and units as the data is being presented in the results section or figure legends for easy access.

      We have now included the Ns (sample sizes), specifying the number of cells or sections and the number of experimental animals, directly within the Results section and in the figure legends. This ensures that readers have immediate access to this information without needing to refer to the supplementary materials.

      (3) Several typos require correction:

      a. "mamory" - Line 22, page 5.

      b. The term "Interneurons" is abbreviated as both "INs" and "IN" throughout the manuscript. The author should consistently choose one abbreviation.

      We have corrected the typo "mamory" to "memory" on line 22, page 5. Additionally, we have standardized the abbreviation for "Interneurons" to "INs" throughout the manuscript for consistency.

      (4) Note 2 in Supplementary Table 1 states that animals of both sexes with equal distribution were used throughout the study. It would be best for the reader to assess the data distribution based on sex. Thus, it is advisable for the authors to depict male and female data points as distinct symbols throughout the figures.

      Unfortunately, we do not have detailed sex-disaggregated data for all datasets, which limits our ability to depict male and female data points separately across all figures. Therefore, we have opted to pool data from both sexes for a more comprehensive analysis. We believe this approach maintains the robustness of our findings.

      Reviewer #2 (Recommendations for the authors):

      Major Points:

      - To keep the logical line of reasoning and to be able to interpret the results, it would be important to use the same metrics when comparing the population activity of O/A interneurons and principal cells in the different behavioral conditions.

      We have revised Figures 4 and 5 to enhance the coherence in data presentation. This includes using consistent metrics for comparing the population activity of both O/A interneurons and principal cells across different behavioral conditions. These changes ensure a clearer and more logical interpretation of the results.

      - Although results nicely suggest that deficits in VIP physiological properties are related to the differences in network activity, there is no demonstration of causality. Would it be possible to test if manipulating VIP neurons one could obtain such specific results? Alternatively, it could be discussed more in detail how the decrease in disinhibition could lead to the changes in network activity demonstrated here.

      We agree with the reviewer that establishing causality between VIP neuron deficits and changes in network activity would be very important. However, demonstrating causality would require a new line of investigation, involving the use of specific mouse models to selectively manipulate VIP neurons. This is an exciting direction that we plan to prioritize in our future research. For this study, we have included a discussion on the potential mechanisms by which decreased disinhibition might lead to the observed changes in network activity. Specifically, we propose that in young adult 3xTg-AD mice, the altered firing of I-S3 cells may lead to enhanced inhibition of principal cells. This could shift the excitation/inhibition balance, input integration and firing output of principal cells thereby impacting overall network activity. These points are discussed in detail in the revised Discussion section.

      - On the same lines the correlations showed in the manuscript, would be more robust if there was an in vivo demonstration that 3xTg mice indeed show decreased activity in vivo. The same experiments could also clarify if VIP cells in control animals are more active at the time of decision-making and during object exploration as suggested in the manuscript.

      Thank you for your comment. In response to the point raised, we would like to highlight that we have recently documented the increased activity of VIP-INs in the D-zone of the T-maze and during object exploration in a study published in Cell Reports (Tamboli et al., 2024). This publication is now referenced in our manuscript to support our findings. Regarding the in vivo activity of 3xTg mice, our observations indicated no significant differences in major behavioral patterns such as locomotion, rearing, and exploration of the T-maze when comparing Tg and non-Tg mice. These findings are presented in detail in Figure 4c and Supplementary Fig. 5. We believe these data support the robustness of our correlations by demonstrating that the overall behavioral activity of 3xTg mice is comparable to that of non-transgenic controls, thus focusing attention on the specific roles of VIP-INs in early prodromal state of AD pathology.

      Minor Points:

      - Figure 1c: Heading of VIP-Tg should have capital letters.

      Thank you for pointing that out. We have corrected the heading to "VIP-Tg" with capital letters in Figure 1c.

      - Figure 1d: The finding that no change was observed in the percentage of VIP+/CR+ is based on three animals and 3-4 slices per mouse. However, the result of VIP+CR+ in tg-mice has an outlier that might bias the results. I would suggest increasing the number of animals to confirm these results.

      Thank you for your insightful suggestion. We addressed the potential impact of the outlier in the VIP+/CR+ cell density analysis by recalculating the results after removing the outlier using the interquartile range method. This reanalysis revealed a statistically significant difference in the VIP+/CR+ cell density between non-Tg and Tg mice, which we have now detailed in the Results section. Despite this, we have chosen to retain the outlier in our final presentation to accurately represent the biological variability observed in our sample. We agree that increasing the number of animals would further validate these findings and will consider this in future studies.

      - Figure 3d: Would it be possible to identify the recorded interneurons? Is it expected that most of those are OLM cells?

      Thank you for your question. We were unable to fully recover all recorded cells using biocytin staining. However, for those cells with preserved axonal structures, we identified both OLM and bistratified cells, which are the primary targets of I-S3 cells. We have now included this information in the Results section to clarify the types of interneurons identified.

      - Figure 3: Why quantify VGat terminals instead of quantification of VIP-GFP terminals? Combined with the Calretinine labeling it would be more useful to indicate that no changes were observed at the morphological bouton level specifically in disinhibitory interneurons. Please also describe which imageJ plugin was used for the quantification.

      Thank you for your question. Our primary objective was to quantify the synaptic terminals of CR+ INs in the CA1 O/A region, which are predominantly formed by I-S3 cells. Therefore, VGaT and CR co-localization was used to guide this analysis. GFP expression in axonal boutons can sometimes be inconsistent and less reliable for precise quantification. For this analysis, we utilized the “Analyze Particles” function in ImageJ, combined with watershed segmentation, which is now specified in the Methods section.

      -  Figure 4g: How was the statistical test performed? If data was averaged across mice, please add error bars and data points in the figure.

      Thank you for your question. To compare the alternation percentage between non-Tg and Tg mice, we used Fisher’s Exact test as detailed in Supplementary Table 1. In this analysis, we considered each animal's choice individually, comparing the preference for correct versus incorrect choices between the two groups. Since Fisher’s Exact test is designed for analyzing qualitative data rather than quantitative data, averaging across mice was not applicable, and therefore, we did not include error bars or data points in the figure.

      - Figure 4h: To conclude that the increase in activity is larger in the 3xTg mice, there should be a statistical comparison for the magnitude of change between the decision and the stem zone for control and 3xTg mice. To show that there is no significant difference in this measurement in the control mice is insufficient.

      Thank you for your suggestion. We performed a statistical comparison of the magnitude of change in activity between the stem zone and the D-zone for non-Tg and 3xTg mice, as recommended. Our analysis showed no significant difference in this magnitude of change between the two genotypes. These results have now been included in the Results section. However, we would like to highlight an important finding regarding the nature of these changes. In the 3xTg mice, there was a consistent increase in the activity of O/A INs when entering the Dzone. In contrast, non-Tg mice displayed a range of responses, including both increases and decreases in activity. This indicates a higher reliability in the firing of O/A INs in the D-zone of 3xTg mice. Our recent study suggests that VIP-INs are particularly active in the D-zone (Tamboli et al., 2024). Therefore, the absence or reduced input from VIP-INs in 3xTg mice may lead to the observed higher engagement of O/A INs in this zone. We believe this observation is crucial for understanding the differential yet nuanced changes in neural dynamics in these mice.

      - In the methods, it is stated that there was a pre-selection of animals depending on learning performance. Would it be possible to also show the data from animals that did not properly learn? Alternatively, it would be useful to plot the correlation between performance in this test and the difference between activity in the stem and the decision-making zone. The reason to ask for this is that there is a trend for control animals to show reduced alternations (50 vs 80%, although not significant, it is a big difference). Considering that there is also a trend in control animals to show increased activity in the decision-making zone, it would be important to confirm that this is not only due to differences in performance. The current statistical procedure does not allow discarding this.

      In this study, we excluded from the analysis the animals that refused to explore the T-maze and spent all their time in the stem corner, or refused to explore the objects and stayed in the open field maze (OFM) corner. These exclusions applied to both non-Tg (n = 6) and Tg (n = 5) groups, indicating that low exploratory activity is not necessarily linked to AD-related mutations. During the T-maze test, we also observed several animals that made incorrect choices (4 out of 9 non-Tg and 1 out of 6 Tg mice). However, due to the low number of animals making incorrect choices, we were unable to form a separate group for analysis based on incorrect choices. These details are now provided in the Methods section.

      - Figure 4i. It is not clear when exactly cell activity was measured. If it was during the entire recording time, I think it would be interesting to see if the activity of O/A interneurons is different specifically during interaction with the object in 3xTg mice.

      Cell activity was indeed measured throughout the entire recording session and analyzed in relation to animal behavior (immobility to walking; Fig. 4d,e), and periods specifically related to interaction with objects were extracted for analysis (Figure 4i).

      - Why was the object modulation measured during a different task in which both objects were the same? The figure is misleading in that sense, as it suggests the experiment was the same as for the other panels with two different objects. It would be important to correct this if the authors want to correlate the deficits in NOR in 3xTg mice and changes in IN activity.

      The study specifically investigated object-modulated neural activity during the Sampling phase. Therefore, two identical objects were placed in the arena for animal exploration. As mentioned above, due to several animals failing to explore the OFM and objects on the second day, they were excluded from the analysis, preventing the conduct of the novel-object exploration Test Trial. Both non-Tg and Tg mice showed a lack of exploration in the OFM and Tmaze, for reasons that remain unclear. Consequently, we opted to present robust data on neural activity during the initial sampling of two identical objects. However, further investigation is needed to understand how this activity relates to deficits observed in the classical NOR test.

      - Figure. 5c-f. I would strongly suggest performing the same quantification and displaying similar figures for the fiber photometry experiments in interneurons and principal cells. It would help to interpret the data.

      We have taken the reviewer's suggestion into account and standardized the data analysis and presentation. Figures 4d, e and 5c, d now depict the walk-induced activity in INs and PCs, respectively. Figures 4h and 5f compare activity between the stem and D-zone in the T-maze. Additionally, Figures 4j and 5h illustrate the object modulation of INs and PCs, respectively.

      - Although velocity and mobility were quantified, it would be important to show also that they are not different during those times when activity was dissimilar, as in the decision zone.

      We have analyzed these data and found no significant differences between the two genotypes in terms of velocity and mobility during these periods. This analysis is now presented in Supplementary Figure 5e, f and detailed in the Results section.

      - Figure 5g-h. Similarly, I would suggest using the same metrics in order to correlate the results from interneuron and principal cell activity photometry.

      We have updated this figure to align with the presentation of interneurons (Figure 4j) and included RMS analysis to emphasize lower variance in object modulation of PCs as an indicator of increased network inhibition.

      - Was object modulation variance also different for INs depending on the mouse phenotype?

      We conducted this additional analysis but did not find any significant difference.

      - Figure S4: would it be possible to identify the postsynaptic partners?

      As mentioned above, for those cells with preserved axonal structures, we identified both OLM and bistratified cells. We have now included this information in the Results section to clarify the types of interneurons identified.

    1. Author response:

      The following is the authors’ response to the original reviews.

      Public Reviews:

      Reviewer #1 (Public Review):

      In this study, the authors address a fundamental unresolved question in cerebellar physiology: do synapses between granule cells (GCs) and Purkinje cells (PCs) made by the ascending part of the axon (AA) have different synaptic properties from those made by parallel fibers? This is an important question, as GCs integrate sensorimotor information from numerous brain areas with a precise and complex topography.

      Summary:

      The authors argue that CGs located close to PCs essentially contact PC dendrites via the ascending part of their axons. They demonstrate that joint high-frequency (100 Hz) stimulation of distant parallel fibers and local CGs potentiates AA-PC synapses, while parallel fiber-PC synapses are depressed. On the basis of paired-pulse ratio analysis, they concluded that evoked plasticity was postsynaptic. When individual pathways were stimulated alone, no LRP was observed. This associative plasticity appears to be sensitive to timing, as stimulation of parallel fibers first results in depression, while stimulation of the AA pathway has no effect. NMDA, mGluR1 and GABAA receptors are involved in this plasticity.

      Strengths:

      Overall, the associative modulation of synaptic transmission is convincing, and the experiments carried out support this conclusion. However, weaknesses limit the scope of the results.

      Weaknesses:

      One of the main weaknesses of this study is the suggestion that high-frequency parallel-fiber stimulation cannot induce long term potentiation unless combined with AA stimulation. Although we acknowledge that the stimulation and recording conditions were different from those of other studies, according to the literature (e.g. Bouvier et al 2016, Piochon et al 2016, Binda et al, 2016, Schonewille et al 2021 and others), high-frequency stimulation of parallel fibers leads to long-term postsynaptic potentiation under many different experimental conditions (blocked or unblocked inhibition, stimulation protocols, internal solution composition). Furthermore, in vivo experiments have confirmed that high-frequency parallel fibers are likely to induce long-term potentiation (Jorntell and Ekerot, 2002; Wang et al, 2009).

      This article provides further evidence that long-term plasticity (LTP and LTD) at this connection is a complex and subtle mechanism underpinned by many different transduction pathways. It would therefore have been interesting to test different protocols or conditions to explain the discrepancies observed in this dataset.

      Even though this is not the main result of this study, we acknowledge that the control experiments done on PF stimulation add a puzzling result to an already contradictory literature. High frequency parallel fibre stimulation (in isolation) has been shown to induce long term potentiation in vitro, but not always, and most importantly, this has been shown in vivo. This was the reason for choosing that particular stimulation protocol. Examination of in vitro studies, however, show that the results are variable and even contradictory. Most were done in the presence of GABAA receptor antagonists, including the SK channel blocker Bicuculline, whereas in the study by Binda (2016), LTP was blocked by GABAA receptor inhibition. In some studies also, LTP was under the control of NMDAR activation only, whereas in Binda (2016), it was under the control of mGluR activation. Moreover, most experiments were done in mice, whereas our study was done in rats. Our results reveal multiple mechanisms working together to produce plasticity, which are highly sensitive to in vitro conditions. We designed our experiments to be close to the physiological conditions, with inhibition preserved and a physiological chloride gradient. It is likely that experimental differences have given rise to the variability of the results and our inability to reproduce PF-LTP, but it was not the aim of this study to dissect the subtleties of the different experimental protocols and models.

      We have modified the Discussion to cover that point fully.

      Another important weakness is the lack of evidence that the AAs were stimulated. Indeed, without filling the PC with fluorescent dye or biocytin during the experiment, and without reconstructing the anatomical organization, it is difficult to assess whether the stimulating pipette is positioned in the GC cluster that is potentially in contact with the PC with the AAs. According to EM microscopy, AAs account for 3% of the total number of synapses in a PC, which could represent a significant number of synapses. Although the idea that AAs repeatedly contact the same Purkinje cell has been propagated, to the best of the review author's knowledge, no direct demonstration of this hypothesis has yet been published. In fact, what has been demonstrated (Walter et al 2009; Spaeth et al 2022) is that GCs have a higher probability of being connected to nearby PCs, but are not necessarily associated with AAs.

      We fully agree with the reviewer that we have not identified morphologically ascending axon synapses, and we stress this fact both in the first paragraph of the Results section, and again at the beginning of Discussion. Our point is mainly topographical, given the well documented geometrical organisation of the cerebellar cortex. Strictly speaking, inputs are local (including AAs) or distal (PFs). Similarly, the studies by Isope and Barbour (2002) and Walter et al. (2009), just like Sims and Hartell (2005 and 2006), have coined the term ‘ascending axon’ when drawing conclusions about locally stimulated inputs. Moreover, our results do not rely on or assume multiple contacts, stronger connections, or higher probability of connections between ascending axons and Purkinje cells. Our results only demonstrate a different plasticity outcome for the two types of inputs. Therefore, our manuscript could be rephrased with the terms ‘local’ and ‘distal’ granule cell inputs, but this would have no more implication for the results or the computation performed in Purkinje cells. However, in our experience, these terms are more confusing, and consistent with the literature, we do not wish to make this modification. However, we have modified the abstract of the manuscript to clarify this point.

      Reviewer #2 (Public Review):

      Summary:

      The authors describe a form of synaptic plasticity at synapses from granule cells onto Purkinje cells in the mouse cerebellum, which is specific to synapses proximal to the cell body but not to distal ones. This plasticity is induced by the paired or associative stimulation of the two types of synapses because it is not observed with stimulation of one type of synapse alone. In addition, this form of plasticity is dependent on the order in which the stimuli are presented, and is dependent on NMDA receptors, metabotropic glutamate receptors and to some degree on GABAA receptors. However, under all experimental conditions described, there is a progressive weakening or run-down of synaptic strength. Therefore, plasticity is not relative to a stable baseline, but relative to a process of continuous decline that occurs whether or not there is any plasticity-inducing stimulus.

      As highlighted by the reviewer, we observed a postsynaptic rundown of the EPSC amplitude for both input pathways. Rundown could be mistaken for a depression of synaptic currents, not for a potentiation, and the progressive decrease of the EPSC amplitude during the course of an experiment leads to an underestimate of the absolute potentiation. We have taken the view to provide a strong set of control data rather than selecting experiments based on subjective criteria or applying a cosmetic compensation procedure. We have conducted control experiments with no induction (n = 17), which give a good indication of the speed and amplitude of the rundown. Comparison shows a highly significant potentiation of the ascending axon EPSC. Depression of the parallel fibre EPSC, on the other hand, was not significantly different from rundown, and we have not spoken of parallel fibre long term depression. The data show thus very clearly that ascending axon and parallel fibre synapses behave differently following the costimulation protocol.

      Strengths:

      The focus of the authors on the properties of two different synapse-types on cerebellar Purkinje cells is interesting and relevant, given previous results that ascending and parallel fiber synapses might be functionally different and undergo different forms of plasticity. In addition, the interaction between these two synapse types during plasticity is important for understanding cerebellar function. The demonstration of timing and order-dependent potentiation of only one pathway, and not another, after associative stimulation of both pathways, changes our understanding of potential plasticity mechanisms. In addition, this observation opens up many new questions on underlying intracellular mechanisms as well as on its relevance for cerebellar learning and adaptation.

      Weaknesses and suggested improvements:

      A concern with this study is that all recordings demonstrate "rundown", a progressive decrease in the amplitude of the EPSC, starting during the baseline period and continuing after the plasticity-induction stimulus. In the absence of a stable baseline, it is hard to know what changes in strength actually occur at any set of synapses. Moreover, the issues that are causing rundown are not known and may or may not be related to the cellular processes involved in synaptic plasticity. This concern applies in particular to all the experiments where there is a decrease in synaptic strength.

      We have provided an answer to that point directly below the summary paragraph. We will just add here that if the phenomenon causing rundown was involved in plasticity, it should affect plasticity of both inputs, which was not the case, clearly distinguishing the ascending axon and parallel fibre inputs.

      The authors should consider changes in the shape of the EPSC after plasticity induction, as in Fig 1 (orange trace) as this could change the interpretation.

      Figure 1 shows an average response composed of evoked excitatory and inhibitory synaptic currents. The third section of Supplementary material (supplementary figure 3) shows that this complex shape is given by an EPSC followed by a delayed disynaptic IPSC. We would like to point out that while separating EPSC from IPSC might appear difficult from average traces due to the averaged jitter in the onset of the synaptic currents, boundaries are much clearer when analysing individual traces. In the same section we discuss the results of experiments in which transient applications of SR 95531 before and after the induction protocol allowed us to measure the EPSC, while maintaining the same experimental conditions during induction. Analysis of the kinetics of the EPSCs during SR application at the beginning and end of experiments, showed that there is no change in the time to peak of both AA and PF response. The decay time of AA- and PF-EPSCs are slightly longer at the end of the experiment, even if the difference is not significant for AA inputs. This analysis has been added to the Supplementary material. Our analysis, that uses as template the EPSCs kinetics measured at the beginning and at the end of the experiments, takes directly into account these changes. The results show clearly that the presence of disynaptic inhibition doesn’t significantly affect the measure of the peak EPSC after the induction protocol nor the estimate of plasticity.

      In addition, the inconsistency with previous results is surprising and is not explained; specifically, that no PF-LTP was induced by PF-alone repeated stimulation.

      In our experimental conditions, PF-LTP was not induced when stimulating PF only, the condition that reproduces experiments in the literature. As discussed in our response to reviewer 1, a close look at the literature, however, reveals variabilities and contradictions behind seemingly similar results. They reveal intricate mechanisms working together to produce plasticity, which are sensitive to in vitro conditions. We designed our experiments to be close to physiological conditions, with inhibition preserved and a physiological chloride gradient. It is likely that experimental differences have given rise to the variability of the results and our inability to observe PF-LTP. We have modified the Discussion section to cover that point thoroughly in the context of past results. 

      The authors test the role of NMDARs, GABAARs and mGluRs in the phenotype they describe. The data suggest that the form of plasticity described here is dependent on any one of the three receptors. However, the location of these receptors varies between the Purkinje cells, granule cells and interneurons. The authors do not describe a convincing hypothetical model in which this dependence can be explained. They suggest that there is crosstalk between AA and PF synapses via endocannabinoids downstream of mGluR or NO downstream of NMDARs. However, it is not clear how this could lead to the long-term potentiation that they describe. Also, there is no long-lasting change in paired-pulse ratio, suggesting an absence of changes in presynaptic release.

      We suggest in the result section that the transient change in paired pulse ratio (PPR) is linked to a transient presynaptic effect, but there was no significant long term change of the PPR, suggesting that the long term effects observed are linked to postsynaptic changes. We now stress this point in the Results and Discussion sections.

      Concerning the involvement of multiple molecular pathways, investigators often tested for the involvement of NMDAR or mGluRs in cerebellar plasticity, rarely both. Here we showed that both pathways are involved. The conjunctive requirement for NMDAR and mGluR activation could easily be explained based on the dependence of cerebellar LTP and LTD on the concentrations of both NO and postsynaptic calcium (Coesman et al., 2004; Safo and Regehr, 2005; Bouvier et al., 2016; Piochon et al., 2016).

      We also observed an effect of GABAergic inhibition. GABAergic inhibition was elegantly shown by Binda (2016) to regulate calcium entry together with mGluRs, and control plasticity induction. A similar mechanism could contribute to our results, although inhibition might have additional effects. We have modified the Discussion of the manuscript to clarify the pathways involved in plasticity and added a diagram to highlight the links between the different molecular pathways, potential cross talk mechanisms, and the location of receptors.

      Is the synapse that undergoes plasticity correctly identified? In this study, since GABAergic inhibition is not blocked for most experiments, PF stimulation can result in both a direct EPSC onto the Purkinje cell and a disynaptic feedforward IPSC. The authors do address this issue with Supplementary Fig 3, where the impact of the IPSC on the EPSC within the EPSC/IPSC sequence is calculated. However, a change in waveform would complicate this analysis. An experiment with pharmacological blockade will make the interpretation more robust. The observed dependence of the plasticity on GABAA receptors is an added point in favor of the suggested additional experiments.

      We did consider that due to long recording times there might be kinetic changes, and that’s the reason why the experiments of Supplementary figure 3 were done with pharmacological blockade of GABAAR with SR, both before and again after LTP induction. The estimate of the amplitude of the EPSC is based on the actual kinetics of the response at both times.

      A primary hypothesis of this study is that proximal, or AA, and distal, or PF, synapses are different and that their association is specifically what drives plasticity. The alternative hypothesis is that the two synapse-types are the same. Therefore, a good control for pairing AA with PF would be to pair AA with AA and PF with PF, thereby demonstrating that pairing with each other is different from pairing with self.

      Pairing AA with AA would be difficult because stimulation of AA can only be made from a narrow band below the PC and we would likely end up stimulating overlapping sets of synapses. However, Figure 5 shows the effect of stimulating PF and PF, while also mimicking the sparse and dense configuration of the control experiment. It shows that sparse PF do not behave like AA. Sims and Hartell (2006) also made an experiment with sparse PF inputs and observed clear differences between sparse local (AA) and sparse distal (PF) synapses.

      It is hypothesized that the association of a PF input with an AA input is similar to the association of a PF input with a CF input. However, the two are very different in terms of cellular location, with the CF input being in a position to directly interact with PF-driven inputs. Therefore, there are two major issues with this hypothesis: 1) how can subthreshold activity at one set of synapses affect another located hundreds of micrometers away on the same dendritic tree? 2) There is evidence that the CF encodes teaching/error or reward information, which is functionally meaningful as a driver of plasticity at PF synapses. The AA synapse on one set of Purkinje cells is carrying exactly the same information as the PF synapses on another set of Purkinje cells further up and down the parallel fiber beam. It is suggested that the two inputs carry sensory vs. motor information, which is why this form of plasticity was tested. However, the granule cells that lead to both the AA and PF synapses are receiving the same modalities of mossy fiber information. Therefore, one needs to presuppose different populations of granule cells for sensory and motor inputs or receptive field and contextual information. As a consequence, which granule cells lead to AA synapses and which to PF synapses will change depending on which Purkinje cell you're recording from. And that's inconsistent with there being a timing dependence of AA-PF pairing in only one direction. Overall, it would be helpful to discuss the functional implications of this form of plasticity.

      We do not hypothesise that association of the AA and PF inputs is similar to the association of PF and climbing fibre inputs. We compare them because it is the other known configuration triggering associative plasticity in Purkinje cells. It is indeed interesting to observe that even if the inputs are very small compared to the powerful climbing fibre input, they can be effective at inducing plasticity. Physiologically, the climbing fibre signal has been linked to error and reward signals, but reward signals are also encoded by granule cell inputs (Wagner et al., 2017). We have modified the discussion to make sure that we do not suggest equivalence with CF induced LTD.

      Moreover, we fully agree that AA and PF synapses made up by a given granule cell carry the same information, and cannot encode sensory and motor information at the same time. AA synapses from a local granule cell deliver information about the local receptive field, but PF synapses from the same granule cell will deliver contextual information about that receptive field to distant Purkinje cells. In the context of sensorimotor learning, movement is learnt with respect to a global context, not in isolation, therefore learning a particular association must be relevant. The associative plasticity we describe here could help explain this functional association. We have clarified the discussion.

      Reviewer #3 (Public Review):

      Granule cells' axons bifurcate to form parallel fibers (PFs) and ascending axons (AAs). While the significance of PFs on cerebellar plasticity is widely acknowledged, the importance of AAs remains unclear. In the current paper, Conti and Auger conducted electrophysiological experiments in rat cerebellar slices and identified a new form of synaptic plasticity in the AA-Purkinje cell (PC) synapses. Upon simultaneous stimulation of AAs and PFs, AA-PC EPSCs increased, while PFs-EPSCs decreased. This suggests that synaptic responses to AAs and PFs in PCs are jointly regulated, working as an additional mechanism to integrate motor/sensory input. This finding may offer new perspectives in studying and modeling cerebellum-dependent behavior. Overall, the experiments are performed well. However, there are two weaknesses. First, the baseline of electrophysiological recordings is influenced significantly by run-down, making it difficult to interpret the data quantitatively. The amplitude of AA-EPSCs is relatively small and the run-down may mask the change. The authors should carefully reexamine the data with appropriate controls and statistics. Second, while the authors show AA-LTP depends on mGluR, NMDA receptors, and GABA-A receptors, which cell types express these receptors and how they contribute to plasticity is not clarified. The recommended experiments may help to improve the quality of the manuscript.

      As highlighted by the reviewer and developed above in response to reviewer 2, we observed a postsynaptic rundown of the EPSC amplitude. Rundown could be mistaken for a depression of synaptic currents, not for a potentiation. Moreover, we have conducted control experiments with no induction (n = 17), which give a good indication of the speed and amplitude of the rundown, and provide a baseline. Comparison shows a highly significant potentiation of the ascending axon EPSC, relative to baseline and relative to these control experiments. Depression of the parallel fibre EPSC on the other hand was not significantly different from rundown. For that reason we have not spoken of parallel fibre long term depression. The data, however, show that ascending axon and parallel fibre synapses behave very differently following the costimulation protocol.

      We have discussed above in our response to reviewer 2 the potential involvement of mGluRs, NMDARs and GABAARs. We have clarified the discussion of the pathways involved in plasticity and added a diagram to highlight the links between the different molecular pathways, potential cross talk mechanisms, and the location of receptors.

      Recommendations for the authors:

      Reviewer #1 (Recommendations For The Authors):

      - If Chloride concentration cannot be modified, recordings should be performed at the Chloride reversal potential to avoid strong bias in amplitude measurements (e.g. in Figures 3 and 5 outward current was observed while not visible in Figures 1 and 4.

      The balance between excitation and inhibition dictates whether there is a visible outward component, and this varies with the connections tested. Careful control experiments with SR application presented in supplementary figure 3 show that the delay of the IPSC does not significantly affect measurement of the peak amplitude of the EPSC. The reversal potential for Clin our study (-85 mV), chosen to reproduce the physiological gradient in Purkinje cells, is too low to record from Purkinje cells at this potential in good conditions as it activates the hyperpolarisation activated cation current Ih, generating huge inward currents.

      - It is not clear whether, during the current clamp, the potential was maintained at -65 mV throughout the induction protocol.

      The potential was set and maintained around -65mV during the induction protocol. The method section has been amended to specify that point.

      - Experiments using GABAB or endocannabinoid antagonists would have been interesting to assess the role of presynaptic plasticity occluding postsynaptic plasticity.

      We are not sure why the reviewer suggested these particular experiments to test for the role of presynaptic plasticity. GABAB and endocannabinoid receptor activation both have presynaptic effects at granule cell to Purkinje cell synapses. They decrease release probability, and as a result increase the paired pulse ratio (Dittman and Regehr, 1997; Safo and Regehr, 2005). Here we only observed a transient decrease of the paired pulse ratio. Additionally, presynaptic endocannabinoid receptor activation, linked to postsynaptic mGluR1 activation and release of endocannabinoids, was shown to be required for induction of postsynaptic PF-LTD (Safo and Regehr, 2005). This effect required climbing fibre stimulation and mGluR activation. Here we show that mGluR1 inhibition did not inhibit the PF depression nor affect the transient change in PPR. Therefore there is no indication that activation of these receptors could induce a pre-synaptic depression occluding postsynaptic plasticity.

      - To give credit to this new plasticity in contradiction with many previous studies, induction pathways should be addressed more deeply.

      As developed earlier in response to the public review, this study does not contradict previous studies, expect maybe that by Binda et al., (2016), conducted on mice. From our point of view, our study in fact reconciles past results which have alternatively involved the mGluR or NMDAR pathways, whereas the molecular downstream pathways they recruit can easily cooperate. We aim to describe a new phenomenon and we cannot cover the mechanistic dissection which has been performed to date on plasticity in the cerebellar cortex.

      - The quality of the figures could be enhanced by modifying the dashed line.

      We have made the dashed line more discrete.

      Reviewer #2 (Recommendations For The Authors):

      - Is there cross-talk between the two synaptic pathways?

      In order to explain the associative nature of AA-LTP we suggest that a signal is generated at the AA input during the induction protocol only when the PF input is also stimulated, i.e. a form of cross-talk takes place between the two synaptic territories. We have not tested for cross-talk during control conditions but we discuss the fact that given the size of the Purkinje cell dendritic tree, the size of the inputs and their geometrical configuration, it is highly unlikely. We discuss possible cross-talk mechanisms.

      - Clarification question: "While the peak amplitude of the first response in the pair of stimulations showed a progressive decline, the peak amplitude of the second response of both AA and PF underwent either LTP or LTD respectively..." Does this mean that all LTP/LTD figures show the amplitude of the second EPSC in the paired pulse stimulation, and that the first EPSC has a different response? If so, this should be mentioned in the Methods section and implications discussed.

      All figures show both the amplitude of the first and second EPSCs in the pair of stimulations. In Figure 1A, 3A, 4A and 5B the paired stimulation protocol is depicted with colours and symbols used in the associated graphs, with closed symbols for the first and open symbols for the second EPSC. Figure legends have been amended to clarify this point. The average values given in the Results section and figure legends relate to the first EPSC only for clarity. As can be seen from the figures, long term plasticity affected the first and second EPSC in a very similar manner. However, individual symbols show that during a transient period, the first and second EPSCs are differentially affected by the induction protocol, resulting in a transient change of the PPR.

      Minor suggestions:

      - It would be helpful to have a reference for the statement that 1-2% of stimulated fibers come from nearby GCs when stimulation is distal.

      We have modified the text to explain our calculation based on the data of Pichitpornchai et al., 1994. P4 result section.

      - Does the shading over the plasticity time course traces come from the standard error of the mean?

      Shading over the plasticity time course plots shows the standard error of the mean. This is now clearly stated in figure legends.

      Reviewer #3 (Recommendations For The Authors):

      Major points:

      (1) Whether the plasticity between AAs and PCs is regulated by the post-synaptic or pre-synaptic mechanisms should be addressed or discussed. Based on the results of PPR (mostly unchanged after induction), the post-synaptic mechanism may be more significant. Supplemental Figure 2C shows a trend toward a positive correlation between AALTP and the number of spikes, suggesting intracellular calcium levels in the post-synaptic Purkinje cells may be important. Whether this is true or not can be directly tested by the addition of BAPTA in the recording pipettes.

      The absence of a long lasting effect on the paired pulse ratio (PPR) indicates that postsynaptic mechanisms are involved in long term changes. This is in line with the dependence of plasticity induced with similar protocols on the concentrations of NO and postsynaptic calcium, both affecting postsynaptic targets, as developed in our response to reviewer 2. BAPTA interferes with calcium and mGluR signalling, and could be used to further confirm the involvement of a postsynaptic mechanism, however, we did not wish to pursue further the dissection of the signalling cascade. We have modified the Results and Discussion sections to include a discussion of pre and postsynaptic mechanisms.

      (2) Most results from the plasticity experiments are shown as average/sem and do not include individual data, making ithard to appreciate the magnitude of the changes. The authors could show the individual data at some time points (e.g. 5 min before and 30 min after induction), plot bar-graphs (Figure 2C with individual data), or boxplots to compare different conditions and perform statistics.

      Individual data points are now visible for plasticity induction in Figure 2C and Supplementary Figure 2 for a number of conditions. Statistics have been performed as detailed in the text and legend of Fig 2.

      (3) In addressing point #2, it is strongly recommended that the authors include the values for controls without inductionbecause AA/PF-EPSCs undergo significant run-down. In most experiments, the authors compare the magnitude of plasticity with baseline changes in Supplemental Figure 1. This should not be appropriate for some experiments, such as Figures 3 & 4, where pharmacological treatments are performed. The authors should carefully consider including the appropriate controls from baseline recording to rule out significant confound by the run-down.

      We agree that control experiments without stimulation (no Stim) are only appropriate controls for the initial synchronous stimulation and AA and PF only experiments (Fig 1). All the other experiments were compared to the synchronous stimulation experiments, not to control No Stim. The synchronous stimulation protocol is strictly the same as that applied in experiments with pharmacological treatments and the appropriate control to test whether treatments affected plasticity. This is now systematically specified in the Results section.

      (4) The authors recorded mixed EPSC/IPSCs and used a fitting approach to extract EPSCs. Applying AMPA-receptor blockers to check that extracted IPSCs are correctly predicted may solidify the reliability of the approach. An additional concern is that this approach can only be used if the waveform of EPSC/IPSC does not change with plasticity. The authors should compare the waveforms between conditions to address this point.

      Fits were not used to extract EPSCs. EPSCs were isolated by blocking IPSCs with SR95531, and the IPSCs were then extracted by subtraction from the mixed EPSC/IPSC. Fits were then done of the isolated EPSC and the extracted IPSC. This procedure was applied both at the start of the experiment and at the end to avoid changes in kinetics that would influence measurements. A section of supplementary material is devoted to this analysis. Isolating IPSCs using AMPAR blockers is not possible as IPSCs are disynaptic. AMPAR blockers would fully suppress inhibition.

      (5) While the AA-LTP depends on NMDA-Rs, which cell type is responsible is not clear. Recording NMDA components in AA/PF-EPSCs should be informative in addressing this point. Cesana et al suggested that AA induces significant activation of NMDA-Rs in Golgi cells (PMID: 23884948). Whether AA stimuli could significantly evoke NMDA current in the experimental condition used in this paper could provide essential information.

      The granule cell to Purkinje cell EPSCs are devoid of an NMDAR component (Llano et al., 1991), and there is no postsynaptic NMDARs at granule cell to PC synapses, but a proportion of presynaptic boutons show the presence of NMDARs (Bidoret et al, 2009). This is now stated clearly on p8.  Presynaptic NMDAR have been involved in LTP and LTD of parallel fibre synapses (Casado et al., 2002; Bouvier et al., 2016; Schonewille et al., 2021), and linked to the activation of NOS in granule cell axons. However, we do not know whether presynaptic NMDARs are also present at AA synapses. NMDAR and NOS are also expressed by molecular layer interneurons, and have sometimes been involved in LTD induction (Kono et al., 2019), although this is disputed. In the paper by Cesana (2013), white matter stimulation activated mossy fibre inputs to granule cells, and as a consequence, granule cell to Golgi cell disynaptic EPSCs. The authors identified AA synapses on the basolateral dendrites of Golgi cells, and showed NMDAR activation associated with the mossy fibre to granule cell EPSC. Granule cell to Golgi cell synapses were shown to activate both postsynaptic AMPA and NMDA receptors (Dieudonné, 1999). But to our knowledge, Golgi cells do not express NOS. Therefore it is unlikely that activation of NMDARs in Golgi cells is linked to synaptic plasticity in Purkinje cells.

      (6) Pharmacological experiments in Figure 3 show that AA-LTP is dependent on mGluR. The authors mentioned that it could be explained by the presence and absence of mGluRs in PFs and AAs, respectively. This is an important and reasonable possibility and should be tested. The authors could simply check whether slow EPSCs can be recorded by the AA activation.

      Activation of the mGluR slow EPSC by AA stimulation would reveal the presence of mGluRs at AA inputs. We know, however, that sparse PF stimulation does not activate the mGluR slow EPSC nor endocannabinoid release unless glutamate transporters are blocked (Marcaggi and Attwell., 2005). This is thought to reflect insufficient glutamate buildup in the sparse configuration to activate mGluR1s. AA inputs are sparsely distributed and are not expected to activate the slow EPSC either, and this is confirmed by our own experiments (CA personal communication). However, mGluR1 mediated Ca2+ release from stores shows a higher sensitivity to glutamate than the slow EPSC (Canepari and Ogden, 2006) and might take place with sparse inputs, but Ca2+ signals have not been investigated in this configuration. Therefore the absence of the slow EPSC is not sufficient proof that mGluR1s are not activated and not present at AA synapses. This is now further discussed p12.

      Minor points:

      (1) The authors should describe how they adjusted the stimulation strength for both AAs and PFs.

      Adjustment of the stimulation intensity is now described in the Methods section.

      (2) A rationale explaining why the authors chose the current induction protocol (synchronous stimulation of both inputs) should be included. This will help the readers to understand the background of the study.

      Papers by Sims and Hartell (2005, 2006) and experimental evidence indicated that AA and PF inputs may have different properties, and as a result may play different roles. Moreover, based on the morphology of the cerebellar granule cell and Purkinje cell, AA and PF inputs can carry different information to a given Purkinje cell. We reasoned that co-presentation of the inputs might represent an important piece of information for the circuit, signalling functional association, and lead to plasticity, as seen for motor command and sensory feedback in cerebellar-like structures, or for PF and climbing fibre. We have tried to convey that rational in the abstract and introduction.

      (3) Supplemental Figure 2B: the x-axis may be labeled incorrectly, Is the x-axis of the top graph for PF PF-EPSC? Thex-axis for the bottom graphs should be the summation of AA- and PF-EPSCs.

      This has been corrected.

      (4) "mglur1" on page 10 should be mGluR1.

      This has been corrected.

    1. Author response:

      The following is the authors’ response to the previous reviews.

      Recommendations for the authors:

      Reviewer #1 (Recommendations For The Authors):

      Please reorder the supplementary figures in the order they are referred to in the Results section for ease of reading. Supp Fig 5 b - should read 'Mean normalized fluorescence of LC ROIs (n = 87) during immobile periods aligned to the switch from familiar to novel environment.’

      We thank the reviewer for highlighting these issues and have reordered the supplementary figures and edited the figure legends appropriately.

      Reviewer #2 (Recommendations For The Authors):

      The authors should include sample size justifications (e.g. based on previous studies, considerations of statistical power, practical considerations, or a combination of these factors).

      In response to this concern, we have added a statement to the “Imaging Sessions” section of the methods. Here we highlight sample sizes were largely based on previous studies and/or limited by the difficulty of recordings and the limited number of visible axons per imaging session.

      Reviewer #3 (Recommendations For The Authors):

      The addition of Supp. Fig 5 partially addresses my previous point 3. However, the claim of dissociation between VTA-CA1 and LC-CA1 would be strengthened by showing that VTA-CA1 axons do not respond to the darkness -> familiar environment in Supp Fig 5. This is particularly important given that (1) the additional 2 VTA-CA1 axons in the revision were not recorded during transitions to novel environments and (2) the overall concern of the reviewers that the low n and heterogeneity of the VTA-CA1 dataset may lead to a false negative. Providing VTA-CA1 data for the darkness -> familiar environment would provide a within-manuscript replication that these axons are not responding to environment changes; a major claim of this manuscript.

      While we agree that data of VTA-CA1 axons during the switch from darkness to the familiar environment would provide additional evidence that these axons are not responding to environment changes, unfortunately, VTA axons were not recorded during the switch from familiar to novel.

    1. Author response:

      The following is the authors’ response to the original reviews.

      eLife assessment 

      The authors present 16 new well-preserved specimens from the early Cambrian Chengjiang biota. These specimens potentially represent a new taxon which could be useful in sorting out the problematic topology of artiopodan arthropods - a topic of interest to specialists in Cambrian arthropods. Because the anatomic features in the new specimens were neither properly revealed nor correctly interpreted, the evidence for several conclusions is inadequate. 

      We thank the Senior Editor, Reviewing Editor and three reviewers for their work, and for their comments aimed at improving this project and manuscript. We have engaged with all the comments in detail, in order to strengthen our work. This includes adding additional data to support that all Acanthomeridion specimens belong to a single species, running further phylogenetic analyses including more trilobite terminals to test the specific hypothesis and interpretation raised by Reviewer 2, and visualising our results in treespace in order to determine support for the different interpretations of the ventral structures and their implications for the evolution of Artiopoda. We have also greatly expanded the introduction, which we feel adds clarity to areas misunderstood by some reviewers in the previous version of the manuscript.

      Our point-by-point response to the public reviews of the reviewers are outlined below. We have also made changes resulting from the additional suggestions which are not public, which we have not reproduced below. We submit a new version of the main text, and can provide a tracked changes version if required. The new main text includes 9 figures and is 8624 words including captions and reference list.

      Public Reviews: 

      Reviewer #1 (Public Review): 

      Summary: 

      Du et al. report 16 new well-preserved specimens of atiopodan arthropods from the Chengjiang biota, which demonstrate both dorsal and ventral anatomies of a potential new taxon of artipodeans that are closely related to trilobites. Authors assigned their specimens to Acanthomeridion serratum and proposed A. anacanthus as a junior subjective synonym of Acanthomeridion serratum. Critically, the presence of ventral plates (interpreted as cephalic liberigenae), together with phylogenic results, lead authors to conclude that the cephalic sutures originated multiple times within the Artiopoda. 

      We thank Reviewer 1 for their comments on the strengths and weaknesses of the previous version of the manuscript. We hope that the revised version strengthens our conclusions that Acanthomeridion anacanthus is a junior synonym of A. serratum.

      Strengths: 

      New specimens are highly qualified and informative. The morphology of the dorsal exoskeleton, except for the supposed free cheek, was well illustrated and described in detail, which provides a wealth of information for taxonomic and phylogenic analyses. 

      Weaknesses: 

      The weaknesses of this work are obvious in a number of aspects. Technically, ventral morphology is less well revealed and is poorly illustrated. Additional diagrams are necessary to show the trunk appendages and suture lines. Taxonomically, I am not convinced by the authors' placement. The specimens are markedly different from either Acanthomeridion serratum Hou et al. 1989 or A. anacanthus Hou et al. 2017. The ontogenetic description is extremely weak and the morpholical continuity is not established. Geometric and morphometric analyses might be helpful to resolve the taxonomic and ontogenic uncertainties. 

      We appreciate that the reviewer was not convinced by our synonimisation in the first version of the manuscript. The recommendation of the reviewer to provide linear morphometric support for our synonymisation was much appreciated. We have provided measurements of the length and width of the thorax (Figure 6 in the new version), visualising the position of specimens previously assigned to A. anacanthus, to show this morphological continuity. These act as a complement to Figure 5, which shows the fossils in an ontogenetic trend.

      I am confused by the author's description of the free cheek (libragena) and ventral plate. Are they the same object? How do they connect with other parts of the cephalic shield, e.g. hypostome, and fixgena? Critically, the homology of cephalic slits (eye slits, eye notch, dorsal suture, facial suture) is not extensively discussed either morphologically or functionally.

      We appreciate that the brevity of the introduction in the previous version led to some misunderstandings and some confusion. We have provided a greatly expanded introduction, including a new Figure 1, which outlines the possible homologies of the ventral plates and the three hypotheses considered in this study. The function of the cephalic and dorsal suture are now discussed in more detail both in introduction and discussion.

      Finally, the authors claimed that phylogenic results support two separate origins rather than a deep origin. However, the results in Figure 4 can explain a deep homology of the cephalic suture at molecular level and multiple co-options within the Atiopoda. 

      A deep molecular origin is difficult to demonstrate using solely fossil material from an extinct group such as Artiopoda. Thus our study focuses on morphological origins. The number of losses required for a deep morphological origin means that we favour multiple independent morphological origins.

      Reviewer #2 (Public Review): 

      Overall: This paper describes new material of Acanthomeridion serratum that the authors claim supports its synonymy with Acanthomeridion anacanthus. The material is important and the description is acceptable after some modification. In addition, the paper offers thoughts and some exploration of the possibility of multiple origins of the dorsal facial suture among artiopods, at least once within Trilobita and also among other non-trilobite artiopods. Although this possibility is real and apparently correct, the suggestions presented in this paper are both surprising and, in my opinion, unlikely to be true because the potential homologies proposed with regard to Acanthomeridion and trilobite-free cheeks are unconventional and poorly supported. 

      What to do? I can see two possibilities. One, which I recommend, is to concentrate on improving the descriptive part of the paper and omit discussion and phylogenetic analysis of dorsal facial suture distribution, leaving that for more comprehensive consideration elsewhere. The other is to seek to improve both simultaneously. That may be possible but will require extensive effort. 

      We thank the reviewer for their detailed comments and suggestions for multiple ways in which we might revise the manuscript. We have taken the option that is more effort, but we hope more reward, in interrogating the larger question alongside improving the descriptive part of the paper. This has taken a long time and incorporation of new techniques, but has in our opinion greatly strengthened the work.

      Major concerns 

      Concern 1 - Ventral sclerites as free cheek homolog, marginal sutures, and the trilobite doublure 

      Firstly, a couple of observations that bear on the arguments presented - the eyes of A. serratum are almost marginal and it is not clear whether a) there is a circumocular suture in this animal and b) if there was, whether it merged with the marginal suture. These observations are important because this animal is not one in which an impressive dorsal facial suture has been demonstrated - with eyes that near marginal it simply cannot do so. Accordingly, the key argument of this paper is not quite what one would expect. That expectation would be that a non-trilobite artiopod, such as A. serratum, shows a clear dorsal facial suture. But that is not the case, at least with A. serratum, because of its marginal eyes. Rather, the argument made is that the ventral doublure of A. serratum is the homolog of the dorsal free cheeks of trilobites. This opens up a series of issues. 

      We appreciate that the reviewer disagrees with both interpretations we offered for the ventral plates, and has offered a third interpretation for the homology of this feature with the doublure of trilobites. Support for our original interpretation comes from the position of the eye stalks in Acanthomeridion, which fall very close to the suture between ventral plate rest of the cephalon. However, we appreciate that the reviewer has a valid interpretation, that the ventral plates might be homologues of the doublure alone.

      To clarify the (two, now three) hypotheses of homology for the ventral plates considered in this study, we provide a new summary figure (Figure 1). In addition, the introduction has been greatly lengthened with further discussion of the different suture types in trilobites, their importance for trilobite classification schemes, and extensive references to older literature are now included. Further, we add background to the hypotheses around the origins of dorsal ecdysial sutures. 

      We add that the interpretation of A. serratum as having features homologous to the dorsal sutures of trilobites is already present in the literature, and so while the reviewer may disagree with it, it is certainly a hypothesis that requires testing.

      The paper's chief claim in this regard is that the "teardrop" shaped ventral, lateral cephalic plates in Acanthomeridion serratum are potential homologs of the "free cheeks" of those trilobites with a dorsal facial suture. There is no mention of the possibility that these ventral plates in A. serratum could be homologs of the lateral cephalic doublure of olenelloid trilobites, which is bound by an operative marginal suture or, in those trilobites with a dorsal facial suture, that it is a homolog of only the doublure portions of the free cheeks and not with their dorsal components. 

      We include this third possibility in our revised analyses and manuscript. To test this properly required adding in an olenelloid trilobite to our matrix, as we needed a terminal that had both a marginal and circumoral suture, but not fused. We chose Olenellus getzi for this purpose, as it is the only Olenellus with some appendages known (the antennae). We also added further characters to the morphological matrix, and additional trilobites from which soft tissues are known, in order to better resolve this part of the tree. Trilobites in the final analyses were: Anacheirurus adserai, Cryptolithus tesselatus, Eoredlichia intermedia, Olenoides serratus, Olenellus getzi, Triarthrus eatoni.

      However, addition of these trilobites added a further complication. Under unconstrained analysis, Olenellus getzi was resolved with Eoredlichia intermediata as a clade sister to all other trilobites.

      Thus the topology of Paterson et al. 2019 (PNAS) was not recovered, and so the hypothesis of Reviewer 2 could not be robustly tested. In order to achieve a topology comparable to Paterson et al., we ran a further three analyses, where we constrained a clade of all trilobites except for O. getzi. This recovered a topology where the earliest diverging trilobites had unfused sutures, and thus one suitable for considering the role of Acanthomeridion serratum ventral plates as homologues of the doublure of trilobites.

      Unfortunately, for these analyses (both constrained and unconstrained), Acanthomeridion was not resolved as sister to trilobites, but instead elsewhere in the tree (see Table 1 in main text, Fig. 9, and  SFig 9). Thus our analyses do not find support for the reviewer’s hypothesis as multiple origins of this feature are still required.

      It was still an excellent point that we should consider this hypothesis, and we have retained it, and discussion surrounding it, in our manuscript.

      The introduction to the paper does not inform the reader that all olenelloids had a marginal suture - a circumcephalic suture that was operative in their molting and that this is quite different from the situation in, say, "Cedaria" woosteri in which the only operative cephalic exoskeletal suture was circumocular. The conservative position would be that the olenelloid marginal suture is the homolog of the marginal suture in A. serratum: the ventral plates thus being homolog of the trilobite cephalic doublure, not only potential homolog to the entire or dorsal only part of the free cheeks of trilobites with a dorsal facial suture. As the authors of this paper decline to discuss the doublure of trilobites (there is a sole mention of the word in the MS, in a figure caption) and do not mention the olenelloid marginal suture, they give the reader no opportunity to assess support for this alternative. 

      At times the paper reads as if the authors are suggesting that olenelloids, which had a marginal cephalic suture broadly akin to that in Limulus, actually lacked a suture that permitted anterior egression during molting. The authors are right to stress the origin of the dorsal cephalic suture in more derived trilobites as a character seemingly of taxonomic significance but lines such as 56 and 67 may be taken by the non-specialist to imply that olenelloids lacked a forward egressionpermiting suture. There is a notable difference between not knowing whether sutures existed (a condition apparently quite common among soft-bodied artiopods) and the well-known marginal suture of olenelloids, but as the MS currently reads most readers will not understand this because it remains unexplained in the MS. 

      As noted in response to a previous point (above) we now have a greatly expanded introduction which should give the reader an opportunity to assess support for this alternative hypothesis. We now include Olenellus getzi in our analyses, and have added characters to the morphological matrix to make this clear.

      A reference to the case of ‘Cedaria’ woosteri is made in the introduction to highlight further the variability of trilobites, as is a reference to Foote’s analysis of cranidial shapes and support this provides for a  single origin of the dorsal suture.

      With that in mind, it is also worth further stressing that the primary function of the dorsal sutures in those which have them is essentially similar to the olenelloid/limulid marginal suture mentioned above. It is notable that the course of this suture migrated dorsally up from the margin onto the dorsal shield and merged with the circumocular suture, but this innovation does not seem to have had an impact on its primary function - to permit molting by forward egression. Other trilobites completely surrendered the ability to molt by forward egression, and there are even examples of this occurring ontogenetically within species, suggesting a significant intraspecific shift in suture functionality and molting pattern. The authors mention some of this when questioning the unique origin of the dorsal facial suture of trilobites, although I don't understand their argument: why should the history of subsequent evolutionary modification of a character bear on whether its origin was unique in the group? 

      We include reference to evolutionary modification and loss of this character as it is important to stress that if a character is known to have been lost multiple times it is possible that it had a deeper root (in an earlier diverging member of Artiopoda than Trilobita) and was lost in olenelloids. This is the question that we seek to address in our manuscript.

      The bottom line here is that for the ventral plates of A. serratum to be strict homologs of only the dorsal portion of the dorsal free cheeks, there would be no homolog of the trilobite doublure in A. serratum. The conventional view, in contrast, would be that the ventral plates are a homolog of the ventral doublure in all trilobites and ventral plates in artiopods. I do not think that this paper provides a convincing basis for preferring their interpretation, nor do I feel that it does an adequate job of explaining issues that are central to the subject. 

      We stress that our interpretations – that the ventral plates are not homologous to any artiopodan feature or that they are homologous to the free cheeks of trilobites – have both been raised in the literature before. Whereas we could not find mention of the reviewer’s ‘conventional view’ relating to Acanthomeridion. We appreciate that this view is still valid and worth investigating, which we have done in the further analyses conducted. However, we did not find support for it. Instead we find some support for both ventral plates as homologues of free cheeks, and as unique structures within Artiopoda.

      Concern 2. Varieties of dorsal sutures and the coexistence of dorsal and marginal sutures 

      The authors do not clarify or discuss connections between the circumocular sutures (a form of dorsal suture that separates the visual surface from the rest of the dorsal shield) and the marginal suture that facilitates forward egression upon molting. Both structures can exist independently in the same animal - in olenelloids for example. Olenelloids had both a suture that facilitated forward egression in molting (their marginal suture) and a dorsal suture (their circumocular suture). The condition in trilobites with a dorsal facial suture is that these two independent sutures merged - the formerly marginal suture migrating up the dorsal pleural surface to become confluent with the circumocular suture. (There are also interesting examples of the expansion of the circumocular suture across the pleural fixigena.) The form of the dorsal facial suture has long figured in attempts at higher-level trilobite taxonomy, with a number of character states that commonly relate to the proximity of the eye to the margin of the cephalic shield. The form of the dorsal facial suture that they illustrate in Xanderella, which is barely a strip crossing the dorsal pleural surface linking marginal and circumocular suture, is comparable to that in the trilobites Loganopeltoides and Entomapsis but that is a rare condition in that clade as a whole. The paper would benefit from a clear discussion of these issues at the beginning - the dorsal facial suture that they are referring to is a merged circumcephalic suture and circumocular suture - it is not simply the presence of a molt-related suture on the dorsal side of the cephalon. 

      We have added in an expanded introduction where these points are covered in detail. We appreciate that this was not clear in the earlier version, and this suggestion has greatly improved our work.

      Concern 3. Phylogenetics 

      While I appreciate that the phylogenetic database is a little modified from those of other recent authors, still I was surprised not to find a character matrix in the supplementary information (unless it was included in some way I overlooked), which I would consider a basic requirement of any paper presenting phylogenetic trees - after all, there's no a space limit. It is not possible for a reviewer to understand the details of their arguments without seeing the character states and the matrix of state assignments. 

      A link to a morphobank project was included in the first submission. This project has been updated for the current submission, including an additional matrix to treat the reviewer’s hypothesis for the ventral plates. Morphobank Project #P4290. Email address: P4290, reviewer password:

      Acanthomeridion2023, accessible at morphobank.org. We have added in additional details for the reviewer and others to help them access the project:

      The project can be accessed at morphobank.org, using the below credentials to log in:  Email address: P4290, Password: Acanthomeridion 2023.

      The section "phylogenetic analyses" provides a description of how tree topology changes depending on whether sutures are considered homologous or not using the now standard application of both parsimony and maximum likelihood approaches but, considering that the broader implications of this paper rest of the phylogenetic interpretation, I also found the absence of detailed discussion of the meaning and implications of these trees to be surprising, because I anticipated that this was the main reason for conducting these analysis. The trees are presented and briefly described but not considered in detail. I am troubled by "Circles indicate presence of cephalic ecdysial sutures" because it seems that in "independent origin of sutures" trilobites are considered to have two origins (brown color dot) of cephalic ecdysial sutures - this may be further evidence that the team does not appreciate that olenelloids have cephalic ecdysial sutures, as the basal condition in all trilobites. Perhaps I'm misunderstanding their views, but from what's presented it's not possible to know that. Similarly, in the "sutures homologous" analyses why would there be two independent green dots for both Acanthomeridion and Trilobita, rather than at the base of the clade containing them both, as cephalic ecdysial sutures are basal to both of them? Here again, we appear to see evidence that the team considers dorsal facial sutures and cephalic ecdysial sutures to be synonymous - which is incorrect.  

      We appreciate that the reviewer misunderstood the meaning of the dots, leading to confusion. The dots indicated how features were coded in the phylogenetic analysis. In our revised version of this figure (Figure 8 in the new version), these dots are now clearly labelled as indicating ‘coding in phylogenetic matrix’. Further, with the revised character list, we now can provide additional detail for the types of sutures (relevant as we now include more trilobite terminals).

      This point aside, and at a minimum, that team needs to do a more thorough job of characterizing and considering the variety of conditions of dorsal sutures among artiopods, their relationships to the marginal suture and to the circumocular suture, the number, and form of their branches, etc. 

      We thank the reviewer for this summary, and appreciate their concerns and thorough review. Our revised version takes into account all these points raised, and they have greatly improved the clarity, scope and thoroughness of the work.

      Reviewer #3 (Public Review): 

      Summary:

      Well-illustrated new material is documented for Acanthomeridion, a formerly incompletely known Cambrian arthropod. The formerly known facial sutures are shown to be associated with ventral plates that the authors very reasonably homologise with the free cheeks of trilobites. A slight update of a phylogenetic dataset developed by Du et al, then refined slightly by Chen et al, then by Schmidt et al, and again here, permits another attempt to optimise the number of origins of dorsal ecdysial sutures in trilobites and their relatives. 

      Strengths:

      Documentation of an ontogenetic series makes a sound case that the proposed diagnostic characters of a second species of Acanthomeridion are variations within a single species. New microtomographic data shed some light on appendage morphology that was not formerly known. The new data on ventral plates and their association with the ecdysial sutures are valuable in underpinning homologies with trilobites. 

      We thank the Reviewer 3 for their positive comments about the manuscript. We appreciate the constructive comments for improvements, and detailed corrections, which we have incorporated into our revised work.

      Weaknesses:

      The main conclusion remains clouded in ambiguity because of a poorly resolved Bayesian consensus and is consistent with work led by the lead author in 2019 (thus compromising the novelty of the findings). The Bayesian trees being majority rules consensus trees, optimising characters onto them (Figure 7b, d) is problematic. Optimising on a consensus tree can produce spurious optimisations that inflate tree length or distort other metrics of fit. Line 264 refers to at least three independent origins of cephalic sutures in artiopodans but the fully resolved Figure 7c requires only two origins. 

      We thank the reviewer for pointing this out. However now the analyses have been re-run we have new results to consider. The results still support multiple origins of sutures. We also note that the dots were indicating how terminals were coded. This is now clearer in the revised version of this figure (Figure 8 in the new version).

      We have extended our interrogation of the trees by incorporating treespace analyses. These add support for the nodes of interest (around the base of trilobites), showing that the coding of Acanthomeridion ventral plate homologies impacts its position in the tree, and thus has implications for our understanding of the evolution of sutures in trilobites.

      The question of how many times dorsal ecdysial sutures evolved in Artiopoda was addressed by Hou et al (2017), who first documented the facial sutures of Acanthomeridion and optimised them onto a phylogeny to infer multiple origins, as well as in a paper led by the lead author in Cladistics in 2019. Du et al. (2019) presented a phylogeny based on an earlier version of the current dataset wherein they discussed how many times sutures evolved or were lost based on their presence in

      Zhiwenia/Protosutura, Acanthomeridion, and Trilobita. To their credit, the authors acknowledge this (lines 62-65). The answer here is slightly different (because some topologies unite Acanthomeridion and trilobites). 

      The following points are not meant to be "Weaknesses" but rather are refinements: 

      I recommend changing the title of the paper from "cephalic sutures" to "dorsal ecdysial sutures" to be more precise about the character that is being tracked evolutionarily. Lots of arthropods have cephalic sutures (e.g., the ventral marginal suture of xiphosurans; the Y-shaped dorsomedian ecdysial line in insects). The text might also be updated to change other instances of "cephalic sutures" to a more precise wording. 

      We appreciate this point and have changed the title as suggested. 

      The authors have provided (but not explicitly identified) support values for nodes in their Bayesian trees but not in their parsimony ones. Please do the jackknife or bootstrap for the parsimony analyses and make it clear that the Bayesian values are posterior probabilities. 

      With the addition of further trilobite terminals to our parsimony analyses, the results became poor.

      Specifically the internal relationships of trilobites did not conform to any previous study, and Olenellus getzi was not resolved as an early diverging member of the group. This meant that these analyses could not be used for addressing the hypothesis of reviewer two. We decided to exclude reporting parsimony analysis results from this version to avoid confusion.

      We have added a note that the values reported at the nodes are posterior probabilities to figures S8, S9 and S10 where we show the full Bayesian results.

      In line 65 or somewhere else, it might be noted that a single origin of the dorsal facial sutures in trilobites has itself been called into question. Jell (2003) proposed that separate lineages of Eutrilobita evolved their facial sutures independently from separate sister groups within Olenellina. 

      We have added this to the introduction (Line 98). Thank you for raising this point.

      I have provided minor typographic or terminological corrections to the authors in a list of recommendations that may not be publicly available. 

      We appreciate the points made by the reviewer and their detailed corrections, which we have corrected in the revised version.

    1. Author response:

      The following is the authors’ response to the previous reviews.

      Public Reviews:

      Reviewer #1 (Public Review):

      In this paper the authors provide a characterisation of auditory responses (tones, noise, and amplitude modulated sounds) and bimodal (somatosensory-auditory) responses and interactions in the higher order lateral cortex (LC) of the inferior colliculus (IC) and compare these characteristic with the higher order dorsal cortex (DC) of the IC - in awake and anaesthetised mice. Dan Llano's group have previously identified gaba'ergic patches (modules) in the LC distinctly receiving inputs from somatosensory structures, surrounded by matrix regions receiving inputs from auditory cortex. They here use 2P calcium imaging combined with an implanted prism to - for the first time - get functional optical access to these subregions (modules and matrix) in the lateral cortex of IC in vivo, in order to also characterise the functional difference in these subparts of LC. They find that both DC and LC of both awake and anaesthetised appears to be more responsive to more complex sounds (amplitude modulated noise) compared to pure tones and that under anesthesia the matrix of LC is more modulated by specific frequency and temporal content compared to the gaba'ergic modules in LC. However, while both LC and DC appears to have low frequency preferences, this preference for low frequencies is more pronounced in DC. Furthermore, in both awake and anesthetized mice somatosensory inputs are capable of driving responses on its own in the modules of LC, but very little in the matrix. The authors now compare bimodal interactions under anaesthesia and awake states and find that effects are different in some cases under awake and anesthesia - particularly related to bimodal suppression and enhancement in the modules.

      The paper provides new information about how subregions with different inputs and neurochemical profiles in the higher order auditory midbrain process auditory and multisensory information, and is useful for the auditory and multisensory circuits neuroscience community.

      The manuscript is improved by the response to reviewers. The authors have addressed my comments by adding new figures and panels, streamlining the analysis between awake and anaesthetised data (which has led to a more nuanced, and better supported conclusion), and adding more examples to better understand the underlying data. In streamlining the analyses between anaesthetised and awake data I would probably have opted for bringing these results into merged figures to avoid repetitiveness and aid comparison, but I acknowledge that that may be a matter of style. The added discussions of differences between awake and anaesthesia in the findings and the discussion of possible reasons why these differences are present help broaden the understanding of what the data looks like and how anaesthesia can affect these circuits.

      As mentioned in my previous review, the strength of this study is in its demonstration of using prism 2p imaging to image the lateral shell of IC to gain access to its neurochemically defined subdivisions, and they use this method to provide a basic description of the auditory and multisensory properties of lateral cortex IC subdivisions (and compare it to dorsal cortex of IC). The added analysis, information and figures provide a more convincing foundation for the descriptions and conclusions stated in the paper. The description of the basic functionality of the lateral cortex of the IC are useful for researchers interested in basic multisensory interactions and auditory processing and circuits. The paper provides a technical foundation for future studies (as the authors also mention), exploring how these neurochemically defined subdivisions receiving distinct descending projections from cortex contribute to auditory and multisensory based behaviour.

      Minor comment:

      - The authors have now added statistics and figures to support their claims about tonotopy in DC and LC. I asked for and I think allows readers to better understand the tonotopical organisation in these areas. One of the conclusions by the authors is that the quadratic fit is a better fit that a linear fit in DCIC. Given the new plots shown and previous studies this is likely true, though it is worth highlighting that adding parameters to a fitting procedure (as in the case when moving from linear to quadratic fit) will likely lead to a better fit due to the increased flexibility of the fitting procedure.

      Thank you for the suggestion. We have highlighted that the quadratic function allowed the regression model to include the cells tuned to higher frequencies at the rostromedial part of the DC and result in a better fit, which is consistent with the tonotopic organization that was previously described as shown in text at (lines 208-211).

      Reviewer #2 (Public Review):

      Summary:

      The study describes differences in responses to sounds and whisker deflections as well as combinations of these stimuli in different neurochemically defined subsections of the lateral and dorsal cortex of the inferior colliculus in anesthetised and awake mice.

      Strengths:

      A major achievement of the work lies in obtaining the data in the first place as this required establishing and refining a challenging surgical procedure to insert a prism that enabled the authors to visualise the lateral surface of the inferior colliculus. Using this approach, the authors were then able to provide the first functional comparison of neural responses inside and outside of the GABA-rich modules of the lateral cortex. The strongest and most interesting aspects of the results, in my opinion, concern the interactions of auditory and somatosensory stimulation. For instance, the authors find that a) somatosensory-responses are strongest inside the modules and b) somatosensory-auditory suppression is stronger in the matrix than in the modules. This suggests that, while somatosensory inputs preferentially target the GABA-rich modules, they do not exclusively target GABAergic neurons within the modules (given that the authors record exclusively from excitatory neurons we wouldn't expect to see somatosensory responses if they targeted exclusively GABAergic neurons) and that the GABAergic neurons of the modules (consistent with previous work) preferentially impact neurons outside the modules, i.e. via long-range connections.

      Weaknesses:

      While the findings are of interest to the subfield they have only rather limited implications beyond it and the writing is not quite as precise as it could be.

      Reviewer #3 (Public Review):

      The lateral cortex of the inferior colliculus (LC) is a region of the auditory midbrain noted for receiving both auditory and somatosensory input. Anatomical studies have established that somatosensory input primarily impinges on "modular" regions of the LC, which are characterized by high densities of GABAergic neurons, while auditory input is more prominent in the "matrix" regions that surround the modules. However, how auditory and somatosensory stimuli shape activity, both individually and when combined, in the modular and matrix regions of the LC has remained unknown.

      The major obstacle to progress has been the location of the LC on the lateral edge of the inferior colliculus where it cannot be accessed in vivo using conventional imaging approaches. The authors overcame this obstacle by developing methods to implant a microprism adjacent to the LC. By redirecting light from the lateral surface of the LC to the dorsal surface of the microprism, the microprism enabled two-photon imaging of the LC via a dorsal approach in anesthetized and awake mice. Then, by crossing GAD-67-GFP mice with Thy1-jRGECO1a mice, the authors showed that they could identify LC modules in vivo using GFP fluorescence while assessing neural responses to auditory, somatosensory, and multimodal stimuli using Ca2+ imaging. Critically, the authors also validated the accuracy of the microprism technique by directly comparing results obtained with a microprism to data collected using conventional imaging of the dorsal-most LC modules, which are directly visible on the dorsal IC surface, finding good correlations between the approaches.

      Through this innovative combination of techniques, the authors found that matrix neurons were more sensitive to auditory stimuli than modular neurons, modular neurons were more sensitive to somatosensory stimuli than matrix neurons, and bimodal, auditory-somatosensory stimuli were more likely to suppress activity in matrix neurons and enhance activity in modular neurons. Interestingly, despite their higher sensitivity to somatosensory stimuli than matrix neurons, modular neurons in the anesthetized prep were overall more responsive to auditory stimuli than somatosensory stimuli (albeit with a tendency to have offset responses to sounds). This suggests that modular neurons should not be thought of as primarily representing somatosensory input, but rather as being more prone to having their auditory responses modified by somatosensory input. However, this trend was different in the awake prep, where modular neurons became more responsive to somatosensory stimuli. Thus, to this reviewer, one of the most intriguing results of the present study is the extent to which neural responses in the LC changed in the awake preparation. While this is not entirely unexpected, the magnitude and stimulus specificity of the changes caused by anesthesia highlight the extent to which higher-level sensory processing is affected by anesthesia and strongly suggests that future studies of LC function should be conducted in awake animals.

      Together, the results of this study expand our understanding of the functional roles of matrix and module neurons by showing that responses in LC subregions are more complicated than might have been expected based on anatomy alone. The development of the microprism technique for imaging the LC will be a boon to the field, finally enabling much-needed studies of LC function in vivo. The experiments were well-designed and well-controlled, the limitations of two-photon imaging for tracking neural activity are acknowledged, and appropriate statistical tests were used.

      Recommendations for the authors:

      Reviewer #1 (Recommendations For The Authors):

      - Increase font size of scale bars on figure 6.

      Thank you for the suggestion. We have increased the font size of the scale bar.

      Reviewer #2 (Recommendations For The Authors):

      Line 505: typo: 'didtinction'

      Thank you for the suggestion and we do apologize for the typo. We have fixed the word as shown in the text (line 506).

      No further comments.

      Reviewer #3 (Recommendations For The Authors):

      Line 543: Change "contripute" to "contribute"

      Thank you for the suggestion and we do apologize for the typo. We have fixed the word as shown in the text (line 544).

    1. Author response:

      The following is the authors’ response to the previous reviews.

      Public Reviews:

      Reviewer #2 (Public Review):

      The authors indicated that the adherence of ETEC is to intestinal epithelial cells. However, it is also possible that the majority of ETEC may reside in the intestinal mucus, particularly under in vivo infection condition. The colonization of ETEC in the jejunum and colon of piglets (Fig 2C) and in the intestines of mice (Fig S2A) does not necessarily reflect the adherence of ETEC to epithelial cells. Please verify these observations with other methods, such as immunostaining. Also, while Salmonella enterica serovar Typhimurium or Listeria monocytogenes can invade organoids within 1 hour, it is unknown if ETEC invade into organoids in this study. Clarifying this will help resolve if A. muciniphila block the adherence and/or invasion of ETEC. Please also address if A. muciniphila metabolites could prevent ETEC infection in the organoid models.

      In the original manuscript, the sentence “ETEC K88 adheres to intestinal epithelial cells and induces gut inflammation (Yu et al., 2018)” in line 447 is a reference cited for the purpose of connecting the previous and the following, and it is not our result. We have deleted this sentence on line 457. Previous studies have shown that ETEC enter into intestinal epithelial cells after only one hour of infection (Xiao et al., 2022; Qian et al., 2023). Whether A. muciniphila metabolites prevent ETEC infection in the organoid models is not the focus of this manuscript, it may be further explored by other members of the research group in the future.

      References:

      Xiao K, Yang Y, Zhang Y, Lv QQ, Huang FF, Wang D, Zhao JC, Liu YL. 2022. Long-chain PUFA ameliorate enterotoxigenic Escherichia coli-induced intestinal inflammation and cell injury by modulating pyroptosis and necroptosis signaling pathways in porcine intestinal epithelial cells. Br. J. Nutr. 128(5):835-850.

      Qian MQ, Zhou XC, Xu TT, Li M, Yang ZR, Han XY. 2023. Evaluation of Potential Probiotic Properties of Limosilactobacillus fermentum Derived from Piglet Feces and Influence on the Healthy and E. coli-Challenged Porcine Intestine. Microorganisms. 11(4).

      Reviewer #3 (Public Review):

      Summary:

      The manuscript by Ma et al. describes a multi-model (pig, mouse, organoid) investigation into how fecal transplants protect against E. coli infection. The authors identify A. muciniphila and B. fragilis as two important strains and characterize how these organisms impact the epithelium by modulating host signaling pathways, namely the Wnt pathway in lgr5 intestinal stem cells.

      Strengths:

      The strengths of this manuscript include the use of multiple model systems and follow up mechanistic investigations to understand how A. muciniphila and B. fragilis interacted with the host to impact epithelial physiology.

      Weaknesses:

      After revision, the bioinformatics section of the methods is still jumbled and may indicate issues in the pipeline. Important parameters are not included to replicate analyses. Merging the forward and reverse reads may represent a problem for denoising. Chimera detection was performed prior to denoising.

      Potential denoising issues for NovaSeq data was not addressed in the response. The authors did not clarify if multiple testing correction was applied; however, it may be assumed not as written. The raw sequencing data made available through the SRA accession (if for the correct project) indicates it was a MiSeq platform; however, the sample names do not appear to link up to this experimental design and metadata not sufficient to replicate analyses.

      We have redescribed the method for microbiome sequencing analysis on lines 298-327.

      Recommendations for the authors:

      Reviewer #3 (Recommendations For The Authors):

      SRA accession must be confirmed and metadata made available.

      We updated the SRA data.

    1. Author response:

      The following is the authors’ response to the original reviews.

      Reviewer #1 (Recommendations For The Authors):

      (1) In the first paragraph of the result section it is not clear why the authors introduce the function of p53ΔAS/ΔAS in thymocyte and then they mention fibroblasts. The authors should clarify this point. The authors should also explain based on what rationale they use doxorubicin and nutlin to analyze p53 activity (Figure 1 and figure S1). 

      We thank the reviewer for this comment. In the revised manuscript, we corrected this by mentioning, at the beginning of the Results section: “We analyzed cellular stress responses in thymocytes, known to undergo a p53-dependent apoptosis upon irradiation (Lowe et al., 1993), and in primary fibroblasts, known to undergo a p53-dependent cell cycle arrest in response to various stresses - e.g. DNA damage caused by irradiation or doxorubicin (Kastan et al., 1992), and the Nutlin-mediated inhibition of Mdm2, a negative regulator of p53 (Vassilev et al., 2004).”

      (2) The authors should provide quantification for the western blot in figure 2D because the reduction of p53 protein level in mutant vs wt tumors is not striking. 

      In the previous version of the manuscript, the quantification of p53 bands had been included, but quantification results were mentioned below the actin bands, rather than the p53 bands, and this was probably confusing. We have corrected this in the revised version of the manuscript. The quantification results are now provided just below the p53 bands in Figs. 1B and 2D, which should clarify this point. For Figure 2D, the quantifications show a strong decrease in p53 levels for 3 out of 4 analyzed mutant tumors. For consistency purposes, in the revised manuscript the quantification results also appear below Myc bands in Fig. 2C.

      (3) In the discussion section, the authors propose that a difference in Ackr4 expression may have prognostic value and that measuring ACKR4 gene expression in male patients with Burkitt lymphoma could be useful to identify the patients at higher risk. However the authors perform a lot of correlative analysis, both in mice and in patients, but the manuscript lacks of functional experiments that could help to functionally characterize Ackr4 and Mt2 in the etiology of B-cell lymphomas in males (both in mouse and in human models).

      In the previous version of the manuscript, we proposed that Ackr4 might act as a suppressor of B-cell lymphomagenesis by attenuating Myc signaling. This hypothesis relied on studies showing that Ackr4 impairs the Ccr7 signaling cascade, which may lead to decreased Myc activity (Ulvmar et al., 2014; Shi et al., 2015; Bastow et al., 2021) and that the loss of Ccr7 may delay Myc-driven lymphomagenesis (Rehm et al., 2011). Furthermore, we proposed that the increased expression of Mt2 in p53ΔAS/ΔAS Em-Myc male splenic cells reflected an increase in Myc activity, because Mt2 is known to be regulated by Myc (Qin et al., 2021) and because the Mt2 promoter is bound by Myc in B cells according to experiments reported in the ChIP-Atlas database. However, in the first version of the manuscript this hypothesis might have appeared only partially supported by our data because an increase in Myc activity could be expected to have a more general impact, i.e. an impact not only on the expression of Mt2, but also on the expression of many canonical Myc target genes. In the revised manuscript, we show that this is indeed the case. We performed a gene set enrichment analysis (GSEA) comparing the RNAseq data from p53ΔAS/ΔAS Eμ-Myc and p53+/+ Eμ-Myc male splenic cells and found an enrichment of hallmark Myc targets in p53ΔAS/ΔAS Eμ-Myc cells. These new data, which strengthen our hypothesis of differences in Myc signaling intensity, are presented in Fig. 3K and Table S2.

      Importantly, we now go beyond correlative analyses by providing direct experimental evidence that ACKR4 impacts on the behavior of Burkitt lymphoma cells. We used a CRISPR-Cas9 approach to knock-out ACKR4 in Raji Burkitt lymphoma cells and found that ACKR4 KO cells exhibited a 4-fold increase in chemokine-guided cell migration. These new data are presented in Figure 4F and the supplemental Figures S5-S7.  

      Finally, following a suggestion of Reviewer#2, we now also point out that “Ackr4 regulates B cell differentiation (Kara et al., 2018), which raises the possibility that an altered p53-Ackr4 pathway in p53ΔAS/ΔAS Eμ-Myc male splenic cells might contribute to increase the pools of pre-B and immature B cells that may be prone to lymphomagenesis.”

      In sum, we now mention in the Discussion that a decrease in Ackr4 expression might promote B-cell lymphomagenesis through three non-exclusive mechanisms.

      Reviewer #2 (Recommendations For The Authors): 

      (1) A great addition would be to demonstrate how p53AS specifically contributes to the regulation of Ackr4. In particular, is there evidence that p53AS might be preferentially recruited on p53 RE within that gene as compared to WT? The availability of specific antibodies that distinguish between AS and WT p53 might help to address this (experimentally complex) question. As a note, usage of such antibodies would also strengthen Fig 1B, in which the AS isoform appears as a mere faint shadow under p53, thus making its "disappearance" in trp53ΔAS/ΔAS difficult to evaluate. 

      We agree with the referee that efficient antibodies against p53-AS isoforms would have been useful. In fact, we tried a non-commercial antibody developed for that purpose, but it led to many unspecific bands in western blots and appeared not reliable. Importantly however, our luciferase assays clearly show that both p53-a and p53-AS can transactivate Ackr4, a result that might be expected because these isoforms share the same DNA binding domain. Furthermore, because p53-a isoforms appear more abundant than p53-AS isoforms at the protein and RNA levels (Figs. 1B and S1A), and because the loss of p53-AS isoforms leads to a significant decrease in p53-a protein levels (Figs. 1B and 2D), we think that in p53ΔAS/ΔAS cells the reduction in p53-a levels might be the main reason for a decreased transactivation of Ackr4. This is now more clearly discussed in the revised manuscript.

      (2) A most interesting observation is in Fig3 A and Fig S3, showing that spleen cells of p53ΔAS Eμ-Myc males (but not females) were enriched in pre-B and immature B cells as compared to WT counterparts. This observation points to a possible defect in B cell maturation process. It would be most interesting to determine whether this particular defect is directly mediated by a p53AS-Ackr4 axis. The hypothesis raised by the authors in the Discussion section is that increased Ackr4 expression may delay lymphomatogenesis, but data in Fig 3A and 3S actually suggest that ΔAS increases the pool of immature B-cell that may be prone to lymphomagenesis. 

      We thank the reviewer for this useful comment, which we integrated in the Discussion of the revised manuscript. Ackr4 was shown to regulate B cell differentiation (Kara at al. (2018) J Exp Med 215, 801–813), so this is indeed one of the possible mechanisms by which a deregulation of the p53-Ackr4 axis might promote lymphomagenesis. We now mention: “Ackr4 regulates B cell differentiation (Kara et al., 2018), which raises the possibility that an altered p53-Ackr4 pathway in p53ΔAS/ΔAS Eμ-Myc male splenic cells might contribute to increase the pools of pre-B and immature B cells that may be prone to lymphomagenesis.” This is presented as one of three possible mechanisms by which decreased Ackr4 levels may promote tumorigenesis, the two others being the impact of Ackr4 on the chemokine-guided migration of lymphoma cells and its apparent effect on Myc signalling.

      (3) The concordance with a male-specific prognostic effect of Ackr4 is most interesting in itself but is only of correlative evidence with respect to the study. Is there any information on whether p53AS expression is also a prognostic factor in BL? And is there evidence that Ackr4 may also be a male-specific prognostic factor in other B-cell malignancies, e.g. Multiple Myeloma?

      We have now performed the CRISPR-mediated knock-out of ACKR4 in Burkitt lymphoma cells and found that it leads to a dramatic increase in chemokine-guided cell migration, which goes beyond correlation. This significant new result is mentioned in the revised abstract and presented in detail in Figures 4F and S5-S7.

      Regarding p53-AS isoforms, they are murine-specific isoforms (Marcel et al. (2011) Cell Death Diff 18, 1815-1824), so there is no information on p53-AS expression in Burkitt lymphoma. Human p53 isoforms with alternative C-terminal domains are p53b and p53g isoforms, but the datasets we analyzed did not provide any information on the relative levels of p53a (the canonical isoform), p53b or p53g isoforms. We agree with the referee that this is an interesting question, but that cannot be answered with currently available datasets.

      Regarding the different types of B-cell malignancies, we had already shown that Ackr4 is a male-specific prognostic factor in Burkitt lymphomas but not in Diffuse Large B cell lymphomas, which indicated that it is not a prognostic factor in all types of B cell lymphomas. For this revision, we also searched for its potential prognostic value in multiple myeloma, and found that, as for DLBCL, it is not a prognostic factor in this cancer type. This new analysis is presented in Figure S4C.

    1. Author response:

      The following is the authors’ response to the original reviews.

      Reviewer #1 (Public Review): 

      Summary: This article explores the role of Ecdysone in regulating female sexual receptivity in Drosophila. The researchers found that PTTH, throughout its role as a positive regulator of ecdysone production, negatively affects the receptivity of adult virgin females. Indeed, loss of larval PTTH before metamorphosis significantly increases female receptivity right after adult eclosion and also later. However, during metamorphic neurodevelopment, Ecdysone, primarily through its receptor EcR-A, is required to properly develop the P1 neurons since its silencing led to morphological changes associated with a reduction in adult female receptivity. Nonetheless, the result shown in this manuscript sheds light on how Ecdysone plays a dual role in female adult receptivity, inhibiting it during larval development and enhancing it during metamorphic development. Unfortunately, this dual and opposite effect in two temporally different developmental stages has not been highlighted or explained. 

      Strengths: This paper exhibits multiple strengths in its approach, employing a well-structured experimental methodology that combines genetic manipulations, behavioral assays, and molecular analysis to explore the impact of Ecdysone on regulating virgin female receptivity in Drosophila. The study provides clear and substantial findings, highlighting that removing PTTH, a positive Ecdysone regulator, increases virgin female receptivity. Additionally, the research expands into the temporal necessity of PTTH and Ecdysone function during development. 

      Weaknesses: 

      There are two important caveats with the data that are reflecting a weakness: 

      (1) Contradictory Effects of Ecdysone and PTTH: One notable weakness in the data is the contrasting effects observed between Ecdysone and its positive regulator PTTH. PTTH loss of function increases female receptivity, while ecdysone loss of function reduces it. Given that PTTH positively regulates Ecdysone, one would expect that the loss of function of both would result in a similar phenotype or at least a consistent directional change. 

      A1. As newly formed prepupae, the ptth-Gal4>UAS-Grim flies display similar changes in gene expression to the genetic control flies to response to a high-titer ecdysone pulse. These include the repression of EcR (McBrayer et al.,2007). We tested whether there is a similar feedforward relationship between PTTH and EcR-A. We quantified the EcR-A mRNA level of PTTH -/- and PTTH -/+ in the whole body of newly formed prepupae. Indeed, PTTH -/- induced increased EcR-A expression in the whole body of newly formed prepupae compared with PTTH -/+ flies. Because of the function of EcR-A in gene expression, this suggests that PTTH -/- disturbs the regulation of a serious of gene expressions during metamorphosis. However, it is not sure that the EcR-A expression in pC1 neurons is increased compared with genetic controls when PTTH is deleted. Furthermore, PTTH -/- must affect development of other neurons rather than only pC1 neurons. So, the feedforward relationship between PTTH and EcRA at the start of prepupal stage is one possible cause for the contradictory effects of PTTH -/- and EcR-A RNAi in pC1 neurons.  

      (2) Discordant Temporal Requirements for Ecdysone and PTTH: Another weakness lies in the different temporal requirements for Ecdysone and PTTH. The data from the manuscript suggest that PTTH is necessary during the larval stage, as shown in Figure 2 E-G, while Ecdysone is required during the pupal stage, as indicated in Figure 5 I-K. Ecdysone is a crucial developmental hormone with precisely regulated expression throughout development, exhibiting several peaks during both larval and pupal stages. PTTH is known to regulate Ecdysone during the larval stage, specifically by stimulating the kinetics of Ecdysone peaking at the wandering stage. However, it remains unclear whether pupal PTTH, expressed at higher levels during metamorphosis, can stimulate Ecdysone production during the pupal stage. Additionally, given the transient nature of the Ecdysone peak produced at wandering time, which disappears shortly before the end of the prepupal stage, it is challenging to infer that larval PTTH will regulate Ecdysone production during the pupal stage based on the current state of knowledge in the neuroendocrine field.  

      Considering these two caveats, the results suggest that the authors are witnessing distinct temporal and directional effects of Ecdysone on virgin female receptivity.  

      A2. First of all, it is necessary to clarify the detailed time for the manipulation of Ptth gene and PTTH neurons. In Figure 3, activation of PTTH neurons during the stage 2 inhibited the female receptivity. The “stage 2” is from six hours before the 3rd-instar larvae to the end of the wandering larvae (the start of prepupae). In Figure 5, The “pupal stage” is from the prepupal stage to the end of pupal stage. This “pupal stage” includes the forming of prepupae when the ecdysone peak is not disappeared. The time of manipulating Ptth and EcR-A in pC1 neurons are continuous. In addition, the pC1-Gal4 expressing neurons appear also at the start of prepupal stage. So, it is possible that PTTH regulates female receptivity through the function of EcR-A in pC1 neurons. 

      Reviewer #1 (Recommendations For The Authors): 

      In light of the significant caveat previously discussed, I will just make a few general suggestions: 

      (1) The paper primarily focuses on robust phenotypes, particularly in PTTH mutants, with a well-detailed execution of several experiments, resulting in thorough and robust outcomes. However, due to the caveat previously presented (opposite effect in larva and pupa), consider splitting the paper into two parts: Figures 1 to 4 deal with the negative effect of PTTH-Ecdysone on early virgin female receptivity, while Figures 5 to 7 focus on the positive metamorphic effect of Ecdysone in P1 metamorphic neurodevelopment. However, in this scenario, the mechanism by which PTTH loss of function increases female receptivity should be addressed.

      A3. It is a good suggestion that splitting the paper into two parts associated with the PTTH function and EcR function in pC1 neurons separately, if it is impossible that PTTH functions in female receptivity through the function of EcR-A in pC1 neurons. However, because of the feedforward relationship between PTTH and EcR-A in the newly formed prepupae, and the time of manipulating Ptth and EcR-A in pC1 neurons is continuous, it is possible that these two functions are not independent of each other. So, we still keep the initial edition.

      (2) Validate the PTTH mutants by examining homozygous mutant phenotypes and the dose-dependent heterozygous mutant phenotype using existing PTTH mutants. This could also be achieved using RNAi techniques.

      A4. We did not get other existing PTTH mutants. We instead decreased the PTTH expression in PTTH neurons and dsx+ neurons, but did not detect the similar phenotype to that of PTTH -/-. Similarly, the overexpression through PTTH-Gal4>UAS-PTTH is also not sufficient to change female receptivity. It is possible that both decreasing and increasing PTTH expression are not sufficient to change female receptivity.

      (3) Clarify if elav-Gal4 is not expressed in PTTH neurons and discuss how the rescue mechanisms work (hormonal, paracrine, etc.) in the text.

      A5. We tested the overlap of elav-Gal4>GFP signal and the stained PTTH with PTTH antibody. We did not detect the overlap. It suggests that elav-Gal4 is not expressed in PTTH neurons. However, we detected the expression of PTTH (PTTH antibody) in CNS when overexpressed PTTH using elav-Gal4>UASPTTH based on PTTH -/-. Furthermore, this rescued the phenotype of PTTH -/- in female receptivity. Insect PTTH isoforms have similar probable signal peptide for secreting. Indeed, except for the projection of axons to PG gland, PTTH also carries endocrine function acting on its receptor Torso in light sensors to regulate light avoidance of larvae. The overexpressed PTTH in other neurons through elav-Gal4>UASPTTH may act on the PG gland through endocrine function and then induce the ecdysone synthesis and release. So that, although elav-Gal4 is not expressed in PTTH neurons, the ecdysone synthesis triggered by PTTH from the hemolymph may result in the rescued PTTH -/- phenotype in female receptivity.

      (4) Consider renaming the new PTTH mutant to avoid confusion with the existing PTTHDelta allele. 

      A6. We have renamed our new PTTH mutant as PtthDelete.

      (5) Include the age of virgin females in each figure legend, especially for Figures 2 to 7, to aid in interpretation. This is essential information since wild-type early virgins -day 1- show no receptivity. In contrast, they reach a typical 80% receptivity later, and the mechanism regulating the first face might differ from the one occurring later.

      A7. We have included the age of virgin females in each figure legend. 

      (6) Explain the relevance of observing that PTTH adult neurons are dsx-positive, as it's unclear why this observation is significant, considering that these neurons are not responsible for the observed receptivity effect in virgin females. Alternatively, address this in the context of the third instar larva or clarify its relevance.  

      A8. We decreased the DsxF expression in PTTH neurons and did not detect significantly changed female receptivity. Almost all neurons regulating female receptivity, including pC1 neurons, express DsxF. We suppose that PTTH neurons have some relationship with other DsxF-positive neurons which regulate female receptivity. Indeed, we detected the overlap of dsx-LexA>LexAop-RFP and torso-Gal4>UAS-GFP during larval stage. Furthermore, decreasing Torso expression in pC1 neurons significantly inhibit female receptivity. 

      These results suggest that, PTTH regulates female receptivity not only through ecdysone, but also may through regulating other neurons especially DsxF-positive neurons associated with female receptivity directly. 

      Reviewer #2 (Public Review): 

      Summary: The authors tried to identify novel adult functions of the classical Drosophila juvenile-adult transition axis (i.e. ptth-ecdysone). Surprisingly, larval ptth-expressing neurons expressed the sex-specific doublesex gene, thus belonging to the sexual dimorphic circuit. Lack of ptth during late larval development caused enhanced female sexual receptivity, an effect rescued by supplying ecdysone in the food. Among many other cellular players, pC1 neurons control receptivity by encoding the mating status of females. Interestingly, during metamorphosis, a subtype of pC1 neurons required Ecdysone Receptor A in order to regulate such female receptivity. A transcriptomic analysis using pC1-specific Ecdyone signaling down-regulation gives some hints of possible downstream mechanisms. 

      Strengths: the manuscript showed solid genetic evidence that lack of ptth during development caused enhanced copulation rate in female flies, which includes ptth mutant rescue experiments by overexpressing ptth as well as by adding ecdysone-supplemented food. They also present elegant data dissecting the temporal requirements of ptth-expressing neurons by shifting animals from non-permissive to permissive temperatures, in order to inactivate neuronal function (although not exclusively ptth function). By combining different drivers together with a EcR-A RNAi line authors also identified the Ecdysone receptor requirements of a particular subtype of pC1 neurons during metamorphosis. Convincing live calcium imaging showed no apparent effect of EcR-A in neural activity, although some effect on morphology is uncovered. Finally, bulk RNAseq shows differential gene expression after EcR-A down-regulation. 

      Weaknesses: the paper has three main weaknesses. The first one refers to temporal requirements of ptth and ecdysone signaling. Whereas ptth is necessary during larval development, the ecdysone effect appears during pupal development. ptth induces ecdysone synthesis during larval development but there is no published evidence about a similar role for ptth during pupal stages. Furthermore, larval and pupal ecdysone functions are different (triggering metamorphosis vs tissue remodeling). The second caveat is the fact that ptth and ecdysone loss-of-function experiments render opposite effects (enhancing and decreasing copulation rates, respectively). The most plausible explanation is that both functions are independent of each other, also suggested by differential temporal requirements. Finally, in order to identify the effect in the transcriptional response of down-regulating EcR-A in a very small population of neurons, a scRNAseq study should have been performed instead of bulk RNAseq. 

      In summary, despite the authors providing convincing evidence that ptth and ecdysone signaling pathways are involved in female receptivity, the main claim that ptth regulates this process through ecdysone is not supported by results. More likely, they'd rather be independent processes. 

      B1. Clarification: in Figure 3, activation of PTTH neurons during the stage 2 inhibited the female receptivity. The “stage 2” is from six hours before the 3rd-instar larvae to the end of the wandering larvae (the start of prepupae). In Figure 5, The “pupal stage” is from the start of prepupal stage to the end of pupal stage. This “pupal stage” includes the forming of prepupae when the ecdysone peak is not disappeared. The time of manipulating Ptth and EcR-A in pC1 neurons are continuous. In addition, the pC1-Gal4 expressing neurons appear also at the start of prepupal stage. So, it is possible that PTTH regulates female receptivity through the function of EcR-A in pC1 neurons. 

      B2. During the forming of prepupae, the ptth-Gal4>UAS-Grim flies display similar changes in gene expression to the genetic control flies to response to a high-titer ecdysone pulse. These include the repression of EcR (McBrayer et al.,2007). We tested whether there is a similar feedforward relationship between PTTH and EcR-A. We quantified the EcR-A mRNA level of PTTH -/- and PTTH -/+ in the whole body of newly formed prepupae. Indeed, PTTH -/- induced increased EcR-A compared with PTTH -/+ flies. Because of the function of EcR-A in gene expression, this suggests that PTTH -/- disturbs the regulation of a serious of gene expressions during metamorphosis. However, it is not sure that the EcR-A expression in pC1 neurons is increased compared with genetic controls when PTTH is deleted. Furthermore, PTTH -/- must affect the development of other neurons rather than only pC1 neurons. So, the feedforward relationship between PTTH and EcR-A at the start of prepupal stage is one possible cause for the contradictory effects of PTTH -/- and EcR-A RNAi in pC1 neurons.

      B3. We will do single cell sequencing in pC1 neurons for the exploration of detailed molecular mechanism of female receptivity in the future.

      Reviewer #2 (Recommendations For The Authors): 

      Additional experiments and suggestions: 

      - torso LOF in the PG to determine whether or not the ecdysone peak regulated by ptth (there is a 1-day delay in pupation) is responsible for the ptth effect in L3. In the same line, what happens if torso is downregulated in the pC1 neurons? Is there any effect on copulation rates? 

      B4. Because the loss of phm-Gal4, we could not test female receptivity when decreasing the expression of Torso in PG gland. However, decreasing Torso expression in pC1 neurons significantly inhibit female receptivity. This suggests that PTTH regulates female receptivity not only through ecdysone but also through regulating dsx+ pC1 neurons in female receptivity directly.

      - What is the effect of down-regulating ptth in the dsx+ neurons? No ptth RNAi experiments are shown in the paper. 

      B5. We decreased PTTH expression in dsx+ neurons but did not detect the change in female receptivity.  We also decreased PTTH expression in PTTH neurons using PTTH-Gal4, also did not detect the change in female receptivity. Similarly, the overexpression through PTTH-Gal4>UAS-PTTH is also not sufficient to change female receptivity. It is possible that both decreasing and increasing PTTH expression are not sufficient to change female receptivity.

      - Why are most copulation rate experiments performed between 4-6 days after eclosion? ptth LOF effect only lasts until day 3 after eclosion (but very weak-fig 1). Again, this supports the idea that ptth and ecdysone effects are unrelated.

      B6. Most behavioral experiments were performed between 4-6 days after eclosion as most other studies in flies, because the female receptivity reaches the peak at that time. Ptth LOF made female receptivity enhanced from the first day after eclosion. This seems like the precocious puberty. Wild type females reach high receptivity at 2 days after eclosion (about 75% within 10 min). We suppose that Ptth LOF effect only lasts until day 3 after eclosion because too high level of receptivity of control flies to exceed.

      It is not sure whether the effect of PTTH-/- in female receptivity disappears after the 3rd day of adult flies. So that it is not sure whether PTTH and EcR-A effects in pC1 neurons are unrelated.

      - The fact that pC1d neuronal morphology changes (and not pC1b) does not explain the effect of EcR-A LOF. Despite it is highlighted in the discussion, data do not support the hypothesis. How do these pC1 neurons look like in a ptth mutant animal regarding Calcium imaging and/or morphology? 

      B7. We detected the pattern of pC1 neurons when PTTH is deleted. Consistent with the feedforward relationship between PTTH and expression of EcR-A in newly formed prepupae, PTTH deletion induced less established pC1-d neurons contrary to that induced by EcR-A reduction in pC1 neurons. However, it is not sure that the expression of EcR-A in pC1 neurons is increased when PTTH is deleted. Furthermore, on the one hand, manipulation of PTTH has general effect on the neurodevelopment not only regulating pC1 neurons. On the other hand, the detailed pattern of pC1-b neurons which is the key subtype regulating female receptivity when EcR-A is decreased in pC1 neurons or PTTH is deleted could not be seen clearly. So, the abnormal development of pC1-b neurons, if this is true, is just one of the possible reasons for the effect of PTTH deletion on female receptivity.

      - The discussion is incomplete, especially the link between ptth and ecdysone; discuss why the phenotype is the opposite (ptth as a negative regulator of ecdysone in the pupa, for instance); the difference in size due to ptth LOF might be related to differential copulation rates.  

      B8. We have revised the discussion. We could not exclude the effect of size of body on female receptivity when PTTH was deleted or PTTH neurons were manipulated, although there was not enough evidence for the effect of body size on female receptivity.

      - scheme of pC neurons may help. 

      B9. We have tried to label pC1 neurons with GFP and sort pC1 neurons through flow cytometry sorting, but could not success. This may because the number of pC1 neurons is too low in one brain. We will try single-cell sequencing in the future. 

      - Immunofluorescence images are too small.

      B10. We have resized the small images.

      Reviewer #3 (Public Review): 

      Summary: 

      This manuscript shows that mutations that disable the gene encoding the PTTH gene cause an increase in female receptivity (they mate more quickly), a phenotype that can be reversed by feeding these mutants the molting hormone, 20-hydoxyecdysone (20E). The use of an inducible system reveals that inhibition or activation of PTTH neurons during the larval stages increases and decreases female receptivity, respectively, suggesting that PTTH is required during the larval stages to affect the receptivity of the (adult) female fly. Showing that these neurons express the sex-determining gene dsx leads the authors to show that interfering with 20E actions in pC1 neurons, which are dsx-positive neurons known to regulate female receptivity, reduces female receptivity and increases the arborization pattern of pC1 neurons. The work concludes by showing that targeted knockdown of EcRA in pC1 neurons causes 527 genes to be differentially expressed in the brains of female flies, of which 123 passed a false discovery rate cutoff of 0.01; interestingly, the gene showing the greatest down-regulation was the gene encoding dopamine beta-monooxygenase. 

      Strengths 

      This is an interesting piece of work, which may shed light on the basis for the observation noted previously that flies lacking PTTH neurons show reproductive defects ("... females show reduced fecundity"; McBrayer, 2007; DOI 10.1016/j.devcel.2007.11.003). 

      Weaknesses: 

      There are some results whose interpretation seem ambiguous and findings whose causal relationship is implied but not demonstrated. 

      (1) At some level, the findings reported here are not at all surprising. Since 20E regulates the profound changes that occur in the central nervous system (CNS) during metamorphosis, it is not surprising that PTTH would play a role in this process. Although animals lacking PTTH (rather paradoxically) live to adulthood, they do show greatly extended larval instars and a corresponding great delay in the 20E rise that signals the start of metamorphosis. For this reason, concluding that PTTH plays a SPECIFIC role in regulating female receptivity seems a little misleading, since the metamorphic remodeling of the entire CNS is likely altered in PTTH mutants. Since these mutants produce overall normal (albeit larger--due to their prolonged larval stages) adults, these alterations are likely to be subtle. Courtship has been reported as one defect expressed by animals lacking PTTH neurons, but this behavior may stand out because reduced fertility and increased male-male courtship (McBrayer, 2007) would be noticeable defects to researchers handling these flies. By contrast, detecting defects in other behaviors (e.g., optomotor responses, learning and memory, sleep, etc) would require closer examination. For this reason, I would ask the authors to temper their statement that PTTH is SPECIFICALLY involved in regulating female receptivity.  

      C1. We agree with that, it is not surprising that PTTH regulates the profound changes that occur in the CNS during metamorphosis through ecdysone. Also, the behavioral changes induced by PTTH mutants include not only female receptivity. We will temper the statement about the function of PTTH on female receptivity.

      We think there are two new points in our text although more evidences are needed in the future. On the one hand, PTTH deletion and the reduction of EcR-A in pC1 neurons during metamorphosis have opposite effects on female receptivity. On the other hand, development of pC1-b neurons regulated by EcR-A during metamorphosis is important for female receptivity.

      (2) The link between PTTH and the role of pC1 neurons in regulating female receptivity is not clear. Again, since 20E controls the metamorphic changes that occur in the CNS, it is not surprising that 20E would regulate the arborization of pC1 neurons. And since these neurons have been implicated in female receptivity, it would therefore be expected that altering 20E signaling in pC1 neurons would affect this phenotype. However, this does not mean that the defects in female receptivity expressed by PTTH mutants are due to defects in pC1 arborization. For this, the authors would at least have to show that PTTH mutants show the changes in pC1 arborization shown in Fig. 6. And even then the most that could be said is that the changes observed in these neurons "may contribute" to the observed behavioral changes. Indeed, the changes observed in female receptivity may be caused by PTTH/20E actions on different neurons.

      C2. As newly formed prepupae, the ptth-Gal4>UAS-Grim flies display similar changes in gene expression to the genetic control flies to response to a high-titer ecdysone pulse. These include the repression of EcR (McBrayer et al., 2007). We tested whether there is a similar feedforward relationship between PTTH and EcR-A. We quantified the EcR-A mRNA level of PTTH -/- and PTTH -/+ in the whole body of newly formed prepupae. Indeed, PTTH -/- induced upregulated EcR-A in the whole body of newly formed prepupae compared with PTTH -/+ flies. We also detected the pattern of pC1 neurons when PTTH is deleted. Consistent with the feedforward relationship between PTTH and expression of EcR-A in newly formed prepupae, PTTH deletion induced less established pC1-d neurons contrary to that induced by EcR-A reduction in pC1 neurons. 

      However, it is not sure that the expression of EcR-A in pC1 neurons increases compared with genetic controls when PTTH is deleted. Furthermore, on the one hand, manipulation of PTTH has general effect on the neurodevelopment. On the other hand, the detailed pattern of pC1-b neurons which is the key subtype regulating female receptivity through EcR-A function in pC1 neurons could not be seen clearly. So, the abnormal development of pC1b neurons, if this is true, is just one of the possible reasons for the effect of PTTH deletion on female receptivity.

      (3) Some of the results need commenting on, or refining, or revising:  a- For some assays PTTH behaves sometimes like a recessive gene and at other times like a semidominant, and yet at others like a dominant gene. For instance, in Fig. 1D-G, PTTH[-]/+ flies behave like wildtype (D), express an intermediate phenotype (E-F), or behave like the mutant (G). This may all be correct but merits some comment.

      C3. Female receptivity increases with the increase of age after eclosion, not only for wild type flies but also PTTH mutants. At the first day after eclosion (Figure 1D), maybe the loss of PTTH in PTTH[-]/+ flies is not enough for sexual precocity as in PTTH -/-. At the second day after eclosion and after (Figure 1E-G), the loss of PTTH in PTTH[-]/+ flies is sufficient to enhance female receptivity compared with wild type flies. However, After the 2nd day of adult, female receptivity of all genotype flies increases sharply. At the 3rd day of adult and after, female receptivity of PTTH -/- reaches the peak and the receptivity of PTTH[-]/+ reaches more nearly to PTTH -/- when flies get older.  

      b - Some of the conclusions are overstated. i) Although Fig. 2E-G does show that silencing the PTTH neurons during the larval stages affects copulation rate (E) the strength of the conclusion is tempered by the behavior of one of the controls (tub-Gal80[ts]/+, UAS-Kir2.1/+) in panels F and G, where it behaves essentially the same as the experimental group (and quite differently from the PTTH-Gal4/+ control; blue line).(Incidentally, the corresponding copulation latency should also be shown for these data.). ii) For Fig. 5I-K, the conclusion stated is that "Knock-down of EcR-A during pupal stage significantly decreased the copulation rate." Although strictly correct, the problem is that panel J is the only one for which the behavior of the control lacking the RNAi is not the same as that of the experimental group. Thus, it could just be that when the experiment was done at the pupal stage is the only situation when the controls were both different from the experimental. Again, the results shown in J are strictly speaking correct but the statement is too definitive given the behavior of one of the controls in panels I and K. Note also that panel F shows that the UAS-RNAi control causes a massive decrease in female fertility, yet no mention is made of this fact.

      C4. i) For all figures in the text, only when all the control groups were significant different from assay group, we say the assay group is significantly different. In Figure 2E-G, the control groups were both different from the assay group only at the larval stage. The difference between two control groups may due to the genetic background. We have described more detailed statistical analysis in the legend. In addition, the corresponding copulation latency has been shown. ii) For Figure 5, we have revised the conclusion in text as “when the experiment was done at the pupal stage is the only situation when the controls were both different from the experimental.” Besides, the UAS-RNAi control causes a massive decrease in female fertility in panel F has been mentioned.

      Reviewer #3 (Recommendations For The Authors): 

      (1) I am not sure that PTTH neurons should be referred to as "PG neurons". I am aware that this name has been used before but the PG is a gland that does not have neurons; it is not even innervated in all insects. 

      C5. Agree. “PG neurons” has been changed into “PTTH neurons”.

      (2) Fig. 1A warrants some explanation. One can easily imagine what it shows but a description is warranted. 

      C6. Explanation has been added.

      (3) When more than one genotype is compared it would be more useful to use letters to mark the genotypes that are not statistically different from each other rather than simply using asterisks. For instance, in the case of copulation latencies shown in Fig. 1E-G, which result does the comparison refer to? For example, since the comparisons are the result of ANOVAs, which comparison receives "*" in Fig. 1F? Is it PTTH[-]/+ vs PTTH[-]/PTTH[-] or vs. +/+? 

      C7. Referred genotypes and conditions were marked in all figure legends.

      (4) Fig. 1H: Why is copulation latency of PTTH[-]/PTTH[-]+elav-GAL4 significantly different from that of PTTH[-]/PTTH[-]? This merits a comment. Also, why was elav-GAL4 used to effect the rescue and not the PTTH-GAL4 driver? 

      C8. We could not explain this phenomenon. This may due to the different genetic backgrounds between controls. We have mentioned this in figure legend.

      (5) Fig. 2C, the genotype is written in a confusing order, GAL4+UAS should go together as should LexA+LexAop. 

      C9. We have revised for avoiding confusion.

      (6) In Fig. 2, is "larval stage" the same period that is shown in Fig. 3A? Please clarify.

      C10. We have clarified this in text and legends.

      (7) Fig. 6. The fact that pC1 neurons can be labeled using the pC1-ss2-Gal4 at the start of the pupal stage does not mean that this is when these neurons appear (are born), only when they start expressing this GAL4. Other types of evidence would be needed to make a statement about the birthdate of these neurons. 

      C11. We have revised the description for the appearance of pC1-ss2-Gal4>GFP. The detailed birth time of pC1 neurons will be tested in future.

      (8) The results shown in Fig. 7 are not pursued further and thus appear like a prelude to the next manuscript. Unless the authors have more to add regarding the role of one of the differentially expressed genes (e.g., dopamine beta-monooxygenase, which they single out) I would suggest leaving this result out. 

      C12. We have leave this out.

      (9) Female flies lacking PTTH neurons were reported to show lower fecundity by McBrayer et al. (2007) and should be cited. 

      C13. This important study has been cited in the first manuscript. In this revision, we have cited it again when mentioning the lower fecundity of female flies lacking PTTH neurons.

      (10) Line 230: when were PTTH neurons activated? Since they are dead by 10h post-eclosion it isn't clear if this experiment even makes sense. 

      C14. Yes, we did this for making sure that PTTH neurons do not affect female receptivity at adult stage again.

      (11) Line 338: the statements in the figures say that PTTH function is required during the larval stages, not during metamorphosis 

      C15. This has been revised as “The result suggested that EcR-A in pC1 neurons plays a role in virgin female receptivity during metamorphosis. This is consistent with that PTTH regulates virgin female receptivity before the start of metamorphosis.”

      (12) Did the authors notice any abnormal behavior in males? McBrayer et al. (2007) mention that males lacking PTTH neurons show male-male courtship. This may remit to the impact of 20E on other dsx[+] neurons. 

      C16. Yes, we have noticed that males lacking PTTH show male-male courtship. It is possible that PTTH deletion induces male-male courtship through the impact of 20E on other dsx+ or fru+ neurons. We have added the corresponding discussion.

      (13) Line 145: please define CCT at first use 

      C17. CCT has been defined.

      (14) Overall the manuscript is well written; however, it would still benefit from editing by a native English speaker. I have marked a few corrections that are needed, but I probably missed some. 

      + Line 77: "If female is not willing..." should say "If THE female is not willing..." 

      + Line 78 "...she may kick the legs, flick the wings," should say "...she may kick HER legs, flick HER wings," 

      + Lines 93-94 this sentence is unclear: "...while the neurons in that fru P1 promoter or dsx is expressed regulate some aspects..." 

      + Line 108 "...similar as the function of hypothalamic-pituitary-gonadal (HPG).." should say "...similar

      TO the function of hypothalamic-pituitary-gonadal (HPG).." 

      + Line 152 "Due to that 20E functions through its receptor EcR.." should say ""BECAUSE 20E ACTS through its receptor EcR.." 

      + Lines 155, 354 "unnormal" is not commonly used (although it is an English word); "abnormal" is usually used instead. 

      + Line 273: "....we then asked that whether ecdysone regulates" delete "that"  + Sentences lines 306-309 need to be revised.

      C18. Thank you for your suggestions. We have revised as you advise.

    1. Author response:

      The following is the authors’ response to the previous reviews.

      Reviewer #1 (Public Review): 

      The reviewer retained most of their comments from the previous reviewing round. In order to meet these comments and to further examine the dynamic nature of threat omission-related fMRI responses, we now re-analyzed our fMRI results using the single trial estimates. The results of these additional analyses are added below in our response to the recommendations for the authors of reviewer 1. However, we do want to reiterate that there was a factually incorrect statement concerning our design in the reviewer’s initial comments. Specifically, the reviewer wrote that “25% of shocks are omitted, regardless of whether subjects are told that the probability is 100%, 75%, 50%, 25%, or 0%.” We want to repeat that this is not what we did. 100% trials were always reinforced (100% reinforcement rate); 0% trials were never reinforced (0% reinforcement rate). For all other instructed probability levels (25%, 50%, 75%), the stimulation was delivered in 25% of the trials (25% reinforcement rate). We have elaborated on this misconception in our previous letter and have added this information more explicitly in the previous revision of the manuscript (e.g., lines 125-129; 223-224; 486-492).   

      Reviewer #1 (Recommendations For The Authors): 

      I do not have any further recommendations, although I believe an analysis of learning-related changes is still possible with the trial-wise estimates from unreinforced trials. The authors' response does not clarify whether they tested for interactions with run, and thus the fact that there are main effects does not preclude learning. I kept my original comments regarding limitations, with the exception of the suggestion to modify the title. 

      We thank the reviewer for this recommendation. In line with their suggestion, we have now reanalyzed our main ROI results using the trial-by-trial estimates we obtained from the firstlevel omission>baseline contrasts. Specifically, we extracted beta-estimates from each ROI and entered them into the same Probability x Intensity x Run LMM we used for the relief and SCR analyses. Results from these analyses (in the full sample) were similar to our main results. For the VTA/SN model, we found main effects of Probability (F = 3.12, p = .04), and Intensity (F = 7.15, p < .001) (in the model where influential outliers were rescored to 2SD from mean). There was no main effect of Run (F = 0.92, p = .43) and no Probability x Run interaction (F = 1.24, p = .28). If the experienced contingency would have interfered with the instructions, there should have been a Probability x Run interaction (with the effect of Probability only being present in the first runs). Since we did not observe such an interaction, our results indicate that even though some learning might still have taken place, the main effect of Probability remained present throughout the task.  

      There is an important side note regarding these analyses: For the first level GLM estimation, we concatenated the functional runs and accounted for baseline differences between runs by adding run-specific intercepts as regressors of no-interest. Hence, any potential main effect of run was likely modeled out at first level. This might explain why, in contrast to the rating and SCR results (see Supplemental Figure 5), we found no main effect of Run. Nevertheless, interaction effects should not be affected by including these run-specific intercepts.

      Note that when we ran the single-trial analysis for the ventral putamen ROI, the effect of intensity became significant (F = 3.89, p = .02). Results neither changed for the NAc, nor the vmPFC ROIs.  

      Reviewer #2 (Public Review): 

      Comments on revised version: 

      I want to thank the authors for their thorough and comprehensive work in revising this manuscript. I agree with the authors that learning paradigms might not be a necessity when it comes to study the PE signals, but I don't particularly agree with some of the responses in the rebuttal letter ("Furthermore, conditioning paradigms generally only include one level of aversive outcome: the electrical stimulation is either delivered or omitted."). This is of course correct description for the conditioning paradigm, but the same can be said for an instructed design: the aversive outcome was either delivered or not. That being said, adopting the instructed design itself is legitimate in my opinion. 

      We thank the reviewer for this comment. We have now modified the phrasing of this argument to clarify our reasoning (see lines 102-104: “First, these only included one level of aversive outcome: the electrical stimulation was either delivered at a fixed intensity, or omitted; but the intensity of the stimulation was never experimentally manipulated within the same task.”).  

      The reason why we mentioned that “the aversive outcome is either delivered or omitted” is because in most contemporary conditioning paradigms only one level of aversive US is used. In these cases, it is therefore not possible to investigate the effect of US Intensity. In our paradigm, we included multiple levels of aversive US, allowing us to assess how the level of aversiveness influences threat omission responding. It is indeed true that each level was delivered or not. However, our data clearly (and robustly across experiments, see Willems & Vervliet, 2021) demonstrate that the effects of the instructed and perceived unpleasantness of the US (as operationalized by the mean reported US unpleasantness during the task) on the reported relief and the omission fMRI responses are stronger than the effect of instructed probability.  

      My main concern, which the authors spent quite some length in the rebuttal letter to address, still remains about the validity for different instructed probabilities. Although subjects were told that the trials were independent, the big difference between 75% and 25% would more than likely confuse the subjects, especially given that most of us would fall prey to the Gambler's fallacy (or the law of small numbers) to some degree. When the instruction and subjective experience collides, some form of inference or learning must have occurred, making the otherwise straightforward analysis more complex. Therefore, I believe that a more rigorous/quantitative learning modeling work can dramatically improve the validity of the results. Of course, I also realize how much extra work is needed to append the computational part but without it there is always a theoretical loophole in the current experimental design. 

      We agree with the reviewer that some learning may have occurred in our task. However, we believe the most important question in relation to our study is: to what extent did this learning influence our manipulations of interest?  

      In our reply to reviewer 1, we already showed that a re-analysis of the fMRI results using the trial-by-trial estimates of the omission contrasts revealed no Probability x Run interaction, suggesting that – overall – the probability effect remained stable over the course of the experiment. However, inspired by the alternative explanation that was proposed by this reviewer, we now also assessed the role of the Gambler’s fallacy in a separate set of analyses. Indeed, it is possible that participants start to expect a stimulation more after more time has passed since the last stimulation was experienced. To test this alternative hypothesis, we specified two new regressors that calculated for each trial of each participant how many trials had passed since the last stimulation (or since the beginning of the experiment) either overall (across all trials of all probability types; hence called the overall-lag regressor) or per probability level (across trials of each probability type separately; hence called the lag-per-probability regressor). For both regressors a value of 0 indicates that the previous trial was either a stimulation trial or the start of experiment, a value of 1 means that the last stimulation trial was 2 trials ago, etc.  

      The results of these additional analyses are added in a supplemental note (see supplemental note 6), and referred to in the main text (see lines 231-236: “Likewise, a post-hoc trial-by-trial analysis of the omission-related fMRI activations confirmed that the Probability effect for the VTA/SN activations was stable over the course of the experiment (no Probability x Run interaction) and remained present when accounting for the Gambler’s fallacy (i.e., the possibility that participants start to expect a stimulation more when more time has passed since the last stimulation was experienced) (see supplemental note 6). Overall, these post-hoc analyses further confirm the PE-profile of omission-related VTA/SN responses”.  

      Addition to supplemental material (pages 16-18)

      Supplemental Note 6: The effect of Run and the Gambler’s Fallacy 

      A question that was raised by the reviewers was whether omission-related responses could be influenced by dynamical learning or the Gambler’s Fallacy, which might have affected the effectiveness of the Probability manipulation.  

      Inspired by this question, we exploratorily assessed the role of the Gambler’s Fallacy and the effects of Run in a separate set of analyses. Indeed, it is possible that participants start to expect a stimulation more when more time has passed since the last stimulation was experienced. To test this alternative hypothesis, we specified two new regressors that calculated for each trial of each participant how many trials had passed since the last stimulation (or since the beginning of the experiment) either overall (across all trials of all probability types; hence called the overall-lag regressor) or per probability level (across trials of each probability type separately; hence called the lag-per-probability regressor). For both regressors a value of 0 indicates that the previous trial was either a stimulation trial or the start of experiment, a value of 1 means that the last stimulation trial was 2 trials ago, etc.  

      The new models including these regressors for each omission response type (i.e., omission-related activations for each ROI, relief, and omission-SCR) were specified as follows:   

      (1) For the overall lag:

      Omission response ~ Probability * Intensity * Run + US-unpleasantness + Overall-lag + (1|Subject).  

      (2) For the lag per probability level:

      Omission response ~ Probability * Intensity * Run + US-unpleasantness + Lag-perprobability : Probability + (1|Subject).  

      Where US-unpleasantness scores were mean-centered across participants; “*” represents main effects and interactions, and “:” represents an interaction (without main effect). Note that we only included an interaction for the lag-per-probability model to estimate separate lag-parameters for each probability level.  

      The results of these analyses are presented in the tables below. Overall, we found that adding these lag-regressors to the model did not alter our main results. That is: for the VTA/SN, relief and omission-SCR, the main effects of Probability and Intensity remained. Interestingly, the overall-lag-effect itself was significant for VTA/SN activations and omission SCR, indicating that VTA/SN activations were larger when more time had passed since the last stimulation (beta = 0.19), whereas SCR were smaller when more time had passed (beta = -0.03). This pattern is reminiscent of the Perruchet effect, namely that the explicit expectancy of a US increases over a run of non-reinforced trials (in line with the gambler’s fallacy effect) whereas the conditioned physiological response to the conditional stimulus declines (in line with an extinction effect, Perruchet, 1985; McAndrew, Jones, McLaren, & McLaren, 2012). Thus, the observed dissociation between the VTA/SN activations and omission SCR might similarly point to two distinctive processes where VTA/SN activations are more dependent on a consciously controlled process that is subjected to the gambler’s fallacy, whereas the strength of the omission SCR responses is more dependent on an automatic associative process that is subjected to extinction. Importantly, however, even though the temporal distance to the last stimulation had these opposing effects on VTA/SN activations and omission SCRs, the main effects of the probability manipulation remained significant for both outcome variables. This means that the core results of our study still hold.   

      Next to the overall-lag effect, the lag-per-probability regressor was only significant for the vmPFC. A follow-up of the beta estimates of the lag-per-probability regressors for each probability level revealed that vmPFC activations increased with increasing temporal distance from the stimulation, but only for the 50% trials (beta = 0.47, t = 2.75, p < .01), and not the 25% (beta = 0.25, t = 1.49, p = .14) or the 75% trials (beta = 0.28, t = 1.62, p = .10).

      Author response table 1.

      F-statistics and corresponding p-values from the overall lag model

      (*) F-test and p-values were based on the model where outliers were rescored to 2SD from the mean. Note that when retaining the influential outliers for this model, the p-value of the probability effect was p = .06. For all other outcome variables, rescoring the outliers did not change the results. Significant effects are indicated in bold.

      Author response table 2.

      Table 2 F-statistics and corresponding p-values from the lag per probability level model

      (*) F-test and p-values were based on the model where outliers were rescored to 2SD from the mean. Note that when retaining the influential outliers for this model, the p-value of the Intensity x Run interaction was p = .05. For all other outcome variables, rescoring the outliers did not change the results. Significant effects are indicated in bold.

      As the authors mentioned in the rebuttal letter, "selecting participants only if their anticipatory SCR monotonically increased with each increase in instructed probability 0% < 25% < 50% < 75% < 100%, N = 11 participants", only ~1/3 of the subjects actually showed strong evidence for the validity of the instructions. This further raises the question of whether the instructed design, due to the interference of false instruction and the dynamic learning among trials, is solid enough to test the hypothesis .  

      We agree with the reviewer that a monotonic increase in anticipatory SCR with increasing probability instructions would provide the strongest evidence that the manipulation worked. However, it is well known that SCR is a noisy measure, and so the chances to see this monotonic increase are rather small, even if the underlying threat anticipation increases monotonically. Furthermore, between-subject variation is substantial in physiological measures, and it is not uncommon to observe, e.g., differential fear conditioning in one measure, but not in another (Lonsdorf & Merz, 2017). It is therefore not so surprising that ‘only’ 1/3 of our participants showed the perfect pattern of monotonically increasing SCR with increasing probability instructions. That being said, it is also important to note that not all participants were considered for these follow-up analyses because valid SCR data was not always available.

      Specifically, N = 4 participants were identified as anticipation non-responders (i.e. participant with smaller average SCR to the clock on 100% than on 0% trials; pre-registered criterium) and were excluded from the SCR-related analyses, and N = 1 participant had missing data due to technical difficulties. This means that only 26 (and not 31) participants were considered for the post hoc analyses. Taking this information into account, this means that 21 out of 26 participants (approximately 80%) showed stronger anticipatory SCR following 75% instructions compared to 25% instructions and that  11 out of 26 participants (approximately 40%) even showed the monotonical increase in their anticipatory SCR (see supplemental figure 4). Furthermore, although anticipatory SCR gradually decreased over the course of the experiment, there was no Run x Probability interaction, indicating that the instructions remained stable throughout the task (see supplemental figure 3).  

      Reviewer #2 (Recommendations For The Authors):

      A more operational approach might be to break the trials into different sections along the timeline and examine how much the results might have been affected across time. I expect the manipulation checks would hold for the first one or two runs and the authors then would have good reasons to focus on the behavioral and imaging results for those runs. 

      This recommendation resembles the recommendation by reviewer 1. In our reply to reviewer 1, we showed the results of a re-analysis of the fMRI data using the trial-by-trial estimates of the omission contrasts, which revealed no Probability x Run interaction, suggesting that – overall - the probability effect remained (more or less) stable over the course of the experiment.  For a more in depth discussion of the results of this additional analysis, we refer to our answer to reviewer 1.  

      Reviewer #3 (Public Review): 

      Comments on revised version: 

      The authors were extremely responsive to the comments and provided a comprehensive rebuttal letter with a lot of detail to address the comments. The authors clarified their methodology, and rationale for their task design, which required some more explanation (at least for me) to understand. Some of the design elements were not clear to me in the original paper. 

      The initial framing for their study is still in the domain of learning. The paper starts off with a description of extinction as the prime example of when threat is omitted. This could lead a reader to think the paper would speak to the role of prediction errors in extinction learning processes. But this is not their goal, as they emphasize repeatedly in their rebuttal letter. The revision also now details how using a conditioning/extinction framework doesn't suit their experimental needs. 

      We thank the reviewer for pointing out this potential cause of confusion. We have now rewritten the starting paragraph of the introduction to more closely focus on prediction errors, and only discuss fear extinction as a potential paradigm that has been used to study the role of threat omission PE for fear extinction learning (see lines 40-55). We hope that these adaptations are sufficient to prevent any false expectations. However, as we have mentioned in our previous response letter, not talking about fear extinction at all would also not make sense in our opinion, since most of the knowledge we have gained about threat omission prediction errors to date is based on studies that employed these paradigms.  

      Adaptation in the revised manuscript (lines 40-55):  

      “We experience pleasurable relief when an expected threat stays away1. This relief indicates that the outcome we experienced (“nothing”) was better than we expected it to be (“threat”). Such a mismatch between expectation and outcome is generally regarded as the trigger for new learning, and is typically formalized as the prediction error (PE) that determines how much there can be learned in any given situation2. Over the last two decades, the PE elicited by the absence of expected threat (threat omission PE) has received increasing scientific interest, because it is thought to play a central role in learning of safety. Impaired safety learning is one of the core features of clinical anxiety4. A better understanding of how the threat omission PE is processed in the brain may therefore be key to optimizing therapeutic efforts to boost safety learning. Yet, despite its theoretical and clinical importance, research on how the threat omission PE is computed in the brain is only emerging.  

      To date, the threat omission PE has mainly been studied using fear extinction paradigms that mimic safety learning by repeatedly confronting a human or animal with a threat predicting cue (conditional stimulus, CS; e.g. a tone) in the absence of a previously associated aversive event (unconditional stimulus, US; e.g., an electrical stimulation). These (primarily non-human) studies have revealed that there are striking similarities between the PE elicited by unexpected threat omission and the PE elicited by unexpected reward.”

      It is reasonable to develop a new task to answer their experimental questions. By no means is there a requirement to use a conditioning/extinction paradigm to address their questions. As they say, "it is not necessary to adopt a learning paradigm to study omission responses", which I agree with.  But the authors seem to want to have it both ways: they frame their paper around how important prediction errors are to extinction processes, but then go out of their way to say how they can't test their hypotheses with a learning paradigm.

      Part of their argument that they needed to develop their own task "outside of a learning context" goes as follows: 

      (1) "...conditioning paradigms generally only include one level of aversive outcome: the electrical stimulation is either delivered or omitted. As a result, the magnitude-related axiom cannot be tested." 

      (2) "....in conditioning tasks people generally learn fast, rendering relatively few trials on which the prediction is violated. As a result, there is generally little intra-individual variability in the PE responses" 

      (3) "...because of the relatively low signal to noise ratio in fMRI measures, fear extinction studies often pool across trials to compare omission-related activity between early and late extinction, which further reduces the necessary variability to properly evaluate the probability axiom" 

      These points seem to hinge on how tasks are "generally" constructed. However, there are many adaptations to learning tasks:

      (1) There is no rule that conditioning can't include different levels of aversive outcomes following different cues. In fact, their own design uses multiple cues that signal different intensities and probabilities. Saying that conditioning "generally only include one level of aversive outcome" is not an explanation for why "these paradigms are not tailored" for their research purposes. There are also several conditioning studies that have used different cues to signal different outcome probabilities. This is not uncommon, and in fact is what they use in their study, only with an instruction rather than through learning through experience, per se.

      (2) Conditioning/extinction doesn't have to occur fast. Just because people "generally learn fast" doesn't mean this has to be the case. Experiments can be designed to make learning more challenging or take longer (e.g., partial reinforcement). And there can be intra-individual differences in conditioning and extinction, especially if some cues have a lower probability of predicting the US than others. Again, because most conditioning tasks are usually constructed in a fairly simplistic manner doesn't negate the utility of learning paradigms to address PEaxioms.

      (3) Many studies have tracked trial-by-trial BOLD signal in learning studies (e.g., using parametric modulation). Again, just because other studies "often pool across trials" is not an explanation for these paradigms being ill-suited to study prediction errors. Indeed, most computational models used in fMRI are predicated on analyzing data at the trial level. 

      We thank the reviewer for these remarks. The “fear conditioning and extinction paradigms” that we were referring to in this paragraph were the ones that have been used to study threat omission PE responses in previous research (e.g., Raczka et al., 2011; Thiele et al. 2021; Lange et al. 2020; Esser et al., 2021; Papalini et al., 2021; Vervliet et al. 2017). These studies have mainly used differential/multiple-cue protocols where either one (or two) CS+  and one CS- are trained in an acquisition phase and extinguished in the next phase. Thus, in these paradigms: (1) only one level of aversive US is used; and (2) as safety learning develops over the course of extinction, there are relatively few omission trials during which “large” threat omission PEs can be observed (e.g. from the 24 CS+ trials that were used during extinction in Esser et al., the steepest decreases in expectancy – and thus the largest PE – were found in first 6 trials); and (3) there was never absolute certainty that the stimulation will no longer follow. Some of these studies have indeed estimated the threat omission PE during the extinction phase based on learning models, and have entered these estimates as parametric modulators to CS-offset regressors. This is very informative. However, the exact model that was used differed per study (e.g. Rescorla-Wagner in Raczka et al. and Thiele et al.; or a Rescorla- Wagner–Pearce- Hall hybrid model in Esser et al.). We wanted to analyze threat omission-responses without commitment to a particular learning model. Thus, in order to examine how threat omissionresponses vary as a function of probability-related expectations, a paradigm that has multiple probability levels is recommended (e.g. Rutledge et al., 2010; Ojala et al., 2022)

      The reviewer rightfully pointed out that conditioning paradigms (more generally) can be tailored to fit our purposes as well. Still, when doing so, the same adaptations as we outlined above need to be considered: i.e. include different levels of US intensity; different levels of probability; and conditions with full certainty about the US (non)occurrence. In our attempt to keep the experimental design as simple and straightforward as possible, we decided to rely on instructions for this purpose, rather than to train 3 (US levels) x 5 (reinforcement levels) = 15 different CSs. It is certainly possible to train multiple CSs of varying reinforcement rates (e.g. Grings et al. 1971, Ojala et al., 2022). However, given that US-expectation on each trial would primarily depend on the individual learning processes of the participants, using a conditioning task would make it more difficult to maintain experimental control over the level of USexpectation elicited by each CS. As a result, this would likely require more extensive training, and thus prolong the study procedure considerably. Furthermore, even though previous studies have trained different CSs for different reinforcement rates, most of these studies have only used one level of US. Thus, in order to not complexify our task to much, we decided to rely on instructions rather than to train CSs for multiple US levels (in addition to multiple reinforcement rates).

      We have tried to clarify our reasoning in the revised version of the manuscript (see introduction, lines 100-113):  

      “The previously discussed fear conditioning and extinction studies have been invaluable for clarifying the role of the threat omission PE within a learning context. However, these studies were not tailored to create the varying intensity and probability-related conditions that are required to systematically evaluate the threat omission PE in the light of the PE axioms. First, these only included one level of aversive outcome: the electrical stimulation was either delivered or omitted; but the intensity of the stimulation was never experimentally manipulated within the same task. As a result, the magnitude-related axiom could not be tested. Second, as safety learning progressively developed over the course of extinction learning, the most informative trials to evaluate the probability axiom (i.e. the trials with the largest PE) were restricted to the first few CS+ offsets of the extinction phase, and the exact number of these informative trials likely differed across participants as a result of individually varying learning rates. This limited the experimental control and necessary variability to systematically evaluate the probability axiom. Third, because CS-US contingencies changed over the course of the task (e.g. from acquisition to extinction), there was never complete certainty about whether the US would (not) follow. This precluded a direct comparison of fully predicted outcomes. Finally, within a learning context, it remains unclear whether brain responses to the threat omission are in fact responses to the violation of expectancy itself, or whether they are the result of subsequent expectancy updating.”

      Again, the authors are free to develop their own task design that they think is best suited to address their experimental questions. For instance, if they truly believe that omission-related responses should be studied independent of updating. The question I'm still left puzzling is why the paper is so strongly framed around extinction (the word appears several times in the main body of the paper), which is a learning process, and yet the authors go out of their way to say that they can only test their hypotheses outside of a learning paradigm. 

      As we have mentioned before, the reason why we refer to extinction studies is because most evidence on threat omission PE to date comes from fear extinction paradigms.  

      The authors did address other areas of concern, to varying extents. Some of these issues were somewhat glossed over in the rebuttal letter by noting them as limitations. For example, the issue with comparing 100% stimulation to 0% stimulation, when the shock contaminates the fMRI signal. This was noted as a limitation that should be addressed in future studies, bypassing the critical point. 

      It is unclear to us what the reviewer means with “bypassing the critical point”. We argued in the manuscript that the contrast we initially specified and preregistered to study axiom 3 (fully predicted outcomes elicit equivalent activation) could not be used for this purpose, as it was confounded by the delivery of the stimulation. Because 100% trials aways included the stimulation and 0% trials never included stimulation, there was no way to disentangle activations related to full predictability from activations related to the stimulation as such.   

      Reviewer #3 (Recommendations For The Authors): 

      I'm not sure the new paragraph explaining why they can't use a learning task to test their hypotheses is very convincing, as I noted in my review. Again, it is not a problem to develop a new task to address their questions. They can justify why they want to use their task without describing (incorrectly in my opinion) that other tasks "generally" are constructed in a way that doesn't suit their needs. 

      For an overview of the changes we made in response to this recommendation, we refer to our reply to the public review.   

      We look forward to your reply and are happy to provide answers to any further questions or comments you may have.

    1. Author response:

      The following is the authors’ response to the original reviews.

      The manuscript lacks the conclusion section to summarize their finding. The rebuttal is too simple to state where and in which way the authors have made their revisions. In this case, please return this revision to the authors and ask them revise their contribution carefully.

      We now indicate in detail the places and the way that we make revisions. Specific revisions in sentences/words are marked with blue color in the main text where necessary. A conclusion is now provided at the end of the main text (lines 264-275). Other major revisions include:

      (1) We add Fig. 5 as a new figure to reconstruct ovule structure of Alasemenia and to compare three- and four-winged ovules. This is followed by Fig. 6 relating to mathematical analysis.

      (2) We re-organize (sequences of some) paragraphs and revise sentences in Discussion, and then divide Discussion into three parts: “Late Devonian acupulate ovules and their functions” (lines 124-150), “Late Devonian winged ovules and evolution of ovular wings” (lines 151-179), “Mathematical analysis of wind dispersal of ovules with 1-4 wings” (lines 180-262).

      (3) We move “Mathematical analysis of wind dispersal of ovules with 1-4 wings” section from the supplementary information to the main text as the third part of Discussion (lines 180-262). The original paragraph headed with Mathematical analysis in Results is now modified and inserted to “Mathematical analysis of wind dispersal of ovules with 1-4 wings” section (lines 250-256). The last paragraph in the original Supplementary information is now greatly modified and presented at the end of “Mathematical analysis of wind dispersal of ovules with 1-4 wings” section (lines 256-262).

      (4) With moving “Mathematical analysis of wind dispersal of ovules with 1-4 wings” section from the supplementary information to the main text, five references are accordingly added to the list (lines 278-282, 296-300, 329-330).

      (5) We change the format of citing references in the main text.

      We have therefore returned your manuscript to you to allow you to make the updates necessary to address the editors comments. Please ensure that you also update your preprint with the newly revised version once complete.

      Many thanks for this allowance and we now make the necessary updates to address the editors’ and reviewers’ comments. At the same time, the new version is also provided as a preprint.

      Reviewer #1 (Public Review):

      Summary:

      Winged seeds or ovules from the Devonian are crucial to understanding the origin and early evolutionary history of wind dispersal strategy. Based on exceptionally well-preserved fossil specimens, the present manuscript documented a new fossil plant taxon (new genus and new species) from the Famennian Series of Upper Devonian in eastern China and demonstrated that three-winged seeds are more adapted to wind dispersal than one-, two- and four-winged seeds by using mathematical analysis.

      Many thanks for these positive comments by the reviewer.

      Strengths:

      The manuscript is well organised and well presented, with superb illustrations. The methods used in the manuscript are appropriate.

      Many thanks for the reviewer’s positive comments.

      Weaknesses:

      I would only like to suggest moving the "Mathematical analysis of wind dispersal of ovules with 1-4 wings" section from the supplementary information to the main text, leaving the supplementary figures as supplementary materials.

      Ok, following the suggestion, we have moved this “Mathematical analysis of wind dispersal of ovules with 1-4 wings” section to the main text (lines 180-262). It now represents the third part of Discussion. The original paragraph headed with Mathematical analysis in Results is now modified and inserted to “Mathematical analysis of wind dispersal of ovules with 1-4 wings” section (lines 250-256). The last paragraph in the original Supplementary information is now greatly modified and presented at the end of “Mathematical analysis of wind dispersal of ovules with 1-4 wings” section (lines 256-262).

      Reviewer #2 (Public Review):

      Summary:

      This manuscript described the second earliest known winged ovule without a capule in the Famennian of Late Devonian. Using Mathematical analysis, the authors suggest that the integuments of the earliest ovules without a cupule, as in the new taxon and Guazia, evolved functions in wind dispersal.

      Yes, these include our description, mathematical analysis and suggestion.

      Strengths:

      The new ovule taxon's morphological part is convincing. It provides additional evidence for the earliest winged ovules, and the mathematical analysis helps to understand their function.

      Many thanks for these positive comments of the reviewer.

      Weaknesses:

      The discussion should be enhanced to clarify the significance of this finding. What is the new advance compared with the Guazia finding? The authors can illustrate the character transformations using a simplified cladogram. The present version of the main text looks flat.

      To clarify the significance of this finding, the discussion is now enhanced in the following respects. We now re-organize the contents of Discussion and divide it into three parts. These three parts are entitled “Late Devonian acupulate ovules and their functions” (lines 124-150), “Late Devonian winged ovules and evolution of ovular wings” (lines 151-179), “Mathematical analysis of wind dispersal of ovules with 1-4 wings” (lines 180-262). The third part is transformed from the original Supplementary information.

      Regarding new advance (Alasemenia) compared with Guazia and illustration of the character transformations:

      (1) we now provide a new figure (Fig. 5) to reconstruct ovule of Alasemenia and to compare the structure of these two ovules.

      (2) in the second part of Discussion, we now say “As in Alasemenia (Fig. 5a), the integumentary wings of acupulate ovule of Guazia are broad, thin and fold inwards along the abaxial side, but their numbers are four in each ovule and their free portions usually arch centripetally (Fig. 5c; Wang et al., 2022, Figure 5).”

      (3) also in the second part of Discussion, we now say “Compared to Warsteinia with short and straight wings and Guazia with long but distally inwards curving wings, Alasemenia with longer and outwards extending wings would efficiently reduce the rate of descent and be more capably moved by wind. Furthermore, the quantitative analysis in mathematics indicates that three-winged ovules such as Alasemenia are more adapted to wind dispersal than four-winged ovules including Warsteinia and Guazia (see following).”

      (4) in the third part of Discussion, we now say “Significantly, the maximum windward area of each wing of Alasemenia is greater than that of Guazia and Warsteinia with four wings. All these factors suggest that Alasemenia is well adapted for anemochory.”

      (5) in Conclusion, we now say “Compared to Famennian four-winged ovules of Warsteinia and Guazia, Alasemenia with three distally outwards extending wings shows advantage in anemochory.”

      Recommendations for the authors:

      Ok, we undertake some revisions and keep some original contents.

      Reviewer #1 (Recommendations For The Authors):

      I would only like to suggest moving the "Mathematical analysis of wind dispersal of ovules with 1-4 wings" section from the supplementary information to the main text, leaving the supplementary figures as supplementary materials.

      Ok, following the suggestion, we now move this “Mathematical analysis of wind dispersal of ovules with 1-4 wings” section to the main text (lines 180-262). It now represents the third part of Discussion.

      Reviewer #2 (Recommendations For The Authors):

      (1) The mathematical part as the supplement can be incorporated into the text.

      Ok, following the suggestion, we now move this “Mathematical analysis of wind dispersal of ovules with 1-4 wings” section to the main text (lines 180-262). It now represents the third part of Discussion. The original paragraph headed with Mathematical analysis in Results is now modified and inserted to “Mathematical analysis of wind dispersal of ovules with 1-4 wings” section (lines 250-256). The last paragraph in the original Supplementary information is now greatly modified and presented at the end of “Mathematical analysis of wind dispersal of ovules with 1-4 wings” section (lines 256-262).

      (2) The comparisons between three- or four-winged ovules are not addressed enough.

      We now add Fig. 5 as a new figure. Based on this figure and revisions, the comparisons between three- and four-winged ovules now include:

      a) “Their integumentary wings illustrate diversity in number (three or four per ovule), length, folding or flattening, and being straight or curving distally. As in Alasemenia (Fig. 5a), the integumentary wings of acupulate ovule of Guazia are broad, thin and fold inwards along the abaxial side, but their numbers are four in each ovule and their free portions usually arch centripetally (Fig. 5c; Wang et al., 2022, Figure 5). In contrast to Alasemenia, Warsteinia has four integumentary wings without folding and their free portions are short and straight (Rowe, 1997, TEXT-FIG. 4).” (lines 154-160).

      b) “Furthermore, the quantitative analysis in mathematics indicates that three-winged ovules such as Alasemenia are more adapted to wind dispersal than four-winged ovules including Warsteinia and Guazia (see following).” (lines 166-168).

      c) “The relative wind dispersal efficiency of three-winged seeds is obviously better than that of single- and two- winged seeds, and is close to that of four-winged seeds (Fig. 6). In addition, three-winged seeds have the most stable area of windward, which also ensures the motion stability in wind dispersal. Significantly, the maximum windward area of each wing of Alasemenia is greater than that of Guazia and Warsteinia with four wings.” (lines 256-261).

      d) “Compared to Famennian four-winged ovules of Warsteinia and Guazia, Alasemenia with three distally outwards extending wings shows advantage in anemochory.” (lines 272-274).

      (3) The significance of this finding should be well summarized with solid evidence.

      It has been summarized in Abstract (lines 19-28) and is now further summarized especially in the newly provided Conclusion (lines 264-275).

    1. Author response:

      Reviewer #1

      - The entire study is based on only 2 adult animals, that were used for both the single cell dataset and the HCR. Additionally, the animals were caught from the ocean preventing information about their age or their life history. This makes the n extremely small and reduces the confidence of the conclusions. 

      This statement is incorrect.  While the scRNAseq was indeed performed in two animals (n=2), the HCR-FISH was performed in 3-5 animals (depending on the probe used).  These were different animals from those used for the scRNAseq.  We are partly responsible for this confusion, since we did not state the number of animals used for the HSC-FISH in the manuscript. 

      - All the fluorescent pictures present in this manuscript present red nuclei and green signals being not color-blind friendly. Additionally, many of the images lack sufficient quality to determine if the signal is real. Additional images of a control animal (not eviscerated) and of a negative control would help data interpretation. Finally, in many occasions a zoomed out image would help the reader to provide context and have a better understanding of where the signal is localized. 

      Fluorescent photos will be changed to color-blind friendly colors. 

      Diagrams, arrows and new photos will be included as to guide readers to the signal

      or labeling in cells. In the original manuscript 6 out of 7 cluster validations included a photo of a normal, non-eviscerated control.  We will make certain that this is highlighted in the resubmission and that ALL figures with HCR-FISH labeling will include data from control animals.

      - The Authors frequently report the percentage of cells with a specific feature (either labelled or expressing a certain gene or belonging to a certain cluster). This number can be misleading since that is calculated after cell dissociation and additional procedures (such as staining or sequencing and dataset cleanup) that can heavily bias the ratio between cell types. Similarly, the Authors cannot compare cell percentage between anlage and mesentery samples since that can be affected by technical aspects related to cell dissociation, tissue composition and sequencing depth. 

      The Reviewer has correctly identified the limitations of using cell percentages in scRNA-seq analyses. However, these percentages do offer a general overview of the sequenced cell populations and highlight potential differences between samples. In addition, these percentages, as addressed by the Reviewer, not only emphasize the shortcommings of the dissociation methods but at the same time provide some explanation for the absence of particular cell populations, as we describe in the manuscript. In our future resubmission, we will acknowledge these limitations and inform readers of any potential biases introduced by relying on these numbers.

      - The Authors decided to validate only a few clusters and in many cases there are no positive controls (such as specific localization, specific function, changes between control and regenerating animals, co-stain) that could actually validate the cluster identity and the specificity of the selected marker. There is no validation of the trajectory analysis and there is no validation of the proliferating cluster with H3P or BrdU stainings. 

      We validated the seven clusters that were important to reach our conclusions. Six of these had controls of normal (uneviscerated) intestine.  Nonetheless we will increase the number of cluster validations and include the dividing cell cluster using BrdU.

      - It is not clear what is already known about holothurian intestine regeneration and what are the new findings in this manuscript. The Authors reference several papers throughout the whole result sectioning mentioning how the steps of regeneration, the proliferating cells, some of the markers and some of the cell composition of mesenteries and anlages was already known. 

      The manuscript presents several novel findings on holothurian intestine regeneration, including:

      - The integration of multiple cellular processes, reported for the first time within a single species, along with the identification of the specific mRNAs expressed by each involved cell population.

      - A comparative analysis of the sea cucumber anlage structure, highlighting its similarities to previously described blastemal structures.

      - The identification of the potential dedifferentiated cell populations that form the foundation of the anlage, serving as the epicenter for proliferating and differentiating cells.

      We will ensure that these and other significant findings are prominently emphasized in the resubmitted manuscript.

      Reviewer #2

      - The spatial context of the RNA localization images is not well represented, making it difficult to understand how the schematic model was generated from the data. In addition, multiple strong statements in the conclusion should be better justified and connected to the data provided.

      As explained above we will make an effort to provide a better understanding of the cellular/tissue localization of the labeled cells. Similarly, we will revise the conclusions so that the statements made are well justified.

      Reviewer #3

      - Possible theoretical advances regarding lineage trajectories of cells during sea cucumber gut regeneration, but the claims that can be made with this data alone are still predictive.

      We are conscious that the results from these lineage trajectories are still predictive and will emphasize this in the text. Nonetheless, they are important part of our analyses that provide the theoretical basis for future experiments.

      - Better microscopy is needed for many figures to be convincing. Some minor additions to the figures will help readers understand the data more clearly.

      As explained above we will make an effort to provide a better

      understanding of the cellular/tissue localization of the labeled cells.  Similarly, we will revise the conclusions so that the statements made are well justified.

    1. Author response:

      We sincerely appreciate the reviewers' time, effort, and thoughtful feedback, which have significantly contributed to our research.

      A key concern raised was the potential overinterpretation of our data. While the reviewers acknowledged our identification of a possible synchronization mechanism among active mitral and tufted cells (MTCs) that is distance-independent, they correctly pointed out that we did not provide direct evidence showing how ensemble MTCs synchronize. We concur with their assessment and will address this in our forthcoming response to ensure a precise interpretation of our findings.

      Another concern raised involves the interpretation of results obtained under Ketamine anesthesia. Since Ketamine is an NMDA receptor antagonist, which plays a crucial role in MTC-GC reciprocal synapses, this might impact our conclusions. To address this, we will include analyses demonstrating that optogenetic activation of granule cells (GCs) in an anesthetized state inhibits recorded MTCs during baseline but does not affect odor-evoked MTC firing rates. Additionally, we will thoroughly discuss the potential influence of Ketamine anesthesia on GC-MTC synapses and its implications for our findings.

      Lastly, in our detailed response to the reviewers' comments, we will discuss several recent studies that are particularly relevant to our research. We will also expand on our hypothesis that parvalbumin-positive cells in the olfactory bulb may serve as key mediators of the activity- and distance-dependent lateral inhibition observed in our findings.

    1. Author response:

      We thank both reviewers for their constructive comments. We will do our best incorporating the requested analyses and answering reviewers’ questions in the revision

    1. Author response:

      General comments, factual mistakes:

      Reviewer 1 - Summary: “This study builds on the observation that the kynurenine pathway is required in the conceptus, as HOO null embryos are sensitive to maternal deficiency of NAD precursors (vitamin B3) and tryptophan, and narrows the window of sensitivity to a 3-day period.”

      Correction:

      Vitamin B3 should not be in parentheses, because vitamin B3 and tryptophan are both NAD precursors. We also suggest that the second half of this sentence is changed to “…and narrows the window of sensitivity to a 3-day period from embryonic day 7.5 to E10.5.” Currently, it reads as if Haao-null embryos are sensitive to any 3-day period of maternal NAD precursor restriction.

      Reviewer 1 – Strengths: “Abnormalities develop under conditions of maternal vitamin B3 deficiency, indicating…”

      Correction:

      We suggest replacing “vitamin B3 deficiency” with “NAD deficiency”, as this is more accurate.

      Reviewer 2 – Strengths: “…and then re-analysis of RNA-seq datasets suggested the endoderm was the cell source of NAD synthesis.”

      Correction:

      We suggest re-phrasing this sentence to “…and then re-analysis of RNA-seq datasets suggested the yolk sac endoderm cells are the source of NAD de novo synthesis.”

      Reviewer 1 (Public Review):

      However, without analysis of embryos at later stages in this experiment it is not known how long is needed for NAD synthesis to be recovered - and therefore until when the period of exposure to insufficient NAD lasts. This information would inform the understanding of the developmental origin of the observed defects.

      We are currently seeking funds to investigate the developmental origin of the observed defects. This study includes assessing how the timing of maternal NAD precursor restriction corresponds to the timing of NAD deficiency in the embryo.

      More importantly, there is still a question of whether in addition to the yolk sac, there is HAAO activity within the embryo itself prior to E12.5 (when it has first been assayed in the liver - Figure 1C).

      We have additional data showing that at E11.5 the embryo has no HAAO activity. We also tested E14.5 embryos with their livers removed, and these also do not have HAAO activity. We are planning to include these data sets in the revised version of this manuscript.

      Reviewer 2 (Public Review):

      Page 4 and Table S4. The descriptors for malformations of organs such as the kidney and vertebrae are quite vague and uninformative. More specific details are required to convey the type and range of anomalies observed as a consequence of NAD deficiency.

      Kidney defects were classified as described in Cuny et al. 2020 PNAS (PMID:32015132). In brief, kidneys with a length (tip to tip) of ≤ 1.5 mm in length were counted as hypoplastic, because the average length of a normal kidney at E18.5 is 2.98 mm (2.75-3.375 mm). The one dysmorphic kidney we observed in our dataset had a cyst. We plan to include this information plus more details of the observed vertebral defects in the revised version of this manuscript.

      Can the authors define whether the role of the NAD pathway in a couple of tissue or organ systems is the same? By this I mean is the molecular or cellular effect of NAD deficiency is the same in the vertebrae and organs such as the kidney. What unifies the effects on these specific tissues and organs and are all tissues and organs affected? If some are not, can the authors explain why they escape the need for the NAD pathway?

      We agree that this is a very important question, but consider it beyond the scope of this manuscript. To elucidate the underlying cellular and molecular mechanisms in individual organs will require a multiomic approach because NAD is involved in hundreds of molecular and cellular processes affecting gene expression, protein levels, metabolism, etc. For details of NAD functions that have relevance to embryogenesis see Dunwoodie et al 2023 https://doi.org/10.1089/ars.2023.0349. Furthermore, organs develop at different times during embryogenesis with both distinct, but in some cases shared, molecular and cellular processes. Relating these to specific NAD functions is the challenge. We are currently seeking funds to investigate how NAD deficiency disrupts organogenesis.

      Page 5 and Figure 6C. The expectation and conclusion for whether specific genes are expressed in particular cell types in scRNA-seq datasets depend on the number of cells sequenced, the technology (methodology) used, the depth of sequencing, and also the resolution of the analysis. It is therefore essential to perform secondary validation of the analysis of scRNA-seq data. At a minimum, the authors should perform in situ hybridization or immunostaining for Tdo2, Amid, Kmo, Kanu, Haao, Qprt, and Nadsyn1 or some combination thereof at multiple time points during early mouse embryogenesis to truly understand the spatiotemporal dynamics of expression and NAD synthesis.

      We have tested antibodies against HAAO, KYNU, and QPRT in adult mouse liver samples (the main site of NAD de novo synthesis) which produced non-specific bands with western blotting. Therefore, in situ immunostaining  studies on embryonic tissues are not feasible. We will investigate the possibility of effectively localizing transcripts of NAD de novo synthesis enzymes using in situ hybridization.

      Absolute functional proof of the yolk sac endoderm as being essential and required for NAD synthesis in the context of CNDD might require conditional deletion of Haoo in the yolk sac versus embryo using appropriate Cre driver lines or in the absence of a conditional allele, could be performed by tetraploid embryo-ES cell complementation approaches. But temporal dietary intervention can also approximate the same thing by perturbing NAD synthesis Shen the yolk sac is the primary source versus when the liver becomes the primary source in the embryo.

      Reviewer 1 has a related comment. We have additional data showing that at E11.5 the embryo has no HAAO activity, like the placenta. Similarly, E14.5 embryos with their livers removed, do not have HAAO activity either. We believe this provides sufficient proof that the yolk sac endoderm is the only site of NAD de novo activity in the conceptus until the liver has formed and takes over this function.

    1. Author response:

      We are grateful to the reviewers for recognizing the importance of our work and for their helpful suggestions. We will revise our manuscript in the revised version. However, we’d like to provide provisional responses now to answer the key questions and comments from the reviewers.

      (1) Both reviewers asked why we chose 24-120 hpf to measure the apoptotic rates. We chose this time window based on the following two reasons: 1) Previous studies showed that although the motor neuron death time windows vary in chick (E5-E10), mouse (E11.5-E15.5), rat (E15-E18) and human (11-25 weeks of gestation), the common feature of these time windows is that they are all the developmental periods when motor neurons contact with muscle cells. The contact between zebrafish motor neurons and muscle cells occurs before 72 hpf, which is included in our observation time window. 2) Zebrafish complete hatching during 48-72 hpf, and most organs form before 72 hpf. More importantly, zebrafish start swimming around 72 hpf, indicating that motor neurons are fully functional.

      Thus, we are confident that this 24-120 hpf time window covers the time window during which motor neurons undergo programmed cell death during zebrafish early development. We frequently used “early development” in this manuscript to describe our observation. However, we missed “early” in our title. We will add “early” in the title in the revised version.

      (2) Both reviewers also asked about the neurogenesis of motor neurons. Previous studies have shown that the production of spinal cord motor neurons largely ceases before 48 hpf and then the motor neurons remain largely constant until adulthood. Our observation time window covers the major motor neuron production process. Therefore, we believe that neurogenesis will not affect our data and conclusions.

      (3) Both reviewers questioned the specificity of using the mnx1 promoter to label motor neurons. The mnx1 promoter has been widely used to label motor neurons in transgenic zebrafish. Previous studies have shown that most of the cells labeled in the mnx1 transgenic zebrafish are motor neurons. In this study, we observed that the neuronal cells in our sensor zebrafish formed green cell bodies inside of the spinal cord and extended to the muscle region, which is an important morphological feature of the motor neurons. Furthermore, a few of those green cell bodies turned into blue apoptotic bodies inside the spinal cord and changed to blue axons in the muscle regions at the same time, which strongly suggests that those apoptotic neurons are not interneurons. Although the mnx1 promoter might have labeled some interneurons, this will not affect our major finding that only a small portion of motor neurons died during zebrafish early development.

      (4) Reviewer 2 is concerned that the estimated 50% of motor neuron death was in limb-innervating motor neurons but not in body wall-innervating motor neurons. The death of motor neurons in limb-innervating motor neurons has been extensively studied in chicks and rodents, as it is easy to undergo operations such as amputation. However, previous studies have shown this dramatic motor neuron death does not only occur in limb-innervating motor neurons but also occurs in other spinal cord motor neurons. In our manuscript, we studied the naturally occurring motor neuron death in the whole spinal cord during the early stage of zebrafish development.

      (5) Reviewer 2 mentioned that we ignored the death of an identified motor neuron. Our study was to examine the overall motor neuron apoptosis rather than a specific type of motor neuron death, so we did not emphasize the death of VaP motor neurons. We agree that the dead motor neurons observed in our manuscript contain VaP motor neurons. However, there were also other types of dead motor neurons observed in our study. The reasons are as follows: 1) VaP primary motor neurons die before 36 hpf, but our study found motor neuron cells died after 36 hpf and even at 84 hpf. 2) The position of the VaP motor neuron is together with that of the CaP motor neuron, that is, at the caudal region of the motor neuron cluster. Although it’s rare, we did observe the death of motor neurons in the rostral region of the motor neuron cluster. 3) There is only one or zero VaP motor neuron in each hemisegment. Although our data showed that usually one motor neuron died in each hemisegment, we did observe that sometimes more than one motor neuron died in the motor neuron cluster. We will include this information in the revised manuscript.

      (6) For the morpholinos, we did not confirm the downregulation of the target genes. These morpholino-related data are a minor part of our manuscript and shall not affect our major findings. Thus, we didn’t think we missed “important” controls. We will perform experiments to confirm the efficiency of the morpholinos or remove these morpholino-related data from the revised version.

    1. Author Response:

      We would like to thank the editors and reviewers for the careful consideration of our manuscript and their many helpful comments. We would like to provide provisional author responses to address the public reviews.

      Response to Reviewer 1:

      Weaknesses:

      While this study convincingly describes the phenotype seen upon Drp1 loss, my major concern is that the mechanism underlying these defects in zygotes remains unclear. The authors refer to mitochondrial fragmentation as the mechanism ensuring organelle positioning and partitioning into functional daughters during the first embryonic cleavage. However, could Drp1 have a role beyond mitochondrial fission in zygotes? I raise these concerns because, as opposed to other Drp1 KO models (including those in oocytes) which lead to hyperfused/tubular mitochondria, Drp1 loss in zygotes appears to generate enlarged yet not tubular mitochondria. Lastly, while the authors discard the role of mitochondrial transport in the clustering observed, more refined experiments should be performed to reach that conclusion.

      It would be difficult to answer from this study whether Drp1 has a role beyond mitochondrial fission in zygotes. However, there are several possible reasons why the Drp1 KO zygotes differs from the somatic cell Drp1 KO models.  

      First, the reviewer mentions that the loss of Drp1 in oocytes leads to hyperfused/tubular mitochondria, but in fact, unlike in somatic cells, the EM images in Drp1 KO oocytes show enlarged mitochondria rather than tubular structures  (Udagawa et al. Current Biology 2014, Fig. 2C and Fig. S1B-D), as in the case of zygotes in this study. 

      These mitochondrial morphologies in Drp1-deficient oocytes/zygotes may be attributed to the unique mitochondrial architecture in these cells. Mitochondria in oocytes have the shape of a small sphere with an irregular cristae located peripherally or transversely. These structural features might be the cause of insensitivity or resistance to inner membrane fusion. In addition, in our previous study (Wakai et al., Molecular Human Reproduction 2014, Fig. 2), overexpression of mitochondrial fusion factors in oocytes resulted in mitochondrial aggregation when outer membrane fusion factor Mfn1/Mfn2 was overexpressed, while overexpression of Opa1 did not cause any morphological changes. Thus, while mitochondria in oocytes/zygotes divide actively, complete fusion, including the inner membrane, as seen in somatic cells, is unlikely to occur.

      As for mitochondrial transport, we do not entirely discard its role. Althogh mitochondrial intrinsic dynamics such as fission are of primary importance for the mitochondrial distribution and partitioning in embryos, the regulation of dynamics by the cytoskeletons may be important and thus needs further study, as the reviewer pointed out.

      Response to Reviewer 2:

      Weaknesses:

      The authors first describe the redistribution of mitochondria during normal development, followed by alterations induced by Drp1 depletion. It would be useful to indicate the time post-hCG for imaging of fertilised zygotes (first paragraph of the results/Figure 1) to compare with subsequent Drp1 depletion experiments.

      We will indicate the time after hCG as the reviewer pointed out. The only problem is that in this experiment, there may be a slight deviation from the actual mitochondrial distribution change (Fig. S1A) due to the manipulation time for Trim-Away (since it was performed outside of the incubator). Also, no significant delay in pronuclear formation or embryonic development was observed with Drp1 depleted zygotes.

      It is noted that Drp1 protein levels were undetectable 5h post-injection, suggesting earlier times were not examined, yet in Figure 3A it would seem that aggregation has occurred within 2 hours (relative to Figure 1).

      As the reviewer pointed out, the depletion of Drp1 is likely to have occurred at an earlier stage. In this study, due to the injection of various RNAs to visualize organelles such as mitochondria and chromosomes, observations were started after about 5 hours of incubation for their fluorescent proteins to be sufficiently expressed. Therefore, for the western blotting analysis, samples were taken into account their condition at the start of the observation.

      Mitochondria appear to be slightly more aggregated in Drp1 fl/fl embryos than in control, though comparison with untreated controls does not appear to have been undertaken. There also appears to be some variability in mitochondrial aggregation patterns following Drp1 depletion (Figure 2-suppl 1 B) which are not discussed.

      We would like to add quantitative data on mitochondrial aggregation in Drp1-depleted embryos.

      The authors use western blotting to validate the depletion of Drp1, however do not quantify band intensity. It is also unclear whether pooled embryo samples were used for western blot analysis.

      We would like to add the quantitative results of the intensity of the bands for the Western blot analysis. The number of embryos analyzed is described in Fig legends, from 20 (Fig. 4) to 30 (Fig. 2) pooled samples were used.

      Likewise, intracellular ROS levels are examined however quantification is not provided. It is therefore unclear whether 'highly accumulated levels' are of significance or related to Drp1 depletion.

      We will present to indicate quantitative results on the accumulation of ROS.

      In previous work, Drp1 was found to have a role as a spindle assembly checkpoint (SAC) protein. It is therefore unclear from the experiments performed whether aggregation of mitochondria separating the pronuclei physically (or other aspects of mitochondrial function) prevents appropriate chromosome segregation or whether Drp1 is acting directly on the SAC.

      It has been reported that Drp1 regulates meiotic spindle through spindle assembly checkpoint (SAC) (Zhou et al., Nature Communications 2022). We would like to mention the possibility pointed out in the discussion part.

      Response to Reviewer 3:

      Seemingly, there are few apparent shortcomings. Following are the specific comments to activate the further open discussion.

      - Line 246: Comments on cristae morphology of mitochondria in Drp1-depleted embryos would better be added.

      We would like to add a comment regarding cristae morphology.

      - Regarding Figure 2H: If possible, a representative picture of Ateam would better be included in the figure. As the authors discussed in line 458, Ateam may be able to detect whether any alterations of local energy demand occurred in the Drp1-depleted embryos.

      ATeam fluorescence is analyzed using a regular fluorescence microscope, not a confocal laser microscope, in order to analyze the intensity in the whole embryo (or the whole blastomere). Therefore, we are currently unable to obtain images of localized areas within the cell (e.g., around the spindle) as expected by the reviewer; as shown in the images in Figure 3-figure supplement 1C, there is a tendency to see high ATP levels at the cell periphery, but further analysis is needed for clear and definitive results.

      - Line 282: In Figure 3-Video 1, mitochondria were seemingly more aggregated around female pronucleus. Is it OK to understand that there is no gender preference of pronuclei being encircled by more aggregated mitochondria?

      Aggregated mitochondria are localized toward the cell center, but do not behave in such a way that they are preferentially concentrated near the female pronucleus.

      - Line 317: A little more explanation of the "variability" would be fine. Does that basically mean that the Ca2+ response in both Drp1-depleted blastomeres were lower than control and blastomere with more highly aggregated mitochondria show severer phenotype compared to the other blastomere with fewer mito?

      We assume that what the reviewer have pointed out is right. However, although we were able to show the bias in Ca2+ store levels between blastomeres of Drp1 depleted embryos, we did not stain mitochondria simultaneously, so we were unable to say details such as more Ca2+ stores in blastomere that inherited more mitochondria or less Ca2+ stores in blastomere with more aggregated mitochondria

      - Regarding Figure 5B (& Figure 1-figure supplement 1B): Do authors think that there would be less abnormalities in the embryos if Drp1 is trim-awayed after 2-cell or 4-cell, in which mitochondria are less involved in the spindle?

      The marked accumulation of mitochondria around the spindle is unique to the first cleavage and seems to be coincident with the migration of the pronuclei toward the center. Since the process of assembly of the male and female pronuclei is also an event unique to the first cleavage, abnormalities such as binucleation due to mitochondrial misplacement are thought to be a phenomenon seen only in the first cleavage. Therefore, if Drp1 is depleted at the 2-cell or 4-cell stage, chromosome segregation errors may be less frequent. However, since unequal partitioning of mitochondria is thought to occur, some abnormalities in embryonic development is likely to be observed.

    1. Author response:

      The following is the authors’ response to the original reviews.

      Public Reviews:

      Reviewer #1 (Public Review):

      This is an interesting study investigating the mechanisms underlying membrane targeting of the NLRP3 inflammasome and reporting a key role for the palmitoylation-depalmitoylation cycle of cys130 in NRLP3. The authors identify ZDHHC3 and APT2 as the specific ZDHHC and APT/ABHD enzymes that are responsible for the s-acylation and de-acylation of NLRP3, respectively. They show that the levels of ZDHHC3 and APT2, both localized at the Golgi, control the level of palmitoylation of NLRP3. The S-acylation-mediated membrane targeting of NLRP3 cooperates with polybasic domain (PBD)-mediated PI4P-binding to target NLRP3 to the TGN under steady-state conditions and to the disassembled TGN induced by the NLRP3 activator nigericin.

      However, the study has several weaknesses in its current form as outlined below.

      (1) The novelty of the findings concerning cys130 palmitoylation in NLRP3 is unfortunately compromised by recent reports on the acylation of different cysteines in NLRP3 (PMID: 38092000), including palmitoylation of the very same cys130 in NLRP3 (Yu et al https://doi.org/10.1101/2023.11.07.566005), which was shown to be relevant for NLRP3 activation in cell and animal models. What remains novel and intriguing is the finding that NLRP3 activators induce an imbalance in the acylation-deacylation cycle by segregating NLRP3 in late Golgi/endosomes from de-acylating enzymes confined in the Golgi. The interesting hypothesis put forward by the authors is that the increased palmitoylation of cys130 would finally contribute to the activation of NLRP3. However, the authors should clarify the trafficking pathway of acylated-NLRP3. This pathway should, in principle, coincide with that of TGN46 which constitutively recycles from the TGN to the plasma membrane and is trapped in endosomes upon treatment with nigericin. 

      We think the data presented in our manuscript are consistent with the majority of S-acylated NLRP3 remaining on the Golgi via S-acylation in both untreated and nigericin treated cells. We have performed an experiment with BrefeldinA (BFA), a fungal metabolite that disassembles the Golgi without causing dissolution of early endosomes, that further supports the conclusion that NLRP3 predominantly resides on Golgi membranes pre and post activation. Treatment of cells with BFA prevents recruitment of NLRP3 to the Golgi in untreated cells and blocks the accumulation of NLRP3 on the structures seen in the perinuclear area after nigericin treatment (see new Supplementary Figure 4A-D). We do see some overlap of NLRP3 signal with TGN46 in the perinuclear area after nigericin treatment (see new Supplementary Figure 2E), however this likely represents TGN46 at the Golgi rather than endosomes given that the NLRP3 signal in this area is BFA sensitive.  As with 2-BP and GFP-NLRP3C130S, GFP-NLRP3 spots also form in BFA / nigericin co-treated cells but not with untagged NLRP3. These spots also do not show any co-localisation with EEA1, suggesting that under these conditions, endosomes don’t appear to represent a secondary site of NLRP3 recruitment in the absence of an intact Golgi. However, we cannot completely rule out that some NLRP3 may recruited to endosomes at some point during its activation.

      (2) To affect the S-acylation, the authors used 16 hrs treatment with 2-bromopalmitate (2BP). In Figure 1f, it is quite clear that NLRP3 in 2-BP treated cells completely redistributed in spots dispersed throughout the cells upon nigericin treatment. What is the Golgi like in those cells? In other words, does 2-BP alter/affect Golgi morphology? What about PI4P levels after 2-BP treatment? These are important missing pieces of data since both the localization of many proteins and the activity of one key PI4K in the Golgi (i.e. PI4KIIalpha) are regulated by palmitoylation.

      We thank the reviewer for highlighting this point and agree that it is possible the observed loss of NLRP3 from the Golgi might be due to an adverse effect of 2-BP on Golgi morphology or PI4P levels. We have tested the effect of 2-BP on the Golgi markers GM130, p230 and TGN46. 2BP has marginal effects on Golgi morphology with cis, trans and TGN markers all present at similar levels to untreated control cells (Supplementary Figure 2B-D). We also tested the effect of 2-BP on PI4P levels using mCherry-P4M, a PI4P biosensor. Surprisingly, as noted by the reviewer, despite recruitment of PI4K2A being dependent on S-acylation, PI4P was still present on the Golgi after 2-BP treatment, suggesting that a reduction in Golgi PI4P levels does not underly loss of NLRP3 from the Golgi (Supplementary Figure 2A). The pool of PI4P still present on the Golgi following 2-BP treatment is likely generated by other PI4K enzymes that localise to the Golgi independently of S-acylation, such as PI4KIIIB. We have included this data in our manuscript as part of a new Supplementary Figure 2. 

      (3) The authors argue that the spots observed with NLRP-GFP result from non-specific effects mediated by the addition of the GFP tag to the NLRP3 protein. However, puncta are visible upon nigericin treatment, as a hallmark of endosomal activation. How do the authors reconcile these data? Along the same lines, the NLRP3-C130S mutant behaves similarly to wt NLRP3 upon 2-BP treatment (Figure 1h). Are those NLRP3-C130S puncta positive for endosomal markers? Are they still positive for TGN46? Are they positive for PI4P?

      This is a fair point given the literature showing overlap of NLRP3 puncta formed in response to nigericin with endosomal markers and the similarity of the structures we see in terms of size and distribution to endosomes after 2BP + nigericin treatment. We have tested whether these puncta overlap with EEA1, TGN46 or PI4P (Supplementary Figure 2A, E-G). The vast majority of spots formed by GFP-NLRP3 co-treated with 2-BP and nigericin do not co-localise with EEA1, TGN46 or PI4P. This is consistent with these spots potentially being an artifact, although it has recently been shown that human NLRP3 unable to bind to the Golgi can still respond to nigericin (Mateo-Tórtola et al., 2023). These puncta might represent a conformational change cytosolic NLRP3 undergoes in response to stimulation, although our results suggest that this doesn’t appear to happen on endosomes.

      (4) The authors expressed the minimal NLRP3 region to identify the domain required for NLRP3 Golgi localization. These experiments were performed in control cells. It might be informative to perform the same experiments upon nigericin treatment to investigate the ability of NLRP3 to recognize activating signals. It has been reported that PI4P increases on Golgi and endosomes upon NG treatment. Hence, all the differences between the domains may be lost or preserved. In parallel, also the timing of such recruitment upon nigericin treatment (early or late event) may be informative for the dynamics of the process and of the contribution of the single protein domains.

      This is an interesting point which we thank the reviewer for highlighting. However, we think that each domain on its own is not capable of responding to nigericin as shown by the effect of mutations in helix115-125 or the PB region in the full-length NLRP3 protein. NLRP3HF, which still contains a functional PB region, isn’t capable of responding to nigericin in the same way as wild type NLRP3 (Supplementary Figure 6C-D). Similarly, mutations in the PB region of full length NLRP3 that leave helix115-125 intact show that helix115-125 is not sufficient to allow enhanced recruitment of NLRP3 to Golgi membranes after nigericin treatment (Supplementary Figure 9A). We speculate that helix115-125, the PB region and the LRR domain all need to be present to provide maximum affinity of NLRP3 for the Golgi prior to encounter with and S-acylation by ZDHHC3/7. Mutation or loss of any one of the PB region, helix115-125 or the LRR lowers NLRP3 membrane affinity, which is reflected by reduced levels of NLRP3 captured on the Golgi by S-acylation at steady state and in response to nigericin. 

      (5) As noted above for the chemical inhibitors (1) the authors should check the impact of altering the balance between acyl transferase and de-acylases on the Golgi organization and PI4P levels. What is the effect of overexpressing PATs on Golgi functions?

      We have checked the effect of APT2 overexpression on Golgi morphology and can show that it has no noticeable effect, ruling out an impact of APT on Golgi integrity as the reason for loss of NLRP3 from the Golgi in the presence of overexpressed APT2. We have included these images as Supplementary Figure 11H-J. 

      It is plausible that the effects of ZDHHC3 or ZDHHC7 on enhanced recruitment of NLRP3 to the Golgi may be via an effect on PI4P levels since, as mentioned above, both enzymes are involved in recruitment of PI4K2A to the Golgi and have previously been shown to enhance levels of PI4K2A and PI4P on the Golgi when overexpressed (Kutchukian et al., 2021). However, NLRP3 mutants with most of the charge removed from the PB region, which are presumably unable to interact with PI4P or other negatively charged lipids, are still capable of being recruited to the Golgi by excess ZDHHC3. This would suggest that the effect of overexpressed ZDHHC3 on NLRP3 is largely independent of changes in PI4P levels on the Golgi and instead driven by helix115-125 and S-acylation at Cys-130. The latter point is supported by the observation that NLRP3HF and NLRP3Cys130 are insensitive to ZDHHC3 overexpression.

      At the levels of HA-ZDHHC3 used in our experiments with NLRP3 (200ng pEF-Bos-HAZDHHC3 / c.a. 180,000 cells) we don’t see any adverse effect on Golgi morphology (Author response image 1), although it has been noted previously by others that higher levels of ZDHHC3 can have an impact on TGN46 (Ernst et al., 2018). ZDHHC3 overexpression surprisingly has no adverse effects on Golgi function and in fact enhances secretion from the Golgi (Ernst et al., 2018).  

      Author response image 1.

      Overexpression of HA-ZDHHC3 does not impact Golgi morphology. A) Representative confocal micrographs of HeLaM cells transfected with 200 ng HA-ZDHHC3 fixed and stained with antibodies to STX5 or TGN46. Scale bars = 10 µm. 

      Reviewer #2 (Public Review):

      Summary:

      This paper examines the recruitment of the inflammasome seeding pattern recognition receptor NLRP3 to the Golgi. Previously, electrostatic interactions between the polybasic region of NLRP3 and negatively charged lipids were implicated in membrane association. The current study reports that reversible S-acylation of the conserved Cys-130 residue, in conjunction with upstream hydrophobic residues plus the polybasic region, act together to promote Golgi localization of NLRP3, although additional parts of the protein are needed for full Golgi localization. Treatment with the bacterial ionophore nigericin inhibits membrane traffic and prevents Golgi-associated thioesterases from removing the acyl chain, causing NLRP3 to become immobilized at the Golgi. This mechanism is put forth as an explanation for how NLRP3 is activated in response to nigericin.

      Strengths:

      The experiments are generally well presented. It seems likely that Cys-130 does indeed play a previously unappreciated role in the membrane association of NLRP3.

      Weaknesses:

      The interpretations about the effects of nigericin are less convincing. Specific comments follow.

      (1) The experiments of Figure 4 bring into question whether Cys-130 is S-acylated. For Cys130, S-acylation was seen only upon expression of a severely truncated piece of the protein in conjunction with overexpression of ZDHHC3. How do the authors reconcile this result with the rest of the story?

      Providing direct evidence of S-acylation at Cys-130 in the full-length protein proved difficult. We attempted to detect S-acylation of this residue by mass spectrometry. However, the presence of the PB region and multiple lysines / arginines directly after Cys-130 made this approach technically challenging and we were unable to convincingly detect S-acylation at Cys-130 by M/S. However, Cys-130 is clearly important for membrane recruitment as its mutation abolishes the localisation of NLRP3 to the Golgi. It is feasible that it is the hydrophobic nature of the cysteine residue itself which supports localisation to the Golgi, rather than S-acylation of Cys-130. A similar role for cysteine residues present in SNAP-25 has been reported (Greaves et al., 2009). However, the rest of our data are consistent with Cys-130 in NLRP3 being S-acylated. We also refer to another recently published study which provides additional biochemical evidence that mutation of Cys-130 impacts the overall levels of NLRP3 S-acylation (Yu et al., 2024). 

      (2) Nigericin seems to cause fragmentation and vesiculation of the Golgi. That effect complicates the interpretations. For example, the FRAP experiment of Figure 5 is problematic because the authors neglected to show that the FRAP recovery kinetics of nonacylated resident Golgi proteins are unaffected by nigericin. Similarly, the colocalization analysis in Figure 6 is less than persuasive when considering that nigericin significantly alters Golgi structure and could indirectly affect colocalization. 

      We agree that it is likely that the behaviour of other Golgi resident proteins are altered by nigericin. This is in line with a recent proteomics study showing that nigericin alters the amount of Golgi resident proteins associated with the Golgi (Hollingsworth et al., 2024) and other work demonstrating that changes in organelle pH can influence the membrane on / off rates of Rab GTPases (Maxson et al., 2023). However, Golgi levels of other peripheral membrane proteins

      that associate with the Golgi through S-acylation, such as N-Ras, appear unaltered (Author response image 2.), indicating a degree of selectivity in the proteins affected. Our main point here is that NLRP3 is amongst those proteins whose behaviour on the Golgi is sensitive to nigericin and that this change in behaviour may be important to the NLRP3 activation process, although this requires further investigation and will form the basis of future studies. 

      The reduction in co-localisation between NLRP3 and APT2, due to alterations in Golgi organisation and trafficking, was the point we were trying to make with this figure, and we apologise if this was not clear. We think that the changes in Golgi structure and function caused by nigericin potentially affect the ability of APT2 to encounter NLRP3 and de-acylate it. We have added a new paragraph to the results section to hopefully explain this more clearly. We recognise that our results supporting this hypothesis are at present limited and we have toned down the language used in the results section to reflect the nature of these findings..  

      Author response image 2.

      S-acylated peripheral membrane proteins show differential sensitivity to nigericin. A) Representative confocal micrographs of HeLaM cells coexpressing GFP-NRas and an untagged NLRP3 construct. Cells were left untreated or treated with 10 µM nigericin for 1 hour prior to fixation. Scale bars = 10 µm. B) Quantification of GFP-NRas or NLRP3 signal in the perinuclear region of cells treated with or without nigericin

      Recommendations for the authors:

      Reviewer #2 (Recommendations For The Authors):

      (1) Does overnight 2-BP treatment potentially have indirect effects that could prevent NLRP3 recruitment? It would be useful here to show some sort of control confirming that the cells are not broadly perturbed.

      Please see our response to point (2) raised by reviewer #1 which is along similar lines. 

      (2) In Figure 5, "Veh" presumably is short for "Vehicle". This term should be defined in the legend.

      We have now corrected this.

      References

      Ernst, A.M., S.A. Syed, O. Zaki, F. Bottanelli, H. Zheng, M. Hacke, Z. Xi, F. Rivera-Molina, M. Graham, A.A. Rebane, P. Bjorkholm, D. Baddeley, D. Toomre, F. Pincet, and J.E. Rothman. 2018. SPalmitoylation Sorts Membrane Cargo for Anterograde Transport in the Golgi. Dev Cell. 47:479-493 e477.

      Greaves, J., G.R. Prescott, Y. Fukata, M. Fukata, C. Salaun, and L.H. Chamberlain. 2009. The hydrophobic cysteine-rich domain of SNAP25 couples with downstream residues to mediate membrane interactions and recognition by DHHC palmitoyl transferases. Mol Biol Cell. 20:1845-1854.

      Hollingsworth, L.R., P. Veeraraghavan, J.A. Paulo, J.W. Harper, and I. Rauch. 2024. Spatiotemporal proteomic profiling of cellular responses to NLRP3 agonists. bioRxiv.

      Kutchukian, C., O. Vivas, M. Casas, J.G. Jones, S.A. Tiscione, S. Simo, D.S. Ory, R.E. Dixon, and E.J. Dickson. 2021. NPC1 regulates the distribution of phosphatidylinositol 4-kinases at Golgi and lysosomal membranes. EMBO J. 40:e105990.

      Mateo-Tórtola, M., I.V. Hochheiser, J. Grga, J.S. Mueller, M. Geyer, A.N.R. Weber, and A. TapiaAbellán. 2023. Non-decameric NLRP3 forms an MTOC-independent inflammasome. bioRxiv:2023.2007.2007.548075.

      Maxson, M.E., K.K. Huynh, and S. Grinstein. 2023. Endocytosis is regulated through the pHdependent phosphorylation of Rab GTPases by Parkinson’s kinase LRRK2. bioRxiv:2023.2002.2015.528749.

      Yu, T., D. Hou, J. Zhao, X. Lu, W.K. Greentree, Q. Zhao, M. Yang, D.G. Conde, M.E. Linder, and H. Lin. 2024. NLRP3 Cys126 palmitoylation by ZDHHC7 promotes inflammasome activation. Cell Rep. 43:114070.

    1. Author response:

      The following is the authors’ response to the original reviews.

      Reviewer 1:

      Strengths

      We thank the reviewer for recognizing the strengths of our in vivo Ca2+ measurements, super resolution microscopy and assessment of the secretory dysfunction in the Sjogrens syndrome mouse model.

      Weaknesses

      Point 1: The less restricted Ca2+ signal to the apical region of the acinar cell is not really relevant to the reduced activation of TMEM16a by a local signal at the apical plasma membrane.

      We agree that the spatially averaged Ca2+ signal is not indicative of the local Ca2+ signal that activates TMEM16a. The description of the disordered Ca2+ signal in the disease model was intended to simply convey that the Ca2+ signal is altered in the model. Whether or indeed how the altered spatial characteristics of the signal are deleterious is not known but we speculate in the discussion that this contributes to the ultrastructural damage observed.

      Point 2. Secretion is decreased but the amplitude of the globally averaged Ca2+ signals are increased. No proof is offered that the greater distance between IP3R and TMEM16a is the reason for decreased secretion in the face of this increased peak signal.

      We have now added new data that indicates that the local Ca2+ signal is indeed disrupted in the disease model. We show that in control animals, activation of TMEM16a by application of agonist occurs when the pipette is buffered with the slower buffer EGTA but not with the fast buffer BAPTA In contrast, in cells isolated from DMXAA -treated animals both EGTA and BAPTA abolish the agonist-induced currents (new Figure 6). These data are consistent with our super resolution data showing the distance between IP3R and TMEM16a being greaterand thus presumably is enough to allow buffering of Ca2+ release from IP3R such that it does not effectively activate TMEM16a. These data also would suggest that the increased amplitude of the spatially averaged Ca2+ signal is not sufficient to overcome this structural change.

      Point 3. Lack of evidence that the mitochondrial changes are associated with the defect in fluid secretion.

      We agree that a causal link between the decreased secretion and altered mitochondrial morphology and function is not established. Nevertheless, we feel it is reasonable to contend that profound changes in mitochondrial morphology observed at the light and EM level, together with changes in mitochondrial membrane potential and oxygen consumption are consistent with contributing to altered fluid secretion given that this is an energetically costly process. We have altered the discussion to reflect these caveats and ideas.

      Reviewer 2:

      We thank the reviewer for their assessment of our work and constructive comments.

      Reviewer 3:

      We thank the reviewer for their careful appraisal of our manuscript and insightful comments. 

      Point 1: Are all the effects of DMXAA mediated through the STING pathway?

      This is an important point because as noted DMXAA has been reported to inhibit NAD(P)H quinone oxireductase that could contribute to the phenotype reported here. In future studies we intend to test other STING pathway agonists such as MSA-2 and perhaps antagonists of the STING pathway. We have added text to the discussion indicating that all the effects observed may not be a result of activation of the STING pathway.

      Point 2: As noted, and clarified in the text, the driving force for ATP production is the electrochemical H+ gradient which establishes the mitochondrial membrane potential.

      Point 3:  The reviewer suggested there was a decrease mitochondrial membrane potential in the absence of a change in TMRE steady state.

      We apologize for the confusion generated from the presentation of the figure. We normalized TMRE fluorescence against Mitotraker green fluorescence but as shown, the figure does not reflect that the absolute TMRE fluorescence was indeed decreased. Supplemental figure 4 now shows the basal TMRE fluorescence.

      Point 4: Indications that the disruption to ER structure seen in Electron Micrographs contributes to the changes in Ca2+ signal and fluid secretion.

      We did not focus on the relative distance between ER and apical PM in the EMs primarily because the ER that projects towards the apical PM is a relatively minor component of the specialized ER expressing IP3R and is difficult to identify. We note that the disruption of the bulk ER as quantitated by altered ER-mitochondrial interfaces and fragmentation is consistent with our super resolution data and thus likely plays a role in the mechanism that results in dysregulated Ca2+ signals and reduced secretion.

      Recommendations to Authors:

      Reviewing Editor:

      (1) The Editor suggests that we should use the activity of TMEM16a to directly measure the [Ca2+] experienced by the channel.

      We now present new additional data.  First, we show an extended range of pipette [Ca2+] demonstrating identical Ca2+ sensitivity in DMXAA vs vehicle treated cells (Figure 5). Second, importantly, we now present data evaluating the ability of muscarinic stimulation to activate TMEM16a in the presence of either EGTA (slow Ca2+ buffer) or BAPTA (fast Ca2+ buffer). Notably, currents can be stimulated in control cells when the pipette is buffered with EGTA, but not in DMXAA treated cells. BAPTA inhibits activation in both situations (new Figure 6). These data are consistent with TMEM16a being activated by Ca2+ in a microdomain and that this is disrupted in the disease model.   

      (2) The Editor asks whether a decrease in IP3R3 in a subset of the samples could account for the decreased fluid secretion.

      We think this is unlikely given, as noted by the Editor, that a reduction only occurred in a subset of the samples and statistically there was no significant difference to vehicle-treated animals. Moreover, we would note that there is also no difference in the expression of IP3R2 between experimental groups and in studies of transgenic mice where either IP3R2 or IP3R3 were knocked out individually, there was no effect on salivary fluid secretion, indicating that expression of a single subtype can support stimulus-secretion coupling.

      (3) Absolute values for changes in fluorescence (over time) should be included together with SD images.

      These have been added in Figure 3.

      (4) DMXAA has additional effects to STING activation and thus other STING pathway modulators should be used.

      We agree that additional STING agonists should be explored in the future but believe that this is beyond the scope of the present studies. Additional text has been added to the discussion acknowledging the additional targets of DMXAA and that they could contribute to the phenotype.

      (5) No causal link between the observed Ca2+ changes and mitochondrial dysfunction.

      We agree that no experimental evidence is offered to directly support this contention. Nevertheless, dysregulated Ca2+ signals are well-documented to lead to altered mitochondrial structure and function and thus we feel it not unreasonable to speculate that this is a possibility.

      (6) The paper would be improved by directly assessing mechanistic connections between altered Ca2+ signaling and TMEM16a activation.

      We agree, please refer to point 1 and new figure 6.

      Reviewer 1:

      (1) Standard Deviation images should be explained and the location of ROI identified.

      We contend that Standard Deviation images provide an effective visualization (in a single image) of both the magnitude of the Ca2+ increase and the degree of recruitment of cells in the field of view during the entire period of stimulation.  We have added text to describe the utility of this technique. Nevertheless, we now show kinetic traces of the changes in fluorescence over time in both apical and basal regions in Figure 3. We also clarify that the traces shown in Figure 2 are averaged over the entire cell. 

      (2) The Authors should consider that reduced secretion is because cells are dying.

      We believe this is unlikely given the lack of morphological changes in glandular structure and the minor lymphocyte infiltration observed in this model. Nevertheless, we now add data showing that the mass of SMG is not altered in the DMXAA-treated animals compared with vehicle-treated (Figure 1E).

      (3) The role of mitochondria in the DMXAA phenotype is unclear. What is the effect of acutely de-energizing mitochondria on fluid secretion.

      Since fluid secretion is an energetically expensive undertaking, it is not unreasonable to suggest that compromised mitochondrial function may impact secretion. That being said this could occur at multiple levels- production of ATP to fuel the Na/K pump to establish membrane gradients or to provide energy to sequester Ca2+ among a multitude of targets. This will be a subject of ongoing experiments. We contend that experiments to acutely disrupt salivary mitochondria in vivo while assessing fluid secretion would be difficult experiments to perform and interpret given that local administration of agents to SMG would not effect the other major salivary glands and systemic administration would be predicted to have wide-ranging off target effects. 

      (4) Could a subset of cells with low IP3R numbers contribute to reduced fluid secretion?

      Please see the response to Reviewing Editors point 2. 

      (5) An attempt to estimate the effect of the spatial distruption of IP3R and TMEM16a localization should be made.

      Please see the response to Reviewing Editors point 1.

      Minor Points

      We have amended the statement form “Highly expressed” to increased.

      Regions of the cell have been labelled for orientation in the line scans.

      The molecular weight markers have been added in Figure 4.

      Reviewer 2:

      (1) Whether mitochondrial dysfunction is the initiator of the phenotype or a result of the dysregulated Ca2+ signal is unclear.

      We agree that our data does not clarify a classic “Chicken vs Egg” conundrum. We plan further experiments to address this issue. Future plans include repeating the mitochondrial and Ca2+ signaling experiments at earlier time points where we know fluid secretion is not yet impacted. This may potentially reveal the temporal sequence of events. Similarly, we plan experiments to mechanistically address why the global Ca2+ signal is augmented- reduced Ca2+ clearance or enhanced Ca2+ release/influx are possibilities. We speculate that reduced Ca2+ clearance, either because mitochondrial Ca2+ uptake is reduced or as a secondary consequence of reduced ATP levels on SERCA and PMCA is a likely possibility.

      (2) Measurement of ECAR and direct measurements of ATP and Seahorse methods.

      In a separate series of experiments, we monitored ECAR. These data were unfortunately very variable and difficult to interpret, although no obvious compensatory increase was observed. We plan in the future to directly monitor ATP levels in acinar cells using Mg-Green. To normalize for cell numbers in the Seahorse experiments, following centrifugation, cell pellets of equal volume were resuspended in equal volumes of buffer. Acinar cells were seeded onto Cell Tak coated dishes. This information is added to the Methods section.

    1. Author response:

      The following is the authors’ response to the original reviews.

      Recommendations for the authors:

      Reviewer #1 (Recommendations For The Authors):  

      (1) When introducing the different antibody clones recognizing Pan, oxidized, or reduced forms, please clearly indicate which clone number belongs to which form.  

      - We see where the original language could be confusing. Please see our new introduction to the antibodies used.

      “we evaluated the redox state of La in fusing osteoclasts using recently validated monoclonal α-La antibodies that recognize oxidized La (clone 7B6) or reduced La (clone 312B), or do not distinguish between these La species (Pan, clone 5B9)”

      (2) "Finding that the surface La pool, which promotes multinucleation in osteoclasts, is an oxidized species..." I would suggest rewording as "...is enriched in oxidized species".  

      - Agreed. We have edited the sentence as follows.

      “Finding that the surface La pool, which promotes multinucleation in osteoclasts, is enriched in an oxidized species raised the question”

      (3) Although not necessary to support the conclusions of the manuscript, it would be interesting to know if the application of La194-408 to osteoclast progenitors following NAC treatment results in the rescue of La staining at the cell surface, or if this exogenous La is acting independently from cell surface association.  

      - We agree that this is an interesting idea. We previously demonstrated that we could add La 1-375 to osteoclast progenitors following RANKL addition and promote osteoclast fusion. We also demonstrated that La 1-375 under these conditions enriched La surface staining (PMID: 36739273)

      - Therefore, we hypothesize that La 194-408 would act similarly.

      (4) Is the confirmation of La modified by the conversion of Cys 232 and 245 to alanine? What about the potential to form oligomers?  

      - To directly answer the Reviewer’s question – we simply do not know and do not have a simple way to test this. To speculate, the differential recognition of La that is reduced vs oxidized by the antibodies used here (specifically clone 312b vs clone 7b6) suggests that some conformational change is taking place when redox signaling modifies La in osteoclasts. Moreover, in Supp. Fig. 4b, we show that recombinant La 194-408 does form a small amount of dimer under our conditions while La 194-408 Cys 232 and 245 to Ala does not. These data together weakly support that La, when converted from reduced to oxidized forms or when we artificially Cys 232 and 245 to Ala, undergoes some conformational and oligomeric change. However, we are not comfortable making

      such claims in the manuscript currently and prefer to investigate this with more rigor and comment in the biological significance of these potential changes in the future.

      (5) "In conclusion, in this study, we identified redox signaling as a molecular switch that redirects La protein away from the nucleus, where it protects precursor tRNAs from exonuclease digestion, and towards its osteoclast-specific function at the cell surface..." I would suggest rewording this sentence given that there is no evidence that the function of oxidized La at the cell surface is osteoclast-specific. This phenomenon could be applicable to other cell types and other biological processes.  

      - The Reviewer makes a good point here, that we very much appreciate. We hoped to communicate that this was a unique function of La that was different from the well-recognized role this protein plays in RNA metabolism, but somewhat overstated past our intention. Please see where we have modified this statement to read:

      “In conclusion, in this study, we identified redox signaling as a molecular switch that redirects La protein away from the nucleus, where it protects precursor tRNAs from exonuclease digestion, and towards its separable function at the osteoclast surface, where La regulates the multinucleation and resorptive functions of these managers of the skeleton.”

      (6) In methods, the definition of TCEP is missing a closed parenthesis sign.  

      - Thank you, corrected.

      (7) In methods under "Cells" there is a missing superscript in 1x10⁶ cells/ml. Presumably, this is 1x10e6.   

      - Thank you, corrected.

      (8) Please provide the sequences of primers used for RT-PCR in this study.  

      - Understood. Please see where a table of all primer sequences used has been added to the Methods under the Transcript Analysis section.

      (9) In methods, "Bone resorption" should be relabeled given that the osteoclasts are plated on calciumphosphate plates and not on a bone surface.  

      - Thank you. Please see where in the Methods both the title and all references to “bone resorption” in the method description have now been changed to “mineral resorption”.

      (10) In several figures, it would be more appropriate to correct for multiple comparisons in the statistical analyses.  

      - We appreciate this concern. Please see where Fig. 2b,c; Fig. 3 b,c; Fig. 4d; Fig. 5b,d; and Fig. 6d have been reanalyzed using paired one-way ANOVAs corrected for multiple comparisons. Now all data where t-tests are used to evaluate statistical significance are only evaluating  differences between 2 values and all experiments considering 3+ values are compared using one-way ANOVAs corrected for multiple comparisons.

      (11) Figure 5: Panels D and E are flipped relative to the legend. Please also define the reagent used for ROS signal in the legend.  

      - Thank you. D and E are now corrected and we added “(Grey = CellRox Dye)” to the end of the legend for Fig. 5a.

      (12) Supplemental Figure 5c: in the control condition, why are some nuclei not staining with the reduced La antibody?  

      - Great question, direct answer – we simply do not know.  

      Longer answer, this image is in fact representative and not exclusive to the reduced La antibody (clone 312b). When we look at La staining in mature, multinucleated osteoclast nuclei at later timepoints post fusion using even pan antibodies, we find that its localization to the nuclei of syncytial osteoclasts is not uniform, but that nuclear La preferentially enriches in some mature osteoclast nuclei and seems to be excluded from others. This may suggest that – akin to myonuclei in skeletal muscle – osteoclast nuclei in a syncytium are not all equal. However, we are far, far away from being able to make any conclusions from the data we have.

      (13) Figure 7 legend: consider breaking this legend up into multiple sentences.  

      - Thank you for the suggestion. The legend for Figure 7 has been rewritten.

      Reviewer #2 (Recommendations For The Authors):  

      (1) Can the authors use the official name of La protein in NCBI GENE and PROTEIN?  

      - While some in the field refer to lupus La protein as La protein, we choose to refer to it simply as La, as is common throughout the Lupus La Protein literature. It is our opinion that continuously referring to a protein as a name + the word protein throughout the manuscript is unnecessary and alters the flow of our manuscript’s points.

      Thanks. We have included the official name of human La in NCBI GENE ((SSB small RNA binding exonuclease protection factor La, Gene ID 6741, NCBI GENE)  into the revised text.  

      (2) The references 26 and 27 are not representative. The pioneering work from Mundy, Chambers, and Almeida (PBMID 2312718, 15528306, and 24781012) should be cited.  

      - Thanks. We have added these 3 references to better acknowledge these significant contributions.

      (3) It is hard to understand Figure 2. What are the white arrows in Figure 2a pointed to? In Figure 2b, what do the columns a-LA(Red), a-La (Pan), and a-La (Ox) mean, treatment, or staining? Figure 2c, the legend "conditions where surface proteins are oxidized (TCEP) seems to be "deoxidized.  

      - We agree. We now realized this legend was rather confusing. It has been edited to read

      “(a) Representative fluorescence and DIC confocal micrographs of primary human osteoclasts following synchronized cell-cell fusion where hemifusion inhibitor was left (Inhibition), removed (Wash) or removed but the α-La antibodies indicated were simultaneously added.

      Cyan=Hoechst Arrows=Multinucleated Osteoclasts (b) Quantification of a.” • Thanks. 2c has now been corrected to “reduced” rather than the errant “oxidized”.

      (4) How do authors normalize bone resorption, % of total area?  

      - We normalized to a separate, paired well where monocytes are differentiated to precursors (MCSF), but no RANKL is added. We have added this omitted information to the methods sections for our mineral resorption assay.

      (5) Figure 5. There are two legends (b). In Figure 5c RT-qPCR, the DC-STAMP or OC-STAMP and mature osteoclast marker calcitonin receptor should be included.

      - Thank you. There were several problems with Figure legend 5 that both you and Reviewer #1 brought our attention to. We have now corrected these errors.

      - We understand the Reviewer’s interest in these markers. However, our point is that the steadystate transcript levels of two well recognized osteoclast differentiation factors and the fusion regulator La, which our manuscript focuses on, are not significantly altered by NAC treatment at these later, fusion associated timepoints. While DC-STAMP, OC-STAMP, and Calcitonin would be interesting, we believe they are outside the scope of this manuscript.

    1. Author response:

      The following is the authors’ response to the original reviews.

      Public Reviews:

      Reviewer #1 (Public Review):

      Summary:

      HMGCS1, 3-hydroxy-3-methylglutaryl-CoA synthase1 is predicted to be involved in Acetyl-CoA metabolic process and mevalonate-cholesterol pathway. To induce diet-induced diabetes, they fed wild-type littermates either a standard chow (Control) or a high fat-high sucrose (HFHG) diet, where the diet composition consisted of 60% fat, 20% protein, and 20% carbohydrate (H10060, Hfkbio, China). The dietary regimen was maintained for 14 weeks. Throughout this period, body weight and fasting blood glucose (FBG) levels were measured on a weekly basis. Although the authors induced diabetes with a diet also rich in fat, the cholesterol concentration or metabolism was not investigated. After the treatment, were the animals with endothelial dysfunction? How was the blood pressure of the animals?

      Thank you for your comments and kind suggestions. We have conducted a study on the impact of HFHG diet on the serum levels of total cholesterol(T-CHO) in mice over a 14-week period. Our findings indicated that the HFHG diet significantly elevated T-CHO levels in the serum of mice (Supplementary Figure 5E). Additionally, HFHG diet was associated with an increased in blood pressure (Figure 5F) and it exacerbated the progression of endothelial dysfunction in mice (Figure 5H-L).

      Strengths:

      To explore the potential role of circHMGCS1 in regulating endothelial cell function, the authors cloned exons 2-7 of HMGCS1 into lentiviral vectors for ectopic overexpression of circHMGCS1 (Figure S2). The authors could use this experiment as a concept proof and investigate the glucose concentration in the cell culture medium. Is the pLV-circ HMGCS1 transduction in HUVEC increasing the glucose release? (Line 163)

      In the manuscript, we utilized a DMEM culture medium containing 4500 mg/L glucose. Given that the HUVEC cell culture is glucose-dependent for its metabolic processes, it was challenging to precisely evaluate the relationship between pLV-circHMGCS1 transduction and the glucose concentration in the medium.

      Weaknesses:

      (1) Pg 20. The cells were transfected with miR-4521 mimics, miR-inhibitor, or miR-NC and incubated for 24 hours. Subsequently, the cells were treated with PAHG for another 24 hours. Were the cells transfected with lipofectanine? The protocol or the lipofectamine kit used should be described. The lipofectamine protocol suggests using an incubation time of 72 hours. Why did the authors incubate for only 24 hours? If the authors did the mimic and inhibitor curves, these should be added to the supplementary figures. Please, describe the miRNA mimic and antagomir concentration used in cell culture.

      For detailed transfection methods of miRNA mimic and its inhibitor, please refer to “Transfection of miRNA mimic or inhibitor” (Line 587) in the revised Experimental Section. We employed the Hieff Trans®siRNA/miRNA in vitro transfection reagent (yeason, China, 40806ES03), with a transfection duration of 48h. The miR-4521 content in HUVEC post-transfection was quantified using qRT-PCR. The transfection of the miR-4521 mimic for 48h notably enhanced its expression in HUVEC (Supplementary Figure 3B), whereas the transfection of the miR-4521 inhibitor for the same duration significantly suppressed its expression (Supplementary Figure 3C). The concentration used for both miRNA mimic and inhibitor transfection was 50 nM. In the revised manuscript, we have corrected the transfection time and clarified that we did not utilize miRNA antagomirs in our experiments.

      (2) Pg 20, line 507. What was the miR-4521 agomiR used to treatment of the animals?

      miRNA agomir serves as a valuable experimental tool for elucidating miRNA function, used to simulate the overexpression of a specific miRNA. miRNA agomir is a chemically modified RNA molecule identical in sequence to the target miRNA, engineered for enhanced stability and transfection efficacy. Utilizing miRNA agomir enables the overexpression of the target miRNA, facilitating the investigation of miRNA functions and mechanism in vivo. In our study, we have employed miRNA mimic for cellular studies and miRNA agomir in vivo applications to achieve high expression of miRNA (Fu et al, 2019).

      (3) Figure 1B. The results are showing the RT-qPCR for only 5 circRNA, however, the results show 48 circRNAs were upregulated, and 18 were downregulated (Figure S1D). Why were the other cicRNAs not confirmed? The circRNAs upregulated with high expression are not necessarily with the best differential expression comparing control vs. PAHG groups. Furthermore, Figure 1A and S1D show circRNAs downregulated also with high expression. Why were these circRNAs not confirmed?

      Our study aims to the identification of potential biomarkers for endothelial dysfunction in type 2 diabetes, To the end, we focused on circRNAs that exhibited significant upregulation following PAHG treatment. In our sequencing data, the p-values for these top upregulated circRNAs were notably below the threshold of 0.001, prompting their selection for further validation. We employed qRT-PCR to ascertain the consistency of their expression levels with the RNA-sequencing findings. Among these, circHMGCS1 was identified as a promising candidate with regulatory potential in endothelial dysfunction. Additionally, circRNAs that were significantly downregulated will be the subject of our ongoing research endeavors.

      (4) Figure 1B shows the relative circRNAs expression. Were host genes expressed in the same direction?

      circRNAs are generated from specific exons or introns of their host genes, either individually or in combination, and the main function of circRNA depends on its non-coding RNA characteristics. The expression levels of circRNAs is not necessarily correlated with those of their host genes, and similarly, the function of circRNAs do not inherently relate to the functions of the host genes (Kristensen et al, 2019; Liu & Chen, 2022). Consequently, the data presented in Figure 1B were primarily aimed at validating the accuracy of circRNA-seq. Although we did not conduct host gene expression analysis for the identified circRNAs, our subsequent results indicated that the overexpression of circHMGCS1 did not influence the expression levels of HMGCS1 (Figure 2A).

      (5) Line 128. The circRNA RT-qPCR methodology was not described. The methodology should be described in detail in the Methods Session.

      The only difference between the circRNA RT-qPCR method and other gene detection is that random primers need to be used for reverse transcription during the reverse transcription process. Unlike linear RNAs that possess a 3' polyA tail, which allows for the use of oligo(dT) primers, circRNAs require random primers to initiate the reverse transcription process. Beyond this distinction, the other processes are no different from the common qRT-PCR process. We have revised the Isolation of RNA and miRNA for quantitative Real Time-PCR (qRT-PCR) analysis method in the revised version (Line 695).

      (6) Line 699. The relative gene expression was calculated using the 2-ΔΔCt method. This is not correct, the expression for miRNA and gene expression are represented in percentage of control.

      We initially employed the 2^-ΔΔCt method to ascertain the relative gene expression levels. Subsequently, we scaled all values by a factor of 100 to amplify the visual representation of the observed variations, thereby enhancing the visualization of the data.

      (7) Line 630. Detection of ROS for tissue and cells. The methodology for tissue was described, but not for cells.

      We have added the detailed description of the cellular ROS detection methods in the revised manuscript as follows:

      For ROS detection in cells, the treated cells were washed once by PBS, then 20 μM DHE was added, and incubated at 37°C for 30 min away from light, then washed three times by PBS and then colorless DMEM medium was added, followed by fluorescence microscopy for observation (Line 640-643).

      (8) Line 796. RNA Fluorescent In Situ Hybridization (RNA-FISH). Figure 1F shows that the RNA-Fluorescence in situ hybridization (RNA-FISH) confirmed the robust expression of cytoplasmic circHMGCS1 in HUVECs (Figure 1F). However, in the methods, lines 804 and 805 described the probes targeting circMAP3K5 and miR-4521 were applied to the sections. Hybridization was performed in a humid chamber at 37C overnight. Is it correct?

      We have made a correction in the revised manuscript. The accreted description is "the probes targeting circHMGCS1 and miR-4521 were applied to the sections"(Line816).

      (9) Line 14. Fig 1-H. The authors discuss qRT-PCR demonstrated that circHMGCS1 displayed a stable half-life exceeding 24 h, whereas the linear transcript HMGCS1 mRNA had a half-life less than 8 h (Figure 1H). Several of the antibodies may contain trace amounts of RNases that could degrade target RNA and could result in loss of RNA hybridization signal or gene expression. Thus, all of the solutions should contain RNase inhibitors. The HMGCS1 mRNA expression could be degraded over the incubation time (0-24hs) leading to incorrect results. Moreover, in the methods is not mentioned if the RNAse inhibitor was used. Please, could the authors discuss and provide information?

      This experiment was performed in cell culture as described in our Experimental Methods (Line 753), where we added actinomycin D directly into the cell culture well plates, and the cells remained in a healthy state during this treatment. We did not directly extract mRNA from cells for this experiment. Additionally, all solutions utilized throughout the whole experiment were prepared using Rnase-free water, ensuring that the integrity of the mRNA.

      (10) Further experiments demonstrated that the overexpression of circHMGCS1 stimulated the expression of adhesion molecules (VCAM1, ICAM1, and ET-1) (Figures 2B and 2C), suggesting that circHMGCS1 is involved in VED. How were these genes expressed in the RNA-seq?

      In the manuscript, we only focused exclusively on circRNA and miRNA sequencing, and not perform mRNA sequencing, Consequently, we employed qRT-PCR and Western blot to assess the expression alterations of ET-1, ICAM1, and VCAM1 at gene and protein level. The findings revealed that the overexpression of circHMGCS1 significantly upregulated the expression of adhesion molecules (VCAM1, ICAM1, and ET-1).

      (11) Line 256. By contrast, the combined treatment of circHMGCS1 and miR-4521 agomir did not significantly affect the body weight and blood glucose levels. OGTT and ITT experiments demonstrated that miR-4521 agomir considerably enhanced glucose tolerance and insulin resistance in diabetic mice (Figures 5C, 5D, and Figures S5B and S5C). Why did the miR-4521 agomir treatment considerably enhance glucose tolerance and insulin resistance in diabetic mice, but not the blood glucose levels?

      Our results showed that miR-4521 agomir could effectively suppress the increase of body weight and blood glucose in mice (Figure 5A-B).

      (12) In the experiments related to pull-down, the authors performed Biotin-coupled miR-4521 or its mutant probe, which was employed for circHMGCS1 pull-down. This result only confirms the Luciferase experiments shown in Figure 4A. The experiment that the authors need to perform is pull-down using a biotin-labeled antisense oligo (ASO) targeting the circHMGCS1 backsplice junction sequence followed by pulldown with streptavidin-conjugated magnetic beads to capture the associated miRNAs and RNA binding proteins (RBPs). Also, the ASO pulldown assay can be coupled to miRNA RT-qPCR and western blotting analysis to confirm the association of miRNAs and RBPs predicted to interact with the target circRNA.

      This point is correct. As suggested, we utilized a biotin-labeled circHMGCS1 probe for pull down experiments. Because circRNA-miRNA interactions are mainly mediated by the RNA-induced silencing complex, which includes Argonaute 2 (AGO2), we examined the levels of miR-4521 and AGO2 in the capture meterial. Our results demonstrated that circHMGCS1 significantly captured miR-4521 in the cells, with a concomitant acquisition of AGO2. These findings have been integrated into the revised manuscript (Supplementary Figures 4D and 4E).

      (13) In Figure 5, the authors showed that the results suggest that miR-4521 can inhibit the occurrence of diabetes, whereas circHMGCS1 specifically dampens the function of miR-4521, weakening its protective effect against diabetes. In this context, what are the endogenous target genes for the miR-4521 that could be regulating diabetes?

      In this study, we focused on the role of miR-4521 in endothelial function. Our animal experiments involving ARG1 knockdown revealed that the reduction of ARG1 expression resulted in the inability of miR-4521 to modulate the progression of type 2 diabetes. Consequently, ARG1 is likely an endogenous target gene of miR-4521, potentially implicated in the regulation of diabetes.

      (14) In the western blot of Figure 5, the β-actin band appears to be different from the genes analyzed. Was the same membrane used for the four proteins? The Ponceau S membrane should be provided.

      As described in our experimental methodology (Western blot analysis), we have utilized PVDF membranes for our Western blot experiments. β-actin, recognized for its high expression and specificity as a housekeeping gene, yields distinct bands with minimal background noise. This property can lead to the migration β-actin from the spot wells to both sides during electrophoresis. So much so that it is not aligned with the lane shown by the target gene. And the other 3 genes can see the phenomenon of obvious lane because their expression is not as high as β-actin. We replaced β-actin with a similar background in the revised manuscript (Figure 5L).

      (15) Why did the authors use AAV9, since the AAV9 has a tropism for the liver, heart, skeletal muscle, and not to endothelial vessels?

      AAV9 has garnered significant interest as a gene delivery vector due to its extensive tissue penetration, minimal immunogenicity, and stable gene expression profile. Its application in cardiovascular disease research and therapy has been widely reported (Barbon et al, 2023; Yao et al, 2018; Zincarelli et al, 2008). Meanwhile, we employed AAV9 for gene delivery via the tail vein injection in mice, and as shown in Figure 5J and Figure 7Q, we observed GFP signals carried by AAV9 in the thoracic aorta of mice. These findings suggest that AAV9 possesses the capability to infect endothelial cells effectively.

      Reviewer #2 (Public Review):

      Summary:

      The authors observed an aggravated vascular endothelial dysfunction upon overexpressing circHMGCS1 and inhibiting miR-4521. This study discovered that circHMGCS1 promotes arginase 1 expression by sponging miR-4521, which accelerated the impairment of vascular endothelial function.

      Strengths:

      The study is systematic and establishes the regulatory role of the circHMGCS1-miR-4521 axis in diabetes-induced cardiovascular diseases.

      Weaknesses:

      (1) The authors selected the miR-4521 as the target based on their reduced expression upon circHMGCS1 overexpression. Since the miRNA level is downregulated, the downstream target gene is expected to be upregulated even in the absence of circRNA. The changes in miRNA expression opposite to the levels of target circRNA could be through Target RNA-Directed MicroRNA Degradation. In addition, miRNA can also be stabilized by circRNAs. Hence, selecting miRNA targets based on opposite expression patterns and concluding miRNA sponging by circRNA needs further evidence of direct interactions.

      Thank you for your positive comments and kind suggestions.

      As suggested by Public Reviewer #1 (12), we employed a biotin-tagged circHMGCS1 to capture miR-4521 and AGO2 in HUVECs (Supplementary Figures 4D and 4E), and Dual luciferase assays have confirmed that miR-4521 can bind to circHMGCS1 directly. Furthermore, RNA pull down and RIP assays have demonstrated the direct binding capability of circHMGCS1 for miR-4521. Collectively, these findings underscore the direct interaction between circHMGCS1 and miR-4521.

      (2) The majority of the experiments were performed with an overexpression vector which can generate a lot of linear RNAs along with circRNAs. The linear RNAs produced by the overexpression vectors can have a similar effect to the circRNA due to sequence identity.

      In our manuscript, the employed vectors incorporate reverse repeat sequences that facilitate efficient circularization of circRNAs. This design ensures robust circular shearing upon the insertion of circRNA sequences into the polyclonal sites, thereby enhancing the overexpression of circRNAs (Supplementary Figure 2). Moreover, we used lentiviral virus as a vector for circRNA overexpression, not direct plasmid transfection. As demonstrated in Figure 2A, upon overexpression of circHMGCS1, we observed a significant upregulation in circHMGCS1 levels compared to the pLV-circNC and Control groups. Notably, the expression levels of the linear HMGCS1 mRNA did not exhibit significant alterations.

      (3) There is a lack of data of circHMGCS1 silencing and its effect on target miRNA & mRNAs.

      According to your suggestion, we employed shRNA to knockdown circHMGCS1 in HUVEC, and qRT-PCR was used to assess the expression levels of miR-4521 and ARG1. The knockdown of circHMGCS1 significantly inhibit the expression of circHMGCS1 in HUVEC without obviously affecting the levels of HMGCS1 mRNA. We then selected circHMGCS1 shRNA1 for further investigation. We observed that the knockdown of circHMGCS1 resulted in an upregulation of miR-4521 and a downregulation of ARG1 expression.

      Author response image 1.

      The impact of circHMGCS1 knockdown on ARG1 and miR-4521 expression levels in HUVEC. The cells were transfected with either circHMGCS1 shRNA1 or circHMGCS1 shRNA2, and the expressions levels of circHMGCS1 and HMGCS1 (A), miR-4521 (B) and ARG1 (C and D) in HUVECs were detected by qRT-PCR and Western blot. n=3 in each group. *p < 0.05, **p < 0.01. All significant difference was determined by one-way ANOVA followed by Bonferroni multiple comparison post hoc test, error bar indicates SD.

      Recommendations for the authors:

      Reviewer #1 (Recommendations For The Authors):

      I suggest improving the discussion based on the literature.

      (1) Line 131. .... (hsa_circ_0008621, 899 nt in length, identified as circHMGCS1 in subsequent studies because of its host gene being HMGCS1). Please, provide the reference.

      We appreciate the valuable comments. We have made changes for improvement, which is add in Line 133(Liang et al, 2021).

      (2) The authors conclude that both in vitro and in vivo data suggest that the miR-4521 or circHMGCS1 fails to regulate the effect of diabetes-induced VED in the absence of ARG1. Therefore, ARG1 may serve as a promising VED biomarker, and circHMGCS1 and miR-4521 play a key role in regulating diabetes-induced VED by ARG1. In this context, they should re-evaluate whether this is the best title. "Circular RNA HMGCS1 sponges miR-4521 to aggravate type 2 diabetes-induced vascular endothelial dysfunction"

      This manuscript initiates its exploration with circRNA as the focal point of study (Figure 1 and Figure 2), It then delves into the miRNAs associated with circRNA and elucidates their interactions (Figure 3, Figure 4 and Figure 5). Subsequently, the manuscript identifies the target genes of miRNA and validates the regulatory effects of circRNA and miR-4521 on ARG1 (Figure 6). The study culminates with the application of the ceRNA theory to confirm the significance of ARG1 in the functional interplay between circHMGCS1 and miR-4521 (Figure 7). These findings throughout the manuscript are dedicated to uncovering the pivotal roles of circHMGCS1 and miR-4521 in modulating vascular endothelial function. Notably, the interaction between circHMGCS1 and miR-4521 represents a novel discovery of our research. Therefore, we aim to emphasize the critical function of circHMGCS1 and miR-4521 in the regulation of vascular endothelial dysfunction in type 2 diabetes within the manuscript.

      Reviewer #2 (Recommendations For The Authors):

      I have a few suggestions for improving the study further.

      (1) Although the experiments suggest the role of circHMGCS1, miR-4521 in vascular endothelial function, the direct regulation or interaction of circHMGCS1-miR-4521-ARG1 is unclear. A rescue experiment that checks the effect of circHMGCS1 silencing with/without inhibition of miR-4521 on ARG1 expression must be performed to prove the circHMGCS1- miR-4521 regulatory axis.

      Thank you very much for your constructive comments.

      According to your suggestion, we utilized shRNA to effectively knockdown circHMGCS1 in HUVEC, Subsequent expression analysis via qRT-PCR was conducted to assess the levels of miR-4521 and ARG1. The knockdown of circHMGCS1 significantly reduced the expression of circHMGCS1 in HUVEC without influencing the expression of the host gene HMGCS1. Concurrently, the knockdown of circHMGCS1 resulted in an upregulation of miR-4521 (Supplementary Figure 4B) and a downregulation of ARG1 (Figure 6P and 6Q). In our manuscript, the upregulation in ARG1 expression caused by circHMGCS1 overexpression was reduced by miR-4521, and the downregulation in ARG1 expression caused by miR-4521 overexpression was also reversed by circHMGCS1. When miR-4521 was knocked down, the expression of ARG1 increased, and circHMGCS1 abrogated its regulatory effect on the expression of ARG1. Collectively, these findings indicate that the interplay between circHMGCS1 and miR-4521 significantly influences ARG1 expression.

      Author response image 2.

      The impact of circHMGCS1 knockdown on ARG1 and miR-4521 expression levels in HUVEC. The cells were transfected with either circHMGCS1 shRNA1 or circHMGCS1 shRNA2, and the expressions levels of circHMGCS1 and HMGCS1 (A), miR-4521 (B) and ARG1 (C and D) in HUVECs were detected by qRT-PCR and Western blot. n=3 in each group. *p < 0.05, **p < 0.01. All significant difference was determined by one-way ANOVA followed by Bonferroni multiple comparison post hoc test, error bar indicates SD.

      (2) It is unclear how the authors arrived at the circHMGCS1-miR-4521 pair. The pull down of circHMGCS1 followed by qPCR enrichment analysis of all target miRNAs must be performed to select the target miRNA.

      In this manuscript, we identified the expression of miRNA under PAHG treatment through miRNA sequencing, and then further screened out 4 miRNAs with potential binding sites to circHMGCS1 utilizing the miRanda database. Subsequently, we employed qRT-PCR and Western blot analysis to confirm the regulatory influence of miR-4521 on endothelial function (Figure 3). Following this, RIP, RNA pull down, dual luciferase and RNA-FISH experiments were conducted to map the interaction between circHMGCS1 and miR-4521 (Figure 4), the direct interaction between circHMGCS1 and miR-4521 was further substantiated through overexpression and knockdown studies (Figures 5-7). while the reviewer's method may offer a more direct validation, our methodology initially involved a database-driven screening of candidate miRNAs with the potential to target and bind circHMGCS1, followed by experimental validation of these interactions. Both methodologies are capable of establishing the interaction sites between circHMGCS1 and miR-4521.

      (3) Since the back splicing is not that efficient, the linear RNA from the overexpression construct may produce many linear RNAs with miRNA binding sites. The effect seen in the case of overexpression experiments needs to consider the level of linear and circular HMGCS1 produced by the vector.

      In this manuscript, the vector's multiple cloning site is flanked by inverted repeat sequences that facilitate efficient circRNA looping. This design enables the inserted sequence to form a stable loop and undergo circularization upon transcription, leading to the overexpression of circRNA (Supplementary Figure 2). For the validation of circular RNA, we employed divergent primers that straddle the circRNA splicing junction. These primers are specific for circRNA amplification and do not amplify the corresponding linear RNA, as demonstrated in Figure 2A. Upon overexpression of circHMGCS1, we observed a significant increase in circHMGCS1 levels compared to the empty vector and Control groups, while there was no significant change in the expression level of HMGCS1 mRNA.

      (4) As miR-4521 has multiple miRNA binding sites on circHMGCS1, it is not very clear which sites were mutated in circHMGCS1-MUT.

      We have made corrections to Supplementary Figure 4C. Utilizing the miRanda algorithm, we identified 10 potential binding sites for miR-4521 on circHMGCS1. Subsequently, we selected the site with the highest binding affinity for mutational analysis (miR-4521 binding positions 3-15, circHMGCS1 binding positions 260-281, binding rate 91.67%, binding ability -17.299999 kCal/Mol). We employed a dual-luciferase assay to confirm the direct interaction between circHMGCS1 and miR-4521.

      (5) Since the ceRNA network works efficiently in an equimolar concentration of the regulatory molecules, providing the copy number of circHMGCS1, miR-4521, and target mRNAs would be helpful.

      We employed qRT-PCR to ascertain the absolute quantification of mRNA copy numbers, following established methodologies (Nolan et al, 2006; Wagatsuma et al, 2005; Zhang et al, 2009). Our qRT-PCR data reveal that the circHMGCS1 mRNA copy number is 2343±529. In comparison, the ARG1 mRNA copy number stands at 88±27, while the miR-4521 copy number is significantly higher, recorded at 36277±9407.

      Author response image 3.

      The distribution of copy numbers for circHMGCS1, miR-4521 and ARG1 in HUVECs.

      (6) The yellow highlighted "cyclization-mediated sequence-F & R" does not seem to be complementary sequences. The method section may include the details of the vectors and cloning strategies for the overexpression constructs.

      The figure below illustrates the schematic representation of the complementary structure between the upstream and downstream sequences that facilitate circRNA circularization. This strategic pairing is designed to enhance the circularization efficiency of circRNA while concurrently suppressing mRNA synthesis (Liang & Wilusz, 2014). Details of this design have been integrated into the experimental method (Line539). The specific additions are as follows:

      The circHMGCS1 sequence [NM_001098272: 43292575-43297268], the splice site AG/GT and ALU elements were inserted into the pCDH-circRNA-GFP vector (upstream ALU: AAAGTGCTGAGATTACAGGCGTGAGCCACCACCCCCGGCCCACTTTTTGTAAAGGTACGTACTAATGACTTTTTTTTTATACTTCAG, downstream ALU: GTAAGAAGCAAGGAAAAGAATTAGGCTCGGCACGGTAGCTCACACCTGTAATCCCAGCA). The restriction enzyme sites selected were EcoRI and NotI.

      Author response image 4.

      (7) Since circHMGCS1 is a multi-exonic circRNA that can undergo alternative splicing and divergent primers only validate the backsplice junction, the full-length sequence of mature circHMGCS1 needs to be checked by circRNA-RCA PCR followed by Sanger sequencing.

      In compliance with your guidance, we have enriched the revised manuscript with additional data. Specifically, we have included the full-length nucleic acid electrophoresis diagram of circHMGCS1 in Supplementary Figure 1F, the Sanger sequencing results in Supplementary Figure 1G, and a comparative analysis of the circHMGCS1 sequences obtained from Sanger sequencing with those referenced in the circBase database, presented in Supplementary Figure 1H.

      Reference:

      Barbon, E., C. Kawecki, S. Marmier, A. Sakkal, F. Collaud, S. Charles, G. Ronzitti, C. Casari, O.D. Christophe, C.V. Denis, P.J. Lenting, and F. Mingozzi. 2023. Development of a dual hybrid AAV vector for endothelial-targeted expression of von Willebrand factor. Gene Ther. 30: 245-254.

      Fu, Y., J. Chen, and Z. Huang. 2019. Recent progress in microRNA-based delivery systems for the treatment of human disease. ExRNA. 1: 24.

      Kristensen, L.S., M.S. Andersen, L.V.W. Stagsted, K.K. Ebbesen, T.B. Hansen, and J. Kjems. 2019. The biogenesis, biology and characterization of circular RNAs. Nat Rev Genet. 20: 675-691.

      Liang, D., and J.E. Wilusz. 2014. Short intronic repeat sequences facilitate circular RNA production. Genes Dev. 28: 2233-2247.

      Liang, J., X. Li, J. Xu, G.M. Cai, J.X. Cao, and B. Zhang. 2021. hsa_circ_0072389, hsa_circ_0072386, hsa_circ_0008621, hsa_circ_0072387, and hsa_circ_0072391 aggravate glioma via miR-338-5p/IKBIP. Aging (Albany NY). 13: 25213-25240.

      Liu, C.X., and L.L. Chen. 2022. Circular RNAs: Characterization, cellular roles, and applications. Cell. 185: 2016-2034.

      Nolan, T., R.E. Hands, and S.A. Bustin. 2006. Quantification of mRNA using real-time RT-PCR. Nat Protoc. 1: 1559-1582.

      Wagatsuma, A., H. Sadamoto, T. Kitahashi, K. Lukowiak, A. Urano, and E. Ito. 2005. Determination of the exact copy numbers of particular mRNAs in a single cell by quantitative real-time RT-PCR. J Exp Biol. 208: 2389-2398.

      Yao, C., T. Veleva, L. Scott, Jr., S. Cao, L. Li, G. Chen, P. Jeyabal, X. Pan, K.M. Alsina, I.D. Abu-Taha, S. Ghezelbash, C.L. Reynolds, Y.H. Shen, S.A. Lemaire, W. Schmitz, F.U. Müller, A. El-Armouche, N. Tony Eissa, C. Beeton, S. Nattel, X.H.T. Wehrens, D. Dobrev, and N. Li. 2018. Enhanced Cardiomyocyte NLRP3 Inflammasome Signaling Promotes Atrial Fibrillation. Circulation. 138: 2227-2242.

      Zhang, X.X., T. Zhang, M. Zhang, H.H. Fang, and S.P. Cheng. 2009. Characterization and quantification of class 1 integrons and associated gene cassettes in sewage treatment plants. Appl Microbiol Biotechnol. 82: 1169-1177.

      Zincarelli, C., S. Soltys, G. Rengo, and J.E. Rabinowitz. 2008. Analysis of AAV serotypes 1-9 mediated gene expression and tropism in mice after systemic injection. Mol Ther. 16: 1073-1080.

    1. Author response:

      Public Reviews:

      Reviewer #1 (Public Review):

      Summary:

      In this work, the authors continue their investigations on the key role of glycosylation to modulate the function of a therapeutic antibody. As a follow-up to their previous demonstration on how ADCC was heavily affected by the glycans at the Fc gamma receptor (FcγR)IIIa, they now dissect the contributions of the different glycans that decorate the diverse glycosylation sites. Using a well-designed mutation strategy, accompanied by exhaustive biophysical measurements, with extensive use of NMR, using both standard and newly developed methodologies, they demonstrate that there is one specific locus, N162, which is heavily involved in the stabilization of (FcγR)IIIa and that the concomitant NK function is regulated by the glycan at this site.

      Strengths:

      The methodological aspects are carried out at the maximum level.

      Weaknesses:

      The exact (or the best possible assessment) of the glycan composition at the N162 site is not defined.

      We will revise the Introduction to include previous findings from our laboratory regarding processing on YTS cells:

      “YTS cells, a key cytotoxic human NK cell line used for these studies, express FcγRIIIa with extensive glycan processing, including the N162 site with predominantly hybrid and complex-type glycoforms {Patel 2021}.”  

      Reviewer #2 (Public Review):

      Summary:

      The authors set out to demonstrate a mechanistic link between Fcgamma receptor (IIIA) glycosylation and IgG binding affinity and signaling - resulting in antibody-dependent cellular cytotoxicity - ADCC. The work builds off prior findings from this group about the general impact of glycosylation on FcR (Fc receptor)-IgG binding.

      Strengths:

      The structural data (NMR) is highly compelling and very significant to the field. A demonstration of how IgG interacts with FcgRIIIA in a manner sensitive to glycosylation of both the IgG and the FcR fills a critical knowledge gap. The approach to demonstrate the selective impact of glycosylation at N162 is also excellent and convincing. The manuscript/study is, overall, very strong.

      Weaknesses:

      There are a number of minor weaknesses that should be addressed.

      (1) Since S164A is the only mutant in Figure 1 that seems to improve affinity, even if minimally, it would be a nice reference to highlight that residue in the structural model in panel B.

      We will revise Figure 1B to include the S164 site.

      (2) It is confusing why some of the mutants in the study are not represented in Figure 1 panel A. Those affinities and mutants should be incorporated into panel A so the reader can easily see where they all fall on the scale.

      We thank the reviewer for this comment. We will restructure the Results section to highlight that a primary outcome of the experiment referenced was to map the contribution of interface residues to antibody binding affinity. These data were not previously available, highlighting hotspots at the interface. Figure 1A and B report these results.

      We then used a subset of mutations from this experiment, as well as a subset of mutations from an additional library containing mutations proximal to the interface, to build a small library for evaluation using ADCC. The complete binding data for all variants, binding to two different IgG1 Fc glycoforms, is presented in Supplemental Table 1. 

      T167Y in particular needs to be shown, as it is one of few mutants that fall between what seems to be ADCC+ and ADCC- lines. Also, that mutant seems to have a stronger affinity compared to wt (judged by panel D), yet less ADCC than wt. This would imply that the relationship between affinity and activity is not as clean as stated, though it is clearly important. Comments about this would strengthen the overall manuscript.

      We thank the reviewer for this particular insight. We agree that the lack of a clean correlation between ADCC potency and affinity implies additional factors that could have affected these experimental results. We will add the following sentence to the discussion. 

      “Notably, the ADCC potency for those high-affinity variants does not fall cleanly on a line, indicating that other factors affect our observations, which may include organization at the cell surface, changes to glycan composition, or receptor trafficking.”

      (3) This statement feels out of place: "In summary, this result demonstrates that the sensitivity to antibody fucosylation may be eliminated through FcγRIIIa engineering while preserving antibody-binding affinity." In Figure 2, the authors do indeed show that mutations in FcgRIIIa can alter the impact of IgG core fucosylation, but implying that receptor engineering is somehow translatable or as impactful therapeutically as engineering the antibody itself deflates the real basic science/biochemical impact of understanding these interactions in molecular detail. Not everything has to be immediately translatable to be important. 

      We agree and will remove the highlighted sentence.   

      (4) The findings reported in Figure 2, panel C are exciting. Controls for the quality of digestion at each step should be shown (perhaps in supplementary data). We agree.

      We will add an example of the digestions as Figure S2.  

      (5) Figure 3 is confusing (mislabeled?) and does not show what is described in the Results. First, there is a F158V variant in the graph but a V158F variant in the text.

      Please correct this. 

      Thank you for identifying this typo. We will correct Figure 3.

      Second, this variant (V158F/F158V) does not show the 2-fold increase in ADCC with kifunesine as stated. 

      Thank you for drawing our attention to this rounding error. We will revise the text to report a statistically significant 1.4-fold increase.

      Finally, there are no statistical evaluations between the groups (+/- kif; +/- fucose). 

      We provide the p values for +/-fuc and +/- Kifunensine for each YTS cell line in the figure. We did not provide a global comparison of p values that included all cell lines due to some cell lines experiencing a significant change and others not. However, we will add the raw data as Supplemental Table 2 should readers wish to perform these analyses.

      The differences stated are not clearly statistically significant given the wide spread of the data. This is true even for the wt variant.

      We agree that there are points that overlap in this figure between the different treatments. However, our use of the students T-test (two tailed) using three experiments collected on three different days (each with three technical replicates) provides enough resolution to determine the significance of difference of the means for the different treatments. This is, by our estimation, a highly rigorous manner to collect and analyze the data.  

      (6) The kifunensine impact is somewhat confusing. They report a major change in ADCC, yet similar large changes with trimming only occur once most of the glycan is nearly gone (Figure 2). Kifunensine will tend to generate high mannose and possibly a few hybrid glycans. It is difficult to understand what glycoforms are truly important outside of stating that multi-branched complex-type N-glycans decrease affinity.

      Note that Figure 2 does not evaluate the kifunensine-treated glycan, which is mostly Man8 and Man9 structures. In our previous work, these structures likewise provide increased binding affinity (see pubmed ID 30016589). We believe the most important message is that composition of the N162 glycan (removed with the S164A mutation) regulates NK cell ADCC. On cells, we are not able to modulate N162 glycan composition without affecting potentially every other N-glycan on the surface, so we do not have an ADCC experiments that is directly comparable to Figure 2. Thus, this increased ADCC resulting from kifunensine treatment is consistent with previously observed increases in binding affinity measurement.  

      (7) This is outside of the immediate scope, but I feel that the impact would be increased if differences in NK cell (and thus FcgRIIIA) glycosylation are known to occur during disease, inflammation, age, or some other factor - and then to demonstrate those specific changes impact ADCC activity via this mechanism.

      We agree completely. As mentioned in the Introduction, we know that N162 glycan composition varies substantially from donor to donor based on previous work from our lab. Curiously, little variability appeared between donors at the other four Nglycosylation sites. Thus, there is the potential that different NK cell N162 glycan compositions are coincident with different indications. This is an area we are quite interested in pursuing.

    1. Author response:

      The following is the authors’ response to the original reviews.

      Public Reviews:

      Reviewer #1 (Public Review):

      Summary:

      In this manuscript, the authors investigate the contributions of the long noncoding RNA snhg3 in liver metabolism and MAFLD. The authors conclude that liver-specific loss or overexpression of Snhg3 impacts hepatic lipid content and obesity through epigenetic mechanisms. More specifically, the authors invoke that the nuclear activity of Snhg3 aggravates hepatic steatosis by altering the balance of activating and repressive chromatin marks at the Pparg gene locus. This regulatory circuit is dependent on a transcriptional regulator SND1.

      Strengths:

      The authors developed a tissue-specific lncRNA knockout and KI models. This effort is certainly appreciated as few lncRNA knockouts have been generated in the context of metabolism. Furthermore, lncRNA effects can be compensated in a whole organism or show subtle effects in acute versus chronic perturbation, rendering the focus on in vivo function important and highly relevant. In addition, Snhg3 was identified through a screening strategy and as a general rule the authors the authors attempt to follow unbiased approaches to decipher the mechanisms of Snhg3.

      Weaknesses:

      Despite efforts at generating a liver-specific knockout, the phenotypic characterization is not focused on the key readouts. Notably missing are rigorous lipid flux studies and targeted gene expression/protein measurement that would underpin why the loss of Snhg3 protects from lipid accumulation. Along those lines, claims linking the Snhg3 to MAFLD would be better supported with careful interrogation of markers of fibrosis and advanced liver disease. In other areas, significance is limited since the presented data is either not clear or rigorous enough. Finally, there is an important conceptual limitation to the work since PPARG is not established to play a major role in the liver.

      We thank the reviewer for the detailed comment. In this study, hepatocyte-specific Snhg3 deficiency decreased body and liver weight and alleviated hepatic steatosis in DIO mice, whereas overexpression induced the opposite effect (Figure 2 and 3). Furthermore, we investigated the hepatic differentially expressed genes (DEGs) between the DIO Snhg3-HKI and control WT mice using RNA-Seq and revealed that Snhg3 exerts a global effect on the expression of genes involved in fatty acid metabolism using GSEA (Figure 4B). We validated the expression of some DEGs involved in fatty acid metabolism by RT-qPCR. The results showed that the hepatic expression levels of some genes involved in fatty acid metabolism, including Cd36, Cidea/c and Scd1/2 were upregulated in Snhg3-HKO mice and were downregulated in Snhg3-HKI mice compared to the controls (Figure 4C), respectively. Please check them in the first paragraph in p8.

      As a transcription regulator of Cd36 and Cidea/c, it is well known that PPARγ plays major adipogenic and lipogenic roles in adipose tissue. Although the expression of PPARγ in the liver is very low under healthy conditions, induced expression of PPARγ in both hepatocytes and non-parenchymal cells (Kupffer cells, immune cells, and HSCs) in the liver has a crucial role in the pathophysiology of MASLD (Lee et al., 2023b, Chen et al., 2023, Gross et al., 2017). The activation of PPARγ in the liver induces the adipogenic program to store fatty acids in lipid droplets as observed in adipocytes (Lee et al., 2018). Moreover, the inactivation of liver PPARγ abolished rosiglitazone-induced an increase in hepatic TG and improved hepatic steatosis in lipoatrophic AZIP mice (Gavrilova et al., 2003). Furthermore, there is a strong correlation between the onset of hepatic steatosis and hepatocyte-specific PPARγ expression. Clinical trials have also indicated that increased insulin resistance and hepatic PPARγ expressions were associated with NASH scores in some obese patients (Lee et al., 2023a, Mukherjee et al., 2022). Even though PPARγ’s primary function is in adipose tissue, patients with MASLD have much higher hepatic expression levels of PPARγ, reflecting the fact that PPARγ plays different roles in different tissues and cell types (Mukherjee et al., 2022). As these studies mentioned above, our result also hinted at the importance of PPARγ in the pathophysiology of MASLD. Snhg3 deficiency or overexpression respectively induced the decrease or increase in hepatic PPARγ. Moreover, administration of PPARγ antagonist T0070907 mitigated the hepatic Cd36 and Cidea/c increase and improved Snhg3-induced hepatic steatosis. However,  conflicting findings suggest that the expression of hepatic PPARγ is not increased as steatosis develops in humans and in clinical studies and that PPARγ agonists administration didn’t aggravate liver steatosis (Gross et al., 2017). Thus, understanding how the hepatic PPARγ expression is regulated may provide a new avenue to prevent and treat the MASLD (Lee et al., 2018). We also discussed it in revised manuscript, please refer the first paragraph in the section of Discussion in p13.

      Hepatotoxicity accelerates the development of progressive inflammation, oxidative stress and fibrosis (Roehlen et al., 2020). Chronic liver injury including MASLD can progress to liver fibrosis with the formation of a fibrous scar. Injured hepatocytes can secrete fibrogenic factors or exosomes containing miRNAs that activate HSCs, the major source of the fibrous scar in liver fibrosis (Kisseleva and Brenner, 2021). Apart from promoting lipogenesis, PPARγ has also a crucial function in improving inflammation and fibrosis (Chen et al., 2023). In this study, no hepatic fibrosis phenotype was seen in Snhg3-HKO and Snhg3-HKI mice (figures supplement 1D and 2D). Moreover, deficiency and overexpression of Snhg3 respectively decreased and increased the expression of profibrotic genes, such as collagen type I alpha 1/2 (Col1a1 and Col1a2), but had no effects on the pro-inflammatory factors, including transforming growth factor β1 (Tgfβ1), tumor necrosis factor α (Tnfα), interleukin 6 and 1β (Il6 and Il1β) (figures supplement 3A and B). Inflammation is an absolute requirement for fibrosis because factors from injured hepatocytes alone are not sufficient to directly activate HSCs and lead to fibrosis (Kisseleva and Brenner, 2021). Additionally, previous studies indicated that exposure to HFD for more 24 weeks causes less severe fibrosis (Alshawsh et al., 2022). In future, the effect of Snhg3 on hepatic fibrosis in mice need to be elucidated by prolonged high-fat feeding or by adopting methionine- and choline deficient diet (MCD) feeding. Please check them in the second paragraph in the section of Discussion in p13.

      References

      ALSHAWSH, M. A., ALSALAHI, A., ALSHEHADE, S. A., SAGHIR, S. A. M., AHMEDA, A. F., AL ZARZOUR, R. H. & MAHMOUD, A. M. 2022. A Comparison of the Gene Expression Profiles of Non-Alcoholic Fatty Liver Disease between Animal Models of a High-Fat Diet and Methionine-Choline-Deficient Diet. Molecules, 27. DIO:10.3390/molecules27030858, PMID:35164140

      CHEN, H., TAN, H., WAN, J., ZENG, Y., WANG, J., WANG, H. & LU, X. 2023. PPAR-gamma signaling in nonalcoholic fatty liver disease: Pathogenesis and therapeutic targets. Pharmacol Ther, 245, 108391. DIO:10.1016/j.pharmthera.2023.108391, PMID:36963510

      GAVRILOVA, O., HALUZIK, M., MATSUSUE, K., CUTSON, J. J., JOHNSON, L., DIETZ, K. R., NICOL, C. J., VINSON, C., GONZALEZ, F. J. & REITMAN, M. L. 2003. Liver peroxisome proliferator-activated receptor gamma contributes to hepatic steatosis, triglyceride clearance, and regulation of body fat mass. J Biol Chem, 278, 34268-76. DIO:10.1074/jbc.M300043200, PMID:12805374

      GROSS, B., PAWLAK, M., LEFEBVRE, P. & STAELS, B. 2017. PPARs in obesity-induced T2DM, dyslipidaemia and NAFLD. Nat Rev Endocrinol, 13, 36-49. DIO:10.1038/nrendo.2016.135, PMID:27636730

      KISSELEVA, T. & BRENNER, D. 2021. Molecular and cellular mechanisms of liver fibrosis and its regression. Nat Rev Gastroenterol Hepatol, 18, 151-166. DIO:10.1038/s41575-020-00372-7, PMID:33128017

      LEE, S. M., MURATALLA, J., KARIMI, S., DIAZ-RUIZ, A., FRUTOS, M. D., GUZMAN, G., RAMOS-MOLINA, B. & CORDOBA-CHACON, J. 2023a. Hepatocyte PPARgamma contributes to the progression of non-alcoholic steatohepatitis in male and female obese mice. Cell Mol Life Sci, 80, 39. DIO:10.1007/s00018-022-04629-z, PMID:36629912

      LEE, S. M., MURATALLA, J., SIERRA-CRUZ, M. & CORDOBA-CHACON, J. 2023b. Role of hepatic peroxisome proliferator-activated receptor gamma in non-alcoholic fatty liver disease. J Endocrinol, 257. DIO:10.1530/JOE-22-0155, PMID:36688873

      LEE, Y. K., PARK, J. E., LEE, M. & HARDWICK, J. P. 2018. Hepatic lipid homeostasis by peroxisome proliferator-activated receptor gamma 2. Liver Res, 2, 209-215. DIO:10.1016/j.livres.2018.12.001, PMID:31245168

      MUKHERJEE, A. G., WANJARI, U. R., GOPALAKRISHNAN, A. V., KATTURAJAN, R., KANNAMPUZHA, S., MURALI, R., NAMACHIVAYAM, A., GANESAN, R., RENU, K., DEY, A., VELLINGIRI, B. & PRINCE, S. E. 2022. Exploring the Regulatory Role of ncRNA in NAFLD: A Particular Focus on PPARs. Cells, 11. DIO:10.3390/cells11243959, PMID:36552725

      ROEHLEN, N., CROUCHET, E. & BAUMERT, T. F. 2020. Liver Fibrosis: Mechanistic Concepts and Therapeutic Perspectives. Cells, 9. DIO:10.3390/cells9040875, PMID:32260126

      Reviewer #2 (Public Review):

      Through RNA analysis, Xie et al found LncRNA Snhg3 was one of the most down-regulated Snhgs by a high-fat diet (HFD) in mouse liver. Consequently, the authors sought to examine the mechanism through which Snhg3 is involved in the progression of metabolic dysfunction-associated fatty liver diseases (MASLD) in HFD-induced obese (DIO) mice. Interestingly, liver-specific Snhg3 knockout was reduced, while Snhg3 over-expression potentiated fatty liver in mice on an HFD. Using the RNA pull-down approach, the authors identified SND1 as a potential Sngh3 interacting protein. SND1 is a component of the RNA-induced silencing complex (RISC). The authors found that Sngh3 increased SND1 ubiquitination to enhance SND1 protein stability, which then reduced the level of repressive chromatin H3K27me3 on PPARg promoter. The upregulation of PPARg, a lipogenic transcription factor, thus contributed to hepatic fat accumulation.

      The authors propose a signaling cascade that explains how LncRNA sngh3 may promote hepatic steatosis. Multiple molecular approaches have been employed to identify molecular targets of the proposed mechanism, which is a strength of the study. There are, however, several potential issues to consider before jumping to a conclusion.

      (1) First of all, it's important to ensure the robustness and rigor of each study. The manuscript was not carefully put together. The image qualities for several figures were poor, making it difficult for the readers to evaluate the results with confidence. The biological replicates and numbers of experimental repeats for cell-based assays were not described. When possible, the entire immunoblot imaging used for quantification should be presented (rather than showing n=1 representative). There were multiple mislabels in figure panels or figure legends (e.g., Figure 2I, Figure 2K, and Figure 3K). The b-actin immunoblot image was reused in Figure 4J, Figure 5G, and Figure 7B with different exposure times. These might be from the same cohort of mice. If the immunoblots were run at different times, the loading control should be included on the same blot as well.

      We thank the reviewer for the detailed comment. We have provided the clear figures in revised manuscript, please check them.

      The biological replicates and numbers of experimental repeats for cell-based assays had been updated and please check them in the manuscript.

      The entire immunoblot imaging used for quantification had been provided in the primary data. Please check them.

      The original Figure 2I, Figure 2K, Figure 3K have been revised and replaced with new Figure 2F, Figure 2H, Figure 3H, and their corresponding figure legends has also been corrected in revised manuscript.

      The protein levels of CD36, PPARγ and β-ACTIN were examined at the same time and we had revised the manuscript, please check them in revised Figure 7B and 7C.

      (2) The authors can do a better job in explaining the logic for how they came up with the potential function of each component of the signaling cascade. Snhg3 is down-regulated by HFD. However, the evidence presented indicates its involvement in promoting steatosis. In Figure 1C, one would expect PPARg expression to be up-regulated (when Sngh3 was down-regulated). If so, the physiological observation conflicts with the proposed mechanism. In addition, SND1 is known to regulate RNA/miRNA processing. How do the authors rule out this potential mechanism? How about the hosting snoRNA, Snord17? Does it involve the progression of NASLD?

      We thank the reviewer for the detailed comment. Our results showed that the expression of Snhg3 was decreased in DIO mice which led us to speculate that the downregulation of Snhg3 in DIO mice might be a stress protective reaction to high nutritional state, but the specific details need to be clarified. This is probably similar to fibroblast growth factor 21 (FGF21) and growth differentiation factor 15 (GDF15), whose endogenous expression and circulating levels are elevated in obese humans and mice despite their beneficial effects on obesity and related metabolic complications (Keipert and Ost, 2021). Although FGF21 can be induced by oxidative stress and be activated in obese mice and in NASH patients, elevated FGF21 paradoxically protects against oxidative stress and reduces hepatic steatosis (Tillman and Rolph, 2020).  We had added the content the section of Discussion, please check it in the second paragraph in p12.

      SND1 has multiple roles through associating with different types of RNA molecules, including mRNA, miRNA, circRNA, dsRNA and lncRNA. SND1 could bind negative-sense SARS-CoV-2 RNA and promoted viral RNA synthesis, and to promote viral RNA synthesis (Schmidt et al., 2023). SND1 is also involved in hypoxia by negatively regulating hypoxia‐related miRNAs (Saarikettu et al., 2023). Furthermore, a recent study revealed that lncRNA SNAI3-AS1 can competitively bind to SND1 and perturb the m6A-dependent recognition of Nrf2 mRNA 3'UTR by SND1, thereby reducing the mRNA stability of Nrf2 (Zheng et al., 2023). Huang et al. also reported that circMETTL9 can directly bind to and increase the expression of SND1 in astrocytes, leading to enhanced neuroinflammation (Huang et al., 2023). However, whether there is an independent-histone methylation role of SND1/lncRNA-Snhg3 involved in lipid metabolism in the liver needs to be further investigated. We also discussed the limitation in the manuscript and please refer the section of Discussion in the third paragraph in p17.

      Snhg3 serves as host gene for producing intronic U17 snoRNAs, the H/ACA snoRNA. A previous study found that cholesterol trafficking phenotype was not due to reduced Snhg3 expression, but rather to haploinsufficiency of U17 snoRNA. Upregulation of hypoxia-upregulated mitochondrial movement regulator (HUMMR) in U17 snoRNA-deficient cells promoted the formation of ER-mitochondrial contacts, resulting in decreasing cholesterol esterification and facilitating cholesterol trafficking to mitochondria (Jinn et al., 2015). Additionally, disruption of U17 snoRNA caused resistance to lipid-induced cell death and general oxidative stress in cultured cells. Furthermore, knockdown of U17 snoRNA in vivo protected against hepatic steatosis and lipid-induced oxidative stress and inflammation (Sletten et al., 2021). We determined the expression of hepatic U17 snoRNA and its effect on SND1 and PPARγ. The results showed that the expression of U17 snoRNA decreased in the liver of DIO Snhg3-HKO mice and unchanged in the liver of DIO Snhg3-HKI mice, but overexpression of U17 snoRNA had no effect on the expression of SND1 and PPARγ (figure supplement 5A-C), indicating that Sngh3 induced hepatic steatosis was independent on U17 snoRNA. We also discussed it in revised manuscript, please refer the section of Discussion in p15.

      References

      HUANG, C., SUN, L., XIAO, C., YOU, W., SUN, L., WANG, S., ZHANG, Z. & LIU, S. 2023. Circular RNA METTL9 contributes to neuroinflammation following traumatic brain injury by complexing with astrocytic SND1. J Neuroinflammation, 20, 39. DIO:10.1186/s12974-023-02716-x, PMID:36803376

      JINN, S., BRANDIS, K. A., REN, A., CHACKO, A., DUDLEY-RUCKER, N., GALE, S. E., SIDHU, R., FUJIWARA, H., JIANG, H., OLSEN, B. N., SCHAFFER, J. E. & ORY, D. S. 2015. snoRNA U17 regulates cellular cholesterol trafficking. Cell Metab, 21, 855-67. DIO:10.1016/j.cmet.2015.04.010, PMID:25980348

      KEIPERT, S. & OST, M. 2021. Stress-induced FGF21 and GDF15 in obesity and obesity resistance. Trends Endocrinol Metab, 32, 904-915. DIO:10.1016/j.tem.2021.08.008, PMID:34526227

      SAARIKETTU, J., LEHMUSVAARA, S., PESU, M., JUNTTILA, I., PARTANEN, J., SIPILA, P., POUTANEN, M., YANG, J., HAIKARAINEN, T. & SILVENNOINEN, O. 2023. The RNA-binding protein Snd1/Tudor-SN regulates hypoxia-responsive gene expression. FASEB Bioadv, 5, 183-198. DIO:10.1096/fba.2022-00115, PMID:37151849

      SCHMIDT, N., GANSKIH, S., WEI, Y., GABEL, A., ZIELINSKI, S., KESHISHIAN, H., LAREAU, C. A., ZIMMERMANN, L., MAKROCZYOVA, J., PEARCE, C., KREY, K., HENNIG, T., STEGMAIER, S., MOYON, L., HORLACHER, M., WERNER, S., AYDIN, J., OLGUIN-NAVA, M., POTABATTULA, R., KIBE, A., DOLKEN, L., SMYTH, R. P., CALISKAN, N., MARSICO, A., KREMPL, C., BODEM, J., PICHLMAIR, A., CARR, S. A., CHLANDA, P., ERHARD, F. & MUNSCHAUER, M. 2023. SND1 binds SARS-CoV-2 negative-sense RNA and promotes viral RNA synthesis through NSP9. Cell, 186, 4834-4850 e23. DIO:10.1016/j.cell.2023.09.002, PMID:37794589

      SLETTEN, A. C., DAVIDSON, J. W., YAGABASAN, B., MOORES, S., SCHWAIGER-HABER, M., FUJIWARA, H., GALE, S., JIANG, X., SIDHU, R., GELMAN, S. J., ZHAO, S., PATTI, G. J., ORY, D. S. & SCHAFFER, J. E. 2021. Loss of SNORA73 reprograms cellular metabolism and protects against steatohepatitis. Nat Commun, 12, 5214. DIO:10.1038/s41467-021-25457-y, PMID:34471131

      TILLMAN, E. J. & ROLPH, T. 2020. FGF21: An Emerging Therapeutic Target for Non-Alcoholic Steatohepatitis and Related Metabolic Diseases. Front Endocrinol (Lausanne), 11, 601290. DIO:10.3389/fendo.2020.601290, PMID:33381084

      ZHENG, J., ZHANG, Q., ZHAO, Z., QIU, Y., ZHOU, Y., WU, Z., JIANG, C., WANG, X. & JIANG, X. 2023. Epigenetically silenced lncRNA SNAI3-AS1 promotes ferroptosis in glioma via perturbing the m(6)A-dependent recognition of Nrf2 mRNA mediated by SND1. J Exp Clin Cancer Res, 42, 127. DIO:10.1186/s13046-023-02684-3, PMID:37202791

      (3) The role of PPARg in fatty liver diseases might be a rodent-specific phenomenon. PPARg agonist treatment in humans may actually reduce ectopic fat deposition by increasing fat storage in adipose tissues. The relevance of the findings to human diseases should be discussed.

      We thank the reviewer for the detailed comment. As a transcription regulator of Cd36 and Cidea/c, it is well known that PPARγ plays major adipogenic and lipogenic roles in adipose tissue. Although the expression of PPARγ in the liver is very low under healthy conditions, induced expression of PPARγ in both hepatocytes and non-parenchymal cells (Kupffer cells, immune cells, and hepatic stellate cells (HSCs)) in the liver has a crucial role in the pathophysiology of MASLD (Lee et al., 2023b, Chen et al., 2023, Gross et al., 2017). The activation of PPARγ in the liver induces the adipogenic program to store fatty acids in lipid droplets as observed in adipocytes (Lee et al., 2018). Moreover, the inactivation of liver PPARγ abolished rosiglitazone-induced an increase in hepatic TG and improved hepatic steatosis in lipoatrophic AZIP mice (Gavrilova et al., 2003). Apart from promoting lipogenesis, PPARγ has also a crucial function in improving inflammation and fibrosis (Chen et al., 2023). Furthermore, there is a strong correlation between the onset of hepatic steatosis and hepatocyte-specific PPARγ expression. Clinical trials have also indicated that increased insulin resistance and hepatic PPARγ expressions were associated with NASH scores in some obese patients (Lee et al., 2023a, Mukherjee et al., 2022). Even though PPARγ’s primary function is in adipose tissue, patients with MASLD have much higher hepatic expression levels of PPARγ, reflecting the fact that PPARγ plays different roles in different tissues and cell types (Mukherjee et al., 2022). As these studies mentioned above, our result also hinted at the importance of PPARγ in the pathophysiology of MASLD. Snhg3 deficiency or overexpression respectively induced the decrease or increase in hepatic PPARγ. Moreover, administration of PPARγ antagonist T0070907 mitigated the hepatic Cd36 and Cidea/c increase and improved Snhg3-induced hepatic steatosis. However,  conflicting findings suggest that the expression of hepatic PPARγ is not increased as steatosis develops in humans and in clinical studies and that PPARγ agonists administration didn’t aggravate liver steatosis (Gross et al., 2017). Thus, understanding how the hepatic PPARγ expression is regulated may provide a new avenue to prevent and treat the MASLD (Lee et al., 2018). We also discussed it in revised manuscript, please refer the first paragraph in the section of Discussion in p13.

      References

      CHEN, H., TAN, H., WAN, J., ZENG, Y., WANG, J., WANG, H. & LU, X. 2023. PPAR-gamma signaling in nonalcoholic fatty liver disease: Pathogenesis and therapeutic targets. Pharmacol Ther, 245, 108391. DIO:10.1016/j.pharmthera.2023.108391, PMID:36963510

      GAVRILOVA, O., HALUZIK, M., MATSUSUE, K., CUTSON, J. J., JOHNSON, L., DIETZ, K. R., NICOL, C. J., VINSON, C., GONZALEZ, F. J. & REITMAN, M. L. 2003. Liver peroxisome proliferator-activated receptor gamma contributes to hepatic steatosis, triglyceride clearance, and regulation of body fat mass. J Biol Chem, 278, 34268-76. DIO:10.1074/jbc.M300043200, PMID:12805374

      GROSS, B., PAWLAK, M., LEFEBVRE, P. & STAELS, B. 2017. PPARs in obesity-induced T2DM, dyslipidaemia and NAFLD. Nat Rev Endocrinol, 13, 36-49. DIO:10.1038/nrendo.2016.135, PMID:27636730

      LEE, S. M., MURATALLA, J., KARIMI, S., DIAZ-RUIZ, A., FRUTOS, M. D., GUZMAN, G., RAMOS-MOLINA, B. & CORDOBA-CHACON, J. 2023a. Hepatocyte PPARgamma contributes to the progression of non-alcoholic steatohepatitis in male and female obese mice. Cell Mol Life Sci, 80, 39. DIO:10.1007/s00018-022-04629-z, PMID:36629912

      LEE, S. M., MURATALLA, J., SIERRA-CRUZ, M. & CORDOBA-CHACON, J. 2023b. Role of hepatic peroxisome proliferator-activated receptor gamma in non-alcoholic fatty liver disease. J Endocrinol, 257. DIO:10.1530/JOE-22-0155, PMID:36688873

      LEE, Y. K., PARK, J. E., LEE, M. & HARDWICK, J. P. 2018. Hepatic lipid homeostasis by peroxisome proliferator-activated receptor gamma 2. Liver Res, 2, 209-215. DIO:10.1016/j.livres.2018.12.001, PMID:31245168

      MUKHERJEE, A. G., WANJARI, U. R., GOPALAKRISHNAN, A. V., KATTURAJAN, R., KANNAMPUZHA, S., MURALI, R., NAMACHIVAYAM, A., GANESAN, R., RENU, K., DEY, A., VELLINGIRI, B. & PRINCE, S. E. 2022. Exploring the Regulatory Role of ncRNA in NAFLD: A Particular Focus on PPARs. Cells, 11. DIO:10.3390/cells11243959, PMID:36552725

      Recommendations for the authors:

      Reviewer #1 (Recommendations For The Authors):

      As a general strategy for the revision, I would advise the authors to focus on strengthening the analysis of the liver with the two most important figures being Figure 2 and Figure 3. The mechanism as it stands is problematic which reduces the impact of the animal studies despite substantial efforts from the authors. Consider removing or toning down some of the studies focused on mechanisms in the nucleus, including changing the title.

      We thank the reviewer for the detailed comment. In this study, hepatocyte-specific Snhg3 deficiency decreased body and liver weight, alleviated hepatic steatosis and promoted hepatic fatty acid metabolism in DIO mice, whereas overexpression induced the opposite effect. The hepatic differentially expressed genes (DEGs) between the DIO Snhg3-HKI and control WT mice using RNA-Seq and revealed that Snhg3 exerts a global effect on the expression of genes involved in fatty acid metabolism using GSEA (Figure 4B). RT-qPCR analysis confirmed that the hepatic expression levels of some genes involved in fatty acid metabolism, including Cd36, Cidea/c and Scd1/2, were upregulated in Snhg3-HKO mice and were downregulated in Snhg3-HKI mice compared to the controls (Figure 4C). Moreover, deficiency and overexpression of Snhg3 respectively decreased and increased the expression of profibrotic genes, such as Col1a1 and Col1a2, but had no effects on the pro-inflammatory factors, including Tgfβ1, Tnfα, Il6 and Il1β (figure supplement 3A and B). The results indicated that Snhg3 involved in hepatic steatosis through regulating fatty acid metabolism. Furthermore, PPARγ was selected to study its role in Snhg3-induced hepatic steatosis by integrated analyzing the data from CUT&Tag-Seq, ATAC-Seq and RNA-Seq. Finally, inhibition of PPARγ with T0070907 alleviated Snhg3 induced Cd36 and Cidea/c increases and improved Snhg3-aggravated hepatic steatosis. In summary, we confirmed that SND1/H3K27me3/PPARγ is partially responsible for Sngh3-inuced hepatic steatosis. As the reviewer suggested, we replaced the title with “LncRNA-Snhg3 Aggravates Hepatic Steatosis via PPARγ Signaling”.

      (1) How is steatosis changing in the liver? Is this due to a change in fatty acid uptake, lipogenesis/synthesis, beta-oxidation, trig secretion, etc..? The analysis in Figures 2 and 3 is mostly focused on metabolic chamber studies which seem distracting, particularly in the absence of a mechanism and given a liver-specific perturbation. The authors should use a combination of targeted gene expression, protein blots, and lipid flux measurements to provide better insights here. The histology in Figure 2H suggests a very dramatic effect but does match with lipid measurements in 2I.

      We thank the reviewer for the detailed comment. The pathogenesis of MASLD has not been entirely elucidated. Multifarious factors such as genetic and epigenetic factors, nutritional factors, insulin resistance, lipotoxicity, microbiome, fibrogenesis and hormones secreted from the adipose tissue, are recognized to be involved in the development and progression of MASLD (Buzzetti et al., 2016, Lee et al., 2017, Rada et al., 2020, Sakurai et al., 2021, Friedman et al., 2018). In this study, we investigated the hepatic differentially expressed genes (DEGs) between the DIO Snhg3-HKI and control WT mice using RNA-Seq and revealed that Snhg3 exerts a global effect on the expression of genes involved in fatty acid metabolism using GSEA (Figure 4B). We validated the expression of some DEGs involved in fatty acid metabolism by RT-qPCR. The results showed that the hepatic expression levels of some genes involved in fatty acid metabolism, including Cd36, Cidea/c and Scd1/2 were upregulated in Snhg3-HKO mice and were downregulated in Snhg3-HKI mice compared to the controls (Figure 4C), respectively. Additionally, we re-analyzed the metabolic chamber data using CalR and the results showed that there were no obvious differences in heat production, total oxygen consumption, carbon dioxide production or RER between DIO Snhg3-HKO or DIO Snhg3-HKI and the corresponding control mice (figure supplement 1C and 2C). Unfortunately, we did not detect lipid flux due to limited experimental conditions. However, in summary, our results indicated that Snhg3 is involved in hepatic steatosis by regulating fatty acid metabolism. Please check them in the first paragraph in p8.

      Additionally, we determined the hepatic TC levels in other batch of DIO Snhg3-HKO and control mice and found there was no difference in hepatic TC (as below) between DIO Snhg3-HKO and control mice fed HFD 18 weeks. Perhaps the apparent difference in TC requires a prolonged high-fat diet feeding time.

      Author response image 1.

      Hepatic TC contents of in DIO Snhg3-Flox and Snhg3-HKO mice.

      References

      BUZZETTI, E., PINZANI, M. & TSOCHATZIS, E. A. 2016. The multiple-hit pathogenesis of non-alcoholic fatty liver disease (NAFLD). Metabolism, 65, 1038-48. DIO:10.1016/j.metabol.2015.12.012, PMID:26823198

      FRIEDMAN, S. L., NEUSCHWANDER-TETRI, B. A., RINELLA, M. & SANYAL, A. J. 2018. Mechanisms of NAFLD development and therapeutic strategies. Nat Med, 24, 908-922. DIO:10.1038/s41591-018-0104-9, PMID:29967350

      LEE, J., KIM, Y., FRISO, S. & CHOI, S. W. 2017. Epigenetics in non-alcoholic fatty liver disease. Mol Aspects Med, 54, 78-88. DIO:10.1016/j.mam.2016.11.008, PMID:27889327

      RADA, P., GONZALEZ-RODRIGUEZ, A., GARCIA-MONZON, C. & VALVERDE, A. M. 2020. Understanding lipotoxicity in NAFLD pathogenesis: is CD36 a key driver? Cell Death Dis, 11, 802. DIO:10.1038/s41419-020-03003-w, PMID:32978374

      SAKURAI, Y., KUBOTA, N., YAMAUCHI, T. & KADOWAKI, T. 2021. Role of Insulin Resistance in MAFLD. Int J Mol Sci, 22. DIO:10.3390/ijms22084156, PMID:33923817

      (2) Throughout the manuscript the authors make claims about liver disease models, but this is not well supported since markers of advanced liver disease are not examined. The authors should stain and show expression for fibrosis and inflammation.

      We thank the reviewer for the detailed comment. Metabolic dysfunction-associated fatty liver disease (MASLD) is characterized by excess liver fat in the absence of significant alcohol consumption. It can progress from simple steatosis to metabolic dysfunction-associated steatohepatitis (MASH) and fibrosis and eventually to chronic progressive diseases such as cirrhosis, end-stage liver failure, and hepatocellular carcinoma (Loomba et al., 2021). As the reviewer suggested, we detected the effect of Snhg3 on liver fibrosis and inflammation. The results showed no hepatic fibrosis phenotype was seen in Snhg3-HKO and Snhg3-HKI mice (figures supplement 1D and 2D). Moreover, deficiency and overexpression of Snhg3 respectively decreased and increased the expression of profibrotic genes, such as collagen type I alpha 1/2 (Col1a1 and Col1a2), but had no effects on the pro-inflammatory factors including Tgf-β, Tnf-α, Il-6 and Il-1β (figure supplement 3A and 3B). Inflammation is an absolute requirement for fibrosis because factors from injured hepatocytes alone are not sufficient to directly activate HSCs and lead to fibrosis (Kisseleva and Brenner, 2021). Additionally, previous studies indicated that exposure to HFD for more 24 weeks causes less severe fibrosis (Alshawsh et al., 2022). In future, the effect of Snhg3 on hepatic fibrosis in mice need to be elucidated by prolonged high-fat feeding or by adopting methionine- and choline deficient diet (MCD) feeding. Please check them in the second paragraph in the section of Discussion in p13.

      References

      ALSHAWSH, M. A., ALSALAHI, A., ALSHEHADE, S. A., SAGHIR, S. A. M., AHMEDA, A. F., AL ZARZOUR, R. H. & MAHMOUD, A. M. 2022. A Comparison of the Gene Expression Profiles of Non-Alcoholic Fatty Liver Disease between Animal Models of a High-Fat Diet and Methionine-Choline-Deficient Diet. Molecules, 27. DIO:10.3390/molecules27030858, PMID:35164140

      KISSELEVA, T. & BRENNER, D. 2021. Molecular and cellular mechanisms of liver fibrosis and its regression. Nat Rev Gastroenterol Hepatol, 18, 151-166. DIO:10.1038/s41575-020-00372-7, PMID:33128017

      LOOMBA, R., FRIEDMAN, S. L. & SHULMAN, G. I. 2021. Mechanisms and disease consequences of nonalcoholic fatty liver disease. Cell, 184, 2537-2564. DIO:10.1016/j.cell.2021.04.015, PMID:33989548

      (3) Publicly available datasets show that PPARG protein is not expressed in the liver (Science 2015 347(6220):1260419, PMID: 25613900). Are the authors sure this is not an effect on another PPAR isoform like alpha? ChIP and RNA-seq pathway readouts do not distinguish between different isoforms.

      We thank the reviewer for the detailed comment. As a transcription regulator of Cd36 and Cidea/c, it is well known that PPARγ plays major adipogenic and lipogenic roles in adipose tissue. Although the expression of PPARγ in the liver is very low under healthy conditions, induced expression of PPARγ in both hepatocytes and non-parenchymal cells (Kupffer cells, immune cells, and hepatic stellate cells (HSCs)) in the liver has a crucial role in the pathophysiology of MASLD (Lee et al., 2023b, Chen et al., 2023, Gross et al., 2017). The activation of PPARγ in the liver induces the adipogenic program to store fatty acids in lipid droplets as observed in adipocytes (Lee et al., 2018). Moreover, the inactivation of liver PPARγ abolished rosiglitazone-induced an increase in hepatic TG and improved hepatic steatosis in lipoatrophic AZIP mice (Gavrilova et al., 2003). Apart from promoting lipogenesis, PPARγ has also a crucial function in improving inflammation and fibrosis (Chen et al., 2023). Furthermore, there is a strong correlation between the onset of hepatic steatosis and hepatocyte-specific PPARγ expression. Clinical trials have also indicated that increased insulin resistance and hepatic PPARγ expressions were associated with NASH scores in some obese patients (Lee et al., 2023a, Mukherjee et al., 2022). Even though PPARγ’s primary function is in adipose tissue, patients with MASLD have much higher hepatic expression levels of PPARγ, reflecting the fact that PPARγ plays different roles in different tissues and cell types (Mukherjee et al., 2022). As these studies mentioned above, our result also hinted at the importance of PPARγ in the pathophysiology of MASLD. Snhg3 deficiency or overexpression respectively induced the decrease or increase in hepatic PPARγ. Moreover, administration of PPARγ antagonist T0070907 mitigated the hepatic Cd36 and Cidea/c increase and improved Snhg3-induced hepatic steatosis. However,  conflicting findings suggest that the expression of hepatic PPARγ is not increased as steatosis develops in humans and in clinical studies and that PPARγ agonists administration didn’t aggravate liver steatosis (Gross et al., 2017). Thus, understanding how the hepatic PPARγ expression is regulated may provide a new avenue to prevent and treat the MASLD (Lee et al., 2018). We also discussed it in revised manuscript, please refer the first paragraph in the section of Discussion in p13 in revised manuscript.

      PPARα, most highly expressed in the liver, transcriptionally regulates lipid catabolism by regulating the expression of genes mediating triglyceride hydrolysis, fatty acid transport, and β-oxidation. Activators of PPARα decrease plasma triglycerides by inhibiting its synthesis and accelerating its hydrolysis (Chen et al., 2023). Mice with deletion of the Pparα gene exhibited more hepatic steatosis under HFD induction. As the reviewer suggested, we investigated the effect of Snhg3 on Pparα expression.  The result showed that both deficiency of Snhg3 or overexpression of Snhg3 doesn’t affect the mRNA level of Pparα as showing below, indicating that Snhg3-induced lipid accumulation independent on PPARα. Additionally, the exon, upstream 2k, 5’-UTR and intron regions of Pparγ, not Pparα, were enriched with the H3K27me3 mark (fold_enrichment = 4.15697) in the liver of DIO Snhg3-HKO mice using the CUT&Tag assay (table supplement 8), which was further confirmed by ChIP (Figure 6F and G). Therefore, we choose PPARγ to study its role in Sngh3-induced hepatic steatosis by integrated analyzing the data from CUT&Tag-Seq, ATAC-Seq and RNA-Seq.

      Author response image 2.

      The mRNA levels of hepatic Pparα expression in DIO Snhg3-HKO mice and Snhg3-HKI mice compared to the controls.

      References

      CHEN, H., TAN, H., WAN, J., ZENG, Y., WANG, J., WANG, H. & LU, X. 2023. PPAR-gamma signaling in nonalcoholic fatty liver disease: Pathogenesis and therapeutic targets. Pharmacol Ther, 245, 108391. DIO:10.1016/j.pharmthera.2023.108391, PMID:36963510

      GAVRILOVA, O., HALUZIK, M., MATSUSUE, K., CUTSON, J. J., JOHNSON, L., DIETZ, K. R., NICOL, C. J., VINSON, C., GONZALEZ, F. J. & REITMAN, M. L. 2003. Liver peroxisome proliferator-activated receptor gamma contributes to hepatic steatosis, triglyceride clearance, and regulation of body fat mass. J Biol Chem, 278, 34268-76. DIO:10.1074/jbc.M300043200, PMID:12805374

      GROSS, B., PAWLAK, M., LEFEBVRE, P. & STAELS, B. 2017. PPARs in obesity-induced T2DM, dyslipidaemia and NAFLD. Nat Rev Endocrinol, 13, 36-49. DIO:10.1038/nrendo.2016.135, PMID:27636730

      LEE, S. M., MURATALLA, J., KARIMI, S., DIAZ-RUIZ, A., FRUTOS, M. D., GUZMAN, G., RAMOS-MOLINA, B. & CORDOBA-CHACON, J. 2023a. Hepatocyte PPARgamma contributes to the progression of non-alcoholic steatohepatitis in male and female obese mice. Cell Mol Life Sci, 80, 39. DIO:10.1007/s00018-022-04629-z, PMID:36629912

      LEE, S. M., MURATALLA, J., SIERRA-CRUZ, M. & CORDOBA-CHACON, J. 2023b. Role of hepatic peroxisome proliferator-activated receptor gamma in non-alcoholic fatty liver disease. J Endocrinol, 257. DIO:10.1530/JOE-22-0155, PMID:36688873

      LEE, Y. K., PARK, J. E., LEE, M. & HARDWICK, J. P. 2018. Hepatic lipid homeostasis by peroxisome proliferator-activated receptor gamma 2. Liver Res, 2, 209-215. DIO:10.1016/j.livres.2018.12.001, PMID:31245168

      MUKHERJEE, A. G., WANJARI, U. R., GOPALAKRISHNAN, A. V., KATTURAJAN, R., KANNAMPUZHA, S., MURALI, R., NAMACHIVAYAM, A., GANESAN, R., RENU, K., DEY, A., VELLINGIRI, B. & PRINCE, S. E. 2022. Exploring the Regulatory Role of ncRNA in NAFLD: A Particular Focus on PPARs. Cells, 11. DIO:10.3390/cells11243959, PMID:36552725

      (4) Previous work suggests that SNHG3 regulates its neighboring gene MED18 which is an important regulator of global transcription. Could some of the observed effects be due to changes in MED18 or other neighboring genes?

      We thank the reviewer for the detailed comment. Previous work suggested that human SNHG3 promotes progression of gastric cancer by regulating neighboring MED18 gene methylation (Xuan and Wang, 2019). Here, we studied the effect of mouse Snhg3 on Med18 and the result showed that Snhg3 had no effect on the mRNA levels of Med18 (as below). Additionally, we also tested the effect of mouse Snhg3 on its neighboring gene, regulator of chromosome condensation 1 (Rcc1). Although deficiency of Snhg3 inhibited the mRNA level of Rcc1, overexpression of Snhg3 doesn’t affect the mRNA level of Rcc1 as showing below. RCC1, the only known guanine nucleotide exchange factor in the nucleus for Ran, a nuclear Ras-like G protein, directly participates in cellular processes such as nuclear envelope formation, nucleocytoplasmic transport, and spindle formation (Ren et al., 2020). RCC1 also regulates chromatin condensation in the late S and early M phases of the cell cycle. Many studies have found that RCC1 plays an important role in tumors. Furthermore, whether Rcc1 mediates the alleviated effect on MASLD of Snhg3 needs to be further investigated.

      Author response image 3.

      The mRNA levels of hepatic Rcc1 and Med18 expression in DIO Snhg3-HKO mice and Snhg3-HKI mice compared to the controls.

      References

      REN, X., JIANG, K. & ZHANG, F. 2020. The Multifaceted Roles of RCC1 in Tumorigenesis. Front Mol Biosci, 7, 225. DIO:10.3389/fmolb.2020.00225, PMID:33102517

      XUAN, Y. & WANG, Y. 2019. Long non-coding RNA SNHG3 promotes progression of gastric cancer by regulating neighboring MED18 gene methylation. Cell Death Dis, 10, 694. DIO:10.1038/s41419-019-1940-3, PMID:31534128

      (5) The claim that Snhg3 regulates SND1 protein stability seems subtle. There is data inconsistency between different panels regarding this regulation including Figure 5I, Figure 6A, and Figure 7E. In addition, is ubiquitination happening in the nucleus where Snhg3 is expressed?

      We thank the reviewer for the detailed comment. The effect of Snhg3-induced SND1 expression had been confirmed by western blotting, please check them in Figure 5I, Figure 6A, Figure 7E and corresponding primary data. Additionally, Snhg3-induced SND1 protein stability seemed subtle, indicating there may be other mechanism by which Snhg3 promotes SND1, such as riboregulation. We had added it in the section of Discussion, please check it in the second paragraph in p16.

      Additionally, we did not detect the sites where SND1 is modified by ubiquitination. Our results showed that Snhg3 was more localized in the nucleus (Figure 1D) and Snhg3 also promoted the nuclear localization of SND1 (Figure 5O). We had revised the diagram of Snhg3 action in Figure 8G. Please check them in revised manuscript.

      (6) The authors show that the loss of Snhg3 changes the global H3K27me3 level. Few enzymes modify H3K27me3 levels. Did the authors check for an interaction between EZH2, Jmjd3, UTX, and Snhg3/SND1?

      We thank the reviewer for the detailed comment. It is crucial to ascertain whether SND1 itself functions as a new demethylase or if it influences other demethylases, such as Jmjd3, enhancer of zeste homolog 2 (EZH2), and ubiquitously transcribed tetratricopeptide repeat on chromosome X (UTX). The precise mechanism by which SND1 regulates H3K27me3 is still unclear and hence requires further investigation. We had added the limitations in the section of Discussion and please check it in the third paragraph in p17.

      (7) Can the authors speculate if the findings related to Snhg3/SND1 extend to humans?

      We thank the reviewer for the detailed comment. Since the sequence of Snhg3 is not conserved between mice and humans, the findings in this manuscript may not be applicable to humans, but the detail need to be further exploited.

      (8) As a general rule the figures are too small or difficult to read with limited details in the figure legends which limits evaluation. For example, Figure 1B and almost all of 4 cannot read labels. Figure 2, cannot see the snapshots show of mice or livers. What figure is supporting the claim that snhg3KI are more 'hyper-accessible'? Can the authors clarify what Figure 4H is referring to?

      We thank the reviewer for the detailed comment. We have provided high quality figures in our revised manuscript.

      The ‘hyper-accessible’ state in the liver of Snhg3-HKI mice was inferred by the differentially accessible regions (DARs), that is, we discovered 4305 DARs were more accessible in Snhg3-HKI mice and only 2505 DARs were more accessible in control mice and please refer table supplement 3).

      The result of Figure 4H about heatmap for Cd36 was from hepatic RNA-seq of DIO Snhg3-HKI and control WT mice. For avoiding ambiguity, we have removed it.

      (9) Authors stated that upon Snhg3 knock out, more genes are upregulated(1028) than downregulated(365). This description does not match Figure 4A. It seems in Figure 4A there are equal numbers of up and downregulated genes.

      We thank the reviewer for the detailed question. We apologized for this mistake and have corrected it.

      (10) Provide a schematic of the knockout and KI strategy in the supplement.

      We thank the reviewer for the detailed comment. We had included the knockout and KI strategy in figure supplement 1A and B, and 2A.

      Reviewer #2 (Recommendations For The Authors):

      (1) Metabolic cage data need to be reanalyzed with CalR (particularly when the body weights are significantly different).

      We thank the reviewer for the detailed comment. We reanalyzed the metabolic cage data using CalR (Mina et al., 2018). The results showed that there were no obvious differences in heat production, total oxygen consumption, carbon dioxide production and the respiratory exchange ratio between DIO Snhg3-HKO and control mice. Similar to DIO Snhg3-HKO mice, there was also no differences in heat production, total oxygen consumption, carbon dioxide production, and RER between DIO Snhg3-HKI mice and WT mice. Please check them in figure supplement 1C and 2C, and Mouse Calorimetry in Materials and Methods.

      Reference

      MINA, A. I., LECLAIR, R. A., LECLAIR, K. B., COHEN, D. E., LANTIER, L. & BANKS, A. S. 2018. CalR: A Web-Based Analysis Tool for Indirect Calorimetry Experiments. Cell Metab, 28, 656-666 e1. DIO:10.1016/j.cmet.2018.06.019, PMID:30017358

      (2) ITT in Figure 2F should also be presented as % of the initial glucose level, which would reveal that there is no difference between WT and KO.

      We thank the reviewer for the detailed comment. We repeated ITT experiment and include the new data in revised manuscript, please check it in Figure 2C.

      (3) The fasting glucose results are inconsistent between ITT and GTT. Is there any difference in fasting glucose?

      We thank the reviewer for the questions. The difference between GTT and ITT was caused owing to different fasting time, that is, mice were fasted for 6 h in ITT and were fasted for 16 h in GTT. It seems that Snhg3 doesn’t affect short- and longer-time fasting glucose levels and please refer Figures 2C and 3C.

    1. Author response:

      The following is the authors’ response to the original reviews.

      Public Reviews:

      Reviewer 1 (Public Review):

      Summary:

      The authors propose that the energy landscape of animals can be thought of in the same way as the fundamental versus realized niche concept in ecology. Namely, animals will use a subset of the fundamental energy landscape due to a variety of factors. The authors then show that the realized energy landscape of eagles increases with age as the animals are better able to use the energy landscape. Strengths:

      This is a very interesting idea and that adds significantly to the energy landscape framework. They provide convincing evidence that the available regions used by birds increase with size.

      Weaknesses:

      Some of the measures used in the manuscript are difficult to follow and there is no mention of the morphometrics of birds or how these change with age (other than that they don’t change which seems odd as surely they grow). Also, there may need to be more discussion of other ontogenetic changes such as foraging strategies, home range size etc.

      We thank reviewer 1 for their interest in our study and for their constructive recommendations. We have included further discussions of these points in the manuscript and outline these changes in our responses to the detailed recommendations below.

      Reviewer 2 (Public Review):

      Summary:

      With this work, the authors tried to expand and integrate the concept of realized niche in the context of movement ecology by using fine-scale GPS data of 55 juvenile Golden eagles in the Alps. Authors found that ontogenic changes influence the percentage of area flyable to the eagles as individuals exploit better geographic uplifts that allow them to reduce the cost of transport.

      Strengths:

      Authors made insightful work linking changes in ontogeny and energy landscapes in large soaring birds. It may not only advance the understanding of how changes in the life cycle affect the exploitability of aerial space but also offer valuable tools for the management and conservation of large soaring species in the changing world.

      Weaknesses:

      Future research may test the applicability of the present work by including more individuals and/or other species from other study areas.

      We are thankful to reviewer 2 for their encouragement and positive assessment of our work. We have addressed their specific recommendations below.

      Recommendations for the authors:

      Reviewer 1 (Recommendations For The Authors):

      I found this to be a very interesting paper which adds some great concepts and ideas to the energy landscape framework. The paper is also concise and well-written. While I am enthusiastic about the paper there are areas that need clarifying or need to be made clearer. Specific comments below:

      Line 64: I disagree that competition is the fundamental driver of the realized niche. In some cases, it may be but in others, predation may be far more important (as an example).

      We agree with this point and have now clarified that competition is an example of a driver of the realized niche. We have also included predation as another example:

      "However, just as animals do not occupy the entirety of their fundamental Hutchinsonian niche in reality [1], for example due to competition or predation risk, various factors can contribute to an animal not having access to the entirety of its fundamental movement niche."

      Intro: I think the authors should emphasize that morphological changes with ontogeny will change the energy landscape for many animals. It may not be the case specifically with eagles but that won’t be true for other animals. For example, in many sharks, buoyancy increases with age.

      We agree and have now clarified that the developmental processes that we are interested in happen in addition to morphological changes:

      "In addition to morphological changes, as young animals progress through their developmental stages, their movement proficiency [2] and cognitive capabilities [3] improve and memory manifests [4]."

      Line 91-93: The idea that birds fine-tune motor performance to take advantage of updrafts is a very important one to the manuscript and should be discussed in a bit more detail. How? At the moment there is a single sentence and it doesn’t even have a citation yet this is the main crux of the changes in realized energy landscape with age. This point should be emphasized because, by the end of the introduction, it is not clear to me why the landscape should be cheaper as the birds age?

      Thank you for pointing out this missing information. We have now added examples to clarify how soaring birds fine-tune their motor performance when soaring. These include for example adopting high bank angles in narrow and weak thermals [5] and reducing gliding airspeed when the next thermal has not been detected [6]:

      "Soaring flight is a learned and acquired behavior [7, 8], requiring advanced cognitive skills to locate uplifts as well as fine-tuned locomotor skills for optimal adjustment of the body and wings to extract the most energy from them, for example by adopting high bank angles in narrow and weak thermals [5] and reducing gliding airspeed when the next thermal has not been detected [6]."

      Results:

      Line 106: explain the basics of the life history of the birds in the introduction. I have no idea what emigration refers to or the life history of these animals.

      Thank you for pointing out the missing background information. We have now added this

      information to the introduction:

      "We analyzed 46,000 hours of flight data collected from bio-logging devices attached to 55 wild-ranging golden eagles in the Central European Alps. These data covered the transience phase of natal dispersal (hereafter post-emigration). In this population, juveniles typically achieve independence by emigrating from the parental territory within 4-10 months after fledging. However, due to the high density of eagles and consequently the scarcity of available territories, the transience phase between emigration and settling by eventually winning over a territory is exceptionally long at well over 4 years. Our hypothesis posited that the realized energy landscape during this transience phase gradually expands as the birds age."

      What I still am having a hard time understanding is the flyability index. Is this just a measure of the area animals actively select and then the assumption that it’s a good region to fly within?

      We have modified our description of the flyability index for more clarity. In short, we built a step-selection model and made predictions using this model. The predictions estimate the probability of use of an area based on the predictors of the model. For the purpose of our study and what our predictors were (proxies for uplift + movement capacity), we interpreted the predicted values as the "flyability index". We have now clarified this in the methods section:

      "We made the predictions on the scale of the link function and converted them to values between 0 and 1 using the inverse logit function [9]. These predicted values estimated the probability of use of an area for flying based on the model. We interpreted these predicted values as the flyability index, representing the potential energy available in the landscape to support flight, based on the uplift proxies (TRI and distance to ridge line) and the movement capacity (step length) of the birds included in the model."

      It might also be useful to simply show the changes in the area the animals use with age as well (i.e. a simple utilization distribution). This should increase in age for many animals but would also be a reflection of the resources animals need to acquire as they get older.

      We have now added the figure S2 to the supplementary material. This plot was created by calculating the cumulative area used by the birds in each week after emigration. This was done by extracting the commuting flights for each week, converting these to line objects, overlapping the lines with a raster of 100*100 m cell size, counting the number of overlapping cells and calculating the area that they covered. We did not calculate UDs or MCPs because the eagles seem to be responding to linear features of the landscape, e.g. preferring ridgelines and avoiding valleys. Using polygons to estimate used areas would have made it difficult to ensure that decision-making with regards to these linear features was captured.

      In a follow-up project, a PhD student in the golden eagle consortium is exploring the individuals’ space use after emigration considering different environmental and social factors. The outcome of that study will further complete our understanding of the post-emigration behavior of juvenile golden eagles in the Alps.

      How much do the birds change in size over the ontogeny measured? This is never discussed.

      Thank you for bringing up this question. The morphometrics of juvenile golden eagles are not significantly different from the adults, except in the size of culmen and claws [10]. Body mass changes after fledging, because of the development of the pectoral muscles as the birds start flying. Golden eagles typically achieve adult-like size and mass within their natal territory before emigration, at which time we started quantifying the changes in energy landscape. Given our focus on post-emigration flight behavior, we do not expect any significant changes in size and body mass during our study period. We now cover this in the discussion:

      "Juvenile golden eagles complete their morphological development before gaining independence from their parents, with their size and wing morphology remaining stable during the post-emigration phase [10, 11]. Consequently, variations in flyability of the landscape for these birds predominantly reflect their improved mastery of soaring flight, rather than changes in their morphology."

      Discussion:

      Line 154: Could the increase in step length also be due to changes in search strategies with age? e.g. from more Brownian motion when scavenging to Levy search patterns when actively hunting?

      This is a very good point and we tried to look for evidence of this transition in the tracking data. We explored the first passage time for two individuals with a radius of 50 km to see if there is a clear transition from a Brownian to a Levy motion. The patterns that emerge are inconclusive and seem to point to seasonality rather than a clear transition in foraging strategy (Author response image 1). We have modified our statement in the discussion about the change in preference of step lengths indicating improve flight ability, to clarify that it is speculative:

      Author response image 1.

      First passage times using a 50 km radius for two randomly selected individuals.

      "Our findings also reveal that as the eagles aged, they adopted longer step lengths, which could indicate an increasing ability to sustain longer uninterrupted flight bouts."

      Methods:

      Line 229: What is the cutoff for high altitude or high speed?

      We used the Expectation-maximization binary clustering (EMbC) method to identify commuting flights. The EmbC method does not use hard cutoffs to cluster the data. Each data point was assigned to the distribution to which it most likely belonged based on the final probabilities after multiple iterations of the algorithm. Author response image 2 shows the distribution of points that were either used or not used based on the EmbC classification.

      Author response image 2.

      Golden eagle tracking points were either retained (used) or discarded (not used) for further data analysis based on the EmbC algorithm. The point were clustered based on ground speed and height above ground.

      Figure 1: The figure captions should stand on their own but in this case there is no information as to what the tests are actually showing.

      We have now updated the caption to provide information about the model:

      "Coefficient estimates of the step selection function predicting probability of use as a function of uplift proxies, week since emigration, and step length. All variables were z-transformed prior to modeling.

      The error bars show 95% confidence intervals."

      Reviewer 2 (Recommendations For The Authors):

      First, I want to congratulate you on this fantastic work. I enjoyed reading it. The manuscript is clear and well-written, and the findings are sound and relevant to the field of movement ecology. Also, the figures are neatly presented and easy to follow.

      I particularly liked expanding the old concept of fundamental vs realized niche into a movement ecology context. I believe that adds a fresh view into these widely accepted ecological assumptions on species niche, which may help other researchers build upon them to better understand movement "realms" on highly mobile animals in a rapidly changing world.

      I made some minor comments to the manuscript since it was hard to find important weaknesses in it, given the quality of your work. However, there was a point in the discussion that I feel deserves your attention (or rather a reflection) on how major biological events such as moulting could also influence birds to master the flying and exploitation of the energy landscape. You may find my suggestion quite subjective, but I think it may help expand your idea for future works and, what is more, link concepts such as energy landscapes, ontogeny, and important life cycle events such as moulting in large soaring birds. I consider this relevant from a mechanistic perspective to understand better how individuals negotiate all three concepts to thrive and persist in changing environments and to maximise their

      fitness.

      Once again, congratulations on this excellent piece of research.

      We thank the reviewer for their enthusiasm about our work and for bringing up important points about the biology of the species. Our detailed response are below.

      MINOR COMMENTS:

      (Note: Line numbers refer to those in the PDF version provided by the journal).

      Line 110: Distinguished (?)

      corrected

      Line 131: Overall, I agree with the authors’ discussion and very much liked how they addressed crucial points. However, I have a point about some missing non-discussed aspects of bird ecology that had not been mentioned.

      The authors argue that morphological traits are less important in explaining birds’ mastery of flight (thus exploiting all available options in the landscape). However, I think the authors are missing some fundamental aspects of bird biology that are known to affect birds’ flying skills, such as moult.

      The moulting process affects species’ flying capacity. Although previous works have not assessed moults’ impact on movement capacity, I think it is worth including the influence of flyability on this ecologically relevant process.

      For instance, golden eagles change their juvenile plumage to intermediate, sub-adult plumage in two or three moult cycles. During this process, the moulting process is incomplete and affects the birds’ aerodynamics, flying capacity, and performance (see Tomotani et al. 2018; Hedenström 2023). Thus, one could expect this process to be somewhat indirectly linked to the extent to which birds can exploit available resources.

      Hedenström, A. (2023). Effects of wing damage and moult gaps on vertebrate flight performance.

      Journal of Experimental Biology, 226(9), jeb227355. Tomotani, B. M., Muijres, F. T., Koelman, J., Casagrande, S., & Visser, M. E. (2018). Simulated moult reduces flight performance, but overlap with breeding does not affect breeding success in a longdistance migrant. Functional Ecology, 32(2), 389-401.

      We thank the reviewer for bringing up this relevant topic. We explored the literature listed by the reviewer and also other sources. We came to the conclusion that moulting does not impact our findings. In our study, we included data for eagles that had emigrated from the natal territories, with their fully grown feathers in juvenile plumage. The moulting schedule in juvenile birds is similar to that of adults: the timing, intensity, and sequence of feathers being replaced is consistent every year (Author response image 3). For these reasons, we do not believe that moulting stage noticeably impacts flight performance at the scale of our study (hourly flights). Fine details of soaring flight performance (aerodynamics within and between thermals) could differs during moulting of different primary and secondary feathers, but this is something that would occur every time the eagle replaces these feather and we do not expect it to be any different for juveniles. Such fine scale investigations are outside the scope of this study.

      Author response image 3.

      Moulting schedule of golden eagles [12]

      Lines 181-182: I don’t think trophic transitions rely only on individual flying skill changes. Furthermore, despite its predominant role, scavenging does not mean it is the primary source of food acquisition in golden eagles. This also depends on prey availability, and scavenging is an auxiliary font of easy-to-catch food.

      Scavenging implies detecting carcasses. Should this carcass appearance occur in highly rugged areas, the likelihood of detection also reduces notably. This is not to say that there are not more specialized carrion consumers, such as vultures, that may outcompete eagles in searching for such resources more

      efficiently.

      In summary, I don‘t think such transition relies only on flying skills but on other non-discussed factors such as knowledge accumulation of the area or even the presence of conspecifics.

      Line 183: This is precisely what I meant with my earlier comment.

      Thank you for the discussion on the interaction between flight development and foraging strategy. We explored the transition from scavenging to hunting above as a response to Reviewer 1, but did not find a clear transition. This is in line with your comment that the birds probably use both scavenging and hunting methods opportunistically.

      Lines 193-195: I will locate this sentence somewhere in this paragraph. As it is now, it seems a bit out of context. It could be a better fit at the end of the first point in line 203.

      Thank you for pointing out the issue with the flow. We have now added a transitional sentence before this one to improve the paragraph. The beginning of the conclusion now reads as follows, with the new sentence shown in boldface.

      "Spatial maps serve as valuable tools in informing conservation and management strategies by showing the general distribution and movement patterns of animals. These tools are crucial for understanding how animals interact with their environment, including human-made structures. Within this context, energy landscapes play an important role in identifying potential areas of conflict between animals and anthropogenic infrastructures such as wind farms. The predictability of environmental factors that shape the energy landscape has facilitated the development of these conservation tools, which have been extrapolated to animals belonging to the same ecological guild traversing similar environments."

      References

      (1) Colwell, R. K. & Rangel, T. F. Hutchinson’s duality: The once and future niche. Proceedings of the National Academy of Sciences 106, 19651–19658. doi:10.1073/pnas.0901650106 (2009).

      (2) Corbeau, A., Prudor, A., Kato, A. & Weimerskirch, H. Development of flight and foraging behaviour in a juvenile seabird with extreme soaring capacities. Journal of Animal Ecology 89, 20–28. doi:10.1111/1365-2656.13121 (2020).

      (3) Fuster, J. M. Frontal lobe and cognitive development. Journal of neurocytology 31, 373–385.

      doi:10.1023/A:1024190429920 (2002).

      (4) Ramsaran, A. I., Schlichting, M. L. & Frankland, P. W. The ontogeny of memory persistence and specificity. Developmental Cognitive Neuroscience 36, 100591. doi:10.1016/j.dcn.2018.09.002 (2019).

      (5) Williams, H. J., Duriez, O., Holton, M. D., Dell’Omo, G., Wilson, R. P. & Shepard, E. L. C. Vultures respond to challenges of near-ground thermal soaring by varying bank angle. Journal of Experimental Biology 221, jeb174995. doi:10.1242/jeb.174995 (Dec. 2018).

      (6) Williams, H. J., King, A. J., Duriez, O., Börger, L. & Shepard, E. L. C. Social eavesdropping allows for a more risky gliding strategy by thermal-soaring birds. Journal of The Royal Society Interface 15, 20180578. doi:10.1098/rsif.2018.0578 (2018).

      (7) Harel, R., Horvitz, N. & Nathan, R. Adult vultures outperform juveniles in challenging thermal soaring conditions. Scientific reports 6, 27865. doi:10.1038/srep27865 (2016).

      (8) Ruaux, G., Lumineau, S. & de Margerie, E. The development of flight behaviours in birds. Proceedings of the Royal Society B: Biological Sciences 287, 20200668. doi:10.1098/rspb.2020.

      0668 (2020).

      (9) Bolker, B., Warnes, G. R. & Lumley, T. Package gtools. R Package "gtools" version 3.9.4 (2022).

      (10) Bortolotti, G. R. Age and sex size variation in Golden Eagles. Journal of Field Ornithology 55,

      54–66 (1984).

      (11) Katzner, T. E., Kochert, M. N., Steenhof, K., McIntyre, C. L., Craig, E. H. & Miller, T. A. Birds of the World (eds Rodewald, P. G. & Keeney, B. K.) chap. Golden Eagle (Aquila chrysaetos), version 2.0. doi:10.2173/bow.goleag.02 (Cornell Lab of Ornithology, Ithaca, NY, USA, 2020).

      (12) Bloom, P. H. & Clark, W. S. Molt and sequence of plumages of Golden Eagles and a technique for in-hand ageing. North American Bird Bander 26, 2 (2001).

    1. Author response:

      (1) Clarification and Detailed Explanation in the Methods Section:

      - Regarding Reviewer 1's comments about the unclear explanation of the update process for pseudotime, T, and the selection of important genes/features at bifurcation points in the methods, we will provide a detailed description of the update process for pseudotime T and how high-weight genes important to the bifurcation process are selected.

      - Regarding Reviewer 2's comments concerning the impact of the initial pseudotime prediction method and the insufficient description of various parameters, we will add information about the differences in the initially used pseudotime prediction methods and provide detailed information on the techniques and parameters used in each analysis.

      - Regarding Reviewer 2's comments on the choice of kernel functions, we will explain the rationale for selecting rbf and polynomial kernels and why other options were discarded.

      (2) Performance Comparison and Data Presentation:

      - Regarding Reviewer 1's comments about using a few trajectory plots of the real-world data to visualize the results, we will include 1-2 trajectory plots of real-world datasets in the benchmark analysis to better visualize the results and assess accuracy.

      - Regarding Reviewer 2's comments concerning the lack of comparison results and discussion related to trajectory prediction methods based on deep learning, we will include a comparison with deep learning methods such as scTour and Tigon in the revision. Additionally, we will discuss the latest deep learning methods for bifurcation analysis and alternative trajectory inference methods such as CellRank.

      - Regarding Reviewer 2's comments on the impact of MURP, we will include an analysis on whether the number of MURPs affects the performance of the method and compare it with the random subsampling approach.

      (3) Article Calibration and Refinement:

      - Regarding Reviewer 2's comments on the discussion section, we will simplify the first three paragraphs to succinctly convey the background and implications of our contributions. Additionally, we will explain why HVG is considered as the entire feature space in our comparisons and analyses.

      - Regarding Reviewer 2's comments concernig the regulons in the microglia analysis, we will review the correct explanations and revise the article accordingly.

      - In response to the issues raised by both reviewers regarding grammatical errors, spelling mistakes, and inconsistencies between text and figures, we will review and correct any errors in the article. This includes providing explanations for all abbreviations upon their first appearance, ensuring the accuracy of text and figure descriptions, correcting equation numbering, improving image quality, and revising descriptions such as "the current manifold learning methods face two major challenges."

      (4) Enhancing Descriptions and Readability:

      - Regarding Reviewer 1's comments about the synthetic data, we will add a brief description in the main text on how synthetic data were generated.

      - Regarding Reviewer 1's comments on the survival analysis, we will provide a more detailed description of the computational steps and clarify whether key confounding factors such as age, clinical stage, and tumor purity were controlled.

      - Regarding Reviewer 2's comments on evaluation metrics, we will add detailed descriptions of the evaluation metrics and provide intuitive explanations of how different methods perform across various metrics in the comparison results.

      - Regarding Reviewer 2's comments on CD8+ T cells, we plan to compare MGPfact with Monocle3, in addition to Monocle2. This will help clarify the added value of MGPfact and provide a more comprehensive evaluation of its performance.

      - Regarding Reviewer 2's comments about consensus trajectorie, we will add detailed descriptions of the process of generating consensus trajectories.

      - Regarding Reviewer 2's comments on regulons, we will include additional information on the process of downstream trajectory analysis and clarify the roles of SCENIC, GENIE3, RCisTarget, and AUCell in the bifurcation analysis.

    1. Author response:

      The following is the authors’ response to the original reviews.

      Preliminary note from the Reviewing Editor:

      The evaluations of the two Reviewers are provided for your information. As you can see, their opinions are very different.

      Reviewer #1 is very harsh in his/her evaluation. Clearly, we don't expect you to be able to affect one type of actin network without affecting the other, but rather to change the balance between the two. However, he/she also raises some valid points, in particular that more rationale should be added for the perturbations (also mentioned by Reviewer #2). Both Reviewers have also excellent suggestions for improving the presentation of the data.

      We sincerely appreciate your and the reviewers’ suggestions. The comments are amended accordingly.

      On another point, I was surprised when reading your manuscript that a molecular description of chirality change in cells is presented as a completely new one. Alexander Bershadsky's group has identified several factors (including alpha-actinin) as important regulators of the direction of chirality. The articles are cited, but these important results are not specifically mentioned. Highlighting them would not call into question the importance of your work, but might even provide additional arguments for your model.

      We appreciate the editor’s comment. Alexander Bershadsky's group has done marvelous work in cell chirality. They introduced the stair-stepping and screw theory, which suggested how radial fiber polymerization generates ACW force and drives the actin cytoskeleton into the ACW pattern. Moreover, they have identified chiral regulators like alpha-actinin 1, mDia1, capZB, and profilin 1, which can reverse or neutralize the chiral expression.

      It is worth noting that Bershadsky's group primarily focuses on radial fibers. In our manuscript, instead, we primarily focused on the contractile unit in the transverse arcs and CW chirality in our investigation. Our manuscript incorporates our findings in the transverse arcs and the radial fibers theory by Bershadsky's group into the chirality balance hypothesis, providing a more comprehensive understanding of the chirality expression.

      We have included relevant articles from Alexander Bershadsky's group, we agree that highlighting these important results of chiral regulators would further strengthen our manuscript. The manuscript was revised as follows:

      “ACW chirality can be explained by the right-handed axial spinning of radial fibers during polymerization, i.e. ‘stair-stepping' mode proposed by Tee et al. (Tee et al. 2015) (Figure 8A; Video 4). As actin filament is formed in a right-handed double helix, it possesses an intrinsic chiral nature. During the polymerization of radial fiber, the barbed end capped by formin at focal adhesion was found to recruit new actin monomers to the filament. The tethering by formin during the recruitment of actin monomers contributes to the right-handed tilting of radial fibers, leading to ACW rotation. Supporting this model, Jalal et al. (Jalal et al. 2019) showed that the silencing of mDia1, capZB, and profilin 1 would abolish the ACW chiral expression or reverse the chirality into CW direction. Specifically, the silencing of mDia1, capZB or profilin-1 would attenuate the recruitment of actin monomer into the radial fiber, with mDia1 acting as the nucleator of actin filament (Tsuji et al. 2002), CapZB promoting actin polymerization as capping protein (Mukherjee et al. 2016), and profilin-1 facilitating ATP-bound G-actin to the barbed ends(Haarer and Brown 1990; Witke 2004). The silencing resulted in a decrease in the elongation velocity of radial fiber, driving the cell into neutral or CW chirality. These results support that our findings that reduction of radial fiber elongation can invert the balance of chirality expression, changing the ACW-expressing cell into a neutral or CW-expressing cell.”

      By incorporating their findings into our revision and discussion, we provide additional support for our radial fiber-transverse arc balance model for chirality expression. The revision is made on pages 8 to 9, 13, lines 253 to 256, 284, 312 to 313, 443, 449 to 459.

      Public Reviews:

      Reviewer #1 (Public Review):

      Summary:

      Kwong et al. present evidence that two actin-filament based cytoskeletal structures regulate the clockwise and anticlockwise rotation of the cytoplasm. These claims are based on experiments using cells plated on micropatterned substrates (circles). Previous reports have shown that the actomyosin network that forms on the dorsal surface of a cell plated on a circle drives a rotational or swirling pattern of movement in the cytoplasm. This actin network is composed of a combination of non-contractile radial stress fibers (AKA dorsal stress fibers) which are mechanically coupled to contractile transverse actin arcs (AKA actin arcs). The authors claim that directionality of the rotation of the cytoplasm (i.e., clockwise or anticlockwise) depends on either the actin arcs or radial fibers, respectively. While this would interesting, the authors are not able to remove either actin-based network without effecting the other. This is not surprising, as it is likely that the radial fibers require the arcs to elongate them, and the arcs require the radial fibers to stop them from collapsing. As such, it is difficult to make simple interpretations such as the clockwise bias is driven by the arcs and anticlockwise bias is driven by the radial fibers.

      Weaknesses:

      (1) There are also multiple problems with how the data is displayed and interpreted. First, it is difficult to compare the experimental data with the controls as the authors do not include control images in several of the figures. For example, Figure 6 has images showing myosin IIA distribution, but Figure 5 has the control image. Each figure needs to show controls. Otherwise, it will be difficult for the reader to understand the differences in localization of the proteins shown. This could be accomplished by either adding different control examples or by combining figures.

      We appreciate the reviewer’s comment. We agree with the reviewer that it is difficult to compare our results in the current arrangement. The controls are included in the new Figure 6.

      (2) It is important that the authors should label the range of gray values of the heat maps shown. It is difficult to know how these maps were created. I could not find a description in the methods, nor have previous papers laid out a standardized way of doing it. As such, the reader needs some indication as to whether the maps showing different cells were created the same and show the same range of gray levels. In general, heat maps showing the same protein should have identical gray levels. The authors already show color bars next to the heat maps indicating the range of colors used. It should be a simple fix to label the minimum (blue on the color bar) and the maximum (red on the color bar) gray levels on these color bars. The profiles of actin shown in Figure 3 and Figure 3- figure supplement 3 were useful for interpretating the distribution of actin filaments. Why did not the authors show the same for the myosin IIa distributions?

      We appreciate the reviewer’s comment. For generating the distribution heatmap, the images were taken under the same setting (e.g., fluorescent staining procedure, excitation intensity, or exposure time). The prerequisite of cells for image stacking was that they had to be fully spread on either 2500 µm2 or 750 µm2 circular patterns. Then, the location for image stacking was determined by identifying the center of each cell spread in a perfect circle. Finally, the images were aligned at the cell center to calculate the averaged intensity to show the distribution heatmap on the circular pattern. Revision is made on pages 19 to 20, lines 668 to 677.

      It is important to note that the individual heatmaps represent the normalized distribution generated using unique color intensity ranges. This approach was chosen to emphasize the proportional distribution of protein within cells and its variations among samples, especially for samples with generally lower expression levels. Additionally, a differential heatmap with its own range was employed to demonstrate the normalized differences compared to the control sample. Furthermore, to provide additional insight, we plotted the intensity profile of the same protein with the same size for comparative analysis. Revision is made on pages 20, lines 679 to 682.

      The labels of the heatmap are included to show the intensity in the revised Figure 3, Figure 5, Figure 6, and Figure 3 —figure supplement 4.

      To better illustrate the myosin IIa distribution, the myosin intensity profiles were plotted for Y27 treatment and gene silencing. The figures are included as Figure 5—figure supplement 2 and Figure 6—figure supplement 2. Revisions are made on pages 10, lines 332 to 334 and pages 11, lines 377 to 379.

      (3) Line 189 "This absence of radial fibers is unexpected". The authors should clarify what they mean by this statement. The claim that the cell in Figure 3B has reduced radial stress fiber is not supported by the data shown. Every actin structure in this cell is reduced compared to the cell on the larger micropattern in Figure 3A. It is unclear if the radial stress fibers are reduced more than the arcs. Are the authors referring to radial fiber elongation?

      We appreciate the reviewer’s comment. We calculated the structures' pixel number and the percentage in the image to better illustrate the reduction of radial fiber or transverse arc. As radial fibers emerge from the cell boundary and point towards the cell center and the transverse arcs are parallel to the cell edge, the actin filament can be identified by their angle with respect to the cell center. We found that the pixel number of radial fiber is greatly reduced by 91.98 % on 750 µm2 compared to the 2500 µm2 pattern, while the pixel number of transverse arc is reduced by 70.58 % (Figure 3- figure supplement 3A). Additionally, we compared the percentage of actin structures on different pattern sizes (Figure 3- figure supplement 3B). On 2500 µm2 pattern, the percentage of radial fiber in the actin structure is 61.76 ± 2.77 %, but it only accounts for 31.13 ± 2.76 % while on 750 µm2 pattern. These results provide evidence of the structural reduction on a smaller pattern.

      Regarding the radial fiber elongation, we only discussed the reduction of radial fiber on 750 µm2 compared to the 2500 µm2 pattern in this part. For more understanding of the radial fiber contribution to chirality, we compared the radial fiber elongation rate in the LatA treatment and control on 2500 µm2 pattern (Figure 4). This result suggests the potential role of radial fiber in cell chirality. Revisions are made on page 6, lines 186 to 194; pages 17 to 18, 601 to 606; and the new Figure 3- figure supplement 3.

      (4) The choice of the small molecule inhibitors used in this study is difficult to understand, and their results are also confusing. For example, sequestering G actin with Latrunculin A is a complicated experiment. The authors use a relatively low concentration (50 nM) and show that actin filament-based structures are reduced and there are more in the center of the cell than in controls (Figure 3E). What was the logic of choosing this concentration?

      We appreciate the reviewer’s comment. The concentration of drugs was selected based on literatures and their known effects on actin arrangement or chiral expression.

      For example, Latrunculin A was used at 50 nM concentration, which has been proven effective in reversing the chirality at or below 50 nM (Bao et al., 2020; Chin et al., 2018; Kwong et al., 2019; Wan et al., 2011). Similarly, the 2 µM A23187 treatment concentration was selected to initiate the actin remodeling (Shao et al., 2015). Furthermore, NSC23677 at 100 µM was found to efficiently inhibit the Rac1 activation and resulted in a distinct change in actin structure (Chen et al., 2011; Gao et al., 2004), enhancing ACW chiral expression. The revision is made on pages 6 to 7, lines 202 to 211.

      (5) Using a small molecule that binds the barbed end (e.g., cytochalasin) could conceivably be used to selectively remove longer actin filaments, which the radial fibers have compared to the lamellipodia and the transverse arcs. The authors should articulate how the actin cytoskeleton is being changed by latruculin treatment and the impact on chirality. Is it just that the radial stress fibers are not elongating? There seems to be more radial stress fibers than in controls, rather than an absence of radial stress fibers.

      We appreciate the reviewer’s comment. Our results showed Latrunculin A treatment reversed the cell chirality. To compare the amount of radial fiber and transverse arc, we calculated the structures' pixel percentage. We found that, the percentage of radial fibers pixel with LatA treatment was reduced compared to that of the control, while the percentage of transverse arcs pixel increased (Figure 3— figure supplement 5). This result suggests that radial fibers are inhibited under Latrunculin A treatment.

      Furthermore, the elongation rate of radial fibers is reduced by Latrunculin A treatment (Figure 4). This result, along with the reduction of radial fiber percentage under Latrunculin A treatment suggests the significant impact of radial fiber on the ACW chirality.  Revisions are made on pages 7 to 8, lines 244 to 250 and the new Figure 3— figure supplement 5 and Figure 3— figure supplement 6.

      (6) Similar problems arise from the other small molecules as well. LPA has more effects than simply activating RhoA. Additionally, many of the quantifiable effects of LPA treatment are apparent only after the cells are serum starved, which does not seem to be the case here.

      We appreciate the reviewer’s comment. The reviewer mentioned that the quantifiable effects of LPA treatments were seen after the cells were serum-starved. LPA is known to be a serum component and has an affinity to albumin in serum (Moolenaar, 1995). Serum starvation is often employed to better observe the effects of LPA by comparing conditions with and without LPA. We agree with the reviewer that the effect of LPA cannot be fully seen under the current setting. Based on the reviewer’s comment and after careful consideration, we have decided to remove the data related to LPA from our manuscript. Revisions are made on pages 6 to 7, 17 and Figure 3— figure supplement 4.

      (7) Furthermore, inhibiting ROCK with, Y-27632, effects myosin light chain phosphorylation and is not specific to myosin IIA. Are the two other myosin II paralogs expressed in these cells (myosin IIB and myosin IIC)? If so, the authors’ statements about this experiment should refer to myosin II not myosin IIa.

      We appreciate the reviewer’s comment. We agree that ensuring accuracy and clarity in our statements is important. The terminology is revised to myosin II regarding the Y27632 experiment for a more concise description. Revision is made on pages 9 to 10 and 29, lines 317 to 341, 845 and 848.  

      (8) None of the uses of the small molecules above have supporting data using a different experimental method. For example, backing up the LPA experiment by perturbing RhoA tho.

      We appreciate the reviewer’s comment. After careful consideration, we have decided to remove the data related to LPA from our manuscript. Revisions are made on pages 6 to 7, 17 and Figure 3— figure supplement 4.

      (9) The use of SMIFH2 as a "formin inhibitor" is also problematic. SMIFH2 also inhibits myosin II contractility, making interpreting its effects on cells difficult to impossible. The authors present data of mDia2 knockdown, which would be a good control for this SMIFH2.

      We appreciate the reviewer’s comment. We agree that there is potential interference of SMIFH2 with myosin II contractility, which could introduce confounding factors to the results. Based on your comment and further consideration, we have decided to remove the data related to SMIFH2 from our manuscript. Revisions are made on pages 6 to 7, 10, 17 and Figure 3— figure supplement 4.

      (10) However, the authors claim that mDia2 "typically nucleates tropomyosin-decorated actin filaments, which recruit myosin II and anneal endwise with α-actinin- crosslinked actin filaments."

      There is no reference to this statement and the authors own data shows that both arcs and radial fibers are reduced by mDia2 knockdown. Overall, the formin data does not support the conclusions the authors report.

      We appreciate the reviewer’s comment. We apologize for the lack of citation for this claim. To address this, we have added a reference to support this claim in the revised manuscript (Tojkander et al., 2011). Revision is made on page 10, line 345 to 347.

      Regarding the actin structure of mDia2 gene silencing, our results showed that myosin II was disassociated from the actin filament compared to the control. At the same time, there is no considerable differences in the actin structure of radial fibers and transverse arcs between the mDia2 gene silencing and the control.  

      (11) The data in Figure 7 does not support the conclusion that myosin IIa is exclusively on top of the cell. There are clear ventral stress fibers in A (actin) that have myosin IIa localization. The authors simply chose to not draw a line over them to create a height profile.

      We appreciate the reviewer’s comment. To better illustrate myosin IIa distribution in a cell, we have included a video showing the myosin IIa staining from the base to the top of the cell (Video 7). At the cell base, the intensity of myosin IIa is relatively low at the center. However, when the focal plane elevates, we can clearly see the myosin II localizes near the top of the cell (Figure 7B and Video 7). Revision is made on page 12, lines 421 to 424, and the new Video 7. 

      Reviewer #2 (Public Review):

      Summary:

      Chirality of cells, organs, and organisms can stem from the chiral asymmetry of proteins and polymers at a much smaller lengthscale. The intrinsic chirality of actin filaments (F-actin) is implicated in the chiral arrangement and movement of cellular structures including F-actin-based bundles and the nucleus. It is unknown how opposite chiralities can be observed when the chirality of F-actin is invariant. Kwong, Chen, and co-authors explored this problem by studying chiral cell-scale structures in adherent mammalian cultured cells. They controlled the size of adhesive patches, and examined chirality at different timepoints. They made various molecular perturbations and used several quantitative assays. They showed that forces exerted by antiparallel actomyosin bundles on parallel radial bundles are responsible for the chirality of the actomyosin network at the cell scale.

      Strengths:

      Whereas previously, most effort has been put into understanding radial bundles, this study makes an important distinction that transverse or circumferential bundles are made of antiparallel actomyosin arrays. A minor point that was nice for the paper to make is that between the co-existing chirality of nuclear rotation and radial bundle tilt, it is the F-actin driving nuclear rotation and not the other way around. The paper is clearly written.

      Weaknesses:

      The paper could benefit from grammatical editing. Once the following Major and Minor points are addressed, which may not require any further experimentation and does not entail additional conditions, this manuscript would be appropriate for publication in eLife.

      Recommendations for the authors:

      Reviewer #2 (Recommendations For The Authors):

      Major:

      (1) The binary classification of cells as exhibiting clockwise or anticlockwise F-actin structures does not capture the instances where there is very little chirality, such as in the mDia2-depleted cells on small patches (Figure 6B). Such reports of cell chirality throughout the cell population need to be reported as the average angle of F-actin structures on a per cell basis as a rose plot or scatter plot of angle. These changes to cell-scoring and data display will be important to discern between conditions where chirality is random (50% CW, 50% ACW) from conditions where chirality is low (radial bundles are radial and transverse arcs are circumferential).

      We appreciate the reviewer’s comment. We apologize if we did not convey our analysis method clearly enough. Throughout the manuscript, unless mentioned otherwise, the chirality analysis was based on the chiral nucleus rotation within a period of observation. The only exception is the F-actin structure chirality, in Figure 3—figure supplement 1, which we analyzed the angle of radial fiber of the control cell on 2500 µm2. It was described on pages 5 to 6, lines 169-172, and the method section “Analysis of fiber orientation and actin structure on circular pattern” on page 17.

      Based on the feedback, we attempted to use a scatter plot to present the mDia2 overexpression and silencing to show the randomness of the result. However, because scatter plots primarily focus on visualizing the distribution, they become cluttered and visually overwhelming, as shown below.

      Author response image 1.

      (A) Percentage of ACW nucleus rotational bias on 2500 µm2 with untreated control (reused data from Figure 3D, n = 57), mDia2 silencing (n = 48), and overexpression (n = 25). (B) Probability of ACW/CW rotation on 750 µm2 pattern with untreated control (reused data from Figure 3E, n = 34), mDia2 silencing (n = 53), and overexpressing (n = 22). Mean ± SEM. Two-sample equal variance two-tailed t-test.

      Therefore, in our manuscript, the presentation primarily used a column bar chart with statistical analysis, the Student T-test. The column bar chart makes it easier to understand and compare values. In brief, the Student T-test is commonly used to evaluate whether the means between the two groups are significantly different, assuming equal variance. As such, the Student T-test is able to discern the randomness of the chirality.

      (2) The authors need to discuss the likely nucleator of F-actin in the radial bundles, since it is apparently not mDia2 in these cells.

      We appreciate the reviewer’s comment. In our manuscript, we originally focused on mDia2 and Tpm4 as they are the transverse arc nucleator and the mediator of myosin II motion. However, we agree with the reviewer that discussing the radial fiber nucleator would provide more insight into radial fiber polymerization in ACW chirality and improve the completeness of the story.

      Radial fiber polymerizes at the focal adhesion. Serval proteins are involved in actin nucleation or stress fiber formation at the focal adhesion, such as Arp2/3 complex (Serrels et al., 2007), Ena/VASP (Applewhite et al., 2007; Gateva et al., 2014), and formins (Dettenhofer et al., 2008; Sahasrabudhe et al., 2016; Tsuji et al., 2002), etc. Within the formin family, mDia1 is the likely nucleator of F-actin in the radial bundle. The presence of mDia1 facilitates the elongation of actin bundles at focal adhesion (Hotulainen and Lappalainen, 2006). Studies by Jalal, et al (2019) (Jalal et al., 2019) and Tee, et al (2023) (Tee et al., 2023), have demonstrated the silencing of mDia1 abolished the ACW actin expression. Silencing of other nucleation proteins like Arp2/3 complex or Ena/VASP would only reduce the ACW actin expression without abolishing it.

      Based on these findings, the attenuation of radial fiber elongation would abolish the ACW chiral expression, providing more support for our model in explaining chirality expression.

      This part is incorporated into the Discussion. The revision is made on page 13, lines 443, 449 to 459.

      Minor:

      (1) In the introduction, additional observations of handedness reversal need to be referenced (line 79), including Schonegg, Hyman, and Wood 2014 and Zaatri, Perry, and Maddox 2021.

      We appreciate the reviewer’s comment. The observations of handedness reversal references are cited on page 3, line 78 to 79.

      (2) For clarity of logic, the authors should share the rationale for choosing, and results from administering, the collection of compounds as presented in Figure 3 one at a time instead of as a list.

      We appreciate the reviewer’s comment. The concentration of drugs was determined based on existing literature and their known outcomes on actin arrangement or chiral expression.

      To elucidate, the use of Latrunculin A was based on previous studies, which have demonstrated to reverse the chirality at or below 50 nM (Bao et al., 2020; Chin et al., 2018; Kwong et al., 2019; Wan et al., 2011).  Because inhibiting F-actin assembly can lead to the expression of CW chirality, we hypothesized that the opposite treatment might enhance ACW chirality. Therefore, we chose A23187 treatment with 2 µM concentration as it could initiate the actin remodeling and stress fiber formation (Shao et al., 2015).

      Furthermore, in the attempt to replicate the reversal of chirality by inhibiting F-actin assembly through other pathways, we explored NSC23677 at 100 µM, which was found to inhibit the Rac1 activation (Chen et al., 2011; Gao et al., 2004) and reduce cortical F-actin assembly (Head et al., 2003). However, it failed to reverse the chirality but enhanced the ACW chirality of the cell.

      We carefully selected the drugs and the applied concentration to investigate various pathways and mechanisms that influence actin arrangement and might affect the chiral expression. We believe that this clarification strengthens the rationale behind our choice of drug. The revision is made on pages 6 to 7, lines 202 to 211.

      (3) "Image stacking" isn't a common term to this referee. Its first appearance in the main text (line 183) should be accompanied with a call-out to the Methods section. The authors could consider referring to this approach more directly. Related issue: Image stacking fails to report the prominent enrichment of F-actin at the very cell periphery (see Figure 3 A and F) except for with images of cells on small islands (Figure 3H). Since this data display approach seems to be adding the intensity from all images together, and since cells on circular adhesive patches are relatively radially symmetric, it is unclear how to align cells, but perhaps cells could be aligned based on a slight asymmetry such as the peripheral location with highest F-actin intensity or the apparent location of the centrosome.

      We appreciate the reviewer’s comment. We fully acknowledge the uncommon use of “image stacking” and the insufficient description of image stacking under the Method section. First, we have added a call-out to the Methods section at its first appearance (Page 6, Lines 182 to 183). The method of image stacking is as follows. During generating the distribution heatmap, the images were taken under the same setting (e.g., staining procedure, fluorescent intensity, exposure time, etc.). The prerequisite of cells to be included in image stacking was that they had to be fully spread on either 2500 µm2 or 750 µm2 circular patterns. Then, the consistent position for image stacking could be found by identifying the center of each cell spreading in a perfect circle. Finally, the images were aligned at the center to calculate the averaged intensity to show the distribution heatmap on the circular pattern.

      We agree with the reviewer that our image alignment and stacking are based on cells that are radially symmetric. As such, the intensity distribution of stacked image is to compare the difference of F-actin along the radial direction. Revision is made on page 19, lines 668 to 682.

      (4) The authors need to be consistent with wording about chirality, avoiding "right" and left (e.g. lines 245-6) since if the cell periphery were oriented differently in the cropped view, the tilt would be a different direction side-to-side but the same chirality. This section is confusing since the peripheral radial bundles are quite radial, and the inner ones are pointing from upper left to lower right, pointing (to the right) more downward over time, rather than more right-ward, in the cropped images.

      We appreciate the reviewer’s comment. We apologize for the confusion caused by our description of the tilting direction. For consistency in our later description, we mention the “right” or “left” direction of the radial fibers referencing to the elongation of the radial fiber, which then brings the “rightward tilting” toward the ACW rotation of the chiral pattern. To maintain the word “rightward tilting”, we added the description to ensure accurate communication in our writing. We also rearrange the image in the new Figure 4A and Video 2 for better observation. Revision is made on page 8, lines 262 to 263.

      (5) Why are the cells Figure 4A dominated by radial (and more-central, tilting fibers, while control cells in 4D show robust circumferential transverse arcs? Have these cells been plated for different amounts of time or is a different optical section shown?

      We appreciate the reviewer’s comment. The cells in Figure 4A and Figure 4D are prepared with similar conditions, such as incubation time and optical setting. Actin organization is a dynamic process, and cells can exhibit varied actin arrangements, transitioning between different forms such as circular, radial, chordal, chiral, or linear patterns, as they spread on a circular island (Tee et al., 2015). In Figure 4A, the actin is arranged in a chiral pattern, whereas in Figure 4D, the actin exhibits a radial pattern. These variations reflect the natural dynamics of actin organization within cells during the imaging process.

      (6) All single-color images (such as Fig 5 F-actin) need to be black-on-white, since it is far more difficult to see F-actin morphology with red on black.

      We appreciate the reviewer’s comment. We have changed all F-actin images (single color) into black and white for better image clarity. Revisions are made in the new Figure 5, Figure 6 and Figure 7.

      (7) Figure 5A, especially the F-actin staining, is quite a bit blurrier than other micrographs. These images should be replaced with images of comparable quality to those shown throughout.

      We appreciate the reviewer’s comment. We agree that the F-actin staining in Figure 5 is difficult to observe. To improve image clarity, the F-actin staining images are replaced with more zoomed-in image. Revision is made in the new Figure 5.

      (8) F-actin does not look unchanged by Y27632 treatment, as the authors state in line 306. This may be partially due to image quality and the ambiguities of communicating with the blue-to-red colormap. Similarly, I don't agree that mDia2 depletion did not change F-actin distribution (line 330) as cells in that condition had a prominent peripheral ring of F-actin missing from cells in other conditions.

      We appreciate the reviewer’s comment. We agree with the reviewer’s observation that the F-actin distribution is indeed changed under Y27632 treatment compared to the control in Figure 5A-B. Here, we would like to emphasize that the actin ring persists despite the actin structure being altered under the Y27632 treatment. The actin ring refers to the darker red circle in the distribution heatmap. It presents the condensed actin structure, including radial fibers and transverse arcs. This important structure remains unaffected despite the disruption of myosin II, the key component in radial fiber.

      Furthermore, we agree with the reviewer that mDia2 depletion does change F-actin distribution. Similar to the Y27632 treatment, the actin ring persists despite the actin structure being altered under mDia2 gene silencing. Moreover, compared to other treatments, mDia2 depletion has less significant impact on actin distribution. To address these points more comprehensively, we have made revision in Y27632 treatment and mDia2 sections. The revisions of Y27632 and mDia2 are made on pages 10, lines 324-327 and 352-353, respectively.

      (9) The colormap shown for intensity coding should be reconsidered, as dark red is harder to see than the yellow that is sub-maximal. Verdis is a colormap ranging from cooler and darker blue, through green, to warmer and lighter yellow as the maximum. Other options likely exist as well.

      We appreciate the reviewer’s comment. We carefully considered the reviewer’s concern and explored other color scale choices in the colormap function in Matlab. After evaluating different options, including “Verdis” color scale, we found that “jet” provides a wide range of colors, allowing the effective visual presentation of intensity variation in our data. The use of ‘jet’ allows us to appropriately visualize the actin ring distribution, which represented in red or dark re. While we understand that dark red could be harder to see than the sub-maximal yellow, we believe that “jet” serves our purpose of presenting the intensity information.

      (10) For Figure 6, why doesn't average distribution of NMMIIa look like the example with high at periphery, low inside periphery, moderate throughout lamella, low perinuclear, and high central?

      We appreciate the reviewer’s comment. We understand that the reviewer’s concern about the average distribution of NMMIIa not appearing as the same as the example. The chosen image is the best representation of the NMMIIa disruption from the transverse arcs after the mDia2 silencing. Additionally, it is important to note that the average distribution result is a stacked image which includes other images. As such, the NMMIIA example and the distribution heatmap might not necessarily appear identical.

      (11) In 2015, Tee, Bershadsky and colleagues demonstrated that transverse bundles are dorsal to radial bundles, using correlative light and electron microscopy. While it is important for Kwong and colleagues to show that this is true in their cells, they should reference Tee et al. in the rationale section of text pertaining to Figure 7.

      We appreciate the reviewer’s comment. Tee, et al (Tee et al., 2015) demonstrated the transverse fiber is at the same height as the radial fiber based on the correlative light and electron microscopy. Here, using the position of myosin IIa, a transverse arc component, our results show the dorsal positioning of transverse arcs with connection to the extension of radial fibers (Figure 7C), which is consistent with their findings. It is included in our manuscript, page 12, lines 421 to 424, and page 14 lines 477 to 480.

      Reference

      Applewhite, D.A., Barzik, M., Kojima, S.-i., Svitkina, T.M., Gertler, F.B., and Borisy, G.G. (2007). Ena/Vasp Proteins Have an Anti-Capping Independent Function in Filopodia Formation. Mol. Biol. Cell. 18, 2579-2591. DOI: https://doi.org/10.1091/mbc.e06-11-0990

      Bao, Y., Wu, S., Chu, L.T., Kwong, H.K., Hartanto, H., Huang, Y., Lam, M.L., Lam, R.H., and Chen, T.H. (2020). Early Committed Clockwise Cell Chirality Upregulates Adipogenic Differentiation of Mesenchymal Stem Cells. Adv. Biosyst. 4, 2000161. DOI: https://doi.org/10.1002/adbi.202000161

      Chen, Q.-Y., Xu, L.-Q., Jiao, D.-M., Yao, Q.-H., Wang, Y.-Y., Hu, H.-Z., Wu, Y.-Q., Song, J., Yan, J., and Wu, L.-J. (2011). Silencing of Rac1 Modifies Lung Cancer Cell Migration, Invasion and Actin Cytoskeleton Rearrangements and Enhances Chemosensitivity to Antitumor Drugs. Int. J. Mol. Med. 28, 769-776. DOI: https://doi.org/10.3892/ijmm.2011.775

      Chin, A.S., Worley, K.E., Ray, P., Kaur, G., Fan, J., and Wan, L.Q. (2018). Epithelial Cell Chirality Revealed by Three-Dimensional Spontaneous Rotation. Proc. Natl. Acad. Sci. U.S.A. 115, 12188-12193. DOI: https://doi.org/10.1073/pnas.1805932115

      Dettenhofer, M., Zhou, F., and Leder, P. (2008). Formin 1-Isoform IV Deficient Cells Exhibit Defects in Cell Spreading and Focal Adhesion Formation. PLoS One 3, e2497. DOI:  https://doi.org/10.1371/journal.pone.0002497

      Gao, Y., Dickerson, J.B., Guo, F., Zheng, J., and Zheng, Y. (2004). Rational Design and Characterization of a Rac GTPase-Specific Small Molecule Inhibitor. Proc. Natl. Acad. Sci. U.S.A. 101, 7618-7623. DOI: https://doi.org/10.1073/pnas.0307512101

      Gateva, G., Tojkander, S., Koho, S., Carpen, O., and Lappalainen, P. (2014). Palladin Promotes Assembly of Non-Contractile Dorsal Stress Fibers through Vasp Recruitment. J. Cell Sci. 127, 1887-1898. DOI: https://doi.org/10.1242/jcs.135780

      Haarer, B., and Brown, S.S. (1990). Structure and Function of Profilin.

      Head, J.A., Jiang, D., Li, M., Zorn, L.J., Schaefer, E.M., Parsons, J.T., and Weed, S.A. (2003). Cortactin Tyrosine Phosphorylation Requires Rac1 Activity and Association with the Cortical Actin Cytoskeleton. Mol. Biol. Cell. 14, 3216-3229. DOI: https://doi.org/10.1091/mbc.e02-11-0753

      Hotulainen, P., and Lappalainen, P. (2006). Stress Fibers are Generated by Two Distinct Actin Assembly Mechanisms in Motile Cells. J. Cell Biol. 173, 383-394. DOI: https://doi.org/10.1083/jcb.200511093

      Jalal, S., Shi, S., Acharya, V., Huang, R.Y., Viasnoff, V., Bershadsky, A.D., and Tee, Y.H. (2019). Actin Cytoskeleton Self-Organization in Single Epithelial Cells and Fibroblasts under Isotropic Confinement. J. Cell Sci. 132. DOI: https://doi.org/10.1242/jcs.220780

      Kwong, H.K., Huang, Y., Bao, Y., Lam, M.L., and Chen, T.H. (2019). Remnant Effects of Culture Density on Cell Chirality after Reseeding. J. Cell Sci. 132. DOI: https://doi.org/10.1242/jcs.220780

      Moolenaar, W.H. (1995). Lysophosphatidic Acid, a Multifunctional Phospholipid Messenger. J. Cell Sci. 132. DOI: https://doi.org/10.1242/jcs.220780

      Mukherjee, K., Ishii, K., Pillalamarri, V., Kammin, T., Atkin, J.F., Hickey, S.E., Xi, Q.J., Zepeda, C.J., Gusella, J.F., and Talkowski, M.E. (2016). Actin Capping Protein Capzb Regulates Cell Morphology, Differentiation, and Neural Crest Migration in Craniofacial Morphogenesis. Hum. Mol. Genet. 25, 1255-1270. DOI: https://doi.org/10.1093/hmg/ddw006

      Sahasrabudhe, A., Ghate, K., Mutalik, S., Jacob, A., and Ghose, A. (2016). Formin 2 Regulates the Stabilization of Filopodial Tip Adhesions in Growth Cones and Affects Neuronal Outgrowth and Pathfinding In Vivo. Development 143, 449-460. DOI: https://doi.org/10.1242/dev.130104

      Serrels, B., Serrels, A., Brunton, V.G., Holt, M., McLean, G.W., Gray, C.H., Jones, G.E., and Frame, M.C. (2007). Focal Adhesion Kinase Controls Actin Assembly via a Ferm-Mediated Interaction with the Arp2/3 Complex. Nat. Cell Biol. 9, 1046-1056. DOI: https://doi.org/10.1038/ncb1626

      Shao, X., Li, Q., Mogilner, A., Bershadsky, A.D., and Shivashankar, G. (2015). Mechanical Stimulation Induces Formin-Dependent Assembly of a Perinuclear Actin Rim. Proc. Natl. Acad. Sci. U.S.A. 112, E2595-E2601. DOI: https://doi.org/10.1073/pnas.1504837112

      Tee, Y.H., Goh, W.J., Yong, X., Ong, H.T., Hu, J., Tay, I.Y.Y., Shi, S., Jalal, S., Barnett, S.F., and Kanchanawong, P. (2023). Actin Polymerisation and Crosslinking Drive Left-Right Asymmetry in Single Cell and Cell Collectives. Nat. Commun. 14, 776. DOI: https://doi.org/10.1038/s41467-023-35918-1

      Tee, Y.H., Shemesh, T., Thiagarajan, V., Hariadi, R.F., Anderson, K.L., Page, C., Volkmann, N., Hanein, D., Sivaramakrishnan, S., Kozlov, M.M., and Bershadsky, A.D. (2015). Cellular Chirality Arising from the Self-Organization of the Actin Cytoskeleton. Nat. Cell Biol. 17, 445-457. DOI: https://doi.org/10.1038/ncb3137

      Tojkander, S., Gateva, G., Schevzov, G., Hotulainen, P., Naumanen, P., Martin, C., Gunning, P.W., and Lappalainen, P. (2011). A Molecular Pathway for Myosin II Recruitment to Stress Fibers. Curr. Biol. 21, 539-550. DOI: https://doi.org/10.1016/j.cub.2011.03.007

      Tsuji, T., Ishizaki, T., Okamoto, M., Higashida, C., Kimura, K., Furuyashiki, T., Arakawa, Y., Birge, R.B., Nakamoto, T., Hirai, H., and Narumiya, S. (2002). Rock and mdia1 Antagonize in Rho-Dependent Rac Activation in Swiss 3T3 Fibroblasts. J. Cell Biol. 157, 819-830. DOI: https://doi.org/10.1083/jcb.200112107

      Wan, L.Q., Ronaldson, K., Park, M., Taylor, G., Zhang, Y., Gimble, J.M., and Vunjak-Novakovic, G. (2011). Micropatterned Mammalian Cells Exhibit Phenotype-Specific Left-Right Asymmetry. Proc. Natl. Acad. Sci. U.S.A. 108, 12295-12300. DOI: https://doi.org/10.1073/pnas.1103834108

      Witke, W. (2004). The Role of Profilin Complexes in Cell Motility and Other Cellular Processes. Trends Cell Biol. 14, 461-469. DOI: https://doi.org/10.1016/j.tcb.2004.07.003

    1. Author response:

      The following is the authors’ response to the original reviews.

      eLife assessment

      This valuable contribution studies factors that impact molecular exchange between dense and dilute phases of biomolecular condensates through continuum models and coarse-grained simulations. The authors provide solid evidence that interfacial resistance can cause molecules to bounce off the interface and limit mixing. Results like these can inform how experimental results in the field of biological condensates are interpreted.

      We would like to sincerely thank the editors for spending time on our manuscript and for the very positive assessment of our work. We have carefully considered and addressed the reviewers’ comments in the point-by-point response below and have revised our manuscript accordingly.

      Reviewer #1 (Public Review):

      Summary:

      In this paper by Zhang, the authors build a physical framework to probe the mechanisms that underlie the exchange of molecules between coexisting dense and dilute liquid-like phases of condensates. They first propose a continuum model, in the context of a FRAP-like experiment where the fluorescently labeled molecules inside the condensate are bleached at t=0 and the recovery of fluorescence is measured. Through this model, they identify how the key timescales of internal molecular mixing, replenishment from dilute phase, and interface transfer contribute to molecular exchange timescale. Motivated by a recent experiment reported by some of the co-authors previously (Brangwynne et al. in 2019) finding strong interfacial resistance in in-vitro protein droplets of LAF-1, they seek to understand the microscopic features contributing to the interfacial conductance (inversely proportional to the resistance). To check, they perform coarse-grained MD simulations of sticker-spacer self-associative polymers and report how conductance varies significantly even across the few explored sequences. Further, by looking at individual trajectories, they postulate that "bouncing" - i.e., molecules that approach the interface but are not successfully absorbed - is a strong contributor to this mass transfer limitation. Consistent with their predictions, sequences that have more free unbound stickers (i.e., for example through imbalance sequence sticker stoichiometries) have higher conductances and they show a simple linear scaling between the number of unbound stickers and conductance. Finally, they predict a droplet-size-dependent transition in recovery time behavior.

      Strengths:

      (1) This paper is well-written overall and clear to understand.

      (2) By combining coarse-grained simulations, continuum modeling, and comparison to published data, the authors provide a solid picture of how their proposed framework relates to molecular exchange mechanisms that are dominated by interface resistance and LAF-1 droplets.

      (3) The choice of different ways to estimate conductance from simulation and reported data are thoughtful and convincing in their near agreement (although a little discussion of why and when they differ would be merited as well).

      We would like to thank the reviewer for the positive evaluation of our work. Indeed, we are grateful to the reviewer for this thoughtful, detailed, and constructive report, which has helped us strengthen the manuscript.

      Weaknesses:

      (1) Almost the entirety of this paper is motivated by a previously reported FRAP experiment on a particular LAF-1 droplet in vitro. There are a few major concerns I have with how the original data is used, how these results may generalize, and the lack of connection of predictions with any other experiments (published or new).

      a. The mean values of cdense, cdilute, diffusivities, etc. are taken from Taylor et al. to rule in the importance of interfacial mass transfer limits. While this may be true, the values originally inferred (in the 2019 paper that this paper is strongly built off) report extremely large confidence intervals/inferred standard errors. The authors should accordingly report all their inferences with correct standardized errors or confidence intervals, which in turn, allow us to better understand these data.

      Yes, agreed. We have now included the standard errors of the parameters from Taylor et al. (2019), and reported the corresponding standard errors for the timescales and interface conductance using error propagation. We have modified Fig. 1C right panel as well as the text in the figure caption:

      “(Right) Expected recovery times and if the slowest recovery process was either the flux from the dilute phase or diffusion within the droplet, respectively, with and taken from Taylor et al. (2019). While the timescale associated with interface resistance is unknown, the measured recovery time is much longer than and , suggesting the recovery is limited by flux through the interface, with an interface conductance of  (Below Figure 1)”

      b. The generalizability of this model is hard to gauge when all comparisons are made to a single experiment reported in a previous paper.

      i. Conceptually, the model is limited to single-component sticker-spacer polymers undergoing phase separation which is already a very simplified model of condensates - for e.g., LAF1 droplets in the cell have no perceptible interfacial mass limitations, also reported in Taylor et al. 2019 - so how these mechanisms relate to living systems as opposed to specific biochemistry experiments. So the authors need to discuss the implications and limitations of their model in the living context where there are multiple species, finite-size effects, and active processes at play.

      We thank the reviewer for the critical comment. To address this point, we have included a paragraph in the Discussion regarding in vivo situations:

      “In this work, we focused on the exchange dynamics of in vitro single-component condensates. How is the picture modified for condensates inside cells? It has been shown that Ddx4-YFP droplets in the cell nucleus exhibit negligible interface resistance Taylor et al. (2019), which raises the question whether interface resistance is relevant to natural condensates in vivo. Future quantitative FRAP and single-molecule tracking experiments on different types of droplets in the cell will address this question. One complication is that condensates in cells are almost always multi-component, which can increase the complexity of the exchange dynamics. Interestingly, formation of multiple layers or the presence of excess molecules of one species coating the droplet is likely to increase interface resistance. A notable example is the Pickering effect, in which adsorbed particles partially cover the interface, thereby reducing the accessible area and the overall condensate surface tension, slowing down the exchange dynamics Folkmann et al. (2021). The development of theory and modeling for the exchange dynamics of multi-component condensates is currently underway. (Lines 323-334)”

      ii. Second, can the authors connect their model to make predictions of the impact of perturbations to LAF-1 on exchange timescales? For example, are mutants (which change the number or positioning of "stickers") expected to show particular trends in conductances or FRAP timescales? Since LAF-1 is a relatively well-studied protein in vitro, can the authors further contrast their expectations with already published datasets that explore these perturbations, even if they don't generate new data?

      Our model is intended to address interface exchange dynamics at the conceptual level. The underlying mechanism for the large interface resistance of LAF-1 droplets could be more complicated than explored in our work. To study the impact of perturbations to LAF-1 on exchange timescales likely requires substantially more sophisticated molecular dynamics simulations. We undertook an extensive search for FRAP experiments on LAF-1 droplets where the whole droplet is photobleached, but were not able to find another dataset. We would be grateful if the reviewer is aware of such data and can point us to it.

      iii. A key prediction of the interface limitation model is the size-dependent crossover in FRAP dynamics. Can the authors reanalyze published data on LAF-1 (albeit of different-size droplets) to check their predictions? At the least, is the crossover radius within experimentally testable limits?

      Based on our prediction, the crossover radius for LAF-1 droplet is around 70 𝜇m. We have added a sentence in the text to point this out:

      “We also predict the crossover for LAF-1 droplets to be around 𝑅 = 71 𝜇m, which in principle can be tested experimentally. (Lines 285-286)”

      Unfortunately, most of FRAP experiments in Taylor at al. (2019) are partial FRAP experiments, in which only part of the dense phase is photobleached. The recovery time for such experiments reflects primarily the internal mixing speed of the dense phase rather than the exchange dynamics at the interface or transport from the dilute phase.

      c. The authors nicely relate the exchange timescale to various model parameters. Is LAF-1 the only protein for which the various dilute/dense concentrations/diffusivities are known? Given the large number of FRAP and other related studies, can the authors report on a few other model condensate protein systems? This will help broaden the reach of this model in the context of other previously reported data. If such data are lacking, a discussion of this would be important.

      Yes, indeed, we have found numerous publications with FRAP experiments performed on whole droplets of various proteins. However, none of these have provided a complete set of parameters to allow a quantitative analysis. Part of the reason is because it is nontrivial to have an accurate measurement of the partition coefficient (cden/cdil). We have added a sentence in the Discussion to promote future quantitative experiment and analysis of condensate exchange dynamics:

      “We hope that our study will motivate further experimental investigations into the anomalous exchange dynamics of LAF-1 droplets and potentially other condensates, and the mechanisms underlying interface resistance. (Lines 320-322)”

      To broaden the audience for this work in the hope of stimulating such studies, we have also modified the title and abstract so that it will be more visible to the FRAP community:

      “The exchange dynamics of biomolecular condensates (Line 1)”

      “A hallmark of biomolecular condensates formed via liquid-liquid phase separation is that they dynamically exchange material with their surroundings, and this process can be crucial to condensate function. Intuitively, the rate of exchange can be limited by the flux from the dilute phase or by the mixing speed in the dense phase. Surprisingly, a recent experiment suggests that exchange can also be limited by the dynamics at the droplet interface, implying the existence of an “interface resistance”. Here, we first derive an analytical expression for the timescale of condensate material exchange, which clearly conveys the physical factors controlling exchange dynamics. We then utilize sticker-spacer polymer models to show that interface resistance can arise when incident molecules transiently touch the interface without entering the dense phase, i.e., the molecules “bounce” from the interface. Our work provides insight into condensate exchange dynamics, with implications for both natural and synthetic systems. (Lines 16-26)”

      (2) The reported sticker-spacer simulations, while interesting, represent a very small portion of the parameter space. Can the authors - through a combination of simulation, analyses, or physical reasoning, comment on how the features of their underlying microscopic model (sequence length, implicit linker length, relative stoichiometry of A/B for a given length, overall concentration, sequence pattern properties like correlation length) connect to conductance? This will provide more compelling evidence relating their studies beyond the cursory examination of handpicked sequences. A more verbose description of some of the methods would be appreciated as well, including specifically how to (a) calculate the bond lifetime of isolated A-B pair, and (b) how equilibration/convergence of MD simulations is established.

      In our simulation, the interface conductance is essentially controlled by the fraction of unbound stickers, the encounter rate of a pair of unbound stickers, the dilute- and dense-phase concentrations, and the width of the interface. As a result, weaker binding strength and/or deviation of A:B stoichiometry from 1:1 result in a higher interface conductance. A6B6 polymers with long blocks of stickers of the same type (compared to (A2B2)3 and (A3B3)2) have a lower dilute-phase concentration and thinner interface width, so lower conductance. Sequence length and implicit linker length can have more complex effects, which are beyond the scope of the current study. We have now provided an explicit expression for 𝜅 in Equation (14) and added a discussion sentence in the text:

      “More generally, we find that the interface conductance of the sticker-spacer polymers is controlled by the encounter rate of a pair of unbound stickers and the availability of these stickers, which in turn depends on the sticker-sticker binding strength, the dilute- and dense-phase polymer concentrations, and the width of the interface:

      where 𝓃 is the number of monomers in a polymer,  is the global stoichiometry (i.e., ), and are the fractions of unbound A/B monomers in the dilute and dense phases. (Lines 208-214)”

      We have also added a few sentences in Appendix 2 to describe how we calculate the bond lifetime of an isolated A-B pair and how equilibration in simulations is established.

      “Briefly, the bond lifetime of an isolated pair is obtained by simulating a bound pair of A-B stickers in a box and recording the time when they first separate by the cutoff distance of the attractive interaction nm. The mean bond lifetime 𝜏 is found by averaging results of 1000 replicates with different random seeds. (Lines 642-645)”

      “To test if the system has reached equilibrium, we compare the dense- and dilute-phase concentrations derived from the first and second halves of the recorded data. The agreement indicates that the system has reached equilibrium. (Lines 586-589)”

      (3) A lot of the main text repeats previously published models (continuum ones in Taylor et al. 2019 and Hubsatch et al., 2021, amongst others) and the idea of interface resistance being limiting was already explored quantitatively in Taylor 2019 (including approximate estimates of mass transfer limitations) - this is fine in context. While the authors do a good job of referring to past work in context, the main results of this paper, in my reading, are:

      - a simplified physical form relating conductance timescales.

      - sticker-spacer simulations probing microscopic origins.

      - analysis of size-dependent FRAP scaling.

      I am stating this not as a major weakness, but, rather - I would recommend summarizing and categorizing the sections to make the distinctions between previously reported work and current advances sufficiently clear.

      We thank the reviewer for a clear summary of the contributions of our work. We have highlighted our main contributions in multiple places:

      “Here, we first derive an analytical expression for the timescale of condensate material exchange, which clearly conveys the physical factors controlling exchange dynamics. We then utilize sticker-spacer polymer models to show that interface resistance can arise when incident molecules transiently touch the interface without entering the dense phase, i.e., the molecules “bounce” from the interface. (Lines 21-25)”

      “In the following, we first derive an analytical expression for the timescale of condensate material exchange, which conveys a clear physical picture of what controls this timescale. We then utilize a “sticker-spacer” polymer model to investigate the mechanism of interface resistance. We find that a large interface resistance can occur when molecules bounce off the interface rather than being directly absorbed. We finally discuss characteristic features of the FRAP recovery pattern of droplets when the exchange dynamics is limited by different factors. (Lines 65-70)”

      “Specifically, we first derived an analytical expression for the exchange rate, which conveys the clear physical picture that this rate can be limited by the flux of molecules from the dilute phase, by the speed of mixing inside the dense phase, or by the dynamics of molecules at the droplet interface. Motivated by recent FRAP measurements Taylor et al. (2019) that the exchange rate of LAF-1 droplets can be limited by interface resistance, which contradicts predictions of conventional mean-field theory, we investigated possible physical mechanisms underlying interface resistance using a “sticker-spacer” model. Specifically, we demonstrated via simulations a notable example in which incident molecules have formed all possible internal bonds, and thus bounce from the interface, giving rise to a large interface resistance. Finally, we discussed the signatures in FRAP recovery patterns of the presence of a large interface resistance. (Lines 291-300)”

      Reviewer #2 (Public Review):

      Summary:

      In this paper, the authors have obtained an analytical expression that provides intuition about regimes of interfacial resistance that depend on droplet size. Additionally, through simulations, the authors provide microscopic insight into the arrangement of sticky and non-sticky functional groups at the interface. The authors introduce bouncing dynamics for rationalizing quantity recovery timescales.

      I found several sections that felt incomplete or needed revision and additional data to support the central claim and make the paper self-contained and coherent.

      We thank the reviewer for spending time on our manuscript and for the helpful critical comments.

      First, the analytical theory operates with diffusion coefficients for dilute and dense phases. For the dilute phase, this is fine. For the dense phase, I have doubts that dynamics can be described as diffusive. Most likely, dynamics is highly subdiffusive due to crowded, entangled, and viscoelastic environments of densely packed interactive biomolecules. Some explanation and justification are in order here.

      The reviewer is correct in noting that molecules within a condensate can move subdiffusively due to the viscoelastic nature of the condensate. However, subdiffusion only occurs at short time and small length scales, the motion of molecules becomes diffusive at longer time and larger length scales. The crossover time here is the terminal relaxation time measured to be on the order of milliseconds to seconds for typical condensates (see Alshareedah, Ibraheem, et al. "Determinants of viscoelasticity and flow activation energy in biomolecular condensates" Science Advances 10.7, 2024). We previously have also found that, for sticker-spacer polymers, this relaxation time is determined by the time it takes for a sticker to switch to a new partner (see Ronceray et al. (2022) in References), which is therefore largely determined by the bond lifetime of a sticker pair. The crossover length scale is expected to be comparable to the size of a molecule based on the theory of polymer disentanglement. Importantly, in order for the bleached droplet to recover its fluorescence, the bleached molecules must travel for a much longer time and a much larger length than the crossover time and length. It is therefore expected that the molecules move diffusively on the relevant timescale of a FRAP experiment, albeit with a diffusion coefficient that reflects crowding and entanglement on short time and length scales.

      The second major issue is that I did not find a clean comparison of simulations with the derived analytical expression. Simulations test various microscopic properties on the value of k, which is important. But how do we know that it is the same quantity that appears in the expressions? Also, how can we be sure that analytical expressions can guide simulations and experiments as claimed? The authors should provide sound evidence of the predictive aspect of their derived expressions.

      We thank the reviewer for raising this critical issue. We agree with the reviewer that we did not perform an explicit simulation to validate the developed theory, which leaves a gap between our theory and simulations. The main reason is because simulation of an in silico “FRAP experiment” on a 3D droplet is very computationally costly. Nevertheless, following the reviewer’s suggestion, we have now performed such a simulation in which we “bleached” a small A6B6 droplet and measured its recovery time. The good agreement between simulation and theory helps validate our overall combined computational and analytical approach. We have incorporated the new simulation and results into the manuscript. Two new sections including new figures (Figure 4 and Appendix 2 Figure 4) are added: “Direct simulation of droplet FRAP” in the main text (lines 232-261) and “Details of simulation and theory of FRAP recovery of an A6B6 droplet” in Appendix 2 (lines 665-715).

      Are the plots in Figure 4 coming from experiment, theory, and simulation? I could not find any information either in the text or in the caption.

      Figure 4 (now Figure 5) is from theory which uses parameters of the A6B6 system in simulation. We have added the following sentences to clarify:

      “We compare the measured FRAP recovery time for the small droplet (green circle) to theoretical predictions from Equation (6) (gray) and Equations (1) - (4) (black) in Figure 5A. (Lines 255-257)”

      “Figure 5. FRAP recovery patterns for large versus small droplets can be notably different for condensates with a sufficiently large interface resistance. (A) Expected relaxation time as a function of droplet radius for in silico “FRAP experiments” on the A6B6 system. The interface resistance dominates recovery times for smaller droplets, whereas dense-phase diffusion dominates recovery times for larger droplets. Green circle: FRAP recovery time obtained from direct simulation of an A6B6 droplet of radius 37 nm. Black curve: the recovery time as a function of droplet radius from a single exponential fit of the exact solution of the recovery curve from Equations (1) - (4). Gray curve: the recovery time predicted by Equation (6). Yellow, blue, and red curves: the recovery time when dense-phase, dilute-phase, and interface flux limit the exchange dynamics, i.e., the first, second, and last term in Equation (6), respectively. Parameters matched to the simulated A6B6 system in the slab geometry: (B) Time courses of fluorescence profiles for A6B6 droplets of radius  (top) and  (bottom); red is fully bleached, green is fully recovered. These concentration profiles are the numerical solutions of Equations (1) - (3) using the parameters in (A). (Below Figure 5)”

    1. Author response:

      We thank the reviewers for their insightful comments on our model and manuscript. In this provisional response, we would like to comment on some of the issues raised and how we plan to address them.

      First, the reviewers correctly pointed out that only a small part of the full model was openly available. We have now rectified this and the full model is available at: https://dataverse.harvard.edu/dataverse/sscx.

      Next, we would like to comment on the perceived lack of clarity of certain descriptions in the manuscript. We note that individual techniques and parts of the model have been developed, justified, and validated in previous publications. This left us with the question of how much of the contents of those papers we should re-describe. Too much, and the manuscript becomes overly long; too little, and the reader cannot gain a sufficient understanding of the model building process. The reviewers' comments made it clear that some aspects of the model should be described in more detail and we plan to address this in a revision. Crucially, one missing item raised by all reviewers was a comparison of local connection probabilities to the literature. This will be provided in the revision. Additionally, the reviewers questioned our decision to use a connectivity algorithm that is not based on direct parameterization of target connection probabilities. While this is a limitation of the algorithm we employed, it also has unique strengths, providing non-random aspects of connectivity that have been proven to be impossible to model with algorithms that enforce given connection probabilities or degree distributions. We plan to explain this better in a revision.

      We will also comment on the challenges associated with the interpretation of experimentally measured connection probabilities and employing them for the parameterization of a biophysically detailed model spanning millimeters.

      The reviewers also suggested several aspects of the model that could be improved. Whilst we see merit with all of them, we would like to briefly comment on model completeness in general. First, this model - and any model - can probably never be considered complete. Instead, the model has to be continuously refined, which one reviewer phrased as the "live nature" of the model. However, to demonstrate the model's utility and justify the expense of modeling, we also have to use the model in projects that explore specific scientific questions. To undertake and complete such a project, one must select and "freeze" a given version of the model-- otherwise the project will never conclude. Further, we believe that it is advantageous if several projects use the same version of the model. In that case, a reader who is already familiar with the model from one paper may find it easier to understand other papers using the same model. The goal of this manuscript is to describe the version of the model that we used in several ongoing and concluded follow-up projects, including its limitations and opportunities for refinement. As such, we do not plan to add further improvements to the model for this reviewed pre-print. We will, however, continue to refine the model outside of the scope of this publication. Since we believe the development and bottom up models are best done in a community driven manner, we encourage interested parties to participate.

      We invite anyone with ideas of how the model could be refined to contact us to discuss how we could integrate these changes into the model together using our tools.

    1. Author response:

      eLife assessment

      This important study reports numerous attempts to replicate reports on transgenerational inheritance of a learned behavior, pathogen avoidance, in C. elegans. While the authors observe parental effects that are limited to a single generation (also called intergenerational inheritance), the authors failed to find any evidence for transmission over multiple generations, or transgenerational inheritance. The experiments presented are meticulously described, making for compelling evidence that in the authors' hands transgenerational inheritance cannot be observed, although there remains the possibility that subtle differences in culture conditions or lab environment explain the failure to reproduce previous observations. Given the prominence of the original reports of transgenerational inheritance, the present study is of broad interest to anyone studying genetics, epigenetics, or learned behavior.

      Thank you for your considered reviews and advice on how to improve our manuscript. We appreciate that the editors and reviewers felt that our manuscript addressed an important issue and acknowledged the difficulty of publishing negative results. We will revise the manuscript and consider all the concerns raised by the editor and referees.

      Public Reviews:

      Reviewer #1 (Public Review):

      Summary:

      The authors report an inability to reproduce a transgenerational memory of avoidance of the pathogen PA14 in C. elegans. Instead, the authors demonstrate intergenerational inheritance for a single F1 generation, in embryos of mothers exposed to OP50 and PA14, where embryos isolated from these mothers by bleaching are capable of remembering to avoid PA14 in a manner that is dependent on systemic RNAi proteins sid-1 and sid-2. This could reflect systemic sRNAs generated by neuronal daf-7 signaling that are transmitted to F1 embryos. The authors note that transgenerational memory of PA14 was reported by the Murphy group at Princeton, but that environmental or strain variation (worms or bacteria) might explain the single generation of inheritance observed at Harvard. The Hunter group tried different bacterial growth conditions and different worm growth temperatures for independent PA14 strains, which they showed to be strongly pathogenic. However, the authors could not reproduce a transgenerational effect at Harvard. This important data will allow members of the scientific community to focus on the robust and reproducible inheritance of PA14 avoidance transmitted to F1 embryos of mothers exposed to PA14, which the authors demonstrate depends on small RNAs in a manner that is downstream of or in parallel to daf-7. This paper honestly and importantly alters expectations and questions the model that avoidance of PA14 is mediated by a bacterial ncRNA whose siRNAs target a C. elegans gene. Instead, endogenous C. elegans sRNAs that affect pathogen response may be the culprit that explains sRNA-mediated avoidance.

      Overall, this is an important paper that demonstrates that one model for transgenerational inheritance in C. elegans is not reproducible. This is important because it is not clear how many of the reported models of transgenerational inheritance reported in C. elegans are reproducible. The authors do demonstrate a memory for F1 embryos that could be a maternal effect, and the authors confirm that this is mediated by a systemic small RNA response. There are several points in the manuscript where a more positive tone might be helpful.

      We would like to correct the statement made in the second to last sentence. The demonstration of an F1 response to PA14 was first reported by Moore et al., (2019) and then by Pereira et al., (2020) using a different behavioral assay. We merely confirmed these results in our hands, and confirmed the observation, first reported by Kaletsky et al., (2020), that sid-1 and sid-2 are required for this F1 response; although we did find that sid-1 and sid-2 are not required for the PA14-induced increase in daf-7p::gfp expression in ASI neurons in the F1 progeny of trained adults, which had not been addressed in the published work.

      Yes, the intergenerational F1 response could be a maternal effect, but the in utero F1 embryos and their precursor germ cells were directly exposed to PA14 metabolites and toxins (non-maternal effect) as well as any parental response, whether mediated by small RNAs, prions,  hormones, or other unknown information carriers. While the F1 aversion response does require sid-1 and sid-2, we would not presume that the substrate is therefore an RNA molecule, particularly because the systemic RNAi response supported by sid-1 and sid-2 is via long double-stranded RNA. To date, no evidence suggests that either protein transports small RNAs, particularly single-stranded RNAs. 

      Strengths:

      The authors note that the high copy number daf-7::GFP transgene used by the Murphy group displayed variable expression and evidence for somatic silencing or transgene breakdown in the Hunter lab, as confirmed by the Murphy group. The authors nicely use single copy daf-7::GFP to show that neuronal daf-7::GFP is elevated in F1 but not F2 progeny with regards to the memory of PA14 avoidance, speaking to an intergenerational phenotype.

      The authors nicely confirm that sid-1 and sid-2 are generally required for intergenerational avoidance of F1 embryos of moms exposed to PA14. However, these small RNA proteins did not affect daf-7::GFP elevation in the F1 progeny. This result is unexpected given previous reports that single copy daf-7::GFP is not elevated in F1 progeny of sid mutants. Because the Murphy group reported that daf-7 mutation abolishes avoidance for F1 progeny, this means that the sid genes function downstream of daf-7 or in parallel, rather than upstream as previously suggested.

      The authors studied antisense small RNAs that change in Murphy data sets, identifying 116 mRNAs that might be regulated by sRNAs in response to PA14. Importantly, the authors show that the maco-1 gene, putatively targeted by piRNAs according to the Kaletsky 2020 paper, displays few siRNAs that change in response to PA14. The authors conclude that the P11 ncRNA of PA14, which was proposed to promote interkingdom RNA communication by the Murphy group, is unlikely to affect maco-1 expression by generating sRNAs that target maco-1 in C. elegans. The authors define 8 genes based on their analysis of sRNAs and mRNAs that might promote resistance to PA14, but they do not further characterize these genes' role in pathogen avoidance. The Murphy group might wish to consider following up on these genes and their possible relationship with P11.

      Weaknesses:

      This very thorough and interesting manuscript is at times pugnacious.

      We reiterate that we never claimed that Moore et al., (2019) did not obtain their reported results. We simply stated that we could not replicate their results using the published methods and then failed in our search to identify variable(s) that might account for our results. We will do better when revising the manuscript to make clear, unmuddied statements of facts and state that future investigations may provide independent evidence that supports the original claims and explains our divergent results.

      Please explain more clearly what is High Growth media for E. coli in the text and methods, conveying why it was used by the Murphy lab, and if Normal Growth or High Growth is better for intergenerational heritability assays.

      We used the standard recipes as described in Moore et al., (2021), and will include the recipes and some of the relevant commentary from the paragraphs below to the methods and text as appropriate. 

      Normal Growth (NG) media minimally supports OP50 growth, resulting in a thin lawn that minimally obscures viewing larvae and embryos. High Growth (HG) media contains 8X more peptone, which supports much higher OP50 growth, resulting in a thick bacterial lawn that supports larger worm populations. The thicker bacterial lawn can also compromise agar integrity, and the higher worm density encourages worm burrowing behavior, thus the HG plates also have 75% more agar to inhibit worm burrowing. 

      Our results (Figure 4) show that worms grown on OP50 seeded NG or HG plates show different choice responses (PA14 vs OP50). As for experimental “advice”, we would caution our colleagues to not assume that OP50 is a neutral food and to be aware that how you grow and store OP50 (or any bacterial culture that is to be used as food for worms) may have a significant effect on the phenotype you are studying. 

      Reviewer #2 (Public Review):

      This paper examines the reproducibility of results reported by the Murphy lab regarding transgenerational inheritance of a learned avoidance behavior in C. elegans. It has been well established by multiple labs that worms can learn to avoid the pathogen pseudomonas aeruginosa (PA14) after a single exposure. The Murphy lab has reported that learned avoidance is transmittable to 4 generations and dependent on a small RNA expressed by PA14 that elicits the transgenerational silencing of a gene in C. elegans. The Hunter lab now reports that although they can reproduce inheritance of the learned behavior by the first generation (F1), they cannot reproduce inheritance in subsequent generations.

      This is an important study that will be useful for the community. Although they fail to identify a "smoking gun", the study examines several possible sources for the discrepancy, and their findings will be useful to others interested in using these assays. The preference assay appears to work in their hands in as much as they are able to detect the learned behavior in the P0 and F1 generations, suggesting that the failure to reproduce the transgenerational effect is not due to trivial mistakes in the protocol. An obvious reason, however, to account for the differing results is that the culture conditions used by the authors are not permissive for the expression of the small RNA by PA14 that the MUrphy lab identified as required for transgenerational inheritance. It would seem prudent for the authors to determine whether this small RNA is present in their cultures, or at least acknowledge this possibility.

      We note that Kaletsky et al., (2020) (Figure 3L) showed that PA14 ΔP11 bacteria failed to induce an F1 avoidance response. Thus, the fact that we observed F1 avoidance implies that our culture conditions successfully induced P11 expression. We believe that this addresses the concern raised here. We thank the reviewer for raising this issue and we will add a statement to this effect in the revised manuscript.

      The authors should also note that their protocol was significantly different from the Murphy protocol (see comments below) and therefore it remains possible that protocol differences cumulatively account for the different results.

      We disagree. Our adjustments to the core protocol were minor and, where possible, were explicitly tested in side-by-side experiments. To discover the source(s) of discrepancy between our results and the published results we subsequently introduced variations to this core protocol to exclude likely variables (worm and bacteria growth temperatures, assay conditions, worm handling methods, bacterial culture and storage conditions, and some minor developmental timing issues). To substantiate these assertions, we will, upon revision, add the precise protocol we followed for the aversion assay to the supplemental documents, provide some additional experimental results supporting these claims, and further clarify which presented experiments included protocol variations (e.g. sodium azide or cold immobilization). It remains possible that we misunderstood the published protocol, but we were highly motivated to replicate the results and read every published version with extreme care.

      Reviewer #3 (Public Review):

      Summary:

      It has been previously reported in many high-profile papers, that C. elegans can learn to avoid pathogens. Moreover, this learned pathogen avoidance can be passed on to future generations - up to the F5 generation in some reports. In this paper, Gainey et al. set out to replicate these findings. They successfully replicated pathogen avoidance in the exposed animals, as well as a strong increase in daf-7 expression in ASI neurons in F1 animals, as determined by a daf-7::GFP reporter construct. However, they failed to see strong evidence for pathogen avoidance or daf-7 overexpression in the F2 generation. The failure of replication is the major focus of this work.

      Given their failure to replicate these findings, the authors embark on a thorough test of various experimental confounders that may have impacted their results. They also re-analyze the small RNA sequencing and mRNA sequencing data from one of the previously published papers and draw some new conclusions, extending this analysis.

      Strengths:

      (1) The authors provide a thorough description of their methods, and a marked-up version of a published protocol that describes how they adapted the protocol to their lab conditions. It should be easy to replicate the experiments.

      (2) The authors test the source of bacteria, growth temperature (of both C. elegans and bacteria), and light/dark husbandry conditions. They also supply all their raw data, so that the sample size for each testing plate can be easily seen (in the supplementary data). None of these variations appears to have a measurable effect on pathogen avoidance in the F2 generation, with all but one of the experiments failing to exhibit learned pathogen avoidance.

      (3) The small RNA seq and mRNA seq analysis is well performed and extends the results shown in the original paper. The original paper did not give many details of the small RNA analysis, which was an oversight. Although not a major focus of this paper, it is a worthwhile extension of the previous work.

      (4) It is rare that negative results such as these are accessible. Although the authors were unable to determine the reason that their results differ from those previously published, it is important to document these attempts in detail, as has been done here. Behavioral assays are notoriously difficult to perform and public discourse around these attempts may give clarity to the difficulties faced by a controversial field.

      Thank you for your support. Choosing to pursue publication of these negative results was not an easy decision, and we thank members of the community for their support and encouragement.

      Weaknesses:

      (1) Although the "standard" conditions have been tested over multiple biological replicates, many of the potential confounders that may have altered the results have been tested only once or twice. For example, changing the incubation temperature to 25{degree sign}C was tested in only two biological replicates (Exp 5.1 and 5.2) - and one of these experiments actually resulted in apparent pathogen avoidance inheritance in the F2 generation (but not in the F1). An alternative pathogen source was tested in only one biological replicate (Exp 3). Given the variability observed in the F2 generation, increasing biological replicates would have added to the strengths of the report.

      We agree that our study was not exhaustive in our exploration of variables that might be interfering with our ability to detect F2 avoidance. We also note that some of these variables also failed (with many more independent experiments) to induce elevated daf-7p::gfp expression in ASI neurons in F2 progeny. Our goal was not to show that variation in some growth or assay condition would generate reproducible negative results, the exploration was designed to tweak conditions to enable detection of a robust F2 response. Given the strength of the data presented in Moore et al., (2019) we expected that adjustment of the problematic variable would produce positive results apparent in a single replicate, which could then be followed up. If we had succeeded, then we would have documented the conditions that enabled robust F2 inheritance and would have explored molecular mechanisms that support this important but mysterious process.

      (2) A key difference between the methods used here and those published previously, is an increase in the age of the animals used for training - from mostly L4 to mostly young adults. I was unable to find a clear example of an experiment when these two conditions were compared, although the authors state that it made no difference to their results.

      We can state firmly that the apparent time delay did not affect P0 learned avoidance or, as documented in Table S1, daf-7p::gfp expression in ASI neurons. In our experience, training mostly L4’s on PA14 frequently failed to produce sufficient F1 embryos for both F1 avoidance assays or daf-7p::gfp measurements in ASI neurons and collection of F2 progeny. Indeed, in early attempts to detect heritable PA14 aversion, trained P0 and F1 progeny were not assayed in order to obtain sufficient F2’s for a choice assay. These animals failed to display aversion, but without evidence of successful P0 training or an F1 intergenerational response this was deemed a non-fruitful trouble-shooting approach. We will add to our supplemental figures P0 choice results from experiments using younger trained animals that failed to produce sufficient F1’s to continue the inheritance experiments. 

      The different timing between the two protocols may reflect the age of the recovered bleached P0 embryos. It is reasonable to assume that bleaching day 1 adults vs day 2 adults from the P-1 population could shift the average age of recovered P0 embryos by several hours. The Murphy protocol only states that P0 embryos were obtained by bleaching healthy adults. Regardless, if the hypothesis entertained here is true, that a several hour difference in larval/adult age during 24 hours of training affects F2 inheritance of learned aversion but does not affect P0 learned avoidance, then we would argue that this paradigm for heritable learned avoidance, as described in Moore et al, (2019, 2021), is not sufficiently robust for mechanistic investigations. 

      (3) The original paper reports a transgenerational avoidance effect up to the F5 generation. Although in this work the authors failed to see avoidance in the F2 generation, it would have been prudent to extend their tests for more generations in at least a couple of their experiments to ensure that the F2 generation was not an aberration (although this reviewer acknowledges that this seems unlikely to be the case).

      Citations

      Moore, R.S., Kaletsky, R., and Murphy, C.T. (2019). Piwi/PRG-1 Argonaute and TGF-beta Mediate Transgenerational Learned Pathogenic Avoidance. Cell 177, 1827-1841 e1812.

      Pereira, A.G., Gracida, X., Kagias, K., and Zhang, Y. (2020). C. elegans aversive olfactory learning generates diverse intergenerational effects. J Neurogenet 34, 378-388.

      Kaletsky, R., Moore, R.S., Vrla, G.D., Parsons, L.R., Gitai, Z., and Murphy, C.T. (2020). C. elegans interprets bacterial non-coding RNAs to learn pathogenic avoidance. Nature 586, 445-451.

      Moore, R.S., Kaletsky, R., and Murphy, C.T. (2021). Protocol for transgenerational learned pathogen avoidance behavior assays in Caenorhabditis elegans. STAR Protoc 2, 100384.

    1. Author response:

      We appreciate the time and effort that you and the reviewers have dedicated to providing valuable feedback on our manuscript. We are grateful to the reviewers for their insightful comments.

      Reviewer #1:<br /> We thank the reviewer for the positive comments made on our manuscript.

      Reviewer #2:<br /> We thank the reviewer for these positive remarks.

      Concerning the main weakness highlighted by the reviewer:

      We presented results in our submitted work both without noise and with a signal-to-noise ratio (SNR) equal to 50. Figure 5 shows exemplar posterior distributions obtained in a noise-free scenario, and Table 1 reports the number of degeneracies for each model on 10000 noise-free simulations. These results highlight that the presence of degeneracies is inherent to the model definition. Figures 3, 6 and 7 present results considering an SNR of 50. Results with lower SNR have indeed not been included into this work. We agree that adding a figure showing the impact of noise on the posterior distributions will be a good addition to this work. We will include an additional figure in the second version, as interestingly suggested.

    1. Author response:

      Reviewer #1 (Recommendations For The Authors):

      (1) Figure 3B was not cited in the manuscript.

      We have now included the citation for Figure 3B in the main text: “….whereas NSP13-R567A (lost ATP consumption) and NSP13-K345A/K347A (obstructed the nucleic acid binding channel) failed to inhibit YAP activity (Figure 3B).” (Please see the revised manuscript) 

      Reviewer #2 (Recommendations For The Authors):

      (2) In Figure 1, ciliated cells are marked as a separate cluster from "epithelial cells". Since ciliated cells are epithelial cells, I suggest changing the nomenclature of the clusters.

      We have updated the label from “Ciliated” to “Ciliated Epithelial” in Figure 1A, as suggested. (Please see the revised manuscript)

      (3) Outlines of planned revisions: 1) Reanalyze snRNA-seq and bulk RNA-seq data from Figure 1 to investigate YAP target genes related to innate immune response; 2) Employ ChIP-seq to determine whether NSP13 WT or mutants (K131, K345/K347, and R567) prevent YAP/TEAD complex from binding to DNA by occupying the TEAD DNA binding site, providing insights into the mechanism; 3) Validate NSP13 interacting proteins using Immunoprecipitation-Western Blot (IP-WB) assays based on mass spectrum results; 4) Perform bulk RNA sequencing in cells with or without NSP13 expression to assess endogenous YAP target genes expression.

    1. Author response:

      The following is the authors’ response to the current reviews.

      Reviewer #1 (Public Review):

      Overall the authors provide a very limited data set and in fact only a proof of concept that their sensor can be applied in vivo. This is not really a research paper, but a technical note. With respect to their observation of clustered activity, they now provide an overview image, next to zoomed details. However, from these images one cannot conclude 'by eye' any clustering event. This aligns with the very low r values. All neurons in the field show variable activity and a clustering is not really evident from these examples. Even within a cluster, there is variability. The authors now confirm that expression levels are indeed variable but are independent from the ratio measurements. Further, they controlled for specificity by including DAPT treatments, but opposite to their own in vitro data (in primary neurons) the ratios increased. The authors argue that both distance and orientation can either decrease or increase ratios and that the use of this biosensor should be explored model-by-model. This doesn't really confer high confidence and may hinder other groups in using this sensor reliably.

      Secondly, there is still no physiological relevance for this observation. The experiments are performed in wild-type mice, but it would be more relevant to compare this with a fadPSEN1 KI or a PSEN1cKO model to investigate the contribution of a gain of toxic function or LOF to the claimed cell non-autonomous activations. The authors acknowledge this shortcoming but argue that this is for a follow-up study.

      For instance, they only monitor activity in cell bodies, and miss all info on g-sec activity in neurites and synapses: what is the relevance of the cell body associated g-sec and can it be used as a proxy for neuronal g-sec activity? If cells 'communicate' g-sec activities, I would expect to see hot spots of activity at synapses between neurons.

      Without some more validation and physiologically relevant studies, it remains a single observation and rather a technical note paper, instead of a true research paper.

      The effect size was small, as stated in the original and revised manuscripts and the point-by-point responses to the 1st round review. Such subtle effects will likely be challenging to detect by eye. However, our unbiased quantification allowed us to detect a statistically significant linear correlation between the 720/670 ratio in each neuron and the average ratio in neighboring neurons, which we have verified using many different approaches (Figure 3, Figure 3—figure supplement 2, and Figure 4), and the correlation was canceled by the administration of g-secretase inhibitor (Figure 5). Such objective analysis made us more confident to conclude that g-secretase affects g-secretase in neighboring neurons.

      We would also like to make clear the design of the C99 720-670 biosensor. Both C99, the sensing domain that is cleaved by g-secretase, and the anchoring domain fused to miRFP670 are integrated into the membrane (Figure 1A). Therefore, how these two domains with four transmembrane regions are embedded in the membrane should affect the orientation between the donor, miRFP670, and the acceptor, miRFP720. As noted in our point-by-point responses to the initial review, we have previously validated that pharmacological inhibition of g-secretase significantly increases the FRET ratio in various cell lines, including CHO, MEF, BV2 cells, and mouse cortical primary neurons (Maesako et al., 2020; Houser et al., 2020, and unpublished observations). On the other hand, FRET reduction by g-secretase inhibition was found in mouse primary neurons derived from the cerebellum (unpublished observations) as well as the somatosensory cortex neurons in vivo (this study). While we could not use the exact same imaging set-up between cortical primary neurons in vitro and those in vivo due to different expression levels of the biosensor, we could do it for in vitro cortical primary neurons vs. in vitro cerebellum neurons. We found by the direct comparison that 720/670 ratios are significantly higher in the cerebellum than the cortex neurons even in the presence of 1 mM DAPT (Author response image 1), a concentration that nearly completely inhibits g-secretase activity. This suggests a different integration and stabilization pattern of the sensing and anchoring domains in the C99 720-670 biosensor between the cortex and cerebellum primary neurons, and thus, orientation between the donor and acceptor varies in the two neuronal types. We expect a similar scenario between cortical primary neurons in vitro and those in vivo. Of note, we have recently demonstrated that the cortex and cerebellum primary neurons exhibit distinct membrane properties (Lundin and Wieckiewicz et al., 2024 in revision), suggesting the different baseline FRET could be related to the different membrane properties between the cortex and cerebellum primary neurons. On the other hand, this raises a concern that 720/670 ratios can be affected not only by g-secretase activity but also by other cofounders, such as altered membrane properties. However, a small but significant correlation between the 720/670 ratio in a neuron and those ratios in its neighboring neurons is canceled by g-secretase inhibitor (Figure 5), suggesting that the correlation between the 720/670 ratio in a neuron and those in its neighboring neurons is most likely dependent on g-secretase activity. Taken together, we currently think orientation plays a significant role in our biosensor and would like to emphasize the importance of ensuring on a model-by-model basis whether the cleavage of the C99 720-670 biosensor by g-secretase increases or decreases 720/670 FRET ratios.

      Author response image 1.

      Furthermore, we co-expressed the C99 720-670 biosensor and visible range fluorescence reporters to record other biological events, such as changes in ion concentration, in cortex primary neurons. Interestingly, several biological events uniquely detected in the neurons with higher 720/670 ratios, which are expected to exhibit lower endogenous g-secretase activity, are recapitulated by pharmacological inhibition of g-secretase (unpublished observations), ensuring that higher 720/670 ratios are indicative of lower g-secretase activity in mouse cortex primary neurons. Such multiplexed imaging will help to further elucidate how the C99 720-670 biosensor behaves in response to the modulation of g-secretase activity.

      Lastly, the scope of this study was to develop and validate a novel imaging assay employing a NIR FRET biosensor to measure g-secretase activity on a cell-by-cell basis in live wild-type mouse brains. However, we do appreciate the reviewer’s suggestion and think employing this new platform in FAD PSEN1 knock-in (KI) or PSEN1 conditional knockout (cKO) mice would provide valuable information. Furthermore, we are keen to expand our capability to monitor g-secretase with subcellular resolution in live mouse brains in vivo, which we will explore in follow-up studies. Thank you for your thoughtful suggestions.

      Reference

      - Maesako M, Sekula NM, Aristarkhova A, Feschenko P, Anderson LC, Berezovska O. Visualization of PS/γ-Secretase Activity in Living Cells. iScience. 2020 Jun 26;23(6):101139.

      - Houser MC, Hou SS, Perrin F, Turchyna Y, Bacskai BJ, Berezovska O, Maesako M. A Novel NIR-FRET Biosensor for Reporting PS/γ-Secretase Activity in Live Cells. Sensors (Basel). 2020 Oct 22;20(21):5980.

      - Lundin B, Wieckiewicz N, Dickson JR, Sobolewski RGR, Sadek M, Armagan G, Perrin F, Hyman BT, Berezovska O, and Maesako M. APP is a regulator of endo-lysosomal membrane permeability. 2024 in revision

      Reviewer #2 (Public Review):

      Regarding the variability and spatial correlation- the dynamic range of the sensor previously reported in vitro is in the range of 20-30% change (Houser et al 2020) whereas the range of FR detected in vivo is between cells is significantly larger in this MS. This raises considerable doubts for specific detection of cellular activity.

      One direct way to test the dynamic range of the sensor in vivo, is to increase or decrease endogenous gamma-secretase activity and to ensure this experimental design allows to accurately monitor gamma-secretase activity. In the previous characterization of the reporter (Hauser et al 2020), DAPT application and inhibition of gamma-secretase activity results in increased FR (Figures 2 and 3 of Houser et al). This is in agreement with the design of the biosensor, since FR should be inversely correlated with enzymatic activity. Here, the authors repeated the experiment, and surprisingly found an opposite effect, in which DAPT significantly reduced FR.

      The authors maintain that this result could be due to differences in cell-types, However, this experiment was previously performed in cultures cortical neurons and many different cell types, as noted by the authors in their rebuttal.

      Instead, I would argue that these results further highlight the concerns of using FR in vivo, since based on their own data, there is no way to interpret this quantification. If DAPT reduces FR, does this mean we should now interpret the results of higher FR corresponds to higher g-sec activity? Given a number of papers from the authors claiming otherwise, I do not understand how one can interpret the results as indicating a cell-specific effect.

      In conclusion, without any ground truth, it is impossible to assess and interpret what FR measurements of this sensor in vivo mean. Therefore, the use of this approach as a way to study g-sec activity in vivo seems premature.

      Please find our response to reviewer 1’s similar critique above. Here, we again would like to re-clarify the design of our C99 720-670 biosensor. The orientation between the donor, miRFP670, and acceptor, miRFP720, is dependent on how C99, the sensing domain that is cleaved by g-secretase, and the anchoring domain are integrated into the membrane (Figure 1A). Although it was surprising to us, it is possible that g-secretase inhibition decreases 720/670 ratios if 1) the donor-acceptor orientation plays a significant role in FRET and 2) the baseline structure of the C99 720-670 biosensor is different between cell types. This appears to be the case between the cortex and cerebellum primary neurons (i.e., DAPT increases 720/670 ratios in the cortex neurons while decreasing in the cerebellum neurons), and we expect it in cortical neurons in vitro vs. in vivo as well. Hence, we recommend that users first validate whether the cleavage of the C99 720-670 biosensor by g-secretase increases or decreases 720/670 FRET ratios in their models. If DAPT increases 720/670 ratios (like in cortex primary neurons, CHO, MEF, and BV2 cells that we have validated), the results of higher ratios should be interpreted as lower g-secretase activity. If DAPT reduces 720/670 ratios (like in cerebellum primary neurons and the somatosensory cortex neurons in vivo), we should interpret the results of higher ratios corresponding to higher g-secretase activity. From a biosensing perspective, although we need to know which is the case on a model-by-model basis, we think whether g-secretase activity increases or decreases the 720/670 ratio is not critical; rather, if it can significantly change FRET efficiency is more important. Thank you for your critical comments.

      Reviewer #3 (Public Review):

      This paper builds on the authors' original development of a near infrared (NIR) FRET sensor by reporting in vivo real-time measurements for gamma-secretase activity in the mouse cortex. The in vivo application of the sensor using state-of-the-art techniques is supported by a clear description and straightforward data, and the project represents significant progress because so few biosensors work in vivo. Notably, the NIR biosensor is detectable to ~ 100 µm depth in the cortex. A minor limitation is that this sensor has a relatively modest ΔF as reported in Houser et al, which is an additional challenge for its use in vivo. Thus, the data is fully dependent on post-capture processing and computational analyses. This can unintentionally introduce biases but is not an insurmountable issue with the proper controls that the authors have performed here.

      The following opportunity for improving the system didn't initially present itself until the authors performed an important test of the FRET sensor in vivo following DAPT treatment. The authors get credit for diligently reporting the unexpected decrease in 720/670 FRET ratio. In turn this has led to a suggestion that this sensor would benefit from a control that is insensitive to gamma-secretase activity. FRET influences that are independent of gamma-secretase activity could be distinguished by this control.

      From previous results in cultured neurons, the authors expected an increase in FRET following DAPT treatment in vivo. These expectations fit with the sensor's mode-of-action because a block of gamma-secretase activity should retain the fluorophores in proximity. When the authors observed decreased FRET, the conclusion was that the sensor performs differently in different cellular contexts. However, a major concern is that mechanistically it is unclear how this could occur with this type of sensor. The relative orientation of fluorophores indeed can contribute to FRET efficiency in tension-based sensors. However, the proteolysis expected with gamma-secretase activity would release tension and orientation constraints. Thus, the major contributing FRET factor is expected to be distance, not orientation. Alternative possibilities that could inadvertently affect readouts include an additional DAPT target in vivo sequestering the inhibitor, secondary pH effects on FRET, photo-bleaching, or an unidentified fluorophore quencher in vivo stimulated by DAPT. Ultimately this new FRET sensor would benefit from a control that is insensitive to gamma-secretase activity. FRET influences that are independent of gamma-secretase activity could be distinguished by this control.

      Given that the anchoring domain is composed of three transmembrane regions and the linker connecting the donor, miRFP670, and the acceptor, miRFP720, is highly flexibility, we are still not sure if the orientation constraint of the C99 720-670 biosensor is canceled by g-secretase cleavage. This means that the orientation between the donor and acceptor in the cleaved form of the sensor can be different between model and model. As explained in response to the similar critique of reviewer 1, we found that the 720/670 ratio is significantly higher in the cerebellum than in the cortex neurons even in the presence of DAPT (Figure 1 for the review only). Therefore, we currently think the donor-acceptor orientation, both in the cleaved and non-cleaved forms of the sensor, plays a role in determining whether g-secretase activity increases or decreases the 720/670 ratio (but this view may change depends on the future discoveries).

      As the reviewer pointed out, the NIR g-secretase biosensor with no biological activity is important; however, a point mutation in the transmembrane region of the C99 sensing domain could also result in altered orientation between the donor, miRFP670, and the acceptor, miRFP720, since C99 is connected to the acceptor, which may bring additional complexity. Also, as noted in our point-by-point responses to the initial review, the mutation(s) that can fully block C99 processing by g-secretase has not been established. Therefore, we asked if a subtle but significant correlation we found between the 720/670 ratio in a neuron and those ratios in its neighboring neurons is canceled by g-secretase inhibitor administration. Since the correlation was abolished (Figure 5), it suggests that the correlation between the 720/670 ratio in a neuron and those ratios in the neighboring neurons depends on g-secretase activity.

      It is not fully established how g-secretase activity is spatiotemporally regulated; therefore, the development of more appropriate control biosensors and further validation of our findings with complementary approaches would be crucial in our follow-up studies. Thank you for your valuable comments.


      The following is the authors’ response to the original reviews.

      Reviewer #1 (Public Review):

      (1) Overall the authors provide a very limited data set and in fact only a proof of concept that their sensor can be applied in vivo. This is not really a research paper, but a technical note. With respect to their observation of clustered activity, the images do not convince me as they show only limited areas of interest: from these examples (for instance fig 5) one sees that merely all neurons in the field show variable activity and a clustering is not really evident from these examples. Even within a cluster, there is variability. With r values between 0.23 to .36, the correlation is not that striking. The authors herein do not control for expression levels of the sensor: for instance, can they show that in all neurons in the field, the sensor is equally expressed, but FRET activity is correlated in sets of neurons? Or are the FRET activities that are measured only in positively transduced neurons, while neighboring neurons are not expressing the sensor? Without such validation, it is difficult to make this conclusion.

      We appreciate the reviewer’s comment. We agree with the reviewer that this study is not testing a new hypothesis but rather developing and validating a novel tool. However, we do believe such a “technical note” is as important as a “research paper” since advancing technique(s) is the only way to break the barrier in our understanding of complex biological events. Therefore, this study aimed to develop and validate a novel imaging assay employing a recently engineered NIR FRET biosensor to measure γ-secretase activity (Houser et al., 2020) on a cell-by-cell basis in live mouse brains, enabling us for the first time to examine how γ-secretase activity is regulated in individual neurons in vivo, and uncover that γ-secretase activity may influence γ-secretase in neighboring neurons. Like the reviewer, we found that the cell-to-cell correlation is not that striking, as we clearly stated in the original manuscript: “Although the effect size is modest, we also found a statistically significant correlation between…” 

      We were also aware that there is variability in a cluster of neurons exhibiting similar γ-secretase activities. Per the reviewer’s request, the images have been expanded to the entire imaging field of view (new Figure 3A). Although the effect size is small, our unbiased quantification showed a statistically significant linear correlation between the 720/670 ratio in each neuron and the average ratio in five neighboring neurons (Figure 3, Figure 3—figure supplement 2, and Figure 4), and the correlation was canceled by the administration of γ-secretase inhibitor (Figure 5). These findings made it impossible to conclude that γ-secretase does not affect γ-secretase in neighboring neurons.

      Regarding the expression levels and pattern of the sensor, an AAV-based gene delivery approach employed in this study results in the expression of the sensor not in all but in selected neurons. We have newly performed immunohistochemistry, showing that approximately 40% of NeuN-positive neurons express the C99 720-670 biosensor (new Figure 1—figure supplement 2A and 2B).

      Reference

      - Houser MC, Hou SS, Perrin F, Turchyna Y, Bacskai BJ, Berezovska O, Maesako M. A Novel NIRFRET Biosensor for Reporting PS/γ-Secretase Activity in Live Cells. Sensors (Basel). 2020 Oct 22;20(21):5980. 

      (2) Secondly, I am lacking some more physiological relevance for this observation. The experiments are performed in wild-type mice, but it would be more relevant to compare this with a fadPSEN1 KI or a PSEN1cKO model to investigate the contribution of a gain of toxic function or LOF to the claimed cell non-autonomous activations. Or what would be the outcome if the sensor was targeted to glial cells?

      The AAV vector in this study encodes the human synapsin promoter and our new immunohistochemistry demonstrates that nearly 100% of the cells expressing the C99 720-670 sensor are NeuN positive, and we hardly detected the sensor expression in Iba-1 or GFAP-positive cells (new Figure 1— figure supplement 2A and 2C). 

      The mechanism underlying the cell non-autonomous regulation of γ-secretase remains unclear. As discussed in our manuscript, one of the potential hypotheses could be that secreted abeta42 plays a role (Zoltowska et al., 2023 eLife). Whereas this report focuses on the development and validation of a novel assay using wildtype mice, future follow-up studies employing FAD PSEN1 knock-in (KI) and PSEN1 conditional knockout (cKO) mice would allow us test the hypothesis above since abeta42 is known to increase in some FAD PSEN1 KI mice (Siman et al., 2000 J Neurosci, Vidal et al., 2012 FASEB J) while decreases in PSEN1 cKO mice (Yu et al., 2001 Neuron).  

      Reference

      - Siman R, Reaume AG, Savage MJ, Trusko S, Lin YG, Scott RW, Flood DG. Presenilin-1 P264L knockin mutation: differential effects on abeta production, amyloid deposition, and neuronal vulnerability. J Neurosci. 2000 Dec 1;20(23):8717-26. 

      - Vidal R, Sammeta N, Garringer HJ, Sambamurti K, Miravalle L, Lamb BT, Ghetti B. The Psen1-L166Pknock-in mutation leads to amyloid deposition in human wild-type amyloid precursor protein YAC transgenic mice. FASEB J. 2012 Jul;26(7):2899-910. 

      - Yu H, Saura CA, Choi SY, Sun LD, Yang X, Handler M, Kawarabayashi T, Younkin L, Fedeles B, Wilson MA, Younkin S, Kandel ER, Kirkwood A, Shen J. APP processing and synaptic plasticity in presenilin-1 conditional knockout mice. Neuron. 2001 Sep 13;31(5):713-26. 

      - Zoltowska KM, Das U, Lismont S, Enzlein T, Maesako M, Houser MC, Franco ML, Moreira DG, Karachentsev D, Becker A, Hopf C, Vilar M, Berezovska O, Mobley W, Chávez-Gutiérrez L. Alzheimer's disease linked Aβ42 exerts product feedback inhibition on γ-secretase impairing downstream cell signaling. eLife. 2023. 12:RP90690

      (3) For this reviewer it is not clear what resolution they are measuring activity, at cellular or subcellular level? In other words are the intensity spots neuronal cell bodies? Given g-sec activity are in all endosomal compartments and at the cell surface, including in the synapse, does NIR imaging have the resolution to distinguish subcellular or surface localized activities? If cells 'communicate' g-sec activities, I would expect to see hot spots of activity at synapses between neurons: is this possible to assess with the current setup? 

      Since this study aimed to determine how γ-secretase activity is regulated on a cell-by-cell basis in live mouse brains, the FRET signal was detected in neuronal cell bodies. While our current set-up for in vivo can only record γ-secretase activity with a cellular resolution, we previously detected predominant γ-secretase activity in the endo-lysosomal compartments (Maesako et al., 2022 J Neurosci) as well as in certain spots of neuronal processes (Maesako et al., 2020 iScience) in cultured primary neurons using the same microscope set-up. Therefore, future studies will expand our capability to monitor γ-secretase with subcellular resolution in live mouse brains in vivo.

      Reference

      - Maesako M, Sekula NM, Aristarkhova A, Feschenko P, Anderson LC, Berezovska O. Visualization of PS/γ-Secretase Activity in Living Cells. iScience. 2020 Jun 26;23(6):101139. 

      - Maesako M, Houser MCQ, Turchyna Y, Wolfe MS, Berezovska O. Presenilin/γ-Secretase Activity Is Located in Acidic Compartments of Live Neurons. J Neurosci. 2022 Jan 5;42(1):145-154. 

      (4) Without some more validation and physiological relevant studies, it remains a single observation and rather a technical note paper, instead of a true research paper.

      Please find our response above to the critique (1).  

      Reviewer #2 (Public Review):

      (1) Regarding the variability and spatial correlation- the dynamic range of the sensor previously reported in vitro is in the range of 20-30% change (Houser et al 2020) whereas the range of FR detected in vivo is between cells is significantly larger (Fig. 3). This raises considerable doubts for specific detection of cellular activity (see point 3).

      Please find our response below to the critique (2).

      (2) One direct way to test the dynamic range of the sensor in vivo, is to increase or decrease endogenous gamma-secretase activity and to ensure this experimental design allows to accurately monitor gamma-secretase activity. In the previous characterization of the reporter (Hauser et al 2020), DAPT application and inhibition of gammasecretase activity results in increased FR (Figures 2 and 3 of Houser et al). This is in agreement with the design of the biosensor, since FR should be inversely correlated with enzymatic activity. Here, while the authors repeat the same manipulation and apply DAPT to block gamma-secretase activity, it seems to induce the opposite effect and reduces FR (comparing figures 8 with figures 5,6,7). First, there is no quantification comparing FR with and without DAPT. Moreover, it is possible to conduct this experiment in the same animals, meaning comparing FR before and after DAPT in the same mouse and cell populations. This point is absolutely critical- if indeed FR is reduced following DAPT application, this needs to be explained since this contradicts the basic design and interpretation of the biosensor.

      We appreciate the reviewer’s comment. In our hand, overexpression of γ-secretase four components (PSEN, Nct, Aph1, and Pen2) is the only reliable and reproducible approach to increase the cellular activity of γ-secretase, which we successfully employed in vitro but not in vivo yet. Therefore, a γ-secretase inhibitor was used to determine the dynamic range of our FRET biosensor in vivo. FRET efficiency depends on the proximity and orientation of donor and acceptor fluorescent proteins. In our initial study, we engineered the original C99 EGFP-RFP biosensor (C99 R-G), and the replacement of EGFP and RFP with mTurquoise-GL and YPet, respectively, expanded the dynamic range of the sensor approximately 2 times. Moreover, extending the linker length from 20 a.a. to 80 a.a. increased the dynamic range 2.2 times (Maesako et al., 2020 iScience). Of note, the C99 720-670 NIR analog, which has the same 80 a.a. linker but miRFP670 and miRFP720 as the donor and acceptor, exhibited a slightly better dynamic range than the C99 Y-T sensor (Houser et al., 2020 Sensor). Our interpretation, at that time, was that the cleavage of the C99 720-670 biosensor by γ-secretase results in a longer distance between the donor and acceptor, and thus, the FRET ratio always increases by γ-secretase inhibition (i.e., proximity plays a more significant role than orientation in our biosensors). As expected, a significantly increased FRET ratio was detected in various cell lines by γ-secretase inhibitors, including CHO, MEF, BV2 cells, and mouse cortical primary neurons. Moreover, to further ensure the C99 720-670 biosensor records changes in γ-secretase activity, the multiplexing capability of the biosensor was utilized. In other words, we co-expressed the C99 720-670 biosensor and visible range fluorescence reporters to record other biological events, such as changes in ion concentration, etc., in cortex primary neurons. Strikingly, several biological events uniquely detected in the neurons with diminished endogenous γ-secretase activity, i.e., neurons with higher FRET ratios, are recapitulated by pharmacological inhibition of γ-secretase (unpublished observation). This approach has allowed us to ensure that increased FRET ratios are indicative of decreased endogenous γ-secretase activity in mouse cortical primary neurons. 

      However, as recommended by the reviewer, we have performed a new experiment to compare the FRET ratio before and after DAPT, a potent γ-secretase inhibitor, administration in the same mouse and cell populations. Surprisingly, we found that of DAPT significantly decreases 720/670 ratios, which is included in our revised manuscript (Figure 2—figure supplement 2C). This unexpected FRET reduction by γ-secretase inhibition was also found in mouse primary neurons derived from the cerebellum (unpublished observation). These findings suggest that orientation plays a significant role in our γ-secretase FRET biosensor and whether the FRET ratio is increased or decreased by the γ-secretase-mediated cleavage depends on cell types. Of note, the difference in FRET ratios with and without DAPT was comparable between primary cortex neurons (24.3%) and the somatosensory cortex neurons in vivo (22.1%). Our new findings suggest that how our biosensors report γ-secretase activity (i.e., increased vs. decreased FRET ratio) must be examined on a model-by-model basis, which is clearly noted in the revised manuscript: 

      Reference

      - Houser MC, Hou SS, Perrin F, Turchyna Y, Bacskai BJ, Berezovska O, Maesako M. A Novel NIRFRET Biosensor for Reporting PS/γ-Secretase Activity in Live Cells. Sensors (Basel). 2020 Oct 22;20(21):5980. 

      - Maesako M, Sekula NM, Aristarkhova A, Feschenko P, Anderson LC, Berezovska O. Visualization of PS/γ-Secretase Activity in Living Cells. iScience. 2020 Jun 26;23(6):101139. 

      (3) For further validation, I would suggest including in vivo measurements with a sensor version with no biological activity as a negative control, for example, a mutation that prevents enzymatic cleavage and FRET changes. This should be used to showcase instrumental variability and would help to validate the variability of FR is indeed biological in origin. This would significantly strengthen the claims regarding spatial correlation within population of cells.

      We fully agree with the reviewer that having a sensor version containing a mutation, which prevents enzymatic cleavage and thus FRET changes, as a negative control is preferable. In our previous study, we developed and validated the APP-based C99 Y-T and Notch1-based N100 Y-T biosensors (Maesako et al., 2020 iScience). It is well established that Notch1 cleavage is entirely blocked by Notch1 V1744G mutation (Schroeter et al., 1998 Nature; Huppert et al., 2000 Nature), and therefore, we introduced the mutation into N100 Y-T biosensor and used it as a negative control. On the other hand, such a striking mutation has never been identified in APP processing. To successfully monitor γ-secretase activity in deep tissue in vivo, we replaced Turquoise-GL and YPet in the C99 Y-T and N100 Y-T biosensors with miRFP670 and miRFP720, respectively. While the APP-based C99 720-670 biosensor allows recording γ-secretase activity (Houser et al., 2020 Sensors), we found the N100 720-670 sensor exhibits a very small dynamic range, not enabling to reliably measure γ-secretase activity. Taken together, there is not currently available NIR γ-secretase biosensor with no biological activity.

      Reference

      - Houser MC, Hou SS, Perrin F, Turchyna Y, Bacskai BJ, Berezovska O, Maesako M. A Novel NIRFRET Biosensor for Reporting PS/γ-Secretase Activity in Live Cells. Sensors (Basel). 2020 Oct 22;20(21):5980. 

      - Huppert SS, Le A, Schroeter EH, Mumm JS, Saxena MT, Milner LA, Kopan R. Embryonic lethality in mice homozygous for a processing-deficient allele of Notch1. Nature. 2000 Jun 22;405(6789):966-70. 

      - Maesako M, Sekula NM, Aristarkhova A, Feschenko P, Anderson LC, Berezovska O. Visualization of PS/γ-Secretase Activity in Living Cells. iScience. 2020 Jun 26;23(6):101139. 

      - Schroeter EH, Kisslinger JA, Kopan R. Notch-1 signalling requires ligand-induced proteolytic release of intracellular domain. Nature. 1998 May 28;393(6683):382-6. 

      (4) In general, confocal microcopy is not ideal for in vivo imaging. Although the authors demonstrate data collected using IR imaging increases penetration depth, out of focus fluorescence is still evident (Figure 4). Many previous papers have primarily used FLIM based analysis in combination with 2p microscopy for in vivo FRET imaging (Some examples: Ma et al, Neuron, 2018; Massengil et al, Nature methods, 2022; DIaz-Garcia et al, Cell Metabolism, 2017; Laviv et al, Neuron, 2020). This technique does not rely on absolute photon number and therefore has several advantage sin terms of quantification of FRET signals in vivo.

      It is therefore likely that use of previously developed sensors of gamma-secretase with conventional FRET pairs, might be better suited for in vivo imaging. This point should be at least discussed as an alternative.

      The reviewer notes that 2p-FLIM may provide certain advantages over our confocal spectral imaging approach for detecting in vivo FRET. In our response below, we will address both the FRET detection method (FLIM vs. spectral) and microscope modality (2p vs. confocal). 

      As noted by the reviewer, we do acknowledge that 2p-FLIM has been utilized to detect FRET in vivo. On the other hand, the ratiometric spectral FRET approach has also been utilized in many in vivo FRET studies (Kuchibhotla et al., 2008 Neuron; Kuchibhotla et al., 2014 PNAS; Hiratsuka et al., 2015 eLife; Maesako et al., 2017 eLife; Konagaya et al., 2017 Cell Rep; Calvo-Rodriguez et al., 2020 Nat Communi; Hino et al., 2022 Dev Cell). We think both approaches have advantages and disadvantages, as discussed in a previous review (Bajar et al., 2016 Sensors), but they complement each other. Indeed, we regularly employ FLIM in cell culture studies (Maesako et al., 2017 eLife; McKendell et al., 2022 Biosensors; Devkota 2024 Cell Rep), and our recent study also utilized 2p-FLIM for in vivo NIR imaging (although not for detecting FRET) (Hou et al., 2023, Nat Biomed Eng); therefore, we are confident that 2p-FLIM can be adapted in our follow-up studies for γ-secretase recording.

      Regarding microscope modality, we agree with the reviewer’s point that generally two-photon microscopy can achieve larger penetration depths than confocal microscopy and is therefore more ideal for in vivo FRET imaging. However, in this study, since our aim was to quantify γ-secretase activity in the superficial layers of the cortex (<200 microns in depth), both NIR confocal and multiphoton microscopies could be used to achieve this imaging objective. Additionally, we chose to use confocal microscopy with our NIR C99 720-670 probe due to the probe’s slightly but higher sensitivity compared to our C99 Y-T probe (Houser et al., 2020 Sensors). Imaging γ-secretase activity with our NIR C99-720-670 probe has the additional advantage that it will allow us in future studies to multiplex with visible FRET pairs using multiphoton microscopy in the same brain region. Furthermore, our demonstration of in vivo FRET imaging using NIR confocal microscopy avoids some of the issues associated with multiphoton microscopy, including potential phototoxicity due to high average and peak laser powers and the high complexity and costs of the instrumentation. For future studies aimed at interrogating γ-secretase activity in deeper cortical regions, multiphoton microscopy could be applied for FLIM or ratiometric spectral imaging of either our NIR or visible FRET probes. Per the reviewer’s request, we have added multiphoton FRET imaging as an alternative in the discussion section. 

      Reference

      - Bajar BT, Wang ES, Zhang S, Lin MZ, Chu J. A Guide to Fluorescent Protein FRET Pairs. Sensors (Basel). 2016 Sep 14;16(9):1488.  

      - Calvo-Rodriguez M, Hou SS, Snyder AC, Kharitonova EK, Russ AN, Das S, Fan Z, Muzikansky A,

      Garcia-Alloza M, Serrano-Pozo A, Hudry E, Bacskai BJ. Increased mitochondrial calcium levels

      associated with neuronal death in a mouse model of Alzheimer's disease. Nat Commun. 2020 May

      1;11(1):2146  

      - Devkota S, Zhou R, Nagarajan V, Maesako M, Do H, Noorani A, Overmeyer C, Bhattarai S, Douglas JT, Saraf A, Miao Y, Ackley BD, Shi Y, Wolfe MS. Familial Alzheimer mutations stabilize synaptotoxic γ-secretase-substrate complexes. Cell Rep. 2024 Feb 27;43(2):113761. 

      - Hino N, Matsuda K, Jikko Y, Maryu G, Sakai K, Imamura R, Tsukiji S, Aoki K, Terai K, Hirashima T, Trepat X, Matsuda M. A feedback loop between lamellipodial extension and HGF-ERK signaling specifies leader cells during collective cell migration. Dev Cell. 2022 Oct 10;57(19):2290-2304.e7.

      - Hiratsuka T, Fujita Y, Naoki H, Aoki K, Kamioka Y, Matsuda M. Intercellular propagation of extracellular signal-regulated kinase activation revealed by in vivo imaging of mouse skin. eLife. 2015 Feb 10;4:e05178.  

      - Hou SS, Yang J, Lee JH, Kwon Y, Calvo-Rodriguez M, Bao K, Ahn S, Kashiwagi S, Kumar ATN, Bacskai BJ, Choi HS. Near-infrared fluorescence lifetime imaging of amyloid-β aggregates and tau fibrils through the intact skull of mice. Nat Biomed Eng. 2023 Mar;7(3):270-280.  

      - Houser MC, Hou SS, Perrin F, Turchyna Y, Bacskai BJ, Berezovska O, Maesako M. A Novel NIRFRET Biosensor for Reporting PS/γ-Secretase Activity in Live Cells. Sensors (Basel). 2020 Oct 22;20(21):5980. 

      - Konagaya Y, Terai K, Hirao Y, Takakura K, Imajo M, Kamioka Y, Sasaoka N, Kakizuka A, Sumiyama K, Asano T, Matsuda M. A Highly Sensitive FRET Biosensor for AMPK Exhibits Heterogeneous AMPK Responses among Cells and Organs. Cell Rep. 2017 Nov 28;21(9):2628-2638.  

      - Kuchibhotla KV, Goldman ST, Lattarulo CR, Wu HY, Hyman BT, Bacskai BJ. Abeta plaques lead to aberrant regulation of calcium homeostasis in vivo resulting in structural and functional disruption of neuronal networks. Neuron. 2008 Jul 31;59(2):214-25  

      - Kuchibhotla KV, Wegmann S, Kopeikina KJ, Hawkes J, Rudinskiy N, Andermann ML, Spires-Jones TL, Bacskai BJ, Hyman BT. Neurofibrillary tangle-bearing neurons are functionally integrated in cortical circuits in vivo. Proc Natl Acad Sci U S A. 2014 Jan 7;111(1):510-4  

      - Maesako M, Horlacher J, Zoltowska KM, Kastanenka KV, Kara E, Svirsky S, Keller LJ, Li X, Hyman BT, Bacskai BJ, Berezovska O. Pathogenic PS1 phosphorylation at Ser367. Elife. 2017 Jan 30;6:e19720.  

      - McKendell AK, Houser MCQ, Mitchell SPC, Wolfe MS, Berezovska O, Maesako M. In-Depth

      Characterization of Endo-Lysosomal Aβ in Intact Neurons. Biosensors (Basel). 2022 Aug 20;12(8):663. 

      (Recommendations For The Authors):

      (5) Minor issues- Figure 4 describes the analysis procedure, which seems to be standard practice in the field. This can be described in the methods section rather than in the main figure.

      Per the reviewer’s suggestion, this figure has been moved to Figure 2—figure supplement 1. 

      Reviewer #3 (Public Review):

      (1) This paper builds on the authors' original development of a near infrared (NIR) FRET sensor by reporting in vivo real-time measurements for gamma-secretase activity in the mouse cortex. The in vivo application of the sensor using state of the art techniques is supported by a clear description and straightforward data, and the project represents significant progress because so few biosensors work in vivo. Notably, the NIR biosensor is detectable to ~ 100 µm depth in the cortex. A minor limitation is that this sensor has a relatively modest ΔF as reported in Houser et al, which is an additional challenge for its use in vivo. Thus, the data is fully dependent on post-capture processing and computational analyses. This can unintentionally introduce biases but is not an insurmountable issue with the proper controls that the authors have performed here.

      We appreciate the reviewer’s overall positive evaluation. As described in our response to the Reviewer 2’s critique (2), ΔF in vivo has been characterized (Figure 2—figure supplement 2C).

      (2) The observation of gamma-secretase signaling that spreads across cells is potentially quite interesting, but it can be better supported. An alternative interpretation is that there exist pre-formed and clustered hubs of high gamma-secretase activity, and that DAPT has stochastic or differential accessibility to cells within the cluster. This could be resolved by an experiment of induction, for example, if gamma-secretase activity is induced or activated at a specific locale and there was observed coordinated spreading to neighboring neurons with their sensor.

      We agree with the reviewer that the stochastic or differential accessibility of DAPT to cell clusters with different γ-secretase can be an alternative interpretation of our data, which is now included in the Discussion of the revised manuscript. Undoubtedly, the activation of γ-secretase would provide valuable information. However, as described in the response above to Reviewer 2’s critique #2, overexpressing the four components of γ-secretase (PSEN, Nct, Aph1, and Pen2) is the only reliable and reproducible approach to increasing the cellular activity of γ-secretase, which was achieved in our in vitro study but not yet in vivo. Our future study will develop and characterize the approach to induce γ-secretase activity to further perform detailed mechanistic studies.

      (3) Furthermore, to rule out the possibility that uneven viral transduction was not simply responsible for the observed clustering, it would be helpful to see an analysis of 670nm fluorescence alone.

      Our new analysis comparing 670 nm fluorescence intensity and that in five neighbor neurons shows a positive correlation (Figure 3—figure supplement 1A), suggesting that AAV was unevenly transduced. On the other hand, the 720/670 ratio (i.e., γ-secretase activity) is not correlated with 670 nm fluorescence intensity (i.e., C99 720-670 biosensor expression) (Figure 3—figure supplement 1B). This strongly suggests that, while C99 720-670 biosensor expression was not evenly distributed in the brain, the uneven probe expression did not impact the capability of γ-secretase recording.  

      Reviewer #3 (Recommendations For The Authors):

      (4) One minor suggestion might be to consider Figures 6-7 as orthogonal supporting analyses rather than "validation". It might then be helpful to present them together with Figure 5.

      We have moved the initial Figure 6 and 7 to Figure 3—figure supplement 2 and Figure 4, respectively.

    1. Author response:

      The following is the authors’ response to the previous reviews.

      Recommendations for the authors:

      Reviewer #1 (Recommendations For The Authors):

      My main concern is still in place. It is unclear whether the proposed method can find actual goal states, and as a result it is unclear what states it finds. Table S1 mentions the model BIOMD0000000454, which is a small metabolic pathway with known equations given in "Example One" in "Metabolic Control Analysis: Rereading Reder". In this model the goal states can be calculated analytically.

      Regarding your statements below: I am not concerned that your method will be less efficient than random search (or any other search..) on small models, but I think it is important for the readers to have evidence that your method is able to discover true goal states at least in small networks, used in your study. You do show that your method scales to complex models. So, in my opinion, the missing part is to show that it is able to find true goal states.

      "...For simple models whose true steady-state distribution can be derived numerically and/or analytically, it is very likely that their exploration will be much simpler and this is not where a lot of improvement over random search may be found, which explains our focus on more complex models..."

      We thank you for your response and for your concerns on the lack of evidence that our method is able to re-discover the true goal states of simple models when these are known a priori. We acknowledge that adding these simple cases is useful for completeness. We did not include these simple models in our main study because in most cases a basic random search over the initial conditions will lead to the re-discovery of these goal states. For instance for the mentioned model BIOMD0000000454 described in the "Example One" from the "Metabolic Control Analysis: Rereading Reder" paper, several simplifying assumptions are made such that the system only has one steady state (x1=0.056, x2=0.769, x3=4.231) which can be found analytically as shown in the paper. In that simple case, this goal state is also straightforward to find with numerical simulation as any valid initial condition will converge to it.

      To address the concerns of the reviewer, we propose to add an additional "sanity check" figure in the supplementary of the revised paper (Figure S4), as well as a “sanity check” subsection in the “Methods”, to present additional experiments made on  simple models such as this one. The novel figure and subsection can be visualized on the paper’s interactive version available online https://developmentalsystems.org/curious-exploration-of-grn-competencies, and we plan to include them as such in the further revision.  We have also included the full code to reproduce this sanity check as a ‘sanity_check.ipynb’  jupyter notebook in the github repository (https://github.com/flowersteam/curious-exploration-of-grn-competencies/blob/main/notebooks/sanity_check.ipynb).

      In the novel figure S4-b, we show the results of our exploration pipeline on the suggested model BIOMD0000000454 as described in the "Example One" of the paper. These results provide evidence that the curiosity search is able to find back the correct unique goal state (x1=0.056, x2=0.769, x3=4.231), as expected.

      We also include a second sanity check on BIOMD0000000341 which models the dynamics of beta-cell mass, insulin and glucose dynamics. This model has two stable fixed points representing physiological (B=300, I=10, G=100) and pathological (B=0, I=0, G=600) steady states, which are the known ground truth steady states as described in Figure 3 of the "A Model of b-Cell Mass, Insulin, and Glucose Kinetics: Pathways to Diabetes" paper. Again, as expected, curiosity search is able to find back those two steady states (Figure S4-a).

      As stated in our previous answer, our main study focuses on more complex models that are not limited to one or few attractors that can easily be discovered with random initial conditions. Regarding the mentioned BIOMD0000000454, maybe something that has been confusing for the reviewer is that we indeed included it in our main study but, as specified in the caption of table S4, at the difference of what is done in the "example one" of the original paper, we let the metabolite concentrations y1,...,y5 evolve in time (instead of enforcing them as constants). When doing so, the resulting dynamics of the system are more complex and exhibit a spectrum of possible steady states (unknown a priori), which differ from the previous case with a single steady state. In that case, the new attractors are not analytically easy to find and the proposed curiosity search becomes interesting as it is able to uncover the distribution of possible steady states much more efficiently than a random search baseline, as shown in the new figures S4-c and S4-d.

      We hope that these new results will address the reviewer’s concerns and provide evidence to the readers on the validity of the approach on simple networks.

      eLife assessment

      This important study develops a machine learning method to reveal hidden unknown functions and behavior in gene regulatory networks by searching parameter space in an efficient way. The evidence for some parts of the paper is still incomplete and needs systematic comparison to other methods and to the ground truth, but the work will be of broad interest to anyone working in biology of all stripes since the ideas reach beyond gene regulatory networks to revealing hidden functions in any complex system with many interacting parts.

      We thank the editors and reviewers for their positive assessment and constructive suggestions. In our response, we acknowledge the importance of systematic comparison to other methods and to the ground truth, when available. However we also emphasize the challenges associated with evaluating such methods in the context of uncovering hidden behaviors in complex biological networks as the ground truth is often unknown. We hope that our explanations will clarify the potential of our approach in advancing the exploration of these systems.

      Public Reviews:

      Reviewer #1 (Public Review):

      Summary: This paper suggests to apply intrinsically-motivated exploration for the discovery of robust goal states in gene regulatory networks.

      Strengths:

      The paper is well written. The biological motivation and the need for such methods are formulated extraordinarily well. The battery of experimental models is impressive.

      We thank the reviewer for sharing interest in the research problem and for recognizing the strengths of our work.

      Weaknesses:

      (1) The proposed method is compared to the random search. That says little about the performance with regard to the true steady-state goal sets. The latter could be calculated at least for a few simple ODE (e.g., BIOMD0000000454, `Metabolic Control Analysis: Rereading Reder'). The experiment with 'oscillator circuits' may not be directly interpolated to the other models.

      The lack of comparison to the ground truth goal set (attractors of ODE) from arbitrary initial conditions makes it hard to evaluate the true performance/contribution of the method. A part of the used models can be analyzed numerically using JAX, while there are models that can be analyzed analytically.

      "...The true versatility of the GRN is unknown and can only be inferred through empirical exploration and proxy metrics....": one could perform a sensitivity analysis of the ODEs, identifying stable equilibria. That could provide a proxy for the ground truth 'versatility'.

      We agree with the reviewer that one primary concern is to properly evaluate the effectiveness of the proposed method. However, as we move toward complex pathways, knowledge of the “true” steady-state goal sets is often unknown which is where the use of machine learning methods as the one we propose are particularly interesting (but challenging to evaluate).

      For simple models whose true steady-state distribution can be derived numerically and/or analytically, it is very likely that their exploration will be much simpler and this is not where a lot of improvement over random search may be found, which explains our focus on more complex models. While we agree that it is still interesting to evaluate exploration methods on these simple models for checking their behavior, it is not clear how to scale this analysis to the targeted more complex systems.

      For systems whose true steady state distribution cannot be derived analytically or numerically, we believe that random search is a pertinent baseline as it is commonly used in the literature to discover the attractors/trajectories of a biological network. For instance, Venkatachalapathy et al. [1] initialize stochastic simulations at multiple randomly sampled starting conditions (which is called a kinetic Monte Carlo-based method) to capture the steady states of a biological system. Similarly, Donzé et al. [29] use a Monte Carlo approach to compute the reachable set of a biological network «when the number of parameters  is large and their uncertain range  is not negligible». For the considered models, the true steady-state goal set is unknown, which is why we chose comparison with random search. We added a “Statistics” subsection in the Methods section providing additional details about the statistical analyses we perform between our method and the random search baseline.

      (2) The proposed method is based on `Intrinsically Motivated Goal Exploration Processes with Automatic Curriculum Learning', which assumes state action trajectories [s_{t_0:t}, a_{t_0:t}], (2.1 Notations and Assumptions' in the IMGEP paper). However, the models used in the current work do not include external control actions, but rather only the initial conditions can be set. It is not clear from the methods whether IMGEP was adapted to this setting, and how the exploration policy was designed w/o actual time-dependent actions. What does "...generates candidate intervention parameters to achieve the current goal....", mean considering that interventions 'Sets the initial state...' as explained in Table 2?

      We thank the reviewer for asking for clarification, as indeed the IMGEP methodology originates from developmental robotics scenarios which generally focus on the problem of robotic sequential decision-making, therefore assuming state action trajectories as presented in Forestier et al. [65]. However, in both cases, note that the IMGEP is responsible for sampling parameters which then govern the exploration of the dynamical system. In Forestier et al. [65], the IMGEP also only sets one vector at the start (denoted ) which was specifying parameters of a movement (like the initial state of the GRN), which was then actually produced with dynamic motion primitives which are dynamical system equations similar to GRN ODEs, so the two systems are mathematically equivalent. More generally, while in our case the “intervention” of the IMGEP (denoted ) only controls the initial state of the GRN, future work could consider more advanced sequential interventions simply by setting parameters of an action policy  at the start which could be called during the GRN’s trajectory to sample control actions  where  would be the state of the GRN. In practice this would also require setting only one vector at the start, so it would remain the same exploration algorithm and only the space of parameters would change, which illustrates the generality of the approach.

      (3) Fig 2 shows the phase space for (ERK, RKIPP_RP) without mentioning the typical full scale of ERK, RKIPP_RP. It is unclear whether the path from (0, 0) to (~0.575, ~3.75) at t=1000 is significant on the typical scale of this phase space. is it significant on the typical scale of this phase space?

      The purpose of Figure 2 is to illustrate an example of GRN trajectory in transcriptional space, and to illustrate what “interventions” and “perturbations” can be in that context. To that end we have used the fixed initial conditions provided in the BIOMD0000000647, replicating Figure 5 of Cho et al. [56].

      While we are not sure of what the reviewer means with “typical” scale of this phase space, we would like to point reviewer toward Figure 8 which shows examples of certain paths that indeed reach further point in the same phase space (up to ~10 in RKIPP_RP levels and ~300 in ERK levels). However, while the paths displayed in Figure 8 are possible (and were discovered with the IMGEP), note that they may be “rarer” to occur naturally  in the sense that a large portion of the tested initial conditions with random search tend to converge toward smaller (ERK, RKIPP_RP) steady-state values similar to the ones displayed in Figure 2.

      (4) Table 2:

      a. Where is 'effective intervention' used in the method?

      b. in my opinion 'controllability', 'trainability', and 'versatility' are different terms. If their correspondence is important I would suggest to extend/enhance the column "Proposed Isomorphism". otherwise, it may be confusing.

      a) We thank the reviewer for pointing out that “effective intervention” is not explicitly used in the method. The idea here is that as we are exploring a complex dynamical system (here the GRN), some of the sampled interventions will be particularly effective at revealing novel unseen outcomes whereas others will fail to produce a qualitative change to the distribution of discovered outcomes. What we show in this paper, for instance in Figure 3a and Figure 4, is that the IMGEP method is particularly sample-efficient in finding those “effective interventions”, at least more than a random exploration. However we agree that the term “effective intervention” is ambiguous (does not say effective in what) and we have replaced it with “salient intervention” in the revised version.

      b) We thank the reviewer for highlighting some confusing terms in our chosen vocabulary, and we have clarified those terms in the revised version. We agree that controllability/trainability and versatility are not exactly equivalent concepts, as controllability/trainability typically refers to the amount to which a system is externally controllable/trainable whereas versatility typically refers to the inherent adaptability or diversity of behaviors that a system can exhibit in response to inputs or conditions. However, they are both measuring the extent of states that can be reached by the system under a distribution of stimuli/conditions, whether natural conditions or engineered ones, which is why we believe that their correspondence is relevant.

      I don't see how this table generalizes "concepts from dynamical complex systems and behavioral sciences under a common navigation task perspective".

      We have replaced the verb “generalize” with “investigate” in the revised version.

      Reviewer #2 (Public Review):

      Summary:

      Etcheverry et al. present two computational frameworks for exploring the functional capabilities of gene regulatory networks (GRNs). The first is a framework based on intrinsically-motivated exploration, here used to reveal the set of steady states achievable by a given gene regulatory network as a function of initial conditions. The second is a behaviorist framework, here used to assess the robustness of steady states to dynamical perturbations experienced along typical trajectories to those steady states. In Figs. 1-5, the authors convincingly show how these frameworks can explore and quantify the diversity of behaviors that can be displayed by GRNs. In Figs. 6-9, the authors present applications of their framework to the analysis and control of GRNs, but the support presented for their case studies is often incomplete.

      Strengths:

      Overall, the paper presents an important development for exploring and understanding GRNs/dynamical systems broadly, with solid evidence supporting the first half of their paper in a narratively clear way.

      The behaviorist point of view for robustness is potentially of interest to a broad community, and to my knowledge introduces novel considerations for defining robustness in the GRN context.

      We thank the reviewer for recognizing the strengths and novelty of the proposed experimental framework for exploring and understanding GRNs, and complex dynamical systems more generally. We agree that the results presented in the section “Possible Reuses of the Behavioral Catalog and Framework” (Fig 6-9) can be seen as incomplete along certain aspects, which we tried to make as explicit as possible throughout the paper, and why we explicitly state that these are “preliminary experiments”. Despite the discussed limitations, we believe that these experiments are still very useful to illustrate the variety of potential use-cases in which the community could benefit from such computational methods and experimental framework, and build on for future work.

      Some specific weaknesses, mostly concerning incomplete analyses in the second half of the paper:

      (1) The analysis presented in Fig. 6 is exciting but preliminary. Are there other appropriate methods for constructing energy landscapes from dynamical trajectories in gene regulatory networks? How do the results in this particular case study compare to other GRNs studied in the paper?

      We are not aware of other methods than the one proposed by Venkatachalapathy et al. [1] for constructing an energy landscape given an input set of recorded dynamical trajectories, although it might indeed be the case. We want to emphasize that any of such methods would anyway depend on the input set of trajectories, and should therefore benefit from a set that is more representative of the diversity of behaviors that can be achieved by the GRN, which is why we believe the results presented in Figure 6 are interesting. As the IMGEP was able to find a higher diversity of reachable goal states (and corresponding trajectories) for many of the studied GRNs, we believe that similar effects should be observable when constructing the energy landscapes for these GRN models, with the discovery of additional or wider “valleys” of reachable steady states.

      Additionally, it is unclear whether the analysis presented in Fig. 6C is appropriate. In particular, if the pseudopotential landscapes are constructed from statistics of visited states along trajectories to the steady state, then the trajectories derived from dynamical perturbations do not only reflect the underlying pseudo-landscape of the GRN. Instead, they also include contributions from the perturbations themselves.

      We agree that the landscape displayed Fig. 6C integrates contributions from the perturbations on the GRN’s behavior, and that it can shape the landscape in various ways, for instance affecting the paths that are accessible, the shape/depth of certain valleys, etc. But we believe that qualitatively or quantitatively analyzing the effect of these perturbations  on the landscape is precisely what is interesting here: it might help 1) understand how a system respond to a range of perturbations and to visualize which behaviors are robust to those perturbations, 2) design better strategies for manipulating those systems to produce certain behaviors

      (2) In Fig. 7, I'm not sure how much is possible to take away from the results as given here, as they depend sensitively on the cohort of 432 (GRN, Z) pairs used. The comparison against random networks is well-motivated. However, as the authors note, comparison between organismal categories is more difficult due to low sample size; for instance, the "plant" and "slime mold" categories each only have 1 associated GRN. Additionally, the "n/a" category is difficult to interpret.

      We acknowledge that this part is speculative as stated in the paper: “the surveyed database is relatively small with respect to the wealth of available models and biological pathways, so we can hardly claim that these results represent the true distribution of competencies across these organism categories”. However, when further data is available, the same methodology can be reused and we believe that the resulting statistical analyses could be very informative to compare organismal (or other) categories.

      (3) In Fig. 8, it is unclear whether the behavioral catalog generated is important to the intervention design problem of moving a system from one attractor basin to another. The authors note that evolutionary searches or SGD could also be used to solve the problem. Is the analysis somehow enabled by the behavioral catalog in a way that is complementary to those methods? If not, comparison against those methods (or others e.g. optimal control) would strengthen the paper.

      We thank the reviewer for asking to clarify this point, which might not be clearly explained in the paper. Here the behavioral catalog is indeed used in a complementary way to the optimization method, by identifying a representative set of reachable attractors which are then used to define the optimization problem. For instance here, thanks to the catalog, we 1) were able to identify a “disease” region and several possible reachable states in that region and 2) use several of these states as starting points of our optimization problem, where we want to find a single intervention that can successfully and robustly reset all those points, as illustrated in Figure 8. Please note that given this problem formulation, a simple random search was used as an optimization strategy. When we mention more advanced techniques such as EA or SGD, it is to say that they might be more efficient optimizers than random search. However, we agree that in many cases optimizing directly will not work if starting from random or bad initial guess, and this even with EA or SGD. In that case the discovered behavioral catalog can be useful to better initialize  this local search and make it more efficient/useful, akin to what is done in Figure 9.

      (4) The analysis presented in Fig. 9 also is preliminary. The authors note that there exist many algorithms for choosing/identifying the parameter values of a dynamical system that give rise to a desired time-series. It would be a stronger result to compare their approach to more sophisticated methods, as opposed to random search and SGD. Other options from the recent literature include Bayesian techniques, sparse nonlinear regression techniques (e.g. SINDy), and evolutionary searches. The authors note that some methods require fine-tuning in order to be successful, but even so, it would be good to know the degree of fine-tuning which is necessary compared to their method.

      We agree that the analysis presented in Figure 9 is preliminary, and thank the reviewer for the suggestion. We would first like to refer to other papers from the ML literature that have more thoroughly analyzed this issue, such as Colas et al. [74] and Pugh et al. [34], and shown the interest of diversity-driven strategies as promising alternatives.  Additionally, as suggested by the reviewer, we added an additional comparison to the CMA-ES algorithm in the revised version in order to complete our analysis. CMA-ES is an evolutionary algorithm which is self-adaptive in the optimization steps and that is known to be better suited than SGD to escape local minimas when the number of parameters is not too high (here we only have 15 parameters). However, our results showed that while CMA-ES explores more the solution space at the beginning of optimization than SGD does, it also ultimately converges into a local minima similarly to SGD. The best solution converges toward a constant signal (of the target b) but fails to maintain the target oscillations, similar to the solutions discovered by gradient descent. We tried this for a few hyperparameters (init mean and std) but always found similar results.  We have updated the figure 9 image and caption, as well as descriptive text, to include these novel results in the revised version. We also added a reference to the CMA-ES paper in the citations.

      Reviewer #1 (Recommendations For The Authors):

      I would suggest to conduct a more rigor analysis of the performance by estimating/approximating the ground truth robust goal sets in important GRNs.

      Also, the use of terminology from different disciplines can be improved. Please see my comments above. Specifically, the connection between controllability in dynamical control systems and versatility used in this paper is unclear.

      We hope to have addressed the reviewer's concerns in our previous answers.

      Reviewer #2 (Recommendations For The Authors):

      Fig 4b: I'm not sure if DBSCAN is the appropriate method to use here, as the visual focus on the core elements of the clusters downplays the full convex hull of the points that random sampling achieves in Z space. An analysis based on convex hulls or the ball-coverage from Fig. 3b would presumably generate plots that were more similar between random sampling and curiosity search. If the goal is to highlight redundancy/non-linearity in the mapping between Z and I, another approach might be to simply bin Z-space in a grid, or to use a clustering algorithm that is less stringent about core/noise distinctions.

      We thank the reviewer for the suggestion. This plot is intended to convey the reader an understanding of why a method that uniformly samples goals in Z (what the  IMGEP is doing), is more efficient than a method that uniformly samples parameters in I (what the random search is doing), in systems for which there is high redundancy/non-linearity in the mapping between I and Z. We agree that binning the Z-space in a grid and counting the number of achieved bins is a way to quantitatively measure this, which is by the way very close to what we do in Figure 3 for measuring the achieved diversity. We believe however that the clustering and coloring provides additional intuitions on why this is the case: it illustrates that large regions of the intervention space map to small regions in the outcome space and vice versa.

      Additional changes in the revised version:

      We added a sentence in the Methods section as well as in the caption of Table S1 providing additional details about the way we simulate the biological models from the BioModels website

      We fixed a wrong reference to Figure 4 in the Methods “Sensitivity measure” subsection with reference to Figure 5.

    1. Author response:

      The following is the authors’ response to the original reviews.

      Reviewer #1 (Public Review): 

      The process of EMT is a major contributor to metastasis and chemoresistance in breast cancer. By using a modified PyMT model that allows the identification of cells undergoing EMT and their decedents via S100A4-Cre mediated recombination of the mTmG allele, Ban et al. tackle a very important question of how tumor metastasis and therapy resistance by EMT can be blocked. They identified that pathways associated with ribosome biogenesis (RiBi) are activated during transition cell states. This finding represents a promising therapeutic target to block any transition from E to M (activated during cell dissemination and invasion) as well as from M to E (activated during metastatic colonization). Inhibition of RiBi-blocked EMT also reduced the establishment of chemoresistance that is associated with an EMT phenotype. Hence, RiBi blockage together with standard chemotherapy showed synergistic effects, resulting in impaired colonization/metastatic outgrowth in an animal model. The study is of great interest and of high clinical relevance as the authors show that blocking the transition from E to M or vice versa targets both aspects of metastasis, dissemination from the primary tumor, and colonization in distant organs. 

      We appreciate the positive acknowledgment of our work.

      The study is done with high skill using state-of-the-art technology and the conclusions are convincing and solid, but some aspects require some additional experimental support and clarification. It remains elusive whether blocking of EMT/MET is necessary for the synergistic effect of standard chemotherapy together with RiBi blockage or whether a general growth disadvantage of RiBi-treated cells independent of blocking transition is responsible. 

      We appreciate the reviewer for raising the pertinent query regarding the interrelation between EMT/MET blocking by RiBi inhibition and its synergistic effect with chemotherapy drugs. Our experimental data suggests a potential consequence of these events. Specifically, when assessing the potency of RiBi inhibitors (BMH21 and CX5410), we observed a pronounced EMT/MET blocking effect at concentrations preceding the emergence of cytotoxic effects (refer to Fig. 4 and Supplementary Fig S8). Notably, the IC50 for BMH21 was approximately 200nM, which is a concentration surpassing those that manifested the EMT/MET blocking effects. Crucially, the enhanced synergy of RiBi inhibitors with chemotherapy drugs was predominantly seen at these lower concentrations (as illustrated in Supplementary Fig S10). Therefore, the EMT/MET blocking by RiBi inhibition, rather than the cytotoxic effect, is likely instrumental for the synergy with chemotherapy drugs. The result was highlighted in Page#16.

      How can specific effects on state transition by RiBI block be separated from global effects attributed to overall reduced protein biosynthesis, proliferation etc.? 

      We appreciate the reviewer's insightful query. We agree that RiBi activity and associated protein synthesis are fundamental processes for cell viability, making it challenging to clearly delineate the overall effects of RiBi blockage to the specific effects of EMT state transition. Our results showed an elevated RiBi activity during the EMT transitioning phases, concomitant with enhanced nascent protein synthesis, indicating a higher-than-normal requirement of new proteins for cells to switch their phenotype. This would provide us a chance to target the excessive activities of RiBi to block EMT/MET transition. Based on a similar consideration, we chose to apply shRNA instead of CRISPR technology to modulate RiBi gene expression. By comparing to scramble controls, the growth rates of the Rps knockdown cells (both RFP+ and GFP+ cells) were not significantly affected, while the EMT/MET transitioning was impaired (Supplementary Fig 9). These results may provide evidence of uncoupling the cell proliferation and EMT/MET status changes by inhibiting RiBi pathway.  

      Some other aspects are misleading or need extension. 

      Reviewer #1 (Recommendations For The Authors): 

      (1) The analysis of RiBi expression during EMT in Fig. 1K shows that transition states have high RiBi levels, whereas E and M states are low. Analyses of MET in Fig.2G indicate that M states have the lowest, transition states upregulate RiBi while E states have the highest levels of RiBi expression. This is puzzling and how can it be explained? It would be helpful to demonstrate how these two settings are related by combining results from Figs 1 and 2 in an E-Trans-M-Trans-E state graph (in a sequence of EMT/MET). Does it mean that the initial E state starts with lower RiBi and the final E state displays the highest RiBi expression? In other words, are the initial E state and the one after MET different? 

      Thank the reviewer for raising the concern about which EMT/MET state exhibits the highest RiBi activity. Following the reviewer's suggestions, we merged the scRNA-seq data of EMT and MET cells and performed the trajectory analysis. Similar epithelial-mesenchymal spectrums were detected from these cells (For reviewers Fig 1). Notably, the highest RiBi activity was detected in the early EMT transitioning or the late MET transitioning cells (revised For reviewers Fig 1D). Addressing the question of the reviewer, the initial E state (of EMT cells) did not show significant differences to the final E state (of MET cells) in comparisons of EMT pseudotime and RiBi activities. In addition, the analysis with merged cells also revealed:

      (1) Both the EMT (In_Vitro_Mix) and MET (In_Vivo_GFP) cells were generally divided into two major clusters representing epithelial and mesenchymal phenotypes (For reviewers Fig 1A, 1B).

      (2) The EMT and MET cells exhibited similar EMT spectrums (EMT/MET status, and pseudotime) in the trajectory analysis (For reviewers Fig 1C, 1D).

      (3) Cells with high RiBi activity were mostly from the transitioning cell during EMT (In_Vitro_Mix) cells (For reviewers Fig 1D).  

      (2) It needs to be elaborated on how the experiment in Fig. 4A was exactly done. Are there cells isolated directly from the autochthonous TriPyMT tumor in contrast to steady-state cultures from Fig. 1? Does the control graph represent 0d in culture or have the cells been cultured for the same amount of time as the treated samples? How do these observed 15% GFP+ cells are related to the 15% GFP+ cells obtained at day 0 and 34% at d7 control condition in Fig. 5A? 

      Following the reviewer’s suggestion, we have amended the figure legend to clarify the experiment settings. In Fig. 4A, we initiated the experiment with sorted RFP+/Epcam+ cells. The control cells were cultured for the same period of time (5 days) as drug-treated cells did. We apologize for the unclear description. The percentage of GFP+ cells in this experiment is not related to the experiment in Fig 5A, where the initial cell population comprised an unsorted mix of RFP/GFP cells. 

      (3) Fig. 4B: Since the bulk population is loaded in the WB, does that suggest that the epithelial state is stabilized/enhanced or does it reflect only different cell ratios? So, it would be important to show the WB for RFP+ and GFP+ cells separately. 

      Thank the reviewer for the query regarding Fig. 4B. We apologize for the unclear explanation. The experimental setup for Fig 4B was identical to that of Fig 4A, where the sorted RFP+ cells were utilized at the start. Indeed, the observed increase in epithelial markers and decrease in mesenchymal markers in cells treated with BMH and CX suggest a higher proportion of cells maintaining the RFP+ state. 

      Performing WB for RFP+ and GFP+ cells separately may not address the question we asked since the experiment was initialed with pure RFP+ cells. Also, the expression of the fluorescent markers is closely aligned with the EMT status of the cells with and without drug treatment.  

      (4) Figs. 4-6: The authors claim that there is less EMT under treatment. If the experiment was done over 5 days (as indicated in Fig.4b legend), it is necessary to rule out that shifts in E/M ratios are attributed to the effects of treatment on proliferation/survival affecting both populations differently. How do the same cells grow under treatment when injected orthotopically/subcutaneously? 

      We apologized for the unclear descriptions. The effect of blocking the transitioning of EMT with RiBi inhibitors were performed with purified RFP+/EpCam+ cells. All GFP+ cells in this experiment setting were transformed from RFP+ cells. Given the fluorescence switch was well correlated with EMT status of cells, RFP and GFP were used as EMT reporters. Similarly, we used purified GFP+/EpCam- cells as the initial population to study the MET process of tumor cells.

      To address the reviewer's concern regarding how RiBi inhibition may differentially affect the growth of RFP+ and GFP+ cells, we conducted a cell cycle assay using Tri-PyMT cells, which include both RFP+ and GFP+ populations. Our results demonstrated that both RFP+ and GFP+ cells exhibited a trend towards G2/M phase accumulation when treated with BMH21. It is important to note that the impact of BMH21 on the cell cycle was less pronounced than previously reported by Fu et al. (Oncol Rep, 2017). This is likely because the dose used for EMT inhibition in our study was approximately one-tenth of the dose known to inhibit cell growth (For Reviewers Fig 2). Also, no significantly differential impacts were detected between RFP+ and GFP+ cells. 

      We have previously characterized the proliferation rate of RFP+ and GFP+ populations (Lourenco et al 2020). RFP+ cells proliferate faster than GFP+ cells. Primary tumor cells derived from RFP+ cells also grew faster than GFP+ tumors (Lourenco et al 2020).

      (5) Fig. 6B: this image is puzzling. Only in the lower two panels the outline of the lung is visualized by DAPI staining. The upper two panels look like there is no lung tissue in ctrl (no DAPI+GFP-RFP- cells) or show almost exclusively DAPI+GFP-RFP- cells that are present in a clustered assembly. Do the latter represent lymphoid cell clusters or normal lung tissue? 

      To improve the clarity of fluorescent images in Fig 6B, we enlarged the merge images with higher contrast (Revised Fig. 6B). The DAPI+/RFP-/GFP- region represent normal lung tissue. Nodules with either RFP or GFP signals represent tumor lesions.  

      (6) Text: Several typos and sentences should be revised, including p. 3 "Le et al. discovered" which should read as "Li et al. discovered", p.8 "Vimten", p.10 "Cells were then classified cells into three main categories", GSEA should be spelled out as Gene Set Enrichment Analysis (not Assay), p. 13 "cells, suggesting the impaired MET capability with upon treatment". 

      We apologize for the typos. All were corrected in the revised manuscript.

      (7) Figures: Color gradient indicator in Fig. 1E does not reflect the colors of the cells, Fig. S5A+C are not referenced in the text, there is mislabeling of S5B,C,D in the legend, graph in Fig. 3D is placed two times and overlapping, Fig. 6C labeling needs adjustments, labeling of Fig. 6D should be similar to Fig. 6A: CTX blue and BMH21 green. 

      We apologize for these errors and made corrections. Color in Fig.1E represents the EMT status of tumor cells as indicated in the revised figure, red for more epithelial, and green for more mesenchymal features. Fig S5 is now Fig S6, and referred in the revised manuscript. Legend for figures were corrected. Labels of Fig 6 were adjusted. 

      Reviewer #2 (Public Review): 

      (1) The current manuscript by Ban et al describes that cells undergoing EMT have increased rRNA synthesis, as analyzed by RNA seq-based gene expression analysis, and that the increased rRNA synthesis provides a therapeutic opportunity to target chemoresistance. The cells utilized in this manuscript were isolated from the authors' Tri-PyMT EMT lineage tracing model published a few years ago which demonstrated that cells undergoing EMT are not the cells that are contributing to metastasis but rather to tumor chemoresistance (Fischer, Nature 2015). This in vivo model has since then been criticized for not capturing all relevant EMT events which the authors also acknowledge in the introduction. The authors therefore reason that they use this lineage tracing model to better understand the role of EMT in chemoresistance. 

      A major problem with the current manuscript is that the authors present many of their findings as a novel without the proper acknowledgment of previously published literature in particular, Prakash et al., Nature Communications, 2019 and Dermitt, Dev Cell, 2020. In the studies by Prakash, the authors demonstrate that maintaining ongoing rRNA biogenesis is essential for the execution of the EMT program, and thus the ability of cancer cells to become migratory and invasive. Further, Prakash et al showed that blocking rRNA biogenesis with a small molecule inhibitor, CX-5461 (which is also used in the study by Ban et al) specifically inhibits breast cancer growth, invasion, EMT, and metastasis in animal models without significant toxicity to normal tissues. As such a significant revision that is necessary at this time is a rewrite of the manuscript especially the introduction and the discussion to more accurately describe and cite previously published findings and then highlight the current work by Ban et al which nicely builds on the previously published literature as it highlights the contribution of EMT to chemoresistance rather than metastasis. The suggestion for the authors is that they therefore should focus on highlighting the chemotherapy resistance angle as their Tri-PyMT EMT lineage tracing was chosen to test this angle and as such focus on both primary tumor growth and metastasis. 

      We appreciate the reviewer’s insightful feedback. In response, we have revised a section in the discussion to better highlight how our study builds upon and extends the work of others. We acknowledge that the link between ribosome biogenesis (RiBi) and the epithelial-mesenchymal transition (EMT) pathway was noted by prior researches (Prakash et al. 2019; Ebright et al. 2020). In the revised manuscript, we have included extra discussion about the topic. Our findings, however, contribute to this knowledge by elucidating increased activities of RiBi during both EMT and mesenchymal-epithelial transition (MET) processes, thereby deepening our understanding of its role. Additionally, we have clarified our novel stance on EMT-targeting strategies. Rather than solely targeting the mesenchymal phenotype, we propose that inhibiting the phenotypic switching ability of tumor cells (a round trip encompassing both EMT and MET) could be more effective, as described in the introduction part.

      Additional major revisions: 

      (2) The authors use the FSP1-Cre Model which in the field has been questioned as to not capture all the relevant EMT events and therefore their findings should be corroborated by another EMT model system. 

      We agree with the reviewer that the Fsp1-Cre model could not capture ALL the relevant EMT events. However, the fidelity and accuracy of Fsp1-Cre model in reporting EMT process of Tri-PyMT cells have also been demonstrated in our previous studies (Lourenco et al. 2020). Also, we have included additional results to further characterize this model: 1) Continuous fluorescence switching from RFP+ to GFP+ was observed in Tri-PyMT cells (Supplementary Fig S1); 2) Bulk RNA-seq data showed the differential expression of EMT marker genes with the RFP+ and GFP+ cells (Supplementary Fig S2A); 3) Single-cell RNA-seq data showed the EMT spectrum and EMT status distributions according to Fsp1(S100a4)/Epcam, and Vim/Krt18 expression (revised Supplementary Fig S3B, 3C). Hope these results clarify the reviewer’s doubt about the Fsp1-Cre model in reporting EMT of tumor cells. Of note, the evaluation of EMT status with RiBi activity does not rely solely on the fluorescent marker switch but on the ETM-related transcriptome (EMTome) of the Tri-PyMT cells. 

      Again, we agree with the reviewer that the Tri-PyMT model does not report ALL relevant EMT events. In the manuscript, we have included experiments with MD-MB231-LM2 cells (Fig 6D) and analyzed the sequencing databases of breast cancer patients (revised Supplementary Fig S13, S14), to validate the findings of the association between EMT status and RiBi activity.

      (3) In the current version of the manuscript, there are no measurements of rRNA synthesis, but the gene expression profiles are used as a proxy for rRNA synthesis. The authors therefore need to include measurements of rRNA synthesis corroborating the RNA sequencing data to support their scientific findings and claims. This can be accomplished by qPCR, Northern blot, or EU staining of the respective sorted cell population. Quantification of rRNA synthesis is also needed for the CX5461/BMH-21 and silencing studies. 

      We agree that direct measure rRNA synthesis is important to validate the association of RiBi activity with the EMT/MET process. Following the reviewer’s suggestion, we performed EU incorporation assay with RFP+, Double+, and GFP+ Tri-PyMT cells with and without RiBi inhibitors. Under the treatment-naïve condition, the double+ (EMT-transitioning) cells exhibited highest activity of rRNA synthesis compared to either RFP+ (E) and GFP+ (M) cells (revised Supplementary Fig S7). Also, as expected, the treatment of BMH21 or CX-5461 could significantly inhibit the rRNA synthesis (revised Supplementary Fig S8B).

      (4) Currently, there is no mechanistic insight as to how rRNA synthesis is increased during EMT, which would also strengthen the manuscript. This could be done through targeted ChIP analysis. 

      The experimental data in the current manuscript suggest that the activation of RiBi is upstream of the EMT process, as the impaired RiBi pathway hinders the EMT of tumor cells. We are uncertain about the suggestion regarding ChIP analysis. If the reviewer refers to ChIP analysis with EMT transcription factors (i.e., Snail, Twist, and Zeb1), it may not elucidate the mechanisms by which the EMT process is associated with rRNA synthesis. Using sorted GFP/RFP double-positive Tri-PyMT cells, we found enhanced activations in the ERK and mTOR pathways in the EMT-transitioning cells (Figure 3A). It is well-documented that the ERK and mTOR pathways are key coordinators of EMT (Xie et al., Neoplasia 2004; Shin et al., PNAS 2019; Lamouille et al., J. Cell Sci. 2012; Roshan et al., Biochimie 2019). Interestingly, we also observed significantly higher phosphorylation of rpS6, a downstream indicator of mTOR pathway activation, in the Doub+ cells. As an indispensable ribosome protein, rpS6 phosphorylation could impact ribosome functions of protein translation (Bohlen et al., Nucleic Acid Res. 2021; Mieulet et al., 2007).

      (5) rRNA synthesis has canonically been linked to the cell cycle therefore it will be necessary for the authors to determine the cell cycle state of their respective cell populations throughout the manuscript. 

      Following the reviewer's suggestion, we analyzed the cell cycles of RFP+, GFP+, and Doub+ Tri-PyMT cells. Our analysis revealed that the proportion of proliferating RFP+ cells (in the S phase) was higher than that of proliferating GFP+ cells. Interestingly, the Doub+ cells also exhibited a higher ratio of proliferation, which was significantly greater compared to both RFP+ and GFP+ cells (revised supplementary Figure S1B).

      (6) Statistics and quantifications are currently missing in several figures and need to be better explained throughout the manuscript to strengthen the scientific rigor of the studies. 

      We have improved the clarity of our manuscript. Proper statistics descriptions of experiments have been carefully reviewed and adequate information was edited in the revised manuscript.

      (7) Only metastasis studies are shown in the current version of the manuscript. These studies should be complemented with primary tumor studies as the main focus of the paper is the contribution of EMT to chemoresistance. 

      We appreciate the reviewer's suggestion regarding the primary tumor studies. We apologize for not stating clearly in our manuscript. In response, we have revised the manuscript to outline the rationale for establishing a competitive model by injecting a mixture of RFP+ and GFP+ cells in a 1:1 ratio via the tail vein. This model is designed to study of both EMT and MET processes under chemotherapy at a distal site, where tumor cells need phenotypic switches (both EMT and MET) to adapt to and overcome chemo/environmental challenges in this context. Indeed, we have studied the primary tumor growth with the pre-EMT (RFP+) and postEMT (GFP+) cells. Their differential contribution to tumor growth was published in another paper (Lourenco etal. Cancer Res 2020). 

      Reviewer #2 (Recommendations For The Authors): 

      Figure 1 and associated supplementary figure panels 

      Fig. 1A. More details are needed about the Tri-PyMT model and the induction of EMT in vitro. The authors mention that when growing the isolated cells they spontaneously undergo EMT when grown in 10% FBS. What is the timeline for this transition and how reproducible is it? This information is not clear from Supp. 1. When were cells taken for analysis and also how long is plasticity maintained? According to Supp 1. cell generation 15-21 seems to have a stable cell population of green, red, and yellow cells. Are these cell populations changing if one stimulates the whole cell population with a pro-EMT stimulus? Since cell proliferation is linked to rRNA synthesis the authors also need to include markers of cell cycle for the individual cell population to identify which cell cycle state each sorted cell population is associated with. 

      We thank the reviewer for recommending further analysis of the cell cycle among RFP+, GFP+, and Doub+ cells. As illustrated in the revised Supplementary Figure 1B, an increased proportion of RFP+ cells was observed in the S phases in comparison to GFP+ cells. Conversely, Doub+ cells demonstrated a proliferation rate even higher than to that of RFP+ cells.

      Upon sorting, RFP+ cells were found to spontaneously undergo epithelial-mesenchymal transition (EMT) when cultured in 10% FBS media, thereby converting to GFP+. We quantified the GFP+ cell percentage within the total cell population, noting a consistent transition of a certain proportion of RFP+ cells to EMT, leading to an accumulation of GFP+ cells. This accumulation stabilizes as approximately 60-70% of the entire population become GFP+. Remarkably, re-sorting RFP+ cells from this balanced tumor cell population resulted in a similar fluorescent transition pattern as observed in the parental population. The mechanisms by which tumor cells regulate the EMT phenotypes across the entire population remain unclear. Nevertheless, the equilibrium between RFP+ and GFP+ cells may be attributed in part to the more rapid proliferation of RFP+ cells and the limited proportion of tumor cells undergoing EMT.

      We conducted repeated long-term cultures (up to 20 passages) of the Tri-PyMT cells, yielding consistent results. The fluorescence transition pattern in Tri-PyMT cells proved highly reliable. Further details regarding the Tri-PyMT cells have been incorporated into the Methods section.

      Fig. 1B. The loading control is not even and quantification is missing, in the text, it states Vimten instead of Vimentin. 

      The less loading with Doub+ cells was due to the limited number of EMT transitioning cells we could purify by flow sorting. Even though, the expression of both epithelial and mesenchymal markers in the Doub+ cells were clear. In the revised manuscript, we have quantified the Western blot results. We also apologize for the type errors and have corrected the spelling of "Vimentin."

      Fig. 1K. In this figure, the authors write: 'It is worth noting that with the 2-phase classifications (Epi or Mes), the elevated RiBi activity was associated with the transitioning cells still exhibiting overall epithelial phenotypes; RiBi activities diminished as cells completed their transition to the mesenchymal phase'. But in Fig. 1K, the Ribi activity is already at a peak during the epithelial state and starts declining already at the beginning of the transition, can the authors please explain this data a bit more? The finding that ribosome biogenesis diminishes once the cells have completed their transition was shown in Prakash et al, Fig. 1 J, I, and accordingly their scientific findings should be discussed in the context of published work. 

      We acknowledge the reviewer's concerns regarding the comparison of the timeline for EMT in our model with that in Prakash's study. In our model, EMT-transitioning cells are identified by their EMT marker genes and fluorescence expression. We enriched the EMT transitioning cells by sorting the Doub+ cells. Due to the RFP protein's half-life, cells remain RFP+ for 2-3 days after the reporter cassette has switched to GFP expression. In Prakash's study, the EMT transitioning phase was defines by the duration of TGF-β stimulation.

      In Figure 1K, cells are categorized based on their EMT pseudotime, calculated from their expression of EMT marker genes in the EMTome. Ribosome biogenesis (RiBi) activity is highest in cells transitioning between phase 1 (Red) and phase 2 (Green), with both phases displaying predominantly epithelial phenotypes (Figures 1C, 1D, and 1E). RiBi activity declines in cells in phases 4, 5, and 3, which exhibit a mesenchymal phenotype. We have expanded the discussion to include more details in comparison with Prakash's study in the revised manuscript.

      Supp Fig S4. The authors should provide a rationale for how and why the specific marker genes were selected to calculate the AUC values. 

      We have chosen the specific EMT marker genes based on their overall expression levels in Tri-PyMT cells, ensuring consistency with the reported associations of their expression patterns to epithelial or mesenchymal phenotypes in the literature. We provide a detailed rationale for the selection of these genes in the Method of revised manuscript (Page #7).

      Figure 2 and associated supplementary figure panel. In this figure, rRNA synthesis needs to be evaluated in the cells isolated from the lungs to corroborate the RNA sequencing findings. 

      Following the reviewer’s suggestion, we performed an RT-PCR of Ribi related genes including Bop1, Gemin4, Its1, Its2, Npm1, Rpl8, Rpl29, Rps9, Rps24, Rps28, Polr1a, Setd4, Utp6, and Xpo1. Consistent with the bulk and single cell RNA sequencing, relatively higher expression of Ribi related genes were detected in Doub+ cells compared to that of RFP+ and GFP+ cells (revised Supplementary Fig S5). 

      Fig 2C, as per figure Supp Fig S4 please explain the rationale for how and why the specific marker genes were selected. 

      The same marker genes used for the calculation of the EMT AUC value as in Fig. 1. These marker genes were selected because their overall expression levels are readily detectable in Tri-PyMT cells, their expression patterns are consistent with their epithelial or mesenchymal phenotypes, and the associations between expression of marker genes and phenotypes are in line with the previous reports in literature. Description of AUCell value quantification was included in the revised manuscript (Page #7).

      Fig. 2G. The high Ribi during the epithelial state is most likely due to the resumption of cell proliferation of these cells. The authors should check the cell cycle states of these different sets of cells. 

      We agree with the reviewer that higher Ribi activity could be related to the resumption of cell proliferation of mesenchymal tumor cells. To clarify this, we revisited the scRNAseq data, and project the S phase score to the scatter plot of Ribi activity/MET pseudotime. Indeed, cells in the far mesenchymal state show low S phase score, while the proliferating cells were mostly detected in the MET transitioning phase and epithelial phase (revised Supplementary Figure S6D).

      Suppl Fig. 5 Please correct the figure legends as there is no figure D. 

      We apologize for the mislabeling. We have corrected the figure legend accordingly.

      Figure 3. Please explain the rationale for stimulating cells with FBS for the selected time points. 

      Fig. 3A. The loading control is not even, and quantification is missing. In addition, the authors should explain why the different time points were chosen and why FBS was chosen as a stimulus. In addition, from which passage of cells were these cells? 

      The RFP+ Tri-PyMT cells underwent EMT and switched their expression of fluorescent marker to GFP+ when cultured with FBS. To investigate the response of cells at varying EMT statuses to an FBS-enriched environment, we isolated RFP+, Doub+, and GFP+ cells from the 4th and 5th passages of Tri-PyMT cells and probed downstream signaling pathways after FBS stimuli. The timeline for stimulation was informed by the innate activation profile of these phosphorylation-dependent signals, spanning from 10 minutes to 1 hour. We noted that ERK signaling activation in RFP+ cells occurred within minutes of FBS exposure and diminished within approximately one hour. This ERK signal was more pronounced and persisted longer in Doub+ cells. In contrast, GFP+ cells exhibited a more transient and lower ERK activation (see revised Fig 3A). To address concerns regarding potential uneven loading in our previous assays, we have now included the quantification of Western blots in the revised Fig 3A.

      How and why were ERK and mTORC1 pathways chosen for analysis downstream of increased rRNA synthesis? ERK and mTORC1 have mostly been investigated in the role of cell proliferation which is why the cell cycle status of these cell populations will be important to consider in the context of their findings. 

      The regulation of ribosome biogenesis (RiBi) is mediated by multiple pathways, including the myelocytomatosis oncogene (Myc), mammalian targets of rapamycin (mTOR), and noncoding RNAs, as detailed by Jiao et al. in Signal Transduction and Targeted Therapy (2023). There was no significant difference in Myc expression between tumor cells with epithelial and mesenchymal phenotypes. We thus investigated the activation of the mTOR pathway in sorted RFP+, Doub+, and GFP+ cells. Additionally, given the recognized role of the ERK/MAPK signaling pathway in regulating protein synthesis and cell proliferation, we also analyzed the activation of ERK signals. 

      In alignment with the reviewer's observation regarding the potential correlation between cell proliferation rate and RiBi activation, we further characterized the cell cycle distributions of RFP+, Doub+, and GFP+ cells. Notably, the Doub+ cells exhibited a higher ratio of cells in the proliferative state (including S and G2/M phases) compared to RFP+ and GFP+ cells. Also, higher percentage of S phase cells were detected in RFP+ cells than GFP+ cells (revised Supplementary Figure S1B).

      Figure 3 B, C, D. Please provide more information about which cells are analyzed in this figure. 

      We apologize for the previous ambiguity regarding the cells analyzed in these figures. To clarify, the figure legend has been revised to specify that Tri-PyMT cells from the 5th to 10th passages were the subjects of analysis for cell size and nascent protein synthesis, utilizing flow cytometry.

      Figure 3D. The selected images show enlarged nucleoli/ fibrillarin which is an indicator of increased rRNA synthesis however, the authors need to show an increase in rRNA transcripts by q-PCR or Northern blot and also show EU staining in these different cell states to support their claim. 

      We appreciate the reviewer's recommendation to further validate the enhanced ribosome biogenesis (RiBi) in Doub+ cells. In response, we conducted RT-PCR analysis of several RiBi-related genes (revised Supplementary Fig S5). Additionally, we carried out an EU incorporation assay to illustrate the rRNA transcription activity within these cells. The new results have been incorporated into the revised manuscript (Supplementary Fig S7).

      Figure 4 and associated supplementary. In this figure, the authors show that using small molecule Pol I assembly inhibitors (BMH-21 and CX-5461) reduces the expression of mesenchymal proteins. As mentioned in previous comments these results should be put in the context of published work by Prakash et al which demonstrate that upon CX-5461 and genetic silencing of Pol I EMT is hampered as demonstrated by gene expression profiles as well as functional assays. 

      We revised the description of our experiments with Pol I inhibitors in the revised manuscript by including the citation context (Prakash et al Nat Commun, 2019) as mentioned above.  

      Figure 4A. Please provide an explanation of how the doses of Pol I assembly inhibitors were determined and also the selected time points. The Pol I assembly inhibitors should have an effect within a few hours (Drygin, Cancer Research, 2011, Peltonen, Cancer Cell, 24). The authors also need to show that the BMH-21 and CX5461 at selected doses are indeed inhibiting rRNA synthesis in the selected cell populations. The data would also be strengthened by performing ChIP analysis demonstrating that indeed the Pol I complex is disassociated from the rDNA genes upon inhibition. 

      In addition, why are there only 2 reports and how were the statistics done? Were the data normalized to the total number of cells? The graph visually shows a difference in cell numbers. Are cells dying at this concentration? More controls must be included including markers for cell stress, p53, autophagy, and apoptosis. 

      The dose of Pol inhibitors was selected based on prior studies, as noted by the reviewer. Peltonen et al. demonstrated that BMH-21 inhibits growth across a wide spectrum of cancer cell lines, achieving a mean half-maximal inhibition of cell proliferation (GI50) at 160 nM (Peltonen K., et al. Cancer Cell. 2014). Consistently, in our experiments, the growth inhibitory effect of BMH-21 on Tri-PyMT cells fell within this range, at approximately 200 nM (Fig 5B, Supplementary Fig S10). 

      To address the reviewer's suggestion and verify that RiBi inhibitor effectively inhibits rRNA synthesis in our study, we conducted an EU incorporation assay. This assay revealed significant inhibition of rRNA synthesis by BMH-21 and CX5461 in Tri-PyMT cells (revised Supplementary Fig S8B). Furthermore, to enhance the robustness of our findings, we repeated the BMH-21 treatment on sorted RFP+ Tri-PyMT cells across three biological replicates, which yielded consistent results.

      Figure 4B. How many replicates were done for this experiment and please provide quantification as per previous comments on WB experiments. The authors should provide a rationale for why Snail and Vimentin were chosen for these studies. Also, the authors should provide a functional assay and demonstrate that cells are less migratory post-treatment and not only markers. 

      Western blots with sorted Tri-PyMT cells were performed twice. We have added the quantification of these blot in the revised manuscript. Snail and Vimentin were chosen as mesenchymal markers to indicate EMT phenotype switches as those were well-studied and commonly used mesenchymal markers of EMT. The association of fluorescent marker switch and

      EMT phenotype such as cell migration was well established in our previous study (Fischer et al., 2015, Lourenco et al., 2020). The morphology and migration property of GFP+ were well distinguished from RFP+ counterparts. Also, following reviewer’s suggestion, we performed migration assay with BMH21 treatment (revised Supplementary Fig 8C). Indeed, the treatment with BMH21 or CX5461 inhibited cell migration as expected.

      Supplementary figure 7. The authors need to provide a rationale as to why the two Rps were chosen to inhibit ribosome biogenesis. 

      The two Rps targets were chosen based on their differential expression in Doub+ cells compared with RFP+ and GFP+ cells. Also, we considered the overall expression level of these genes in Tri-PyMT cells. We have edited the according text in the revised manuscript.

      Figure S7B. In the images shown there does not appear to be a significant change in the number of nucleoli however the cells seem to be smaller. This should be explained. 

      We agree with the reviewer that the box plot does not clearly show the nucleoli differences between these cells. We present the data with a violin plot, which more clearly exhibit the result (revised Supplementary Fig S9B). It was also true that the sizes of the Rps knockdown cells were relatively smaller than control cells. This is consistent with the finding that the EMT transitioning cell size was bigger than the non-transitioning cells (Fig 3B)

      .

      Figure 5 and Supp 8. The authors should provide the background as to why the specific chemotherapeutic drugs were chosen. 

      The chemotherapeutic agents employed in this study are widely used in the treatment of breast cancer. For instance, Cyclophosphamide (CTX) hampers both DNA replication and RNA transcription; Doxorubicin inhibits DNA replication by disrupting topoisomerase activity; Paclitaxel prevents cell division by stabilizing microtubules; and 5-Fluorouracil (5-FU), a pyrimidine analog, blocks thymidylate synthase, thereby disrupting DNA synthesis. Additionally, some of these agents, such as CTX and 5-FU, may directly or indirectly affect RNA polymerase, prompting us to investigate the synergistic effects of these drugs when used in combination with BMH21. We have included the information in revised manuscript. 

      Fig 5B/Supp 8. Can the authors please explain why only 2 replicates were done and provide a rationale for future statistics? 

      Using serial concentrations of drugs tested—6 doses for BMH21 and 8 doses for CTX—it is logical to arrange the experiment in duplicates on 96-well plates. For the statistical analysis, we conducted dose-response analysis to ascertain the IC50 values for each drug alone and in combination. Additionally, we calculated the synergy score to assess the interactions between the drugs. The methodology section of the manuscript has been enhanced to provide a clearer description of these processes in the revised version.

      Figure 6. The authors should provide a rationale of why tail veins were chosen as their in vivo model system as the EMT cells do not cause metastasis and if chemoresistance is the main focus of their studies both primary and secondary tumors should be considered. Why was not the MMTVPyMT mouse model chosen where the cells were originally isolated from to test the role of the dual treatment? How was the drug concentration decided and the interval of treatments? 

      We acknowledge the reviewer's concerns regarding the choice of experimental setup for our metastasis model. Certainly, utilizing the original MMTV-PyMT mice for the combination therapy experiment would be the ideal scenario. However, there are potential drawbacks to using these transgenic mice: 1) The occurrence of multiple primary tumors that develop simultaneously but without synchronized timelines (in mice aged 6-9 weeks), and the unsynchronized development of lung metastasis (from 10-16 weeks of age). This leads to uncontrollable variations in the experimental setup, particularly when establishing multiple treatment groups; 2) Gathering a sufficient number of female transgenic mice of a similar age poses another challenge; 3) The absence of tumor cell labeling complicates the focus on assays for EMT/MET phenotype changes during tumor progression. Consequently, we have chosen to employ our Tri-PyMT model for this experiment. The drug treatment protocol was established after reviewing literature on the in vivo application of CTX and BMH21 treatment (Peltonen etal. Cancer Cell 2014; Jacobs etal. JBC 2022).

      Figure 6B, C. The authors should provide quantification for these data, how many mice were analyzed, and how many sections were stained and analyzed. 

      We have improved the quality of these fluorescent images and clarify the methodology, including the mouse/section numbers per group, for obtaining these fluorescent images in the legend. To quantify the differential impact of BMH21 on RFP+ and GFP+ tumor cells, we performed flow cytometry (revised Supplementary Fig S11). We have also changed the presentation of these flow data to improve the clarity of these results. 

      Fig 6D. How were the treatment timeline and dosing chosen? LM2 cells are derived from a metastatic site, so they are not transitioning cells they are stably mesenchymal why was this chosen as their in vivo model? 

      LM2 cells were derived from the lung metastasis of MDA-MB-231 cell line. These cells exhibit predominantly mesenchymal phenotype in culture. While growing into metastasis in the lung, expressions of epithelial markers such as E-cad were upregulated (Supplementary Fig S12), suggesting a MET process may be involved the outgrowth of lung metastasis. Therefore, we choose the LM2 cells as our experimental model for assessing the effect of RiBi inhibitor on MET. The treatment timeline was determined based on previous studies of BMH21 and chemotherapy applications in vivo (Peltonen etal. Cancer Cell 2014; Jacobs etal. JBC 2022).  

      Reviewer #3 (Public Review): 

      Summary: 

      Ban et al. investigated the role of ribosome biogenesis (RiBi) in epithelial-to-mesenchymal transition (EMT) and its contribution to chemoresistance in breast cancer. They used a Tri-PyMT EMT lineage-tracing model and scRNA-seq to analyze EMT status and found that RiBi was elevated during both EMT and mesenchymal-to-epithelial transition (MET) of cancer cells. They further revealed that nascent protein synthesis mediated by ERK and mTOR signaling pathways was essential for the completion of RiBi. Inhibiting excessive RiBi impaired EMT and MET capability. More importantly, combinatorial treatment with RiBi inhibitors and chemotherapy drugs reduced metastatic outgrowth of both epithelial and mesenchymal tumor cells. These results suggest that targeting the RiBi pathway may be an effective strategy for treating advanced breast cancer with EMT-related chemoresistance. 

      Strengths: 

      The conclusions of this study are generally supported by the data. However, some weaknesses still exist as mentioned below. 

      Weaknesses: 

      (1) The study predominantly focused on RiBi as a target for overcoming EMT-related chemoresistance. Thus, it will be necessary to provide some canonical outcomes after upregulating ribosome biogenesis, such as translation activity. I would suggest ribosome profiling or puromycin-incorporation assay, or other more suitable experiments. 

      EU incorporation assay (revised Supplementary Fig S7) and puromycin incorporation assay (Fig 3C) were performed.

      (2) The results were basically obtained from mice and in vitro experiments. While these results provide valuable insights, it will be valuable to validate part of the findings using some tissue samples from patients (e.g. RiBi activity) to determine the clinical relevance and potential therapeutic applications.  

      We agree. We have added the analyses on the correlation between patients’ survival and RiBi activation (revised Supplementary Fig S13, S14).

      (3) The results revealed that mTORC1 and ERK mediated RiBi activation. How about mTORC2? It will be informative to evaluate mTORC2 signaling. 

      We investigated the role of the mTORC1 pathway in regulating RiBi activation. It is pertinent to acknowledge that the mTORC1 complex is known to positively regulate protein synthesis through the phosphorylation of ribosomal protein S6 kinase, among other mechanisms. Additionally, Rps6 is recognized as an essential component of the 40S subunit in the ribosome. We agree with the reviewer that mTORC2 may also be involved in RiBi activity, as its activation is mediated through ribosome association (Zinzalla et al., Cell 2011; Prakash et al., Nat Comm 2019). However, this association is more likely to be downstream of RiBi activation, as the RiBi inhibitor CX5461 can block the translocation of Rictor into the nucleus (Prakash et al., Nat Comm 2019).

      We also revisited our sequencing data of RFP+, GFP+, and Doub+ cells. While there was no significant change in the expression of either Rptor or Rictor among these cells, the LSMean (overall expression level) of Rptor was higher than that of Rictor; for example, 163.77 vs 29.95 in RFP+ cells. This suggests that mTORC1 may play a dominant role in regulating RiBi activity in our model.

      Furthermore, we analyzed how Rapamycin (an mTORC1 inhibitor) affects the EMT process in TriPyMT cells. As expected, Rapamycin-treated cells exhibited higher expression of the epithelial marker E-cadherin (Ecad) and lower expression of the mesenchymal markers Snail and Vimentin (Vim) compared to the control (For Reviewers Figure 3).

      (4) The results also demonstrated promising synergic effects of Pol I inhibitor (BMH21) and chemotherapy drug (CTX) on chemo-resistant metastasis. How about using the inhibitors of mTORC1 together with CTX? 

      Several mTOR inhibitors (e.g., sirolimus, temsirolimus, ridaforolimus) have demonstrated antitumor activity. The combination of mTOR inhibitors with various targeted therapies or chemotherapies is being examined in numerous clinical trials, showing promising results. Although the combination therapy of mTORC inhibitors and CTX is beyond the scope of our study, we analyzed how mTOR inhibitors may affect the EMT process in our model, as mentioned above. Western blot analysis of EMT markers (E-cadherin, Snail, and Vimentin) showed that rapamycin treatment inhibited the EMT transition of Tri-PyMT cells. (For Reviewers Figure 3).

      (5) While the results demonstrate the potential efficacy of RiBi inhibitors in reducing metastatic outgrowth, other factors and mechanisms contributing to chemoresistance may exist and need further investigation. I would suggest some discussion about this aspect. 

      Following reviewer’s suggestion, we have edited the discussion section with more future directions. 

      Reviewer #3 (Recommendations For The Authors): 

      (1) Please provide the quantified data for all western blots, rather than solely show some representative blots. 

      We quantified the western blot images as shown in the revised figures. Thanks for reviewer’s suggestion.  

      (2) Please add a graphic abstract or schematic to help the readers understand the whole story. 

      We have summarized a schematic graph of our findings in the revised manuscript (Supplementary Fig S15).

      (3) It is hard to read the numbers inside all plots of flow cytometry. 

      High-resolution figures of flow plots are included in the revised manuscript.

      (4) Please provide high-resolution figures for all the synergy plots.

      High-resolution figures of synergy plots are included in the revised manuscript.

    1. Author response:

      The following is the authors’ response to the original reviews.

      Public Reviews:

      Reviewer #1 (Public Review):

      In this manuscript, Wang et al. demonstrate that knockdown of DYRK1A results in reduced cell size, which is mediated by mTORC1 activity. They found that DYRK1A interacts with TSC1/TSC2 proteins which leads to the phosphorylation of TSC2 at T1462. Phosphorylation of TSC2 at T1462 inhibits TSC2 activity leading to the activation of mTORC1. The authors complement their findings by demonstrating that overexpression of RHEB (positive regulator of mTORC1) rescues the phenotype of DYRK1A (mnb in flies) mutation in the NMJ.

      The authors' findings on the regulation of cell size and mTORC1 activity by DYRK1A reflect the previous findings of Levy et al. (PMID: 33840455) that cortical deletion of Dyrk1a in mice causes decreased neuronal size associated with a decreased activity of mTORC1 that can be rescued by the inhibition of Pten or supplementation of IGF1.

      The authors demonstrate that T1462 phospho-site at TSC2 is phosphorylated in response to the overexpression of WT but not kinase-dead DYRK1A. However, the authors do not provide any evidence that the regulation of mTORC1 is mediated via phosphorylation of this site. In addition, T1462 site is known to be phosphorylated by Akt. There is a possibility that Akt was co-purified with TSC1/TSC2 complex and DYRK1A promotes phosphorylation of TSC2 indirectly via the activation of AKT that can be tested by using AKT depleted cells.

      We thank the reviewer for reviewing this manuscript and the critical comments. Various groups have reported the significance of the Phosphorylation of TSC2 T1462, along with four other phosphorylation sites, in regulating mTORC1, and therefore, we did not deal with this in the current manuscript (Manning et al. PMID: 12150915, Inoki et al. PMID: 12172553, Zhang et al. PMID: 19593385). Regarding co-purification of AKT with TSC1/TSC2 - AKT phosphorylates T1462, S939 and S1387 (Manning et al. PMID: 12150915, Inoki et al. PMID: 12172553, Zhang et al. PMID: 19593385). However, in in vitro kinase assay, signal intensities of anti-TSC2 S939 and S1387, with or without ATP, showed no significant difference, suggesting that AKT is not pulled down with TSC1 or TSC2. DYRK1A and Kinase dead DYRK1A were expressed and purified from bacteria.  Moreover, multiple studies have purified TSC1 and TSC2 and reported no AKT co-purified (Menon et al. PMID: 24529379, Chong-kopera et al. PMID: 16464865).

      RHEB is the most proximal regulator of mTORC1 and can activate mTORC1 even under amino acid starvation. The fact that RHEB overexpression rescues the cell size under DYRK1A depletion or mnb (DYRK1A in Drosophila) mutant phenotype does not prove that DYRK1A regulates the cell size via TSC1 as it would rescue any inhibitory effects upstream to mTORC1.

      We agree with the reviewer that overexpression of RHEB may rescue any inhibitory effects upstream to mTORC1.  In the results and discussion sections (Page number 7, last 3 lines), we mentioned that Rheb overexpression only supports our suggestion that DYRK1A likely works upstream to RHEB. We, however, have performed another experiment to strengthen our hypothesis. We show that increased cell size phenotype due to DYRK1A overexpression can be suppressed by inhibiting the TORC1 pathway, suggesting that mTORC1 is necessary for DYRK1A-mediated cell growth.  These results are presented in Supplementary Figure 4. The results of two reciprocals of experiments (Suppression of DRYK1A/Mnb loss of function phenotypes by RHEB overexpression and suppression of rescue of DYRK1A Gain of function phenotypes) along with and regulation of TSC phosphorylation by DYRK1A strongly suggests that DYRK1A positively regulates TSC pathway.

      Reviewer #2 (Public Review):

      This study aims to describe a physical interaction between the kinase DYRK1A and the Tuberous Sclerosis Complex proteins (TSC1, TSC2, TBC1D7). Furthermore, this study aims to demonstrate that DYRK1A, upon interaction with the TSC proteins regulates mTORC1 activity and cell size. Additionally, this study identifies T1462 on TSC2 as a phosphorylation target of DYRK1A. Finally, the authors demonstrate the role of DYRK1A on cell size using human, mouse, and Drosophila cells.

      This study, as it stands, requires further experimentation to support the conclusions on the role of DYRK1A on TSC interaction and subsequently on mTORC1 regulation. Weaknesses include, 1) The lack of an additional assessment of cell growth/size (eg. protein content, proliferation), 2) the limited data on the requirement of DYRK1A for TSC complex stability and function, and 3) the limited perturbations on the mTORC1 pathway upon DYRK1A deletion/overexpression.

      We thank the reviewer for reviewing this manuscript and the comments. We have previously analyzed the effect of DYRK1A knockdown in the proliferation of THP cells (human leukemia monocytic cell line) (Li Shanshan et al. PMID: 30137413) and have shown that DYRK1A knockdown negatively affects cell proliferation. Other studies have also shown a role for DYRK1A in cell proliferation, including in foreskin fibroblasts (Chen et al. PMID: 24119401) and HepG2 cells (Frendo-Cumbo et al. PMID: 36248734). mTORC1 regulates several pathways, including protein synthesis, lipid synthesis, nucleotide synthesis, autophagy, and stress responses. We have not done the protein content as this parameter is directly affected by TORC1 activation and may not be a suitable measure for cell growth. A large number of studies involving mTORC1 regulation analyze the levels of S6K and S6 phosphorylation, as these are direct readouts of mTORC1 function   (Prentzell et al. PMID: 33497611,  Zhang et al. PMID: 17052453, Ben-Sahra et al, PMID: 23429703, Düvel et al. PMID: 20670887,  Zhang et al. PMID: 2504303). Therefore, we used these markers to assess the status of the mTORC1 pathway.

      (2) ..the limited data on the requirement of DYRK1A for TSC complex stability and function,

      We agree with this limitation in our study. We have not seen a significant difference in TSC1 or TSC2 protein levels in DYRK1A knockdown or overexpressing cells, so we did not follow up on this aspect.

      ..and 3) the limited perturbations on the mTORC1 pathway upon DYRK1A deletion /overexpression.

      We have performed an additional experiment where we overexpressed DYRK1A and showed that increased cell size phenotype due to DYRK1A overexpression can be suppressed by inhibiting the TORC1 pathway, suggesting that mTORC1 is necessary for DYRK1A-mediated cell growth.  These results are presented in Supplementary Figure 4. The results of two reciprocals of experiments (Suppression of DRYK1A/Mnb loss of function phenotypes by RHEB overexpression and suppression of Rescue of DYRK1A Gain of function phenotypes) along with and regulation of TSC phosphorylation by DYRK1A suggests that DYRK1A positively regulates TSC pathway.

      Finally, this study would benefit from identifying under which nutrient conditions DYRK1A interacts with the TS complex to regulate mTORC1. The interaction described here is highly impactful to the field of mTORC1-regulated cell growth and uncovers a previously unrecognized TSC-associated interacting protein. Further characterization of the role that DYRK1A plays in regulating mTORC1 activation and the upstream signals that stimulate this interaction will be extremely important for multiple diseases that exhibit mTORC1 hyper-activation.

      We agree that identifying nutrients (or physiological conditions) that affect DYRK1A-mediated TSC regulation will be important to understanding the additional complexity in context-dependent mTORC1 activation/deactivation. This study has not addressed those issues, particularly due to DYRK1A's pleiotropic nature. DYRK1A has many substrates, and both overexpression and loss of DYRK1A lead to multiple phenotypes. Identifying nutrient conditions or growth factors that can regulate the activation of DYRK1A is not yet known and would require an independent investigation.

      Reviewer #3 (Public Review):

      The manuscript describes a combination of in vitro and in vivo results implicating Dyrk1a in the regulation of mTORC. Particular strengths of the data are this combination of cell and whole animal (drosophila) based studies. However, most of the experiments seem to lack a key additional experimental condition that could increase confidence in the authors' conclusions. Overall some tantalizing data is presented. However, there are several issues that should be clarified or otherwise addressed with additional data.

      We thank the reviewer for reviewing and commenting on this manuscript.

      (1) In Figure 1G, why not test overexpression levels of Dyrk1a via western rather than only looking at the RNA levels?

      Induced overexpression of DYRK1A was probed by analyzing mRNA levels, as the concentration of Doxycycline used (0-100 ng/ml) did not produce enough protein that could be detected by anti-flag antibody in a western blot. We have modified the sentence (page 5, paragraph 1).

      (2) In Figure 2, while there is clearly TSC1 protein in the Dyrk1a and FLAG-Dyrk1a IPs that supports an interaction between the proteins, it would be good to see the reciprocal IP experiment wherein TSC1 or TSC2 are pulled down and then the blot probed for Dyrk1a.

      In the revised manuscript, we have provided evidence that TSC1 and TSC2 can interact with endogenous DYRK1A. We have performed immunoprecipitation of affinity-tagged TSC1 or TSC2 and have probed for the enrichment of DYRK1A (Supplementary Figure S2).

      (3) Figures 3 A and D tested the effects of Dyrk1a knockdown using different methods in different cell lines. This is a reasonable approach to ascertain the generalizability of findings. However, each experiment is performed differently. For example, in 3A, the authors found no difference in baseline pS6, so they did a time course of treatment to induce phosphorylation and found differences depending on Dyrk1a expression. In 3D, they only show baseline effects from the CRISPR knockdown. Why not do the time course as well for consistency? Also, why the an inconsistency in approaches wherein one shows baseline effects and the other does not? The authors could also consider the pharmacologic inhibition of Dyrk1a activity as well.

      We agree that different methods were used in different cell lines to assess the effect of DYRK1A. Since DYRK1A is a pleiotropic gene, its manipulation has diverse effects on different cell lines. Also, not all cell types have similar levels of mTORC activity. Hence, we had to adapt to different strategies in different cell types, which accounted for the inconsistency in the methodology.  However, various groups have used these methods to determine the activity of mTORC1 by S6 and S6K phosphorylation by both starvations, followed by the stimulation and direct estimation methods in cycling cells (Prentzell et al. PMID: 33497611,  Zhang et al. PMID: 17052453, Ben-Sahra et al, PMID: 23429703, Düvel et al. PMID: 20670887,  Zhang et al. PMID: 25043031). ShRNA-mediated knockdown in HEK293 cells does not change S6 or S6K phosphorylation levels in actively growing cells, whereas cycling NIH3T3 cells shows a significant reduction in S6 and S6K phosphorylation. As suggested, we used pharmacological inhibition of DYRK1A and 1uM Harmine to treat the HEK293 cells and perform starvation. However, cells treated and starved start to float and die in large numbers. Thus, we did not follow this experiment further.

      (4) In Figure 4, RHEB overexpression increases cell size in both Dyrk1a wt and Dyrk1a shRNA treated cells, although the magnitude of the effect appears reduced in Dyrk1a shRNA cells. However, there is the possibility here that RHEB acts independently of Dyrk1a. Why not also do the experiment of Figure 1 wherein Dyrk1a is overexpressed and then knockdown RHEB in that context? If the hypothesis is supported, then RHEB knockdown should eliminate the cell size effect of Dyrk1a overexpression.

      We thank the reviewer for suggesting this experiment.  We have overexpressed DYRK1A using the inducible HEK293A-Flag-DYRK1A overexpression system and treated cells with mTOR inhibitors (Rapamycin or Torin1). The results are added to the supplementary figure S4. Our results show that the increased cell size phenotype due to DYRK1A overexpression can be suppressed by inhibiting the TORC1 pathway. This suggests that mTORC1 is necessary for DYRK1A-mediated cell growth. This data further supports the hypothesis that DYRK1A is a positive regulator of the mTORC1 pathway.

      (5) The discussion should incorporate relevant findings from other models, such as Arabidopsis. Barrada et al., Development (2019), 146 (3).

      We have incorporated the findings from Arabidopsis (Barrada et al., Development (2019), 146 (3) PMID: 30705074) in the last paragraph of the discussion section.

      Recommendations for the authors:

      Reviewer #1 (Recommendations For The Authors):

      (1) To demonstrate that DYRK1A can phosphorylate T1462 phospho-site at TSC2 in the absence of Akt using genetic and pharmacological approaches (by using pan-Akt small molecule inhibitors).

      We have performed in vitro kinase assay using recombinant DYRK1A, and affinity purified TSC1/TSC2 from HEK293 cells. However, we have not been able to perform this experiment by overexpression of DYRK1A in human cells, as 1) strong overexpression of DYRK1A leads to cell cycle exit, as demonstrated by various laboratories (Soppa et al. PMID: 24806449, Hämmerle et al PMID: 21610031,  Najas et al. PMID: 26137553, Park et al. PMID: 20696760) and our observations, and 2) T1462 Antibody signal is weak and cannot be seen in cellular extracts. We have attempted this experiment with at least three different batches of T1462 antibody from CST without success.

      (2) To demonstrate that endogenous phosho-mutant/mimetic substitution of T1462 phospho-site at TSC2 is sufficient to prevent the regulation of cell size/NMJ phenotype in Drosophila by DYRK1A (mnb).

      This is an interesting experiment, and we thank the reviewer for this suggestion. However, we are skeptical about interpreting the possible results. Since T1462 substitution will also block the regulation by other kinases, e.g., Akt, and it may constitutively suppress the mTORC1, any interpretation will be confusing.

      Reviewer #2 (Recommendations For The Authors):

      (1) In section 2.1 the authors claim that DYRK1A down-regulation enhances cell growth. An additional assessment of cell growth or size would strengthen this statement. Is total protein content also increased upon DYRK1A overexpression? Does DYRK1A KD also increase cell proliferation? In Figure 1, providing the median or mean size of cells in each condition will help the reader understand the impact of DYRK1A on cell size. In Supplementary Figure 1, the important statistical differences should be highlighted.

      We have not claimed that down-regulation of DYRK1A enhances cell growth. We have not tested the protein content in a cell directly. Knockdown of DYRK1A leads to a reduction in cell proliferation, as shown by various groups, including ours (Shanshan Li PMID: 30137413, Luna et al. PMID: 30343272). Cell size is a very dynamic process and is variable within the population. All the studies measuring cell size show the size using assays on a population of cells. We have not been able to figure out a way to display the median or mean cell size that accurately reflects the cell size of the whole population. 

      (2) In section 2.2 the authors describe the interaction between DYRK1A and the TSC proteins. Do the DYRK1A mutants impact interaction with TSC2 and TBC1D7 or is this specific to TSC1?

      We have not tested this possibility.

      (3) In section 2.3, more detailed perturbations of the mTORC1 pathway are needed. Is the mTORC1 activation observed sensitive to rapamycin treatment? Since mTORC1 regulates cell size via S6 ribosomal protein and transcription via 4EBP1, phosphorylation of 4EBP1 should also be considered. In Figure 3A, what is the level of DYRK1A down-regulation? It is unclear how many shRNA constructs were used or whether these were pooled constructs or single clones. If one shRNA/sgRNA is used, it would be very helpful to validate some of the key findings of this study with at least one more clone.

      Many research studies have measured the activity of various mTORC1 substrates, the most commonly used being the phosphorylation of S6 and S6K. We agree that analyzing 4EBP1 would make the study more comprehensive, but to complete the study with our limited resources and in a limited time, we have not attempted to establish the 4EBP1 phosphorylation status. We have used a previously described and validated DYRK1A shRNA (as mentioned in the methods section).

      (4) In section 2.3 is T1462 an activating or inhibiting phosphorylation event? If DYRK1A phosphorylates and activates mTORC1 via RHEB, shouldn't that result in the inhibition of mTORC1?

      Multiple laboratories have demonstrated that T1462 phosphorylation leads to a reduced TSC complex activity and, hence, increased mTORC1 activity (Manning et al. PMID: 12150915, Inoki, PMID: 12172553, Zhang PMID: 19593385).

      (5) In section 2.4, what is the status of AKT phosphorylation? Would an AKT inhibitor be useful in this scenario?

      AKT phosphorylates T1462, S939 and S1360, as demonstrated by others. However, in our in vitro assay kinase assay, the following facts suggest that AKT is not involved in T1462 phosphorylation we observed:

      (1) Signal intensities of anti-TSC2 S939 and S1387 with or without ATP, do not show any significant differences, suggesting that AKT is not pulled down with TSC1 or TSC2.

      (2) Multiple studies have performed phosphorylation studies of TSC1 and TSC2 and have not reported any co-purification of AKT.

      (6) Very minor grammar errors were observed, mostly at the beginning of the manuscript.

      We tried our best to fix grammatical errors.

    1. Author response:

      Reviewer #1 (Public Review):

      In this manuscript, Yang et al. conduct a comprehensive investigation to demonstrate the role of adipose tissue Mir802 in obesity-associated inflammation and metabolic dysfunction. Using multiple models and techniques, they propose a mechanism where elevated levels of Mir802 in adipose tissue (both in mouse models and humans) trigger fat accumulation and inflammation, leading to increased adiposity and insulin resistance. They suggest that increased Mir802 levels in adipocytes during obesity result in the downregulation of TRAF3, a negative regulator of canonical and non-canonical NF-κB pathways. This downregulation induces inflammation through the production of cytokines/chemokines that attract and polarize macrophages. Concurrently, the NF-κB pathway induces the lipogenic transcriptional factor SREBP1, which promotes fat accumulation and further recruits pro-inflammatory macrophages. While the proposed model is supported by multiple experiments and consistent data, there are areas where the manuscript could be improved. Some improvements can be addressed in the text, while others require additional controls, experiments, or analyses.

      1) The manuscript should provide measurements of lipid droplet/adipocyte size for all models, both in vitro and in vivo. In vivo studies should also include fat weight measurements. This is crucial to determine whether Mir802, TRAF3, and SREBP1 promote adiposity/fat accumulation across all models.

      Thank you for your careful reviewing. As suggested, we have measured the size of lipid droplet and adipocyte (1J, 2A, S2I, 3F, 3L, S3L, 5I), this modification can make you and other readers understand our manuscript more clearly. In vivo studies have included fat weight measurements (Figure 2K, L; Figure 3C, D; Figure 5N). Our results determined that adipose-selective overexpression Mir802 induced adipogenesis during high fat diet induced.

      2) The rationale for co-culture experiments using WAT SVF is unclear, given that Mir802 is upregulated by obesity in adipocytes, not in the stromal-vascular fraction. These experiments would be more relevant if performed using isolated adipocytes or differentiated WAT SVF.

      Thank you for this important point. We are sorry for our inaccurate expression. In our study, we used differentiated WAT SVF to co-culture with primary macrophage, we illustrated it in the methods of Migration and invasion assays. We have revised it in the Flowchart of the co-culture experiments (Figure 4A). We hope that this modification will enhance readers' comprehension of our manuscript.

      3) Figures 1G and 1H lack a control group (time 0 or NCD). Without this control, it is impossible to determine if inflammation precedes Mir802 upregulation.

      Thank you for this insightful comment. In the previous study, we have tested the 0 weeks high fed diet treatment group of the Figures 1I and 1J, now we have added this data in the manuscript, we hope this modification can enhance our conclusion that inflammation precedes Mir802 upregulation.

      4) The statement, "The knockout of Mir802 in adipose tissue did not alter food intake, body weight, glucose level, and adiposity (data not shown)," needs more detail regarding the age and sex of the animals. These data are important and should be reported, perhaps in a supplementary figure.

      Thank you for your careful reviewing. To enhance our conclusions, we have added the data of food intake, body weight, glucose level, and adiposity about Mir802 KO mice treated with normal chow diet (NCD, Supplementary Figure 3E-I).

      ….The knockout of Mir802 in adipose tissue did not alter food intake, body weight, glucose levels, and adiposity compared with their WT littermates in both males and females when they were fed with NCD (Figure S3E-I)……

      5) The terms "KO" (knockout) and "KI" (knock-in) are misleading for AAV models, as they do not modify the genome. "KD" (knockdown) and "OE" (overexpression) are more accurate.

      Thank you for your good advice. We are sorry for our inaccurate expression. According to your advice, we have rewritten it. AAV models for Mir802 knockdown (Figure 3) and Traf3 overexpression (Figure 5) have changed to KD and OE respectively.

      6) The statement, "Mir802 expression was unaffected in other organs (Figure S3O)," should clarify that this is except for BAT.

      We appreciate the you for this insightful comment. We have clarified that Mir802 expression was unaffected in other organs except for BAT (Figure S3T, revised manuscript).

      By addressing these points, the manuscript would present a more robust and clear demonstration of the role of Mir802 in obesity-associated inflammation and metabolic dysfunction.

      Thanks for your positive comments. As suggested, we have modified all point.

      Reviewer #2 (Public Review):

      Yang et al. investigated the role of Mir802 in the development of adipose tissue (AT) inflammation during obesity. The authors found Mir802 levels are up-regulated in the AT of mouse models of obesity and insulin resistance as well as in the AT of humans. They further demonstrated that Mir802 regulates the intracellular levels of TRAF3 and downstream activation of the NF-kB pathway. Ultimately, controlling AT inflammation by manipulating Mir802 affected whole-body glucose homeostasis, highlighting the role of AT inflammatory status in whole-body metabolism. The study provides solid evidence on the role of adipocyte Mir802 in controlling inflammation and macrophage recruitment. However, how lipid mobilization from adipocytes and how engulfment of lipid droplets by macrophages control inflammatory phenotype in these cells could be better explored. The findings of this study will have a great impact in the field, contributing to the growing body of evidence on how microRNAs control the inflammatory microenvironment of AT and whole-body metabolism in obesity.

      Thanks for your positive comments.

      Reviewer #3 (Public Review):

      Mir802 appears to accumulate before macrophage numbers increase in adipose tissue in both mice and humans. The phenotype of Mir802 overexpression and deletion in vivo is sticking and novel. Deletion of Mir802 in adipose tissue after obesity onset also attenuated Adipose inflammation and improved systemic glucose homeostasis. Understanding how Mir802 affects the crosstalk between macrophage and adipocyte is a major point. For example, does Mir802 change the inflammatory of macrophages as it increases Traf3 expression in adipocytes? This is important because macrophages are the input if inflammatory mediators that will activate the TNFR receptor signaling pathway, potentially Traf3, resulting in impaired insulin stimulated Glut4 translocation and glucose uptake. Also, modulation of Mir802 levels in vivo leads to alterations in adiposity. Here, what is a direct effect of Mir802 and what is a result of simply reduced adiposity? One point that os ket is what triggers Mir802 expression, especially in obesity.

      Thanks for your important suggestions. According to your suggestions, we have addressed additional data in the revised manuscript to enhance our conclusion.

    1. Author response:

      Reviewer #1 (Public Review):

      In this paper, Tompary & Davachi present work looking at how memories become integrated over time in the brain, and relating those mechanisms to responses on a priming task as a behavioral measure of memory linkage. They find that remotely but not recently formed memories are behaviorally linked and that this is associated with a change in the neural representation in mPFC. They also find that the same behavioral outcomes are associated with the increased coupling of the posterior hippocampus with category-sensitive parts of the neocortex (LOC) during a post-learning rest period-again only for remotely learned information. There was also correspondence in rest connectivity (posterior hippocampus-LOC) and representational change (mPFC) such that for remote memories specifically, the initial post-learning connectivity enhancement during rest related to longer-term mPFC representational change.

      This work has many strengths. The topic of this paper is very interesting, and the data provide a really nice package in terms of providing a mechanistic account of how memories become integrated over a delay. The paper is also exceptionally well-written and a pleasure to read. There are two studies, including one large behavioral study, and the findings replicate in the smaller fMRI sample. I do however have two fairly substantive concerns about the analytic approach, where more data will be required before we can know whether the interpretations are an appropriate reflection of the findings. These and other concerns are described below.

      Thank you for the positive comments! We are proud of this work, and we feel that the paper is greatly strengthened by the revisions we made in response to your feedback. Please see below for specific changes that we’ve made.

      1) One major concern relates to the lack of a pre-encoding baseline scan prior to recent learning.

      a) First, I think it would be helpful if the authors could clarify why there was no pre-learning rest scan dedicated to the recent condition. Was this simply a feasibility consideration, or were there theoretical reasons why this would be less "clean"? Including this information in the paper would be helpful for context. Apologies if I missed this detail in the paper.

      This is a great point and something that we struggled with when developing this experiment. We considered several factors when deciding whether to include a pre-learning baseline on day two. First, the day 2 scan session was longer than that of day 1 because it included the recognition priming and explicit memory tasks, and the addition of a baseline scan would have made the length of the session longer than a typical scan session – about 2 hours in the scanner in total – and we were concerned that participant engagement would be difficult to sustain across a longer session. Second, we anticipated that the pre-learning scan would not have been a ‘clean’ measure of baseline processing, but rather would include signal related to post-learning processing of the day 1 sequences, as multi-variate reactivation of learned stimuli have been observed in rest scans collected 24-hours after learning (Schlichting & Preston, 2014). We have added these considerations to the Discussion (page 39, lines 1047-1070).

      b) Second, I was hoping the authors could speak to what they think is reflected in the post-encoding "recent" scan. Is it possible that these data could also reflect the processing of the remote memories? I think, though am not positive, that the authors may be alluding to this in the penultimate paragraph of the discussion (p. 33) when noting the LOC-mPFC connectivity findings. Could there be the reinstatement of the old memories due to being back in the same experimental context and so forth? I wonder the extent to which the authors think the data from this scan can be reflected as strictly reflecting recent memories, particularly given it is relative to the pre-encoding baseline from before the remote memories, as well (and therefore in theory could reflect both the remote + recent). (I should also acknowledge that, if it is the case that the authors think there might be some remote memory processing during the recent learning session in general, a pre-learning rest scan might not have been "clean" either, in that it could have reflected some processing of the remote memories-i.e., perhaps a clean pre-learning scan for the recent learning session related to point 1a is simply not possible.)

      We propose that theoretically, the post-learning recent scan could indeed reflect mixture of remote and recent sequences. This is one of the drawbacks of splitting encoding into two sessions rather than combining encoding into one session and splitting retrieval into an immediate and delayed session; any rest scans that are collected on Day 2 may have signal that relates to processing of the Day 1 remote sequences, which is why we decided against the pre-learning baseline for Day 2, as you had noted.

      You are correct that we alluded to in our original submission when discussing the LOC-mPFC coupling result, and we have taken steps to discuss this more explicitly. In Brief, we find greater LOC-mPFC connectivity only after recent learning relative to the pre-learning baseline, and cortical-cortical connectivity could be indicative of processing memories that already have undergone some consolidation (Takashima et al., 2009; Smith et al., 2010). From another vantage point, the mPFC representation of Day 1 learning may have led to increased connectivity with LOC on Day 2 due to Day 1 learning beginning to resemble consolidated prior knowledge (van Kesteren et al., 2010). While this effect is consistent with prior literature and theory, it's unclear why we would find evidence of processing of the remote memories and not the recent memories. Furthermore, the change in LOC-mPFC connectivity in this scan did not correlate with memory behaviors from either learning session, which could be because signal from this scan reflects a mix of processing of the two different learning sessions. With these ideas in mind, we have fleshed out the discussion of the post-encoding ‘recent’ scan in the Discussion (page 38-39, lines 1039-1044).

      c) Third, I am thinking about how both of the above issues might relate to the authors' findings, and would love to see more added to the paper to address this point. Specifically, I assume there are fluctuations in baseline connectivity profile across days within a person, such that the pre-learning connectivity on day 1 might be different from on day 2. Given that, and the lack of a pre-learning connectivity measure on day 2, it would logically follow that the measure of connectivity change from pre- to post-learning is going to be cleaner for the remote memories. In other words, could the lack of connectivity change observed for the recent scan simply be due to the lack of a within-day baseline? Given that otherwise, the post-learning rest should be the same in that it is an immediate reflection of how connectivity changes as a function of learning (depending on whether the authors think that the "recent" scan is actually reflecting "recent + remote"), it seems odd that they both don't show the same corresponding increase in connectivity-which makes me think it may be a baseline difference. I am not sure if this is what the authors are implying when they talk about how day 1 is most similar to prior investigation on p. 20, but if so it might be helpful to state that directly.

      We agree that it is puzzling that we don’t see that hippocampal-LOC connectivity does not also increase after recent learning, equivalently to what we see after remote learning. However, the fact that there is an increase from baseline rest to post-recent rest in mPFC – LOC connectivity suggests that it’s not an issue with baseline, but rather that the post-recent learning scan is reflecting processing of the remote memories (although as a caveat, there is no relationship with priming).

      On what is now page 23, we were referring to the notion that the Day 1 procedure (baseline rest, learning, post-learning rest) is the most straightforward replication of past work that finds a relationship between hippocampal-cortical coupling and later memory. In contrast, the Day 2 learning and rest scan are less ‘clean’ of a replication in that they are taking place in the shadow of Day 1 learning. We have clarified this in the Results (page 23, lines 597-598).

      d) Fourth and very related to my point 1c, I wonder if the lack of correlations for the recent scan with behavior is interpretable, or if it might just be that this is a noisy measure due to imperfect baseline correction. Do the authors have any data or logic they might be able to provide that could speak to these points? One thing that comes to mind is seeing whether the raw post-learning connectivity values (separately for both recent and remote) show the same pattern as the different scores. However, the authors may come up with other clever ways to address this point. If not, it might be worth acknowledging this interpretive challenge in the Discussion.

      We thought of three different approaches that could help us to understand whether the lack of correlations in between coupling and behavior in the recent scan was due to noise. First, we correlated recognition priming with raw hippocampal-LOC coupling separately for pre- and post-learning scans, as in Author response image 1:

      Author response image 1.

      Note that the post-learning chart depicts the relationship between post-remote coupling and remote priming and between post-recent coupling and recent priming (middle). Essentially, post-recent learning coupling did not relate to priming of recently learned sequences (middle; green) while there remains a trend for a relationship between post-remote coupling and priming for remotely learned sequences (middle; blue). However, the significant relationship between coupling and priming that we reported in the paper (right, blue) is driven both by the initial negative relationship that is observed in the pre-learning scan and the positive relationship in the post-remote learning scan. This highlights the importance of using a change score, as there may be spurious initial relationships between connectivity profiles and to-be-learned information that would then mask any learning- and consolidation-related changes.

      We also reasoned that if comparisons between the post-recent learning scan and the baseline scan are noisier than between the post-remote learning and baseline scan, there may be differences in the variance of the change scores across participants, such that changes in coupling from baseline to post-recent rest may be more variable than coupling from baseline to post-remote rest. We conducted F-tests to compare the variance of the change in these two hippocampal-LO correlations and found no reliable difference (ratio of difference: F(22, 22) = 0.811, p = .63).

      Finally, we explored whether hippocampal-LOC coupling is more stable across participants if compared across two rest scans within the same imaging session (baseline and post-remote) versus across two scans across two separate sessions (baseline and post-recent). Interestingly, coupling was not reliably correlated across scans in either case (baseline/post-remote: r = 0.03, p = 0.89 Baseline/post-recent: r = 0.07, p = .74).

      Finally, we evaluated whether hippocampal-LOC coupling was correlated across different rest scans (see Author response image 2). We reasoned that if such coupling was more correlated across baseline and post-remote scans relative to baseline and post-recent scans, that would indicate a within-session stability of participants’ connectivity profiles. At the same time, less correlation of coupling across baseline and post-recent scans would be an indication of a noisier change measure as the measure would additionally include a change in individuals’ connectivity profile over time. We found that there was no difference in the correlation of hipp-LO coupling is across sessions, and the correlation was not reliably significant for either session (baseline/post-remote: r = 0.03, p = 0.89; baseline/post-recent: r = 0.07, p = .74; difference: Steiger’s t = 0.12, p = 0.9).

      Author response image 2.

      We have included the raw correlations with priming (page 25, lines 654-661, Supplemental Figure 6) as well as text describing the comparison of variances (page 25, lines 642-653). We did not add the comparison of hippocampal-LOC coupling across scans to the current manuscript, as an evaluation of stability of such coupling in the context of learning and reactivation seems out of scope of the current focus of the experiment, but we find this result to be worthy of follow-up in future work.

      In summary, further analysis of our data did not reveal any indication that a comparison of rest connectivity across scan sessions inserted noise into the change score between baseline and post-recent learning scans. However, these analyses cannot fully rule that possibility out, and the current analyses do not provide concrete evidence that the post-recent learning scan comprises signals that are a mixture of processing of recent and remote sequences. We discuss these drawbacks in the Discussion (page 39, lines 1047-1070).

      2) My second major concern is how the authors have operationalized integration and differentiation. The pattern similarity analysis uses an overall correspondence between the neural similarity and a predicted model as the main metric. In the predicted model, C items that are indirectly associated are more similar to one another than they are C items that are entirely unrelated. The authors are then looking at a change in correspondence (correlation) between the neural data and that prediction model from pre- to post-learning. However, a change in the degree of correspondence with the predicted matrix could be driven by either the unrelated items becoming less similar or the related ones becoming more similar (or both!). Since the interpretation in the paper focuses on change to indirectly related C items, it would be important to report those values directly. For instance, as evidence of differentiation, it would be important to show that there is a greater decrease in similarity for indirectly associated C items than it is for unrelated C items (or even a smaller increase) from pre to post, or that C items that are indirectly related are less similar than are unrelated C items post but not pre-learning. Performing this analysis would confirm that the pattern of results matches the authors' interpretation. This would also impact the interpretation of the subsequent analyses that involve the neural integration measures (e.g., correlation analyses like those on p. 16, which may or may not be driven by increased similarity among overlapping C pairs). I should add that given the specificity to the remote learning in mPFC versus recent in LOC and anterior hippocampus, it is clearly the case that something interesting is going on. However, I think we need more data to understand fully what that "something" is.

      We recognize the importance of understanding whether model fits (and changes to them) are driven by similarity of overlapping pairs or non-overlapping pairs. We have modified all figures that visualize model fits to the neural integration model to separately show fits for pre- and post-learning (Figure 3 for mPFC, Supp. Figure 5 for LOC, Supp. Figure 9 for AB similarity in anterior hippocampus & LOC). We have additionally added supplemental figures to show the complete breakdown of similarity each region in a 2 (pre/post) x 2 (overlapping/non-overlapping sequence) x 2 (recent/remote) chart. We decided against including only these latter charts rather than the model fits since the model fits strike a good balance between information and readability. We have also modified text in various sections to focus on these new results.

      In brief, the decrease in model fit for mPFC for the remote sequences was driven primarily by a decrease in similarity for the overlapping C items and not the non-overlapping ones (Supplementary Figure 3, page 18, lines 468-472).

      Interestingly, in LOC, all C items grew more similar after learning, regardless of their overlap or learning session, but the increase in model fit for C items in the recent condition was driven by a larger increase in similarity for overlapping pairs relative to non-overlapping ones (Supp. Figure 5, page 21, lines 533-536).

      We also visualized AB similarity in the anterior hippocampus and LOC in a similar fashion (Supplementary Figure 9).

      We have also edited the Methods sections with updated details of these analyses (page 52, lines 1392-1397). We think that including these results considerably strengthen our claims and we are pleased to have them included.

      3) The priming task occurred before the post-learning exposure phase and could have impacted the representations. More consideration of this in the paper would be useful. Most critically, since the priming task involves seeing the related C items back-to-back, it would be important to consider whether this experience could have conceivably impacted the neural integration indices. I believe it never would have been the case that unrelated C items were presented sequentially during the priming task, i.e., that related C items always appeared together in this task. I think again the specificity of the remote condition is key and perhaps the authors can leverage this to support their interpretation. Can the authors consider this possibility in the Discussion?

      It's true that only C items from the same sequence were presented back-to-back during the priming task, and that this presentation may interfere with observations from the post-learning exposure scan that followed it. We agree that it is worth considering this caveat and have added language in the Discussion (page 40, lines 1071-1086). When designing the study, we reasoned that it was more important for the behavioral priming task to come before the exposure scans, as all items were shown only once in that task, whereas they were shown 4-5 times in a random order in the post-learning exposure phase. Because of this difference in presentation times, and because behavioral priming findings tend to be very sensitive, we concluded that it was more important to protect the priming task from the exposure scan instead of the reverse.

      We reasoned, however, that the additional presentation of the C items in the recognition priming task would not substantially override the sequence learning, as C items were each presented 16 times in their sequence (ABC1 and ABC2 16 times each). Furthermore, as this reviewer suggests, the order of C items during recognition was the same for recent and remote conditions, so the fact that we find a selective change in neural representation for the remote condition and don’t also see that change for the recent condition is additional assurance that the recognition priming order did not substantially impact the representations.

      4) For the priming task, based on the Figure 2A caption it seems as though every sequence contributes to both the control and primed conditions, but (I believe) this means that the control transition always happens first (and they are always back-to-back). Is this a concern? If RTs are changing over time (getting faster), it would be helpful to know whether the priming effects hold after controlling for trial numbers. I do not think this is a big issue because if it were, you would not expect to see the specificity of the remotely learned information. However, it would be helpful to know given the order of these conditions has to be fixed in their design.

      This is a correct understanding of the trial orders in the recognition priming task. We chose to involve the baseline items in the control condition to boost power – this way, priming of each sequence could be tested, while only presenting each item once in this task, as repetition in the recognition phase would have further facilitated response times and potentially masked any priming effects. We agree that accounting for trial order would be useful here, so we ran a mixed-effects linear model to examine responses times both as a function of trial number and of priming condition (primed/control). While there is indeed a large effect of trial number such that participants got faster over time, the priming effect originally observed in the remote condition still holds at the same time. We now report this analysis in the Results section (page 14, lines 337-349 for Expt 1 and pages 14-15, lines 360-362 for Expt 2).

      5) The authors should be cautious about the general conclusion that memories with overlapping temporal regularities become neurally integrated - given their findings in MPFC are more consistent with overall differentiation (though as noted above, I think we need more data on this to know for sure what is going on).

      We realize this conclusion was overly simplistic and, in several places, have revised the general conclusions to be more specific about the nuanced similarity findings.

      6) It would be worth stating a few more details and perhaps providing additional logic or justification in the main text about the pre- and post-exposure phases were set up and why. How many times each object was presented pre and post, and how the sequencing was determined (were any constraints put in place e.g., such that C1 and C2 did not appear close in time?). What was the cover task (I think this is important to the interpretation & so belongs in the main paper)? Were there considerations involving the fact that this is a different sequence of the same objects the participants would later be learning - e.g., interference, etc.?

      These details can be found in the Methods section (pages 50-51, lines 1337-1353) and we’ve added a new summary of that section in the Results (page 17, lines 424- 425 and 432-435). In brief, a visual hash tag appeared on a small subset of images and participants pressed a button when this occurred, and C1 and C2 objects were presented in separate scans (as were A and B objects) to minimize inflated neural similarity due to temporal proximity.

      Reviewer #2 (Public Review):

      The manuscript by Tompary & Davachi presents results from two experiments, one behavior only and one fMRI plus behavior. They examine the important question of how to separate object memories (C1 and C2) that are never experienced together in time and become linked by shared predictive cues in a sequence (A followed by B followed by one of the C items). The authors developed an implicit priming task that provides a novel behavioral metric for such integration. They find significant C1-C2 priming for sequences that were learned 24h prior to the test, but not for recently learned sequences, suggesting that associative links between the two originally separate memories emerge over an extended period of consolidation. The fMRI study relates this behavioral integration effect to two neural metrics: pattern similarity changes in the medial prefrontal cortex (mPFC) as a measure of neural integration, and changes in hippocampal-LOC connectivity as a measure of post-learning consolidation. While fMRI patterns in mPFC overall show differentiation rather than integration (i.e., C1-C2 representational distances become larger), the authors find a robust correlation such that increasing pattern similarity in mPFC relates to stronger integration in the priming test, and this relationship is again specific to remote memories. Moreover, connectivity between the posterior hippocampus and LOC during post-learning rest is positively related to the behavioral integration effect as well as the mPFC neural similarity index, again specifically for remote memories. Overall, this is a coherent set of findings with interesting theoretical implications for consolidation theories, which will be of broad interest to the memory, learning, and predictive coding communities.

      Strengths:

      1) The implicit associative priming task designed for this study provides a promising new tool for assessing the formation of mnemonic links that influence behavior without explicit retrieval demands. The authors find an interesting dissociation between this implicit measure of memory integration and more commonly used explicit inference measures: a priming effect on the implicit task only evolved after a 24h consolidation period, while the ability to explicitly link the two critical object memories is present immediately after learning. While speculative at this point, these two measures thus appear to tap into neocortical and hippocampal learning processes, respectively, and this potential dissociation will be of interest to future studies investigating time-dependent integration processes in memory.

      2) The experimental task is well designed for isolating pre- vs post-learning changes in neural similarity and connectivity, including important controls of baseline neural similarity and connectivity.

      3) The main claim of a consolidation-dependent effect is supported by a coherent set of findings that relate behavioral integration to neural changes. The specificity of the effects on remote memories makes the results particularly interesting and compelling.

      4) The authors are transparent about unexpected results, for example, the finding that overall similarity in mPFC is consistent with a differentiation rather than an integration model.

      Thank you for the positive comments!

      Weaknesses:

      1) The sequence learning and recognition priming tasks are cleverly designed to isolate the effects of interest while controlling for potential order effects. However, due to the complex nature of the task, it is difficult for the reader to infer all the transition probabilities between item types and how they may influence the behavioral priming results. For example, baseline items (BL) are interspersed between repeated sequences during learning, and thus presumably can only occur before an A item or after a C item. This seems to create non-random predictive relationships such that C is often followed by BL, and BL by A items. If this relationship is reversed during the recognition priming task, where the sequence is always BL-C1-C2, this violation of expectations might slow down reaction times and deflate the baseline measure. It would be helpful if the manuscript explicitly reported transition probabilities for each relevant item type in the priming task relative to the sequence learning task and discussed how a match vs mismatch may influence the observed priming effects.

      We have added a table of transition probabilities across the learning, recognition priming, and exposure scans (now Table 1, page 48). We have also included some additional description of the change in transition probabilities across different tasks in the Methods section. Specifically, if participants are indeed learning item types and rules about their order, then both the control and the primed conditions would violate that order. Since C1 and C2 items never appeared together, viewing C1 would give rise to an expectation of seeing a BL item, which would also be violated. This suggests that our priming effects are driven by sequence-specific relationships rather than learning of the probabilities of different item types. We’ve added this consideration to the Methods section (page 45, lines 1212-1221).

      Another critical point to consider (and that the transition probabilities do not reflect) is that during learning, while C is followed either by A or BL, they are followed by different A or BL items. In contrast, a given A is always followed by the same B object, which is always followed by one of two C objects. While the order of item types is semi-predictable, the order of objects (specific items) themselves are not. This can be seen in the response times during learning, such that response times for A and BL items are always slower than for B and C items. We have explained this nuance in the figure text for Table 1.

      2) The choice of what regions of interest to include in the different sets of analyses could be better motivated. For example, even though briefly discussed in the intro, it remains unclear why the posterior but not the anterior hippocampus is of interest for the connectivity analyses, and why the main target is LOC, not mPFC, given past results including from this group (Tompary & Davachi, 2017). Moreover, for readers not familiar with this literature, it would help if references were provided to suggest that a predictable > unpredictable contrast is well suited for functionally defining mPFC, as done in the present study.

      We have clarified our reasoning for each of these choices throughout the manuscript and believe that our logic is now much more transparent. For an expanded reasoning of why we were motivated to look at posterior and not anterior hippocampus, see pages 6-7, lines 135-159, and our response to R2. In brief, past research focusing on post-encoding connectivity with the hippocampus suggests that posterior aspect is more likely to couple with category-selective cortex after learning neutral, non-rewarded objects much like the stimuli used in the present study.

      We also clarify our reasoning for LOC over mPFC. While theoretically, mPFC is thought to be a candidate region for coupling with the hippocampus during consolidation, the bulk of empirical work to date has revealed post-encoding connectivity between the hippocampus and category-selective cortex in the ventral and occipital lobes (page 6, lines 123-134).

      As for the use of the predictable > unpredictable contrast for functionally defining cortical regions, we reasoned that cortical regions that were sensitive to the temporal regularities generated by the sequences may be further involved in their offline consolidation and long-term storage (Danker & Anderson, 2010; Davachi & Danker, 2013; McClelland et al., 1995). We have added this justification to the Methods section (page 18, lines 454-460).

      3) Relatedly, multiple comparison corrections should be applied in the fMRI integration and connectivity analyses whenever the same contrast is performed on multiple regions in an exploratory manner.

      We now correct for multiple comparisons using Bonferroni correction, and this correction depends on the number of regions in which each analysis is conducted. Please see page 55, lines 1483-1490, in the Methods section for details of each analysis.

      Reviewer #3 (Public Review):

      The authors of this manuscript sought to illuminate a link between a behavioral measure of integration and neural markers of cortical integration associated with systems consolidation (post-encoding connectivity, change in representational neural overlap). To that aim, participants incidentally encoded sequences of objects in the fMRI scanner. Unbeknownst to participants, the first two objects of the presented ABC triplet sequences overlapped for a given pair of sequences. This allowed the authors to probe the integration of unique C objects that were never directly presented in the same sequence, but which shared the same preceding A and B objects. They encoded one set of objects on Day 1 (remote condition), another set of objects 24 hours later (recent condition) and tested implicit and explicit memory for the learned sequences on Day 2. They additionally collected baseline and post-encoding resting-state scans. As their measure of behavioral integration, the authors examined reaction time during an Old/New judgement task for C objects depending on if they were preceded by a C object from an overlapping sequence (primed condition) versus a baseline object. They found faster reaction times for the primed objects compared to the control condition for remote but not recently learned objects, suggesting that the C objects from overlapping sequences became integrated over time. They then examined pattern similarity in a priori ROIs as a measure of neural integration and found that participants showing evidence of integration of C objects from overlapping sequences in the medial prefrontal cortex for remotely learned objects also showed a stronger implicit priming effect between those C objects over time. When they examined the change in connectivity between their ROIs after encoding, they also found that connectivity between the posterior hippocampus and lateral occipital cortex correlated with larger priming effects for remotely learned objects, and that lateral occipital connectivity with the medial prefrontal cortex was related to neural integration of remote objects from overlapping sequences.

      The authors aim to provide evidence of a relationship between behavioral and neural measures of integration with consolidation is interesting, important, and difficult to achieve given the longitudinal nature of studies required to answer this question. Strengths of this study include a creative behavioral task, and solid modelling approaches for fMRI data with careful control for several known confounds such as bold activation on pattern analysis results, motion, and physiological noise. The authors replicate their behavioral observations across two separate experiments, one of which included a large sample size, and found similar results that speak to the reliability of the observed behavioral phenomenon. In addition, they document several correlations between neural measures and task performance, lending functional significance to their neural findings.

      Thank you for this positive assessment of our study!

      However, this study is not without notable weaknesses that limit the strength of the manuscript. The authors report a behavioral priming effect suggestive of integration of remote but not recent memories, leading to the interpretation that the priming effect emerges with consolidation. However, they did not observe a reliable interaction between the priming condition and learning session (recent/remote) on reaction times, meaning that the priming effect for remote memories was not reliably greater than that observed for recent. In addition, the emergence of a priming effect for remote memories does not appear to be due to faster reaction times for primed targets over time (the condition of interest), but rather, slower reaction times for control items in the remote condition compared to recent. These issues limit the strength of the claim that the priming effect observed is due to C items of interest being integrated in a consolidation-dependent manner.

      We acknowledge that the lack of a day by condition interaction in the behavioral priming effect should discussed and now discuss this data in a more nuanced manner. While it’s true that the priming effect emerges due to a slowing of the control items over time, this slowing is consistent with classic time-dependent effects demonstrating slower response times for more delayed memories. The fact that the response times in the primed condition does not show this slowing can be interpreted as a protection against this slowing that would otherwise occur. Please see page 29, lines 758-766, for this added discussion.

      Similarly, the interactions between neural variables of interest and learning session needed to strongly show a significant consolidation-related effect in the brain were sometimes tenuous. There was no reliable difference in neural representational pattern analysis fit to a model of neural integration between the short and long delays in the medial prefrontal cortex or lateral occipital cortex, nor was the posterior hippocampus-lateral occipital cortex post-encoding connectivity correlation with subsequent priming significantly different for recent and remote memories. While the relationship between integration model fit in the medial prefrontal cortex and subsequent priming (which was significantly different from that occurring for recent memories) was one of the stronger findings of the paper in favor of a consolidation-related effect on behavior, is it possible that lack of a behavioral priming effect for recent memories due to possible issues with the control condition could mask a correlation between neural and behavioral integration in the recent memory condition?

      While we acknowledge that lack of a statistically reliable interaction between neural measures and behavioral priming in many cases, we are heartened by the reliable difference in the relationship between mPFC similarity and priming over time, which was our main planned prediction. In addition to adding caveats in the discussion about the neural measures and behavioral findings in the recent condition (see our response to R1.1 and R1.4 for more details), we have added language throughout the manuscript noting the need to interpret these data with caution.

      These limitations are especially notable when one considers that priming does not classically require a period of prolonged consolidation to occur, and prominent models of systems consolidation rather pertain to explicit memory. While the authors have provided evidence that neural integration in the medial prefrontal cortex, as well as post-encoding coupling between the lateral occipital cortex and posterior hippocampus, are related to faster reaction times for primed objects of overlapping sequences compared to their control condition, more work is needed to verify that the observed findings indeed reflect consolidation dependent integration as proposed.

      We agree that more work is needed to provide converging evidence for these novel findings. However, we wish to counter the notion that systems consolidation models are relevant only for explicit memories. Although models of systems consolidation often mention transformations from episodic to semantic memory, the critical mechanisms that define the models involve changes in the neural ensembles of a memory that is initially laid down in the hippocampus and is taught to cortex over time. This transformation of neural traces is not specific to explicit/declarative forms of memory. For example, implicit statistical learning initially depends on intact hippocampal function (Schapiro et al., 2014) and improves over consolidation (Durrant et al., 2011, 2013; Kóbor et al., 2017).

      Second, while there are many classical findings of priming during or immediately after learning, there are several instances of priming used to measure consolidation-related changes to newly learned information. For instance, priming has been used as a measure of lexical integration, demonstrating that new word learning benefits from a night of sleep (Wang et al., 2017; Gaskell et al., 2019) or a 1-week delay (Tamminen & Gaskell, 2013). The issue is not whether priming can occur immediately, it is whether priming increases with a delay.

      Finally, it is helpful to think about models of memory systems that divide memory representations not by their explicit/implicit nature, but along other important dimensions such as their neural bases, their flexibility vs rigidity, and their capacity for rapid vs slow learning (Henke, 2010). Considering this evidence, we suggest that systems consolidation models are most useful when considering how transformations in the underlying neural memory representation affects its behavioral expression, rather than focusing on the extent that the memory representation is explicit or implicit.

      With all this said, we have added text to the discussion reminding the reader that there was no statistically significant difference in priming as a function of the delay (page 29, lines 764 - 766). However, we are encouraged by the fact that the relationship between priming and mPFC neural similarity was significantly stronger for remotely learned objects relative to recently learned ones, as this is directly in line with systems consolidation theories.

      References

      Abolghasem, Z., Teng, T. H.-T., Nexha, E., Zhu, C., Jean, C. S., Castrillon, M., Che, E., Di Nallo, E. V., & Schlichting, M. L. (2023). Learning strategy differentially impacts memory connections in children and adults. Developmental Science, 26(4), e13371. https://doi.org/10.1111/desc.13371

      Dobbins, I. G., Schnyer, D. M., Verfaellie, M., & Schacter, D. L. (2004). Cortical activity reductions during repetition priming can result from rapid response learning. Nature, 428(6980), 316–319. https://doi.org/10.1038/nature02400

      Durrant, S. J., Cairney, S. A., & Lewis, P. A. (2013). Overnight consolidation aids the transfer of statistical knowledge from the medial temporal lobe to the striatum. Cerebral Cortex, 23(10), 2467–2478. https://doi.org/10.1093/cercor/bhs244

      Durrant, S. J., Taylor, C., Cairney, S., & Lewis, P. A. (2011). Sleep-dependent consolidation of statistical learning. Neuropsychologia, 49(5), 1322–1331. https://doi.org/10.1016/j.neuropsychologia.2011.02.015

      Gaskell, M. G., Cairney, S. A., & Rodd, J. M. (2019). Contextual priming of word meanings is stabilized over sleep. Cognition, 182, 109–126. https://doi.org/10.1016/j.cognition.2018.09.007

      Henke, K. (2010). A model for memory systems based on processing modes rather than consciousness. Nature Reviews Neuroscience, 11(7), 523–532. https://doi.org/10.1038/nrn2850

      Kóbor, A., Janacsek, K., Takács, Á., & Nemeth, D. (2017). Statistical learning leads to persistent memory: Evidence for one-year consolidation. Scientific Reports, 7(1), 760. https://doi.org/10.1038/s41598-017-00807-3

      Kuhl, B. A., & Chun, M. M. (2014). Successful remembering elicits event-specific activity patterns in lateral parietal cortex. The Journal of Neuroscience, 34(23), 8051–8060. https://doi.org/10.1523/JNEUROSCI.4328-13.2014

      Richter, F. R., Chanales, A. J. H., & Kuhl, B. A. (2016). Predicting the integration of overlapping memories by decoding mnemonic processing states during learning. NeuroImage, 124, Part A, 323–335. https://doi.org/10.1016/j.neuroimage.2015.08.051

      Schapiro, A. C., Gregory, E., Landau, B., McCloskey, M., & Turk-Browne, N. B. (2014). The necessity of the medial-temporal lobe for statistical learning. Journal of Cognitive Neuroscience, 1–12. https://doi.org/10.1162/jocn_a_00578

      Schlichting, M. L., & Preston, A. R. (2014). Memory reactivation during rest supports upcoming learning of related content. Proceedings of the National Academy of Sciences, 111(44), 15845–15850. https://doi.org/10.1073/pnas.1404396111

      Smith, J. F., Alexander, G. E., Chen, K., Husain, F. T., Kim, J., Pajor, N., & Horwitz, B. (2010). Imaging systems level consolidation of novel associate memories: A longitudinal neuroimaging study. NeuroImage, 50(2), 826–836. https://doi.org/10.1016/j.neuroimage.2009.11.053

      Takashima, A., Nieuwenhuis, I. L. C., Jensen, O., Talamini, L. M., Rijpkema, M., & Fernández, G. (2009). Shift from hippocampal to neocortical centered retrieval network with consolidation. The Journal of Neuroscience, 29(32), 10087–10093. https://doi.org/10.1523/JNEUROSCI.0799-09.2009

      Tamminen, J., & Gaskell, M. G. (2013). Novel word integration in the mental lexicon: Evidence from unmasked and masked semantic priming. The Quarterly Journal of Experimental Psychology, 66(5), 1001–1025. https://doi.org/10.1080/17470218.2012.724694

      van Kesteren, M. T. R. van, Fernández, G., Norris, D. G., & Hermans, E. J. (2010). Persistent schema-dependent hippocampal-neocortical connectivity during memory encoding and postencoding rest in humans. Proceedings of the National Academy of Sciences, 107(16), 7550–7555. https://doi.org/10.1073/pnas.0914892107

      Wang, H.-C., Savage, G., Gaskell, M. G., Paulin, T., Robidoux, S., & Castles, A. (2017). Bedding down new words: Sleep promotes the emergence of lexical competition in visual word recognition. Psychonomic Bulletin & Review, 24(4), 1186–1193. https://doi.org/10.3758/s13423-016-1182-7

    1. Author response:

      The following is the authors’ response to the original reviews.

      In this important paper, the authors propose a computational model for understanding how the dynamics of neural representations may lead to specific patterns of errors as observed in working memory tasks. The paper provides solid evidence showing how a two-area model of sensory-memory interactions can account for the error patterns reported in orientation estimation tasks with delays. By integrating ideas from efficient coding and attractor networks, the resulting theoretical framework is appealing, and nicely captures some basic patterns of behavior data and the distributed nature of memory representation as reported in prior neurophysiological studies. The paper can be strengthened if (i) further analyses are conducted to deepen our understanding of the circuit mechanisms underlying the behavior effects; (ii) the necessity of the two-area network model is better justified; (iii) the nuanced aspects of the behavior that are not captured by the current model are discussed in more detail.

      We thank the Editors and Reviewers for their constructive comments. In response to the suggestions provided, we have implemented the following revisions:

      - Clarified the origin of the specific pattern of diffusion: We showed that variance patterns remain consistent across different noise types or levels in new Figure 5 – Figure supplement 2 and Figure 9 – Figure supplement 1 (uniform Gaussian noise with varying strengths). This is connected to the representation geometry induced by heterogeneous connections (Eq. 21).

      - Provided an intuitive explanation of the two-module network’s advantages: Additional simulations demonstrated that heterogeneity degree of sensory connections and intermodal connection strengths affect drift and diffusion terms differently (new Figure 6). This endows an extra degree of freedom in controlling heterogeneity in drift and diffusion terms in the two-module network (new Figure 9).

      - Addressed a limitation and future directions in the Discussion: Our study is limited to the dynamic evolution of memory representation for a single orientation stimulus and its associated error patterns. We acknowledge the need for further investigation to capture nuanced error patterns in broader experimental settings, such as changes in error patterns for varying stimulus presentation durations in perception tasks. We have discussed potential extensions, such as incorporating more biologically plausible baseline activities, external noise, or variations of loss functions.

      Additionally, we showed consistent error patterns when decoded from activities of the sensory module (Figure 4 – Figure supplement 1), and incorrect error patterns with autapses in the sensory module (Figure 7 – Figure supplement 2). Below, we have reorganized each Reviewer’s comments and separately addressed them. All changes were shown in red in the manuscript submitted as Related Manuscript File.  

      Reviewer #1:

      Summary:

      Working memory is imperfect - memories accrue errors over time and are biased towards certain identities. For example, previous work has shown memory for orientation is more accurate near the cardinal directions (i.e., variance in responses is smaller for horizontal and vertical stimuli) while being biased towards diagonal orientations (i.e., there is a repulsive bias away from horizontal and vertical stimuli). The magnitude of errors and biases increase the longer an item is held in working memory and when more items are held in working memory (i.e., working memory load is higher). Previous work has argued that biases and errors could be explained by increased perceptual acuity at cardinal directions. However, these models are constrained to sensory perception and do not explain how biases and errors increase over time in memory. The current manuscript builds on this work to show how a two-layer neural network could integrate errors and biases over a memory delay. In brief, the model includes a 'sensory' layer with heterogenous connections that lead to the repulsive bias and decreased error in the cardinal directions. This layer is then reciprocally connected with a classic ring attractor layer. Through their reciprocal interactions, the biases in the sensory layer are constantly integrated into the representation in memory. In this way, the model captures the distribution of biases and errors for different orientations that have been seen in behavior and their increasing magnitude with time. The authors compare the two-layer network to a simpler one-network model, showing that the one-model network is harder to tune and shows an attractive bias for memories that have lower error (which is incompatible with empirical results).

      Strengths:

      The manuscript provides a nice review of the dynamics of items in working memory, showing how errors and biases differ across stimulus space. The two-layer neural network model is able to capture the behavioral effects as well as relate to neurophysiological observations that memory representations are distributed across the sensory cortex and prefrontal cortex.

      The authors use multiple approaches to understand how the network produces the observed results. For example, analyzing the dynamics of memories in the low-dimensional representational space of the networks provides the reader with an intuition for the observed effects.

      As a point of comparison with the two-layer network, the authors construct a heterogenous one-layer network (analogous to a single memory network with embedded biases). They argue that such a network is incapable of capturing the observed behavioral effects but could potentially explain biases and noise levels in other sensory domains where attractive biases have lower errors (e.g., color).

      The authors show how changes in the strength of Hebbian learning of excitatory and inhibitory synapses can change network behavior. This argues for relatively stronger learning in inhibitory synapses, an interesting prediction.

      The manuscript is well-written. In particular, the figures are well done and nicely schematize the model and the results.

      Overall:

      Overall, the manuscript was successful in building a model that captured the biases and noise observed in working memory. This work complements previous studies that have viewed these effects through the lens of optimal coding, extending these models to explain the effects of time in memory. In addition, the two-layer network architecture extends previous work with similar architectures, adding further support to the distributed nature of working memory representations.

      We appreciate the reviewer’s comments that the work successfully explains error patterns of working memory, extends previous models of optimal coding to include temporal effects, and supports the distributed nature of working memory representations. Below, we address the specific concerns of the reviewer.

      Weaknesses:

      Despite its strengths, the manuscript does have some weaknesses.

      Major Point 1: First, as far as we can tell, behavioral data is only presented in schematic form. This means some of the nuances of the effects are lost. It also means that the model is not directly capturing behavioral effects. Therefore, while providing insight into the general phenomenon, the current manuscript may be missing some important aspects of the data.

      Relatedly, the models are not directly fit to behavioral data. This makes it hard for the authors to exclude the possibility that there is a single network model that could capture the behavioral effects. In other words, it is hard to support the authors' conclusion that "....these evolving errors...require network interaction between two distinct modules." (from the abstract, but similar comments are made throughout the manuscript). Such a strong claim needs stronger evidence than what is presented. Fitting to behavioral data could allow the authors to explore the full parameter space for both the one-layer and two-layer network architectures.

      In addition, directly comparing the ability of different model architectures to fit behavioral data would allow for quantitative comparison between models. Such quantitative comparisons are currently missing from the manuscript.

      We agree with the reviewer that incorporating quantitative comparisons to the data will strengthen our results. However, we note the limitations in fitting network models to behavior data. Previous studies employed drift-diffusion models to fit error patterns observed in visual working memory tasks (Panichello, DePasquale et al. 2019, Gu, Lee et al. 2023). In contrast to these phenomenological models, network models have more parameters that can cause overfitting. Consequently, we focused on comparing the qualitative differences between onemodule and two-module networks, examining whether each network can generate the correct shape of bias and variance patterns. In response to the reviewers’ suggestions, we have revised the manuscript to reinforce our claim by providing an intuitive explanation of the qualitative differences between these two models (see response to your Major Point 3) and conducting additional simulations to support our claim that error patterns are consistent under different noise types or levels (see responses to Major Points 2 of Reviewer 2, and Minor point 1 of Reviewer 3).  

      Major Point 2: To help broaden the impact of the paper, it would be helpful if the authors provided insight into how the observed behavioral biases and/or network structures influence cognition. For example, previous work has argued that biases may counteract noise, leading to decreased variance at certain locations. Is there a similar normative explanation for why the brain would have repulsive biases away from commonly occurring stimuli? Are they simply a consequence of improved memory accuracy? Why isn't this seen for all stimulus domains?

      Previous work has found both diffusive noise and biases increase with the number of items in working memory. It isn't clear how the current model would capture these effects. The authors do note this limitation in the Discussion, but it remains unclear how the current model can be generalized to a multi-item case.

      As pointed by the reviewer, attractors counteract noise and lead to reduced variance around the attracting locations. However, most attractor models reporting such effects did not consider the interaction of attractor dynamics with the sensory network. For the repulsive biases considered here, previous studies on the sensory stage have theoretically demonstrated that they could lower the discrimination threshold around cardinal orientations (e.g., see Wei and Stocker, 2017). In Wei and Stocker (2017), the authors showed that this relationship between bias and discrimination threshold was observed across many stimulus modalities. In the present study, we demonstrated that the bias and variability patterns naturally emerged from the underlying neural dynamics. Nonetheless, we also noted that color working memory shows attractive biases, which necessitates further study of the underlying neural mechanisms of color perception. A plausible explanation is that the categorical effect dominates color perception and memory processes, as suggested by existing modelling work (Tajima et al., 2016). 

      However, we do note the limitation of our current work that does not capture nuanced error patterns in broader experimental settings, such as variation of perception tasks or memory of multiple items. For instance, while shorter stimulus presentations with no explicit delay lead to larger biases experimentally, our current model, which starts activities from a flat baseline, shows an increase in bias throughout the stimulus presentation. Additionally, the error variance during stimulus presentation is almost negligible compared to that during the delay period, as the external input overwhelms the internal noise. These mismatches during stimulus presentation have minimal impact on activities during the delay period when the internal dynamics dominate. Nonetheless, the model needs further refinement to accurately reproduce activities during stimulus presentation, possibly by incorporating more biologically plausible baseline activities. Also, a recent Bayesian perception model suggested different types of noise like external noise or variations in loss functions that adjust tolerance to small errors may help explain various error patterns observed across different modalities (Hahn and Wei, 2024). Even for memories involving multiple items, noise can be critical in determining error patterns, as encoding more items might be equivalent to higher noise for each individual item (Chunharas, Rademaker et al. 2022).

      To make this limitation clear, we included the above response in a new paragraph on limitations and future directions in the Discussion (2nd paragraph in p. 11). Also, we modified the text that previously described that our model can “explain error patterns in both perception and working memory tasks” in p. 3 and p. 5 as

      “explain error patterns in working memory tasks that are similar to those observed in perception tasks.”

      And we added the bias and variance pattern right after the stimulus offset in Figure 4C,D with the following note in p. 6:

      “Note that the variance of errors is nearly zero during stimulus presentation because the external input overwhelms internal noise, which does not fully account for the variability observed during perception tasks (see Discussion).”

      Major Point 3: The role of the ring attractor memory network isn't completely clear. There is noise added in this stage, but how is this different from the noise added at the sensory stage? Shouldn't these be additive? Is the noise necessary?  

      Similarly, it isn't clear whether the memory network is necessary - can it be replaced by autapses (self-connections) in the sensory network to stabilize its representation? In short, it would be helpful for the authors to provide an intuition for why the addition of the memory network facilitates the repulsive bias.

      Internal noise in the circuits is necessary to replicate the variability of the readout in estimating the stimulus because our model did not incorporate external noise (i.e., noise associated with the stimulus). We note the distinct noise implementation in both extension of the previous Bayesian model (Fig. 2) and the network models (Fig. 3 and beyond). In Fig. 2, we followed previous studies by employing static tuning curves for the sensory module and Poisson noise to account for variability in the perception stage. In the memory stage, sensory output undergoes the addition of constant Gaussian noise, replicating the diffusion process along the memory manifolds as shown in traditional memory network models. In the network models, we do consider the same noise in both sensory and memory modules, subjecting all units to Poisson noise to simulate neuronal spiking variability. In the network models, the two modules dynamically interact, which warp the energy landscape and generate uneven noise coefficients along the memory manifold, reminiscent of the conditions shown in Fig. 1. 

      From the bias and variance patterns, we can infer two requirements the network to fulfill – one is efficient coding suggested by sensory perception stage and the other is memory maintenance. The former is achieved by realizing the previous Bayesian models in the sensory networks with specific heterogeneous connections. In our work, the latter is achieved by strong recurrent connections to sustain persistent activity during the delay period. On the other hand, as the reviewer noted, memory can be maintained through autapses in the sensory network, which is equivalent to elongating intrinsic time constants of individual units (Seung, Lee et al. 2000). We simulated such sensory network and showed the results in Figure 7 – Figure Supplement 2. As shown in the figure, a larger time constant also slows down the increase in bias significantly, which can be deduced from Eq. 20. 

      When memory is maintained through strong recurrent connections, there are two possible scenarios, one-module network combining both efficient coding and memory maintenance (Fig. 8), or two-module network satisfying each condition in different modules (Fig. 7). In both networks, heterogeneous connections achieving efficient coding shape drift and diffusion dynamics similarly as illustrated in Figure 9 (previous Figure 7 – Supplement 1). Discrete attractors are formed near oblique orientations, inducing an increase of repulsive bias during the delay period. Also, noise coefficient is lowest at cardinal orientations. However, there is a difference in the asymmetry degrees of the drift and diffusion at cardinal and oblique orientations the one-module network shows larger asymmetry in potential energy, while the two-module network shows larger asymmetry in the noise coefficient. These varying degrees of heterogeneity in drift and diffusion lead to qualitative differences in bias and variance patterns in estimation. Shallower potential differences with more asymmetrical noise coefficients result in correct bias and variance patterns in the two-module network, while the opposite leads to flipped variance patterns in the one-module network.  

      An intuitive explanation of how connectivity heterogeneity differentially affects the asymmetry degrees of drift and diffusion in one-module and two-module networks is detailed in our response to Major Point 3 of Reviewer 2. In summary, separating the memory module from the sensory module imposes an additional degree of freedom, allowing for more flexible control over drift and diffusion, thereby bias and variance patterns. To clarify this, we have added simulations in Figure 6 and Figure 9 and provided an intuitive explanation in the accompanying texts in pp. 6-7 and p. 9. 

      Minor Point 1: The code is stated to be available on GitHub, but I could not access it.

      Thank you for pointing it out. The repository is now publicly available.

      Minor Point 2: The legend for late/mid/early is in an odd place in Figure 1, as it is in panel E where you can't see the difference between the lines. We would suggest moving this to another panel where the different time points are clear. In general, we would suggest adding more text (legends and titles) to the figure to help the reader understand the figures without having to refer to the details in the text and/or figure legends.

      We have now moved the legend to panel B where late/mid/early is first introduced. Also, we added more text to the figure legend (Figure 3,4,5,8). 

      Minor Point 3: The last line of the first paragraph of the Introduction ends awkwardly. I assume it's referring to indirect evidence for dynamics in memory?

      Thank you. We have modified the sentence as follows:

      “For instance, biases of errors, the systematic deviation from the original stimuli, observed in estimation tasks have been used as indirect evidence to infer changes in internal representations of stimuli.”

      Minor Point 4: Similarly, the first line of the second paragraph of the Introduction was also awkward. Specifically, the clause "..., such as nonuniform stimulus distribution in nature." Seems to be missing a 'the' before 'nonuniform'.

      We have modified the sentence as follows:

      “One important source of biases is adaptation to environmental statistics, such as the nonuniform stimulus distribution found in nature or the limited range in specific settings.”

      Reviewer #2:

      In this manuscript, Yang et al. present a modeling framework to understand the pattern of response biases and variance observed in delayed-response orientation estimation tasks. They combine a series of modeling approaches to show that coupled sensory-memory networks are in a better position than single-area models to support experimentally observed delay-dependent response bias and variance in cardinal compared to oblique orientations. These errors can emerge from a population-code approach that implements efficient coding and Bayesian inference principles and is coupled to a memory module that introduces random maintenance errors. A biological implementation of such operation is found when coupling two neural network modules, a sensory module with connectivity inhomogeneities that reflect environment priors, and a memory module with strong homogeneous connectivity that sustains continuous ring attractor function. Comparison with single-network solutions that combine both connectivity inhomogeneities and memory attractors shows that two-area models can more easily reproduce the patterns of errors observed experimentally. This, the authors take as evidence that a sensory-memory network is necessary, but I am not convinced about the evidence in support of this "necessity" condition. A more in-depth understanding of the mechanisms operating in these models would be necessary to make this point clear.

      Strengths:

      The model provides an integration of two modeling approaches to the computational bases of behavioral biases: one based on Bayesian and efficient coding principles, and one based on attractor dynamics. These two perspectives are not usually integrated consistently in existing studies, which this manuscript beautifully achieves. This is a conceptual advancement, especially because it brings together the perceptual and memory components of common laboratory tasks.

      The proposed two-area model provides a biologically plausible implementation of efficient coding and Bayesian inference principles, which interact seamlessly with a memory buffer to produce a complex pattern of delay-dependent response errors. No previous model had achieved this.

      We appreciate the reviewer’s comments that the work is a conceptual advancement, combining Bayesian perception models and attractor memory models, and produces error patterns which wasn’t achieved by previous models. Below, we address the specific concerns of the reviewer.

      Major Point 1: The correspondence between the various computational models is not fully disclosed. It is not easy to see this correspondence because the network function is illustrated with different representations for different models and the correspondence between components of the various models is not specified. For instance, Figure 1 shows that a specific pattern of noise is required in the low-dimensional attractor model, but in the next model in Figure 2, the memory noise is uniform for all stimuli. How do these two models integrate? What element in the population-code model of Figure 2 plays the role of the inhomogeneous noise of Figure 1? Also, the Bayesian model of Figure 2 is illustrated with population responses for different stimuli and delays, while the attractor models of Figures 3 and 4 are illustrated with neuronal tuning curves but not population activity. In addition, error variance in the Bayesian model appears to be already higher for oblique orientations in the first iteration whereas it is only first shown one second into the delay for the attractor model in Figure 4. It is thus unclear whether variance inhomogeneities appear already at the perceptual stage in the attractor model, as it does in the population-code model. Of course, correspondences do not need to be perfect, but the reader does not know right now how far the correspondence between these models goes.

      Thank you for pointing out the lack of clarity in the correspondence between different models. We note the distinct noise implementation in extension of the previous Bayesian model (Fig. 2) and the network models (Fig. 3 and beyond). In Fig. 2, we followed previous studies by employing static tuning curves for the sensory module and Poisson noise to account for variability in the perception stage. In the memory stage, sensory output undergoes the addition of constant Gaussian noise, replicating the diffusion process along the memory manifolds as shown in traditional memory network models. In the network models in Fig. 3 and beyond, we do consider the same noise in both sensory and memory modules, subjecting all units to Poisson noise to simulate neuronal spiking variability. In the network models, the two modules dynamically interact, which warp the energy landscape and generate uneven noise coefficients along the memory manifold, reminiscent of the conditions shown in Fig. 1. 

      However, we do note the limitation of the current study which cannot fully replicate behavior patterns observed in variation of perception tasks. For instance, while shorter stimulus presentations with no explicit delay lead to larger biases experimentally, our current model, which starts activities from a flat baseline, shows an increase in bias throughout the stimulus presentation. Additionally, the error variance during stimulus presentation is almost negligible compared to that during the delay period, as the external input overwhelms the internal noise. These mismatches during stimulus presentation have minimal impact on activities during the delay period when the internal dynamics dominate. Nonetheless, the model needs further refinement to accurately reproduce activities during stimulus presentation, possibly by incorporating more biologically plausible baseline activities. To make this limitation clear, we included the above response in a new paragraph on limitations and future directions in the Discussion (2nd paragraph in p. 11). Also, we modified the text that previously described that our model can “explain error patterns in both perception and working memory tasks” in p. 3 and p. 5 as “explain error patterns in working memory tasks that are similar to those observed in perception tasks.”

      And we added the bias and variance pattern right after the stimulus offset in Figure 4C,D with the following note in p. 6:

      “Note that the variance of errors is nearly zero during stimulus presentation because the external input overwhelms internal noise, which does not fully account for the variability observed during perception tasks (see Discussion).”

      Major Point 2: The manuscript does not identify the mechanistic origin in the model of Figure 4 of the specific noise pattern that is required for appropriate network function (with higher noise variance at oblique orientations). This mechanism appears critical, so it would be important to know what it is and how it can be regulated. In particular, it would be interesting to know if the specific choice of Poisson noise in Equation (3) is important. Tuning curves in Figure 4 indicate that population activity for oblique stimuli will have higher rates than for cardinal stimuli and thus induce a larger variance of injected noise in oblique orientations, based on this Poissonnoise assumption. If this explanation holds, one wonders if network inhomogeneities could be included (for instance in neural excitability) to induce higher firing rates in the cardinal/oblique orientations so as to change noise inhomogeneities independently of the bias and thus control more closely the specific pattern of errors observed, possibly within a single memory network.

      The specific pattern of noise coefficient, lower variability at cardinal orientations in the network models, inherited that of the previous Bayesian perception models (Wei and Stocker, 2017). Either in one-module or two-module networks, the specific pattern of heterogeneous connections induces more neurons tuned to cardinal orientations with narrower tuning widths. Such sparser representation near cardinal stimuli generates lower noise variability even with constant Gaussian noise. This is verified in Eq. 21 in Methods, showing the derivation of noise coefficients – with constant Gaussian noise, Eq. 21 is modified as 

      because . Thus, 𝒟(𝜃) is inversely proportional to , which reflects the length travelled on the stable trajectory 𝒔𝒔‾(𝜃𝜃) when θ increases by one unit. For sparser representation,   becomes larger and 𝒟(𝜃) is reduced. Intuitively, with more neurons tuned to cardinal stimuli, noise is averaged and reduced. In sum, the heterogeneous connection induces the specific noise coefficient, and the choice of Poisson-like noise is not essential, although it facilitates the correct variance pattern. To clarify this point, we have added the results of using uniform Gaussian noise in new Figure 5 – Figure Supplement 2 and Figure 9 – Figure Supplement 1.

      Major point 3: The main conclusion of the manuscript, that the observed patterns of errors "require network interaction between two distinct modules" is not convincingly shown. The analyses show that there is a quantitative but not a qualitative difference between the dynamics of the single memory area compared to the sensory-memory two-area network, for specific implementations of these models (Figure 7 - Figure Supplement 1). There is no principled reasoning that demonstrates that the required patterns of response errors cannot be obtained from a different memory model on its own. Also, since the necessity of the two-area configuration is highlighted as the main conclusion of the manuscript, it is inconvenient that the figure that carefully compares these conditions is in the Supplementary Material.

      Following the suggestion by the reviewer, we moved Figure 7 – Figure supplement 1 as new Figure 9. As noted by the reviewer, drift dynamics and diffusion projected onto the lowdimensional memory manifold have similar shapes in both one-module and two-module networks, with the lowest potential and highest noise coefficient observed at the oblique orientations. However, there is a difference in the asymmetry degrees of the drift and diffusion at cardinal and oblique orientations: the one-module network shows larger asymmetry in potential energy, while the two-module network shows larger asymmetry in the noise coefficient. These varying degrees of heterogeneity in drift and diffusion lead to qualitative differences in bias and variance patterns in estimation. Shallower potential differences with more asymmetrical noise coefficients result in correct bias and variance patterns in the two-module network, while the opposite leads to flipped variance patterns in the one-module network.  

      To intuitively understand how connectivity heterogeneity differentially affects the asymmetry degrees of drift and diffusion in one-module and two-module networks, consider a simple case where only the excitatory connection is heterogeneous, denoted as α. The asymmetry of diffusion reflects the degree of heterogeneity in either the sensory or memory modules. The noise coefficient derived from the low-dimensional projection is mainly determined by the heterogeneity of . While the one-module network, with a much lower α, shows almost flat , the two-module network shows more prominent asymmetry in with a larger α in the sensory module.  

      On the other hand, the asymmetry in the potential energy is influenced differently by the connectivity heterogeneity of the sensory module and that of the memory module. For memory maintenance, overall recurrent connections need to be strong enough to overcome intrinsic decay, simplifying to w = 1. In the one-module network, α in the memory module creates potential differences at cardinal and oblique orientations as 1± α. On the other hand, in the two-module network, with w = 1 fulfilled by the memory module, α in the sensory module acts as a perturbation. The effect of α is modulated by the connectivity strengths between sensory and memory module, denoted by γ. Potential differences at cardinal and oblique orientations can be represented as 1± γα. While both α and γ determine the energy level, the noise coefficient less depends on γ (see response to your Major Point 4). Thus, even for relatively larger α in the sensory module leading to more asymmetrical noise coefficients, the potential difference could be shallower in the two-module network with small γ<1. 

      In sum, in the two-module network, there is an additional degree of freedom, connectivity strengths between sensory and memory modules, which provides the flexibility to control drift and diffusion separately, unlike in the one-module network. To clarify this, we have added simulations in Figure 6 and Figure 9 and provided an intuitive explanation in the accompanying texts in pp. 6-7 and p. 9.

      Major Point 4: The proposed model has stronger feedback than feedforward connections between the sensory and memory modules. This is not a common assumption when thinking about hierarchical processing in the brain, and it is not discussed in the manuscript.

      As noted in the previous response, the connectivity strengths between the sensory and memory modules, denoted as γ, are important parameters determining the qualitative features of bias and variance patterns. γ corresponds to the product of Jf and Jb, feedforward and feedback strengths, and our additional simulation shows that the bias and variance patterns remain similar for a fixed γ. Note that further simulation revealed that the heterogeneity degree, α, and the intermodal connectivity strengths, γ, influence the drift and diffusion terms differently. As this result highlights the advantage of the two-module network, we moved the dependence of error patterns on intermodal connectivity strengths to the main figure (previous Figure 5 – Figure supplement 2), which now includes more simulations showing bias and variance patterns for different Jf and Jb and for different α and Jb (new Figure 6). 

      Minor Point 1: page 11: "circular standard deviation of sigma_theta = 1.3º at cardinal orientations" but in Figure 2 we see sigma_theta = 2º at cardinal orientations.

      The circular standard deviation of 𝜎𝜎𝜃𝜃 = 1.3º refers to the standard deviation of the sensory module output in iteration 1, that is, before feeding into the memory module to complete this iteration. In figure 2, the standard deviation plotted is that of the output of the memory module, which has a Gaussian memory noise with standard deviation 1.3º added on top of the sensory output. Hence we see a standard deviation of √(1.32 + 1.32) = 1.84º which seems close to 2º in the figure. We added a sentence in this paragraph of Methods (p. 13) to avoid confusion.

      Minor Point 2: equation (19): What does the prime of ||s'(theta)|| mean?

      The prime represents taking the derivative with respect to θ:

      reflects the length travelled on the stable trajectory when θ increases by one unit. As we plotted in Figure 9 and Figure 5 – Figure supplement 2, we clarified it in the legend.

      Minor Point 3: page 15: "The Fisher information (F) is estimated by assuming that the likelihood function p(r|theta) is Gaussian", but the whole point of Wei and Stocker (2015) and your Figure 2 is that likelihoods are skewed in these networks. This could be clarified.

      Thank you for pointing out the lack of clarity. In Wei and Stocker (2015) and our Figure 2, the likelihood is skewed with respect to 𝜃 (note the horizontal axes). However, in the Methods section, we assumed the distribution function 𝑝(𝑟|𝜃) is Gaussian with respect to 𝑟𝑟 when 𝜃 is considered fixed:

      where . The distribution function is skewed with respect to 𝜃 because the tuning curves are skewed with respect to 𝜃 (see Figure 4B). We have clarified our assumption in p. 16 to avoid confusion.

      Reviewer #3:

      Summary:

      The present study proposes a neural circuit model consisting of coupled sensory and memory networks to explain the circuit mechanism of the cardinal effect in orientation perception which is characterized by the bias towards the oblique orientation and the largest variance at the oblique orientation.

      Strengths:

      The authors have done numerical simulations and preliminary analysis of the neural circuit model to show the model successfully reproduces the cardinal effect. And the paper is wellwritten overall. As far as I know, most of the studies on the cardinal effect are at the level of statistical models, and the current study provides one possibility of how neural circuit models reproduce such an effect.

      We appreciate the reviewer’s comments that the work successfully reproduces error patterns through circuit models, advancing beyond previous statistical models. Below, we address the specific concerns of the reviewer.

      Weaknesses:

      There are no major weaknesses and flaws in the present study, although I suggest the author conduct further analysis to deepen our understanding of the circuit mechanism of the cardinal effects. Please find my recommendations for concrete comments.

      Minor Point 1: Likely, the interplay of the potential function (Figure 5D) and the noise amplitude (Figure 5C) in the memory network is the key to reproducing the cardinal effect. For me, it is obvious to understand the spatial profile of the potential function as what it currently looks like (Figure 5D), while I haven't had an intuitive understanding of how the spatial profile of noise structure emerges from the circuit model. Therefore I suggest the authors provide a more comprehensive analysis, including theory and simulation, to demonstrate how the noise structure depends on the network parameters. I am concerned about whether the memory network can still reproduce the minimal variance at the cardinal orientation if we reduce the Fano factor of single neuron variabilities. In this case, the shape of the potential function will be dominant in determining the variance over orientation (Figure 5F) and the result might be reverted.

      Thank you for the suggestion. Either in one-module or two-module networks, the specific pattern of heterogeneous connections induces more neurons tuned to cardinal orientations with narrower tuning widths. Such sparser representation near cardinal stimuli generates lower noise variability even with constant Gaussian noise, which is now added in Figure 5 – Figure Supplement 2. We also showed that the distinctive error patterns in one-module and two-module networks are maintained under Gaussian noise with varying amplitude in Figure 9 – Figure supplement 1.

      Minor Point 2: In addition, it is interesting to show how the representation of the sensory module looks like, e.g., plotting the figures similar to Figures B-F but from the sensory module. I feel the sensory module doesn't have a result similar to Figure 5F. Is it?

      Yes, decoded error patterns obtained from the sensory module are similar to the results obtained from the memory module. We have added Figure 4 – Figure supplement 1 to show that our conclusions remain valid when decoding from the sensory module.

      Minor point 3: Last but not least, I have a conceptual question about the presentation mechanism in the proposed circuit model. The present study refers to Wei, et al., 2015 and 2017 about the statistical model mechanism of the cardinal effect. If I remember correctly, Wei's papers considered joint encoding and decoding processes to render the cardinal effect. Can the authors regard the processes in the proposed circuit model with the stages in the statistical model? Or at least the authors should discuss this link in the Discussions.

      We now included a mention of using a population vector decoder that mimics Bayesian optimal readout in the Result section (p. 6), in addition to the Discussion and Methods. However, we acknowledge that this decoder is only optimal under a specific loss function. A recent Bayesian perception model suggested different types of noise like external noise or variations in loss functions that adjust tolerance to small errors may help explain various error patterns observed across different modalities (Hahn and Wei, 2024). We have now added this limitation in the Discussion, along with the inconsistency of the current model with experimental observations during perception tasks and future directions (p. 11).

    1. Author response:

      Reviewer #1 (Public Review):

      In this study, Girardello et al. use proteomics to reveal the membrane tension sensitive caveolin-1 interactome in migrating cells. The authors use EM and surface rendering to demonstrate that caveolae formed at the rear of migrating cells are complex membrane-linked multilobed structures, and they devise a robust strategy to identify caveolin-1 associated proteins using APEX2-mediated proximity biotinylation. This important dataset is further validated using proximity ligation assays to confirm key interactions, and follows up with an interrogation of a surprising relationship between caveolae and RhoGTPase signalling, where caveolin-1 recruits ROCK1 under high membrane tension conditions, and ROCK1 activity is required to reform caveolae upon reversion to isotonic solution. However, caveolin-1 recruits the RhoA inactivator ARHGAP29 when membrane tension is low and ARHGAP29 overexpression leads to disassembly of caveolae and reduced cell motility. This study builds on previous findings linking caveolae to positive feedback regulation of RhoA signalling, and provides further evidence that caveolae serve to drive rear retraction in migration but also possess an intrinsic brake to limit RhoA activation, leading the authors to suggest that cycles of caveolae assembly and disassembly could thereby be central to establish a stable cell rear for persistent cell migration

      A major strength of the manuscript is the robust proteomic dataset. The experimental set up is well defined and mostly well controlled, and there is good internal validation in that the high abundance of core caveolar proteins in low membrane tension (isotonic) conditions, and absence under high membrane tension (brief hypo-osmotic shock) conditions, correlating very well with previous finding. The data could however be better presented to show where statically robust changes occur, and supplementary information should include a table of showing abundance. It's very good to see a link to PRIDE, providing a useful resource for the community.

      We thank the reviewer for the positive feedback. We have included the outputs from the search engine in Supplementary File 1.

      The authors detail several known interactions and their mechanosensitivty, but also report new interactors of caveolin-1. Several mechanosensitive interactions of caveolin-1 take place at the cell rear, but others are more diffuse across the cell looking at the PLA data (e.g FLN1, CTTN, HSPB1; Figure 4A-F and Figure 4 supplement 1). It is interesting to speculate that those at the cell rear are involved in caveolae, whilst others are linked specifically to caveolin-1 (e.g. dolines). PLA or localisation analysis with Cavin1/PTRF may be able to resolve this and further specify caveolae versus non-caveolae mechanosensitive interactions.

      We thank the reviewer for this interesting idea. It is true that many if not most proteins we identified to be associated with Cav1 are not restricted to the cell rear. To analyse to what extent the identified proteins interact with Cav1 at the rear we reanalysed our PLA data for some of the antibody combinations we looked at. This new analysis is now shown in Fig 5G. As expected, for Cav1/PTRF and Cav1/EHD2 most PLA dots (70-80%) were found at the rear. This rear bias is also evident from the representative images we show in the Figure panels 5A and 5E. On the contrary, much fewer PLA dots (~40%) were rear-localised for Cav1/CTTN and Cav1/FLNA antibody combinations. This reflects the much broader cellular distribution of these proteins compared to the core caveolae proteins, and might suggest that there are generally few links between caveolae and cortical actin. However, it is also possible that such links/interactions are more difficult to detect using PLA (because of the extended distance between caveolae and the actin cortex, or because of steric constraints).

      The Cav1/ARHGAP29 influence on YAP signalling is interesting, but appear to be quite isolated from the rest of the manuscript. Does overexpression of ARHGAP29 influence YAP signalling and/or caveolar protein expression/Cav1pY14?

      Our data and published work originally prompted us to speculate that there is a potential functional link between Cav1, YAP, and ARHGAP29. In an attempt to address this we have performed several Western blots on cell lysates from cells overexpressing ARHGAP29. We did not see major changes in Cav1 Y14 phosphorylation levels in cells overexpressing ARHGAP29, and YAP and pYAP levels also remained unchanged (not shown). In addition, based on previous literature 1,2 we expected to see an effect on ARHGAP29 mRNA levels and YAP target gene transcripts in Cav1 siRNA transfected cells. To our surprise, the mRNA levels of three independent YAP target genes and ARHGAP29 were unchanged in Cav1 siRNA treated cells (this is now shown in Figure 6 Figure Supplement 1). Our data therefore suggest that in RPE1 cells, the connection between Cav1 and ARHGAP29 is independent of YAP signalling, and that the increase in ARHGAP29 protein levels observed in Cav1 siRNA cells is due to some unknown post-translational mechanism.

      ARHGAP29 and RhoA/ROCK1 related observations are very interesting and potentially really important. However, the link between ARHGAP29 and caveolae is not well established (other than in proteomic data). PLA or FRET could help establish this.

      We agree that the physical and functional link between caveolae (or Cav1) and ARHGAP29 was not well worked out in the original manuscript. In an attempt to address this we have performed PLA assays in GFP-ARHGAP29 transfected cells (as we did not find a suitable ARHGAP29 antibody that works reliably in IF) using anti-Cav1 and anti-GFP antibodies. The PLA signal we obtained for Cav1 and ARHGAP29 was not significantly different to control PLA experiments. There was very little PLA signal to start with. This is not surprising given that ARHGAP29 localisation is mostly diffuse in the cytoplasm, whilst Cav1 is concentrated at the rear. In addition, in cases where we do see ARHGAP29 localisation at the cell cortex, Cav1 tends to be absent (this is now shown in Figure 6 – Figure Supplement 2E). In other words, with the tools we have available, we see little colocalization between Cav1 and ARHGAP29 at steady state. Altogether we speculate that ARHGAP29, through its negative effect on RhoA, flattens caveolae at the membrane or interferes with caveolae assembly at these sites.

      This of course prompts the question why ARHGAP29 was identified in the Cav1 proteome with such specificity and reproducibility in the first place? This can be explained by the way APEX2 labeling works. Proximity biotinylation with APEX2 is extremely sensitive and restricted to a labelling radius of ~20 nm 3. The labeling reaction is conducted on live and intact cells at room temperature for 1 min. Although 1 min appears short, dynamic cellular processes occur at the time scale of seconds and are ongoing during the labelling reaction. It is conceivable that within this 1 min time frame, ARHGAP29 cycles on and off the rear membrane (kiss and run). This allows ARHGAP29 to be biotinylated by Cav1-APEX2, resulting in its identification by MS. We have included this in the discussion section.

      The relationship between ARHGAP29 and RhoA signalling is not well defined. Is GAP activity important in determining the effect on migration and caveolae formation? What is the effect on RhoA activity? Alternatively, the authors could investigate YAP dependent transcriptional regulation downstream of overexpression.

      We have addressed this point using overexpression and siRNA transfections. We overexpressed ARHGAP29 or ARHGAP29 lacking its GAP domain and performed WB analysis against pMLC (which is a commonly used and reliable readout for RhoA and myosin-II activity). Much to our surprise, overexpression of ARHGAP29 increased (rather than decreased) pMLC levels, partially in a GAP-dependent manner (see Author response image 1). This is puzzling, as ARHGAP29 is expected to reduce RhoA-GTP levels, which in turn is expected to reduce ROCK activity and hence pMLC levels. In addition, and also surprisingly, siRNA-mediated silencing of ARHGAP29 did not significantly change pMLC levels. By contrast, pMLC levels were strongly reduced in Cav1 siRNA treated cells (this is shown in Fig. 6A and 6B in the revised manuscript). These new data underscore the important role of caveolae in the control of myosin-II activity, but do not allow us to draw any firm conclusions about the role of ARHGAP29 at the cell rear.

      Author response image 1.

      Overexpression of ARHGAP29 reduces, rather than increases pMLC in RPE1 cells.

      We are uncertain as to how to interpret the ARHGAP29 overexpression data presented in Author response image 1 and therefore decided not to include it in the manuscript. One possibility is that inactivation of RhoA below a certain critical threshold causes other mechanisms to compensate. For instance, the activity of alternative MLC kinases such as MLCK could be enhanced under these conditions. Another possibility is that ARHGAP29 controls MLC phosphorylation indirectly. For instance, it has been shown that ARHGAP29 promotes actin destabilization through inactivating LIMK/cofilin signalling 1. In agreement with this, we find that overexpression of ARHGAP29 reduces p-cofilin (serine 3) levels (see Author response image 2). Since cofilin and MLC crosstalk 4, it is possible that increased pMLC levels are the result of a feedback loop that compensates for the effect of actin depolymerisation. This is now discussed in the discussion section. Whichever the case, we hope the reviewers understand that deeper mechanistic insight into the intricate mechanisms of Rho signalling at the cell rear are beyond the scope of this manuscript.

      Author response image 2.

      Overexpression of ARHGAP29 reduces p-cofilin levels in RPE1.

      Reviewer #2 (Public Review):

      Girardello et al investigated the composition of the molecular machinery of caveolae governing their mechano-regulation in migrating cells. Using live cell imaging and RPE1 cells, the authors provide a spatio-temporal analysis of cavin-3 distribution during cell migration and reveal that caveolae are preferentially localized at the rear of the cell in a stable manner. They further characterize these structures using electron tomography and reveal an organization into clusters connected to the cell surface. By performing a proteomic approach, they address the interactome of caveolin-1 proteins upon mechanical stimulation by exposing RPE1 cells to hypo-osmotic shock (which aims to increase cell membrane tension) or not as a control condition. The authors identify over 300 proteins, notably proteins related to actin cytoskeleton and cell adhesion. These results were further validated in cellulo by interrogating protein-protein interactions using proximity ligation assays and hypo-osmotic shock. These experiments confirmed previous data showing that high membrane tension induces caveolae disassembly in a reversible manner. Eventually, based on literature and on the results collected by the proteomic analysis, authors investigated more deeply the molecular signaling pathway controlling caveolae assembly upon mechanical stimuli. First, they confirm the targeting of ROCK1 with Caveolin-1 and the implication of the kinase activity for caveolae formation (at the rear of the cell). Then, they show that RhoGAP ARHGAP29, a factor newly identified by the proteomic analysis, is also implicated in caveolae mechano-regulation likely through YAP protein and found that overexpression of RhoGAP ARHGAP29 affects cell motility. Overall, this paper interrogated the role of membrane tension in caveolae located at the rear of the cell and identified a new pathway controlling cell motility.

      Strengths:

      Using a proximity-based proteomic assay, the authors reveal the protein network interacting with caveolae upon mechanical stimuli. This approach is elegant and allows to identify a substantial new set of factors involved in the mechano-regulation of caveolin-1, some of which have been verified directly in the cell by PLA. This study provides a compelling set of data on the interactions between caveolae and its cortical network which was so far ill-characterized.

      We thank the reviewer for this positive feedback.

      Weaknesses:

      The methodology demonstrating an impact of membrane tension is not precise enough to directly assess a direct role on caveolae at a subcellular scale, that is between the front and the rear of the cell. First, a better characterization of the "front-rear" cellular model is encouraged.

      We agree with the reviewer that a quantitative analysis of the caveolae front-rear polarity would strengthen our conclusions. To address this, we have analysed the localisation of Cav1 and cavins in detail and in a large pool of cells, both in fixed and live cells. Our quantification clearly shows that Cav1 and cavins are enriched at the cell rear. This is now shown in Figure 1 and Figure 1 - Figure Supplement 1. To demonstrate that Cav1/cavins are truly rear-localised we analysed live migrating cells expressing tagged Cav1 or cavins. This analysis, which was performed on several individual time lapse movies, showed that caveolae rear localisation is remarkably stable (e.g. Figure 1C and 1D). We also present novel data panels and movies showing caveolae dynamics during rear retractions, in dividing cells, and in cells that polarise de novo. This new data is now described in the first paragraph of the results section.

      Secondly, authors frequently present osmotic shock as "high membrane tension" stimuli. While osmotic shock is widely used in the field, this study is focused only on caveolae localized at the rear of cell and it remains unclear how the level of a global mechanical stimuli triggered by an osmotic shock could mimic a local stimuli.

      We agree with the reviewer that osmotic shock will cause a global increase in membrane tension and therefore is only of limited value to understand how membrane tension is regulated at the rear, and how caveolae respond to such a local stimulus. It was not our aim nor is it our expertise to address such questions. To answer this sophisticated optogenetic approaches or localised membrane tension measurements (e.g. through the use of the Flipper-TR probe) are needed. It is beyond the scope of this manuscript to perform such experiments. However, given the strong enrichment of caveolae at the cell rear, we believe it is justified to propose that the changes we observe in the proteome do (mostly) reflect changes in caveolae at the rear. We have now included several quantifications on fixed cells, live cells, and PLA assays to support that caveolae are highly enriched at the rear. In addition, and importantly, a recent preprint by the Roux lab shows that membrane tension gradients indeed exist in many migrating and non-migrating cells 5. Using very similar hypotonic shock assays, the Caswell lab also showed that low membrane tension at the rear is required for caveolae formation 6. We have included a section in the discussion in which we elaborate on how membrane tension is controlled in migrating cells, and how it might regulate caveolae rear localisation.

      In the present case, it remains unknown the extent to which this mechanical stress is physiologically relevant to mimic mechanical forces applied at the rear of a migrating cell.

      This is true. Our study does not address the nature of mechanical forces at the cell rear. This a complex subject that is technically challenging to address, and therefore is beyond the scope of this manuscript.

      Some images are not satisfying to fully support the conclusions of the article.

      We agree that some of the images, in particular the ones presented for the PLA assays, do not always show a clear rear localisation of caveolae. We have explained above why this is the case. We hope that our new quantitative measurements, movies and figure panels, addresses the reviewer’s concern.

      At this stage, the lack of an unbiased quantitative analysis of the spatio-temporal analysis of caveolae upon well-defined mechanical stimuli is also needed.

      These are all very good points that were previously addressed beautifully by the Caswell group 6. To address this in part in our RPE1 cell system, we imaged RPE1 cells exposed to the ROCK inhibitor Y27632 (see Author response image 3). The data shows that cell rear retraction is impeded in response to ROCK inhibition, which is in line with several previous reports. Cavin-1 remained mostly associated with the cell rear, although the distribution appeared more diffuse. We believe this data does not add much new insight into how caveolae function at the rear, and hence was not included in the manuscript.

      Author response image 3.

      Effect of ROCK inhibition on cavin1 rear localisation and rear retraction. Cells were imaged one hour after the addition of Y27632.

      Cells on images, in particular Figure 1, are difficult to see. Signal-to noise ratio in different cell area could generate a biased. Since there is inconsistency between caveolae density and localization between Figures, more solid illustrations are needed along quantitative analysis.

      As mentioned above, we have carefully analysed the localisation of caveolae in fixed cells (using Cav1 and cavin1 antibodies as well as Cav1 and cavin fusion proteins) and in live cells transfected with various different caveolae proteins. The analysis clearly demonstrates an enrichment of caveolae at the rear (Figure 1 and Figure 1 – Figure Supplement 1). Our tomography and TEM data supports this as well (Figure 2).

      References:

      1. Qiao Y, Chen J, Lim YB, et al. YAP Regulates Actin Dynamics through ARHGAP29 and Promotes Metastasis. Cell reports. 2017;19(8):1495-1502.

      2. Rausch V, Bostrom JR, Park J, et al. The Hippo Pathway Regulates Caveolae Expression and Mediates Flow Response via Caveolae. Curr Biol. 2019;29(2):242-255 e246.

      3. Hung V, Udeshi ND, Lam SS, et al. Spatially resolved proteomic mapping in living cells with the engineered peroxidase APEX2. Nat Protoc. 2016;11(3):456-475.

      4. Wiggan O, Shaw AE, DeLuca JG, Bamburg JR. ADF/cofilin regulates actomyosin assembly through competitive inhibition of myosin II binding to F-actin. Dev Cell. 2012;22(3):530-543.

      5. Juan Manuel García-Arcos AM, Julissa Sánchez Velázquez, Pau Guillamat, Caterina Tomba, Laura Houzet, Laura Capolupo, Giovanni D’Angelo, Adai Colom, Elizabeth Hinde, Charlotte Aumeier, Aurélien Roux. Actin dynamics sustains spatial gradients of membrane tension in adherent cells. bioRxiv 20240715603517. 2024.

      6. Hetmanski JHR, de Belly H, Busnelli I, et al. Membrane Tension Orchestrates Rear Retraction in Matrix-Directed Cell Migration. Dev Cell. 2019;51(4):460-475 e410.

      7. Tsai TY, Collins SR, Chan CK, et al. Efficient Front-Rear Coupling in Neutrophil Chemotaxis by Dynamic Myosin II Localization. Dev Cell. 2019;49(2):189-205 e186.

      8. Mueller J, Szep G, Nemethova M, et al. Load Adaptation of Lamellipodial Actin Networks. Cell. 2017;171(1):188-200 e116.

      9. De Belly H, Yan S, Borja da Rocha H, et al. Cell protrusions and contractions generate long-range membrane tension propagation. Cell. 2023.

      10. Matthaeus C, Sochacki KA, Dickey AM, et al. The molecular organization of differentially curved caveolae indicates bendable structural units at the plasma membrane. Nat Commun. 2022;13(1):7234.

      11. Sinha B, Koster D, Ruez R, et al. Cells respond to mechanical stress by rapid disassembly of caveolae. Cell. 2011;144(3):402-413.

      12. Lieber AD, Schweitzer Y, Kozlov MM, Keren K. Front-to-rear membrane tension gradient in rapidly moving cells. Biophysical journal. 2015;108(7):1599-1603.

      13. Shi Z, Graber ZT, Baumgart T, Stone HA, Cohen AE. Cell Membranes Resist Flow. Cell. 2018;175(7):1769-1779 e1713.

      14. Grande-Garcia A, Echarri A, de Rooij J, et al. Caveolin-1 regulates cell polarization and directional migration through Src kinase and Rho GTPases. The Journal of cell biology. 2007;177(4):683-694.

      15. Grande-Garcia A, del Pozo MA. Caveolin-1 in cell polarization and directional migration. Eur J Cell Biol. 2008;87(8-9):641-647.

      16. Ludwig A, Howard G, Mendoza-Topaz C, et al. Molecular composition and ultrastructure of the caveolar coat complex. PLoS biology. 2013;11(8):e1001640.

    1. Author response:

      The following is the authors’ response to the original reviews.

      eLife assessment:

      This important study details an enrichment of the IL-6 signaling pathway in human tendinopathy and applies transcriptional profiling to an advanced in vitro model to test IL-6 specific phenotypes in tendinopathy. Overall, the strength of evidence is solid yet incomplete, as transcriptomic measurements provide clarity, though functional studies including analysis of proliferation are needed to confirm these findings. This work will be of interest to stem cell biologists and immunologists.

      To functionally assess the effect of IL-6 on Scx+ fibroblast proliferation in an acute injury, we repeated the in vivo studies with an EdU staining and a newly established IL-6 KO x ScxGFP+ mouse line. We found no evidence for this effect in acute injuries and acknowledge this in the revised manuscript.

      We further added data collected by combining fluorescence microscopy with human patient-derived tissue to strengthen the link between IL-6, IL-6R, and proliferation of CD90+ cells in chronic injuries.

      See comment 1.1.

      See comment 2.4.

      Changes:

      - Title

      - Abstract

      - Figure 2 and 3 (new data)

      - Figure 7 (new data)

      - Results

      - Discussion

      Reviewer 1

      (1.1) First, the experimental approach does not directly assess proliferation, as such the conclusions regarding proliferation are not well supported. In the ex-vivo model, the use of cell counting approaches is somewhat acceptable since the system is constrained by the absence of potential influx of new cells. However, given the nearly unlimited supply of extrinsically derived cells in vivo (vs. the explant model), assessment of actual proliferation (e.g. Edu, BrdU, Ki67) is critical to support this conclusion.

      To assess the effect of IL-6 on Scx+ fibroblast proliferation in an acute injury, we repeated the in vivo studies with an EdU staining and a newly established IL-6 KO x ScxGFP+ mouse line to combat the considerable background noise of currently available Scx antibodies.

      Under the improved design of these experiments, we could detect no effect of IL-6 on ScxGFP+ cells in an acute injury in vivo. We have therefore replaced figure 5 with the new results in figure 7 and moved figure 5F to the supplementary materials (Supplementary figure 9).

      We acknowledge and discuss this in the discussion section.

      See comment 2.4.

      See comment 2.11.

      Changes:

      - Title

      - Abstract

      - Figure 7 (new data)

      - Supplementary Figure 9

      - Results

      - Discussion

      (1.2) Second, the justification for the use of Scx-GFP+ cells as a progenitor population is not well supported. Indeed, in the discussion, Scx+ cells are treated as though they are uniformly a progenitor population, when the diversity of this population has been established by the cited studies, which do not suggest that these are progenitor populations. Additional definition/ delineation of these cells to identify the subset of these cells that may actually display other putative progenitor markers would support the conclusions. As it stands, the study currently provides important information on the impact of IL6 on Scx+ cells, but not tendon progenitors.

      We further delineated the extrinsic cell populations isolated from mouse Achilles tendons of ScxGFP+ mice using flow cytometric analysis and RT-qPCR. We used tendon population markers suggested by sc-RNA-seq of mouse Achilles tendons.

      (De Micheli et al., Am. J. Physiol. - Cell Physiol., 2020, 319(5), DOI: 10.1152/ajpcell.00372.2020)

      While a small subpopulation of these cells expressed typical progenitor markers (i.e. CD45 and CD146), we could detect no overlap with Scx+ cells. As suggested by the reviewer, we therefore replaced occurrences of “progenitor” in the manuscript with “fibroblast” and performed additional experiments with human patient-derived tissue sections and the fibroblast marker CD90.

      See comment 2.1.

      Changes:

      - Title

      - Abstract

      - Figure 2 (new data)

      - Figure 3 (new data)

      - Supplementary Figure 6 (new data)

      - Results

      - Discussion

      (1.3) Clarity regarding the relevance of the 'sheath-like' component of the assembloid would provide helpful context regarding which types of tendons are likely to have this type of communication vs. those that do not, and if there are differences in tendinopathy prevalence. Understanding why/how this communication between structures is relevant is important.

      Our assembloid concept is inspired by the structure of unsheathed tendons (i.e. biceps, semitendinosus, gracilis) and not sheathed tendons like the flexor tendons.

      We agree that clarity regarding the tendon type having this type of communication is important, so we sharpened previously blurry text passages in the revised manuscript.

      Text changes:

      - Introduction, page 3

      - Results, page 4

      - Results, page 8

      - Results, page 9

      - Results, page 11

      - Discussion, page 25

      - Discussion, page 26

      - Experimental section, page 28

      - Figure 1

      - Figure 2

      - Figure 3

      - Supplementary Table 1

      - Supplementary Figure 3

      - Supplementary Figure 4

      (1.4) Minor: in the text for Figure 6 (2nd paragraph), the comma in 19,694 is superscripted.

      Corrections were made throughout the manuscript.

      Text changes:

      - Results, page 4

      - Results, page 12

      - Results, page 19

      - Results, page 21

      (1.5) Minor: The inclusion of the Scx-GFP mouse should be included in the schematic Figure 5.

      The results presented in the previous draft did not feature tissues from ScxGFP mice but used a Scx-antibody to visually detect Scx+ cells. In anticipation of the revision process, we bred a new IL-6 KO x ScxGFP+ mouse line and repeated the experiment. As suggested by the reviewer, the new schematic figure 7 as well as the former figure 5 moved to the supplementary material now includes this mouse.

      Figure changes:

      - Supplementary Figure 9 (former figure 5)

      - Figure 7

      Reviewer 2

      (2.1) One question that comes to mind is whether the fibroblast progenitors in the extrinsic sheath of Achilles tendon is similar to those surrounding the tail tendon. The similarity of progenitors between different tendons is assumed with this model. I would consider this to be a minor issue.

      Tail tendon fascicles are thought to have a low number of reparative fibroblasts / progenitor cells because they lack a developed extrinsic compartment. Achilles tendons are supposed to have a higher number of reparative fibroblasts / progenitor cells, as their fascicles are surrounded by an extrinsic compartment.

      To verify this here, we added a better characterization and comparison of the cell populations isolated from the tail tendon fascicles and the Achilles tendons.

      First, we added representative light microscopy images of these cells at different timepoints after being cultured on tissue-culture plastic.

      Second, we performed flow cytometric analysis not only on the freshly digested tail tendon fascicles and Achilles tendons, but also on the cultured cells at the timepoint when they would have been embedded into the assembloids.

      Third, we compared the expression of population-specific markers in cells derived from tail tendon fascicle and Achilles tendons.

      As expected, tail tendon fascicle-derived cell populations appeared to be more elongated than Achilles tendon-derived populations shortly after isolation. Similarly, the “maintenance” fibroblasts in healthy tendons are more elongated than the reparative fibroblasts in diseased ones. After culture and priming in tendinopathic niche conditions, both populations assumed a more roundish, reparative phenotype.

      This was consistent with the flow cytometric analysis, which revealed a large difference between freshly isolated populations, that disappeared after extended culture and priming in tendinopathic niche conditions. Gene expression in tail tendon fascicle-derived and Achilles tendon-derived cells was similar after extended culture and priming in tendinopathic niche conditions.

      See comment 1.2.

      See comment 2.10.

      Changes:

      - Supplementary Figure 6 (new data)

      - Results, page 11

      (2.2) The authors use core tendons from IL-6 knockout mice and progenitors from wild-type mice. The reasoning behind this approach was a little confusing... is IL-6 expressed solely in the tendon core compared to the extrinsic sheath?

      Insights gained from human patient-derived tissues (Figure 2) suggest that in a healthy tendon, most of the IL-6 is located in the extrinsic compartment but distributed over compartments in the tendinopathic ones.

      Our assembloid design mimicks this by embedding wildtype fibroblasts into the extrinsic compartment. Our hypothesis was that a wildtype core in tendinopathic niche conditions attracts reparative fibroblasts through IL-6, while an IL-6 knock-out core does not. Therefore, it was important to establish IL-6 gradients close to what they seem to be in vivo.

      Nevertheless, we have to acknowledge that the amount of IL-6 secreted by extrinsic fibroblasts in isolation is quite small compared to what is secreted by a wildtype core (Supplementary Figure 7). Attributing IL-6 in the supernatant of a WT core // WT fibroblast assembloid to the correct cell population is challenging but could be part of future research.  

      Changes:

      - Figure 2 (new data)

      - Supplementary Figure 7 (new data)

      - Results, page 12

      (2.3) Is a co-culture system for 7 days appropriate to model tendinopathy without the supplementation of exogenous inflammatory compounds? The transcriptomic differences in Figure 3 seem to be subtle, and may perhaps suggest that it could be a model that more closely resembles steady state compared to tendinopathy. If so, is IL-6 still relevant during steady state?

      The collective experience in our lab is that core explants exposed to tendinopathic niche conditions (i.e. serum, 37°C, high oxygen, and high glucose levels) assume a disease-like phenotype. (i.e. Wunderli et al., Matrix Biology, 2020, Volume 89 https://doi.org/10.1016/j.matbio.2019.12.003 and Blache et al., Sci. Rep., 2021, 11(1), DOI 10.1038/s41598-021-85331-1).

      Specifically for our core // fibroblast co-culture system, we have reported the emergence of exaggerated tendinopathic hallmarks in a previous publication (Stauber et al., Adv. Healthc. Mater., 2021, 10(20), https://doi.org/10.1002/adhm.202100741).

      We clarified the use of previously validated tendinopathic niche conditions in this manuscript.

      Changes:<br /> - Introduction, page 3<br /> - Results, page 12

      (2.4) The results presented in Figures 4 and 5 are impressive, demonstrating a link between IL-6 and fibroblast progenitor numbers and migration. Their experimental design in these figures show strong evidence, using Tocilizumab and recombinant IL-6 to rescue shown phenotypes. I would reduce the claims on proliferation, however, unless a proliferation-specific marker (e.g., Ki67, BrdU, EdU) is included in confocal analyses of Scx+ progenitors.

      As reviewer 1 pointed out as well, it is important to use a proliferation-specific marker “given the nearly unlimited supply of extrinsically derived cells in vivo (vs. the explant model)”.

      To assess the effect of IL-6 on Scx+ fibroblast proliferation in vivo, we repeated those experiments with a proliferation-specific EdU staining and a newly established IL-6 KO x ScxGFP+ mouse line.

      Under this improved design, we could not detect an effect of IL-6 on proliferation in an acute injury in vivo.

      We have therefore replaced figure 5 with the new results in figure 7 and moved figure 5F to the supplementary materials (Supplementary figure 9).

      We acknowledge and discuss this in the discussion section and softened our statements in the title and the abstract.

      See comment 1.1.

      See comment 2.11.

      Changes:

      - Title

      - Abstract

      - Figure 7 (new data)

      - Supplementary Figure 9

      - Results

      - Discussion

      (2.5) I think it would significantly strengthen the study if they could measure tendon healing in IL-6 knockouts or in wild-type mice treated with IL-6 inhibitors, since conventional ablation of IL-6 may lead to the elevation of compensatory IL-6 superfamily ligands that could activate STAT signaling. The authors claim that reducing IL-6 signaling decreases transcriptomic signatures of tendinopathy, but IL-6 may be necessary to promote normal healing of the tendon following injury. It is supposed that a lack of Scx+ progenitor migration would delay tendon healing.

      Indeed, another study using the same IL-6 knock-out strain showed that a lack of IL-6 signaling resulted in slightly inferior mechanical properties in healing patellar tendons (Lin et al., J. Biomech., 39(1), 2006 https://doi.org/10.1016/j.jbiomech.2004.11.009)

      Also, it might be due to the elevation of compensatory IL-6 superfamily ligands that we found no effect of IL-6 on the proliferation of Scx+ cells in an acute injury in vivo.

      Therefore, assessing the effects of IL-6 inhibitors on tendon healing following an acute injury would have been of great interest to us. Unfortunately, getting the necessary permission from the animal experimentation office for a new invasive treatment protocol was outside of our scope due to the severity degree and time limitations.

      We incorporated and acknowledged these important points in the discussion.

      Text changes:

      - Introduction, page 3

      - Discussion, page 26

      (2.6) Do IL-6 knockout mice and/or mice treated with IL-6 inhibitors have delayed healing following Achilles tendon resection? Please provide experimental evidence.

      See comment 2.5.

      (2.7) I would suggest reducing claims on proliferation, or include a proliferation specific marker (e.g., Ki67, BrdU, EdU) in confocal analyses of Scx+ progenitors.

      See comment 1.1.

      See comment 2.4.

      (2.8) Supplementary Figures 1 and 2: the authors removed outliers. Please specify exactly which outliers were removed in the figures, and provide additional information on the criteria used to identify these outliers.

      To address this comment, we sharpened our criteria for identifying outliers and re-did the analysis depicted in figure 1.

      Briefly, we excluded 5 normal and 5 tendinopathic samples from sheathed tendons which have a different compartmental structure than unsheathed tendons.

      A complete separate analysis of the sheathed tendons would have been beyond the scope of this manuscript, but early screening suggested that IL-6 transcripts are not increased in sheathed tendinopathic tendons.

      We made text changes throughout the manuscript and to the supplementary table 1 and supplementary figure 2 to clearly state our criteria for excluding samples / outliers.

      Changes:

      - Introduction, page 3

      - Results, page 4

      - Results, page 8

      - Results, page 9

      - Results, page 11

      - Discussion, page 25

      - Discussion, page 26

      - Experimental section, page 28

      - Figure 1,

      - Figure 2,

      - Figure 3,

      - Supplementary table 1,

      - Supplementary figure 2,

      - Supplementary figure 3,

      - Supplementary figure 4,

      (2.9) Whenever "positive enrichment" is mentioned in the text, please specify in what group. It is presumed that the enrichment, for example, in the first figure is associated with tendinopathy samples compared to controls, though it is a bit unclear.

      The direction of the enrichment was added to the text.

      Text changes:

      - Abstract, page 1

      - Introduction, page 3

      - Results, page 4

      - Results, page 6

      - Results, page 12

      - Results, page 14

      - Results, page 19

      - Results, page 21

      - Discussion, page 25

      - Discussion, page 26

      - Discussion, page 27

      - Figure 1

      - Figure 5

      - Figure 8

      - Figure 9

      - Supplementary figure 3

      - Supplementary figure 4

      - Supplementary figure 6

      - Supplementary figure 8

      - Supplementary figure 11

      - Supplementary figure 12

      - Supplementary figure 14

      (2.10) Are tail tendon progenitors similar to Achilles tendon progenitors? Please provide a statement that shows similarity (in function, transcriptome, etc.) to support the in vitro tendon model.

      See comment 1.2.

      See comment 2.1.

      (2.11) Are the results in Figure 5F significant? It seems that your pictures show a dramatic change in migration, but the quantification does not?

      We repeated the in vivo studies with a newly established IL-6 KO x ScxGFP+ mouse line to combat the considerable background noise of currently available Scx antibodies.

      Under the improved design of these experiments, we could not detect an effect of IL-6 on ScxGFP+ cells migration in an acute injury in vivo.

      We have therefore replaced figure 5 with the new results in figure 7 and moved figure 5F to the supplementary materials (Supplementary figure 9)

      We acknowledge and discuss this in the discussion section.

      See comment 1.1.

      See comment 2.4.

      Changes:

      - Title

      - Abstract

      - Figure 7 (new data)

      - Supplementary Figure 9

      - Results

      - Discussion

      (2.12) Please provide additional discussion points on cis- versus trans-IL6 signaling in your results found in mouse. Do you think researchers/clinicians would want to target trans-IL6 signaling based on your results? Please support these statements with the expression of IL6R on cells found in the tendon core and external sheath progenitors.

      To address this comment, we performed flow cytometric analysis on Achilles tendon-derived fibroblasts expanded in 2D and digested sub-compartments of the assembloids (Supplementary Figure 7).

      These data suggest that IL6R is neither expressed by core nor extrinsic fibroblasts, but mainly comes from core-resident CD45+ tenophages.

      Human samples co-stained for IL6R and CD68 (an established human macrophage marker) confirmed macrophages as a source of IL-6R in vivo. However, human samples co-stained for IL6R and CD90 (an established marker of reparative fibroblasts in humans) also detected IL6R on CD90+ cells, which have not yet been reported to express IL6R themselves.

      Overall, it is likely that trans-IL-6 signaling is more important for the activation of reparative fibroblasts than cis-IL-6 signaling. We added these statements to the manuscript.

      Changes:

      - Results, page 9

      - Results, page 12

      - Discussion, page 25

      - Discussion, page 26

      - Figure 3 (new data)

      - Supplementary figure 7 (new data)

      (2.13) Please provide more detail on collagen isolation from rat tail in the methods section.

      We provided more details on collagen isolation from rat tail in the experimental section (page 29)

      Changes:

      - Experimental section, page 29

      (2.14) Please comment on whether your in vitro system resembles tendinopathy or a steady state tendon. If it models more of a steady state system, would IL-6 still be relevant?

      See comment 2.3.

      Detailed feedback:

      Reviewer 1:

      This work by Stauber et al. is focused on understanding the signaling mechanisms that are associated with tendinopathy development, and by screening a panel of human tendinopathy samples, identified IL-6/JAK/STAT as a potential mediator of this pathology. Using an innovative explant model they delineated the requirement for IL-6 in the main body of the tendon to alter the dynamics of cells in the peritendinous synovial sheath space.

      The use of a publicly available existing dataset is considered a strength since this dataset includes expression data from several different human tendons experiencing tendinopathy. This facilitates the identification of potentially conserved regulators of the tendinopathy phenotype.

      The clear transcriptional shifts between WT and IL6-/- cores demonstrates the utility of the assembloid model, and supports the importance of IL6 in potentiating the cell response to this stimuli.

      Reviewer 2:

      The authors of this study describe a goal of elucidating the signaling pathways that are upregulated in tendinopathy in order to target these pathways for effective treatments. Their goal is honorable, as tendinopathy is a common debilitating condition with limited treatments. The authors find that IL-6 signaling is upregulated in human tendinopathy samples with transcriptomic and GSEA analyses. The evidence of their initial findings are strong, providing a clinically-relevant phenotype that can be further studied using animal models.

      Along these lines, the authors continue with an advanced in vitro system using the mouse tail tendon as the core with progenitors isolated from the Achilles tendon as the external sheath embedded in a hydrogel matrix. One question that comes to mind is whether the fibroblast progenitors in the extrinsic sheath of Achilles tendon is similar to those surrounding the tail tendon. The similarity of progenitors between different tendons is assumed with this model. I would consider this to be a minor issue, and would consider the in vitro system to be an additional strength of this study.

      In order to address the IL-6 signaling pathway, the authors use core tendons from IL-6 knockout mice and progenitors from wild-type mice. The reasoning behind this approach was a little confusing... is IL-6 expressed solely in the tendon core compared to the extrinsic sheath? Furthermore, is a co-culture system for 7 days appropriate to model tendinopathy without the supplementation of exogenous inflammatory compounds? The transcriptomic differences in Figure 3 seem to be subtle, and may perhaps suggest that it could be a model that more closely resembles steady state compared to tendinopathy. If so, is IL-6 still relevant during steady state?

      Nevertheless, the results presented in Figures 4 and 5 are impressive, demonstrating a link between IL-6 and fibroblast progenitor numbers and migration. Their experimental design in these figures show strong evidence, using Tocilizumab and recombinant IL-6 to rescue shown phenotypes. I would reduce the claims on proliferation, however, unless a proliferation-specific marker (e.g., Ki67, BrdU, EdU) is included in confocal analyses of Scx+ progenitors. The Achilles tendon injury model provides a nice in vivo confirmation of Scx-progenitor migration to the neotendon.

      Given their goal to elucidate signaling pathways that could be targeted in the clinic, I think it would significantly strengthen the study if they could measure tendon healing in IL-6 knockouts or in wild-type mice treated with IL-6 inhibitors, since conventional ablation of IL-6 may lead to the elevation of compensatory IL-6 superfamily ligands that could activate STAT signaling. The authors claim that reducing IL-6 signaling decreases transcriptomic signatures of tendinopathy, but IL-6 may be necessary to promote normal healing of the tendon following injury. It is supposed that a lack of Scx+ progenitor migration would delay tendon healing.

      Overall, the authors of this study elucidated IL-6 signaling in tendinopathy and provided a strong level of evidence to support their conclusions at the transcriptomic level. However, functional studies are needed to confirm these phenotypes and fully support their aims and conclusions. With these additional studies, this work has the potential to significantly influence treatments for those suffering from tendinopathy.

    1. Author response:

      (1) First, we wish to point out that there has not been a model for quantifying genetic drift in multi-copy gene systems.  Hence, the first attempt using the Haldane model is not expected to be familiar and readily acceptable. Nevertheless, the standard WF (Wright-Fisher) model cannot handle drift in multi-copy gene systems, such as viruses, due to the two levels of genetic drift – within individuals as well as between individuals of the population.

      [Point 1 responds to the comments that we did not engage with the literature, in particular, publications like the Canning model, which are extensions of the WF model. As pointed out above, models based on the WF sampling cannot handle the two levels of genetic drift.]

      (2) A crucial aspect of the study is the nature of rRNA gene cluster, which is also a multi-copy gene system. It is easy to see some multi-copy gene systems, like viral particles or mtDNAs, to have a sub-population of genes within each individual. It is less obvious that tandem arrays of gene copies like rRNA genes can be treated as sub-populations that are subjected to drift. Nevertheless, rRNA gene copies frequently transfer mutations among copies in the same cell via the homogenization process. Hence, rRNA genes do not have the property of "locus" of single-copy genes as they move about as well (a bit like transposons but via different mechanisms). Indeed, the collection of rRNA genes in a cell is referred to as the “community of genes” as cited in Fig. 1. Over hundreds of generations, rRNA genes are effectively a small gene pool like mtDNAs within cells.  Furthermore, the copy number of rRNA genes also changes rapidly among individuals. For these reasons, genetic drift is operative within cells and this study aims to determine its strength (see Response 3 below).

      [Point 2 of the response addresses questions of Review #1 such as "(whether) the authors are referring to diversity in a single copy of an rRNA gene (or) diversity across the entire array of rRNA genes" or "(whether) the discussion of heterozygosity at rRNA ... is diversity per single copy locus or after collapsing loci together". The answer should be "the genetic diversity of the population of rRNA genes in the cell", noting that the single gene locus does not apply here. Similarly, a question like "Alignment to a single reference genome would likely lead to incorrect and even failed alignment for some reads'" from Review #2 appears to be based on the homology concept of a rRNA gene locus.  All rRNA gene copies are aligned against the consensus of the population of genes of the species. The consensus nucleotide nearly always accounts for > 90% of the gene copies in the population.]

      (3) We now clarify the meaning of C*, the effective copy number of rRNA genes. We apologize that the abstract is indeed unclear, and even misleading. In the abstract, we did not use different notations for the actual copy number (C) and the effective copy number (C*) of rRNA genes. Instead, we use the letter C to designate both.  Furthermore, in the main text, the presentation of the effective number, C*, is overly complicated (in order to be realistic).  We apologize. Slight modifications of the abstract should have removed all the mis-understandings, as shown below.

      "On average, rDNAs have C ~ 150 - 300 copies per haploid in humans. While a neutral mutation of a single-copy gene would take 4N (N being the population size) generations to become fixed, the time should be 4NC generations for rRNA genes where 1<< C (C being the effective copy number; C > C or C <C will depend on the strength of drift). However, the observed fixation time in mouse and human is < 4N, implying the paradox of C < 1. Genetic drift that encompasses all random neutral evolutionary forces appears as much as 100 times stronger for rRNA genes as for single-copy genes, thus reducing C* to < 1."

      [Point 3 responds to the key criticisms.  From Review #1 " The authors frame the number of rRNA genes as roughly equivalent to expanding the population size, ... a mutation can spread among rRNA gene copies is fundamentally different   …". Indeed, the abstract can be very misleading when it uses CN interchangeably with C*N, essentially by allowing C to mean both. 

      From Review #2 "In Eq (1), although C is defined as the "effective copy number", it is unclear what it means in an empirical sense…".  From the slightly revised text quoted above, it should be clear that the fixation time as well as the level of polymorphism represent the empirical measures of C".

      (4) Lastly, we shall address the mis-understood "reproductive success" of rRNA genes, which is the number of progeny, K, in the Haldane model. K should be more accurately referred to as the transmission speed. For single-copy genes, reproductive success and transmission both mean the same thing, K. But the term reproductive success is not appropriate for rRNA genes even though the formulae for K are the same for all gene systems

      [Point 4 responds to all criticisms using the term "reproductive success"]

    1. Author response:

      The following is the authors’ response to the original reviews.

      Public Reviews:

      Reviewer #1 (Public Review):

      Yun et al. examined the molecular and neuronal underpinnings of changes in Drosophila female reproductive behaviors in response to social cues. Specifically, the authors measure the ejaculate-holding period, which is the amount of time females retain male ejaculate after mating (typically 90 min in flies). They find that female fruit flies, Drosophila melanogaster, display shorter holding periods in the presence of a native male or male-associated cues, including 2-Methyltetracosane (2MC) and 7-Tricosene (7-T). They further show that 2MC functions through Or47b olfactory receptor neurons (ORNs) and the Or47b channel, while 7-T functions through ppk23 expressing neurons. Interestingly, their data also indicates that two other olfactory ligands for Or47b (methyl laurate and palmitoleic acid) do not have the same effects on the ejaculate-holding period. By performing a series of behavioral and imaging experiments, the authors reveal that an increase in cAMP activity in pC1 neurons is required for this shortening of the ejaculate-holding period and may be involved in the likelihood of remating. This work lays the foundation for future studies on sexual plasticity in female Drosophila.

      The conclusions of this paper are mostly supported by the data, but aspects of the lines used for individual pC1 subtypes and visual contributions as well as the statistical analysis need to be clarified.

      (1) The pC1 subtypes (a - e) are delineated based on their morphology and connectivity. While the morphology of these neurons is distinct, they do share a resemblance that can be difficult to discern depending on the imaging performed. Additionally, genetic lines attempting to label individual neurons can easily be contaminated by low-level expression in off-target neurons in the brain or ventral nerve cord (VNC), which could contribute to behavioral changes following optogenetic manipulations. In Figures 5C - D, the authors generated and used new lines for labeling pC1a and pC1b+c. The line for pC1b+c was imaged as part of another recent study (https://doi.org/10.1073/pnas.2310841121). However, similar additional images of the pC1a line (i.e. 40x magnification and VNC expression) would be helpful in order to validate its specificity.

      We have included the high-resolution images of the expression of the pC1a-split-Gal4 driver in the brain and the VNC in the new figures S6A and S6B.

      (2) The author's experiments examining olfactory and gustatory contributions to the holding period were well controlled and described. However, the experiments in Figure 1D examining visual contributions were not sufficiently convincing as the line used (w1118) has previously been shown to be visually impaired (Wehner et al., 1969; Kalmus 1948). Using another wild-type line would have improved the authors' claims.

      It is evident that w1118 flies are visually impaired and are able to receive a limited amount of visual information in dim red light. Nevertheless, they are able to exhibit MIES phenotypes, which further supports the dispensability of visual information in MIES. In a 2024 study, Doubovetzky et al. (1) found that MIES in ninaB mutant females, which have defects in visual sensation, was not altered. This further corroborates our assertion that vision is likely to be of lesser importance than olfaction in MIES.

      (3) When comparisons between more than 2 groups are shown as in Figures 1E, 3D, and 5E, the comparisons being made were not clear. Adding in the results of a nonparametric multiple comparisons test would help for the interpretation of these results.

      We have revised figures 1E, 3D, 5E and the accompanying legends as suggested.

      Reviewer #2 (Public Review):

      The work by Yun et al. explores an important question related to post-copulatory sexual selection and sperm competition: Can females actively influence the outcome of insemination by a particular male by modulating the storage and ejection of transferred sperm in response to contextual sensory stimuli? The present work is exemplary for how the Drosophila model can give detailed insight into the basic mechanism of sexual plasticity, addressing the underlying neuronal circuits on a genetic, molecular, and cellular level.

      Using the Drosophila model, the authors show that the presence of other males or mated females after mating shortens the ejaculate-holding period (EHP) of a female, i.e. the time she takes until she ejects the mating plug and unstored sperm. Through a series of thorough and systematic experiments involving the manipulation of olfactory and chemo-gustatory neurons and genes in combination with exposure to defined pheromones, they uncover two pheromones and their sensory cells for this behavior. Exposure to the male-specific pheromone 2MC shortens EHP via female Or47b olfactory neurons, and the contact pheromone 7-T, present in males and on mated females, does so via ppk23 expressing gustatory foreleg neurons. Both compounds increase cAMP levels in a specific subset of central brain receptivity circuit neurons, the pC1b,c neurons. By employing an optogenetically controlled adenyl cyclase, the authors show that increased cAMP levels in pC1b and c neurons increase their excitability upon male pheromone exposure, decrease female EHP, and increase the remating rate. This provides convincing evidence for the role of pC1b,c neurons in integrating information about the social environment and mediating not only virgin but also mated female post-copulatory mate choice.

      Understanding context and state-dependent sexual behavior is of fundamental interest. Mate behavior is highly context-dependent. In animals subjected to sperm competition, the complexities of optimal mate choice have attracted a long history of sophisticated modelling in the framework of game theory. These models are in stark contrast to how little we understand so far about the biological and neurophysiological mechanisms of how females implement post-copulatory or so-called "cryptic" mate choice and bias sperm usage when mating multiple times.

      The strength of the paper is decrypting "cryptic" mate choice, i.e. the clear identification of physiological mechanisms and proximal causes for female post-copulatory mate choice. The discovery of peripheral chemosensory nodes and neurophysiological mechanisms in central circuit nodes will provide a fruitful starting point to fully map the circuits for female receptivity and mate choice during the whole gamut of female life history.

      We appreciate the positive response to our work.

      Recommendations for the authors:

      Reviewing Editor (Recommendations For The Authors):

      While appreciating the quality of the work the reviewers had a few key concerns that would greatly improve the manuscript. These are:

      (1) In some cases the specific statistical analyses are not clear. Could the authors please clarify what comparisons were made and the specific tests used?

      We have clarified the comparisons made in the multiple comparison analysis and specified the tests used in figures 1E, 3D, 5E.

      (2) Could the authors please include data that verify the expression patterns of their new reagent for pC1a, which will be useful for the community?

      Figure S6 was revised to include the expression of the pC1a-split-Gal4 gene in the brain (Fig. S6A) and the VNC (Fig. S6B).

      (3) A figure summarising their findings in the context of known circuitry will be useful.

      A new Figure 7 has been prepared, which provides a summary of our findings.

      (4) The SAG data are interesting. Do the authors wish to consider moving it to the main text or removing it if too preliminary?

      The supplementary figure 10 and related discussions in the discussion section have been removed.

      In the revised version of this manuscript, we present new evidence that the Or47b gene is required for 2MC-induced cAMP elevation in pC1 neurons, but not for 7T-induced one (see Fig. 5F). This observation supports that Or47b is a receptor for 2MC.

      The following paragraph was inserted at line 248 to provide a detailed description of the new findings: "To further test the role of Or47b in 2MC detection, we generated Or47b-deficient females with pC1 neurons expressing the CRE-luciferase reporter. Females with one copy of the wild-type Or47b allele, which served as the control group, showed robust CRE-luciferase reporter activity in response to either 2MC or 7-T. In contrast, Or47b-deficient females showed robust CRE-luciferase activity in response to to 7-T, but little activity in response to 2MC. This observation suggests that the odorant receptor Or47b plays an essential role in the selective detection of 2MC (Fig. 5F).”

      In addition, the following sentence was inserted at line 308 in the discussion section: “In this study, we provide compelling evidence that 2MC induces cAMP elevation in pC1 neurons and EHP shortening via both the Or47b receptor and Or47b ORNs, suggesting that 2MC functions as an odorant ligand for Or47b.”

      Relative CRE-luciferase reporter activity of pC1 neurons in females of the indicated genotypes, incubated with a piece of filter paper perfumed with solvent vehicle control or the indicated pheromones immediately after mating. The CRE-luciferase reporter activity of pC1 neurons of Or47b-deficient females (Or47b2/2 or Or47b3/3) was observed to increase in response to 7-T but not to 2MC. To calculate the relative luciferase activity, the average luminescence unit values of the female incubated with the vehicle are set to 100%. Mann-Whitney Test (n.s. p > 0.05; **p < 0.01; ***p < 0.001; ****p < 0.0001). Gray circles indicate the relative luciferase activity (%) of individual females, and the mean ± SEM of data is presented.

      Reviewer #1 (Recommendations For The Authors):

      (1) There was a discrepancy between the text and the figures. Based on the asterisks above the data in Figure S5A, the data supports only 150 ng of 7-T shortening the ejaculation holding period. However, the text states that (line 190) "150 or 375 ng of 7-T significantly shortened EHP." It would be helpful if the authors clarified this discrepancy.

      The sentence has been revised and now reads as follows: ‘150 ng of 7-T significantly shortened EHP’.

      (2) Based on the current organization of the text, it was not clear how 2MC was identified and its concentrations were known to be physiologically relevant. It would be helpful if the authors could expand on this in lines 178 - 179.

      The following sentences were inserted into the revised version of the manuscript at line 178: The EHP was therefore measured in females incubated in a small mating chamber containing a piece of filter paper perfumed with male CHCs, including 2-methylhexacosane, 2-methyldocosane, 5-methyltricosane, 7-methyltricosane, 10Z-heneicosene, 9Z-heneicosene, and 2MC at various concentrations (not shown). Among these, 2MC at 750 ng was the only one that significantly reduced EHP (Fig. 3A; Fig. S4). 2MC was mainly found in males, but not in virgin females (30). Notably, it is present in D. melanogaster, D. simulans, D. sechellia, and D. erecta, but not in D. yakuba (30, 60).

      (3) The inset pie chart image illustrating MIES in Figure 1A was difficult to interpret. It would be helpful if the authors used a different method for representing this (i.e. a timeline).

      Figure 1A was revised as suggested.

      (4) In lines 121 - 122, the authors state that the females are exposed to "actively courting naive wild type Canton S males." This was difficult to understand and might be improved by removing "actively courting."

      Revised as suggested.

      Reviewer #2 (Recommendations For The Authors):

      (1) Summary figure

      The story is quite comprehensive and contains a lot of detail regarding the interaction of signaling pathways, internal state, and sensory stimuli. I believe a schematic summary figure bringing together all findings could be very helpful and would make it much easier to understand the discussion!

      Figure 7 has been prepared, which provides a summary of the findings and an explanation of the current working model.

      (2) Figure S10/effect on SAG activation of EHP

      At the moment, the quite interesting and relevant result that SAG activation shortens EHP shown in Figure S10 is only referred to in the discussion. Maybe move this to the results and give it a bit more attention? Actually, I believe this is a very exciting finding that could also be the basis for some more interesting speculations about physiological relevance. Since SAG is silenced upon seminal fluid/sex peptide exposure after mating, a mating with failed SAG silencing (i.e. unusually high post-mating SAG activity) could indicate to the female that there was low or failed sex peptide/seminal fluid transfer. In such a case it would be probably advantageous for the female to decrease EHP and quickly remate, as females need the "beneficial" effects of seminal fluid on ovulation and physiology adaptation. SAG could therefore represent another arm of sensing male quality- here not via external pheromones, but internally, via sensing male sex peptide levels.

      If this is a bit preliminary and rather suited to start a new study, Figure S10 could also be removed from the current manuscript.

      Figure S10 and associated text were removed in the revised version of the manuscript.

      (3) PhotoAC experiments in pC1b,c: the authors find that raising cAMP levels in pC1b,c leads to a decrease in EHP. They argue that increased cAMP levels lead to higher excitability of pC1b,c. This implies that the activity of pC1b,c promotes mating plug ejection. I assume the authors have also tried activating pC1b,c directly by optogenetic cation channels? What is the outcome of this? If different from elevating cAMP levels: why so?

      We employed CsChrimson, a red light-sensitive channelrhodopsin, to investigate the effect of optogenetic activation of each pC1 subset on EHP. Optogenetic activation of pC1a, pC1d, or pC1e had little effect on EHP; however, optogenetic activation of pC1b, c significantly increased EHP. This observation was puzzling because optogenetic silencing of the same neurons also increased EHP. In this experiment, females expressing CsChrimson were exposed to red light for the entire period of EHP measurement. Therefore, we suspect that prolonged activation of pC1b and pC1c neurons depleted their neurotransmitter pool, resulting in a silencing effect, but this requires further testing.

      Author response image 1.

      The prolonged optogenetic activation of pC1b, c neurons increases EHP, mimicking silencing of pC1b, c neurons. Females of the indicated genotypes were cultured on food with or without all-trans-retinal (ATR). The ΔEHP is calculated by subtracting the mean of the reference EHP of females cultured in control ATR- food from the EHP of individual females in comparison. The female genotypes are as follows: (A) 71G01-GAL4/UAS-CsChrimson, (B) pC1a-split-Gal4/UAS-CsChrimson, (C) pC1b,c-split-Gal4/UAS-CsChrimson, (D) pC1d-split-Gal4/UAS-CsChrimson, and (E) pC1e-split-Gal4/UAS-CsChrimson. Gray circles indicate the ΔEHP of individual females, and the mean ± SEM of data is presented. Mann-Whitney Test (n.s. p > 0.05; *p <0.05; ****p < 0.0001). Numbers below the horizontal bar represent the mean of the EHP differences between the indicated treatments.

      (4) Text edits

      In general, the manuscript is very well-written, clear, and easy to follow. I recommend small edits of the text and correction of typos in some places:

      l.92: "Drosophila females seem to signal the social sexual context through sperm ejection." This sentence could give the impression that the main function of sperm ejection was to signal to conspecifics. I recommend reformulating to leave it open if ejected sperm is a signal or rather a simple cue. e.g. :"There is evidence that Drosophila females detect the social sexual context through sperm ejected by other females."

      Thanks for the good suggestion. It has been revised as suggested. In addition, we have also made additional changes to the text to correct typos.

      l.97: "transcriptional factor" > "transcription factor"

      Revised as suggested. See lines 77, 98, and 201.

      l.101: "There are Dsx positive 14 pC1 neurons in each brain hemisphere of the brain," > "There are 14 Dsx positive pC1 neurons in each brain hemisphere,"

      Revised as suggested, it now reads " There are 14 Dsx-positive pC1 neurons in each hemisphere of the brain, ...".

      l.160: ", even up to 1440 ng" > ", even when applied at concentrations as high as 1440 ng"

      Revised as suggested.

      l.168: "females with male oenocytes significantly shortens EHP" >"females with male oenocytes significantly shorten EHP"

      Revised as suggested.

      l.181: "it was restored when Orco expression is reinstated" >"it was restored when Orco expression was reinstated"

      Revised as suggested. See line 186.

      l.196: "MIES is almost completely abolished" >"MIES was almost completely abolished"

      Revised as suggested. See line 201.

      l.202: "a sexually dimorphic transcriptional factor gene" >"the sexually determination transcription factor gene" or "the sex specifically spliced transcription factor gene". The gene itself is not dimorphic!

      Revised as suggested, lines 208-210 now read "The same study found that Dh44 receptor neurons involved in EHP regulation also express doublesex (dsx), which encodes sexually dimorphic transcription factors."

      l.211: "to silenced" > "to silence"

      Revised as suggested. See line 216.

      l.229: "females that selectively produce the CRE-Luciferase reporter gene" >"females that selectively express CRE-Luciferase reporter"

      Revised as suggested. See line 234.

      l.271: "neurons. expedite" > delete dot

      Revised as suggested. See line 284.

      l.287: "Furthermore, our study has uncovered the conserved neural circuitry that processes male courtship cues and governs mating decisions play an important role in regulating this behavior." > grammar: "our study has uncovered that the conserved neural circuitry that processes male courtship cues and governs mating decisions plays an important role in regulating this behavior." Also: the meaning of "conserved" is not fully clear to me here: conserved in regards to other Drosophila species? Or do the authors mean: general functional similarity with mouse sexual circuitry?

      The sentence (lines 299-301) has been revised for clarity to read "In addition, our study has revealed that the neural circuit that processes male courtship cues and controls mating decisions plays an important role in regulating this behavior. This fly circuit has recently been proposed to be homologous to VMHvl in the mouse brain (45, 46).”

      l.311: "lipid drolet" > "lipid droplets"

      Revised as suggested. See line 325.

      l.316 and in several instances in the following, including Figure 5 caption (l.723) : "cAMP activity" > "cAMP levels" or "increased cAMP levels"

      Revised as suggested.

      l.323: "in hemibrain" > ", as seen in the hemibrain connectome dataset"

      Revised as suggested. See line 337.

      l.326: "increased cAMP levels causes pC1b,c neurons" > "increased cAMP levels cause pC1b,c neurons"

      Revised as suggested. See line 340.

      l.329: "removement" > "removal" or "ejection"

      Revised as suggested, it now reads "the removal of the mating plug". See line 343.

      l. 330: "This observation well aligns" > "The observation aligns well"

      Revised as suggested. See line 345.

      l. 398: Behavior assays: It would be good to describe how mating plug ejection was identified- by eye? Under the microscope/UV light?

      The following sentence has been added to the behavioral assays section at lines 425-426: The sperm ejection scene, in which the female expels a white sac containing sperm and the mating plug through the vulva, has been directly observed by eye in recorded video footage.

      l.685, Figure legend 2: "thermal activation" > "thermogenetic activation"

      Revised as suggested. See line 430.

      Reference:

      (1) Doubovetzky, N., Kohlmeier, P., Bal, S., & Billeter, J. C. (2023). Cryptic female choice in response to male pheromones in Drosophila melanogaster. bioRxiv, 2023-12.

    1. Author response:

      The following is the authors’ response to the previous reviews.

      Public Reviews:

      Reviewer #1 (Public Review):

      In this manuscript, Lee et al. compared encoding of odor identity and value by calcium signaling from neurons in the ventral pallidum (VP) in comparison to D1 and D2 neurons in the olfactory tubercle (OT).

      Strengths:

      They utilize a strong comparative approach, which allows the comparison of signals in two directly connected regions. First, they demonstrate that both D1 and D2 OT neurons project strongly to the VP, but not the VTA or other examined regions, in contrast to accumbal D1 neurons which project strongly to the VTA as well as the VP. They examine single unit calcium activity in a robust olfactory cue conditioning paradigm that allows them to differentiate encoding of olfactory identity versus value, by incorporating two different sucrose, neutral and air puff cues with different chemical characteristics. They then use multiple analytical approaches to demonstrate strong, low-dimensional encoding of cue value in the VP, and more robust, high-dimensional encoding of odor identity by both D1 and D2 OT neurons, though D1 OT neurons are still somewhat modulated by reward contingency/value. Finally, they utilize a modified conditioning paradigm that dissociates reward probability and lick vigor to demonstrate that VP encoding of cue value is not dependent on encoding of lick vigor during sucrose cues, and that separable populations of VP neuros encode cue value/sucrose probability and lick vigor. Direct comparisons of single unit responses between the two regions now utilize linear mixed effects models with random effects for subject,

      Weaknesses:

      The manuscript still includes mention of differences in effect size or differing "levels" of significance between VP and OT D1 neurons without reports of a direct comparisons between the two populations. This is somewhat mitigated by the comprehensive statistical reporting in the supplemental information, but interpretation of some of these results is clouded by the inclusion of OT D2 neurons in these analyses, and the limited description or contextualization in the main text.

      We think the reviewer is mistaken and have clarified the text.  Each pairwise comparison between VP, OTD1 and OTD2, for each odor across days is shown as a heatmap in supplementary figure 8B, with further details in table 37. Absolute diff 3H no statistics

      Reviewer #2 (Public Review):

      We appreciate the authors revision of this manuscript and toning down some of the statements regarding "contradictory" results. We still have some concerns about the major claims of this paper which lead us to suggest this paper undergo more revision as follows since, in its present form, we fear this paper is misleading for the field in two areas. here is a brief outline:

      (1) Despite acknowledging that the injections only occurred in the anteromedial aspect of the tubercle, the authors still assert broad conclusions regarding where the tubercle projects and what the tubercle does. for instance, even the abstract states "both D1 and D2 neurons of the OT project primarily to the VP and minimally elsewhere" without mention that this is the "anteromedial OT". Every conclusion needs to specify this is stemming from evidence in just the anteromedial tubercle, as the authors do in some parts of the the discussion.

      We have clarified in multiple locations that we are recorded from the anteromedial OT, including the abstract, and further clarified this in the conclusions throughout the results and discussion. We refrain stating “anteromedial OT” at every mention of the OT, but think we have now made it abundantly clear that our observations are from the anteromedial OT. It is worth noting that retrograde tracing from the VTA did not label any neuron in any part of the OT, suggesting that the conclusion may well extend beyond the anteromedial portion. Though, we acknowledge further work is needed to comprehensively characterize the OT outputs.

      (2) The authors now frame the 2P imaging data that D1 neuron activity reflects "increased contrast of identity or an intermediate and multiplexed encoding of valence and identity". I struggle to understand what the authors are actually concluding here. Later in discussion, the authors state that they saw that OT D1 and D2 neurons "encode odor valence" (line 510). 

      The point we aim to make is that valence encoding is different between the OT and VP. We do not think the reward modulated activity in OT is valence encoding, at least not as it is in the VP.  We do observe some valence encoding at the population level, which is different from individual valence encoding neurons. The ability of classifiers to segregate population activity based on reward might be considered valence encoding, but we contrast it with that in VP where individual neurons signal reward prediction. This is more robust than that in the OT data where few neurons robustly encode valence. The increased response of the OTD1 neurons after reward association, is more consistent with contrast enhancement than valence encoding.  We believe this distinction is important and reflects a transformation between two reward-related brain areas. For clarification of the sentence in question we have changed it to reflects “increased contrast of iden-ty or an intermediate encoding of valence that also encodes iden-ty.” (line 488)

      We appreciate the authors note that there is "poor standardization" when it comes to defining valence (line 521). We are ok with the authors speculating and think this revision is more forthcoming regarding the results and better caveats the conclusions. I suggest in abstract the authors adjust line 14/15 to conclude that, "While D1 OT neurons showed larger responses to rewarded odors, in line with prior work, we propose this might be interpreted as identity encoding with enhanced contrast." [eliminating "rather than valence encoding" since that is a speculation best reserved for discussion as the authors nicely do.

      We accept this suggestion and have modified the abstract sentence to say, “Though D1 OT neurons showed larger responses to rewarded odors than other odors, consistent with prior findings, we interpret this as iden-ty encoding with enhanced contrast.”  We believe this is appropriately qualified as an interpreta-on, and should not be confusing.

      The above items stated, one issue comes to mind, and that is, why of all reasons would the authors find that the anteromedial aspect of the tubercle is not greatly reflecting valence. the anteromedial aspect of the tubercle, over all other aspects of the tubercle, is thought my many to more greatly partake in valence and other hedonic-driven behaviors given its dense reception of VTA DAergic fibers (as shown by Ikemoto, Kelsch, Zhang, and others). So this finding is paradoxical in contrast to if the authors would had studied the anterolateral tubercle or posterior lateral tubercle which gets less DA input.

      We agree that this seems surprising.  This is why we focused on the anteromedial expecting to find valence encoding.  It remains possible that other parts of the OT, or more dorsal aspects of the anteromedial OT encode valence, as has been reported by Murthy and colleagues.  However, it remains unclear if their recordings are in the OT or VP.  Nonetheless our findings indicate that more work is required to understand the contribution of the OT to valence encoding.  It is also important to note that our conclusions are drawn in comparison to the VP, which has more robust valence encoding than the OT. Thus, in comparison the OT sample in our recordings lack robust valence signaling.  We think this comparison is important, due to the lack of clear framework for defining valence that may create misleading statements in past OT work.  

      Reviewer #3 (Public Review):

      Summary:

      This manuscript describes a study of the olfactory tubercle in the context of reward representation in the brain. The authors do so by studying the responses of OT neurons to odors with various reward contingencies and compare systematically to the ventral pallidum. Through careful tracing, they present convincing anatomical evidence that the projection from the olfactory tubercle is restricted to the lateral portion of the ventral pallidum.

      Using a clever behavioral paradigm, the authors then investigate how D1 receptor- vs. D2 receptor-expressing neurons of the OT respond to odors as mice learn different contingencies. The authors find that, while the D1-expressing OT neurons are modulated marginally more by the rewarded odor than the D2-expressing OT neurons as mice learn the contingencies, this modulation is significantly less than is observed for the ventral pallidum. In addition, neither of the OT neuron classes shows conspicuous amount of modulation by the reward itself. In contrast, the OT neurons contained information that could distinguish odor identities. These observations have led the authors to conclude that the primary feature represented in the OT may not be reward.

      Strengths:

      The highly localized projection pattern from olfactory tubercle to ventral pallidum is a valuable finding and suggests that studying this connection may give unique insights into the transformation of odor by reward association.

      Comparison of olfactory tubervle vs. ventral pallidum is a good strategy to further clarify the olfactory tubercle's position in value representation in the brain.

      Weaknesses:

      The study comes to a different conclusion about the olfactory tubercle regarding reward representations from several other prior works. Whether this stems from a difference in the experimental configurations such as behavioral paradigms used or indeed points to a conceptually different role for the olfactory tubercle remains to be seen.

      We acknowledge that our results lead us to conclusions that are different from that of prior work.  But we note that our results are not directly at odds, as we see similar reward modulation of D1 OT neurons as has been reported previously. Our conclusion is different because we contrast our OT responses with that in the VP where valence is more robustly encoded at the single neuron level. We also note, that many of the past studies do not define valence as stringently as we do.  Thus, increased activity with reward, as observed in our data and past studies, seems more like reward modulation than valence.

    1. Author response:

      The following is the authors’ response to the original reviews.

      Public Reviews:

      Reviewer #1 (Public Review):

      Summary:

      This work explored intra and interspecific niche partitioning along spatial, temporal, and dietary niche partitioning between apex carnivores and mesocarnivores in the Qilian Mountain National Park of China, using camera trapping data and DNA metabarcoding sequencing data. They conclude that spatial niche partitioning plays a key role in facilitating the coexistence of apex carnivore species, spatial and temporal niche partitioning facilitate the coexistence of mesocarnivore species, and spatial and dietary niche partitioning facilitate the coexistence between apex and mesocarnivore species. The information presented in this study is important for wildlife conservation and will contribute substantially to the current understanding of carnivore guilds and effective conservation management in fragile alpine ecosystems.

      Strengths:

      Extensive fieldwork is evident in the study. Aiming to cover a large percentage of the Qilian Mountain National Park, the study area was subdivided into squares, as a geographical reference to distribute the sampling points where the camera traps were placed and the excreta samples were collected.

      They were able to obtain many records in their camera traps and collected many samples of excreta. This diversity of data allowed them to conduct robust analyses. The data analyses carried out were adequate to obtain clear and meaningful results that enabled them to answer the research questions posed. The conclusions of this paper are mostly well supported by data.

      The study has demonstrated the coexistence of carnivore species in the landscapes of the Qilian Mountains National Park, complementing the findings of previous studies. The information presented in this study is important for wildlife conservation and will contribute substantially to the current understanding of carnivore guilds and effective conservation management in fragile alpine ecosystems.

      Weaknesses:

      It is necessary to better explain the methodology because it is not clear what is the total sampling effort. In methodology, they only claim to have used 280 camera traps, and in the results, they mention that there are 319 sampling sites. However, the total sampling effort (e.g. total time of active camera traps) carried out in the study and at each site is not specified.

      Thanks a lot for this detailed review! We apologize for not offering a distinct description of the overall sampling effort. In this study, we deployed 280 camera trappings, and these cameras were active for approximately 4 to 6 months. We visited each camera 2 to 3 times annually to download photos and check the batteries. In case some cameras failed to capture the targeted carnivore, we would relocate the positions of those cameras. Eventually, we collected 322 camera trapping sites, among which 3 cameras malfunctioned due to loss. As a result, we analyzed data from 319 camera sites and obtained 14,316 independent detections over 37,192 trap-days.

      We have added this information as follows in lines 132 to lines 143: “Taking into account the fact that mammalian communities are sensitive to seasonality, we used camera traps to monitor animals with an extensive survey effort from December 2016 to February 2022, covering the activity of animal species in different seasons, which can reflect the overall distribution of carnivores. We placed a total of 280 infrared cameras at the study site, set them to be active for 4 to 6 months, and considered possible relocation to another position based on animal detection in an effort to improve estimates of the occupancy and detection rates for both common and rare species (Figure 1) (Kays et al., 2020). The camera trap was set to record the time and date on a 24 hr clock when triggered, and to record a 15s video and 1 photo with an interval of 2 minutes between any two consecutive triggers. The sum of camera trap effective days was defined by the total amount of trapping effort during the sampling period, which was calculated from the time the camera was placed in operation to the time the last video or photograph was taken. We visited each camera 2 to 3 times a year to download photos and check batteries.” and lines 228 to lines 232: “A total of 322 camera trap sites were surveyed after relocating infrared cameras that did not capture any target carnivore species. A total of 3 cameras were considered to have failed due to loss. We analyzed data from 319 camera sites and obtained 14,316 independent detections during a total effort of 37,192 effective camera trap days. We recorded wolf in 26 sites, snow leopard in 109 sites, Eurasian lynx in 36 sites, red fox in 92 sites, and Tibetan fox in 34 sites.”

      Reviewer #2 (Public Review):

      Summary:

      The study entitled "Different coexistence patterns between apex carnivores and mesocarnivores based on temporal, spatial, and dietary niche partitioning analysis in Qilian Mountain National Park, China" by Cong et al. addresses the compelling topic of carnivores' coexistence in a biodiversity hotspot in China. The study is interesting given it considers all three components affecting sympatric carnivores' distribution and co-occurrence, namely the temporal, the spatial, and the dietary partition within the carnivore guild. The authors have found that spatial co-occurrence is generally low, which represents the major strategy for coexistence, while there is temporal and dietary overlap. I also appreciated the huge sampling effort carried out for this study by the authors: they were able to deploy 280 camera trapping sites (which became 322 in the result section?) and collect a total of 480 scat samples. However, I have some concerns about the study on the non-consideration of the human dimension and potential anthropogenic disturbance that could affect the spatial and temporal distribution of carnivores, the choice of the statistical model to test co-occurrence, and the lack of clearly stated ecological hypotheses.

      Strengths:

      The strengths of the study are the investigation of all three major strategies that can mitigate carnivores' coexistence, therefore, the use of multiple monitoring techniques (both camera trapping and DNA metabarcoding) and the big dataset produced that consists of a very large sampled area with a noteworthy number of camera trap stations and many scat samples for each species.

      Weaknesses:

      I think that some parts of the manuscript should be written better and more clearly. A clear statement of the ecological hypotheses that could affect the partitioning among the carnivore guild is lacking. I think that the human component (thus anthropogenic disturbance) should have been considered more in the spatial analyses given it can influence the use of the environment by some carnivores. Additionally, a multi-species co-occurrence model would have been a more robust approach to test for spatial co-occurrence given it also considers imperfect detection.

      Thank you very much for your valuable comments and suggestions. We checked and edited the manuscript, and we thought the English level was improved.

      (1) According to your suggestion, we added the competitive exclusion and niche differentiation hypothesis with space, time and diets axis to explain co-occurrence relationship among species in the introduction as follow: “The competitive exclusion principle dictates that species with similar ecological requirements are unable to successfully coexist (Hardin, 1960; Gause, 1934). Thus, carnivores within a guild occupy different ecological niches based on a combination of three niche dimensions, i.e. spatial, temporal, and trophic (Schoener, 1974). Spatially, carnivore species within the same geographic area exhibit distinct distributions that minimize overlap in resource use and competition. For example, carnivores can partition habitats based on habitat feature preferences and availability of prey (De Satgé et al., 2017; Garrote and Pérez De Ayala, 2019; Gołdyn et al., 2003; Strampelli et al., 2023). Temporally, differences in seasonal or daily activity patterns among sympatric carnivores can reduce competitive interactions and facilitate coexistence. For example, carnivores can exhibit temporal segregation in their foraging behaviors, such as diurnal versus nocturnal activity, to avoid direct competition (Finnegan et al., 2021; Nasanbat et al., 2021; Searle et al., 2021). Trophically, carnivore species can diversify their diets to exploit different prey species or sizes, thereby reducing competition for food resources. For example, carnivores can exhibit dietary specialization to optimize their foraging efficiency and minimize competitive pressures (Steinmetz et al., 2021).”

      (2) In addition to distance from roads, we included human dimension as covariates influencing occupancy rates based on the number of independent photos or videos of herders and livestock detected by infrared cameras (named human disturbance and is represented by hdis). According to the results of occupancy models, we found red fox occupancy probability displayed a significant positive relationship with hdis. Moreover, the detection probability of snow leopard and Eurasian lynx decreased with increasing hdis.

      We have incorporated these results into the Results as follow: “According to the findings derived from single-season, single-species occupancy models, the snow leopard demonstrated a notably higher probability of occupancy compared to other carnivore species, estimated at 0.437 (Table 1). Conversely, the Eurasian lynx exhibited a lower occupancy probability, estimated at 0.161. Further analysis revealed that the occupancy probabilities of the wolf and Eurasian lynx declined with increasing Normalized Difference Vegetation Index (NDVI) (Table 2, Figure 2). Additionally, wolf occupancy probability displayed a negative relationship with roughness index and a positive relationship with prey availability. Snow leopard occupancy probabilities exhibited a negative relationship with distance to roads and NDVI. In contrast, both red fox and Tibetan fox demonstrated a positive relationship with distance to roads. Moreover, red fox occupancy probability increased with higher human disturbance and greater prey availability. The detection probabilities of wolf, snow leopard, red fox, and Tibetan fox exhibited an increase with elevation (Table 2). Moreover, there was a positive relationship between the detection probability of Tibetan fox and prey availability. The detection probabilities of snow leopard and Eurasian lynx declined as human disturbance increased.”

      (3) We appreciate the suggestion to use a multi-species co-occurrence model to test spatial co-occurrence. We attempted a multispecies occupancy modeling to analysis the five species in our study followed the method of Rota et al. (2016). Initially, we simplified the candidate models by adopting a single-season, single-species occupancy model. We selected occupancy covariates from the best model as the best covariates for each species and used them to establish multispecies occupancy models. Unfortunately, the final model results did not converge. We are investigating potential solutions to resolve this problem.

      Rota CT, Ferreira MAR, Kays RW, Forrester TD, Kalies EL, McShea WJ, Parsons AW, Millspaugh JJ. 2016. A multispecies occupancy model for two or more interacting species. Methods Ecol Evol 7:1164–1173. doi:10.1111/2041-210X.12587

      Temporal and dietary results are solid and this latter in particular highlights a big predation pressure on some prey species such as the pika. This implies important conservation and management implications for this species, and therefore for the trophic chain, given that i) the pika population should be conserved and ii) a potential poisoning campaign against small mammals could be incredibly dangerous also for mesocarnivores feeding on them due to secondary poisoning.

      Thank you for your thoughtful comments. We appreciate your recognition of the temporal and dietary findings, particularly the highlighted predation pressure on prey species like the pika. These observations indeed underscore critical implications for conservation and management. The necessity to conserve the pika population is paramount for its role in maintaining the stability of the trophic chain within its ecosystem. As you rightly pointed out, any disruption to this delicate balance, including through predation or indirect threats like poisoning campaigns, could have far-reaching consequences. Regarding the potential risks associated with poisoning campaigns targeting small mammals, we acknowledge the significant concerns raised about secondary poisoning affecting mesocarnivores. This underscores the need for careful consideration in pest control strategies and the adoption of measures that minimize unintended ecological impacts. Our findings suggest several practical implications for conservation and management. Conservation efforts should focus on vulnerable prey populations such as the pika, while management strategies could include regulatory frameworks and community education to mitigate risks associated with pest control methods. We believe our study contributes valuable insights into the complexities of predator-prey dynamics and the broader implications for ecosystem health. By integrating these findings into conservation practices, we can work towards ensuring the sustainability of natural systems and the species that depend on them.

      Reviewer #1 (Recommendations For The Authors):

      To better explain the methodology and the sampling effort I recommend reviewing e.g. Kays et al. 2020. An empirical evaluation of camera trap study design: How many, how long, and when?. Methods in Ecology and Evolution, 11(6), 700-713. https://besjournals.onlinelibrary.wiley.com/doi/epdf/10.1111/2041-210X.13370.

      Thank you for this valuable suggestion! According to this reference, we have added this information to explain the methodology and the sampling effort as follow: “Taking into account the fact that mammalian communities are sensitive to seasonality, we used camera traps to monitor animals with an extensive survey effort from December 2016 to February 2022, covering the activity of animal species in different seasons, which can reflect the overall distribution of carnivores. We placed a total of 280 infrared cameras at the study site, set them to be active for 4 to 6 months, and considered possible relocation to another position based on animal detection in an effort to improve estimates of the occupancy and detection rates for both common and rare species (Figure 1) (Kays et al., 2020). The camera trap was set to record the time and date on a 24 hr clock when triggered, and to record a 15s video and 1 photo with an interval of 2 minutes between any two consecutive triggers. The sum of camera trap effective days was defined by the total amount of trapping effort during the sampling period, which was calculated from the time the camera was placed in operation to the time the last video or photograph was taken. We visited each camera 2 to 3 times a year to download photos and check batteries.”

      Reviewer #2 (Recommendations For The Authors):

      I have some concerns about the manuscript.

      I find that the manuscript should be written more clearly: some sentences are not straightforward to understand given the presence of structural errors that make the text hard to read; the paragraphs should be written in a more harmonic way (without logical leaps) with a smoother change of topic between paragraphs, especially in the introduction.

      We appreciate your constructive comments, which have helped us improve the clarity and coherence of the manuscript. We have revised the introduction to provide a clearer outline of the paper's structure and objectives. Specifically, we have rephrased complex sentences and removed ambiguities to ensure that each idea is communicated more straightforwardly. We providing clearer links between ideas and avoiding abrupt shifts in topics to ensure that a smoother transition between paragraphs.

      I feel like the strength of merging the two techniques (camera trapping and DNA metabarcoding) is not brought up enough, while the disadvantage of this approach is not even mentioned (e.g., the increasing costs).

      Thanks a lot for this valuable comment! We have added this information to the Discussion (L356-L363) as follow: “Our study highlights the effectiveness of combining camera trapping with DNA metabarcoding for detecting and identifying both cryptic and rare species within a sympatric carnivore guild. This integrated approach allowed us to capture a more comprehensive view of species presence and interactions compared to traditional visual surveys. whereas, it is important to acknowledge the challenges associated with this technique, including the high costs of equipment and the need for specialized training and computational resources to manage and analyze the large volumes of sequence data. Despite these challenges, the benefits of this combined method in improving biodiversity assessments and understanding species coexistence outweigh the drawbacks.”

      The structure of the manuscript does not follow the structure of the journal (Intro, Material and Method, Results, Discussion instead it reports the methods at the end of the main manuscript), and, most critically, I found that a clear explanation of the research hypothesis is missing: authors should clearly state they ecological hypotheses. What are your hypotheses on the co-occurrence relationship among species? What would specifically affect and change the sympatric relationships among carnivores?

      Thank you for this valuable suggestion! We have revised the manuscript, that is integrated the methods section appropriately within the main body of the manuscript to ensure that it aligns with the standard sections (Introduction, Materials and Methods, Results, Discussion.

      We state our main ecological hypotheses concerning the co-occurrence relationships among carnivore species is based on niche differentiation hypothesis. We hypothesize that differentiation along one or more niche axes is beneficial for the coexistence of carnivorous guild in the Qilian Mountains. We expected that spatial niche differentiation promotes the coexistence of large carnivores in the Qilian Mountain region, as they are more likely than small carnivores to spatially avoid interspecific competition (Davis et al., 2018). Mesocarnivores may coexist either spatially or temporally due to increased interspecific competition for similar prey (Di Bitetti et al., 2010; Donadio and Buskirk, 2006). Nutritional niche differentiation may be a significant factor for promoting coexistence between large and mesocarnivore species due to differences in body size (Gómez-Ortiz et al., 2015; Lanszki et al., 2019). We have added ecological hypotheses in lines 101 to 110.

      Another concern is that all pictures with people have been removed from the dataset, but I think that this could be a bit biased as human presence (or also the presence of livestock) could affect the spatial or temporal presence of carnivores, changing their co-occurrence dynamics. On one side, humans can be perceived as a source of disturbance by carnivores and, therefore, can cause a shift in distribution towards locations with lower human presence (or lower anthropogenic disturbance) that could further concentrate the presence of carnivores increasing the competitive interaction. Conversely, mesocarnivores could take advantage of an increasing human presence - following the human shield hypotheses - finding a refugium from larger body carnivores. From this perspective, important information on the potential anthropogenic pressure is lacking in the description of the study area: how effective is the protection effort of the park? How intense is the potential human disturbance in and around the park? Is there poaching? Intensive livestock grazing? Resources extractions? These are all factors that could affect the interactions among carnivores. Do not forget the possibility and risk of being retaliatory killed by humans due to the presence of livestock in the area. I think that incorporating the human dimension is important because it could strongly affect how carnivores perceive and use the environment. Here only the distance to the closest road has been considered. However, for example, recent research (Gorczynski et al 2022, Global Change Biology) has indeed found that co-occurrece of ecologically similar species differed in relation to increasing human density. Therefore, I think that anthropogenic disturbance is an aspect to be reckoned with and more variables as proxy of human disturbance should be considered.

      Thanks a lot for this valuable comment! We acknowledge that humans can act as both a disturbance factor, potentially driving carnivores away from highly populated areas, and as a source of indirect refuge for mesocarnivores, thereby affecting competitive interactions among carnivores. We understand that poaching and resource extraction are prohibited and livestock grazing is a significant human activity within the study area. Therefore, we added human dimension as covariates influencing occupancy rates based on the number of independent photos or videos of herders and livestock detected by infrared cameras (named human disturbance and is represented by hdis). According to the results of occupancy models, we found red fox occupancy probability displayed a significant positive relationship with hdis. Moreover, the detection probability of snow leopard and Eurasian lynx decreased with increasing hdis.

      In the statistical analyses section, I don't find that the statistical procedure is well described: it is not clear which occupancy model has been used (probably a single-species single-season occupancy model for each target species?), which covariates have been tested for each species and following which hypotheses. Additionally, I think that when modelling the spatial distribution of subordinate species, it should be important to include information on the spatial distribution of apex species given this could affect their occurrence on the territory. This could have been done by using the Relative Abundance Index of the apex predators as a covariate when modelling the distribution of subordinate species. Additionally, why haven't the authors used prey as a covariate for occupancy? I think that prey distribution should affect the occupancy probability more than the detection rate. Also, the authors used the Sørensen similarity index to measure associations between species. However, this association metric has been criticized (see the recent paper of Mainali et al 2022, Science Advances). I am therefore wondering: given the authors are using the occupancy framework, why don't they use a multi-species co-occurrence model that allows them to directly estimate both single-species occupancy and the co-occurrence parameter as a function of covariates (examples are Rota et al. 2016, Methods Ecol. Evol. Or Tobler et al. 2019, Ecology)? For the temporal overlap, I think that adding Figure S2 (pairwise temporal overlap) in the main text would help deliver the results of the temporal analyses more straightforwardly.

      Thanks a lot for this valuable comment!

      (1) The current manuscript utilizes a single-species single-season occupancy model for each target species. Additionally, we have added prey and human disturbance as occupancy covariables. We have revised the statistical analyses section to explicitly state this model choice and clarify the covariates tested for each species from lines 153 to lines170. The details are as follows: “To investigate the spatial distribution of carnivores, as well as the influence of environmental factors on the site occupancy of species in the study area, we performed single-season, single-species occupancy models to estimate carnivores’ occupancy (ψ) and detection (Pr) probability (Li et al., 2022b; MacKenzie, 2018; Moreno-Sosa et al., 2022). To ensure capture independence, only photo or video records at intervals of 30 min were was included in the data analysis (Li et al., 2020). We created a matrix recording whether each carnivore species was detected (1) or not (0) across several 30-day intervals (that is 0-30, 31-60, 61-90, 91-120, 121-150, >150 days) for each camera location. Based on the previous studies of habitat use of carnivores (Greenspan and Giordano, 2021; Alexander et al., 2016; Gorczynski et al., 2022), we selected terrain, vegetation, biological factors and disturbance to construct the model. Terrain is a fundamental element of wildlife habitat and closely linked to other environmental factors (Chen et al., 2024). Terrain variables include elevation (ele) and roughness index (rix). Vegetation variables include normalized difference vegetation index (ndvi), and provide information on the level of habitat concealment. Biological variables include prey abundance (the number of independent photos of their preferred prey based on dietary analysis in this study, wolf and snow leopard: artiodactyla including livestock; Eurasian lynx and Pallas’s cat: lagomorpha; red fox and Tibetan fox: lagomorpha and rodentia) and reflect habitat preference and distribution patterns of carnivores. Disturbance variables include distance to roads (disrd) and human disturbances (hdis, the number of independent photos of herdsman and livestock) and can provide insight into the habitat selection and behavior patterns of carnivores.”

      (2) Thank you for your valuable suggestions. We acknowledge the importance of considering apex species in models of subordinate species' spatial distributions.

      Nonetheless, considering the consistency of covariates for each species and the lack of interspecies interactions in single-species occupancy models, we did not include the Relative Abundance Index of the apex predators as a covariate affecting the occupancy of mesopredators. As you recommended, multi-species occupancy models that account for interspecies interactions are a robust approach. However, we attempted to use the multi-species occupancy method of Rota et al. (Rota et al., 2016), the final model results did not converge. Specifically, we selected occupancy covariates from the best model by single-species model as the best covariates for each species and used them to establish multispecies occupancy models. We are investigating potential solutions to resolve this problem.

      (3) We used the Sørensen similarity index to measure associations between species based on support from previous literature. As counted by Mainali et al., the Sørensen index has been used in more than 700 papers across journals such as Science, Nature, and PNAS. We believe this index holds broad applicability in describing relationships between species.

      (4) We agree that presenting pairwise temporal overlap in the main text would enhance clarity. We revised the manuscript to include Figure S2 in the main text and ensure that the temporal analyses are more straightforwardly presented.

      Regarding the sampling collection of the scats, I'm just curious to know why you decided to use silica desiccant instead of keeping the samples frozen. I'm not familiar with this method and I guess it works fine because the environment is generally freezing cold. Yet, I would like to know more. How fresh do scat samples need to be in order to be suitable for DNA metabarcoding analyses? Additionally, what do you mean by "scats were collected within camera trapping area", could you be more specific? Have you specified a buffer around camera stations?

      Thanks a lot for this specific inquiry! We refer to the scat collection method mentioned in the study of Janecka et al (2008; 2011). Silica is used to dry the scats to minimize DNA degradation. Due to the limitation of field environmental conditions, there is no suitable equipment to freeze samples during sampling, the collected scat samples should be kept dry and cool in shade, and transferred to the laboratory as soon as possible after sampling. We selected relatively fresh samples based on the color of the scat as well as broken off bits and pieces from the outside part of the scat including pieces not directly in the sun. Collect scat material about the size of a pinkie nail in the tube. If over fill the tube it will likely not dry and lead to DNA degradation.

      The study area was subdivided into sample squares of 25 km2 (5×5 km) as a geographical reference for placing camera survey sites and collecting scat samples. Camera traps were set in areas believed to be important to and heavily used by wildlife, such as the bottoms of cliffs, sides of boulders, valleys and ridges along movement corridors. Also, we focused on sites with known or suspected carnivore activity to maximize probability of detection for scat samples. Therefore, transects were set around the infrared camera to collect scat samples. Length of each transect was determined by terrain, amount of scat, and available time. Each transect should have collected about 18 samples or covered 5 km of terrain to avoid uneven representation among transects and ensure that the team has sufficient time to return to base camp (Janečka et al., 2011).

      Janecka J, Jackson R, Yuquang Z, Li D, Munkhtsog B, Buckley-Beason V, Murphy W. 2008. Population monitoring of snow leopards using noninvasive collection of scat samples: A pilot study. Animal Conservation 11:401–411. doi:10.1111/j.1469-1795.2008.00195.x

      Janečka JE, Munkhtsog B, Jackson RM, Naranbaatar G, Mallon DP, Murphy WJ. 2011. Comparison of noninvasive genetic and camera-trapping techniques for surveying snow leopards. J Mammal 92:771–783. doi:10.1644/10-MAMM-A-036.1

      Kays R, Arbogast BS, Baker‐Whatton M, Beirne C, Boone HM, Bowler M, Burneo SF, Cove MV, Ding P, Espinosa S, Gonçalves ALS, Hansen CP, Jansen PA, Kolowski JM, Knowles TW, Lima MGM, Millspaugh J, McShea WJ, Pacifici K, Parsons AW, Pease BS, Rovero F, Santos F, Schuttler SG, Sheil D, Si X, Snider M, Spironello WR. 2020. An empirical evaluation of camera trap study design: How many, how long and when? Methods Ecol Evol 11:700–713. doi:10.1111/2041-210X.13370

      Regarding the discussion, the authors have information for 1) spatial distribution, 2) temporal overlap, 3) dietary requirement, they should use this information to support the discussion. Instead, sometimes it feels that authors go by exclusion or make a suggestion. For example: the authors have found dietary and temporal overlap between two apex predators (i.e., wolf and snow leopard), and they said that this suggests that spatial partitioning is responsible for their successful coexistence in this area (lines 195-196). But why "suggesting", what the co-occurrence metric says? Another example: "Apex carnivores and mesocarnivores showed substantial overlap in time overall, indicating that spatial and dietary partitioning may play a large role in facilitating their coexistence" (lines 241 - 242). However, this should not be a suggestion: your Sørensen similarity index is low proving spatial divergence. So, when data supports the hypotheses, the authors should be firmer in their discussion. Generally, when reading the discussion, it felt that a figure summarizing the partitioning would be much needed to digest which type of partitioning strategy the species are using.

      Thank you for your thoughtful comments and suggestions.

      (1) We appreciate your insights on the discussion section, particularly concerning the interpretation of our findings on spatial distribution, temporal and dietary overlap. We acknowledge the need for clearer interpretation of our findings. We have revised the discussion section to provide more direct support. For example, in line 294-295, we modify it as “We found dietary and temporal overlap among apex carnivores, showing that spatial partitioning is responsible for their successful coexistence in this area.” In line 341-342, we modify it as “Apex carnivores and mesocarnivores exhibited considerable overlap in time overall, showing that spatial and dietary partitioning may play a large role in facilitating their coexistence.”

      (2) We appreciate your suggestion regarding the inclusion of a figure summarizing partitioning strategies among species discussed. In our study, we organized the overlap index of space, time, and diet among carnivores in Table 3, which directly reflects the overlap of carnivore species in these three dimensions by summarizing them in a single table. Additionally, Figure 3 illustrates the activity patterns and overlap among species, while Figure 4 displays the primary prey of carnivores and the frequency of food utilization.

      About lines 228 - 229, just as a side note, the Pallas's cat, as the red fox, selects the environment according to a greater distribution of prey species, while also selecting primarily meadows and natural environment (Greco et al. 2022, Journal of wildlife management) additionally it is not strictly diurnal (Anile et al. 2020, Wildlife Research; Greco et al. 2022, Journal of wildlife management). Regarding the Pallas's cat and its exclusion from the temporal and spatial analyses, can you specify how many independent detection events you had?

      Thanks a lot for this valuable comment!

      (1) We appreciate the references to recent studies highlighting its habitat preferences and activity patterns. We have revised the manuscript to acknowledge these points and provide context regarding its habitat selection strategies. Specifically, we modify it as follow: “Pallas’s cat hunts during crepuscular and diurnal periods, inhabits meadow with greater prey abundance (Anile et al., 2021; Greco et al., 2022; Ross et al., 2019).”

      (2) The low detection rate of Pallas's cat (0.072) identified by single-species occupancy model raised concerns regarding the reliability of the results. The estimated high standard errors for each environmental variable and the wide confidence intervals around the detection rate further indicated potential bias or randomness. Consequently, we made the decision to exclude the Pallas's cat data from further analysis. Upon closer examination of the Pallas's cat data, it became evident that out of 319 camera sites surveyed, only 27 sites detected the presence of Pallas's cat. Notably, only 3 out of 193 sites in Gansu Province recorded detections, while Qinghai Province had 24 detections out of 126 sites. This skewed distribution of data likely contributed to the unsatisfactory outcomes observed in our models.

      About the diet and results of scat analyses, have you found any sign of intra-guild predation (i.e., apex predators that kill and sometimes consume subordinate carnivores to reduce competition), this could actually represent proof of competition and spatial overlap.

      Thanks a lot for your thoughtful comments!

      We observed intraguild predation in the diet of wolves and snow leopards. Specifically, we found the presence of Pallas’s cat, red fox, and Tibetan fox in the diet of wolfs, and Pallas’s cat, Eurasian Badger and Tibetan fox in the diet of snow leopard. However, these intraguild predation events accounted for only 1.89% of the diet composition of apex carnivores. We suggest that the rarity of these observations may be influenced by various factors and does not necessarily provide sufficient evidence of competition and spatial overlap. Therefore, further data collection and in-depth research are needed to better understand this phenomenon.

      Some minor comments: Figure 2 is really nice, while some abbreviations are missing in the caption of Table 2.

      Thank you for your feedback and positive comments on Figure 2. Unfortunately, we have removed Figure 2 from the manuscript. Due to the inclusion of prey abundance and human disturbance as occupancy covariates, these variables were derived solely from infrared camera trap data and did not encompass a comprehensive dataset across the entire national park. Therefore, we were unable to accurately spatially project for carnivore species occupancy probability in nature park.

      We apologize for the oversight that the abbreviations missing in the caption of Table 2. We have added the missing abbreviations to the caption of Table 2 as follow: “Abbreviations: Disrd-distance to roads, Ele-elevation, NDVI-normalized difference vegetation index, Rix- roughness index, hdis-human disturbance.”

    1. Author response:

      The following is the authors’ response to the original reviews.

      Reviewer #1 (Recommendations For The Authors):

      In its current form, I would exclude the cryo-EM data from the manuscript. It does not add much and it is distracting from the excellent work that you did on the functional characterization of the variant. Alternatively, you could try to improve the resolution and see if you can get some more meaningful analysis out of the structures? I noticed that you only collected very small datasets. If you decide to pursue a higher resolution reconstruction, collecting more movies will give you a better chance to obtain a higher resolution.

      We express our gratitude to the reviewer for their invaluable feedback. While acknowledging that our structure currently maintains a low resolution, it still provides valuable insights into the splice's proximity to the N412 glycan density. This proximity and low-resolution map hindered the complete modeling of all the splice residues. Notably, this structure represents the first depiction of this particular splice variant. Consequently, it lays a foundation for subsequent studies in the field, and hence, we would want to keep it in the manuscript. As per reviewers’ suggestions, we have now included comparisons of our structure with the GluK1-2a receptor structure reported recently (Mayerson et al. 2022). We do plan to carry out higher-resolution structures in the future.

      I would probably also exclude the RNAseq analysis. I think that Figure 1 is fine, but the supplement 1 is not very successful in convincing me that the exon 9 is expressed mainly in early stages of brain development. In addition, the plot in Figure 1 indicates strong expression in the cerebellar cortex in 20s and 30s. If you decide to keep the data, I strongly encourage you to include more details on the analysis in the methods section.

      Thanks for this insightful comment. We have now modified this section extensively for better clarity. Indeed, the expression of this variant seems to be dynamic in different brain regions. This has now been specified in the revised manuscript. Figure 1 shows the expression of GRIK1 exon 9 gene in different regions of the human brain and donor age. The supplementary figure 1 is a zoom-in on one such region, the Cerebral cortex, where we observe the maximum expression of GRIK1. In this region, we also observed higher expression of exon 9 in the early stages of development. The scales of Figure 1 (0-4 RPKM) and supplemental Figure 1(06RPKM) are different due to more expression of other exons in supplemental Figure 1 (example, we observe 4RPKM expression in the shade of red, for figure 1, whereas similar values of 4RPKM are orange-yellow in the supplemental figure1). Using Supplemental Figure 1, we wanted to show the expression of exon 9 with respect to other exons during developmental stages that prove that GluK1-1 is highly expressed in the initial stages of life. more details on the analysis in the methods section has been added now.

      Additionally, there are a few minor issues in the data presentation:

      (1) in Fig. 2C there seems to be a mismatch between the green dose response plot and the GluK12a trace shown. The plot reports an EC50 of 187.7 uM, whereas in the sample trace 0.25 mM agonist activates only to ~20%.

      We have verified the data and statistics, confirming their consistency with the values reported in the manuscript. For Figure 2C, we present representative traces from a single cell. However, the EC50 value was calculated using Hill's equation based on averaged data from 5 cells.

      (2) The axis label is misprinted in Figure 3C

      Thanks. Corrected.

      (3) In Fig 5 supplement 1, panel B - the 3 last labels above the western blot lanes are off so it is difficult to see which sample corresponds to which lane.

      Thanks. We have corrected the figure.

      Reviewer #2 (Recommendations For The Authors):

      Overall I congratulate the authors of this study nicely done. It represents a large body of work.

      We thank the reviewer for his/her time and positive comments.

      I have several minor corrections that authors could consider for the revision of the manuscript P7. The desensitization rate of GluK1-2a was "delayed"... replace by "increased".

      Corrected.

      P9. Last line 0.37; P.. Add the P value.

      P value has been added as suggested.

      P11 authors indicate that K368/375//379/382H376-E mutant exhibit significant difference in desensitization properties in presence of NEto1, but on the 1st line of p11, they provide a P value above 0.05

      We thank the reviewer for pointing out this discrepancy and have fixed the same. We have discussed two mutants that show slower desensitization when compared to GluK1-1a co-expressed with Neto1. The K to E mutant has significance, while the des value for the K368/375//379/382H376-E mutant shows the same pattern, though not significantly. We have now modified the text to explain this more clearly.

      P19 the calculation of mean weighted tau TDes is not clear and should be better explained.

      Thanks. We have added more details in the Methods sections. We analyzed the current decays in response to 1–2 ms or 1 s applications by employing an exponential function or the sum of two exponential functions. This analysis allowed us to derive a weighted mean τdes using the formula [(τ1 × amplitude1) + (τ2 × amplitude2)]/[amplitude1 + amplitude2]. The tau values represent the time constants obtained from the exponential fits, while the amplitudes correspond to the estimated contributions of each component to the total peak current amplitude.

      [(A1 * t1) + (A2 * t2)] / (A1 + A2)

      It represents the calculation of a weighted mean, where A1 and A2 are the amplitudes, and t1 and t2 are the corresponding time constants. The formula calculates the overall mean time constant by taking into account the contribution of each component to the total amplitude.

      P19 the rate of recovery was obtained by fitting the one-phase association "with" exponential function. With is missing.

      We have corrected this error.  Thanks.

      P21 which method has been used for site directed mutagenesis

      Overlapping PCR was carried out for mutagenesis using the primers listed in Figure 4-table supplement 1. A ligation-free cloning approach (Zhang et al., 2017) was used. It has now been elaborated in the methodology section under Site directed mutagenesis.

      P21 and 22. Provide complete reference of reagent including species of antibodies.

      Thanks. We have added all the details in the methods section now. 

      Anti-His: Rabbit mAb #12698 (Cell Signaling Technology)

      Anti-Neto1: Rabbit #SAB3500679 (Sigma Aldrich)

      Anti-GFP: Mouse mAb G1546 (Sigma Aldrich)

      Anti-actin: Mouse mAb A3853 (Sigma Aldrich)

      P22 How much anti His antibody was used with 40microliter of protein A?

      We have used 2µg/ 40uL of Protein A slurry. This has now been added to the methodology.

      P23 Authors seem to have used a virus to express protein but the protocol is not given. For example what is P2 virus?

      We have now modified the manuscript to include details of baculovirus generation as per the protocol described in Goehring et al. 2014. We followed the same protocol wherein the 2nd generation of virus (P2) generated in insect (SF9) cells was used for infecting suspensionadapted HEK293-T cells for large-scale GluK1-1aEM protein expression.

      Reviewer #3 (Recommendations For The Authors):

      Major concerns:

      (1) The effect of the splice insert on Gluk1 regulation by Neto proteins is not fully clear. For example, experiments in Fig. 3G indicate that the desensitization time for Gluk1-1a + Neto2 is ~32ms. This value is half compared with data obtained from whole-cell experiments shown in Fig. 3A (~70ms). What is the reason for this discrepancy? If variability is observed between experiments, I wonder how valid are the comparisons made in panel A between GluK11a+Neto2 vs GluK1-2a+Neto2 groups. In the case of recovery analysis, authors found significant differences comparing both groups in the presence of Neto (Fig. 3B) but recovery times are not identic for Gluk1-1a vs Gluk1-2a (without Neto). Thus, I wonder if the fold change related to the control group (without Neto) is different. 

      We appreciate your detailed feedback, which has allowed us to clarify and reinforce the validity of our experimental findings. Different recording configurations (e.g., outside-out patch (Fig. 3G) versus whole-cell recordings (Fig. 3A) have been used. Whole-cell recordings average responses over a larger membrane area and also have slower solution exchange times compared to outside-out patch recordings. This may have contributed to the variability in desensitization times. However, similar trends in our whole cell vs. outside-out patch recordings were observed. Further, all the data except those presented in Figs 3G and 3H are from whole-cell recordings. We have performed multiple independent experiments and utilized rigorous statistical analyses to validate our comparisons. We report mean values with standard deviations or confidence intervals to provide a more accurate representation of the data.

      Neto1 significantly speeds up the recovery from desensitization for both variants, with a more pronounced effect on GluK1-1a (GluK1-1a +Neto1: 0.68 s) compared to GluK1-2a (GluK1-2a +Neto1: 1.15 s). The recovery times are not identical for the two variants, likely due to the presence of splice insert in GluK1-1a. Neto2, on the other hand, slows recovery for both variants without significant differential effects. However, the recovery rate from the desensitized state is faster for GluK1-1 compared to GluK1-2a alone, although insignificant (without Neto). 

      In the case of the glutamate concentration-response curve (Fig. 3C), EC50 values for Neto1 and Neto2 are relatively the same, but this approach on its own does not provide insights about the role of the splice insert. Previous experiments with the Gluk1 reveal differences between EC50 in the presence of Neto1 or 2 (Fisher, 2015), suggesting that the insert could regulate glutamate binding affinity, but still, this point is not directly demonstrated in this work.

      Thanks for this insightful comment. Indeed, we cannot conclude that splice residues directly affect glutamate sensitivity and have modified the text accordingly. The Fisher paper demonstrated that both Neto1 and Neto2 can influence glutamate sensitivity in GluK1-2a, with EC50 values of 124.6 ± 16.2 µM. Specifically, in the presence of Neto1 and Neto2, the EC50 values are 4.4 ± 0.4 µM and 13.7 ± 4.2 µM, respectively, indicating a noticeable effect though not substantially different for GluK1-2a coexpressed with either Neto1 and Neto2. Our observation for the GluK1-1a has been similar, with both Neto1 and Neto2 showing a leftward shift.

      (2) Similar to the previous point, a proper interpretation of mutant data is missing in the manuscript. From current data, it is difficult to visualize the role of the insert on Netodependent regulation, mainly, because of the fact that some mutations alone affect Gluk1-1 channel properties. The authors conclude their data by stating that "while the modulation of the receptor by Neto 1 is affected by mutations in splice insert, the modulation by Neto 2 remains largely unaffected" (Page 13). However, this statement is confusing since the co-expression of Gluk1-1a with Neto2 (Fig. 5) prevents the effect caused by mutation K368 alone (Fig. 4), indicating that modulations by Neto 2 are indeed potentially affected by the mutations. Please, clarify. Also, the effect of the K368/375/379/382H376-E mutant on Neto modulation (pink bar in Fig. 5) is impossible to interpret properly since the effect of the mutation alone is not shown in the manuscript.

      Thanks for seeking this important clarification. It is indeed true that splice residue mutations themselves affect the receptor functional properties in comparison to the wild-type receptors. For the sake of clarity, we have presented the effect of splice mutants on receptor properties separately from the effect of mutations on modulation by Neto proteins. Figure 4 demonstrates a comparison between wild-type and mutant receptors without the Neto proteins, showcasing different kinetic properties, while Figure 5 provides detailed information on the role of the insert in Neto-dependent regulation. 

      It’s true we could not record the effect of the K368/375/379/382H376-E mutant alone or when coexpressed with Neto 2 due to low peak amplitudes (mentioned in Table 1) that prevented reliable comparisons. However, robust currents were observed when the same mutant was coexpressed with Neto1, and hence comparisons were shown for this mutant with GluK1-1a wild-type + Neto1. 

      We have now modified the statement "while the modulation of the receptor by Neto 1 is affected by mutations in splice insert, the modulation by Neto 2 remains largely unaffected" and the last paragraph as follows:

      “Neto1 appears to have more pronounced effects on the mutant receptors compared to Neto2. Specifically, Neto1 significantly slowed desensitization for the K368-E mutant, accelerated recovery from desensitization for K368-E and K368/375/379/382H376-E mutants, increased agonist efficacy for K368-E and K375/379/382H376-E mutants, and altered rectification properties for K368E and K368/375/379/382H376-E mutants. In contrast, Neto2 had fewer significant effects on the mutant receptors, with the main impact being an increase in agonist efficacy for the K368-E mutant. Notably, Neto2 did not significantly affect desensitization, recovery from desensitization, or rectification properties of the mutant receptors when compared with wildtype GluK1-1a coexpressed with Neto2. These findings suggest that the splice residues in GluK1-1a differentially influence receptor modulation by Neto1 and Neto2, with Neto1 showing more extensive modulation of the mutant receptors' functional properties.”

      (3) An open question after reading this interesting work is if the proposed change in Neto regulation because of the splice insert is due to changes in Gluk1-Neto interactions or because the rearrangement after interaction with Neto proteins is different. Pull-down experiments (Fig 5 Sup.1) suggest that the splice insert and all the mutants tested do not prevent interaction with Neto proteins. I wonder if the authors could complement their data with a quantitative approach/analysis to demonstrate if the splice insert and the mutants affect Neto1/2 interactions (as expected for the rationale when creating the mutants).

      Thank you for this insightful suggestion. You raise an important point about distinguishing between changes in GluK1-Neto interactions and potential differences in receptor rearrangement after Neto binding. While our pull-down experiments suggest that the splice insert and mutants don't prevent Neto interactions (probably due to a larger interaction interface all along the receptor), a quantitative approach would indeed provide more nuanced information. In future studies, we do plan to perform a quantitative approach like Surface plasmon resonance to assess the changes in interactions upon mutations in the splice and/or Neto proteins in different states of the receptor. In addition, obtaining cryo-EM structures of GluK1 splice variants in complex with Neto1 and Neto2 would provide crucial insights into their interaction interfaces and any conformational changes induced by binding. 

      (4) Related to the Gluk1-1a structure, the authors state that the overall structure is similar to the one without the insert (page 14); however, this is not properly shown in the manuscript. Even if the overall architecture of the channel is the same, authors should make a proper/adequate comparison between both structures/domains to support their claims. Also, one should expect that the insertion of 15 amino acids would affect in some way the closing neighboring domains. The differential effect of the splice insert on glutamate and kainate EC50 values (Fig. 2 and Fig. 2 sup.1), suggests that the insert could introduce a sort of rearrangement in the binding domain. Thus, I wonder if a more elaborated analysis of the current structural data could reveal some structural insights that would explain the specific functional differences due to the splice insert. If the low resolution and the missing residues avoid making some comparisons and establish differences between sidechain orientations, still, a proper comparison between the domain backbones would be helpful to validate the author's statement at least. Also, I wonder if the changes could be resolved better in a closed state or APO structure, instead of the desensitized structure. Finally, are the structures obtained in DDM and nanodiscs similar?

      As per the reviewer’s suggestion, we have now added a new figure in the supplementary information, “Figure 6-figure supplement 9,” where we show a superimposition of GluK11aEM (detergent-solubilized or reconstituted in nanodiscs) and GluK1-2a (PDB:7LVT; silver) showing overall conservation of the structures in the desensitized state.

      As evident from the figure and rmsd values mentioned above, we do not observe significant movements at both ATD and LBD layers of GluK1-1a with respect to GluK1-2a. Also as can be observed the DDM solubilized and nanodisc reconstituted GluK1-1a (Panel A) are very similar with a rmsd of ~2.19Å across all the 2664 Calpha atom pairs. Due to low resolution of our structures, we have refrained from carrying out detailed structural comparisions.

      Our efforts to capture the closed state or apo state structures have failed due to either severe orientation bias (only top views) or increased heterogeneity. 

      (5) Methods section lacks relevant information for proper data interpretation as well as for replicating some experiments in the future. For example:

      A) The experimental design to determine the rectification index with a Ramp protocol is not clear: 1) Why the authors applied a ramp protocol if receptors desensitize along the time? Please clarify the protocol.

      Ramp protocols were used only for the wild-type receptors to compare their voltage-dependent behavior, as this was the first study to compare the two splice variants. All kainate receptors (GluK1-GluK5) desensitize over time. However, their rectification properties have been studied previously (both the absence and presence of Neto proteins) using Ramp protocols as they are faster than step protocols.  

      B) Are polyamines included in the solutions to perform the rectification assays?

      No, polyamines were not added to the intracellular solution, and the effect of the endogenous polyamine block was measured. This has now been specified in the results as well as the methods section.

      C) It is not clear if the experiments to calculate IK/IG ratios were performed in the same preparation (This is, the same cell was stimulated with glutamate and then kainate or vice versa).

      Indeed, the current responses for glutamate vs kainate are performed in the same cell (the same cell was stimulated by glutamate then kainate) so that the responses can be compared. It’s now been specified in the methods section.

      D) The experimental design for calculating recovery is not clear.

      We employed a double pulse protocol to measure receptor recovery. The protocol involved applying two consecutive pulses of agonist stimulation to the receptor. Initially, we applied a brief agonist pulse to activate the receptor, followed by a specific recovery period. After the recovery period, we administered a second agonist pulse to assess the receptor's recovery response. The receptor's recovery was determined by comparing the response amplitude of the second pulse to that of the first pulse, providing valuable insights into the receptor's recovery kinetics. Recovery rates were calculated with single exponential association fits in Prism. We have now modified the text for better clarity.

      E) Please indicate the species used for both functional and Cryo-EM (rat Gluk1 isoform?).

      Thanks for pointing this out. We have now specified in relevant methodology sections that Rattus norvegicus GluK1 and Neto proteins were used in this study.

      F) Please describe the nanodisc reconstitution protocol and how the nanodisc protein was purified, if appropriate.

      The MSP1E3D1 was purified by following the protocol given by the Sligar group in 2014 (doi: 10.1016/S0076-6879(09)64011-8). The nanodisc reconstitution protocol has now been elaborated in the revised manuscript.

      G) Site-directed mutagenesis methodology is incomplete. Please check.

      We have now elaborated this section to include more details.

      Minor concerns:

      (1) Authors state that splice residues are ~30A away from the TM domain. Currently, there is no friendly representation showing the localization of the splice in the structure, besides Fig.6E. The manuscript could benefit itself if authors include a better 3D representation or a scheme to highlight the position of the splice relative to critical domains.

      Thanks for pointing this out. The distance between TRP 381 CA (ATD) and LEU 636 CA (TM3) is 92.10 Å. We have changed the value in the text to ~92 Å.

      Author response image 1.

      (2) Authors mention that mutations in the insert to alanine show normal traffic to the plasma membrane but low current amplitude. Then, I wonder if single-channel conductance, mean open time or open probability is affected by the splice insert. Showing the effects of the insert on single-channel properties would strengthen the manuscript's quality.

      It is a good suggestion. However, as can be observed from our whole cell or outside out patch data, we obtained low peak amplitudes (<50 pA) for many of our receptor-only constructs and also suffered from high SEM for some recordings due to heterogeneity between cells of the same population. The suggestion to study the single channel properties of these receptors is considered for future experiments

      (3) It is unclear how the insert or the mutations specifically affect glutamate- or kainate-induced responses because authors analyze IK/IG ratios only. Maybe authors could consider including an analysis of the role of the insert on specific glutamate- or kainate-induced response to gain insights about ligand selectivity.

      All the values have been included in the excel for raw data. We have included the desensitization kinetics of mutant receptors in the presence of glutamate and compared it to the wild type GluK1-1a. Kainate induced responses were very heterogenous (high SEM for % desensitization) and hence have not been included in the main data.

      (4) Please be consistent with nomenclature along the manuscript to avoid confusion. For example, Are Gluk-1-1 and Gluk-1-1a referring to the same variant?

      GluK1-1 has been used in the abstract and the introduction where we introduce the N-terminal splice variant which either has the 15 residues (termed as GluK1-1) or lacks it (GluK1-2). The C- terminal splice variants for GluK1 are named as “a-d”, with “a” being the smallest Cterminal domain variant. Later in the manuscript, we have used only GluK1-1a terminology to represent the ATD splice variant with shortest C-terminal domain.

      The introduction and spatiotemporal results talk about the GluK1-1 receptors wherein the 

      (5) Legend figure 2: Repeated phrase should be removed. Please check.

      (6) Page 8: "This is similar to the effect observed in GluK1-2 receptors whereby the glutamate EC50 was shown to increase by Neto proteins [Neto1: 34-fold and Neto2: 7.5-fold (Palacios-Filardo et al., 2016) and Neto1/2: 10-30X (Fisher, 2015)]". It seems that values from Fisher's paper are backward. Please correct. 

      (7) Page 9. Second paragraph. Spelling mistake when referring to Fig. 3G.

      Thanks for pointing out the inadvertent errors; we have now corrected all of them.

      (8) Figure 3: The title in Y axis overlaps with the figure. Please check.

      We have corrected the error.

      (9) Page 10: "In addition, K375/379/382H376-E mutant also exhibited a slowdown in the recovery (K375/379/382H376-E: 4.83 {plus minus} 0.31 s P=0.2774) (Figure 4C; Table 1)." Statistical analysis indicates this is not correct. Please tone down this statement. For example: "...mutant also exhibited a trend to a slowdown in the recovery although differences do not reach statistical significance".

      Thanks. We have modified the statement as suggested.

      (10) Page 11: "and a reduction was observed for K375/379/382H376-E receptors (1.17 {plus minus} 0.28 P=0.3733) compared to wild-type (Figure 4D; Table 1)." Same issue as the previous minor comment.

      Thanks. We have modified the statement as suggested.

      (11) Page 11: "We observed that mutants K368-E and K368/375/379/382H376-E, desensitize significantly slower in the presence of Neto1" This statement is not true for K368/375/379/382H376-E mutant. Please correct.

      Thanks. We have modified the statement as suggested and specified the difference.

      (12) Legend Figure 4. Colored asterisks are not clear in the figure. Please check.

      Thanks. The reference to colored asterisks has been removed from the legend as they are not used.

      (13) Representative data shown in Fig 5 sup.2A do not match very well with the final quantification shown in Fig 5A. Please check. Also, the authors state in the result section (page 10) that data shown in Fig. 5A indicate that "GluK1-1a modulation by Neto 1 is influenced by the splice residues". This could be true only for residue K368; however, this is not so obvious since the two mutants containing K368E are inconsistent. Please check and clarify.

      Only representative traces are shown in Fig 5 sup 2 A. However, the quantification shown in Fig 5 A is from multiple cells. We have rechecked all the data and found it to be consistent. We have rewritten this section and modified it for better clarity.

      (14) Figure 6-supplement 2: Please incorporate missing values of MW standards in panel B.

      Thanks. We have modified the figure to include values for MW standards.

      (15) It is not clear the rationale for showing construct C552Y C557V C575S in Fig. 6 sup.3, panel A. This mutant is not mentioned in the manuscript.

      It has been mentioned in the methodology section under “Construct design for expression and purification of rat GluK1-1aEM”. It (C552Y C557V C576S) is one of the constructs used in optimizations that were checked for good protein yields. Based on FSEC protein profiles, we used C552Y, C557V (2X Cys mutant) as GluK1-1aEM, which is mentioned in the same section.

      (16) Fig. 6 sup.4 Not clear what does mean w.r.c. Please specify in the legend.

      With respect to (w. r. t.) has been specified in the manuscript.

      (17) Suggestion to improve data presentation in Fig. 4D and Fig. 3 sup.1B: For easier comparison of IK/IG ratios, representative traces for kainate and glutamate in the same group could be shown using the same Y-scale.

      It has been purposely shown with two different Y-scales due to the differences in peak amplitudes in the presence of glutamate or kainate. 

      (18) Fig. 3 sup.1A: Based on the figure legend, horizontal bars representing the application of glutamate are not consistent with time scale bars. Please, check. In the same figure, panel B, the representative traces shown for GluK-1a-Neto1 are not consistent with IK/IG ratio shown in Fig. 3D.

      Thanks, we have corrected the horizontal bars representing glutamate application. The representative traces shown for GluK-1a-Neto1 were rechecked and are consistent with the IK/IG ratio shown in Fig. 3D.

      (19) I wonder if the authors could discuss the lack of Neto1 effect on the wild type Gluk1-2a channel, as proposed previously.

      Sheng et al., 2015 showed that Neto1 enhances the desensitization onset of GluK1. However, it is unclear which GluK1 splice variants were used in that study. GluK1 has several splice variants, but in the present study, we specifically compared GluK1-1a and 2a. In our case, we did not observe the effect of Neto1 on wild-type GluK1-2a in either of the two techniques (whole cell and outside-out patch) we utilized for our study. However, as can be observed from our data, the GluK1-2a receptor alone shows a faster desensitization kinetics than the previous study (Copits et al., 2011). The differences could stem from different experimental conditions such as constructs, recording conditions used etc.

      Copits BA, Robbins JS, Frausto S, Swanson GT. Synaptic targeting and functional modulation of GluK1 kainate receptors by the auxiliary neuropilin and tolloid-like (NETO) proteins. Journal of Neuroscience. 2011 May 18;31(20):7334-40.

      Sheng N, Shi YS, Lomash RM, Roche KW, Nicoll RA. Neto auxiliary proteins control both the trafficking and biophysical properties of the kainate receptor GluK1. Elife. 2015 Dec 31;4:e11682. doi: 10.7554/eLife.11682. PMID: 26720915; PMCID: PMC4749551.

    1. Author response:

      The following is the authors’ response to the original reviews.

      Public Reviews: 

      Reviewer #1 (Public Review): 

      In their manuscript, Gerlevik et al. performed an integrative analysis of clinical, genetic and transcriptomic data to identify MDS subgroups with distinct outcomes. The study was based on the building of an "immunoscore" and then combined with genotype and clinical data to analyze patient outcomes using multi-omics factor analysis. 

      Strengths: Integrative analysis of RNA-seq, genotyping and clinical data 

      Weaknesses: Validation of the bioinformatic pipeline is incomplete 

      Major comments: 

      (1) This study considered two RNA-seq data sets publicly available and generated in two distinct laboratories. Are they comparable in terms of RNA-seq technique: polyA versus rRNA depletion, paired-end sequencing, fragment length? 

      We want to reemphasize that the main point of this study is not to compare the BMMNC with the HSPC cohort. These datasets are not comparable because they were

      collected from different cell types, and we should not expect them to be matched. We just analysed them in parallel to check how much HSPCs contribute to the molecular signatures we see in BMMNC samples. However, we agree with the reviewer that similar RNA-seq experimental techniques should be employed to control for confounding factors. Here is the information that we found for HSPC and BMMNC RNA-seq studies:

      HSPC RNA-seq cohort: Total RNA was extracted using TRIzol (Thermo Scientific), and Sequencing was performed on an Illumina HiSeq4000 with 100-bp paired-end reads.

      BMMNC RNA-seq cohort: The RNA was extracted with TRIzol reagent (Thermo Scientific). RNA-sequencing libraries were prepared from poly(A)-selected RNA and were sequenced using Illumina HiSeq 2000 or 2500 platform with 100-bp paired-end reads. 

      The only difference between the two cohorts is that one cohort includes total RNAs, whereas the other has polyA-selected RNAs. Since the gene set signatures use the expression of proteincoding genes, which all have polyA tails and are included in total RNA libraries, the analysis will not be affected by total vs. polyA-selected RNA-seq techniques. 

      (2) Data quality control (figure 1): the authors must show in a graph whether the features (dimensions) of factor 1 were available for each BMMNC and CD34+ samples.  

      By features of Factor 1, we think the reviewer means the features with high weights for Factor 1 in BMMNC and CD34+ samples. Figure 2c-d clearly illustrates the important features and their associations with Factor 1 for all samples in both cohorts. The samples are the columns of the two heatmaps.

      (3) How to validate the importance of "immunoscore"? If GSEA of RNA-seq data was performed in the entire cohort, in the SF3B1-mutated samples or SRSF2-mutated samples (instead of patients having a high versus low level of factor 1 shown in Sup Fig. 4), what would be the ranking of Hallmarks or Reactome inflammatory terms among the others? 

      Our GSEA analysis was an attempt to validate the importance of our identified factors. As described in the paper, Factor 1 represents a combination of immunology scores (or  “immunoscores”) in CD34+ cohort. Applying GSEA, we identified upregulation of inflammation related pathways, chemokines, and Neutrophils in patients having high (4th quartile) versus low (1st quartile) levels of Factor 1. Interestingly, sorting patients by Factor 1 resulted in similar pattern based on gene signature scores (Figure 2d).    

      To show that Factor1 generated by MOFA is important and different from known MDS categories such as SF3B1 and SRSF2 mutants, we performed GSEA in SF3B1-mutated vs. SF3B1-WT samples and SRSF2-mutated vs. SRSF2-WT samples in the CD34+ cohort. As shown in Author response image 1, we did not see the upregulation of inflammation and interferon pathways in SF3B1 and SRSF2 mutant MDS.

      Author response image 1.

      GSEA showed no upregulation of inflammation and interferon pathways for SF3B1 and SRSF2 mutant in CD34+ cohort.  

      (4) To decipher cell-type composition of BMMNC and CD34+ samples, the authors used van Galen's data (2019; supplementary table 3). Cell composition is expressed as the proportion of each cell population among the others. Surprisingly, the authors found that the promonocytelike score was increased in SF3B1-mutated samples and not in SRSF2-mutated samples, which are frequently co-mutated with TET2 and associated with a CMML-like phenotype. Is there a risk of bias if bone marrow subpopulations such as megakaryocytic-erythroid progenitors or early erythroid precursors are not considered? 

      We thank the reviewer for their insightful comment about CMML and the high prevalence of SRSF2 mutation (> 45%) in CMML cases. Using single-cell RNA sequencing and high-parameter flow cytometry, Ferrall-Fairbanks et al. (DOI: 10.1158/2643-3230.BCD-21-0217) recently showed that CMML can be classified into three differentiation trajectories: monocytic, megakaryocyte-erythroid progenitor (MEP), and normal-like. One hallmark of monocytic-biased trajectory was the enrichment of inflammatory granulocyte–macrophage progenitor (GMP)-like cells, which we observed through our analysis for SRSF2 mutants (Figure 6a).

      Unfortunately,  van Galen's data does not provide any gene set for MEP, and there is no singlecell RNA-seq atlas for MDS to employ to calculate the MEP score. Also, we compared the Promono-like and GMP-like gene sets from van Galen's data, and we could not find any overlap, meaning that Promono-like is not specific enough to capture the signatures coming from the more differentiated progenitors such as GMPs. Therefore, as described in the paper, we focused on GMP-like rather than Promono-like.

      (5) Figures 2a and 2b indicated that the nature of retrotransposons identified in BMMNC and CD34+ was dicerent. ERVs were not detected in CD34+ cells. Are ERVs not reactivated in CD34+ cells? Is there a bias in the sequencing or bioinformatic method?  

      As described above, the two cohorts' sequencing methods, read length, etc., are identical.

      CD34+ RNA-seq is total RNA-seq that includes both polyA and non-polyA RTE transcripts.

      Therefore, the chance of bias and missing RTE signatures in CD34+ cohort is very low. L1 and Alu, which are shared between the two cohorts, are the two RTE families that are still active and make new insertions in humans. Our interpretation is that ERV activation in BM is associated with immune cells. As shown by Au et al. (DOI: 10.1016/j.ccell.2021.10.001), several ERV loci had expression in purified immune cell subsets in renal cell carcinoma samples, potentially explaining ERV upregulation in tumours responding to treatment as those biopsies had increased tumour infiltration.

      (6) What is the impact of factor 1 on survival? Is it dicerent between BMMNC and CD34+ cells considering the distinct composition of factor 1 in CD34+ and BMMNC? 

      As shown in Table 1, Factor 1 in the BMMNC cohort is associated with overall survival (P-val < 0.05) when we did multivariate analysis but not univariate analysis. We did not observe any association between Factor 1 and event-free survival in the BMMNC cohort. Also, The 10 factors identified by MOFA in BM CD34+ cohort did not show any significance associated with MDS overall survival (Supplementary Table 5). 

      (7) In Figure 1e, genotype contributed to the variance of in the CD34+ cell analyses more importantly than in the BMMNC. Because the patients are dicerent in the two cohorts, dicerences in the variance could be explained either by a greater variability of the type of mutations in CD34 or an increased frequency of poor prognosis mutations in CD34+ compared to BMMNC. The genotyping data must be shown.  

      The genotype has already been reported in Supplementary Table 2. In fact, the number of inspected genes was much higher in the BMMNC cohort (17 genes) compared to the CD34+ cohort (3 genes). Therefore, we have more significant variability of the type of mutations in the BMMNC cohort compared to the CD34+ cohort. For the CD34+ cohort, we only had mutations for three spliceosome genes, where most cases (n=28) were SF3B1 mutants with good prognosis. We think that the result makes sense because the less genetic variability, the more homogenous groups and the more chance that one factor or a group of factors can explain the genetic variance.   

      (8) Fig. 2a-b: Features with high weight are shown for each factor. For factor 9, features seemed to have a low weight (Fig. 1b and 1c). However, factor 9 was predictive of EFS and OS in the BMMNC cohort. What are the features driving the prognostic value of factor 9? 

      As shown in Figure 3b, The main features are RTE expression from LTR:ERV1, SINE:MIR, and SINE:Alu family.  

      (9) The authors also provided microarray analyses of CD34+ cell. It could be interesting to test more broadly the correlation between features identified by RNA-seq or microarrays. 

      The microarray data did not come with any genetic information or clinical data except survival information. Therefore, we could not apply MOFA on Microarray data. However, we did generate gene signature scores from Microarray data and investigated the relationship between inflammatory chemokines and cytokines, and IFN-I signature scores with MDS survival (Figure 3c and 4c).    

      (10) The authors should discuss the relevance of immunosenescence features in the context of SRSF2 mutation and extend the discussion to the interest of their pipeline for patient diagnosis and follow up under treatments. 

      We have added the below text to the discussion:

      Recent studies have shown that the expression of programmed death-ligand 1 (PD-L1) protein is significantly elevated in senescent cells (DOIs: 10.1128/mcb.00171-22, 10.1172/JCI156250, 10.1038/s41586-022-05388-4). Increased PD-L1 protein levels protect senescent cells from being cleared by cytotoxic immune cells that express the PD-1 checkpoint receptor. In fact, activation of the PD-1 receptor inhibits the cytotoxic capabilities of CD8 + T and NK cells, increasing immunosenescence.   

      Notably, patients with MDS who possess particular somatic mutations, such as those in the TP53, ASXL1, SETBP1, TET2, SRSF2, and RUNX1 genes, have an increased propensity to react favourably to PD-1/PD-L1 inhibitors (DOIs: 10.1111/bjh.17689, https://doi.org/10.1182/blood2020-141100) confirming that many cellular and molecular mechanisms, known to promote cellular senescence, including alteration of splicing machinery, are crucial stimulators of the expression of PD-L1 protein. Interestingly, in our analysis, we also observed a correlation between the senescence gene signature score and the expression of the PD-L1 gene in CD34+ cells (Supplementary Figure 7), supporting the previous findings linking PD-L1 gene expression to cellular senescence.

      The immunology and ageing features extracted from the MDS transcriptomic data used in our analysis pipeline can enhance the conventional risk-scoring systems for MDS by providing new insights into this disease, particularly in the context of inflammation and ageing. For some patients, the clinical and genetic features may remain relatively the same until follow-up. Still, the transcriptomic features might differ considerably from the baseline diagnosis, affecting the course of treatment.    

      Reviewer #2 (Public Review): 

      The authors performed a Multi-Omics Factor Analysis (MOFA) on analysis of two published MDS patient cohorts-1 from bone marrow mononuclear cells (BMMNCs) and CD34 cells (ref 17) and another from CD34+ cells (ref 15) --with three data modalities (clinical, genotype, and transcriptomics). Seven different views, including immune profile, inflammation/aging, Retrotransposon (RTE) expression, and cell-type composition, were derived from these modalities to attempt to identify the latent factors with significant impact on MDS prognosis. 

      SF3B1 was found to be the only mutation among 13 mutations in the BMMNC cohort that indicated a significant association with high inflammation. This trend was also observed to a lesser extent in the CD34+ cohort. The MOFA factor representing inflammation showed a good prognosis for MDS patients with high inflammation. In contrast, SRSF2 mutant cases showed a granulocyte-monocyte progenitor (GMP) pattern and high levels of senescence, immunosenescence, and malignant myeloid cells, consistent with their poor prognosis. Also, MOFA identified RTE expression as a risk factor for MDS. They proposed that this work showed the efficacy of their integrative approach to assess MDS prognostic risk that 'goes beyond all the scoring systems described thus far for MDS'. 

      Several issues need clarification and response: 

      (1) The authors do not provide adequate known clinical and molecular information which demonstrates prognostic risk of their sample cohorts in order to determine whether their data and approach 'goes 'beyond all the scoring systems described thus far for MDS'. For example, what data have the authors that their features provide prognostic data independent of the prior known factors related to prognosis (eg, marrow blasts, mutational, cytogenetic features, ring sideroblasts, IPSS-R, IPSS-M, MDA-SS)? 

      We agree with the reviewer that we did not generate a new cumulative risk score and compare it with the conventional risk scores for MDS. However, we identified individual MOFA factors, which are risk or protective factors for MDS, based on survival analysis in the BMMNC cohort. One reason that we did not generate our independent, cumulative score and compare it with other scores was that we did not receive any conventional risk score for the BMMNC cohort. However, we had access to all the clinical and genetic variables from the BMMNC cohort (except for three patients) that were required to calculate IPSS-R; hence, we calculated the IPSS-R in our resubmission for the BMMNC cohort. We made three IPSS-R risk categories by combining low and very low as low risk, and high and very high as high risk, and keeping intermediate as intermediate risk. Our survival analysis of these three categories showed a clear match between IPSS-R score and MDS survival (Author response image 2a).

      We then investigated the relationship between factors 2, 4, and 9 from MOFA with three IPSS-R risk groups.  Integration of IPSS-R risk groups with factor values confirmed the finding in the manuscript that Factors 4 and 9 generally exert a protective influence over the MDS risk, whilst higher levels of Factor 2 predict a high-risk MDS (Author response image 2b). However, we see so many outliers in all three factors, indicating that some patients were assigned to the wrong IPSS-R categories because IPSS-R calculation is based on clinical and genetic variables and does not include the transcriptomics data for coding and non-coding genomic regions. 

      Author response image 2.

      Comparison of IPSS-R risk categories and MOFA risk and protective factors.

      (2) A major issue in analyzing this paper relates to the specific patient composition from whom the samples and data were obtained. The cells from the Shiozawa paper (ref 17) is comprised of a substantial number of CMML patients. Thus, what evidence have the authors that much of the data from the BMMNCs from these patients and mutant SRSF2 related predominantly to their monocytic dicerentiation state?  

      We thank the reviewer for the insightful comment about the monocytic differentiation state of CMML and SRSF2 mutant cases. The BMMNC cohort has 11 CMML and 17 SRSF2 mutant cases, of which six are shared between the two groups. We have divided the patients into four groups: CMML only, SRSF2 mutant only, CCML and SRSF2 mutant, and others. We have generated boxplots for all cellular composition gene signature scores for these groups and compared the scores between these groups. As explained above, Ferrall-Fairbanks et al. (DOI: 10.1158/2643-3230.BCD-21-0217) recently showed that CMML can be classified into three differentiation trajectories: monocytic, megakaryocyte-erythroid progenitor (MEP), and normal-like. One hallmark of monocytic-biased trajectory was the enrichment of inflammatory granulocyte–macrophage progenitor (GMP)-like cells, which we observed through our analysis for the CMML cases with SRSF2 mutation (Author response image 3.).

      Author response image 3.

      Cellular composition gene signature scores for CMML and SRSF2 mutant versus other cases. CMML cases with SRSF2 mutation show a significant higher level of GMP and GMP-like scores compared to other MDS cases.  

      (3) In addition, as the majority of patients in the Shiozawa paper have ring sideroblasts (n=59), thus potentially skewing the data toward consideration mainly of these patients, for whom better outcomes are well known.  

      We disagree with the reviewer. We used 94 BMMNC samples from Shiozawa’s paper, of which 19 cases had Refractory Anemia with Ring Sideroblasts (RARS), 4 cases had Refractory Anemia with Ring Sideroblasts and thrombocytosis (RARS-T), and 5 cases had Refractory cytopenia with multilineage dysplasia and ring sideroblasts (RCMD-RS). In total, we had 28 cases (~30%) with Ring Sideroblasts (RS), which are not large enough to skew the data.

      (4) Further, regarding this patient subset, what evidence have the authors that the importance of the SF3B1 mutation was merely related to the preponderance of sideroblastic patients from whom the samples were analyzed? 

      We had 34 SF3B1 mutant cases, of which 25 had Ring Sideroblasts (RS). The total number of cases with RS in the BMMNC cohort was 28. Therefore, the BMMNC cohort is not an RSdominant cohort, and RS cases did not include all SF3B1 mutants. Furthermore, it was recently shown by Ochi et al. (DOI: 10.1038/s41598-022-18921-2) that RS is a consequence of SF3B1K700E mutation, and it is not a cause to affect the SF3B1 importance.

      (5) An Erratum was reported for the Shiozawa paper (Shiozawa Y, Malcovati L, Gallì A, et al. Gene expression and risk of leukemic transformation in myelodysplasia. Blood. 2018 Aug 23;132(8):869-875. doi: 10.1182/blood-2018-07-863134) that resulted from a coding error in the construction of the logistic regression model for subgroup prediction based on the gene expression profiles of BMMNCs. This coding error was identified after the publication of the article. The authors should indicate the ecect this error may have had on the data they now report.  

      Thank you for bringing this important issue to our attention. The error resulted from a mistake in the construction of the logistic regression model for subgroup prediction based on the gene expression profiles of BMMNCs. However, this issue does not affect our result because we analysed the expression data from scratch and generated our own gene signature scores. Also, the error has no impact on the genetics and clinical information that we received from the authors.

      (6) What information have the authors as to whether the dicering RTE findings were not predominantly related to the dicerentiation state of the cell population analyzed (ie higher in BM MNCs vs CD34, Fig 1)? What control data have the authors regarding these values from normal (non-malignant) cell populations? 

      As described above, L1 and Alu, the two RTE families shared between the two cohorts, are still active and make new insertions in humans (Figure 2.a-b). Our interpretation is that ERV activation in BM is associated with immune cells. This interpretation is further supported by the findings of Au et al. (DOI: 10.1016/j.ccell.2021.10.001), where several ERV loci had expression in purified immune cell subsets in renal cell carcinoma samples. 

      Unfortunately, none of these two cohorts had normal (non-malignant) cell populations. We think that the MOFA unbiased way of modelling the heterogeneity is su@icient to capture the RTE derepressed phenotype of a subset of MDS cases compared to others, and we do not need normal cases to further support the finding. 

      (7) The statement in the Discussion regarding the ecects of SRSF2 mutation is speculative and should be avoided. Many other somatic gene mutations have known stronger ecects on prognosis for MDS. 

      One aim of this study is to identify specific immune signatures associated with SRSF2 and SF3B1 mutations, which are highly prevalent in MDS. Although other mutations, such as TP53, may have a stronger correlation with poor survival, numerous studies have demonstrated a clear link between SRSF2 mutations and poor prognosis.

    1. Author response:

      Public Reviews:

      Reviewer #1 (Public Review):

      In this manuscript, the authors employ a combined proteomic and genetic approach to identify the glycoprotein QC factor malectin as an important protein involved in promoting coronavirus infection. Using proteomic approaches, they show that the non-structural protein NSP2 and malectin interact in the absence of viral infection, but not in the presence of viral infection. However, both NSP2 and malectin engage the OST complex during viral infection, with malectin also showing reduced interactions with other glycoprotein QC proteins. Malectin KD reduce replication of coronaviruses, including SARS-COV2. Collectively, these results identify Malectin as a glycoprotein QC protein involved in regulating coronavirus replication that could potentially be targeted to mitigate coronavirus replication.

      Overall, the experiments described appear well performed and the interpretations generally reflect the results. Moreover, this work identifies Malectin as an important pro-viral protein whose activity could potentially be therapeutically targeted for the broad treatment of coronavirus infection. However, there are some weaknesses in the work that, if addressed, would improve the impact of the manuscript.

      Notably, the mechanism by which malectin regulates viral replication is not well described. It is clear from the work that malectin is a pro-viral protein in the work presented, but the mechanistic basis of this activity is not pursued. Some potential mechanisms are proposed in the discussion, but the manuscript would be strengthened if additional insight was included. For example, does the UPR activated to higher levels in infected cells depleted of malectin? Do glycosylation patterns of viral (or non-viral) proteins change in malectin-depleted cells? Additional insight into this specific question would significantly improve the manuscript.

      We concur with the reviewer that the mechanism by which Malectin regulates viral replication remains unclear. It will be worth pursuing the molecular mechanisms underlying this phenotype in future studies. Our existing proteomics data sets can potentially offer additional insight into the questions posed here. Namely, we plan to analyze levels of protein markers of the UPR and other ER stress pathways in infected cells depleted of Malectin in our existing global proteomics data set. In addition, we will attempt to compare glycosylation patterns of endogenous proteins in Malectin-depleted cells. One caveat to this will be that it may be difficult to differentiate between spontaneous chemical deamidation and enzymatic PNGase F mediated deamidation.

      Further, the evidence for increased interactions between OST and malectin during viral infection is fairly weak, despite being a major talking point throughout the manuscript. The reduced interactions between malectin and other glycoproteostasis QC factors is evident, but the increased interactions with OST are not well supported. I'd recommend backing off on this point throughout the text, instead, continuing to highlight the reduced interactions.

      We note that the fold change increase of OST interactions with malectin are small compared to the fold change decrease of other glycoproteostasis factors. If this modest increase is consistent across replicates, we believe this bolsters the claim that it is a noteworthy change. However, if not, we can modify the text as suggested to emphasize the reduced interactions.

      I was also curious as to why non-structural proteins, nsp2 and nsp4, showed robust interactions with host proteins localized to both the ER and mitochondria? Do these proteins localize to different organelles or do these interactions reflect some other type of dysregulation? It would be useful to provide a bit of speculation on this point.

      We also find these ER and mitochondrial protein interactions curious, which we initially reported on (Davies, Almasy et al. 2020 ACS Infectious Diseases). In this prior report, we found that when expressed in HEK293T cells, SARS-CoV-2 nsp2 and nsp4 have partial localization to mitochondrial-associated ER membranes (MAMs), as determined by subcellular fractionation. Given that malectin has also been shown to have MAMs localization (Carreras-Sureda, et al. 2019 Nature Cell Biology), we can insert some speculation on this in the Discussion section.

      Again, the overall identification of malectin as a pro-viral protein involved in the replication of multiple different coronaviruses is interesting and important, but additional insights into the mechanism of this activity would strengthen the overall impact of this work.

      Reviewer #2 (Public Review):

      Summary:

      A strong case is presented to establish that the endoplasmic reticulum carbohydrate binding protein malectin is an important factor for coronavirus propagation. Malectin was identified as a coronavirus nsp2 protein interactor using quantitative proteomics and its importance in the viral life cycle was supported by using a functional genetic screen and viral assays. Malectin binds diglucosylated proteins, an early glycoform thought to transiently exist on nascent chains shortly after translation and translocation; yet a role for malectin has previously been proposed in later quality control decisions and degradation targeting. These two observations have been difficult to reconcile temporally. In agreement with results from the Locher lab, the malectin-interactome shown here includes a number of subunits of the oligosaccharyltransferase complex (OST). These results place malectin in close proximity to both the co-translational (STT3A or OST-A) and post-translational (STT3B or OST-B) complexes. It follows that malectin knockdown was associated with coronavirus Spike protein hypoglycosylation.

      Strengths:

      Strengths include using multiple viruses to identify interactors of nsp2 and quantitative proteomics along with

      multiple viral assays to monitor the viral life cycle.

      Weaknesses:

      Malectin knockdown was shown to be associated with Spike protein hypoglycosylation. This was further supported by malectin interactions with the OSTs. However, no specific role of malectin in glycosylation was discussed or proposed.

      We will emphasize our hypotheses on this point in the discussion and add a summary figure to highlight the specific role of malectin.

      Given the likelihood that malectin plays a role in the glycosylation of heavily glycosylated proteins like Spike, it is unfortunate that only 5 glycosites on Spike were identified using the MS deamidation assay when Spike has a large number of glycans (~22 sites). The mass spec data set would also include endogenous proteins. Were any heavily glycosylated endogenous proteins hypoglycosylated in the MS analysis in Fig 5D?

      We plan to interrogate this question in our existing MS deamidation proteomics data set as outlined above.

      The inclusion of the nsp4 interactome and its partial characterization is a distraction from the storyline that focuses on malectin and nsp2.

      We believe the nsp4 comparative interactome and functional genomics data offers a rich resource for further functional investigation by others, if made public. While we found the malectin and nsp2 storyline the most compelling to pursue, we believe the inclusion of the nsp4 data strengthens the overall approach, in agreement with Reviewer #3’s comments.

      Reviewer #3 (Public Review):

      Summary:

      In this study, Davies and Plate set out to discover conserved host interactors of coronavirus non-structural proteins (Nsp). They used 293T cells to ectopically express flag-tagged Nsp2 and Nsp4 from five human and mouse coronaviruses, including SARS-CoV-1 and 2, and analyzed their interaction with host proteins by affinity purification mass-spectrometry (AP-MS). To confirm whether such interactors play a role in coronavirus infection, the authors measured the effects of individual knockdowns on replication of murine hepatitis virus (MHV) in mouse Delayed Brain Tumor cells. Using this approach, they identified a previously undescribed interactor of Nsp2, Malectin (Mlec), which is involved in glycoprotein processing and shows a potent pro-viral function in both MHV and SARS-CoV-2. Although the authors were unable to confirm this interaction in MHV-infected cells, they show that infection remodels many other Mlec interactions, recruiting it to the ER complex that catalyzes protein glycosylation (OST). Mlec knockdown reduced viral RNA and protein levels during MHV infection, although such effects were not limited to specific viral proteins. However, knockdown reduced the levels of five viral glycopeptides that map to Spike protein, suggesting it may be affected by Mlec.

      Strengths:

      This is an elegant study that uses a state-of-the-art quantitative proteomic approach to identify host proteins that play critical roles in viral infection. Instead of focusing on a single protein from a single virus, it compares the interactomes of two viral proteins from five related viruses, generating a high confidence dataset. The functional follow-ups using multiple live and reporter viruses, including MHV and CoV2 variants, convincingly depict a pro-viral role for Mlec, a protein not previously implicated in coronavirus biology.

      Weaknesses:

      Although a commonly used approach, AP-MS of ectopically expressed viral proteins may not accurately capture infection-related interactions. The authors observed Mlec-Nsp2 interactions in transfected 293T cells (1C) but were unable to reproduce those in mouse cells infected with MHV (3C). EIF4E2/GIGYF2, two bonafide interactors of CoV2 Nsp2 from previous studies, are listed as depleted compared to negative controls (S1D). Most other CoV2 Nsp2 interactors are also depleted by the same analysis (S1D). Previously reported MERS Nsp2 interactors, including ASCC1 and TCF25, are also not detected (S1D). Furthermore, although GIGYF2 was not identified as an interactor of MHV Nsp2/4 in human cells (S1D), its knockdown in mouse cells reduced MHV titers about 1000 fold (S4). The authors should attempt to explain these discrepancies.

      We plan to address these discrepancies with further elaboration in the text.

      More importantly, the authors were unable to establish a direct link between Mlec and the biogenesis of any viral or host proteins, by mass-spectrometry or otherwise. Although it is clear that Mlec promotes coronavirus infection, the mechanism remains unclear. Its knockdown does not affect the proteome composition of uninfected cells (S15B), suggesting it is not required for proteome maintenance under normal conditions. The only viral glycopeptides detected during MHV infection originated from Spike (5D), although other viral proteins are also known to be glycosylated. Cells depleted for Mlec produce ~4-fold less Spike protein (4E) but no more than 2-fold less glycosylated spike peptides (5D), compounding the interpretation of Mlec effects on viral protein biogenesis. Furthermore, Spike is not essential for the pro-viral role of Mlec, given that Mlec knockdown reduces replication of SARS-CoV-2 replicons that express all viral proteins except for Spike (6A/B).

      These are all important points. We plan to acknowledge some of these compounding factors in the Discussion.

      Any of the observed effects on viral protein levels could be secondary to multiple other processes. Interventions that delay infection for any reason could lead to an imbalance of viral protein levels because Spike and other structural proteins are produced at a much higher rate than non-structural proteins due to the higher abundance of their cognate subgenomic RNAs. Similarly, the observation that Mlec depletion attenuates MHV-mediated changes to the host proteome (S15C/D) can also be attributed to indirect effects on viral replication, regardless of glycoprotein processing. In the discussion, the authors acknowledge that Mlec may indirectly affect infection through modulation of replication complex formation or ER stress, but do not offer any supporting evidence. Interestingly, plant homologs of Mlec are implicated in innate immunity, favoring a more global role for Mlec in mammalian coronavirus infections.

      We plan to interrogate our existing proteomics data for signatures of ER stress in Mlec-depleted cells (as outlined above).

      Finally, the observation that both Nsp2 (3C) and Mlec (3E/F) are recruited to the OST complex during MHV infection neither support nor refute any of these alternate hypotheses, given that Mlec is known to interact with OST in uninfected cells and that Nsp2 may interact with OST as part of the full length unprocessed Orf1a, as it co-translationally translocates into the ER. Therefore, the main claims about the role of Mlec in coronavirus protein biogenesis are only partially supported.

      We plan to acknowledge this alternative hypothesis in the Discussion.

    1. Author response:

      We are grateful to the reviewers for their insightful comments on our manuscript and are encouraged by their overall favorable assessments. For the eLife Version of Record, we will make the following revisions to address reviewers’ comments and broaden the applicability of our technique in the zebrafish research community:

      (1) We will elaborate on various facets with additional details:

      a) Experimental conditions | We will specify the transgenic background, injected plasmids, larval stage, viral type, and viral titer clearly for each related experiment.

      b) Experimental methods | We will depict in more details on how to inject the virus into a target area in larval zebrafish.

      c) Data analysis | We will provide more detailed information on the paired electrical stimulation-calcium imaging study and on identifying connected Purkinje cells and granule cells during circuit reconstruction.

      d) Discussion | We will elaborate on trans-synaptic specificity concerning glial cell labeling, toxicity related to viral dose and temperature, and the potential issue of secondary starters and multi-step circuit tracing.

      (2) We will address the issue of glial cell labeling by adding more discussion and characterization, including potential mechanisms and implications, cell distribution, labeling progress, survival, and capability for viral transmission as starter cells.

      (3) We will modify the text of the manuscript to clarify additional points raised by the reviewers.

      (4) We will provide public repositories for accessing both the items and information on zebrafish lines, plasmids, viral vectors, and reconstructed data generated in this study.

      In the end, we will submit full responses to the reviewer comments along with the revised version of the manuscript.

    1. Author response:

      The following is the authors’ response to the original reviews.

      eLife assessment:

      The manuscript establishes a sophisticated mouse model for acute retinal artery occlusion (RAO) by combining unilateral pterygopalatine ophthalmic artery occlusion (UPOAO) with a silicone wire embolus and carotid artery ligation, generating ischemia-reperfusion injury upon removal of the embolus. This clinically relevant model is useful for studying the cellular and molecular mechanisms of RAO. The data overall are solid, presenting a novel tool for screening pathogenic genes and promoting further therapeutic research in RAO.

      Thank you for recognizing the sophistication and clinical relevance of our mouse model for acute retinal artery occlusion. We are grateful for your supportive feedback.

      Public reviews:

      (1) Response to Reviewer #1: 

      Summary:

      Wang, Y. et al. used a silicone wire embolus to definitively and acutely clot the pterygopalatine ophthalmic artery in addition to carotid artery ligation to completely block the blood supply to the mouse inner retina, which mimics clinical acute retinal artery occlusion. A detailed characterization of this mouse model determined the time course of inner retina degeneration and associated functional deficits, which closely mimic human patients. Whole retina transcriptome profiling and comparison revealed distinct features associated with ischemia, reperfusion, and different model mechanisms. Interestingly and importantly, this team found a sequential event including reperfusion-induced leukocyte infiltration from blood vessels, residual microglial activation, and neuroinflammation that may lead to neuronal cell death.

      Strengths:

      Clear demonstration of the surgery procedure with informative illustrations, images, and superb surgical videos.

      Two-time points of ischemia and reperfusion were studied with convincing histological and in vivo data to demonstrate the time course of various changes in retinal neuronal cell survivals, ERG functions, and inner/outer retina thickness.

      The transcriptome comparison among different retinal artery occlusion models provides informative evidence to differentiate these models.

      The potential applications of the in vivo retinal ischemia-reperfusion model and relevant readouts demonstrated by this study will certainly inspire further investigation of the dynamic morphological and functional changes of retinal neurons and glial cell responses during disease progression and before and after treatments.

      We sincerely appreciate your detailed and positive feedback. These evaluations are invaluable in highlighting the significance and impact of our work. Thank you for your thoughtful and supportive review.

      Weaknesses:

      It would be beneficial to the manuscript and the readers if the authors could improve the English of this manuscript by correcting obvious grammar errors, eliminating many of the acronyms that are not commonly used by the field, and providing a reason why this complicated but clever surgery procedure was designed and a summary table with the time course of all the morphological, functional, cellular, and transcriptome changes associated with this model.

      Thank you for your thorough review of the manuscript. We sincerely apologize for any grammatical errors resulting from our English language proficiency and have taken the necessary steps to polish the article. Additionally, we have heeded your advice and reduced the use of field-specific acronyms to enhance readability for both the manuscript and its readers.

      Regarding the rationale behind the design of the UPOAO model, we have provided a description in Introduction section. Our group focuses on the research of pathogenesis and clinical treatment for RAO. The absence of an accurate mouse model simulating the retinal ischemic process has hampered progress in developing neuroprotective agents for RAO. To better simulate the retinal ischemic process and possible ischemia-reperfusion injury following RAO, we developed a novel vascular-associated mouse model called the unilateral pterygopalatine ophthalmic artery occlusion (UPOAO) model. We drew inspiration from the widely employed middle cerebral artery occlusion (MCAO) model, commonly used in cerebral ischemic injury research, which guided the development of the UPOAO model.

      We appreciate your valuable suggestion regarding the inclusion of a summary table outlining the time course of morphological, functional, cellular, and transcriptome changes associated with this model. To address this, we intend to include a supplementary table at the end of the article (Table. S2 Summary Table), which will offer a comprehensive overview of the experimental results, thereby aiding in clarity and interpretation.

      Once again, we thank you for your insightful comments and suggestions, which have greatly contributed to the improvement of our manuscript.

      (2) Response to Reviewer #2: 

      Summary:

      The authors of this manuscript aim to develop a novel animal model to accurately simulate the retinal ischemic process in retinal artery occlusion (RAO). A unilateral pterygopalatine ophthalmic artery occlusion (UPOAO) mouse model was established using silicone wire embolization combined with carotid artery ligation. This manuscript provided data to show the changes in major classes of retinal neural cells and visual dysfunction following various durations of ischemia (30 minutes and 60 minutes) and reperfusion (3 days and 7 days) after UPOAO. Additionally, transcriptomics was utilized to investigate the transcriptional changes and elucidate changes in the pathophysiological process in the UPOAO model post-ischemia and reperfusion. Furthermore, the authors compared transcriptomic differences between the UPOAO model and other retinal ischemic-reperfusion models, including HIOP and UCCAO, and revealed unique pathological processes.

      Strengths:

      The UPOAO model represents a novel approach to studying retinal artery occlusion. The study is very comprehensive.

      We greatly appreciate your positive assessment of our work and are encouraged by your recognition of its significance.

      Weaknesses:

      Some statements are incorrect and confusing. It would be helpful to review and clarify these to ensure accuracy and improve readability.

      We sincerely appreciate your meticulous review of the manuscript. Taking into account your valuable feedback, we will thoroughly address the inaccuracies identified in the revised version. Additionally, we will commit to polishing the article to ensure improved readability. We apologize for any confusion caused by these inaccuracies and genuinely thank you for bringing them to our attention.

      Recommendations For The Authors:

      Reviewer #1:

      (1) Response to comment:

      The conclusions of this paper are mostly well supported by clear images and convincing data analysis, but some aspects of image presentation and additional data analysis may be needed to strengthen the manuscript.

      We sincerely appreciate your positive assessment of our work and your recognition of the clear images and convincing data analysis supporting our conclusions. Your constructive feedback on enhancing the clarity of our manuscript's image presentation and additional data analysis is highly valued. In response to your suggestions, we have taken steps to improve readability by removing or correcting uncommon acronyms from certain images. We have also conducted further data analysis to provide more comprehensive insights. Thank you for your guidance in improving the quality of our manuscript.

      (2) Response to recommendation (1):

      In Results 3.1 or in Method 2.2: please explain why this combination of silicone wire embolization and carotid artery ligation was chosen to replace previous models such as UCCAO? What are the advantages? And why the silicone wire embolus was inserted through ECA instead of inserting into CCA directly? The cleverly designed surgical procedure is very impressive but the reasoning behind it is not obvious and needs more explanation.

      Thank you for your valuable feedback.

      In the introduction, we briefly describe the rationale for developing the UPOAO model to simulate acute ischemia-reperfusion of retinal artery occlusion (RAO). Previous common retinal ischemia model had certain shortcomings. For example, in the HIOP model, which is often used for simulating glaucoma, the ischemic factor of interrupted retinal blood flow may be amplified due to the dual effects of IOP-induced mechanical stress [1, 2] and vascular ischemia due to normal saline perfusion in the anterior chamber. In the UCCAO model, recanalization is performed after ligation of the carotid blood vessels, and the retina communicates with the blood vessels in the brain, resulting in retinal hypoperfusion. The retina ischemia in UCCAO is a chronical process, for example, the retina became thinner at week 10 and week 15 [3], while RAO is an acute total retinal ischemic disease. Therefore, it is critically important to develop a simple mouse model that can simulate acute retinal ischemia and reperfusion injury in RAO patients.

      Various models have been developed for ischemic stroke research, with the endoluminal suture model being the most employed method for middle cerebral artery occlusion (MCAO). In this model, filaments are introduced through either the external or internal carotid artery and advanced into the middle cerebral artery, causing temporary blood flow blockage for a specific duration. This method has been extensively employed in studies involving transient occlusion [4]. Among the MCAO models, the Koizumi method (occlusion from the common carotid artery (CCA) to the middle cerebral artery (MCA)) and the Longa method (occlusion from the external carotid artery (ECA) to the MCA) are frequently used. Among these two methods, the Longa method is more widely utilized in research studies. The Longa method has a much lower mortality rate post-surgery (26%) than that of the Koizumi (44%) [5]. The MCAO model induces substantial infarct areas and significantly contributes to advancements in stroke research, including investigations into blood-brain barrier disruption and inflammatory responses to ischemia.

      RAO is considered a form of ocular stroke. Inspired by the MCAO model, we have employed a silicone wire embolus to induce acute interruption of blood flow to the retina. This approach enables the investigation of pathophysiological processes associated with RAO, providing valuable insights into the understanding of this condition. We have clarified these points in the revised manuscript (line 129).

      The reasoning behind inserting the silicone wire embolus through the ECA instead of directly into the CCA is twofold:

      (1) Convenience and avoidance of heavy bleeding and mortality. Inserting the silicone wire embolus requires creating an opening in the artery, which then needs to be ligated at both ends after the silicone wire embolus is removed to prevent excessive bleeding. The ECA's ability to form a straight line with the ICA after folding makes it more convenient for the entry and removal of the silicone wire embolus. This procedure is more convenient to perform on the ECA. The blood flow to the CCA can be restored after the plug is removed from ECA, ensuring that the blood supply to the brain through the CCA is not affected.

      (2) Preservation of reperfusion process. If the silicone wire embolus were inserted directly into the CCA, the ends of the CCA opening would need to be ligated after the silicone wire embolus is removed. This would result in a lack of reperfusion process after retinal ischemia. To enable the reperfusion process, the decision was made to open the ECA instead.

      We have clarified these points in the revised manuscript to better explain the rationale behind our methodology (line 139). Thank you for prompting this important clarification, which we believe will enhance the understanding of our readers.

      (3) Response to recommendation (2):

      Did the UPOPA actually block OA, including both the retinal (CRA) and choroidal (SPCA and LPCA) blood supply? If so, why does it seem only the inner retina was affected but not the outer retina?

      Thank you for your question. We agree with you that the UPOAO model blocks OA, which includes retinal and choroidal vessels. Our experimental results primarily indicate damage to the inner retinal layer within 7 days of reperfusion. For example, OCT and HE staining showed significant thinning of the inner retina after 60 minutes of ischemia followed by 7 days of reperfusion (Figure 4). At the same time, the b-wave amplitudes were decreases, usually indicating damage to the inner layer of the retina. However, the outer retina was seemed not affected by 60 minutes of ischemia based on the results of OCT, HE and immunofluorescence.

      Inner layer of the retina was known to show the highest sensitivity to hypoxic challenges [6], whereas the outer retinal layer was more resistant to hypoxic stress [7]. The possible reason for these results was that the outer layer like photoreceptors is more tolerant against ischemia than inner layer of the retina. Previous studies of retinal ischemia-reperfusion models supported this assumption. In the UCCAO model, the b-wave was more affected than the a-wave. Decreases in the amplitudes of OPs, scotopic b-wave, and photopic b-wave were consistently observed on week 4 after UCCAO, while the amplitude of scotopic a-wave did not dramatically change [8]. Prolonged ischemia, such as permanent ischemia, led to photoreceptor cell degradation, as seen in Stevens et al.'s report of photoreceptors loss 3 months after permanent ligation of both common carotid arteries in bilateral common carotid artery occlusion (BCCAO) [9]. In the HIOP model, the GCL and INL reacted sensitively to ischemic processes. A significant thinning of the GCL as early as 6 hours after 60 minutes of ischemia [10]. Horizontal cells and photoreceptors remained mostly unaffected, while most RGCs and several amacrine cell subtypes disappear [11, 12].

      Our study revealed the changes that occurred within 60 minutes of ischemia and the first 7 days of reperfusion in the UPOAO model. One possibility was that the ischemia duration in our model was not long enough to affect the outer retinal cells. Furthermore, the observation time point for reperfusion was not long enough to see the structure damage and visual dysfunctions in the outer retinal layer. As we have explained in the manuscript, further exploration is needed to understand changes induced by longer ischemia duration and reperfusion periods. Revealing the damage to retinal structure and function during longer ischemia time will be an emphasis direction for our further research.

      (4) Response to recommendation (3):

      Better to only use well-accepted acronyms and remove those that are rarely seen in other publications, such as IMRL, MRL, HIOP, TRT, etc.

      Thank you for your valuable feedback. In our manuscript, we utilized the Spectralis HRA+OCT device (Heidelberg) to capture the retinal images. However, the resulting image layering did not adequately distinguish each retinal layer clearly. To address this limitation, we referred to a clinical OCT stratification approach in RVO and divided the retina into the inner, middle, and outer layers [16]. We acknowledge that this hierarchical description is not commonly used and have therefore followed your recommendation to remove these rare acronyms and instead employ the layer structure abbreviation along with the plus sign. The methods and results have been revised accordingly (line 213, line 368, Figure 4 and Figure S2).

      In addition, for the HIOP model, it is also known as the IR or RIRI model [17-19], and the pathophysiological process of retinal ischemia-reperfusion injury (IRI) is usually used to represent this type of anterior chamber perfusion model. To avoid confusion between the pathophysiological process of ischemia-reperfusion studied in this paper and the common model of high intraocular pressure, we have consistently referred to it as the HIOP model, an abbreviation that is cited in many references [20-22].

      Thanks again for the suggestion. We apologize for any confusion caused by the use of abbreviations and have made the necessary corrections in the manuscript. We have also strengthened the details of OCT layering in the images to enhance readability for our audience.

      (5) Response to recommendation (4):

      Figure 3F, G: What do the OP changes mean? What retina cell dysfunction leads to OP changes? Is there RGC-relevant visual function readout to correlate with RGC death?

      Oscillatory potentials (OPs) are important components of the electroretinogram (ERG). While the precise origin of OPs remains unclear, they are generally believed to be generated from the inner retinal layer, specifically involving bipolar cells, amacrine cells and ganglion cells [23]. OPs are sensitive indicators of retinal ischemic effects and can detect dysfunction before alterations in the b-waves occur [24-26] (We have added these statements at line 358). In this research, the reduction of OPs indicated dysfunction in the inner retinal layer and retinal ischemia.

      The function of RGCs can be non-invasively assessed by using various ERG technique that emphasize the activity of inner retina neurons, including OPs of multifocal ERG (mfERG), photopic negative response (PhNR) in mfERG, pattern electroretinogram (PERG), negative Scotopic Threshold Response (nSTR) [27]. Among these indicators, the PERG appears to be more specifically related to the presence of functional RGCs. However, the complexity of electrophysiological sources and species-specific differences in RGCs characteristics should also be considered. In addition, visual evoked potentials (VEP) can assess the function of visual signaling in the whole visual pathway from RGC axons to the visual cortex of the brain [28, 29]. Unfortunately, due to the unavailability of specific equipment required for evaluating RGCs function, we encountered limitations in conducting a comprehensive assessment in this study. This limitation emphasizes the importance of future studies incorporating RGCs evaluation to provide a more comprehensive understanding of visual pathway functionality and its implications, considering indicators such as PERG and PhNR.

      Thank you for your careful review and insightful questions.

      (6) Response to recommendation (5):

      Figure 4B: RNFL/GCL/IPL normally called GCC (ganglion cell complex).

      We appreciate your helpful recommendation regarding the abbreviation GCC (ganglion cell complex) for the combination of RNFL, GCL, and IPL. We have updated this terminology in the revised manuscript (line 213 and Figure 4).

      (7) Response to recommendation (6):

      Figure 4 A-F: Normally a circular OCT image surrounding the optic nerve head is preferred to measure retina thickness. If in these figures, all the OCT images are from the same location, it may be acceptable, but need to provide imaging details on how these OCT planes are selected and what has been done to make sure the same locations were selected for comparison.

      We agree with your comment on OCT imaging that the retina is usually captured OCT images surrounding the optic nerve head. In this study, our goal was to assess both the thickness of the peripheral retina and the retina near the optic nerve head. To achieve this, we considered the optic nerve head as the apex of the selected field of view (left upper region of panel A in Figure 4). For each mouse, we obtained OCT images of the superior nasal (SN), superior temporal (ST), inferior nasal (IN), and inferior temporal (IT) fields of the optic nerve. We then averaged the thicknesses from these four fields. In each field, we measured and statistically evaluated the retinal thickness at distances of 1.5, 3, and 4.5 papillae diameters (PD) from the optic nerve head.

      This approach allowed us to ensure that the same locations were selected for comparison and provided a comprehensive assessment of retinal thickness across different regions. We have detailed this methodology in the revised manuscript to clarify the imaging process and the consistency of the selected locations.

      Thank you for your insightful feedback.

      Reviewer #2:

      Addressing the following concerns is necessary to improve the manuscript.

      (1) Response to recommendation (1):

      The manuscript contains many grammatical errors and should be carefully reviewed for corrections. For example: In the title, "Silicone Wire Embolization-induced Acute Retinal Artery Ischemia and Reperfusion Model in Mouse: Gene Expression Provide Insight into Pathological Processes". It should be "Provides" instead of "Provide". In the Abstract, "The resident microglia within the retina and peripheral leukocytes which access to the retina were pronounced increased on reperfusion periods." It should be "pronouncedly" or "markedly" instead of " pronounced".

      Thank you for your careful reading and pointing out the grammatical errors in the manuscript. We apologize for these mistakes and have since revised and polished the article with the assistance of native English speakers. Ensuring accurate and clear language usage in scientific writing is crucial, and we appreciate your help in improving the quality of our manuscript. Thank you for bringing these errors to our attention.

      (2) Response to recommendation (2):

      Video 2: the video content from "30s-47s" and "50s-67s" is repeatedly shown.

      Thank you for your careful review of the video. In the process of preparing the external carotid artery for silicone wire embolus insertion, we first ligated the distal end with a square knot and then tied a loose knot at the proximal end. In the video content from "30s-47s" and "50s-67s", we are tying a square knot. We apologize for any confusion caused by these repeated video clips.

      (3) Response to recommendation (3):

      Figure 1: The ConA staining (H-I) and FFA (J-K) were performed before the removal of silicone wire embolus. It would be beneficial to clarify this in the figure legend too. Additionally, the label 'Post. Sup. Alveolar art.: Posterior superior alveolar artery' is not present in Figure 1L."

      Thank you for your thorough review of the manuscript and the valuable suggestions regarding Figure 1. We have updated the figure legend of Figure 1 to clarify that ConA staining (H-I) and FFA (J-K) were performed before the removal of the silicone wire embolus (line 868 and line 873). Additionally, we have included the label 'Post. Sup. Alveolar art' in Figure 1L as you pointed out. We appreciate your careful attention to detail, and we have ensured that these omissions have been rectified in the revised version of the manuscript.

      (4) Response to recommendation (4):

      Figure 2: only representative images of RGCs at the peripheral retina were shown. It is not clear if only RGCs in the peripheral retina were quantified. Is there RGC loss in the central and middle retina in the UPOAO model as well? How many fields of RGCs were quantified for each retina?

      Thank you for your meticulous review of the manuscript. The quantification method of RGCs is described in detail as follows:

      Four radial incisions were made in the retina and flattened on a glass slide to create a "four-leaf clover" shape. Retina was photographed using a fluorescence microscope (BX63, Olympus, Japan). We captured images from three different regions of each retinal quadrant: 0.1 mm-0.5 mm (central region, field numbers: 1, 4, 7, 10), 0.9 mm-1.3 mm (middle region, field numbers: 2, 5, 8, 11), and 1.7 mm-2.1 mm (peripheral region, field numbers: 3, 6, 9, 12) from the optic nerve head, respectively, as shown in Author response image 1.

      Of these, the peripheral field changes were the most noticeable, so we used the Leica SP8 confocal microscope (20X) to capture peripheral field RGCs as a demonstration (Figure 2A, C, E, G). RGC counts of twelve fields of each retina were quantified and the average density of RGCs in twelve fields per retina was shown in Figure 2B, D, F, K. RGC counts in the central (field number: 1, 4, 7, 10), middle (field number: 2, 5, 8, 11), and peripheral (field number: 3, 6, 9, 12) visual fields were shown in Author response table 1-4.We have included this detailed methodology in the revised manuscript to clarify the quantification process and to address the presence of RGCs loss in both the central and middle retina in the UPOAO model. Thank you for pointing out the need for this clarification.

      Author response image 1.

      Schematic diagram of field selection. Scale bar=1.4 mm. Each retinal petal has three distinct visual fields (the area circled by the green line) that radiate from the optic nerve head to the periphery, in that order, the central, middle, and peripheral visual fields.

      Author response table 1.

      RGCs counts in each field of each retina (30-minute ischemia and 3-day reperfusion)

      Author response table 2.

      RGCs counts in each field of each retina (30-minute ischemia and 7-day reperfusion)

      Author response table 3.

      RGCs counts in each field of each retina (60-minute ischemia and 3-day reperfusion)

      Author response table 4.

      RGCs counts in each field of each retina (60-minute ischemia and 7-day reperfusion)

      (5) Response to recommendation (5):

      Figure 3: The representative wave lines in panels A (60min_3d, 60min_7d) and F do not reflect the statistical analysis presented in panels D, E, and G, especially for the amplitudes of b waves and OPs.

      Thank you for your careful review of the manuscript. We've added labels for a-waves, b-waves, and improved the presentation of OPs to make the details of the amplitude more visible (Figure 3). In the previous version, due to incorrect settings, we did not adjust the ordinate spacing when fitting curves of representative wave lines in four groups, resulting in the curves being compressed vertically to the same height. We have now adjusted the curves to be fitted under the same scale bar (shown in the bottom right corner of Figure. 3A). What’s else, we removed the baseline wave of the OPs wave and adjusted the abscissa scale to highlight the N waves and P waves for easy reading (Figure 3F).

      (6) Response to recommendation (6):

      There are two different Supplementary Figure 1 and no Supplementary Figure 3, resulting in misaligned references to Supplementary Figures 1, 2, and 3 in the text.

      Thank you for your careful review of the manuscript. We have reviewed the manuscript again and identified errors in uploading the supplementary figures, which resulted in duplicate Supplementary Figure 1 and the absence of Supplementary Figure 3. We have corrected these issues and realigned the references to Supplementary Figures 1, 2, and 3 in the text to ensure consistency. We appreciate your attention to detail and your reminder to address this issue.

      (7) Response to recommendation (7):

      There is confusion about the definition of ORL (outer retina layer). In Lines 208-209, ORL was defined as the combined thickness of the rest to the retinal pigment epithelium (RPE). It seems the ONL is included in ORL. But in lines 358-359, 907-908, "the ORL encompassed the region from the inner segment/outer segment (IS/OS) to the RPE". Please make the definition consistent. In addition, it is hard to distinguish the regions marked by the green lines in Fig. 4A (sham image) after Line 902.

      Thank you for your careful review of the manuscript. We have addressed the confusion regarding the definition of the outer retinal layer (ORL). The Heidelberg OCT device does not distinguish the layers of the mouse retina well, so we divided it into three broader layers:

      (1) Ganglion Cell Complex (GCC) layer, which encompasses RNFL+GCL+IPL.

      (2) Middle Retinal Layer, which includes INL+OPL.

      (3) Outer Retinal Layer (ORL), which includes ONL+IS/OS+RPE.

      We apologize for the inconsistency and have revised the errors in the manuscript and figure legends accordingly. Additionally, we have removed rare domain-specific acronyms and replaced them with more commonly understood abbreviations, as suggested, to avoid confusion.

      Furthermore, we have enlarged parts of the OCT images to better display the layers, hoping to meet the readers' requirements and improve clarity. Thank you for your valuable feedback.

      (8) Response to recommendation (8):

      Figure 4 (Panels H-J, L-M) incorporated with the text (Line 902) differs from the high-resolution version of Figure 4 included later in the manuscript. In Figure 4 (Panels H-J, L-M) merged with the text (Line 902), the quantification of the IPL and INL thickness is incorrect, and the scale bar is inaccurate. However in the high-resolution version of Figure 4 provided later, the thickness of the RNFL+GCL is incorrect.

      Thank you for your careful review of the manuscript. The quantification of the IPL and INL thickness in Figure 4 (Panels H-J, L-M) incorporated with the text has been revised to ensure accurate measurements and scale bars (Figure 4 and line 924). The high-resolution version of Figure 4 provided later has been updated to correct the thickness measurements of the RNFL+GCL. We have ensured that the ordinate in the high-resolution version of Figure 4 now correctly represents length units, consistent with the equal proportional conversion used in the integrated text figures.

      Thank you for your valuable feedback and for pointing out these errors. We have made the necessary corrections to align the figures accurately with the manuscript.

      (9) Response to recommendation (9):

      Line 384-386: the statement "Notably, a-waves in ERG and the thickness of the outer retinal layers in both OCT and HE remained unchanged." is not accurate, since a-waves in ERG is not changed in 3 days but changed in 7 days, and the thickness of the outer retinal layers in HE is either not measured or not shown in Figure 4.

      Thank you for your careful review of the manuscript. We apologize for this error and have revised it.

      We aimed to convey that the amplitude of the a-waves, which represent the function of the photoreceptors, does not show significant variation, which is consistent with the thickness of the outer retinal layer observed in OCT and HE images. Our results indicated that at 7 days post-injury, the amplitude of the a-waves in ERG was statistically different only at stimulus light intensity of 0.3, 3.0 and 10.0 cd.s/m2. In contrast, the b-wave amplitude was reduced by half compared to sham eyes at almost all stimulus light intensities. At the same time, the immunofluorescence staining results of photoreceptor cells showed no significant change at 7-days. Therefore, we consider the change in a-wave amplitudes were not significant compared to the significant decrease in b-wave amplitude. We have clarified this in the revised manuscript.

      We also analyzed the thickness of the outer retinal layers in HE and found it to be consistent with OCT results, showing no significant changes (shown in below Author response image 2).

      Thank you for your valuable feedback, which has helped improve the accuracy and clarity of our manuscript.

      Author response image 2.

      Thickness of OPL, ONL, IS/OS+RPE in HE staining. n=3; ns: no significance (p>0.05).

      (10) Response to recommendation (10):

      Figure 5 and Figure S3: Quantification data from different sections of the same retina should be averaged to represent one single sample (one data point) for statistical analysis. * in images of Fig. 5E, F, I, J is not defined in the figure legend. It would be easier for readers to follow if the GCL, IPL, INL, and OPL were labeled in retinal sections.

      Thank you for your careful review of the manuscript and recommendation. We have reperformed the statistical analysis and updated the results in Figure 5 and Figure S3. In the UPOAO experimental eyes, no no significant change in the number of HCs (Calbindin) was observed during the 3-days reperfusion period, while a notable reduction was observed after 7 days (Figure 5). Additionally, we have added the definition of the asterisks (*) in the figure legend to clarify their significance. We have also labeled the retinal layers, including the GCL, IPL, INL, OPL, and ONL, in the images to make it easier for readers to follow and understand the data.

      Thank you for helping us improve the clarity and accuracy of our manuscript.

      (11) Response to recommendation (11):

      Lines 407-409, the statement "which aligns with the a-waves observed in ERG (Figure 3D, E) and the changes seen in the outer retinal layers in OCT (Fig S2C, D)" is confusing. No changes were observed by OCT in Fig S2D.

      Thank you for your review and we are sorry about the confusion. The overall trend of the amplitude of the a-wave in ERG at 7-days did not change significantly, which is consistent with the immunofluorescence staining results of the photoreceptor cells. Based on these observations, we consider that the change in the amplitude of the a-wave was not significant. As you pointed out in recommendation 9,since a-waves in ERG were changed in 7-days at the stimulus light intensity of 0.3, 3.0 and 10.0 cd.s/m2, our description on the a-waves in 7-days was not accurate. We have clarified this point in the revised manuscript to ensure it accurately reflects the data presented.

      (12) Response to recommendation (12):

      In Figure S4, panel C shows lymphocyte-mediated immunity, and panel D shows leukocyte-mediated immunity. Please adjust the figure legend accordingly to reflect the figures.

      Thank you for your careful review of the manuscript. We have modified the figure legend of Figure S4.

      (13) Response to recommendation (13):

      Lines 440-442 state "These results suggested early ischemic processions such as cell migration and potential collateral vessel formation." It is not clear why and how "potential collateral vessel formation" is suggested by Figure 6 and Figure S4. Please clarify this in the text.

      Thank you for your careful review of the manuscript and we have deleted this sentence due to insufficient evidence. We have corrected this sentence: "These results suggested that in the early stage of retinal ischemic injury, leukocytes from the microvasculature may infiltrate retinal tissue. More experimental validation will be performed to confirm this hypothesis."(line 448). We will be more cautious in drawing conclusions in the future. Thank you for your reminder.

      (14) Response to recommendation (14):

      For the figure legend of Figure 6 "In each heatmap, upper box showed the top 10 up-regulated genes, and the below one showed the top 10 down-regulated genes." Is this correct? It appears that the upper box shows the top 10 down-regulated genes, and the lower box shows the top 10 up-regulated genes.

      Thank you for your careful review of the manuscript and we have modified the figure legend of Figure 6. In the heatmaps, the upper box showed the top 10 down-regulated genes, and the below one showed the top 10 up-regulated genes (line 977).

      (15) Response to recommendation (15):

      For the figure legend of Figure 7, the statement 'Data points are from retinal sections of four animals' is incorrect, as these data were obtained from whole retinas instead of retinal sections. Please revise the legend to reflect this accurately. The scale bar was absent in the images of Figure 7. Asterisk in Figure 7H and 7I was not defined.

      Thank you for your careful review of the manuscript and we have revised the errors. We have added the scale bar (Figure 7D). The white asterisks in Figure 7H and 7I indicate the activated microglial cells and we have added this definition in the legend of Figure7 (line 981).

      (16) Response to recommendation (16):

      It would be better to switch the order of Figure S7 and Figure S8 to align with their descriptions in the text.

      Thank you for your recommendation and we have switched the order of Figure S7 and Figure S8.

      (17) Response to recommendation (17):

      The gene names in Figure S8 should be written consistently with those listed in Table S1.

      Thank you for your recommendation and we have corrected the gene names.

      (18) Response to recommendation (18):

      In Figure 9, it is not clear why amacrine cells were not included in the UPOAO model, as amacrine cells were also injured as shown in Figure 5I-L.

      Thank you for your careful review of the manuscript and we have added amacrine cells in Figure 9.

      References

      (1) Yang, H., et al., The connective tissue phenotype of glaucomatous cupping in the monkey eye - Clinical and research implications. Prog Retin Eye Res, 2017. 59: p. 1-52.

      (2) Pavlatos, E., et al., Regional Deformation of the Optic Nerve Head and Peripapillary Sclera During IOP Elevation. Invest Ophthalmol Vis Sci, 2018. 59(8): p. 3779-3788.

      (3) Lee, D., et al., A mouse model of retinal hypoperfusion injury induced by unilateral common carotid artery occlusion. Experimental Eye Research, 2020. 201: p. 108275.

      (4) Barthels, D. and H. Das, Current advances in ischemic stroke research and therapies. Biochim Biophys Acta Mol Basis Dis, 2020. 1866(4): p. 165260.

      (5) Smith, H.K., et al., Critical differences between two classical surgical approaches for middle cerebral artery occlusion-induced stroke in mice. J Neurosci Methods, 2015. 249: p. 99-105.

      (6) Janáky, M., et al., Hypobaric hypoxia reduces the amplitude of oscillatory potentials in the human ERG. Doc Ophthalmol, 2007. 114(1): p. 45-51.

      (7) Tinjust, D., H. Kergoat, and J.V. Lovasik, Neuroretinal function during mild systemic hypoxia. Aviat Space Environ Med, 2002. 73(12): p. 1189-94.

      (8) Lee, D., et al., Retinal Degeneration in a Murine Model of Retinal Ischemia by Unilateral Common Carotid Artery Occlusion. Biomed Res Int, 2021. 2021: p. 7727648.

      (9) Yamamoto, H., et al., Complex neurodegeneration in retina following moderate ischemia induced by bilateral common carotid artery occlusion in Wistar rats. Exp Eye Res, 2006. 82(5): p. 767-79.

      (10) Palmhof, M., et al., From Ganglion Cell to Photoreceptor Layer: Timeline of Deterioration in a Rat Ischemia/Reperfusion Model. Front Cell Neurosci, 2019. 13: p. 174.

      (11) Adachi, M., et al., High intraocular pressure-induced ischemia and reperfusion injury in the optic nerve and retina in rats. Graefes Arch Clin Exp Ophthalmol, 1996. 234(7): p. 445-51.

      (12) Jehle, T., et al., Quantification of ischemic damage in the rat retina: a comparative study using evoked potentials, electroretinography, and histology. Invest Ophthalmol Vis Sci, 2008. 49(3): p. 1056-64.

      (13) Hayreh, S.S., H.E. Kolder, and T.A. Weingeist, Central retinal artery occlusion and retinal tolerance time. Ophthalmology, 1980. 87(1): p. 75-8.

      (14) Luo, X., et al., Hypoglycemia induces general neuronal death, whereas hypoxia and glutamate transport blockade lead to selective retinal ganglion cell death in vitro. Invest Ophthalmol Vis Sci, 2001. 42(11): p. 2695-705.

      (15) Schmid, H., et al., Loss of inner retinal neurons after retinal ischemia in rats. Invest Ophthalmol Vis Sci, 2014. 55(4): p. 2777-87.

      (16) Furashova, O. and E. Matthè, Hyperreflectivity of Inner Retinal Layers as a Quantitative Parameter of Ischemic Damage in Acute Retinal Vein Occlusion (RVO): An Optical Coherence Tomography Study. Clin Ophthalmol, 2020. 14: p. 2453-2462.

      (17) Pang, Y., et al., CD38 Deficiency Protects Mouse Retinal Ganglion Cells Through Activating the NAD+/Sirt1 Pathway in Ischemia-Reperfusion and Optic Nerve Crush Models. Invest Ophthalmol Vis Sci, 2024. 65(5): p. 36.

      (18) Feng, Y., et al., GSK840 Alleviates Retinal Neuronal Injury by Inhibiting RIPK3/MLKL-Mediated RGC Necroptosis After Ischemia/Reperfusion. Invest Ophthalmol Vis Sci, 2023. 64(14): p. 42.

      (19) Zeng, S., et al., CREG Protects Retinal Ganglion Cells loss and Retinal Function Impairment Against ischemia-reperfusion Injury in mice via Akt Signaling Pathway. Mol Neurobiol, 2023. 60(10): p. 6018-6028.

      (20) Rosenbaum, D.M., et al., The role of the p53 protein in the selective vulnerability of the inner retina to transient ischemia. Invest Ophthalmol Vis Sci, 1998. 39(11): p. 2132-9.

      (21) Zhang, Y., et al., Melatonin Alleviates Pyroptosis of Retinal Neurons Following Acute Intraocular Hypertension. CNS Neurol Disord Drug Targets, 2021. 20(3): p. 285-297.

      (22) Zhu, J., et al., Protective effects of Erigeron breviscapus Hand.- Mazz. (EBHM) extract in retinal neurodegeneration models. Mol Vis, 2018. 24: p. 315-325.

      (23) Wachtmeister, L., Oscillatory potentials in the retina: what do they reveal. Prog Retin Eye Res, 1998. 17(4): p. 485-521.

      (24) Cao, W., et al., Dextromethorphan attenuates the effects of ischemia on rabbit electroretinographic oscillatory potentials. Documenta Ophthalmologica, 1993. 84(3): p. 247-256.

      (25) Xu, J., et al., Pregabalin Mediates Retinal Ganglion Cell Survival From Retinal Ischemia/Reperfusion Injury Via the Akt/GSK3β/β-Catenin Signaling Pathway. Invest Ophthalmol Vis Sci, 2022. 63(12): p. 7.

      (26)Takács, B., et al., Electroretinographical Analysis of the Effect of BGP-15 in Eyedrops for Compensating Global Ischemia-Reperfusion in the Eyes of Sprague Dawley Rats. Biomedicines, 2024. 12(3).

      (27) Porciatti, V., Electrophysiological assessment of retinal ganglion cell function. Exp Eye Res, 2015. 141: p. 164-70.

      (28) Ridder, W.H. and S. Nusinowitz, The visual evoked potential in the mouse—Origins and response characteristics. Vision Research, 2006. 46(6): p. 902-913.

      (29) Liu, S., et al., An optimized procedure to record visual evoked potential in mice. Exp Eye Res, 2022. 218: p. 109011.

    1. Author response:

      The following is the authors’ response to the original reviews.

      Public Reviews:

      Reviewer #1 (Public Review):

      Summary:

      Satoshi Yamashita et al., investigate the physical mechanisms driving tissue bending using the cellular Potts Model, starting from a planar cellular monolayer. They argue that apical length-independent tension control alone cannot explain bending phenomena in the cellular Potts Model, contrasting with the vertex model. However, the evidence supporting this claim is incomplete. They conclude that an apical elastic term, with zero rest value (due to endocytosis/exocytosis), is necessary in constricting cells and that tissue bending can be enhanced by adding a supracellular myosin cable. Notably, a very high apical elastic constant promotes planar tissue configurations, opposing bending.

      Strengths:

      - The finding of the required mechanisms for tissue bending in the cellular Potts Model provides a more natural alternative for studying bending processes in situations with highly curved cells.

      - Despite viewing cellular delamination as an undesired outcome in this particular manuscript, the model's capability to naturally allow T1 events might prove useful for studying cell mechanics during out-of-plane extrusion.

      We thank the reviewer for the careful comments and insightful suggestions.

      Weaknesses:

      - The authors claim that the cellular Potts Model is unable to obtain the vertex model simulation results, but the lack of a substantial comparison undermines this assertion. No references are provided with vertex model simulations, employing similar setups and rules, and explaining tissue bending solely through an increase in a length-independent apical tension.

      Studies cited in a previous paragraph included the simulations employing the increased length-independent apical tension. For the sake of clarity, we added the citation to them as below.

      P4L174: “In contrast to the simulations in the preceding studies (Sherrard et al., 2010; Conte et al., 2012; Perez-Mockus et al., 2017; Pérez-González et al., 2021), our simulations could not reproduce the apical constriction”.

      We did not copy the parameters of the vertex models in the preceding studies because we also found that the apical, lateral, and basal surface tensions must be balanced otherwise the epithelial cell could not maintain the integrity (Figure 1—figure supplement 1), while the ratio was outside of the suitable range in the preceding studies.

      - The apparent disparity between the two models is attributed to straight versus curved cellular junctions, with cells with a curved lateral junction achieving lower minimum energies at steady-state. However, a critical discussion on the impact of T1 events, allowing cellular delamination, is absent. Note that some of the cited vertex model works do not allow T1 events while allowing curvature.

      We appreciate the comment and added it to the discussion as suggested.

      P12L301: “Even when the vertex model allowed the curved lateral surface, the model did not assume the cells to be rearranged and change neighbors, limiting the cell delamination (Pérez-González et al., 2021).”

      P12L311: “Note that the vertex model could also be extended to incorporate the curved edges and rearrangement of the cells by specifically programming them, and would reproduce the cell delamination. That is, we could find the importance of the balanced pressure because the cellular Potts model intrinscally included a high degree of freedom for the cell shape, the cell rearrangement, and the fluctuation.”

      - The suggested mechanism for inducing tissue bending in the cellular Potts Model, involving an apical elastic term, has been utilized in earlier studies, including a cited vertex model paper (Polyakov 2014). Consequently, the physical concept behind this implementation is not novel and warrants discussion.

      The reviewer is correct but Polyakov et al. assumed “that the cytoskeletal components lining the inside membrane surfaces of the cells provide these surfaces with springlike elastic properties” without justification. We assumed that the myosin activity generated not the elasticity but the contractility based on Labouesse et al. (2015), and expected that the surface elasticity corresponded with the membrane elasticity. Also, in the physical concept, we clarified how the contractility and the elasticity differently deformed the cells and tissue, and demonstrated why the elasticity was important for the apical constriction. We added it to the discussion as below.

      P12L316: “In the preceding studies, the apically localized myosin was assumed to generate either the contractile force (Sherrard et al., 2010; Conte et al., 2012; Perez-Mockus et al., 2017; Pérez-Vonzález et al., 2021) or the elastic force (Polyakov et al., 2014; Inoue et al., 2016; Nematbakhsh et al., 2020). However, the limited cell shape in the vertex model made them similar in terms of the energy change during the apical constriction, i.e., the effective force to decrease the apical surface. In this study, we showed that the contractile force and the elastic force differently deformed the cells and tissue, and demonstrated why and how the elasticity was important for the apical constriction.”

      - The absence of information on parameter values, initial condition creation, and boundary conditions in the manuscript hinders reproducibility. Additionally, the explanation for the chosen values and their unit conversion is lacking.

      We agree with the comment.

      For the initial configuration, we added an explanation to Tissue deformation by increased apical contractility with cellular Potts model section in the Results as below.

      P4L170: “A simulation started from a flat monolayer of cells beneath the apical ECM, and was continued until resulting deformation of cells and tissue could be evaluated for success of failure of reproducing the apical constriction.”

      For the parameter values we added a section “Parameters for the simulations” in the Methods.

      For the parameters unit conversion, we did not measure the surface tension and cell pressure in an actual tissue and thus could not compare the parameters to the actual forces. Instead, we varied the parameters and demonstrated that the apical constriction was reproduced with the wide range of the parameter values. We added it to the discussion as below.

      P12L310: “It succeeded with a wide range of parameter values, indicating a robustness of the model.”

      Reviewer #2 (Public Review):

      Summary:

      In their work, the authors study local mechanics in an invaginating epithelial tissue. The mostly computational work relies on the Cellular Potts model. The main result shows that an increased apical "contractility" is not sufficient to properly drive apical constriction and subsequent tissue invagination. The authors propose an alternative model, where they consider an alternative driver, namely the "apical surface elasticity".

      Strengths:

      It is surprising that despite the fact that apical constriction and tissue invagination are probably most studied processes in tissue morphogenesis, the underlying physical mechanisms are still not entirely understood. This work supports this notion by showing that simply increasing apical tension is perhaps not sufficient to locally constrict and invaginate a tissue.

      We thank the reviewer for recognizing the importance and novelty of our work.

      Weaknesses:

      The findings and claims in the manuscript are only partially supported. With the computational methodology for studying tissue mechanics being so well developed in the field, the authors could probably have done a more thorough job of supporting the main findings of their work.

      We thank the reviewer for the careful assessment and suggestions. However our simulation was computationally expensive, modeling the epithelium in an analytically calculable expression requires a lot of work, and it is beyond the scope of the present study.

      Recommendations for the authors:

      Reviewer #1 (Recommendations For The Authors):

      (1) Reference line 648: Correct the author's name (Pérez-González).

      We thank the reviewer and corrected the reference.

      (2) "Pale" colors are challenging to discern.

      We updated the figures.

      (3) Figure 1j: What does the yellow color in the cellular junction represent?

      We used the apical lateral site colored yellow in Fig. 1e-f’ to simulate the effect of the adherens junction. We updated the figure legend.

      (4) Figure 2c - left: Why is there a red apical junction?

      Our simulation model marked the apical junction in the initial configuration and updated the marking based on connectedness to surrounding other site marked as apical in the same cell. But when a cell was once delaminated and lost its apical junction, any surface site not adjacent to other epithelial cells were marked as basal junction because they were not adjacent to the apical junction.

      We added it to Cellular Potts model with partial surface elasticity section in the Methods as below.

      P17L430: “To simulate the differential phyisical properties of the apical, lateral, and basal surfaces, the subcellular locations are marked automatically, and the marking is updated during the simulation. In each cell, sites adjacent to different cells but not to the medium are marked as lateral.

      At the initial configuration, sites adjacent to the apical ECM are marked as apical, and during the simulation, sites adjacent to medium and other apical sites in the same cell are marked as apical.

      Rest of sites which are adjacent to medium but not marked as apical are marked as basal.

      Therefore, once a cell is delaminated and loses its apical surface, afterwards all sites in the cell adjacent to the medium are marked as basal even if it is adjacent to the apical ECM or the outer body fluid.”

      (5) Figure 4a: The snapshots are not in a steady state but in the middle of deformation. Is the time the same for all snapshots? The motivation to change P_0a is related to endocytosis. However, this could be achieved by decreasing P_0a to a non-zero value. Here, in the more drastic limit, the depth (a measure of bending) is very slight, approximately half of a cell size. What physically limits further invagination? Is it the number of cells or the range of parameters under study?

      The time length was the same for simulations in each figure, and we add it to Parameters for the simulations section in Method as below.

      P18L466: “In each figure, snapshots of the simulations show deformation by the same time length unless specified.”

      For P_0a, the reviewer is correct and the iterated ratcheting may decrease P_0a step by step instead of making it 0 immediately. Still, with P_a0 >0, the energy function and its derivative are both increasing with respect to the apical width as long as P_a > P_a0, and thus the apical shrinkage would be synchronized, even though the deformation would be smaller. We also run simulations by decreasing P_0a to 0.6 times the initial P_a, and observed smaller deformation as expected. On the other hand, the non-zero P_0a made the invagination deeper when it was combined with the effect of surrounding supracellular myosin cable, maybe due to a resistance of the apical surface against compression. One of the novel and important finding in this study is the synergetic effect of the elasticity-based apical constriction and the surrounding supracellular myosin cable. To demonstrate that the deep invagination was not due to the apical surface resistance against the compression, we showed the simulations with P_a0 = 0.

      For the conditions for further invagination, it may include the number of cells, a ratio between the cell height and width (Figure 5—figure supplement 1), interaction with ECM (Figure 5—figure supplement 2), etc. For the parameter, there might be an upper limit (Figure 4). We did not test the number of cells because of its computational cost. Among the conditions we tested, we found the planar compression by surrounding supracellular myosin the most influential rather than the mechanical property of apically constricting cells themselves.

      How each condition and parameter contributes to the invagination shall be studied in future. We added it to the conclusion as below.

      P15L395: “The depth, curvature, and speed of the invagination might be influenced by the cell shape, configuration, and parameters, and how each condition contributes to the invagination shall be studied in future.”

      (6) Figure 6b: What does the cell-surface color represent? If the idea was to represent junction tension, it would be clearer to color the junctions only.

      The junction tension may vary differently in different situations. For example, T1 transition is accompanied by enriched myosin along a shrinking cell-cell junction, and the junction bears higher tension, but other junctions of the same cell do not and thus the cell does not decrease its apical surface. In chick embryo neural tube closure, the junction tension is also polarized, and the cells shrink the apical surface along medial-lateral axis, driving the apical constriction (Nishimura et al., 2012, doi:10.1016/j.cell.2012.04.021). In the case of Drosophila embryo tracheal invagination, the cells shrank their apical surface isotropically (Figure 6a). If the junction tension was responsible for the shrinkage, all junctions of the cell must bear higher tension. Based on this assumption, the junction tension was averaged in each cell to check if the tracheal cells bore the higher average tension than surrounding cells.

      We also plotted stress tensor and calculated nematic order to check if there was radial or encircling tension alignment in the tracheal pit, but there was not.

      (7) Figure 6c: What does the junction color represent here?

      The junction color represent the relative junctional tension. We updated the figure legend.

      (8) Figure 6d-e: It is challenging to understand which error bar corresponds to each dataset.

      We updated the figure.

      (9) What is the definition of relative pressure?

      The geometrical tension inference method assumes that the tissue is in mechanical equilibrium and a sum of the junctional tensions and cell pressures pulling/pushing a vertex (tricellular junction) is 0. Therefore the calculated tensions and pressures are proportional to each other but not absolute values. We added it to the 3D Bayesian tension inference section of Methods as below.

      P24L567: “Since Equation 13 and Equation 14 only evaluate the balance among the forces, it cannot estimate an absolute value but a relative value of the tension and pressure.”

      (10) In the main text, it is mentioned that a large Es (apical elastic constant) leads to flat surfaces, avoiding bending, but the abstract says "strong apical surface tension," which, according to the rest of the text, would seem to be J_apical. Clarification is needed.

      The surface tension includes both of the surface contractility and the surface elasticity.

      We added it to Extended cellular Potts model to simulate epithelial deformations section in the Results as below.

      P3L122: “Note that in some studies the tension and the contractility are considered as equivalent, but they are distinguished in this study.”

      and

      P4L151: “The energy H included only the terms of the contact energy (Equation 1) and the area constraint (Equation 5), but the surface elasticity (Equation 2) nor (Equation 3) was not included, and thus the surface tension was determined by the contact energy.”

      Reviewer #2 (Recommendations For The Authors):

      (1) The model used is rather specific and it is rather confusing whether the issue is in the methodology or fundamental biophysics of apical constriction. For instance, one of the main narratives of the manuscript is that the Cellular Potts model better predicts apical constriction and tissue invagination than the vertex model. As I understand it, and as the authors state in p7 (line 210), "the difference between the vertex model and the cellular Potts model results was due to the straight lateral surface...". I assume that if apical constriction and tissue invagination were modelled with a vertex model with curved edges, while also allowing for cell rearrangements out of the tissue plane (some sort of epithelium-to-mesenchyme transition), the vertex model would yield exactly the same results as in the authors' cellular Potts model. If my understanding is correct, the authors should change the narrative of their manuscript and focus more on the comparison of a model with flat vs. curved edges, with "contractility" vs. "surface elasticity", with patterned apical contractility vs. non-patterned contractility (see my comment in point 2 below)... and not on comparison between CPM and VM.

      We appreciate the comments. The reviewers is correct that the vertex model can include the curved edges and the cell rearrangement, and it would reproduce the result of our cellular Potts model simulations. For the cellular Potts model, there was no need to specifically design how much the cell surface could be curved in a large arc, zigzag, or other shape, and that enabled us to find the conditions of delamination and bending.

      We added it to the discussion as below.

      P12L311: “Note that the vertex model could also be extended to incorporate the curved edges and rearrangement of the cells by specifically programming them, and would reproduce the cell delamination. That is, we could find the importance of the balanced pressure because the cellular Pott’s model intrinscally included a high degree of freedom for the cell shape, the cell rearrangement, and the fluctuation.”

      (2) About physics... and I think this is a really important point: one of the observations in the model was that in the "contractilty" model, only "edge cells" shrank its apical surface, while inner cells remained quadrilateral. Related to this, the authors say that one of the requirements for proper apical constriction is a mechanism that "simulataneously shrinks the apical surface among cells in a cluster". What would happen if the authors assumed patterned contractility, meaning that cells in the center of the cluster would be most apically-contractile, while those further away from the center, would not be contractile? Features like this were investigated in studies of ventral-furrow invagination [see, for instance, Spahn and Reuater PLOS ONE (2013) and Rauzi et al. Nat Commun (2015)-Fig. S13d].

      We thank the reviewer for the critical comment, and ran simulations with the patterned apical contractility. The apical contractility following a gradient of parabola shape succeeded in the simultaneous apical shrinkage. However, it was weak against fluctuations and the cells were delaminated by chance.

      We added it to Apical constriction by modified apical elasticity section in the result as below.

      P9L252: “We also tested another model for the simultaneous apical shrinkage, a gradient contractility model (Spahn and Reuter, 2013; Rauzi et al., 2015). If the inner cells bear higher apical surface contractility than the edge cells, that inner cells may shrink their apical surface. To synchronize the apical shrinkage, the apical contractility must follow a parabola shape gradient. Even though the gradient contractility enabled the cells to shrink the apical surface simultaneously, often some of the cells shrank faster than neighbors and were delaminated by chance (Figure 4—figure Supplement 1).”

      (3) The quality of the figures should be improved. Especially, Figure 3 and the related explanation in lines 183-192. This explanation is way too complicated and it is not clear what Figure 3c shows. For instance: if the arrows are indeed showing contractile forces (as written in the caption) then they are not illustrated correctly, but should be tangential to the cell membrane.

      We updated the figure.

      (4) The figures mostly show steady-state cross-sections from simulations. I miss a more dedicated study with model parameters being varied through wider ranges and some phase diagrams being shown etc. Also, some results could probably be supported by analytic calculations. For instance, the condition for stability (discussed in p4 lines 145-151), cells' preferred aspect ratio, cells' preferred "wedgeness" i.e., local curvature etc... I am sure some of these, if not all, could be calculated analytically and then these analytic results could help to interpret the phase diagrams.

      For the simulation results shown in the figures, we were not sure if the simulations results were in a steady state or not. We added it to Tissue deformation by increased apical contractility simulated with cellular Potts model section in the Results as below.

      P4L170: “A simulation started from a flat monolayer of cells beneath the apical ECM, and was continued until resulting deformation of cells and tissue could be evaluated for success of failure of reproducing the apical constriction.”

      For the ranges of parameters, we ran the simulation in wider range and showed results from sub-range. We added it to Parameters for the simulations section in Methods as below.

      P18L464: “The parameters were varied in a range, and the figures showed simulations with parameter values within a sub-range so that the results showed both success and failure in a development of interest.”

      For the analytical calculations, the Figure 3f shows a kind of phase diagram for shapes of a single cell. To clarify this, we rephrased “map of cell shapes” to “Phase diagram of cell shapes” in the figure legend, and added an explanation to the Results section as below.

      P6L207: “For the analysis of the cell shape in motion, we plotted a phase diagram for shapes of a single cell (Figure 3f).”

      For the analytical evaluation of the cellular Potts model simulations, there was a study doing similar but it concerned a cell of isotropic shape in a steady state (Magno et al., 2015, doi:10.1186/s13628-015-0022-x). Also, our simulation framework is computationally expensive and we could not vary the parameters in fine resolution. Therefore we could not include it in this study.

      (5) I am not sure about the terminology "contractility" vs. "elasticity". In Farhadifar et al. (2007) "contractility" is described by a squared apical-perimeter energy term, while in this work, the authors describe it by a surface-energy-like term.

      In general, elasticity is the ability of a material to resist against deformation and to return to its original shape/size. In Farhadifar et al. (2007), the cell apical area was assigned the area elasticity in this meaning. For the contractility, it is the ability to decrease the size/length, and thus it could be either expressed in linear or quadratic dependent on the modeling. In this study, we assumed cell-cell/cell-ECM adhesion and myosin activity to generate the surface contractility, and thus employed the linear expression. In Farhadifar et al. (2007) it was described as a line tension.

      We used the terms surface ‘elasticity’ and ‘contractility’ as distinctive elements composing the surface ‘tension’. We added it Extended cellular Potts model to simulate epithelial deformations section in the Results as below.

      P3L122: “Note that in some studies the tension and the contractility are considered as equivalent, but they are distinguished in this study.”

      (6) It is not entirely clear what are apical, basal, lateral, and cell "perimeters". This is a 2D model, so I assume all P-s are in fact interface lengths. In either case, this needs to be explained more clearly.

      We updated the explanation in Extended cellular Potts model to simulate epithelial deformations section in the Results as below.

      P3L111: “The cell's perimeter was partitioned automatically based on adjacency with other cells, and it was marked as apical, lateral, basal. Also, apico-lateral sites were marked as a location for the adherens junction. This cell representation also cast the vertical section of the cell. Therefore an area of the cell corresponded with a body of the cell, and a perimeter of the cell corresponded with the cell surface. Likewise the apical, lateral, and basal parts of the perimeter corresponded with the apical surface, cell-cell interface, and the basal surface of the cell respectively.”

      (7) The term H_{mc} is not clear at all. Why is this term called potential energy? What is U(i)? What is the exact biophysical interpretation of this term in 2D vs 3D?

      In 3D, the supracellular myosin cable is formed encircling the cells deformed by the apical constriction. Shrinking of the supracellular myosin cable makes the circle small, and it moves the cable toward the center of the circle. To simulate this motion of the supracellular myosin cable in the 2D cross section, we assigned the force exerted on the adherens junction of the boundary cells pulling toward the center, and because the force is relative to the position of the adherens junction and the center, it was expressed by the potential energy in the simulation.

      We updated Extended cellular Potts model to simulate epithelial deformation section in Results and Cellular Potts model with potential energy section in Methods as below.

      P4L140: “The potential energy was defined by a scalar field which made a horizontal gradient decreasing toward the center,”

      and

      P17L449: “In 3D, tension on a circular actomyosin cable would shrink the circle, and the shrinkage would pull the cable toward the center of the circle. In 2D cross section, the cable is pulled horizontally toward the middle line.”

      (8) Highten->increased

      We updated the text.

      (9) "It seems natural to consider that the myosin generates a force proportional to its density but not to the surface width nor the strain". This sentence should be supported by a reference. Also, if the force is proportional to myosin density, then it must depend on surface width, since density, I assume, is the number of motors per area.

      For the myosin density and generated force, in all preceding studies cited in this manuscript and others in the extent of our knowledge, the myosin and actin filaments density visualized by staining or labeling had been assumed relevant to the generated contractility without references. Therefore it might be well established and shared assumption.

      For the independence from the surface width and strain, the review comment is correct, but the results would be the same. If we presumed that the number of motors on the apical surface was constant in a cell during the apical constriction, then the density would increase when the apical surface was contracted, and thus it would make the apical contractility more unbalanced and promote the delamination. We added it to the results and discussion as below.

      P4L166: “For the sake of simplicity, we ignored an effect of the constriction on the apical myosin density, and discussed it later.”

      P14L328: “In our model, for the sake of simplicity, we ignored an effect of the constriction on the apical myosin density. If we presumed that the apical myosin would be condensed by the shrinkage of the apical surface, it would increase the apical tension in the shrinking cell and is expected to promote the cell delamination further. Therefore it would not change the results.”

      Reviewing Editor (Recommendations For The Authors):

      Please note also the following excerpts from discussions amongst the reviewers and the Reviewing Editor:

      Regarding Reviewer #2's Point 2:

      I believe the authors have assumed patterned contractility in their simulations, and this is shown by the "pale blue" cell color (see also lines 162-163). However, as Reviewer #2 points out in their point 2), the pale colors are very hard to see and therefore easy to miss.

      We updated figure coloring and also add the gradient pattern of contractility.

      Regarding Reviewer #2's point 5:

      It is indeed unconventional to call the "J" terms contractility, they are usually called contact energy or adhesive energy.

      In this study, we included both of the contact energy of cell-cell/cell-ECM adhesion and actomyosin activity in the surface contractility, and used the “J” term as it was conventional in the cellular Potts model.

      On the other hand, due to the parameters chosen for J_apical and J_basal in the pale blue cells, the apical membrane area will tend to shrink and the basal membrane will tend to enlarge. Because the lateral membrane energy J_lateral is constant among all cells (I think?), this will effectively drive cells to apically contract in the center.

      That expectation was an initial motivation of our study, but we found that the differential J alone could not drive the cells to apically contract in the center.

      I agree that extra clarification by the authors would be very helpful here.

      Reviewer #2:

      Regarding the patterned contractility: indeed, I missed this point (the pale blue region is really poorly visible).

      Nevertheless, it seems that contractility in the authors' model changes in a step-like fashion.

      [...] There may be important differences between furrowing under step-like patterning profile versus smooth "bell-like" patterning (see Supplementary Figure 13 in Rauzi et al. Nat Commun 2015). In particular, in the case of a step-like patterning, [there are] constrictions of side cells (similar to what the authors in this manuscript report), whereas in the bell-like patterning, [...] such side constrictions [do not occur].

      As replied to the reviewer #2 comment (2), we added the simulations with gradient-pattern contractility.

    1. Author response:

      The following is the authors’ response to the original reviews.

      We extend our sincere gratitude to the reviewers for their constructive feedback and valuable suggestions, which have significantly contributed to enhancing the quality of our work. In response to the comments, we have meticulously revised our manuscript with the following updates:

      (1) New Data Inclusion: We have incorporated new immunofluorescent staining images, FACS analysis of monocytes, and single-cell RNA sequencing (scRNAseq) expression analysis focusing on genes related to IFNGR, as well as T cell memory subsets (Trm, Tcm, and Tem).

      (2) Comparative Analysis: We have conducted a comparative analysis between the active vitiligo dFBs and the ACD pAd (r5) identified in our study, which provides further insight into the immune response mechanisms.

      (3) Discussion Expansion: We have expanded the discussion to include the role of tissue-resident memory (Trm) T cells in our model and have addressed the limitations of our animal model and in vitro studies.

      (4) Supplemental Material: As requested by the reviewers, we have provided four new supplemental tables (Table S2 ~ S5) and specific information for antibodies used in our study.

      Please see our Point-to-Point Responses to Reviewers' comments below:

      Public Reviews:

      Reviewer #1 (Public Review):

      Summary:

      In this manuscript, Liu et al. used scRNA-seq to characterize cell type-specific responses during allergic contact dermatitis (ACD) in a mouse model, specifically the hapten-induced DNFB model. Using the scRNA-seq data, they deconvolved the cell types responsible for the expression of major inflammatory cytokines such as IFNG (from CD4 and CD8 T cells), IL4/13 (from basophils), IL17A (from gd T cells), and IL1B from neutrophils and macrophages. They found the highest upregulation of a type 1 inflammatory response, centering around IFNG produced by CD4 and CD8 T cells. They further identified a subpopulation of dermal fibroblasts that upregulate CXCL9/10 during ACD and provided functional genetic evidence in their mouse model that disrupting IFNG signaling to fibroblasts decreases CD8 T cell infiltration and overall inflammation. They identify an increase in IFNG-expressing CD8 T cells in human patient samples of ACD vs. healthy control skin and co-localization of CD8 T cells with PDGFRA+ fibroblasts, which suggests this mechanism is relevant to human ACD. This mechanism is reminiscent of recent work (Xu et al., Nature 2022) showing that IFNG signaling in dermal fibroblasts upregulates CXCL9/10 to recruit CD8 T cells in a mouse model of vitiligo. Overall, this is a very wellpresented, clear, and comprehensive manuscript. The conclusions of the study are mostly well supported by data, but some aspects of the work could be improved by additional clarification of the identity of the cell types shown to be involved, including the exact subpopulation discovered by scRNA-seq and the subtype of CD8 T cell involved. The study was limited by its use of one ACD model (DNFB), which prevents an assessment of how broadly relevant this axis is. The human sample validation is slightly circumstantial and limited by the multiplexing capacity of immunofluorescence markers.

      Strengths:

      Through deep characterization of the in vivo ACD model, the authors were able to determine which cell types were expressing the major cytokines involved in ACD inflammation, such as IFNG, IL4/13, IL17A, and IL1B. These analyses are well-presented and thoughtful, showing first that the response is IFNG-dominant, then focusing on deeper characterization of lymphocytes, myeloid cells, and fibroblasts, which are also validated and complemented by FACS experiments using canonical markers of these cell types as well as IF staining. Crosstalk analyses from the scRNA-seq data led the authors to focus on IFNG signaling fibroblasts, and in vitro experiments demonstrate that CXCL9 and CXCL10 are expressed by fibroblasts stimulated by IFNG. In vivo functional genetic evidence demonstrates an important role for IFNG signaling in fibroblasts, as KO of Ifngr1 using Pdgfra-Cre Ifngr1 fl/fl mice, showed a reduction in inflammation and CD8 T cell recruitment.

      Weaknesses:

      (1) The use of one model limits an understanding of how broad this fibroblast-T cell axis is during ACD. However, the authors chose the most commonly employed model and cited additional work in a vitiligo model (another type 1 immune response).

      We thanks the reviewer for pointing out this limitation. Although the DNFB-elicited ACD model is the most commonly used animal model for ACD, our study is limited by the use of only one type 1 immune response model. We have now added new data (Figure 5-figure supplement 1A) showing that the active ACD pAd (r5) and the active IFNγ-responsive vitiligo dFBs (Xu et al., 2022) are enriched with a highly similar panel of IFNγ-inducible genes. Future studies are still needed to determine whether this fibroblast-T cell axis may be broadly applied to other ACD models or to other type-1 immune response-related inflammatory skin diseases.

      (2) The identity of the involved fibroblasts and T cells in the mouse model is difficult to assess as scRNA-seq identified subpopulations of these cell types, but most work in the Pdgfra-Cre Ifngr1 fl/fl mice used broad markers for these cell types as opposed to matched subpopulation markers from their scRNA-seq data.

      Thanks for the reviewer's constructive comments. To better showcase the dWAT layer where PDGFRA+ pAds are enriched, we have included new histological staining and PLIN1 (adipocyte marker) in new Figure 4 - figure supplement 1F-G. As shown in Figure 4 - figure supplement 1G, the PLIN1+ dWAT layer is located in the lower dermis right above the cartilage layer.  In Figure 4-figure supplement 1I and J, we have shown that phosphor-STAT1 (pSTAT1), a key signaling molecule activated by IFNγ, was detected primarily in PDGFRA+Ly6A+ pAds in the lower dermis where dWAT is located. In addition, we have now included new data showing that the pAd (dFB_r5) cluster preferentially expressed the highest levels of both Ifngr1 and Ifngfr2 among all dFB subclusters (new Figure 5 - figure supplement 1B). Furthermore, we have included new co-staining data showing that CXCL9 largely co-localized with ICAM1(new Figure 4 - figure supplement 1K), a marker for committed pAds (Merrick et al., 2019), in the reticular dermis and dWAT region of the ACD skin, further confirming that CXCL9 is specifically induced in the pAd subset of dFBs. Additionally, we included new staining data showing that ACD-mediated induction of CXCL9 in ICAM1+ dFBs were largely suppressed upon targeted deletion of Ifngr1 in Pdgfra+ dFBs (new Figure 6 - figure supplement 1D-E).

      (3) Human patient samples of ACD were co-stained with two markers at a time, demonstrating the presence of CD8+IFNG+ T cells, PDGFRA+CXCL10+ fibroblasts, and co-localization of PDGFRA+ fibroblasts and CD8+ T cells. However, no IF staining demonstrates co-expression of all 4 markers at once; thus, the human validation of co-localization of CD8+IFNG+ T cells and PDGFRA+CXCL10+ fibroblasts is ultimately indirect, although not a huge leap of faith. Although n=3 samples of healthy control and ACD samples are used, there is no quantification of any results to demonstrate the robustness of differences.

      Thanks for the reviewer’s constructive comments. We have shown that PDGFRA colocalizes with CXCL10, in the dermal micro-vascular structures, where CD8+ T cells infiltrate around PDGFRA+ dFBs. We are sorry that due to technical issues (antibody compatibility), we cannot provide the four color co-staining as suggested by the reviewers. In order to demonstrate the robustness and reproducibility of the staining presented, we have now supplemented 4 independent images for both Fig. 7A and Fig. 7E in the updated Figure 7-figure supplement 1A-B.

      Reviewer #2 (Public Review):

      Summary:

      The investigators apply scRNA seq and bioinformatics to identify biomarkers associated with DNFB-induced contact dermatitis in mice. The bioinformatics component of the study appears reasonable and may provide new insights regarding TH1-driven immune reactions in ACD in mice. However, the IF data and images of tissue sections are not clear and should be improved to validate the model.

      Strengths:

      The bioinformatics analysis.

      Weaknesses:

      The IF data presented in 4H, 6H, 7E and 7F are not convincing and need to be correlated with routine staining on histology and different IF markers for PDGFR. Some of the IF staining data demonstrates a pattern inconsistent with its target.

      We are sorry for the confusion, because 4H and 6H are staining on mouse skin sections, and 7E and 7F are staining on human skin sections, therefore the patterns of PDGFRA+ dFBs appeared inconsistent between species. As shown in Fig. 4H, in mouse skin, PDGFRA+CXCL9/10+ dFBs are located between the lower reticular dermis and dWAT region, where preadipocytes are located (Sun et al., 2023). To better showcase the dWAT layer where PDGFRA+ pAds are enriched, we have included new histological staining and PLIN1 (adipocyte marker) in new Figure 4 - figure supplement 1F-G. As shown in Figure 4 - figure supplement 1G, the PLIN1+ dWAT layer is located in the lower dermis right above the cartilage layer. Furthermore, we have included new co-staining data showing that CXCL9 largely co-localized with ICAM1(new Figure 4 - figure supplement 1K), a marker for committed pAds (Merrick et al., 2019), in the reticular dermis and dWAT region of the ACD skin, further confirming that CXCL9 is specifically induced in the pAd subset of dFBs.   

      As shown in Fig. 7E, in human skin, PDGFRA+CXCL10+ dFBs are located within the microvascular structures located at the dermal-epidermal junction (DEJ) region, where mesenchymal stem cells are enriched (Russell-Goldman & Murphy, 2020). We have included the corresponding HE histological staining image for Fig. 4H in new Figure 4-supplement 1F. Histological staining for Fig. 6H is the HE staining image in Fig. 6F. The histological staining for Fig. 7E and 7F is shown by Masson’s trichrome staining shown in Fig. 7C (a three-colour histological staining).

      Recommendations for the authors:

      Reviewer #1 (Recommendations For The Authors):

      Major comments:

      (1) While the focus on fibroblast and T cell interactions and overall biological findings regarding these interactions (IFNG - CXCL9/10 - CXCR3) is sound, it is slightly confusing about which exact subpopulations of these cells are involved in ACD pathogenesis as both scRNA-seq and IF are used but very broad markers are used for IF. Regarding fibroblasts, the scRNA-seq identifies the pAd (r5) cluster of fibroblasts as the main producer of CXCL9/10. However, the expression of IFNGR1 was not shown for this subpopulation as well as for other fibroblast subpopulations. Figure 6C shows IFNGR1 staining in the Ifngr1 fl/fl control mice which appears quite broad. With the seemingly broad expression of IFNGR1, why is it that only a subpopulation of fibroblasts upregulate CXCL9/10? Is there a specific location of these pAd fibroblasts that help drive this IFNG response? Please show the expression of Ifngr1 in the fibroblast scRNA-seq data.

      Thanks for the reviewer’s constructive comments. We have now included new data showing that the pAd (dFB_r5) cluster preferentially expressed higher levels of both Ifngr1 and Ifngfr2 among all dFB subclusters (new Figure 5 - figure supplement 1B). In addition, we included new co-staining data showing that CXCL9 largely co-localized with ICAM1, a marker for committed pAds (Merrick et al., 2019), in the reticular dermis and dWAT region of the ACD skin, further confirming that CXCL9 is specifically induced in the pAd subset of dFBs.

      (2) Regarding T cells, it is slightly confusing regarding what role the fibroblast-produced CXCL9/10 plays on T cell migration vs. activation. This is mainly because in vitro work focuses on T cell activation, while in vivo work seems to mainly assess T cell migration into the tissue. The in vivo studies have nicely shown that CD8 T cells are the main cell type affected by Ifngr1 iKO (i.e., a reduction of these cells), but T cell activity in vivo is not assessed (in the form of IFNG production). I have the following related questions:

      a. Authors do not discuss whether T cells involved in ACD in their model are tissue-resident memory T cells (Trm) or whether these are recruited from circulation. This may be possible to assess via additional analysis of the scRNA-seq data (looking for expression of Trm markers). 

      Thanks for the reviewer’s constructive comments. We have now included new data showing the expression of marker genes of various memory T cells in various T cell subclusters (new Figure 2 - figure supplement 1C-D). Antigen-specific CD8 or CD4 memory T cells can be classified into CD62hi/CCR7hi/CD28hi/CD27hi/CX3CR1lo central memory T cells (Tcm), CX3CR1hi/Cd28hi/Cd27lo/CD62lo/CCR7lo effector memory T cells (Tem), and CD49ahi/CD103hi/ CD69hi/BLIMP1hi tissue-resident memory T cells (Trm) (Benichou, Gonzalez, Marino, Ayasoufi, & Valujskikh, 2017; Cheon, Son, & Sun, 2023; Mackay et al., 2013; Martin & Badovinac, 2018; Park et al., 2023). We observed that in ACD skin, CD4+ and CD8+ T cells predominantly expressed marker genes associated with Tcm including Cd28, Cd27, Ccr7, and S1pr1/Cd62l. In contrast, marker genes associated with Tem (Cx3cr1) and Trm (Itga1/Cd49a, Itgae/Cd103, Cd69 and Prdm1/Blimp1, Cd127/Il7r) were only scarcely expressed in these αβ T cells, suggesting that ACD predominantly triggers a central memory T cell response in the skin.

      Furthermore, this hypothesis is supported by new lymph node gene expression results. We showed that the expression of Ifng, but not Il4 or Il17a, was rapidly induced in skin draining lymph nodes at 24 hours after ACD elicitation (new Figure 1-figure supplement 1H). This suggests a robust and systemic activation of type 1 memory T cell response in the early stage of ACD, and the migration of these lymphatic memory T cells to the skin may contribute to the exacerbation of skin inflammation.

      b. Authors have focused on CXCR3 axis involvement in IFNG production (Figures 5G-H) without assessing the presumed migratory role of this axis. Presumably, CD8 T cells are recruited to the skin via the CXCL9/10-CXCR3 axis, but this would be important to clarify given other work that has demonstrated Trm involvement in ACD. Authors should at least discuss how their model and findings support, refine, or even contradict the current paradigm of Trm involvement in ACD (Lefevre et al., 2021; PMID: 34155157).

      We are grateful for the constructive feedback provided by the reviewer. CXCR3 is a chemokine receptor on T cells and not only plays a pivotal role in the trafficking of type 1 T cells, but also is required for optimal generation of IFNG-secreting type 1 T cells in vivo (Groom et al., 2012). Our in vitro study is limited by only focusing on CXCL9/10-CXCR3 axis involvement in IFNγ production without studying its role in driving T cell migration. We have now addressed this limitation in the discussion section.

      In the murine model of ACD, the initial sensitization phase involves exposing mouse skin to a high dose of DNFB to prime effector T cells in lymphoid organs, and this is followed by a later challenge/elicitation phase, during which the mice are re-exposed to a lower dose of DNFB in a different area of the skin, distal from the original sensitization site (Manresa, 2021; Vocanson, Hennino, Rozieres, Poyet, & Nicolas, 2009). Our updated analysis of the expression of marker genes associated with central memory T cells (Tcm), effector memory T cells (Tem), and tissue-resident memory T cells (Trm), as presented in the revised Figure 2-figure supplement 1C-D, indicates that indicate that the type-1 inflammation observed upon ACD elicitation is predominantly driven by memory T cells recruited from lymphoid organs, rather than by skin resident memory T cells. We have read the reference provided by the reviewer along with a few other related studies indicating that Trm is involved in ACD. We found that these studies performed the elicitation phase on the same skin area where the initial sensitization is conducted, and only when it results in a rapid allergen-induced skin inflammatory response, that is primarily mediated by IL17A-producing and IFNγ-producing CD8+ skin resident memory T cells (Gadsboll et al., 2020; Murata & Hayashi, 2020; Schmidt et al., 2017; Wongchang et al., 2023). These studies suggest that Trm cells establish a long-lasting local memory during the initial sensitization, and upon re-exposure to the hapten in the same skin area, these site-specific Trm cells can rapidly contribute to a robust type-1 skin inflammatory response. Therefore, a robust involvement of Trm in ACD requires a repeated exposure of the same hapten to the same skin area. We have now added related discussion in the discussion section.

      c. While it may be difficult to assess given reduced numbers of CD8 T cells in the Ifngr1 iKO, is the CXCL9/10-CXCR3 axis affecting IFNG production by T cells in vivo?

      Yes, we have shown in Fig. 6G that ACD-mediated induction of Ifng was significantly suppressed in the Ifngr1-iKO mice compared to the control mice.

      (3) The authors cite prior work (Xu et al. Nature 2022) that demonstrated a similar mechanism for fibroblasts in recruiting vitiligo-inducing T cells. Are the pAd (r5) cluster of fibroblasts similar to the fibroblast subpopulation that drives vitiligo?

      The study on mouse model of vitiligo (Xu et al. Nature 2022) did not perform single-cell RNAseq of the vitiligo mouse skin. Instead, they conducted RNAseq analysis on the sorted PDGFRA+ dFBs. Therefore, we cannot directly compare our pAd (r5) cluster with the fibroblast subpopulation that drives vitiligo. Nevertheless, by utilizing a Venn diagram to compare the top 100 lFNγ signaling dependent genes upregulated in the active vitiligo mouse dFBs and the top 100 genes enriched in our ACD pAd (dFB_r5) cells, we identified 29 commonly upregulated genes between the two conditions (Figure 5-figure supplement 1A). Furthermore, all these 29 genes were among the top IFNγ-inducible genes in primary dFBs. These shared genes include CXCL9, CXCL10, and several other downstream targets of IFNγ signaling, such as B2M, BST2, CD274, as well as the GBP family members GBP3, GBP4, GBP5, GBP7, and additional genes like H2-K1, H2-Q4, H2-Q7, H2-T23, IFIT3, ISG15, and STAT1. This result suggests that the pAd (dFB_r5) cells possess a common IFNγ-pathway gene signature with the active vitiligo mouse dFBs, indicating a potential overlap in molecular pathways.

      (4) The authors should include bulk RNA-seq data from fibroblast stimulation (Figure 5b) at a minimum in the GEO submission. They should ideally include the differentially expressed genes in a supplementary table.

      Thanks for the reviewer’s constructive comments. We have now included the raw FPKM file for the bulk RNAseq data shown in Fig. 5 in Supplemental Table S3, and the list for differentially expressed genes in Supplemental Table S4.

      (5) The authors state that human sample stainings were n = 3 per group for healthy control and ACD (Figure 7), but no quantification or statistical testing is provided to demonstrate significant differences in findings such as co-localization of fibroblasts and T cells, IFNG+CD8+ T cells, etc.

      Thanks for the reviewer’s constructive comments. We have now supplemented 4 independent images for both Fig. 7A and Fig. 7E in the new Figure 7-figure supplement 1A-B to demonstrate the robustness and reproducibility of the staining presented.

      Minor comments:

      (1) Figure 1G, possible typos, Il14 and Il11b are on the violin plots when I believe authors meant Il4 and Il1b.

      Thank a lot for pointing out these typos. We have now made the correction in the updated manuscript figure 1.

      (2) The authors label cluster 27 as neutrophils based on the expression of Ly6g and S100a8. These markers are also expressed by Cd14+ inflammatory monocytes. I believe the authors need to additionally validate that these cells are neutrophils (via staining or additional analyses). Neutrophils are notoriously difficult to capture in scRNA-seq given low RNA content. Later, they are quantified by FACS using CD11b+Ly6G+ markers, but I do not believe this would distinguish them from CD14+ monocytes. As this is a relatively minor aspect of the manuscript, I consider this a minor concern, but a finding that should be as accurate as possible as Il1b is likely important, and identifying its accurate source likewise.

      Thanks a lot for reviewer’s constructive comments. According to the reviewer’s suggestion, we have now added Cd14 expression in Figure 1C, and found that indeed cluster 27 express not only expressed Ly6G but also expressed Cd14. Based on literatures, the expression of Ly6G in circulating blood, spleen, and peripheral tissues is limited to neutrophils, whereas monocytes, macrophages, and lymphocytes are negative of Ly6G (Ikeda et al., 2023; Lee, Wang, Parisini, Dascher, & Nigrovic, 2013). Therefore, Ly6G can be used as a marker to distinguish neutrophils and monocytes. Although CD14 is highly expressed in monocytes, neutrophils can also express CD14 at lower level (Antal-Szalmas, Strijp, Weersink, Verhoef, & Van Kessel, 1997). Therefore, the cluster 27 is likely a mixed population of neutrophils and monocytes. So we have changed the definition of this cluster as NEU/Mon in the updated manuscript.

      To confirm the presence of neutrophils and monocytes in ACD, we have included new FACS analysis of inflammatory monocytes, which are gated as CD11B+Ly6G-F4/80-CD11C-Ly6Chi, according to published FACS protocol(Rose, Misharin, & Perlman, 2012). We found that elicitation of ACD led to a transient influx of monocytes at 24 hrs post treatment, whereas the percentage of neutrophils continued to increase by 60 hours post-treatment (Figure 3L, and Figure 3-figure supplement 1G). In addition, at 60 hrs, the percentage of neutrophils (~5%) was > 10 times greater than the percentage of monocytes (~0.4%), indicating that neutrophils are the dominant granulocytes at 60 hours post ACD elicitation.

      (3) The authors should include a cluster marker table as a supplementary file to accompany Figure 1C. Only top cluster markers are shown in 1C.

      Thanks a lot for reviewer’s constructive comments. We have now included the top 5 enriched genes in each cell clusters shown in Fig. 1C in supplementary Table S2.

      (4) Figures 2A/B have mismatched labels. There is a gdT/ILC2 label in the 2B, but not in 2A. Please match these. Along these lines, which gdT cluster is the IL17A expressing cluster as shown in 1D? Matching these labels will clarify which population is doing what.

      Thanks a lot for reviewer to point out this mistake. To avoid confusion about the T cell clusters, we have added a specific recluster# for the T cell clusters as r0~r7 (Figure 2A-B). The r4 cluster is a mixed population of δγT and ILC2, therefore termed as δγT/ILC2. As shown in Figure 2-figure supplement 1E, IL17A is primarily expressed in the δγT cell (r5). We have now corrected δγT2 to δγT/ILC2 throughout the manuscript. To avoid confusion, we have now added cluster # in updated Figure 2D.

      (5) In Figure 3E, the authors used CD11B as a distinguishing marker for basophils (CD11B+) vs. mast cells (CD11B-). Mcpt8 is a better distinguishing marker, so I am wondering why the authors chose CD11B.

      Thanks a lot for reviewer’s comments. In scRNAseq, we did use Mcpt8 as a basophil specific marker to distinguish basophils and mast cells (see Figure 1C). However, Mcpt8 is not a surface receptor that can be used in FACS analysis. Therefore, to distinguish basophils from mast cells by FACS, we have to choose surface markers expressed on these cells. FcεR1a is a highly specific markers expressed exclusively on basophils and mast cells, and CD11B is expressed on basophils but not in mature mast cells (Hamey et al., 2021). As a result, FACS analysis of the surface expression of CD11B and FceR1a can distinguish basophils (CD11B+ FcεR1a+) from mast cells (CD11B- FcεR1a+). The use of CD11B and FcεR1a to distinguish basophils and mast cells can also been see in a published reference study (Arinobu et al., 2005).

      (6) Antibody information is missing for IF studies. No clones, catalog numbers, vendors, RRIDs, or dilutions are included in the Methods section for any of the IF data.

      Thanks a lot for reviewer’s constructive comments. We have now added related information for all the antibodies we used for FACS or IF data in the method section.

      (7) Figure 3 supplement E and F appear to be reversed based on legend descriptions.

      Thank a lot for pointing this out. We have now made the correction in the updated Supplementary file.

      References:

      Antal-Szalmas, P., Strijp, J. A., Weersink, A. J., Verhoef, J., & Van Kessel, K. P. (1997). Quantitation of surface CD14 on human monocytes and neutrophils. J Leukoc Biol, 61(6), 721-728. doi:10.1002/jlb.61.6.721

      Arinobu, Y., Iwasaki, H., Gurish, M. F., Mizuno, S., Shigematsu, H., Ozawa, H., . . . Akashi, K. (2005). Developmental checkpoints of the basophil/mast cell lineages in adult murine hematopoiesis. Proc Natl Acad Sci U S A, 102(50), 18105-18110. doi:10.1073/pnas.0509148102

      Benichou, G., Gonzalez, B., Marino, J., Ayasoufi, K., & Valujskikh, A. (2017). Role of Memory T Cells in Allograft Rejection and Tolerance. Front Immunol, 8, 170. doi:10.3389/fimmu.2017.00170

      Cheon, I. S., Son, Y. M., & Sun, J. (2023). Tissue-resident memory T cells and lung immunopathology. Immunol Rev, 316(1), 63-83. doi:10.1111/imr.13201

      Gadsboll, A. O., Jee, M. H., Funch, A. B., Alhede, M., Mraz, V., Weber, J. F., . . . Bonefeld, C. M. (2020). Pathogenic CD8(+) Epidermis-Resident Memory T Cells Displace Dendritic Epidermal T Cells in Allergic Dermatitis. J Invest Dermatol, 140(4), 806-815 e805. doi:10.1016/j.jid.2019.07.722

      Groom, J. R., Richmond, J., Murooka, T. T., Sorensen, E. W., Sung, J. H., Bankert, K., . . . Luster, A. D. (2012). CXCR3 chemokine receptor-ligand interactions in the lymph node optimize CD4+ T helper 1 cell differentiation. Immunity, 37(6), 1091-1103. doi:10.1016/j.immuni.2012.08.016

      Hamey, F. K., Lau, W. W. Y., Kucinski, I., Wang, X., Diamanti, E., Wilson, N. K., . . . Dahlin, J. S. (2021). Single-cell molecular profiling provides a high-resolution map of basophil and mast cell development. Allergy, 76(6), 1731-1742. doi:10.1111/all.14633

      Ikeda, N., Kubota, H., Suzuki, R., Morita, M., Yoshimura, A., Osada, Y., . . . Asano, K. (2023). The early neutrophil-committed progenitors aberrantly differentiate into immunoregulatory monocytes during emergency myelopoiesis. Cell Rep, 42(3), 112165. doi:10.1016/j.celrep.2023.112165

      Lee, P. Y., Wang, J. X., Parisini, E., Dascher, C. C., & Nigrovic, P. A. (2013). Ly6 family proteins in neutrophil biology. J Leukoc Biol, 94(4), 585-594. doi:10.1189/jlb.0113014

      Mackay, L. K., Rahimpour, A., Ma, J. Z., Collins, N., Stock, A. T., Hafon, M. L., . . . Gebhardt, T. (2013). The developmental pathway for CD103(+)CD8+ tissue-resident memory T cells of skin. Nat Immunol, 14(12), 1294-1301. doi:10.1038/ni.2744

      Manresa, M. C. (2021). Animal Models of Contact Dermatitis: 2,4-Dinitrofluorobenzene-Induced Contact Hypersensitivity. Methods Mol Biol, 2223, 87-100. doi:10.1007/978-1-0716-1001-5_7

      Martin, M. D., & Badovinac, V. P. (2018). Defining Memory CD8 T Cell. Front Immunol, 9, 2692. doi:10.3389/fimmu.2018.02692

      Merrick, D., Sakers, A., Irgebay, Z., Okada, C., Calvert, C., Morley, M. P., . . . Seale, P. (2019). Identification of a mesenchymal progenitor cell hierarchy in adipose tissue. Science, 364(6438). doi:10.1126/science.aav2501

      Murata, A., & Hayashi, S. I. (2020). CD4(+) Resident Memory T Cells Mediate Long-Term Local Skin Immune Memory of Contact Hypersensitivity in BALB/c Mice. Front Immunol, 11, 775. doi:10.3389/fimmu.2020.00775

      Park, S. L., Christo, S. N., Wells, A. C., Gandolfo, L. C., Zaid, A., Alexandre, Y. O., . . . Mackay, L. K. (2023). Divergent molecular networks program functionally distinct CD8(+) skin-resident memory T cells. Science, 382(6674), 1073-1079. doi:10.1126/science.adi8885

      Rose, S., Misharin, A., & Perlman, H. (2012). A novel Ly6C/Ly6G-based strategy to analyze the mouse splenic myeloid compartment. Cytometry A, 81(4), 343-350. doi:10.1002/cyto.a.22012

      Russell-Goldman, E., & Murphy, G. F. (2020). The Pathobiology of Skin Aging: New Insights into an Old Dilemma. Am J Pathol, 190(7), 1356-1369. doi:10.1016/j.ajpath.2020.03.007

      Schmidt, J. D., Ahlstrom, M. G., Johansen, J. D., Dyring-Andersen, B., Agerbeck, C., Nielsen, M. M., . . . Bonefeld, C. M. (2017). Rapid allergen-induced interleukin-17 and interferon-gamma secretion by skin-resident memory CD8(+) T cells. Contact Dermatitis, 76(4), 218-227. doi:10.1111/cod.12715

      Sun, L., Zhang, X., Wu, S., Liu, Y., Guerrero-Juarez, C. F., Liu, W., . . . Zhang, L. J. (2023). Dynamic interplay between IL-1 and WNT pathways in regulating dermal adipocyte lineage cells during skin development and wound regeneration. Cell Rep, 42(6), 112647. doi:10.1016/j.celrep.2023.112647

      Vocanson, M., Hennino, A., Rozieres, A., Poyet, G., & Nicolas, J. F. (2009). Effector and regulatory mechanisms in allergic contact dermatitis. Allergy, 64(12), 1699-1714. doi:10.1111/j.1398-9995.2009.02082.x

      Wongchang, T., Pluangnooch, P., Hongeng, S., Wongkajornsilp, A., Thumkeo, D., & Soontrapa, K. (2023). Inhibition of DYRK1B suppresses inflammation in allergic contact dermatitis model and Th1/Th17 immune response. Sci Rep, 13(1), 7058. doi:10.1038/s41598-023-34211-x

      Xu, Z., Chen, D., Hu, Y., Jiang, K., Huang, H., Du, Y., . . . Chen, T. (2022). Anatomically distinct fibroblast subsets determine skin autoimmune patterns. Nature, 601(7891), 118-124. doi:10.1038/s41586-021-04221-8

    1. Author response:

      The following is the authors’ response to the original reviews.

      Main points:

      (1) We have added data for fructose in Fig. 1

      (2) We have added sta1s1cs (red stars and NS) comparing Tp between fed and refed flies. 

      (3) We have modified the figure for each point to the opened small circles.

      (4) We have moved the data from Fig. S3 to Fig. 2 and 3.

      (5) We have added the schema1c diagrams depic1ng behavioral assay in Fig. S1.

      (6) We have added heatmaps for WT and Gr64f-Gal4>UAS-CsChrimson flies in Fig. S2.

      (7) We have added Orco1 mutant data in Fig. S4.

      Public Reviews:

      Reviewer #1 (Public Review):

      Summary:

      This paper presents valuable findings that gustation and feeding state influence the preferred environmental temperature preference in flies. Interestingly, the authors showed that by refeeding starved animals with the non-nutritive sugar sucralose, they are able to tune their preference towards a higher temperature in addition to nutrient-dependent warm preference. The authors show that temperature-sensing and sweet-sensing gustatory neurons (SGNs) are involved in the former but not the latter. In addition, their data indicate that pep3dergic signals involved in internal state and clock genes are required for taste-dependent warm preference behavior.

      The authors made an analogy of their results to the cephalic phase response (CPR) in mammals where the thought, sight, and taste of food prepare the animal for the consumption of food and nutrients. They further linked this behavior to core regulatory genes and peptides controlling hunger and sleep in flies having homologues in mammals. These valuable behavioral results can be further inves3gated in flies with the advantage of being able to dissect the neural circuitry underlying CPR and nutrient homeostasis.

      Strengths: 

      (1) The authors convincingly showed that tasting is sufficient to drive warm temperature preference behavior in starved flies and that it is independent of nutrient-driven warm preference. 

      (2) By using the genetic manipulation of key internal sensors and genes controlling internal feeding and sleep states such as DH44 neurons and the per genes for example, the authors linked gustation and temperature preference behavior control to the internal state of the animal. 

      Weaknesses: 

      (1) The title is somewhat misleading, as the term homeostatic temperature control linked to gustation only applies to starved flies. 

      We agree with the reviewer's suggestion and have changed the title to "Taste triggers a homeostatic temperature control in hungry flies".

      (2) The authors used a temperature preference assay and refeeding for 5 minutes, 10 minutes, and 1 hour.

      Experimentally, it makes a difference if the flies are tested immediately after 10 minutes or at the same 3me point as flies allowed to feed for 1 hour. Is 10 minutes enough to change the internal state in a nutrition-dependent manner? Some of the authors' data hint at it (e.g. refeeding with fly food for 10 minutes), but it might be relevant to feed for 5/10 minutes and wait for 55/50min to do the assays at comparable time points. 

      Thank you for your suggestions. The temperature preference behavioral test itself takes 30 minutes from the time the flies are placed in the apparatus until the final choice is made. This means that after the hungry flies have been refed for 5 minutes, they will determine their preferred temperature within 35 minutes. It has been shown that insulin levels peak at 10 minutes and gradually decline (Tsao, et al., PLoS Genetics 2023). However, it is unclear how subtle insulin levels affect behavior and how quickly the flies are able to consume food. These factors may contribute to temperature preference in flies. Therefore, to minimize "extraneous" effects, we decided to test the behavioral assay immediately after they had eaten the food. We have noted in the material and method section that why we chose the condition based on behavior duration and insulin effect. 

      (3) A figure depicting the temperature preference assay in Figure 1 would help illustrate the experimental approach. It is also not clear why Figure 1E is shown instead of full statistics on the individual panels shown above (the data is the same). 

      We have revised Figure 1A and added statistics in Figure 1BCD. We also added a figure depicting the temperature preference assay (Fig. S1).

      (4) The authors state that feeding rate and amount were not changed with sucralose and glucose. However, the FLIC assay they employed does not measure consumption, so this statement is not correct, and it is unclear if the intake of sucralose and glucose is indeed comparable. This limits some of the conclusions. 

      We agree and removed “amount” and have revised the MS. 

      (5) The authors make a distinction between taste-induced and nutrient-induced warm preference. Yet the statistics in most figures only show the significance between the starved and refed flies, not the fed controls. As the recovery is in many cases incomplete and used as a distinction of nutritive vs nonnutritive signals (see Figure 1E) it will be important to also show these additional statistics to allow conclusions about how complete the recovery is. 

      We agree with the comments and have revised the MS and figures. 

      (6) The starvation period used is ranging from 1 to 3 days, as in some cases no effect was seen upon 1 day of starvation (e.g. with clock genes or temperature sensing neurons). While the authors do provide a comparison between 18-21 and 26-29 hours old flies in Figure S1, a comparison for 42-49 and 66-69 hours of starvation is missing. This also limits the conclusion as the "state" of the animal is likely quite different after 1 day vs. 3 days of starvation and, as stated by the authors, many flies die under these conditions.  

      We mainly used 2 overnights of starvation.  Some flies (e.g. Ilp6 mutants) were completely healthy even after 2 overnights of starvation, we had to starve them for 3 overnights. For example, Ilp6 mutants needed 3 overnights of starvation to show a significant difference Tp between fed and starved flies. On the other hand, some flies (e.g. w1118 control flies) were very sick after 2 overnights of starvation, we had to starve them for one overnight. Therefore, the starvation conditions which we used for this manuscript are from 1- 3-overnights.

      First, we confirmed the starvation time by focusing on Tp which resulted in a sta1s1cally significant Tp difference between fed and starved flies; as men1oned above, flies prefer lower temperatures when starvation is prolonged (Umezaki et al., Current Biology 2018). Therefore, if Tp was not statistically different between fed and starved flies, we extended the starva1on 1me from 1 to 3 overnights. Importantly, we show in Fig. S3 that the dura1on of starvation did not affect the recovery effect. Furthermore, since control flies do not survive 42-49 or 66-69 hours of starvation, we can not test the reviewer's suggestion. We have carefully documented the conditions in the Material and method and figure legends.

      (7) In Figure 2, glucose-induced refeeding was not tested in Gr mutants or silenced animals, which would hint at post-ingestive recovery mechanisms related to nutritional intake. This is only shown later (in Figure S3) but I think it would be more fitting to address this point here. The data presented in Figure S3 regarding the taste-evoked vs nutrient-dependent warm preference is quite important while in some parts preliminary. It would nonetheless be justified to put this data in the main figures. However, some of the conclusions here are not fully supported, in part due to different and low n numbers, which due to the inherent variability of the behavior do not allow statistically sound conclusions. The authors claim that sweet GRNs are only involved in taste-induced warm preference, however, glucose is also nutritive but, in several cases, does not rescue warm preference at all upon removal of GRN function (see Figures S3A-C). This indicates that the Gal4 lines and also the involved GRs are potentially expressed in tissues/neurons required for internal nutrient sensing. 

      Thank you for your suggestion. We have added Figure S3ABC (glucose refeeding using Gr mutants and silenced animals) to Figure 2. There is no low N number since we tested > 5 times, i.e. >100 flies were tested. Tp may have a variation probably due to the effect of starvation on their temperature preference. 

      We did not mention that "The authors claim that sweet GRNs are only involved in taste-induced warm preference...". However, our wri1ng may not be clear enough. We agree that "...GRs may be expressed in tissues/neurons required for internal nutrient sensing. ..."  We have rewritten and revised the section.  

      (8) In Figure 4, fly food and glucose refeeding do not fully recover temperature preference after refeeding. With the statistical comparison to the fed control missing, this result is not consistent with the statement made in line 252. I feel this is an important point to distinguish between state-dependent and taste/nutrition-dependent changes.  

      We inserted the statistics and compared between Fed and other conditions. 

      (9) The conclusion that clock genes are required for taste-evoked warm preference is limited by the observation that they ingest less sucralose. In addition, the FLIC assay does not allow conclusions about the feeding amount, only the number of food interactions. Therefore, I think these results do not allow clear-cut conclusions about the impact of clock genes in this assay.  

      We agree and remove “amount” and have revised the MS. The per01 mutants ate (touched) sucralose more often than glucose. On the other hand, 1m01 mutants ate glucose more often than sucralose (Figure S6BC). However, these mutants s1ll showed a similar TP pattern for sucralose and glucose refeeding (Fig. 5CD). The results suggest that the 1m01 flies eat enough amount of sucralose over glucose that their food intake does not affect the TP behavioral phenotype. We have rewritten and revised the section.

      (10) CPR is known to be influenced by taste, thought, smell, and sight of food. As the discussion focused extensively on the CPR link to flies it would be interesting to find out whether the smell and sight of food also influence temperature preference behavior in animals with different feeding states.  

      We have added the data using Olfactory receptor co-receptor (Orco1) mutant, which lack olfaction, in Fig. S4. They failed to show the taste-evoked warm preference, but exhibited the nutrient-induced warm preference. Therefore, the data suggest that olfactory detection is also involved in taste-evoked warm preference. On the other hand, "seeing food" is probably more complicated, since light dramatically affects temperature preference behavior and the circadian clock that regulates temperature preference rhythms. Therefore, it will not be unlikely to draw a solid conclusion from the short set of experiments. We will address this issue in the next study.

      (11) In the discussion in line 410ff the authors claim that "internal state is more likely to be associated with taste-evoked warm preference than nutrient-induced warm preference." This statement is not clear to me, as neuropeptides are involved in mediating internal state signals, both in the brain itself as well as from gut to brain. Thus, neuropeptidergic signals are also involved in nutrient-dependent state changes, the authors might just not have identified the peptides involved here. The global and developmental removal of these signals also limits the conclusions that can be drawn from the experiments, as many of these signals affect different states, circuits, and developmental progression.  

      We agree with the comments. We have removed the sentences and revised the MS.  

      Reviewer #2 (Public Review): 

      Animals constantly adjust their behavior and physiology based on internal states. Hungry animals, desperate for food, exhibit physiological changes immediately upon sensing, smelling, or chewing food, known as the cephalic phase response (CPR), involving processes like increased saliva and gastrointestinal secretions. While starvation lowers body temperature, the mechanisms underlying how the sensation of food without nutrients induces behavioral responses remain unclear. Hunger stress induces changes in both behavior and physiological responses, which in flies (or at least in Drosophila melanogaster) leads to a preference for lower temperatures, analogous to the hunger-driven lower body temperature observed in mammals. In this manuscript, the authors have used Drosophila melanogaster to investigate the issue of whether taste cues can robustly trigger behavioral recovery of temperature preference in starving animals. The authors find that food detection triggers a warm preference in flies. Starved flies recover their temperature preference after food intake, with a distinction between partial and full recovery based on the duration of refeeding. Sucralose, an artificial sweetener, induces a warm preference, suggesting the importance of food-sensing cues. The paper compares the effects of sucralose and glucose refeeding, indicating that both taste cues and nutrients contribute to temperature preference recovery. The authors show that sweet gustatory receptors (Grs) and sweet GRNs (Gustatory Receptor Neurons) play a crucial role in taste-evoked warm preference. Optogenetic experiments with CsChrimson support the idea that the excitation of sweet GRNs leads to a warm preference. The authors then examine the internal state's influence on taste-evoked warm preference, focusing on neuropeptide F (NPF) and small neuropeptide F (sNPF), analogous to mammalian neuropeptide Y. Mutations in NPF and sNPF result in a failure to exhibit taste-evoked warm preference, emphasizing their role in this process. However, these neuropeptides appear not to be critical for nutrient-induced warm preference, as indicated by increased temperature preference during glucose and fly food refeeding in mutant flies. The authors also explore the role of hunger-related factors in regula3ng taste-evoked warm preference. Hunger signals, including diuretic hormone (DH44) and adipokinetic hormone (AKH) neurons, are found to be essential for taste-evoked warm preference but not for nutrient-induced warm preference. Additionally, insulin-like peptides 6 (Ilp6) and Unpaired3 (Upd3), related to nutritional stress, are identified as crucial for taste-evoked warm preference. The investigation then extends into circadian rhythms, revealing that taste-evoked warm preference does not align with the feeding rhythm. While flies exhibit a rhythmic feeding pattern, taste-evoked warm preference occurs consistently, suggesting a lack of parallel coordination. Clock genes, crucial for circadian rhythms, are found to be necessary for taste-evoked warm preference but not for nutrient-induced warm preference. 

      Strengths: 

      A well-written and interesting study, investigating an intriguing issue. The claims, none of which to the best of my knowledge controversial, are backed by a substantial number of experiments. 

      Weakness: 

      The experimental setup used and the procedures for assessing the temperature preferences of flies are rather sparingly described. Additional details and data presentation would enhance the clarity and replicability of the study. I kindly request the authors to consider the following points: 

      i) A schematic drawing or diagram illustrating the experimental setup for the temperature preference assay would greatly aid readers in understanding the spatial arrangement of the apparatus, temperature points, and the positioning of flies during the assay. The drawing should also be accompanied by specific details about the setup (dimensions, material, etc). 

      Thank you for your suggestions. We have added the schematic drawing in Fig. S1.

      ii) It would be beneficial to include a visual representation of the distribution of flies within the temperature gradient on the apparatus. A graphical representation, such as a heatmaps or histograms, showing the percentage of flies within each one-degree temperature bin, would offer insights into the preferences and behaviors of the flies during the assay. In addition to the detailed description of the assay and data analysis, the inclusion of actual data plots, especially for key findings or representative trials, would provide readers with a more direct visualization of the experimental outcomes. These additions will not only enhance the clarity of the presented information but also provide the reader with a more comprehensive understanding of the experimental setup and results. I appreciate the authors' attention to these points and look forward to the potential inclusion of these elements in the revised manuscript. 

      Thank you for the advice. We have added the heat map for WT and Gr64fGal4>CsChrimson data in Fig. S2. 

      Reviewer #3 (Public Review): 

      Summary: 

      The manuscript by Yujiro Umezaki and colleagues aims to describe how taste stimuli influence temperature preference in Drosophila. Under starvation flies display a strong preference for cooler temperatures than under fed conditions that can be reversed by refeeding, demonstrating the strong impact of metabolism on temperature preference. In their present study, Umezaki and colleagues observed that such changes in temperature preference are not solely triggered by the metabolic state of the animal but that gustatory circuits and peptidergic signalling play a pivotal role in gustation-evoked alteration in temperature preference. 

      The study of Umezaki is definitively interesting and the findings in this manuscript will be of interest to a broad readership. 

      Strengths: 

      The authors demonstrate interesting new data on how taste input can influence temperature preference during starvation. They propose how gustatory pathways may work together with thermosensitive neurons, peptidergic neurons and finally try to bridge the gap between these neurons and clock genes. The study is very interesting and the data for each experiment alone are very convincing. 

      Weaknesses: 

      In my opinion, the authors have opened many new questions but did not fully answer the initial question - how do taste-sensing neurons influence temperature preferences? What are the mechanisms underlying this observation? Instead of jumping from gustatory neurons to thermosensitive neurons to peptidergic neurons to clock genes, the authors should have stayed within the one question they were asking at the beginning. How does sugar sensing influence the physiology of thermos-sensation in order to change temperature preference? Before addressing all the following question of the manuscript the authors should first directly decipher the neuronal interplay between these two types of neurons. 

      Recommendations for the authors:

      Reviewer #1 (Recommendations For The Authors): 

      Figure S3D is cited before S2, so please rearrange the numbering.

      Thank you. We have changed the numbering.

      I would also suggest a different color to visualize the data points in Figure S3, as some are barely visible on the dark bars (e.g. on a dark green background). 

      We have revised the figures. The data points were changed to smaller opened circles. 

      Reviewer #2 (Recommendations For The Authors): 

      *Please, expand on the experimental procedure, and describe the assay in detail. 

      We have added a scheme for the assay in Fig. S1 and also have revised the manuscript and figures.

      *Show the distribution of the gradient data that the preference values are based upon. Not necessarily for all, but for select key experiments. Heatmaps for each replicate (stacked on top of each other) would be a nice way of showing this. Simple histograms would of course work as well. 

      We have added heatmaps of selected key experiments that were added in Fig. S2. We have revised the manuscript and figures, correspondingly.

      Reviewer #3 (Recommendations For The Authors  

      The manuscript by Yujiro Umezaki and colleagues aims at describing how taste stimuli influence temperature preference in Drosophila. Under starvation, flies display a strong preference for cooler temperatures than under-fed conditions that can be reversed by refeeding, demonstrating the strong impact of metabolism on temperature preference. In their present study, Umezaki and colleagues observed that such changes in temperature preference are not solely triggered by the metabolic state of the animal but that gustatory circuits play a pivotal role in temperature preference. The study of Umezaki is definitively interesting and the findings in this manuscript will be of interest to a broad readership. However, I would like to draw the authors' attention to some points of concern: 

      The title to me sounds somehow inadequate. The definition of homeostasis (Cambridge Dictionary) is as follows: "the ability or tendency of a living organism, cell, or group to keep the conditions INSIDE it the same despite any changes in the conditions around it, or this state of internal balance". What do the authors mean by homeostatic temperature control? Reading the title not knowing much about poikilotherm insects I would understand that the authors claim that Drosophila can indeed keep a temperature homeostasis as mammals do. As Drosophila is not a homoiotherm animal and thus cannot keep its body temperature stable the title should be amended.  

      Homeostasis means a state of balance between all the body systems necessary for the body to survive and function properly. Drosophila are ectotherms, so the source of temperature comes from the environment, and their body temperature is very similar to that of their environment. However, the flies' temperature regulation is not simply a passive response to temperature. Instead, they actively seek a temperature based on their internal state. We have shown that the preferred temperature increases during the day and decreases during the night, showing a circadian rhythm of temperature preference (TPR). Because their environmental temperature is very close to their body temperature, TPR gives rise to body temperature rhythms (BTR). We have shown that TPR is similar to BTR in mammals. (Kaneko et al., Current Biology 2012 and Goda et al., JBR 2023). Similarly, we showed that the hungry flies choose a lower temperature so that the body temperature is also lower. Therefore, our data suggest that the fly maintains its homeostasis by using the environmental temperature to adjust its body temperature to an appropriate temperature depending on its internal state. Therefore, I would like to keep the title as "Taste triggers a homeostatic temperature control in hungry flies" We have added more explana1on in the Introduc1on and Discussion.

      Accordingly, the authors compare the preference of flies to cooler temperatures to the reduced body temperature of mammals (Lines 64 - 65). However, according to the cited literature the reduced body temperature in starved rats is discussed to reduce metabolic heat production (Sakurada et al., 2000). The authors should more rigorously give a short summary of the findings in the cited papers and the original interpretation to help the reader not get confused.

      In flies, it has been shown that a lower temperature means a lower metabolic rate, and a higher temperature means a higher metabolic rate. Therefore, hungry flies choose a lower temperature where their metabolic rate is lower and they do not need as much heat.

      Similarly, in mammals, starvation causes a lower body temperature, hypothermia. Body temperature is controlled by the balance between heat loss and heat production. The starved mammals showed lower heat production. We have added this information to the introduction. 

      The authors show that 5 min fly food refeeding causes a par3al recovery of the naïve temperature preference of the flies (Figure 1B) and that feeding of sucralose par3ally rescues the preference whereas glucose rescues the preference similar to refeeding with fly food would do. As glucose is both sweet and metabolically valuable it would be clearer for the reader if the authors start with the fly food experiment and then show the glucose experiment to show that the altered temperature preference depends on the food component glucose. From there they can further argue that glucose is both sweet (hedonic value) and metabolically valuable. And to disentangle sweetness from metabolism one needs a sugar that is sweet but cannot be metabolized - sucralose. 

      Thank you for your advice. Since the data with sucralose is the one we want to highlight the most, we decided to present it in the order of sucralose, glucose, and fly food.

      In the sucralose experiment the authors omit the 5 min data point and only show the 10 min time point. As Figure 1F indicates that both Glucose and Sucralose elicit the same attractiveness in the flies and that sweetness influences the temperature preference, it is important that the authors show the 5 min temperature preference too to underline the effect of the sweet taste stimulus on the fly behavior independent from the caloric value. Further, the authors should demonstrate not only the cumulative touches but how much sucralose or glucose may already be consumed by the fly in the depicted time frames. 

      It is interesting to see how much sucralose or glucose the flies consume over the time frames shown. Although the cumula1ve exposure to sugar is ideally equivalent to the amount of sugar, we need a different way to actually measure the amount of sugar. We will now emphasize "cumulative touches" rather than "amount of sugar" in the text. In the next study, we will look at how much sucralose or glucose the fly has already consumed.

      Sucralose and Glucose have a similar molecular structure - it would be interesting to see how the sweet taste of a sugar with a different molecular structure like fructose and its receptor Gr43b (Myamato & Amrein 2014) may contribute to temperature preferences.  

      Sucralose and Glucose are not structurally similar. That said, we tested fructose refeeding anyway. The hungry flies showed a taste-evoked warm preference after fructose refeeding. We have added data in Figure 1E and F. The data suggest that sweet taste is more important than sugar structure. We also tested Gr43b>CsChrimson. However, the flies do not show the taste-evoked warm preference (data not shown). The data suggest that Gr43b is not the major receptor controlling taste-evoked warm preference. We have revised the manuscript.

      Both sugars appear similarly attractive to the flies (Figure 1F) - are water, sucralose, and glucose presented in a choice assay or are these individually in separate experiments? 

      Water, sucralose, and glucose were individually presented in separate experiments. We clarified it in the figure legend.

      Subsequently, the authors address the question of how sweet taste may influence temperature preferences in flies. To this end, the authors first employ gustatory receptor mutants for Gr5a, Gr64a, and Gr61a and demonstrate that sucralose feeding does not rescue temperature preference in the absence of sweet taste receptors. In an alternative approach, the authors do not use mutants but an expression of UAS:Kir in Gr64F neurons. Taking a closer look at the graph it appears that the Kir expressing flies have an increased (nearly 1{degree sign}C) temperature preference than the starved mutant flies. Is this preference change related to the mutation directly and what would be the result if Kir would be conditionally only expressed after development is completed, or is the observed temperature preference related to the Gr64f-Gal4 line? If the latter would be the case perhaps the authors may want to bring the flies to the same genetic background to allow for a more direct comparison of the temperature preferences. 

      The Gr64fGal4>Kir flies show a ~one degree higher preferred temperature under starvation compared to the mutants. However, the phenotype is similar to the controls, Gr64fGal4/+ flies, under starvation. Therefore, this phenotype is not due to either the mutation or the Kir effect. Most importantly, the Gr64fGal4>Kir flies failed to show a taste-evoked warm preference. Together with other mutant data, we concluded that sweet GRNs are required for taste-evoked warm preference.

      Overall, the figure legend for Figure 2 is very cryptic and should be more detailed.

      We have revised the figure legend for Figure 2. 

      To shed light on the mechanisms underlying the changes in temperature preferences through gustatory stimuli the authors next blocked heat and cold sensing neurons in fed and starved flies and found out that TrpA1 expressing anterior cells and R11F02-Gal4 expressing neurons both participate in sweetness-induced alteration of temperature preference in starved animals. At this point, it should be explicitly indicated in the figure that the flies need more than one overnight starva3on to display the behavior (Figure 3A). 

      We have revised the manuscript.

      The data provided by the authors indicate a kind of push-and-pull mechanism between heat and cold-sensing neurons under starvation that is somehow influenced by sweet taste sensing. Further, the authors demonstrate that TrpA1-as well as R11F02-Gal4 driven Chrimson activation is sufficient to partially rescue temperature preference under starvation. At this point is unclear why the authors use a tubGal80ts expression system but not for the TrpA1SH-Gal4 driven Chrimson. As the development itself and the conditions under which the animals were raised may have influence on the temperature preference it is important that both groups are equally raised if the authors want to directly compare with each other. 

      As we wrote in the Material and Method, the R11F02-Gal4>uas-CsChrimson flies died during the development. Therefore, we had to use tubGal80ts. On the other hand, the TrpA1-Gal4>CsChrimson flies can survive to adults. As we mentioned in MS, all flies were treated with ATR after they had fully developed into adults. This means that both TrpA1-Gal4 and R11F02-Gal4 expressing cells are ac1vated by red light via CsChrimson only in adult stages. We carefully revised the MS.

      It is a pity that the authors at this point have decided to not deepen the understanding of the circuitry between thermo-sensation and metabolic homeostasis but subsequently change the focus of their study to investigate how internal state influences taste-evoked warm preference in hungry flies. Using mutants for NPF and sNPF the authors demonstrate that both peptides play a pivotal role in taste-evoked warm preference after sucrose feeding but not for nutrient-induced warm preference. Similarly, they found that DH44, AKH and dILP6, Upd2 and Upd3 neurons are also required for taste-evoked warm preference but not for nutrient-induced warm preference. Here again, the authors do not keep the systems stable and change between inhibition of neurons through Kir and mutants for peptides. For a better comparison, it would be preferable to use always exactly the same technique to inhibit neuron signalling.

      It would be interesting to find the neural circuity of thermo-sensation and metabolic homeostasis, but we do not have any luck so far. We will continue to look into the neural circuits which control taste-evoked warm preference and nutrient-induced warm preference. Since UAS-Kir is such a strong reporter, it may kill the flies sometime. So we couldn't use UAS-Kir for all Gal4 flies. 

      DH44 is expressed in the brain and in the abdominal ganglion where they share the expression pattern with 4 Lk neurons per hemisphere. Seeing the impact of Lk signalling in metabolism (AlAnzi et al., 2010) the authors should provide evidence that the observed effect is indeed because of DH44 and not Lk.

      It would be interesting to see if Lk may play a role in taste-evoked warm preference and/or nutrient-induced warm preference. We would like to systematically screen which neuropeptides and receptors are involved in the behavior in the next study. 

      Seeing the results on dILP6 it is interesting that Li and Gong (2015) could show in larvae that cold-sensing neurons directly interact with dILP neurons in the brain. It would be interesting to see whether similar circuitry may exist in adult flies to regulate temperature preferences and these peptidergic neurons. Further, it appears interesting that again these animals need much longer time to display the observed shift in temperature (which again should be clearly indicated in the figure legend too). These observations should be more carefully considered in the discussion part too.

      We have revised the manuscript.

      In the last part of the study, the authors investigate how sensory input from temperature-sensitive cells may transmit information to central clock neurons and how these in turn may influence temperature preference under starvation. The experiments assume that DH44-expressing neurons play a role in the output pathway of the central clock. Using the clock gene null mutants per and tim the authors show that even though the animals display a significant starvation response neither per nor tim mutants exhibited taste-evoked warm preference, indicating a taste but not nutrient-evoked temperature preference regulation. 

      The authors demonstrate interesting new data on how taste input can influence temperature preference during starvation. They propose how gustatory pathways may work together with thermosensitive neurons, peptidergic neurons and finally try to bridge the gap between these neurons and clock genes. The study is very interesting and the data for each experiment alone are very convincing. However, in my opinion, the authors have opened many new questions but did not fully answer the initial question - how do taste-sensing neurons influence temperature preferences? What are the mechanisms underlying this observation? Instead of jumping from gustatory neurons to thermosensitive neurons to peptidergic neurons to clock genes, the authors should have stayed within the one question they were asking at the beginning. How does sugar sensing influence the physiology of thermos-sensation? Before addressing all the following questions of the manuscript the authors should first directly decipher the neuronal interplay between these two types of neurons. 

      Thank you for your suggestion. It would be interesting to find the neural circuity of thermo-sensation and metabolic homeostasis. We have tried but there is no luck so far. 

      The authors could e.g., employ Ca or cAMP-imaging in anterior or cold-sensitive cells and see how the responsiveness of these cells may be altered after sugar feeding. Or at least follow the idea of Li and Gong about the thermos-regulation of dILP-expressing neurons. 

      Thank you for your suggestion. Since we do not know how dlLP-expression neurons are involved in temperature response in the adult flies. We will focus on the cells using Calcium imaging for the next study.

      Anatomical analysis using the GRASP technique may further help to understand the interplay of these neurons and give new insights into the circuitry underlying food preference alteration under starvation. 

      Thank you for your suggestion. It would be interesting to find the neural circuity of thermo-sensation and metabolic homeostasis. We have tried but there is no luck so far.  

      Minor comments: 

      Line 51: Hungry animals are desperate for food - I think the authors should not anthropomorphize at this point too\ much but rather strictly describe how the animals change their behavior without any interpretation of the mental state of the animal. 

      We have modified the manuscript.

      Line 80: Hunger and satiety dramatically affect animal behavior and physiology and control feeding - please not only cite the papers but also give a short overview of the cited papers on which behaviors are altered and how. 

      We have revised the manuscript. 

      Overall statistic: The authors do comparative statistics always against starved animals throughout but often state in the text a comparison against fed (Line 111: "but did not reach that of the fed flies") I think the authors should describe the date according to their statistics and keep this constant throughout the paper. 

      Sorry for the confusion. We originally had it, but we removed it. We have added the additional statistical analyses.  

      Figure legends: Overall the figure legends could be more developed and more detailed.

      We have revised the manuscript.

    1. Author response:

      The following is the authors’ response to the original reviews.

      Public Reviews:

      Reviewer #1 (Public Review):

      Summary:

      As adult-born granule neurons have been shown to play diverse roles, both positive and negative, to modulate hippocampal circuitry and function in epilepsy, understanding the mechanisms by which altered neurogenesis contributes to seizures is important for future therapeutic strategies. The work by Jain et al. demonstrates that increasing adult neurogenesis before status epilepticus (SE) leads to a suppression of chronic seizures in the pilocarpine model of temporal lobe epilepsy. This work is potentially interesting because previous studies showed suppressing neurogenesis led to reduced chronic seizures.

      To increase neurogenesis, the authors conditionally delete the pro-apoptotic gene Bax using a tamoxifen-inducible Nestin-CreERT2 which has been previously published to increase proliferation and survival of adult-born neurons by Sahay et al. After 6 weeks of tamoxifen injection, the authors subjected male and female mice to pilocarpine-induced SE. In the first study, at 2 hours after pilocarpine, the authors examine latency to the first seizure, severity and total number of acute seizures, and power during SE. In the second study in a separate group of mice, at 3 weeks after pilocarpine, the authors examine chronic seizure number and frequency, seizure duration, postictal depression, and seizure distribution/cluster seizures. Overall, the study concludes that increasing adult neurogenesis in the normal adult brain can reduce epilepsy in females specifically. However, important BrdU birthdating experiments in both male and female mice need to be included to support the conclusions made by the authors. Furthermore, speculative mechanisms lacking direct evidence reduce enthusiasm for the findings.

      There are two suggestions. First, BrdU birthdating of newborn neurons is important to add to the paper so that there is support for the conclusions. Second, speculative text reduced enthusiasm. In response, we clarified the conclusions. We do not think that the clarified conclusions require BrdU birthdating (discussed further below). We also removed two schematics (and associated text) that we think the reviewer was referring to when speculation was mentioned.

      We also want to point out something minor -that the times of injections listed above are not correct.

      a. Seizures were not measured 2 hrs after pilocarpine; that is when the anticonvulsant diazepam was administered to males. 

      b. Seizures were not measured 3 weeks after pilocarpine; the duration of recording was 3 weeks.  

      (1) BrdU birthdating is required for conclusions.

      We think that the Reviewer was suggesting birthdating because we were not clear about our conclusions, and we apologize for the confusion. The Reviewer stated that we concluded: “conditionally deleting Bax in Nestin-Cre+ cells leads to increased neurogenesis and hilar ectopic granule cells, thereby reducing chronic seizures.”  (Note this is a quote from the review).

      However, we did not intend to conclude that. We intended to conclude that conditionally deleting Bax in Nestin-Cre+ mice reduced chronic seizures in the mouse model of epilepsy that we used. Also, that conclusion only pertained to females. Please note we did not conclude that hilar ectopic granule cells led to reduced seizures. We also concluded that Bax deletion increased neurogenesis in female mice. We have revised the text to make the conclusions clear.

      Abstract, starting on line 67:

      The results suggest that selective Bax deletion to increase adult neurogenesis can reduce experimental epilepsy, and the effect shows a striking sex difference.

      Results, starting on line 448:

      Because Cre+ epileptic females had increased numbers of immature neurons relative to Cre- females at the time of SE, and prior studies show that Cre+ females had less neuronal damage after SE (Jain et al., 2019), female Cre+ mice might have had reduced chronic seizures because of high numbers of immature neurons. However, the data do not prove a causal role.

      Starting on line 477:

      ...we hypothesized that female Cre+ mice would have fewer hilar ectopic GCs than female Cre- mice. However, that female Cre+ mice did not have fewer hilar ectopic GCs.

      Discussion, starting on line 563:

      The chronic seizures, measured 4-7 weeks after pilocarpine, were reduced in frequency by about 50% in females. Therefore, increasing young adult-born neurons before the epileptogenic insult can protect against epilepsy. However, we do not know if the protective effect was due to the greater number of new neurons before SE or other effects. Past data would suggest that increased numbers of newborn neurons before SE leads to a reduced SE duration and less neuronal damage in the days after SE. That would be likely to lessen the epilepsy after SE. However, there may have been additional effects of larger numbers of newborn neurons prior to SE.

      Conclusions, starting on line 745:

      In the past, suppressing adult neurogenesis before SE was followed by fewer hilar ectopic GCs and reduced chronic seizures. Here, we show that the opposite - enhancing adult neurogenesis before SE and increased hilar ectopic GCs - do not necessarily reduce seizures. We suggest instead that protection of the hilar neurons from SE-induced excitotoxicity was critical to reducing seizures. The reason for the suggestion is that the survival of hilar neurons would lead to persistence of the normal inhibitory functions of hilar neurons, protecting against seizures. However, this is only a suggestion at the present time because we do not have data to prove it. Additionally, because protection was in females, sex differences are likely to have played an important role. Regardless, the results show that enhancing neurogenesis of young adult-born neurons in Nestin-Cre+ mice had a striking effect in the pilocarpine model, reducing chronic seizures in female mice.

      The Reviewer is correct that it would be interesting to know when the increase in adult neurogenesis occurred that was critical to the effect. For example, was it the initial increase following Bax deletion but before pilocarpine-induced SE, or the increase in neurogenesis following SE, or increased adult neurogenesis in the chronic stage of epilepsy. It also might be that related aspects of neurogenesis played a role such as the degree that maturation was normal in adult-born neurons. We have not pursued the experiments to identify these aspects of neurogenesis because of how much work it would entail. Also, approaches to conclude cause-effect relationships are going to be difficult. 

      (2) Speculation.

      We removed the text and supplemental figures with schematics that we think were the overly speculative parts of the paper the Reviewer mentioned.

      Strengths:

      (1) The study is sex-matched and reveals differences in response to increasing adult neurogenesis in chronic seizures between males and females.

      (2) The EEG recording parameters are stringent, and the analysis of chronic seizures is comprehensive. In two separate experiments, the electrodes were implanted to record EEG from the cortex as well as the hippocampus. The recording was done for 10 hours post pilocarpine to analyze acute seizures, and for 3 weeks continuous video EEG recording was done to analyze chronic seizures.

      Weaknesses:

      (1) Cells generated during acute seizures have different properties to cells generated in chronic seizures. In this study, the authors employ two bouts of neurogenesis stimuli (Bax deletion dependent and SE dependent), with two phases of epilepsy (acute and chronic). There are multiple confounding variables to effectively conclude that conditionally deleting Bax in Nestin-Cre+ cells leads to increased neurogenesis and hilar ectopic granule cells, thereby reducing chronic seizures.

      As mentioned above, with a clarification of our conclusions we think we have addressed the concern. We believe that we conditionally deleted Bax in Nestin-expressing cells. We believe we found that female mice had reduced loss of hilar mossy cells and somatostatin-expressing neurons after SE, and fewer chronic seizures after SE. While it makes sense that increased neurogenesis caused the reduced seizures, we acknowledge it was not proved.

      We do not make conclusions about the role of hilar ectopic granule cells. However, we note that they appear to have been similar in number across groups, which suggests they played no role in the results. This is very surprising and therefore adds novelty.

      (2) Related to this is the degree of neurogenesis between Cre+ and Cre- mice and the nature of the sex differences. It is crucial to know the rate/fold change of increased neurogenesis before pilocarpine treatment and whether it is different between male and female mice.

      We agree that if sex differences in adult neurogenesis could be shown by a sex difference in rate, fold change, maturation, and other characteristics.  However, sex differences can also be shown by a change in doublecortin (DCX), which is what we did. We respectfully submit that we do not see an exhaustive study is critical.

      As a result, we have clarified DCX was studied either before SE or in the period of chronic seizures:

      Results, starting on line 406:

      III. Before and after epileptogenesis, Cre+ female mice exhibited more immature neurons than Cre- female mice but that was not true for male mice.

      Starting on line 446:

      Therefore, elevated DCX occurred after chronic seizures had developed in Cre+ mice but the effect was limited to females.

      Discussion, starting on line 592:

      This study showed that conditional deletion of Bax from Nestin-expressing progenitors increased young adult-born neurons in the DG when studied 6 weeks after deletion and using DCX as a marker of immature neurons.

      (3) The authors observe more hilar Prox1 cells in Cre+ mice compared to Cre- mice. The authors should confirm the source of the hilar Prox1+ cells.

      This is an excellent question but it is unclear that it is critical to the seizures since both sexes showed more hilar Prox1 cells in Cre+ mice but only the females had fewer seizures than Cre- mice. This is the additional text to describe the results (starting on Line 493):

      In past studies, hilar ectopic GCs have been suggested to promote seizures (Scharfman et al., 2000; Jung et al., 2006; Cho et al., 2015). Therefore, we asked if the numbers of hilar ectopic GCs correlated with the numbers of chronic seizures. When Cre- and Cre+ mice were compared (both sexes pooled), there was a correlation with numbers of chronic seizures (Fig. 6D1) but it suggested that more hilar ectopic GCs improved rather than worsened seizures. However, the correlation was only in Cre- mice, and when sexes were separated there was no correlation (Fig. 6D3).

      When seizure-free interval was examined with sexes pooled, there was a correlation for Cre+ mice (Fig. 6D2) but not Cre- mice. Strangely, the correlations of Cre+ mice with seizure-free interval (Fig. 6D2, D4) suggest ectopic GCs shorten the seizure-free interval and therefore worsen epilepsy, opposite of the correlative data for numbers of chronic seizures. In light of these inconsistent results it seems that hilar ectopic granule cells had no consistent effect on chronic seizures.

      (4) The biggest weakness is the lack of mechanism. The authors postulate a hypothetical mechanism to reconcile how increasing and decreasing adult-born neurons in GCL and hilus and loss of hilar mossy and SOM cells would lead to opposite effects - more or fewer seizures. The authors suggest the reason could be due to rewiring or no rewiring of hilar ectopic GCs, respectively, but do not provide clear-cut evidence.

      As we mention above, we removed the supplemental figures with schematics because they probably were what seemed overly speculative.

      We acknowledge that mechanism is not proven by our study. However, we would like to mention that in our view, showing preservation of hilar mossy cells and SOM cells, but not PV cells, does add mechanistic data to the paper. We understand more experiments are necessary.

      Reviewer #2 (Public Review):

      Summary:

      In this manuscript, Jain et al explore whether increasing adult neurogenesis is protective against status epilepticus (SE) and the development of spontaneous recurrent seizures (chronic epilepsy) in a mouse pilocarpine model of TLE. The authors increase adult neurogenesis via conditional deletion of Bax, a pro-apoptotic gene, in Nestin-CreERT2Baxfl/fl mice. Cre- littermates are used as controls for comparisons. In addition to characterizing seizure phenotypes, the authors also compare the abundance of hilar ectopic granule cells, mossy cells, hilar SOM interneurons, and the degree of neuronal damage between mice with increased neurogenesis (Cre+) vs Cre- controls. The authors find less severe SE and a reduction in chronic seizures in female mice with pre-insult increased adult-born neurons. Immunolabeling experiments show these females also have preservation of hilar mossy cells and somatostatin interneurons, suggesting the pre-insult increase in adult neurogenesis is protective.

      Strengths:

      (1) The finding that female mice with increased neurogenesis at the time of pilocarpine exposure have fewer seizures despite having increased hilar ectopic granule cells is very interesting.

      (2) The work builds nicely on the group's prior studies.

      (3) Apparent sex differences are a potentially important finding.

      (4) The immunohistochemistry data are compelling.

      (5) Good controls for EEG electrode implantation effects.

      (6) Nice analysis of most of the SE EEG data.

      Weaknesses:

      (1) In addition to the Cre- littermate controls, a no Tamoxifen treatment group is necessary to control for both insertional effects and leaky expression of the Nestin-CreERT2 transgene.

      About “leaky” expression, we have not found expression to be leaky. We checked by injecting a Cre-dependent virus so that mCherry would be expressed in those cells that had Cre.  The results were published as Supplemental Figure 9 in Jain et al. (2019).

      In the revised manuscript we also mention a study that examined three Nestin-CreERT2 mouse lines (Sun et al., 2014). One of the mouse lines was ours. The leaky expression was not in the mouse line we use. We have added these points to the revised manuscript:

      Methods, section II starting on line 791:

      Although Nestin-Cre-ERT2 mouse lines have been criticized because  they can have leaky expression, the mouse line used in the present study did not (Sun et al., 2014), which we confirmed (Jain et al., 2019).

      (2) The authors suggest sex differences; however, experimental procedures differed between male and female mice (as the authors note). Female mice received diazepam 40 minutes after the first pilocarpine-induced seizure onset, whereas male mice did not receive diazepam until 2 hours post-onset. The former would likely lessen the effects of SE on the female mice. Therefore, sex differences cannot be accurately assessed by comparing these two groups, and instead, should be compared between mice with matching diazepam time courses.

      We agree that a shorter delay between pilocarpine and diazepam would be likely to lead to less damage. However, the latency from pilocarpine to SE varied, making the time from the onset of SE to diazepam variable. Most of the variability was in females. By timing the diazepam injection differently in males and females, we could make the time from the onset of SE to diazepam similar between females and males. We had added a supplemental figure to show that our approach led to no significant differences between females and males in the latency to SE, time between SE and diazepam injection, and time between pilocarpine and diazepam injection. We also show that Cre+ females and Cre- females were not different in these times, so it could not be related to the neuroprotection of Cre+ females.

      Additionally, the authors state that female mice that received diazepam 2 hours post-onset had severe brain damage. This is concerning as it would suggest that SE is more severe in the female than in the male mice.

      We regret that our language was misleading. We intended to say females had more morbidity and mortality than males (lack of appetite and grooming, death in the days after SE) when we gave DZP 2 hrs after Pilo. We actually don’t know why because there were no differences in severity of SE. We think the females had worse outcome when they had a short latency to SE.  These females had a longer period of SE before DZP than males, probably leading to worse outcome. To correct this we gave DZP to females sooner. Then morbidity and mortality was improved in females. 

      Interestingly, after we did this we saw females did not always have a short latency to SE. We maintained the same regimen however, to be consistent. As the new supplemental figure (above) shows, there were significant sex differences in the latency to SE, time between SE and DZP, and time between pilocarpine and DZP.

      (3) Some sample sizes are low, particularly when sex and genotypes are split (n=3-5), which could cause a type II statistical error.

      We agree and have noted this limitation in the Discussion:

      Additional considerations, starting on line 739:

      This study is limited by the possibilities of type II statistical errors in those instances where we divided groups by genotype and sex, leading to comparisons of 3-5 mice/group.

      (4) Several figures show a datapoint in the sex and genotype-separated graphs that is missing from the corresponding male and female pooled graphs (Figs. 2C, 2D, 4B).

      We are very grateful to the Reviewer for pointing out the errors. They are corrected.

      (5) In Suppl Figs. 1B & 1C, subsections 1c and 2c, the EEG trace recording is described as the end of SE; however, SE appears to still be ongoing in these traces in the form of periodic discharges in the EEG.

      The Reviewer is correct.  It is a misconception that SE actually ends completely. The most intense seizure activity may, but what remains is abnormal activity that can last for days. Other investigators observe the same and have suggested that it argues against the concept of a silent period between SE and chronic epilepsy. We had discussed this in our prior papers and had referenced how we define SE.  In the revised manuscript we add the information to the Methods section instead of referencing a prior study:

      Methods, starting on line 899:

      SE duration was defined in light of the fact that the EEG did not return to normal after the initial period of intense activity. Instead, intermittent spiking occurred for at least 24 hrs, as we previously described (Jain et al., 2019) and has been described by others (Mazzuferi et al., 2012; Bumanglag and Sloviter, 2018; Smith et al., 2018). We therefore chose a definition that captured the initial, intense activity. We defined the end of this time as the point when the amplitude of the EEG deflections were reduced to 50% or less of the peak deflections during the initial hour of SE. Specifically, we selected the time after the onset of SE when the EEG amplitude in at least 3 channels had dropped to approximately 2 times the amplitude of the EEG during the first hour of SE, and remained depressed for at least 10 min (Fig. S2 in (Jain et al., 2019). Thus, the duration of SE was defined as the time between the onset and this definition of the "end" of SE.

      (6) In Results section II.D and associated Fig.3, what the authors refer to as "postictal EEG depression" is more appropriately termed "postictal EEG suppression". Also, postictal EEG suppression has established criteria to define it that should be used.

      We find suppression is typical in studies of ECT or humans (Esmaeili et al., 2023; Gascoigne et al., 2023; Hahn et al., 2023; Kavakbasi et al., 2023; Langroudi et al., 2023; Karl et al., 2024; Vilan et al., 2024; Zhao et al., 2024) and animal research uses the term postictal depression(Kanner et al., 2010; Krishnan and Bazhenov, 2011; Riljak et al., 2012; Singh et al., 2012; Carballosa-Gonzalez et al., 2013; Kommajosyula et al., 2016; Smith et al., 2018; Uva and de Curtis, 2020; Medvedeva et al., 2023). Therefore we think depression is a more suitable term.

      The example traces in Fig. 3A and B should also be expanded to better show this potential phenomenon.

      We expanded traces in Fig. 3 as suggested. They are in Fig 3A.

      (7) In Fig.5D, the area fraction of DCX in Cre+ female mice is comparable to that of Cre- and Cre+ male mice. Is it possible that there is a ceiling effect in DCX expression that may explain why male Cre+ mice do not have a significant increase compared to male Cre- mice?

      We thank the Reviewer for the intriguing possibility. We now mention it in the manuscript:

      Results, starting on line 456:

      It is notable that the Cre+ male mice did not show increased numbers of immature neurons at the time of chronic seizures but Cre+ females did. It is possible that there was a “ceiling” effect in DCX expression that would explain why male Cre+ mice did not have a significant increase in immature neurons relative to male Cre- mice.

      (8) In Suppl. Fig 6, the authors should include DCX immunolabeling quantification from conditional Cre+ male mice used in this study, rather than showing data from a previous publication.

      We have made this revision.

      (9) In Fig 8, please also include Fluorojade-C staining and quantification for male mice.

      The additional data for males have been added to part D.

      (10) Page 13: Please specify in the first paragraph of the discussion that findings were specific to female mice with pre-insult increases in adult-born neurogenesis.

      This has been done.

      Minor:

      (11) In Fig. 1 and suppl. figure 1, please clarify whether traces are from male or female mice.

      We have clarified.

      (12) Please be consistent with indicating whether immunolabeling images are from female or male mice.

      a. Fig 5B images labeled as from "Cre- Females" and "Cre+ Females".

      b. Suppl. Fig 8: Images labeled as "Cre- F" and "Cre+ F".

      c. Fig 6: sex not specified.

      d. Fig. 7: sex only specified in the figure legend.

      e. Fig 8: only female mice were included in these experiments, but this is not clear from the figure title or legend.

      We revised all figures according to the comments.

      (13) Page 4: the last paragraph of the introduction belongs within the discussion section.

      We recognize there is a classic view that any discussion of Results should not be in the Introduction. However, we find that view has faded and more authors make a brief summary statement about the Results at the end of the Introduction. We would like to do so because it allow Readers to understand the direction of the study at the outset, which we find is helpful.

      (14) Page 6: The sentence "The data are consistent with prior studies..." is unnecessary.

      We have removed the text.

      (15) Suppl. Fig 6A: Please include representative images of normal condition DCX immunolabeling.

      We have added these data. There is an image of a Cre- female, Cre+ female, Cre- male and Cre+ male in the new figure, Supplemental Figure 6. All mice had tamoxifen at 6 weeks of age and were perfused 6 weeks later. None of the mice had pilocarpine.

      (16) In Suppl. Fig 7C, I believe the authors mean "no loss of hilar mossy and SOM cells" instead of "loss of hilar mossy and SOM cells".

      This Figure was removed because of the input from Reviewer 1 suggesting it was too speculative.

      Reviewer #1 (Recommendations For The Authors):

      (1) The main claim of the study is that increasing adult neurogenesis decreases chronic seizures. However, to quantify adult-born neurons, DCX immunoreactivity is used as the sole metric to determine neurogenesis. This is insufficient as changes in DCX-expressing cells could also be an indicator of altered maturation, survival, and/or migration, not proliferation per se. To claim that increasing adult neurogenesis is associated with a reduction of chronic seizures, the authors should perform a pulse/chase (birth dating) experiment with BrdU and co-labeling with DCX.

      We think that increased DCX does reflect increased adult neurogenesis. However, we agree that one does not know if it was due to increased proliferation, survival, etc. We also note that this mouse line has been studied thoroughly to show there was increased neurogenesis with BrdU, Ki67 and DCX. We mention that paper in the revised text:

      Methods, starting on line 786:

      It was shown that after tamoxifen injection in adult mice there is an increase in dentate gyrus neurogenesis based on studies of bromo-deoxyuridine, Ki67, and doublecortin (Sahay et al., 2011).

      (2) As mentioned above, analysis of DCX staining alone months after TAM injections is limited. Instead, the cells could be labelled by BrdU prior to TAM injection, following which quantification of BrdU+/Prox1+ cells at 6 weeks post TAM injection should be performed in Cre+ and Cre- mice (males and females) to yield the rate of neurogenesis increase.

      We respectfully disagree that birthdating cells is critical. Using DCX staining just before SE, we know the size of the population of cells that are immature at the time of SE. This is what we think is most important because these immature neurons are those that appear to affect SE, as we have already shown.

      (3) To confirm the source of the hilar Prox1+ cells, a dual BrdU/EdU labeling approach would be beneficial. BrdU injection could be given before TAM injection and EdU injection before pilocarpine to label different cohorts of neural stem cells. Co-staining with Prox1 at different time points will help in identifying the origin of hilar ectopic cells.

      We are grateful for the ideas of the Reviewer. We hesitate to do these experiments now because it seems like a new study to find out where hilar granule cells come from.

      REFERENCES

      Bumanglag AV, Sloviter RS (2018) No latency to dentate granule cell epileptogenesis in experimental temporal lobe epilepsy with hippocampal sclerosis. Epilepsia 59:2019-2034.

      Carballosa-Gonzalez MM, Munoz LJ, Lopez-Alburquerque T, Pardal-Fernandez JM, Nava E, de Cabo C, Sancho C, Lopez DE (2013) EEG characterization of audiogenic seizures in the hamster strain gash:Sal. Epilepsy Res 106:318-325.

      Cho KO, Lybrand ZR, Ito N, Brulet R, Tafacory F, Zhang L, Good L, Ure K, Kernie SG, Birnbaum SG, Scharfman HE, Eisch AJ, Hsieh J (2015) Aberrant hippocampal neurogenesis contributes to epilepsy and associated cognitive decline. Nat Commun 6:6606.

      Esmaeili B, Weisholtz D, Tobochnik S, Dworetzky B, Friedman D, Kaffashi F, Cash S, Cha B, Laze J, Reich D, Farooque P, Gholipour T, Singleton M, Loparo K, Koubeissi M, Devinsky O, Lee JW (2023) Association between postictal EEG suppression, postictal autonomic dysfunction, and sudden unexpected death in epilepsy: Evidence from intracranial EEG. Clin Neurophysiol 146:109-117.

      Gascoigne SJ, Waldmann L, Schroeder GM, Panagiotopoulou M, Blickwedel J, Chowdhury F, Cronie A, Diehl B, Duncan JS, Falconer J, Faulder R, Guan Y, Leach V, Livingstone S, Papasavvas C, Thomas RH, Wilson K, Taylor PN, Wang Y (2023) A library of quantitative markers of seizure severity. Epilepsia 64:1074-1086.

      Hahn T et al. (2023) Towards a network control theory of electroconvulsive therapy response. PNAS Nexus 2:pgad032.

      Jain S, LaFrancois JJ, Botterill JJ, Alcantara-Gonzalez D, Scharfman HE (2019) Adult neurogenesis in the mouse dentate gyrus protects the hippocampus from neuronal injury following severe seizures. Hippocampus 29:683-709.

      Jung KH, Chu K, Lee ST, Kim J, Sinn DI, Kim JM, Park DK, Lee JJ, Kim SU, Kim M, Lee SK, Roh JK (2006) Cyclooxygenase-2 inhibitor, celecoxib, inhibits the altered hippocampal neurogenesis with attenuation of spontaneous recurrent seizures following pilocarpine-induced status epilepticus. Neurobiol Dis 23:237-246.

      Kanner AM, Trimble M, Schmitz B (2010) Postictal affective episodes. Epilepsy Behav 19:156-158.

      Karl S, Sartorius A, Aksay SS (2024) No effect of serum electrolyte levels on electroconvulsive therapy seizure quality parameters. J ECT 40:47-50.

      Kavakbasi E, Stoelck A, Wagner NM, Baune BT (2023) Differences in cognitive adverse effects and seizure parameters between thiopental and propofol anesthesia for electroconvulsive therapy. J ECT 39:97-101.

      Kommajosyula SP, Randall ME, Tupal S, Faingold CL (2016) Alcohol withdrawal in epileptic rats - effects on postictal depression, respiration, and death. Epilepsy Behav 64:9-14.

      Krishnan GP, Bazhenov M (2011) Ionic dynamics mediate spontaneous termination of seizures and postictal depression state. J Neurosci 31:8870-8882.

      Langroudi ME, Shams-Alizadeh N, Maroufi A, Rahmani K, Rahchamani M (2023) Association between postictal suppression and the therapeutic effects of electroconvulsive therapy: A systematic review. Asia Pac Psychiatry 15:e12544.

      Mazzuferi M, Kumar G, Rospo C, Kaminski RM (2012) Rapid epileptogenesis in the mouse pilocarpine model: Video-EEG, pharmacokinetic and histopathological characterization. Exp Neurol 238:156-167.

      Medvedeva TM, Sysoeva MV, Sysoev IV, Vinogradova LV (2023) Intracortical functional connectivity dynamics induced by reflex seizures. Exp Neurol 368:114480.

      Riljak V, Maresova D, Jandova K, Bortelova J, Pokorny J (2012) Impact of chronic ethanol intake of rat mothers on the seizure susceptibility of their immature male offspring. Gen Physiol Biophys 31:173-177.

      Sahay A, Scobie KN, Hill AS, O'Carroll CM, Kheirbek MA, Burghardt NS, Fenton AA, Dranovsky A, Hen R (2011) Increasing adult hippocampal neurogenesis is sufficient to improve pattern separation. Nature 472:466-470.

      Scharfman HE, Goodman JH, Sollas AL (2000) Granule-like neurons at the hilar/CA3 border after status epilepticus and their synchrony with area CA3 pyramidal cells: Functional implications of seizure-induced neurogenesis. J Neurosci 20:6144-6158.

      Singh B, Singh D, Goel RK (2012) Dual protective effect of passiflora incarnata in epilepsy and associated post-ictal depression. J Ethnopharmacol 139:273-279.

      Smith ZZ, Benison AM, Bercum FM, Dudek FE, Barth DS (2018) Progression of convulsive and nonconvulsive seizures during epileptogenesis after pilocarpine-induced status epilepticus. J Neurophysiol 119:1818-1835.

      Sun MY, Yetman MJ, Lee TC, Chen Y, Jankowsky JL (2014) Specificity and efficiency of reporter expression in adult neural progenitors vary substantially among nestin-creer(t2) lines. J Comp Neurol 522:1191-1208.

      Uva L, de Curtis M (2020) Activity- and ph-dependent adenosine shifts at the end of a focal seizure in the entorhinal cortex. Epilepsy Res 165:106401.

      Vilan A, Grangeia A, Ribeiro JM, Cilio MR, de Vries LS (2024) Distinctive amplitude-integrated EEG ictal pattern and targeted therapy with carbamazepine in kcnq2 and kcnq3 neonatal epilepsy: A case series. Neuropediatrics 55:32-41.

      Zhao C, Tang Y, Xiao Y, Jiang P, Zhang Z, Gong Q, Zhou D (2024) Asymmetrical cortical surface area decrease in epilepsy patients with postictal generalized electroencephalography suppression. Cereb Cortex 34.

    1. Author response:

      The following is the authors’ response to the previous reviews.

      Reviewer #1 (Public Review):

      Comment 1: One of the only demonstrations of the expression and physiological significance of TRPCs in VTA DA neurons was published by (Rasmus et al., 2011; Klipec et al., 2016) which are not cited in this paper. In their study, TRPC4 expression was detected in a uniformly distributed subset of VTA DA neurons, and TRPC4 KO rats showed decreased VTA DA neuron tonic firing and deficits in cocaine reward and social behaviors. Update: The authors say they have added a discussion of these papers, but I do not see it in the updated manuscript.

      We thank the reviewer for the suggestion. The discussion for this has been added (line 557-565).

      Comment 2: The authors should report the results (exact data values) of female mice in the results text, or pool the male and female data if the sex differences are not significant.

      We agree with reviewer. Some experiments were further redone with female and the data of male and female mice have been reported in the results of text.

      Comment 3: The selectivity of drugs should be referred as "selective" rather than "specific". 

      Thanks, “specific” has been changed to “selective”.  

      Comment 4: Line 62: typo, "substantia nigra". 

      Thanks, “substantial nigra” has been changed to “substantia nigra” in line 65.  

      Comment 5: Line 77: some new studies suggest that NALCN might have voltage dependency

      (rectification).

      Thanks, description of NALCN voltage dependence has been corrected in line 81-83.

      Comment 6: Line 175: change "less" to "fewer". 

      Thanks, “less” has been changed to “fewer”.

      Comment 7: Line 299: choose one - "was not ... or" or "was neither ... nor". 

      Thanks, this error has been corrected. 

      Comment 8: In Figure 1Aii and Figure 3Bi, it was not specified in the results text or figure legend that C1-C5 represent individual cell until the legend for Figure 4.

      Thanks, these description about gel have been added in the figure legends. 

      Reviewer #2 (Public Review): 

      Comment 1: From the previous review, we mentioned that " 'The HCN' as written in line 69 is a bit misleading, as HCN channels in the heart and brain are different members of a family of channels, although as written in the text, it seems that they are identical." This is still the case (now line 73).

      We agreed with the reviewer’s comments. The introduction about HCN has been corrected (line 74-78). 

      Comment 2: The authors state in line 112 that "most of the experiments were also repeated in female mice" - this is true in the case of most electrophysiological experiments, although not behavioral experiments. Authors should amend the statement in line 112 and clarify in the Discussion section which findings are generalizable between sexes; e.g.:

      a.  Discussion of HCN contribution to VTA DA activity (beginning line 453) should clarify male mice. 

      b.  Similarly, any discussion of behavioral findings should clarify male mice. 

      We agreed with the reviewer’s comments. The sexes of mice used have been noted in the results and discussion. 

      Comment 3: The authors' statement in lines 179-183 ("In contrast, fewer GABAergic neuronal markers (Glutamic acid decarboxylase, GAD1/2 and vesicular GABA transporter, VGAT) co-expressed with the DA neurons, which is consistent with previous studies that VTA DA neurons co-expressing GABAergic neuronal markers mainly project to the lateral habenula") is a little confusing - as stated, it seems that the authors are confirming DA/GABA coexpression in VTA-LHb neurons, which is not the case.

      We agreed with the reviewer’s comments. We corrected this statement (line 182-186).

      Comment 4: Additional information could be included in the Methods section description of Western Blotting procedures - e.g., what thickness of tissue and what size gauge were used to dissect VTA for these experiments?

      Thanks. The description of tissue in Western Blotting procedures has been added.

      Comment 5:

      a. Grammatical errors in line 23 of Abstract (also lines 31-32)

      b. "drove" should read "strove" in line 92 

      c. Grammatical errors in lines 401, 444, and 448 

      We thank the reviewer for pointing out grammatical errors and we corrected them.

      Reviewer #3 (Public Review): 

      Comment 1: The main strength of this study lies on a comprehensive bottom-up approach ranging from patch-clamp recordings to behavioral tasks. These tasks mainly address anxiety-like behaviors and so-called depression-like behaviors (sucrose choice, forced swim test, tail suspension test). The results gathered by means of these procedures are clearcut. However, the reviewer believes that the authors should be more cautious when interpreting immobility responses to stress (forced swim, tail suspension) as "depression-like" responses. These stress models have been routinely used (and validated) in the past to detect the antidepressant properties of compounds under investigation, which by no means indicates that these are depression models. For readers interested by this debate, I suggest to read e.g. De Kloet and Molendijk (Biol. Pscyhiatry 2021).

      We thank the reviewer for the suggestion. We will be more careful and rigorous in the selection of stress models in our subsequent research work.

      Editor's note:

      Should you choose to revise your manuscript, please include full statistical reporting including exact p-values wherever possible alongside the summary statistics (test statistic and df) and 95% confidence intervals. These should be reported for all key questions and not only when the p-value is less than 0.05.

      We have added the full statistical reporting including exact p-values wherever possible alongside the summary statistics (test statistic and df) and 95% confidence intervals into the results and the figure legends of the revised manuscript.

    1. Author response:

      The following is the authors’ response to the current reviews.

      We thank the Reviewers and Editors for the constructive comments, which we believe have significantly improved the quality of our manuscript.


      The following is the authors’ response to the original reviews.

      Reviewer #1 (Public Review):

      (1) With respect to the predictions, the authors propose that the subjects, depending on their linguistic background and the length of the tone in a trial, can put forward one or two predictions. The first is a short-term prediction based on the statistics of the previous stimuli and identical for both groups (i.e. short tones are expected after long tones and vice versa). The second is a long-term prediction based on their linguistic background. According to the authors, after a short tone, Basque speakers will predict the beginning of a new phrasal chunk, and Spanish speakers will predict it after a long tone.

      In this way, when a short tone is omitted, Basque speakers would experience the violation of only one prediction (i.e. the short-term prediction), but Spanish speakers will experience the violation of two predictions (i.e. the short-term and long-term predictions), resulting in a higher amplitude MMN. The opposite would occur when a long tone is omitted. So, to recap, the authors propose that subjects will predict the alternation of tone durations (short-term predictions) and the beginning of new phrasal chunks (long-term predictions).

      The problem with this is that subjects are also likely to predict the completion of the current phrasal chunk. In speech, phrases are seldom left incomplete. In Spanish is very unlikely to hear a function-word that is not followed by a content-word (and the opposite happens in Basque). On the contrary, after the completion of a phrasal chunk, a speaker might stop talking and a silence might follow, instead of the beginning of a new phrasal chunk.

      Considering that the completion of a phrasal chunk is more likely than the beginning of a new one, the prior endowed to the participants by their linguistic background should make us expect a pattern of results actually opposite to the one reported here.

      We thank the Reviewer #1 for this pertinent comment and the opportunity to address this issue. A very similar concern was also raised by Reviewer #2. Below we try to clarify the motivations that led us to predict that the hypothesized long-term predictions should manifest at the onset (and not within or the end) of a perceptual chunk. 

      Reviewers #1 and #2 contest a critical assumption of our study i.e., the fact that longterm predictions should occur at the beginning of a rhythmic chunk as opposed to its completion. They also contest the prediction deriving from this view i.e., omitting the first sound in a perceptual chunk (short for Spanish, long for Basque) would lead to larger error responses than omitting a later element. They suggest an alternative view: the omission of tones at the end of a perceptual rhythmic chunk would evoke larger error responses than omissions at its onset, as subjects are more likely to predict the completion of the chunk than its beginning. This view predicts an interaction effect in the opposite direction of our findings. 

      While we acknowledge this as a plausible hypothesis, we believe that the current literature provides strong support for our view. Indeed, many studies in the rhythm and music perception literature have investigated the ERP responses to deviant sounds and omissions placed at different positions within rhythmic patterns (e.g., Ladinig et al., 2009; Bouwer et al., 2016; Brochard et al., 2003; Potter et al., 2009; Yabe et al., 2001). For instance, Lading et al., 2009 presented participants with metrical rhythmical sound sequences composed of eight tones. In some deviant sequences, the first or a later tone was omitted. They found that earlier omissions elicited earlier and higher-amplitude MMN responses than later omissions (irrespective of attention). Overall, this and other studies showed that the amplitude of ERP responses are larger when deviants occur at positions that are expected to be the “start” of a perceptual group - “on the beat” in musical terms - and decline toward the end of the chunk. According to some of these studies, the first element of a chunk is particularly important to track the boundaries of temporal sequences, which is why more predictive resources are invested at that position. We believe that this body of evidence provides robust bases for our hypotheses and the directionality of our predictions.

      An additional point that should be considered concerns the amplitude of the prediction error response elicited by the omission. From a predictive coding perspective, the omission of the onset of a chunk should elicit larger error responses because the system is expecting the whole chunk (i.e., two tones/more acoustic information). On the other hand, the omission of the second tone - in the transition between two tones within the chunk - should elicit a smaller error response because the system is expecting only the missing tone (i.e. less acoustic information). 

      Given the importance of these points, we have now included them in the updated version of the paper, in which we try to better clarify the rationale behind our hypothesis (see Introduction section, around the 10th paragraph).

      (2) The authors report an interaction effect that modulates the amplitude of the omission response, but caveats make the interpretation of this effect somewhat uncertain. The authors report a widespread omission response, which resembles the classical mismatch response (in MEG) with strong activations in sensors over temporal regions. Instead, the interaction found is circumscribed to four sensors that do not overlap with the peaks of activation of the omission response.

      We thank the Reviewer for this comment. As mentioned in the provisional response, the approach employed to identify the presence of an interaction effect was conservative: We utilized a non-parametric test on combined gradiometers data, without making a priori assumptions about the location of the effect, and employed small cluster thresholds (cfg.clusteralpha = 0.05) to increase the chances of detecting highly localized clusters with large effect sizes. The fact that the interaction effect arises in a relatively small cluster of sensors does not alter its statistical robustness. It should be also considered that in the present analyses we focused on planar gradiometer data that, compared to magnetometers and axial gradiometers, present more fine-grained spatial resolution and are more suited for picking up relatively small effects. 

      The partial overlap of the cluster with the activation peaks may simply reflect the fact that different sources contribute to the generation of the omission-MMN, which has been reported in several studies (e.g., Zhang et al., 2018; Ross & Hamm, 2020).  We value the Reviewer’s input and are grateful for the opportunity to address these considerations.

      Furthermore, the boxplot in Figure 2E suggests that part of the interaction effect might be due to the presence of two outliers (if removed, the effect is no longer significant). Overall, it is possible that the reported interaction is driven by a main effect of omission type which the authors report, and find consistently only in the Basque group (showing a higher amplitude omission response for long tones than for short tones). Because of these points, it is difficult to interpret this interaction as a modulation of the omission response.

      We thank the Reviewer for the comment and appreciate the opportunity to address these concerns. We have re-evaluated the boxplot in Figure 2E and want to clarify that the two participants mentioned by Reviewer #1, despite being somewhat distant from the rest of the group, are not outliers according to the standard Tukey’s rule. As shown in the figure below, no participant fell outside the upper (Q3+1.5xIQR) and lower whiskers (Q1-1.5xIQR) of the boxplot. 

      Moreover, we believe that the presence of a main effect of omission type does not impact the interpretation of the interaction, especially considering that these effects emerge over distinct clusters of channels (see Fig. 1 C; Supplementary Fig. 2 A). 

      Based on these considerations - and along with the evidence collected in the control study and the source reconstruction data reported in the new version of the manuscript - we find it unlikely that the interaction effect is driven by outliers or by a main effect of omission type. We appreciate the opportunity provided by the Reviewer to address these concerns, as we believe they strengthen the claim that the observed effect is driven by the hypothesized long-term linguistic priors rather than uncontrolled group differences.

      Author response image 1.

      It should also be noted that in the source analysis, the interaction only showed a trend in the left auditory cortex, but in its current version the manuscript does not report the statistics of such a trend.

      We  appreciate  the  Reviewer’s  suggestion  to  incorporate  more comprehensive source analyses. In the new version of the paper, we perform new analyses on the source data using a new Atlas with more fine-grained parcellations of the regions of interests (ROIs) (Brainnetome atlas; Fan et al., 2016) and focusing on peak activity to increase response’s sensitivity in space and time. We therefore invite the Reviewer to read the updated part on source reconstruction included in the Results and Methods sections of the paper.  

      Reviewer #1 (Recommendations For The Authors):

      While I have described my biggest concerns with respect to this work in the public review, here I list more specific points that I hope will help to improve the manuscript. Some of these are very minor, but I hope you will still find them constructive. 

      (1) I understand the difficulties implied in recruiting subjects from two different linguistic groups, but with 20 subjects per group and a between-groups design, the current study is somewhat underpowered. A post-hoc power analysis shows an achieved power of 46% for medium effect sizes (d = 0.5, and alpha = 0.05, one-sided test). A sensitivity analysis shows that the experiment only has 80% power for effect sizes of d = 0.8 and above. It would be important to acknowledge this limitation in the manuscript. 

      We thank the Reviewer for reporting these analyses. It must be noted that our effect of interest was based on Molnar et al.’s (2016) behavioral experiment, in which a sample size of 16 subjects per group was sufficient to detect the perceptual grouping effect. In Yoshida et al., (2010), the perceptual grouping effect emerged with two groups of 20 7–8-month-old Japanese and English-learning infants. Based on these previous findings, we believe that a sample size of 20 participants per group can be considered appropriate for the current MEG study. We clarified these aspects in the Participants section of the manuscript, in which we specified that previous behavioral studies detected the perceptual grouping with similar sample sizes. Moreover, to acknowledge the limitation highlighted by the Reviewer, we also include the power and sensitivity analysis in a note in the same section (see note 2 in the Participants section).

      (2) All the line plots in the manuscript could be made much more informative by adding 95% CI bars. For example, in Figure 4A, the omission response for the long tone departs from the one for the short tone very early. Adding CIs would help to assess the magnitude of that early difference. Error bars are present in Figure 3, but it is not specified what these bars represent. 

      Thanks for the comments. We added the explanation of the error bars in the new version of Figure 3. For the remaining figures, we prefer maintaining the current version of the ERF, as the box-plots accompanying them provide information about the distribution of the effect across participants.

      (3) In the source analysis, there is only mention of an interaction trend in the left auditory cortex, but no statistics are presented. If the authors prefer to mention such a trend, I think it would be important to provide its stats to allow the reader to assess its relevance. 

      We performed new analysis on the source data, all reported in the updated version of the manuscript.

      (4) In the discussion section, the authors refer to the source analysis and state that "the interaction is evident in the left". But if only a statistical trend was observed, this statement would be misleading. 

      We agree with this comment. We invite the Reviewer to check the new part on source reconstruction, in which contrasts going in the same direction of the sensor level data are performed.

      (5) In the discussion the authors argue that "This result highlights the presence of two distinct systems for the generation of auditory" that operate at different temporal scales, but the current work doesn't offer evidence for the existence of two different systems. The effects of long-term priors and short-term priors presented here are not dissociated and instead sum up. It remains possible that a single system is in place, collecting statistics of stimuli over a lifetime, including the statistics experienced during the experiment. 

      Thanks for pointing that out. We changed the sentence above as follows: “This result highlights the presence of an active predictive system that relies on natural sound statistics learned over a lifetime to process incoming auditory input”.

      (6) In the discussion, the authors acknowledge that the omission response has been interpreted both as pure prediction and as pure prediction error. Then they declare that "Overall, these findings are consistent with the idea that omission responses reflect, at least in part, prediction error signals.". However an argument for this statement is not provided. 

      Thanks for pointing out this lack of argument. In the new version of the manuscript, we explained our rationale as follows: “Since sensory predictive signals primarily arise in the same regions as the actual input, the activation of a broader network of regions in omission responses compared to tones suggests that omission responses reflect, at least in part, prediction error signals”.

      (7) In the discussion the authors present an alternative explanation in which both groups might devote more resources to the processing of long events, because these are relevant content words. Following this, they argue that "Independently on the interpretation, the lack of a main effect of omission type in the control condition suggests that the long omission effect is driven by experience with the native language." However as there was no manipulation of duration in the control experiment, a lack of the main effect of omission type there does not rule out the alternative explanation that the authors put forward. 

      This is correct; thanks for noticing it. We removed the sentence above to avoid ambiguities.

      Minor points: 

      (8) The scale of the y-axis in Figure 2C might be wrong, as it goes from 9 to 11 and then to 12. If the scale is linear, the top value should be 13, or the bottom value should be 10. 

      Figure 2C has been modified accordingly, thanks for noticing the error.

      (9) There is a very long paragraph starting on page 7 and ending on page 8. Toward the end of the paragraph, the analysis of the control condition is presented. That could start a new paragraph.

      Thanks for the suggestion. We modified the manuscript as suggested.

      Reviewer #2 (Public Review):

      (1) Despite the evidence provided on neural responses, the main conclusion of the study reflects a known behavioral effect on rhythmic sequence perceptual organization driven by linguistic background (Molnar et al. 2016, particularly). Also, the authors themselves provide a good review of the literature that evidences the influence of longterm priors in neural responses related to predictive activity. Thus, in my opinion, the strength of the statements the authors make on the novelty of the findings may be a bit far-fetched in some instances.

      Thanks for the suggestion. A similar point was also advanced by Reviewer 1. In general, we believe our work speaks about the predictive nature of such experiencedependent  effects, and show that these linguistic priors shape sensory processes at very early stages. This is discussed in the sixth and seventh paragraphs of the Discussion section. In the new version of the article, we modified some statements and tried to make them more coherent with the scope of the present work. For instance, we changed "This result highlights the presence of two distinct systems for the generation of auditory predictive models, one relying on the transition probabilities governing the recent past, and another relying on natural sound statistics learned over a lifetime“ with “This result highlights the presence of an active predictive system that relies on natural sound statistics learned over a lifetime to process incoming auditory input”.

      (2) Albeit the paradigm is well designed, I fail to see the grounding of the hypotheses laid by the authors as framed under the predictive coding perspective. The study assumes that responses to an omission at the beginning of a perceptual rhythmic pattern will be stronger than at the end. I feel this is unjustified. If anything, omission responses should be larger when the gap occurs at the end of the pattern, as that would be where stronger expectations are placed: if in my language a short sound occurs after a long one, and I perceptually group tone sequences of alternating tone duration accordingly, when I hear a short sound I will expect a long one following; but after a long one, I don't necessarily need to expect a short one, as something else might occur.

      A similar point was advanced by Reviewer #1. We tried to clarify the rationale behind our hypothesis. Please refer to the response provided to the first comment of Reviewer #1 above.

      (3) In this regard, it is my opinion that what is reflected in the data may be better accounted for (or at least, additionally) by a different neural response to an omission depending on the phase of an underlying attentional rhythm (in terms of Large and Jones rhythmic attention theory, for instance) and putative underlying entrained oscillatory neural activity (in terms of Lakatos' studies, for instance). Certainly, the fact that the aligned phase may differ depending on linguistic background is very interesting and would reflect the known behavioral effect.

      We thank the Reviewer for this comment. We explored in more detail the possibility that the aligned phase may differ depending on linguistic background, which is indeed a very interesting hypothesis. In the phase analyses reported below we focused on the instantaneous phase angle time locked to the onset of short and long tones presented in the experiment.

      In short, we extracted time intervals of two seconds centered on the onset of the tones for each participant (~200 trials per condition) and using a wavelet transform (implemented in Fieldtrip ft_freqanalysis) we targeted the 0.92 Hz frequency that corresponds to the rhythm of presentation of our pairs of tones. We extracted the phase angle for each time point and using the circular statistics toolbox implemented in Matlab we computed the Raleigh z scores across all the sensor space for each tone (long and short tone) and group (Spanish (Spa) dominants and Basque (Eus) dominants). This method evaluates the instantaneous phase clustering at a specific time point, thus evaluating the presence of a specific oscillatory pattern at the onset of the specific tone. 

      Author response image 2.

      Here we observe that the phase clustering was stronger in the right sensors for both groups. The critical point is to evaluate the phase angle (estimated in phase radians) for the two groups and the two tones and see if there are statistical differences. We focused first on the sensor with higher clustering (right temporal MEG1323) and observed very similar phase angles for the two groups both for long and short tones (see image below). We then focused on the four left fronto-temporal sensor pairs who showed the significant interaction: here we observed one sensor (MEG0412) with different effects for the two groups (interaction group by tone was significant, p=0.02): for short tones the “Watson (1961) approximation U2 test” showed a p-value of 0.11, while for long tones the p-value was 0.03 (after correction for multiple comparisons). 

      Overall, the present findings suggest the tendency to phase aligning differently in the two groups to long and short tones in the left fronto-temporal hemisphere. However, the effect could be detected only in one gradiometer sensor and it was not statistically robust. The effect in the right hemisphere was statistically more robust, but it was not sensitive to group language dominance. 

      Due to the inconclusive nature of these analyses regarding the role of language experience in shaping the phase alignment to rhythmic sound sequences, we prefer to keep these results in the public review rather than incorporating them in the article.  Nonetheless, we believe that this decision does not undermine the main finding that the group differences in the MMN amplitude are driven by long-term predictions – especially in light of the many studies indicating the MMN as a putative index of prediction error (e.g., Bendixen et al., 2012; Heilbron and Chait, 2018). Moreover, as suggested in the preliminary reply, despite evoked responses and oscillations are often considered distinct electrophysiological phenomena, current evidence suggests that these phenomena are interconnected (e.g., Studenova et al., 2023). In our view, the hypotheses that the MMN reflects differences in phase alignment and long-term prediction errors are not mutually exclusive.

      Author response image 3.

      (4) Source localization is performed on sensor-level significant data. The lack of  sourcelevel statistics weakens the conclusions that can be extracted. Furthermore, only the source reflecting the interaction pattern is taken into account in detail as supporting their hypotheses, overlooking other sources. Also, the right IFG source activity is not depicted, but looking at whole brain maps seems even stronger than the left. To sum up, source localization data, as informative as it could be, does not strongly support the author's claims in its current state. 

      A similar comment was also advanced by Reviewer #1 (comment 2). We appreciate the suggestion to incorporate more comprehensive source analyses. In the new version of the paper, we perform new analyses on the source data using a new Atlas with more fine-grained parcellations of the ROIs, and focusing on peak activity to increase response’s sensitivity in space and time. We therefore invite the Reviewer to read the updated part on source reconstruction included in the Results and Methods sections of the paper. 

      In the article, we report only the source reconstruction data from ROIs in the left hemisphere, because it is there that the interaction effect arises at the sensor level. However, we also explored the homologous regions in the right hemisphere, as requested by the Reviewer. A cluster-based permutation test focusing on the interaction between language group and omission type was performed on both the right STG and IFG data. No significant interaction emerged in any of these regions. Below a plot of the source activity time series over ROIs in the right STG and IFG. 

      Author response image 4.

      Reviewer #2 (Recommendations For The Authors):

      In this set of private recommendations for the authors, I will outline a couple of minor comments and try to encourage additional data analyses that, in my opinion, would strengthen the evidence provided by the study. 

      (1) As I noted in the public review, I believe an oscillatory analysis of the data would, on one hand, provide stronger support for the behavioral effect of rhythmic perceptual organization given the lack of behavioral direct evidence; and, on the other hand, provide evidence (to be discussed if so) for a role of entrained oscillation phase in explaining the different pattern of omission responses. One analysis the authors could try is to measure the phase angle of an oscillation, the frequency of which relates to the length of the binary pattern, at the onset of short and long tones, separately, and compare it across groups. Also, single trials of omission responses could be sorted according to that phase. 

      Thanks for the suggestion. Please see phase analyses reported above.

      (2) I wonder why source activity for the right IFG was not shown. I urge the authors to provide and discuss a more complete picture of the source activity found. Given the lack of source statistics (which could be performed), I find it a must to give an overall view. I find it so because I believe the distinction between perceptual grouping effects due to inherent acoustic differences across languages or semantic differences is so interesting. 

      Thanks again for the invitation to provide a more complete picture of the source activity data. As mentioned in the response above, we invite the Reviewer to read the new related part included in the Results and Methods sections of the paper. In our updated source reconstruction analysis, we find that some regions around the left STG show a pattern that resembles the one found at the sensor-level, providing further support for the “acoustic” (rather than syntactic/semantic) nature of the effect. 

      We did not report ROI analysis on the right hemisphere because the interaction effect at sensor level emerged on the left hemisphere. Yet, we included a summary of this analysis in the public response above. 

      (3) Related to this, I have to acknowledge I had to read the whole Molnar et al. (2016) study to find the only evidence so far that, acoustically, in terms of sound duration, Basque and Spanish differ. This was hypothesized before but only at Molnar, an acoustic analysis is performed. I think this is key, and the authors should give it a deeper account in their manuscript. I spend my review of this study thinking, well, but when we speak we actually bind together different words and the syllabic structure does not need to reflect the written one, so maybe the effect is due to a high-level statistical prior related to the content of the words... but Molnar showed me that actually, acoustically, there's a difference in accent and duration: "Taken together, Experiments 1a and 1b show that Basque and Spanish exhibit the predicted differences in terms of the position of prosodic prominence in their phonological phrases (Basque: trochaic, Spanish: iambic), even though the acoustic realization of this prominence involves not only intensity in Basque but duration, as well. Spanish, as predicted, only uses duration as a cue to mark phrasal prosody." 

      Thanks for the suggestion, the distinction in terms of sound duration in Spanish and Basque reported by Molnar is indeed very relevant for the current study. 

      We add a few sentences to highlight the acoustic analysis by Molnar and the consequent acoustic nature of the reported effect.

      In the introduction: “Specifically, the effect has been proposed to depend on the quasiperiodic alternation of short and long auditory events in the speech signal – reported in previous acoustic analyses (Molnar et al., 2016) – which reflect the linearization of function words (e.g., articles, prepositions) and content words (e.g., nouns, adjectives, verbs).”

      In the discussion, paragraph 3, we changed “We hypothesized that this effect is linked to a long-term “duration prior” originating from the syntactic function-content word order of language, and specifically, from its acoustic consequences on the prosodic structure” with “We hypothesized that this effect is linked to a long-term “duration prior” originating from the acoustic properties of the two languages, specifically from the alternation of short and long auditory events in their prosody”.

      In the discussion, end of paragraph eight: “The reconstruction of cortical sources associated with the omission of short and long tones in the two groups showed that an interaction effect mirroring the one at the sensor level was present in the left STG, but not in the left IFG (fig. 3, B, C, D). Pairwise comparisons within different ROIs of the left STG indicated that the interaction effect was stronger over primary (BA 41/42) rather than associative (BAs 22) portions of the auditory cortex. Overall, these results suggest that the “duration prior” is linked to the acoustic properties of a given language rather than its syntactic configurations”.

      Now, some minor comments: 

      (1) Where did the experiments take place? Were they in accordance with the Declaration of Helsinki? Did participants give informed consent? 

      All the requested information has been added to the updated version of the manuscript. Thanks for pointing out this.

      (2) The fixed interval should be called inter-stimulus interval. 

      Thanks for pointing this out. We changed the wording as suggested.

      (3) The authors state that "Omission responses allow to examine the presence of putative error signals decoupled from bottom-up sensory input, offering a critical test for predictive coding (Walsh et al 2020, Heilbron and Chait, 2018).". However the way omission responses are computed in their study is by subtracting the activity from the previous tone. This necessarily means that in the omission activity analyzed, there's bottom-up sensory input activity. As performing another experiment with a control condition in which a sequence of randomly presented tones with different durations to compare directly the omission activity in both sequences (experimental and control) is possibly too demanding, I at least urge the authors to incorporate the fact that their omission responses do reflect also tone activity. And consider, for future experiments, the inclusion of further control conditions. 

      Thanks for the opportunity to clarify this aspect. Actually, the way we computed the omission MMN is not by subtracting the activity of the previous tone from the omission, but by subtracting the activity of randomly selected tones across the whole experiment. That is, we randomly selected around 120 long and short tones (i.e., about the same number as the omissions); we computed the ERF for the long and short tones; we subtracted these ERF from the ERF of the corresponding short and long omissions. We clarified these aspects in both the Materials and Methods (ERF analysis paragraph) and Results section.

      Moreover, the subtraction strategy - which is the standard approach to calculate the MMN - allows to handle possible neural carryover effects arising from the perception of the tone preceding the omission.

      The sentence "Omission responses allow to examine the presence of putative error signals decoupled from bottom-up sensory input, offering a critical test for predictive coding (Walsh et al 2020, Heilbron and Chait, 2018)." simply refer to the fact that the error responses resulting from an omission are purely endogenous, as omissions are just absence of an expected input (i.e., silence). On the other hand, when a predicted sequence of tones is disrupted by an auditory deviants (e.g., a tone with a different pitch or duration than the expected one), the resulting error response is not purely endogenous, but it partially includes the response to the acoustic properties of the deviant.

      (4) When multiple clusters emerged from a comparison, only the most significant cluster was reported. Why? 

      We found more than one significant cluster only in the comparison between pure omissions vs tones (figure 2 A, B). The additional significant cluster from this comparison is associated with a P-value of 0.04, emerges slightly earlier in time, and goes in the same direction as the cluster reported in the paper i.e., larger ERF responses for omission vs tones. We added a note specifying the presence of this second cluster, along with a figure on the supplementary material (Supplementary Fig. 1 A, B).

      (5) Fig 2, if ERFs are baseline corrected -50 to 0ms, why do the plots show pre-stimulus amplitudes not centered at 0? 

      This is because we combined the latitudinal and longitudinal gradiometers on the ERF obtained after baseline correction, by computing the root mean square of the signals at each sensor position (see also  https://www.fieldtriptoolbox.org/example/combineplanar_pipelineorder/). This information is reported in the methods part of the article.

      (6) Fig 2, add units to color bars. 

      Sure.

      (7) Fig 2 F and G, put colorbar scale the same for all topographies. 

      Sure, thanks for pointing this out.

      (8) The interaction effect language (Spanish; Basque) X omission type (short; long) appears only in a small cluster of 4 sensors not located at the locations with larger amplitudes to omissions. Authors report it as left frontotemporal, but it seems to me frontocentral with a slight left lateralization.

      (1) the fact that the cluster reflecting the interaction effect does not overlap with the peaks of activity is not surprising in our view. Many sources contribute to the generation of the MMN. The goal of our work was to establish whether there is also evidence for a long-term system (among the many) contributing to this. That is why we perform a first analysis on the whole omission response network (likely including many sources and predictive/attentional systems), and then we zoom in and focus on our hypothesized interaction. We never claim that the main source underlying the omissionMMM is the long-term predictive system. 

      (2) The exact location of those sensors is at the periphery of the left-hemisphere omission response, which mainly reflects activity from the left temporal regions. The sensor location of this cluster could be influenced by multiple factors, including (i) the direction of the source dipoles determining an effect; (ii) the combination of multiple sources contributing to the activity measured at a specific sensor location, whose unmixing could be solved only with a beamforming source approach. Based on the whole evidence we collected also in the source analyzes we concluded that the major contributors to the sensor-level interaction are emerging from both frontal and temporal regions.

      Reviewer #3 (Public Review):

      (1) The main weaknesses are the strength of the effects and generalisability. The sample size is also relatively small by today's standards, with N=20 in each group. Furthermore, the crucial effects are all mostly in the .01>P<.05 range, such as the crucial interaction P=.03. It would be nice to see it replicated in the future, with more participants and other languages. It would also have been nice to see behavioural data that could be correlated with neural data to better understand the real-world consequences of the effect.

      We appreciate the positive feedback from Reviewer #3. We agree that it would be nice to see this study replicated in the future with larger sample sizes and a behavioral counterpart. Below are a few comments concerning the weakness highlighted: 

      (i) Concerning the sample size: a similar point was raised by Reviewer #1. We report our reply as presented above: “Despite a sample size of 20 participants per group can be considered relatively small for detecting an effect in a between-group design, it must be noted that our effect of interest was based on Molnar et al.’s (2016) experiment, where a sample size of 16 subjects per group was sufficient to detect the perceptual grouping effect. In Yoshida et al., 2010, the perceptual grouping effect arose with two groups of 20 7–8-month-old Japanese and English-learning infants. Based on these findings, we believe that a sample size of 20 participants per group can be considered appropriate for the current study”. We clarified these aspects in the new version of the manuscript.

      (ii) We believe that the lack of behavioral data does not undermine the main findings of this study, given the careful selection of the participants and the well-known robustness of the perceptual grouping effect (e.g., Iversen 2008; Yoshida et al., 2010; Molnar et al. 2014; Molnar et al. 2016). As highlighted by Reviewer #2, having Spanish and Basque dominant “speakers as a sample equates that in Molnar et al. (2016), and thus overcomes the lack of direct behavioral evidence for a difference in rhythmic grouping across linguistic groups. Molnar et al. (2016)'s evidence on the behavioral effect is compelling, and the evidence on neural signatures provided by the present study aligns with it”. (iii) Regarding the fact that the “crucial effects are all mostly in the .01>P<.05 range”: we want to stress that the approach we used to detect the interaction effect was conservative, using a cluster-based permutation approach with no a priori assumptions about the location of the effect. The robustness of our approach has also been highlighted by Reviewer 2: “Data analyses. Sound, state-of-the-art methodology in the event-related field analyses at the sensor level.” In sum, despite some crucial effects being in the .01>P<.05 range, we believe that the statistical soundness of our analysis, combined with the lack of effect in the control condition, provides compelling evidence for our H1.

      Reviewer #3 (Recommendations For The Authors):

      Figures - Recommend converting all diagrams and plots to vector images to ensure they remain clear when zoomed in the PDF format. 

      Sure, thanks. 

      Figure 1: To improve clarity, the representation of sound durations in panels C and D should be revisited. The use of quavers/eighth notes can be confusing for those familiar with musical notation, as they imply isochrony. If printed in black and white, colour distinctions may be lost, making it difficult to discern the different durations. A more universal representation, such as spectrograms, might be more effective. 

      Thanks for the suggestion. It’s true that the quavers/eighth notes might be confusing in that respect. However, we find this notation as a relatively standard approach to define paradigms in auditory neuroscience, see for instance the two papers below. In the new version of the manuscript, we specified in the captions under the figure that the notes refer to individual tones, in order to avoid ambiguities.

      - Wacongne, C., Labyt, E., Van Wassenhove, V., Bekinschtein, T., Naccache, L., & Dehaene, S. (2011). Evidence for a hierarchy of predictions and prediction errors in human cortex. Proceedings of the National Academy of Sciences, 108(51), 20754-20759.

      - Dehaene, S., Meyniel, F., Wacongne, C., Wang, L., & Pallier, C. (2015). The neural representation of sequences: from transition probabilities to algebraic patterns and linguistic trees. Neuron, 88(1), 2-19.

      Figure 2 : In panel C of Figure 2, please include the exact p-value for the interaction observed. Refrain from using asterisks or "n.s." and opt for exact p-values throughout for the sake of clarity. 

      Thank you for your suggestion. We have included the exact p-value for the interaction in panel C of Figure 2. However, for the remaining figures, we have chosen to maintain the use of asterisks and "n.s.". We would like our pictures to convey the key findings concisely, while the numerical details can be found in the article text. The caption below the image also provides guidance on the interpretation of the p-values: (statistical significance: **p < 0.01, *p < 0.05, and ns p > 0.05).  

      Figure 3 Note typo "Omission reponse"

      Fixed. Thanks for noticing the typo. 

      A note: we moved the figure reflecting the main effect of long tone omission and the lack of main effect of language background (Figure 4 in the previous manuscript) in the supplementary material (Supplementary Figure 2).

      References

      Bendixen, A., SanMiguel, I., & Schröger, E. (2012). Early electrophysiological indicators for predictive processing in audition: a review. International Journal of Psychophysiology, 83(2), 120-131.

      Heilbron, M., & Chait, M. (2018). Great expectations: is there evidence for predictive coding in auditory cortex?. Neuroscience, 389, 54-73.

      Iversen, J. R., Patel, A. D., & Ohgushi, K. (2008). Perception of rhythmic grouping depends on auditory experience. The Journal of the Acoustical Society of America, 124(4), 22632271.

      Molnar, M., Lallier, M., & Carreiras, M. (2014). The amount of language exposure determines nonlinguistic tone grouping biases in infants from a bilingual environment. Language Learning, 64(s2), 45-64.

      Molnar, M., Carreiras, M., & Gervain, J. (2016). Language dominance shapes non-linguistic rhythmic grouping in bilinguals. Cognition, 152, 150-159.

      Ross, J. M., & Hamm, J. P. (2020). Cortical microcircuit mechanisms of mismatch negativity and its underlying subcomponents. Frontiers in Neural Circuits, 14, 13.

      Simon, J., Balla, V., & Winkler, I. (2019). Temporal boundary of auditory event formation: An electrophysiological marker. International Journal of Psychophysiology, 140, 53-61.

      Studenova, A. A., Forster, C., Engemann, D. A., Hensch, T., Sander, C., Mauche, N., ... & Nikulin, V. V. (2023). Event-related modulation of alpha rhythm explains the auditory P300 evoked response in EEG. bioRxiv, 2023-02.

      Yoshida, K. A., Iversen, J. R., Patel, A. D., Mazuka, R., Nito, H., Gervain, J., & Werker, J. F. (2010). The development of perceptual grouping biases in infancy: A Japanese-English cross-linguistic study. Cognition, 115(2), 356-361.

      Zhang, Y., Yan, F., Wang, L., Wang, Y., Wang, C., Wang, Q., & Huang, L. (2018). Cortical areas associated with mismatch negativity: A connectivity study using propofol anesthesia. Frontiers in Human Neuroscience, 12, 392.

      Ladinig, O., Honing, H., Háden, G., & Winkler, I. (2009). Probing attentive and preattentive emergent meter in adult listeners without extensive music training. Music Perception, 26(4), 377-386. 

      Brochard, R., Abecasis, D., Potter, D., Ragot, R., & Drake, C. (2003). The “ticktock” of our internal clock: Direct brain evidence of subjective accents in isochronous sequences. Psychological Science, 14(4), 362-366.

      Potter, D. D., Fenwick, M., Abecasis, D., & Brochard, R. (2009). Perceiving rhythm where none exists: Event-related potential (ERP) correlates of subjective accenting. Cortex, 45(1), 103-109.

      Bouwer, F. L., Werner, C. M., Knetemann, M., & Honing, H. (2016). Disentangling beat perception from sequential learning and examining the influence of attention and musical abilities on ERP responses to rhythm. Neuropsychologia, 85, 80-90.

    1. Author response:

      Public Reviews: 

      Reviewer #1 (Public Review): 

      Summary: 

      In Drosophila melanogaster, expression of Sex-lethal (Sxl) protein determines sexual identity and drives female development. Functional Sxl protein is absent from males where splicing includes a termination codon-containing "poison" exon. Early during development, in the soma of female individuals, Sxl expression is initiated by an X chromosome counting mechanism that activates the Sxl establishment promoter (SxlPE) to produce an initial amount of Sxl protein. This then suppresses the inclusion of the "poison" exon, directing the constructive splicing of Sxl transcripts emerging from the Sxl maintenance promotor (SxlPM) which is activated at a later stage during development irrespective of sex. This autoregulatory loop maintains Sxl expression and commits to female development. 

      Sxl also determines the sexual identity of the germline. Here Sxl expression generally follows the same principles as in somatic tissues, but the way expression is initiated differs from the soma. This regulation has so far remained elusive. 

      In the presented manuscript, Goyal et al. show that activation of Sxl expression in the germline depends on additional regulatory DNA sequences, or sequences different from the ones driving initial Sxl expression in the soma. They further demonstrate that sisterless A (sisA), a transcription factor that is required for activation of Sxl expression in the soma, is also necessary, but not sufficient, to initiate the expression of functional Sxl protein in female germ cells. sisA expression precedes Sxl induction in the germline and its ablation by RNAi results in impaired expression of Sxl, formation of ovarian tumors, and germline loss, phenocopying the loss of Sxl. Intriguingly, this phenotype can be rescued by the forced expression of Sxl, demonstrating that the primary function of sisA in the germline is the induction of Sxl expression. 

      Strengths: 

      The clever design of probes (for RNA FISH) and reporters allowed the authors to dissect Sxl expression from different promoters to get novel insight into sex-specific gene regulation in the germline. All experiments are carefully controlled. Since Sxl regulation differs between the soma and the germline, somatic tissues provide elegant internal controls in many experiments, ensuring e.g. functionality of the reporters. Similarly, animals carrying newly generated alleles (e.g. genomic tagging of the Sxl locus) are fertile and viable, demonstrating that the genetic manipulation does not interfere with protein function. The conclusions drawn from the experimental data are sound and advance our understanding of how Sxl expression is induced in the female germline. 

      Weaknesses: 

      The assays employed by the authors provide valuable information on when Sxl promoters become active. However, since no information on the stability of the gene products (i.e. RNA and protein) is available, it remains unclear when the SxlPE promoter is switched off in the germline (conceptually it only needs to be active for a short time period to initiate production of functional Sxl protein). As correctly stated by the authors, the persisting signals observed in the germline might therefore not reflect the continuous activity of the SxlPE promoter. 

      Mapping of regulatory elements and their function: SxlPE with 1.5 kb of flanking upstream sequence is sufficient to recapitulate early Sxl expression in the soma. The authors now provide evidence that beyond that, additional DNA sequences flanking the SxlPE promoter are required for germline expression. However, a more precise mapping was not performed. Also, due to technical limitations, the authors could not precisely map the sisA binding sites. Since this protein is also involved in the somatic induction of Sxl, its binding sites likely reside in the region 1.5kb upstream of the SxlPE promoter, which has been reported to be sufficient for somatic regulation. The regulatory role of the sequences beyond SxlPE-1.5kb therefore remains unaddressed and it remains to be investigated which trans-acting factor(s) exert(s) its/their function(s) via this region. 

      We agree that a more precise mapping of the essential elements within the 10.2 kb reporter is an important direction in which to proceed. Unfortunately, this is out of the scope of the current manuscript given current lab personnel. In regard to the 1.5 kb promoter that activates SxlPE in the soma, we do not feel that the Sisa binding sites are necessarily in this region. It is important to note that, while the 1.5 kb promoter is sufficient for female-specific expression in the soma, it may not contain all of the regulatory elements that normally regulate PE from the endogenous locus. Activation of PE in the soma is thought to be regulated by a combination of positive-acting factors (SisA, SisB, etc.) and repressive factors (e.g. Dpn) that set a threshold for PE activation. Much more work would need to be done to determine whether all of these factors bind to the 1.5 kb promoter, or whether additional sequences are also involved to control the proper timing and robustness of normal Sxl PE activation in the soma.

      The central question of how Sxl expression is initiated and controlled in the germline still remains unanswered. Since sisA is zygotically expressed in both the male and the female germline (Figure 4D), it is unlikely the factor that restricts Sxl expression to the female germline. 

      X chromosome “counting” elements like SisA are always expressed in both males and females, but it is thought that the 2X does of them in females activates PE, while the 1X does in males does not. Thus, we do expect SisA to be expressed in both males and females as we observed.

      How does weak expression of Sxl in male tissues or expression above background after knockdown of sisA reconcile with the model that an autoregulatory feedback loop enforces constant and clonally inheritable Sxl expression once Sxl is induced? Is the current model for Sxl expression too simple or are we missing additional factors that modulate Sxl expression (such as e.g. Sister of Sex-lethal)? While I do not expect the authors to answer these questions, I would expect them to appropriately address these intriguing aspects in the discussion. 

      It is difficult to know what is “background” and what is actual weak Sxl expression in males. We agree that, if it is real, then why it doesn’t activate autoregulation of the Sxl PM transcript is mysterious. And yes, the current model for female-specific expression of Sxl in the soma may well be incomplete. Sxl PM transcript is present in the testis based on community RNA-seq data and our own analysis of male vs. female bam-mutant gonads (PMID 31329582), but it is at lower levels. Whether the lower level in the testis is due to tissue differences or sex-specific regulation of RNA levels is unknown. Our observations that the HA-tagged Sxl Early protein remains present in somatic cells in L1 larvae, and that GFP expression from the 10.2 kb Sxl PE-GFP can be detected in the soma until L2 could either be due to perdurance of the protein products, or continued sex-specific expression of PE long after the time that it was thought to shut off. This is also long after dosage compensation should have equalized the expression of X chromosome gene expression, meaning that X chromosomes can no longer be “counted” by factors like SisA and SisB. Thus, sex-specific expression of PE at this time would require another mechanism besides the current model (such as feedback regulation of Sxl PE transcription from downstream factors).

      Reviewer #2 (Public Review): 

      Summary: 

      The authors wanted to determine whether cis-acting factors of Sxl - two different Sxl promoters in somatic cells - regulate Sxl in a similar way in germ cells. They also wanted to determine whether trans-acting factors known to regulate Sxl in the soma also regulate Sxl in the germline. 

      Regarding the cis-acting factors, they examine the Sxl "establishment promoter" (SxlPE) that is activated in female somatic cells by the presence of two X chromosomes. Slightly later in development, dosage compensation equalizes X chromosome expression in males and females and so X chromosomes can no longer be counted. The second Sxl promoter is the "maintenance promoter," (SxlPM), which is activated in both sexes. The mRNA produced from the maintenance promoter has to be alternatively splicing from early Sxl protein generated earlier in development by the PE. This leads to an autoregulatory loop that maintains Sxl expression in female somatic cells. The authors used fluorescent in situ hybridization (FISH) with oligopaints to determine the temporal activation of the PE or PM promoters. They find that - unlike the soma - the PE does not precede the PM and instead is activated contemporaneously or later than the PM - this is confusing with the later results (see below). Next, they generated transcriptional reporter constructs containing large segments of the Sxl locus, the 1.5 kb used in somatic studies, a 5.2 kb reporter, and a 10.2 kb. Interestingly the 1.5 kb reporter that was reported to recapitulate Sxl expression in soma and germline was not observed by the authors. The 5.2 kb reporter was observed in female somatic cells but not in germ cells. Only when they include an additional 5 kb downstream of the 5.2 kb reporter (here the 10.2 kb reporter) they did see expression in germ cells but this occurred at the L1 stages. Their data indicate that Sxl activity in the germ requires different cis-regulation than the soma and that the PE is activated later in germ cells than in somatic cells. The authors next use gene editing to insert epitope tags in two distinct strains in the hopes of creating an early Sxl and a later Sxl protein derived from the PE and PM, respectively. The HA-tagged protein from the PE was seen in somatic cells but never in the germline, possibly due to very low expression. The FLAG-tagged late Sxl protein is observed in L2 germ cells. Because the early HA-Sxl protein is not perceptible in germ cells, it is not possible to conclude its role in the germline. However, because late FLAG-Sxl was only observed in L2 germ cells and the PE was detected in L1, this leaves open the possibility that PE produces early HA-Sxl (which currently cannot be detected), which then alternatively splices the transcript from the PM. In other words, the soma and germline could have a similar temporal relationship between the two Sxl promoters. While I agree with the authors about this conclusion, the earlier work with the oligopaints leads to the conclusion that SE is active after PM. This is confusing. 

      The temporal relationship between Sxl PE and Sxl PM in the germline is indeed confusing. One source of confusion comes from whether one is discussing Sxl protein production or promoter activity. As the reviewer nicely summarizes, our transcription analysis with oligopaints indicates that, unlike in the soma, Sxl PE is NOT on in the germline prior to PM. Our other data indicate that PE is instead likely only active well after transcription from PM has begun. However, this still means that the temporal order of the EARLY and LATE Sxl proteins can be the same as the soma. Even if PM is active well before PE in the germline, the PE transcript cannot produce any functional protein in the absence of being alternatively spliced by the Sxl protein (Sxl autoregulation). Thus, even if PM is active before PE in the germline, we would not expect to observe any LATE Sxl protein until the PE promoter comes on, and produces a pulse of EARLY Sxl protein. The fact that we observe LATE Sxl protein at L2 is consistent with our observation that the 10.2 kb Sxl PE reporter is active at L1. We will attempt to explain all of this better in a revised manuscript.

      Next, the authors wanted to turn their attention to the trans-acting factors that regulate Sxl in the soma, including Sisterless A (SisA), SisB, Runt, and the JAK/STAT ligand Unpaired. Using germline RNAi, the authors found that only knockdown of SisA causes ovarian tumors, similar to the loss of Sxl, suggesting that SisA regulates Sxl (ie the PE) in both the soma and the germline. They generated a SisA null allele using CRISPR/Cas9 and these animals had ovarian tumors and germ cell-less ovaries. FISH revealed that sisA is activated in primordial germ cells in stages 3-6 before the activation of Sxl. They used CRISPR-Cas9 to generate an endogenously-tagged SisA and found that tagged SisA was expressed in stage 3-6 PCGs, which is consistent with activating PE in the germline. They showed that sisA is upstream of Sxl as germline depletion of sisA led to a significant decrease in expression from the 10.2 kb PE reporter and in SXL protein. The authors could rescue the ovarian tumors and loss of Sxl protein upon germline depletion of sisA by supplying Sxl from another protein (the otu promoter). These data indicate that sisA is necessary for Sxl activation in the germline. However, ectopic sisA in germ cells in the testis did not lead to ectopic Sxl, suggesting that sisA is not sufficient to activate Sxl in the germline. 

      Strengths: 

      (1) The genetic and genomic approaches in this study are top-notch and they have generated reagents that will be very useful for the field. 

      (2) Excellent use of powerful approaches (oligo paint, reporter constructs, CRISPR-Cas9 alleles). 

      (3) The combination of state of art approaches and quantification of phenotypes allows the authors to make important conclusions. 

      Weaknesses: 

      (1) Confusion in line 127 (this indicates that SxlPE is not activated before SxlPM in the germline) about PE not being activated before the PM in the germline when later figures show that PE is activated in L1 and late Sxl protein is seen in L2. It would be helpful to the readers if the authors edited the text to avoid this confusion. Perhaps more explanation of the results at specific points would be helpful. 

      We agree--see response above.

      Reviewer #3 (Public Review): 

      Summary: 

      The mechanisms governing the initial female-specific activation of Sex-lethal (Sxl) in the soma, the subsequent maintenance of female-specific expression and the various functions of Sxl in somatic sex determination and dosage compensation are well documented. While Sxl is also expressed in the female germline where it plays a critical role during oogenesis, the pathway that is responsible for turning Sxl on in germ cells has been a long-standing mystery. This manuscript from Goyal et al describes studies aimed at elucidating the mechanism(s) for the sex-specific activation of the Sex-lethal (Sxl) gene in the female germline of Drosophila. 

      In the soma, the Sxl establishment promoter, Sxl-Pe, is regulated in pre-cellular blastoderm embryos in somatic cells by several X-linked transcription factors (sis-a, sis-b, sis-c and runt). At this stage of development, the expression of these transcription factors is proportional to gene dose, 2x females and 1x in males. The cumulative two-fold difference in the expression of these transcription factors is sufficient to turn Sxl-Pe on in female embryos. Transcripts from the Sxl-Pe promoter encode an "early" version of the female Sxl protein, and they function to activate a splicing positive autoregulatory loop by promoting the female-specific splicing of the initial pre-mRNAs derived from the Sxl maintenance promoter, Sxl-Pm (which is located upstream of Sxl-Pm). These female Sxl-Pm mRNAs encode a Sxl protein with a different N-terminus from the Sxl-Pe mRNAs, and they function to maintain female-specific splicing in the soma during the remainder of development. 

      In this manuscript, the authors are trying to understand how the Sxl-Pm positive autoregulatory loop is established in germ cells. If Sxl-Pe is used and its activation precedes Sxl-Pm as is true in the soma, they should be able to detect Sxl-Pe transcripts in germ cells before Sxl-Pm transcripts appear. To test this possibility, they generated RNA FISH probes complementary to the Sxl-Pe first exon (which is part of an intron sequence in the Sxl-Pm transcript) and to a "common sequence" that labels both Sxl-Pe and Sxl-Pm transcripts. Transcripts labeled by both probes were detected in germ cells beginning at stage 5 (and reaching a peak at stage 10), so either the Sxl-Pm and Sxl-Pe promoters turn on simultaneously, or Sxl-Pe is not active. 

      They next switched to Sxl-Pe reporters. The first Sxl-Pe:gfp reporter they used has a 1.5 kb upstream region which in other studies was found to be sufficient to drive sex-specific expression in the soma of blastoderm embryos. Also like the endogenous Sxl gene it is not expressed in germ cells at this early stage. In 2011, Hashiyama et al reported that this 1.5 kb promoter fragment was able to drive gfp expression in Vasa-positive germ cells later in development in stage 9/10 embryos. However, because of the high background of gfp in the nearby soma, their result wasn't especially convincing. Though they don't show the data, Goyal et al indicated that unlike Hashiyama et al they were unable to detect gfp expressed from this reporter in germ cells. Goyal et al extended the upstream sequences in the reporter to 5 kb, but they were still unable to detect germline expression of gfp. 

      Goyal et al then generated a more complicated reporter which extends 5 kb upstream of the Sxl-Pe start site and 5 kb downstream-ending at or near 4th exon of the Sxl-Pm transcript (the Sxl-Pe10 kb reporter). (The authors were not explicit as to whether the 5 kb downstream sequence extended beyond the 4th exon splice junction-in which case splicing could potentially occur with an upstream exon(s)-or terminated prior to the splice junction as seems to be indicated in their diagram.) With this reporter, they were able to detect sex-specific gfp expression in the germline beginning in L1 (first instar larva). With the caveat that gfp detection might be delayed compared to the onset of reporter activation, these findings indicated that the sequences in the reporter are able to drive sex-specific transcription in the germline at least as early as L1. 

      The authors next tagged the N-terminal end of the Sxl-Pe protein with HA (using Crispr/Cas9) and the N-terminal end of Sxl-Pm protein with Flag. They report that the HA-Sxl-Pe protein is first detected in the soma at stage 9 of embryogenesis. Somatic HA-Sxl-Pe protein persists into L1, but is no longer detected in L2. However, while somatic HA-Sxl-Pe protein is detected, they were unable to detect HA-Sxl-Pe protein in germ cells. In the case of FLAG-Sxl-Pm, it could first be detected in L2 germ cells indicating that at this juncture the Sxl-positive autoregulatory loop has been activated. This contrasts with Sxl-Pm transcripts which are observed in a few germ cells at stage 5 of embryogenesis, and in most germ cells by stage 10. The authors propose (based on the expression pattern of the Sxl-Pe10kb reporter and the appearance of Flag-Sxl-Pm protein) that Sxl-Pe comes on in germ cells in L1, and that the Sxl-Pe protein activates the female splicing of Sxl-Pm transcripts, giving detectable Flag-Sxl-Pm proteins beginning in L2. 

      To investigate the signals that activate Sxl-Pe in germ cells, the authors tested four of the X-linked genes (sis-a, sis-b, sis-c, and runt) that function to activate Sxl-Pe in the soma in early embryos. RNAi knockdown of sis-b, sis-c, and runt had no apparent effect on oogenesis. In contrast, knockdown of sis-a resulted in tumorous ovaries, a phenotype associated with Sxl mutations. (Three different RNAi transgenes were tested-two gave this phenotype, the third did not.) Sxl-Pe10kb reporter activity in L1 female germ cells is also dependent on sis-A. 

      Several approaches were used to confirm a role for sis-a in a) oogenesis and b) the activation of the Sxl-Pm autoregulatory loop. They showed that sis-a germline clones (using tissue-specific Crispr/Cas9 editing) resulted in the tumorous ovary phenotype and reduced the expression of Sxl protein in these ovaries. They found that sis-a transcripts and GFP-tagged Sis-A protein are present in germ cells. Finally, they showed tumorous ovary phenotype induced by germline RNAi knockdown of sis-a can be partially rescued by expressing Sxl in the germ cells. 

      Critique: 

      While this manuscript addresses a longstanding puzzle - the mechanism activating the Sxl autoregulatory loop in female germ cells-and likely identified an important germline transcriptional activator of Sxl, sis-a, the data that they've generated doesn't make a compelling story. At every step, there are puzzle pieces that don't fit the narrative. In addition, some of their findings are inconsistent with many previous studies. 

      We respect and appreciate this reviewer for the detailed comments. However, we feel that the claim that our work doesn’t “make a compelling story” and that many “pieces…don’t fit the narrative” is incorrect. The main issue that this reviewer raises is that we do not know if Sxl “early” transcription in the germline initiates from the Pe promoter. This is true, which we fully acknowledge, but the detail of whether “germline early” transcription of Sxl initiates from Pe or from other, as yet undefined, germline promoter does not affect the main conclusions of the paper. These conclusions are that a) regulation of Sxl in the germline is fundamentally different from in the soma and 2) despite point (1), sisA acts as an activator of Sxl in both the soma and the germline. Neither of these main points is disputed by this reviewer.

      (1) The authors used RNA FISH to time the expression of Sxl-Pe and Sxl-Pm transcripts in germ cells. Transcripts complementary to Sxl-Pe and Sxl-Pm were detected at the same time in embryos beginning at stage 5. This is not a definitive experiment as it could mean a) that Sxl-Pe and Sxl-Pm turn on at the same time, b) that Sxl-Pe comes on after Sxl-Pm (as suggested by the Sxl-Pe10kb reporter) or c) Sxl-Pe never comes on. 

      When designing this experiment, we wanted to test whether the “soma model” of Pe activation before Pm was also true in the germ cells. Our data clearly demonstrate that transcripts beginning downstream of Pe are not expressed prior to transcripts beginning downstream of Pm. Thus, we can state that the “soma model” of Pe first and then Pm does not occur in the germline, which is very interesting. However, we cannot make any other conclusions about Pe in the germline from these data, as the reviewer indicates.

      (2) Hashiyama et al reported that they detected gfp expression in stage 9/10 germ cells from a 1.5 kb Sxl-Pe-gfp. As noted above, this result wasn't entirely convincing and thus it isn't surprising that Goyal et al were unable to reproduce it. Extending the upstream sequences to just before the 1st exon of Sxl-Pm transcripts also didn't give gfp expression in germ cells. Only when they added 5 kb downstream did they detect gfp expression. However, from this result, it isn't possible to conclude that the Sxl-Pe promoter is actually driving gfp expression in L1 germ cells. Instead, the Sxl promoter active in the germ line could be anywhere in their 10 kb reporter. 

      We agree that we have not determined the transcriptional start sites for Sxl in the germline and it is possible that the 10.2 kb reporter uses a different promoter than Pe, as long as that transcript can also be spliced into exon 4 where the GFP tag has been placed. The three types of experiments conducted—FISH to regions of the nascent transcripts, tagged versions of the different predicted ORFs, and promoter-GFP constructs—are extensive, but all have different limitations. Indeed, it would be challenging to determine the transcription start sites in the germline, as it would require obtaining enough L1 larvae to be able to dissociate the animals, or isolated gonads, into single cells in order to FACS purify the germ cells for RACE or long-read sequencing (I’m not sure that L1 larval single-nucleus seq would be enough for calling start sites). Otherwise, there would be no way to determine if expected or unexpected transcripts came from the soma or the germline. We can consider these experiments in the future.

      Fortunately, the main conclusions from this paper do not require knowing whether the germline uses Pe or some other “germline early” promoter that can produce Sxl protein in the absence of autoregulation by existing Sxl protein. The observations that a nascent transcript including the region downstream of Pm is observed in embryonic germ cells, but that the tagged LATE protein is not observed until L2, suggest that the transcript produced in early germ cells cannot produce a functional protein. This is consistent with the need for Sxl autoregulation of the Pm transcript in the germline as in the soma, as was previously thought. This is further supported by the observations that activity of the 10.2 kb reporter is only observed in L1 germ cells, and that the LATE Sxl protein is only observed in germ cells after this point. Thus, we can conclude that either Pe, or another “germline early” promoter, acts to produce female-specific Sxl protein to initiate autoregulation of Sxl splicing and protein production in the germline. We feel that this is a significant advance for the field, and we will make it more clear in the text that the initial expression of Sxl in the germline may not be from the Pe promoter.

      Other conclusions of the manuscript are unaffected by the start site for “germline early” Sxl transcription, including that the germline activates Sxl protein expression much later than the soma, which calls into question previous work indicating an early role for Sxl in the germline. Also unaffected is our conclusion that different enhancer sequences are required for activation of Sxl expression in the germline than in the soma, consistent with previous work demonstrating that the genetics of Sxl activation in the germline are different than in the soma. Lastly, our conclusions that sisA acts upstream of Sxl, and is required for Sxl germline expression, either directly or indirectly, are also unaffected by the nature of the Sxl “germline early” start site.

      (3) At least one experiment suggests that Sxl-Pe never comes on in germ cells. The authors tagged the N-terminus of the Sxl-Pe protein with HA and the N-terminus of the Sxl-Pm protein with Flag. Though they could detect HA-Sxl-Pe protein in the soma, they didn't detect it in germ cells. On the other hand, the Flag-Sxl-Pm protein was detected in L2 germ cells (but not earlier). These results would more or less fit with those obtained for the 10 kb reporter and would support the following model: Prior to L1, Sxl-Pm transcripts are expressed and spliced in the male pattern in both male and female germ cells. During L1, Sxl protein expressed via a mechanism that depends upon a 10 kb region spanning Sxl-Pe (but not on Sxl-Pe) is produced and by L2 there are sufficient amounts of this protein to switch the splicing of Sxl-Pm transcripts from a male to a female pattern-generating Flag-tagged Sxl-Pm protein. 

      As described above, it is indeed possible that another promoter besides Pe is active as the “germline early” promoter. We will make this more clear in a revised version, but the major conclusions of the manuscript are unaffected.

      (4) The 10kb reporter is sex-specific, but not germline-specific. The levels of gfp in female L1 somatic cells are equal to if not greater than those in L1 female germ cells. That the Sxl-Pe10kb reporter is active in the soma complicates the conclusion that it represents a germ line-specific promoter. Germline activity is, however, sensitive to sis-A knockdowns which is plus. Presumably, somatic expression of the reporter wouldn't be sensitive to a (late) sis-A knockdown- but this wasn't shown. 

      We are confused by this comment because we do not conclude that the Pe is a germline-specific promoter. Pe is known to be expressed in the soma, from considerable previous work cited by this reviewer, and the simplest model is that Pe is used in both the soma and the germline, as reflected by our 10.2 kb reporter. It is actually quite interesting how late this promoter seems active in the soma, contrary to current dogma, but we did not study somatic activation of Sxl in this work.

      (5) Their results with the HA-Sxl-Pe protein don't fit with many previous studies-assuming that the authors have explained their results properly. They report that HA-Sxl-Pe protein is first detected in the soma at stage 9 of embryogenesis and that it then persists till L2. However, previous studies have shown that Sxl-Pe transcripts and then Sxl-Pe proteins are first detected in ~NC11-NC12 embryos. In RNase protection experiments, the Sxl-Pe exon is observed in 2-4 hr embryos, but not detected in 5-8 hr, 14-12 hr, L1, L2, L3, or pupae. Northerns give pretty much the same picture. Western blots also show that Sxl-Pe proteins are first detectable around the blastoderm stage. So it is not at all clear why HA-Sxl-Pe proteins are first observed at stage 9 which, of course, is well after the time that the Sxl-Pm autoregulatory loop is established. 

      Given the obvious problems with the initial timing of somatic expression described here, it is hard to know what to make of the fact that HA-tagged Sxl-Pe proteins aren't observed in germ cells. 

      As for the presence of HA-Sxl-Pe proteins later than expected: While RNase protection/Northern experiments showed that Sxl-Pe mRNAs are expressed in 2-4 hr embryos and disappear thereafter, one could argue from the published Western experiments that the Sxl-PE proteins expressed at the blastoderm stage persist at least until the end embryogenesis, though perhaps at somewhat lower levels than at earlier points in development. So the fact that Goyal et al were able to detect HA-Sxl-Pe proteins in stage 9 embryos and later on in L1 larva probably isn't completely unexpected. What is unexpected is that the HA-Sxl-Pe proteins weren't present earlier. 

      We thank the reviewer for this detailed analysis. Since we were not focused on somatic expression of Sxl in this work, it is possible that stage 9 was the earliest stage we observed in our experiments, rather than the earliest stage in which it is ever observed. We will repeat these experiments to verify when the HA-tagged early Sxl protein is first observed. However, these comments have no bearing on our conclusions about Sxl expression in the germline, which is the focus of this manuscript.

      (6) The authors use RNAi and germline clones to demonstrate that sis-A is required for proper oogenesis: when sis-A activity is compromised in germ cells, i) tumorous ovary phenotypes are observed and ii) there is a reduction in the expression of Sxl-Pm protein. They are also able to rescue the phenotypic effects of sis-a knockdown by expressing a Sxl-Pm protein. While the experiments indicating sis-a is important for normal oogenesis and that at least one of its functions is to ensure that sufficient Sxl is present in the germline stem cells seem convincing, other findings would make the reader wonder whether Sis-A is actually functioning (directly) to activate Sxl transcription from promoter X. 

      It is true that we do not know the binding specificity for SisA, which is why we have made no claims about the directness of SisA regulation of Sxl. This does not change our conclusions that sisA is upstream of Sxl activation, since loss of sisA function has a similar phenotype to loss of Sxl, loss of sisA blocks Sxl protein expression, and expression of Sxl rescues the sisA mutant phenotype.

      The authors show that sis-a mRNAs and proteins are expressed in stage 3-5 germ cells (PGCs). This is not unexpected as the X-linked transcription factors that turn Sxl-Pe on are expressed prior to nuclear migration, so their protein products should be present in early PGCs. The available evidence suggests that their transcription is shut down in PGCs by the factors responsible for transcriptional quiescence (e.g., nos and pgc) in which case transcripts might be detected in only one or two PGC-which fits with their images. However, it is hard to believe that expression of Sis-A protein in pre-blastoderm embryos is relevant to the observed activation of the Sxl-Pm autoregulatory loop hours later in L2 larva. 

      It is also not clear how the very low level of gfp-Sis-A seen in only a small subset of migrating germ cells in stage 10 embryos (Figure S6) would be responsible for activating the Sxl-Pe10kb reporter in L1. It seems likely that the small amount of protein seen in stage 10 embryos is left over from the pre-cellular blastoderm stage. In this case, it would not be surprising to discover that the residual protein is present in both female and male stage 10 germ cells. This would raise further doubts about the relevance of the gfp-Sis-A at these early stages. 

      In fact, given the evidence presented implicating sis-a in activating Sxl, (the germline activation of the Sxl-Pe10kb reporter, the RNAi knockdowns, and the germ cell-specific sis-a clones) it is clear that the sis-A RNAs and proteins seen in pre-cellular blastoderm PGCs aren't relevant. The germline clone experiment (and also the RNAi knockdowns) indicates that sis-A must be transcribed in germ cells after Cas9 editing has taken place. Presumably, this would be after transcription is reactivated in the germline (~stage 10) and after the formation of the embryonic gonad (stage 14) so that the somatic gonadal cells can signal to the germ cells. With respect to the reporter, the relevant time frame for showing that sis-A is present in germ cells would be even later in L1. 

      The reviewer is correct in wondering how early sisA transcription can affect late Sxl activation, and we are clear about this conundrum in our manuscript. However, they are incorrect about the early sisA expression. Our experiments examining nascent sisA transcripts indicate that sisA is zygotically expressed in the formed germ cells rather than being leftover from expression in early nuclei. The fact that only a portion of germ cells express sisA at any time may well be due to a timing issue, where not all germ cells express sisA at the same time. They are also incorrect about the timing of Cas9 editing in the germline—the guide RNAs are expressed from a general promoter that is active both maternally and in the early embryo, and the Cas9 RNA from the nos promoter is deposited in the germ plasm where it is translated long before cellularization, meaning that sisA CRISPR knockout can begin at the earliest stages of germ cell formation or before.

      (7) As noted above, the data in this manuscript do not support the idea that Sxl-Pe proteins activate the Sxl-Pm female splicing in the germline. Flybase indicates that there is at least one other Sxl promoter that could potentially generate a transcript that includes the male exon but still could encode a Sxl protein. This promoter "Sxl-Px" is located downstream of Sxl-Pm and from its position it could have been included in the authors' 10 kb reporter. The reported splicing pattern of the endogenous transcript skips exon2, and instead links an exon just downstream of Sxl-Px to the male exon. The male exon is then spliced to exon4. If the translation doesn't start and end at one of the small upstream orfs in the exons close to Sxl-Px and the male exon, a translation could begin with an AUG codon in exon4 that is in frame with the Sxl protein coding sequence. This would produce a Sxl protein that lacks aa sequences from N-terminus, but still retains some function. 

      Another possible explanation for how gfp is expressed from the 10 kb reporter is that the transcript includes the "z" exon described by Cline et al., 2010.

      As discussed above, the exact location of the start site for the Sxl transcript in the germline remains to be determined, but does not affect the main conclusions of the paper.

    1. Author response:

      The following is the authors’ response to the original reviews.

      Public Reviews:

      Reviewer #1 (Public Review):

      First, all the experiments are performed in Jurkat T cells that may not recapitulate the regulation of polarization in primary T cells.

      To extend our results in Jurkat cells forming IS to primary cells, we have now performed experiments using synapses established by Raji cells and either primary T cells  (TCRmediated) or primary CAR T cells (CAR-mediated) (new Suppl. Fig. S7). These experiments clearly show the presence of FMNL1 at these two different IS classes (new Suppl. Fig. S7), similar to what was found in Jurkat-Raji synapses. In addition, since most of the experiments were performed in Jurkat cells, we have changed the title of our manuscript, to be faithful to the main body of our results. New sentences dealing with this important issue have been included in the Results and Discussion sections.

      Moreover, all the experiments analyzing the role of PKCdelta are performed in one clone of wt or PKCdelta KO Jurkat cells. This is problematic since clonal variation has been reported in Jurkat T cells.

      Referee is right, this is the reason why we have studied three different control clones (C3, C9, C7) and three PKCdelta-interfered clones (P5, P6 and S4) all derived from JE6.1 clone and the results have been previously published (Herranz et al 2019)(Bello-Gamboa et al 2020). All these clones expressed similar levels of the relevant cell surface molecules and formed synaptic conjugates with similar efficiency (Herranz et al 2019). The P5, P6 and S4 clones exhibited a similar defect in MVB/MTOC polarization when compared with the control clones (Herranz et al 2019)(Bello-Gamboa et al 2020). Experiments developed by other researchers using a different clone of Jurkat (JE6.1) and primary CD4+ and CD8+ lymphocytes interfered in FMNL1 (Gomez et al. 2007), showed a comparable defect in MTOC polarization to that found in our control clones when were transiently interfered in FMNL1 (Bello-Gamboa et al 2020, this manuscript). In this manuscript we have studied, instead of canonical JE6.1 clone, C3 and C9 control clones derived from JE6.1, since the puromycin-resistant control clones (containing a scramble shRNA) were isolated by limiting dilution together with the PKCdelta-interfered clones (Herranz et al. 2019), thus C3 and C9 clones are the best possible controls to compare with P5 and P6 clones. Please realize that microsatellite analyses, available upon request, supports the identity of our C3 clone with JE6.1. Moreover, when GFP-PKCdelta was transiently expressed in the three PKCdelta-interfered clones, MTOC/MVB polarization was recovered to control levels (Herranz et al. 2019). Therefore, the deficient MTOC/MVB polarization in all these clones is exclusively due to the reduction in PKCdelta expression (Herranz et al 2019), and thus clonal variation cannot underlie our results in stable clones. We have now included new sentences to address this important point and to mention the inability of FMNL1betaS1086D to revert the deficient MTOC polarization occurring in P6 PKCdelta-interfered clone, as occurred in P5 clone. Due to the fact we have now included more figures and panels to satisfy editor and referees’s comments, we have not included the dot plot data corresponding to C9 and P6 clones to avoid a too long and repetitive manuscript. Since all the FMNL1 interference and FMNL1 variants reexpression experiments were performed in transient assays (2-4 days after transfection), there was no chance for any clonal variation in these short-time experiments. Moreover, internal controls using untransfected cells or Raji cells unpulsed with SEE were carried out in all these transient experiments.

      Finally, although convincing, the defect in the secretion of vesicles by T cells lacking phosphorylation of FMNL1beta on S1086 is preliminary. It would be interesting to analyze more precisely this defect. The expression of the CD63‑GFP in mutants by WB is not completely convincing. Are other markers of extracellular vesicles affected, e.g. CD3 positive?

      We acknowledge this comment. It is true that the mentioned results do not directly demonstrate the presence of exosomes at the synaptic cleft of the synapses, since the nanovesicles were harvested from the cell culture supernatants from synaptic conjugates and these nanovesicles could be produced by multi‑directional degranulation of MVBs. To address this important issue, we have performed STED super‑resolution imaging of the immune synapses made by control and FMNL1-interfered cells. Nanosized (100-150 nm) CD63+ vesicles can be found in the synaptic cleft between APC and control cells with polarized MVBs, whereas we could not detect these vesicles in the synaptic cleft from FMNL1-interfered cells that maintain unpolarized MVBs (New Fig. 10). New sentences have been included in the Results and Discussion dealing with this important point. Regarding the use of CD3 as a marker of extracellular vesicles, please realize that CD3 is neither an enriched nor a specific marker of exosomes, since it is also present in plasma membrane shedding vesicles, molting vesicles from microvilli, apoptotic bodies and small cell fragments, apart from exosomes, thus we have preferred to use the canonic exosome marker CD63 as a general exosome reporter readout, for WB and immunofluorescence (MVBs, exosomes), time-lapse of MVBs (suppl. Video 8) and super resolution experiments (Fig. 10).   

      Reviewer #2 (Public Review):

      Summary:

      The authors have addressed the role of S1086 in the FMNL1beta DAD domain in 4 F-actin dynamics, MVB polarization, and exosome secretion, and investigated the potential implication of PKCdelta, which they had previously shown to regulate these processes, in FMNL1beta S1086 phosphorylation. This is based on:

      (1) the documented role of FMNL1 proteins in IS formation

      (2) their ability to regulate F-actin dynamics

      (3) the implication of PKCdelta in MVB polarization to the IS and FMNL1beta phosphorylation

      (4) the homology of the C-terminal DAD domain of FMNL1beta with FMNL2, where a phosphorylatable serine residue regulating its auto-inhibitory function had been previously identified. They demonstrate that FMNL1beta is indeed phosphorylated on S1086 in a PKCdelta-dependent manner and that S1086-phosphorylated FMNL1beta acts downstream of PKCdelta to regulate centrosome and MVB polarization to the IS and exosome release. They provide evidence that FMNL1beta accumulates at the IS where it promotes F-actin clearance from the IS center, thus allowing for MVB secretion.  

      Strengths

      The work is based on a solid rationale, which includes previous findings by the authors establishing a link between PKCdelta, FMNL1beta phosphorylation, synaptic F-actin clearance, and MVB polarization to the IS. The authors have thoroughly addressed the working hypotheses using robust tools. Among these, of particular value is an expression vector that allows for simultaneous RNAi-based knockdown of the endogenous protein of interest (here all FMNL1 isoforms) and expression of wild-‐‑type or mutated versions of the protein as YFP‐tagged proteins to facilitate imaging studies. The imaging analyses, which are the core of the manuscript, have been complemented by immunoblot and immunoprecipitation studies, as well as by the measurement of exosome release (using a transfected MVB/exosome reporter to discriminate exosomes secreted by T cells).

      Weaknesses

      The data on F-‐‑actin clearance in Jurkat T cells knocked down for FMNL1 and expressing wild-type FMNL1 or the non‑phosphorylatable or phosphomimetic mutants thereof would need to be further strengthened, as this is a key message of the manuscript. Also, the entire work has been carried out on Jurkat cells. Although this is an excellent model easily amenable to genetic manipulation and biochemical studies, the key finding should be validated on primary T cells

      Referee’s global assessment is right. To extend our results in Jurkat cells forming IS, we have now performed experiments using synapses established by Raji cells and either primary T cells (TCR-mediated) or primary CAR T cells (CAR-mediated) (new Suppl. Fig. S7). These experiments clearly show the presence of FMNL1 at these two different IS classes (new Suppl. Fig. S7), similar to what was found in Jurkat-Raji synapses. In addition, since most of the experiments were performed in Jurkat cells, we have changed the title of our manuscript, to be faithful to the main body of our results. New sentences have been included in Results and Discussion to address these important points.

      Recommendations for the authors:

      Reviewer #1 (Recommendations For The Authors):

      This study shows the role of the phosphorylation of FMNL1b on S1086 on the polarity of T lymphocytes in T lymphocytes, which is a new and interesting finding. It would be important to confirm some of the key results in primary T cells and to analyze in-depth the defect in actin remodeling (quantification of the images, analysis of some key actors of actin remodeling). The description of the defect in the secretion of extracellular vesicles would also benefit from a more accurate analysis of the content of vesicles. 

      Referee is right.  We have now performed experiments using synapses containing Raji cells and either primary T cells (TCR-mediated) or primary CAR T cells (CAR-mediated) (new Suppl. Fig. S7). These experiments clearly show the presence of FMNL1 at these two different IS classes, similar to what was found in Jurkat-‐‑Raji synapses. Moreover, since most of the experiments were performed in Jurkat cells, we have changed the title of our manuscript, to be faithful to the main body of our results. Regarding the use of CD63 instead of other markers such as for instance,  CD3 (as stated by the other referee), please realize that CD3 is neither an enriched nor a specific marker of exosomes, since it is also present in plasma membrane shedding vesicles, molting vesicles from microvilli, apoptotic bodies and small cell fragments, apart from exosomes, thus we have preferred to use the accepted consensus, canonic extracellular vesicle marker CD63 (International Society of Extracellular Vesicles positioning, Thery et al 2018, doi: 10.1080/20013078.2018.1535750. eCollection 2018., Alonso et al. 2011) as a general exosome reporter readout, for both WB, immunofluorescence (MVBs, exosomes) and super-resolution experiments. Accordingly, GFP-‐‑CD63 reporter plasmid was used for exosome secretion in transient expression studies and living cell time-lapse experiments (Suppl. Video 8). Any other exosome marker will also be present in Raji cells and will not allow to analyse exclusively the secretion of exosomes by the effector Jurkat cells, since B lymphocytes produce a large quantity of exosomes upon MHC‑II stimulation by Th lymphocytes (Calvo et al, 2020, doi:10.3390/ijms21072631). To reinforce the exosome data in the context of the immune synapse, STED super-resolution imaging of the immune synapses made by control and FMNL1‑interfered cells was performed. Nanosized (100-150 nm) CD63+ vesicles can be found in the synaptic cleft of control cells with polarized MVBs, whereas we could no detect these vesicles in the synaptic cleft from FMNL1-interfered cells that maintain unpolarized MVBs (new Fig. 10).

      Moreover, all the videos are not completely illustrative. For example, in video 2 it would be more appropriate show only the z plane corresponding to the IS to see more precisely the F-actin remodeling relative to CD63 labeling.

      Referee is right. It is true that the upper rows in some videos may distract the reader of the main message contained in the lower row, that includes the 90º turn-generated, zx plane corresponding to the IS interface. Accordingly, we have maintained the still images of the whole synaptic conjugates in the first row from video 2; this will allow the reader to perceive a general view of the fluorochromes on the whole cell conjugates, as a reference, and to compare precisely the F-actin remodeling relative to CD63 labeling only at the zx interface (lower row). We have now processed the videos 1 and 5 following similar criteria

      The quality of videos 3 and 4 are not good enough. For video 7, it seems that the labeling of phospho-‐‑Ser is very broad at the IS, which is expected since it should label all the proteins that are phosphorylated by PKCs. The resolution of microscopy (at the best 200 to 300 nm) does not allow us to conclude on the co-‐localization of FMNL1b with phospho-‐‑Ser and is thus not conclusive. Finally, the study would benefit from a more careful statistical analysis. The dot plots showing polarity are presented for one experiment. Yet, the distribution of the polarity is broad. Results of the 3 independent experiments should be shown and a statistical analysis performed on the independent experiments

      Referee is right, we have amended video settings (brightness/contrast) in videos 3 and 4 to improve this issue. In addition, we would like to remark that the translocation of proteins to cellular substructures in living cells is not a trivial issue, since certain protein localizations are too dynamic to be properly imaged with enough spatial resolution. The equilibrium resulting from the association/dissociation of a certain protein to the membrane, in addition to the protein diffusion naturally occurring in living cells, as well as signal intensity fluctuations inherent to the stochastic nature of fluorescence emission often provide barriers for image quality (Shroff et al, 2024). Thus, additional image blurring is expected when compared with that observed in fixed samples. However, we think it is important to provide the potential readers with a dynamic view of FMNL1 localization, which can only be achieved through real-time videos, in addition to the still frames from the same videos provided in Fig. 6A (the referee did not argue against the inclusion of these frames), together with images from fixed cells in Fig 6B, for comparison. This is the reason why we have preferred to maintain the improved videos to complement the results of some spare frames from the videos, together with images from fixed cells in the same figure (Fig. 6).

      Regarding video 7, we agree that colocalization is limited by the spatial resolution of confocal  microscopy,  and this fact does not allow us to infer that FMNL1beta is phosphorylated at the IS. However, please realize we have never concluded this in our manuscript.  Instead, we claimed that “colocalization of endogenous FMNL1 and YFP‑FMNL1βWT with anti‑phospho‑Ser  …is compatible with the idea that both endogenous FMNL1 and YFP‑FMNL1βWT are specifically phosphorylated at the cIS”. Moreover, we have now performed colocalization in super‑resolved STED microscopy images, that reduces the XY resolution down to 30-­40 nm (Suppl. Fig. S12), and the results also support colocalization of endogenous FMNL1 with anti-phospho‑Ser PKC at the IS within a 30 nm resolution limit. We have now somewhat softened our conclusion: “Although all these data did not allow us to infer that FMNL1β is phosphorylated at the IS due to the resolution limit of confocal and STED microscopes, the results are compatible with the idea that both endogenous FMNL1 and YFP-FMNL1βWT are specifically phosphorylated at the cIS”.   

      Regarding statistical analyses we agree the dot distribution in the polarity experiments is quite broad, but this is consistent with the end point strategy used by a myriad of research groups (including ourselves) to image an intrinsically stochastic, rapid and asynchronous processes such as immune synapse formation and to score MTOC/MVB  polarization (Calvo et al 2018, https://doi.org/10.3389/fimmu.2018.00684). Despite this fact,  ANOVA  analyses have underscored the statistical significance of all the experiments represented by dot plot experiments. We cannot average or perform meta statistical analyses by combining the equivalent cohort results from independent experiments, since we have observed that small variations of certain variables (SEE concentration, cell recovery, time after transfection, etc.) affect synapse formation and PI values among experiments without altering the final outcome in each case. Please, note that our manuscript includes now 10  multi‑panel figures,  12  multi‑panel supplementary figures and 8 videos, and it is already quite large.  Thus,  we feel the inclusion of redundant, triplicate dot plot figures will dilute and distract to any potential reader from the main message of our already comprehensive contribution. We have now included new sentences at the figure legends to remark ANOVA analyses were executed separately in all the 3 independent experiments.

      Reviewer #2 (Recommendations For The Authors):

      (1) The key findings should be validated on primary CD4+ T cells (of which Jurkat is a transformed model).

      Referee is right. However, as commented by the other referee, the data from activating surfaces clearly shows that the synaptic actin architecture of the immune synapse from primary CD8+ T cells is essentially indistinguishable and thus unbiased from that of Jurkat T cells, but different to that of primary CD4+ cells (Murugesan, 2016). Thus, our data in Jurkat T cells are directly applicable to the synaptic architecture of primary CD8+ cells. In addition, to definitely extend our results in Jurkat cells forming IS, we have performed experiments using synapses established by Raji cells and either primary T cells (TCR-mediated) or primary CAR T cells (CAR-mediated) (new Suppl. Fig. S7) challenged by Raji cells. We have preferred to work with mixed CD4+ and CD8+ cells in order to maintain potential interactions in trans between these subpopulations that may affect or influence IS formation. These experiments clearly show the presence of FMNL1 at these two different IS classes (new Suppl. Fig. S7), similar to what was found in JurkatRaji synapses. Moreover, since most of the experiments were performed in Jurkat cells as stated by the referee, we have changed the title of our manuscript, to circumscribe our results to the model we have used and to be faithful to the main body of our results.

      (2) The image of wt YFP-­FMNL1beta in Figure 4A displays a weak CD63 signal and shows an asymmetric polarization of both the centrosome and MVBs. It should be replaced with a more representative one.

      Referee is right. Accordingly, we have modified the CD63 channel settings (brightness/contrast) in this panel to make it comparable to the other panels in the same figure. In addition, thanks to this referee´s comment, we have realized the position of the MTOC (yellow dot) in the diagram in the right side of the YFP-FMNL1betaWT panels row appeared mislocated, producing the mentioned apparent asymmetry with respect to MVBs’s center of mass (green dot) position. This mistake leads to an apparent segregation between the position of the center of mass of these organelles which certainly does not correspond with the real image. We have now amended the scheme and we apologize for this mistake.

      (3) The images showing F-­actin clearance at the IS (Figure 8, S4, S5) are not very convincing, also when looking at the MFI along the T cell-­‐‑APC interface in the en-­‐face  views.  Since  the  F-­actin  signal  also  includes  some  signal  from  the  APC, transfecting T cells with an actin reporter to selectively image T cell actin could better clarify this key point.

      Referee´s point is correct. However, we (83), and other researchers using the proposed actin reporter approach in the same Raji/Jurkat IS model (Fig. 4 in ref 84) have already excluded the possibility that actin cytoskeleton of Raji cells can also contribute to the measurements of synaptic F-actin. In Materials and Methods, page 37, lines 1048-1055 we included this related sentence:  ¨It is important to remark that MHC-II-antigen triggering on the B cell side of the Th synapse does not induce noticeable F-­actin changes along the synapse (i.e. F-­actin clearing at the central IS), in contrast to TCR stimulation on T cell side (84) (85) (3). In addition, we have observed that majority of F‐‑actin changes along the IS belongs to the Jurkat cell (83). Thus, the contribution to the analyses of the residual, invariant F‐actin from the B cell is negligible using our protocol (83).

      Thus, we can exclude this caveat may affect our results.

      (4) A similar consideration applies to the MVB distribution in the en‑face images. For example, in Figure S5 the MVB profile, with some peripheral distribution, does not appear very different in cells expressing wt YFP‑tagged FMNL1beta versus the S1086A‑expressing cells.

      The referee's assessment regarding Supp. Figure S5 is valid. Using only the plot profile, the outcomes obtained with YFP-FMNL1βWT may appear comparable to those derived from YFP-FMNL1βS1086A. Nonetheless, this resemblance is attributed to the plot profile's exclusive consideration of the MVBs signal in the interface from the immune synapse region (white rectangle). The upper images (second row), where the whole cell is displayed, illustrate that in YFP-FMNL1βWT, MVB are specifically accumulated within this specific region, in contrast to the scattered distribution observed in YFP-FMNL1βS1086A, where MVB are dispersed throughout the cell without distinction. While MVBs are evident in both instances within the synapse region, the reason behind this observation is different. The YFP-FMNL1βWT transfected cell (third column) shows a pronounced MVB concentration within the synaptic area (white rectangle), which leads to MVB PI=0.52, whereas the YFP-FMNL1βS1086A transfected cell (fourth column), as it presents a scattered distribution of MVB throughout the cell, also exhibits some MVB (but only a small proportion of the total cellular MVB) in the synaptic area, which yields MVB PI=-0.09. Please realise that the position of the center of mass of the distribution of MVB (MVBC) labelled in this figure (white squares) is an unbiased parameter that mirrors MVB center of mass polarization. A new sentence has been included in the figure legend to clarify this important point.

      (5) The image in the first row in Figure 6B does not show a clear accumulation of FMNL1beta at the IS, possibly because the T cell is in contact with two APCs. This image should be replaced.

      Referee is right Therefore, we have replaced the quoted example with a single cell:cell synapse that shows a clearer and more localized accumulation in the cIS, thereby avoiding the mentioned caveat.

      (6) In Figure 2A the last row shows what appears to be a T:T cell conjugate (with one cell expressing the YFP-­‐‑tagged protein). The image should be replaced with another showing a T cell-­APC (blue) conjugate.

      Referee is right, we have accordingly replaced the mentioned image with a T cell:APC conjugate.

      (7) The Discussion is very long and dispersive. It would benefit from shortening it and making it more focused.

      Referee is right, we have shortened and focused it, by eliminating the whole second and third paragraphs of the discussion. Moreover, a whole paragraph in page 24 has been also deleted.

      We have also focussed the discussion towards the new data in primary T lymphocytes.

    1. Author response:

      The following is the authors’ response to the previous reviews.

      Public Reviews: 

      Reviewer #1 (Public Review): 

      Summary: 

      This paper uses a model of binge alcohol consumption in mice to examine how the behaviour and its control by a pathway between the anterior insular cortex (AIC) to the dorsolateral striatum (DLS) may differ between males and females. Photometry is used to measure the activity of AIC terminals in the DLS when animals are drinking and this activity seems to correspond to drink bouts in males but not females. The effects appear to be lateralized with inputs to the left DLS being of particular interest. 

      Strengths: 

      Increasing alcohol intake in females is of concern and the consequences for substance use disorder and brain health are not fully understood, so this is an area that needs further study. The attempt to link fine-grained drinking behaviour with neural activity has the potential to enrich our understanding of the neural basis of behaviour, beyond what can be gleaned from coarser measures of volumes consumed etc. 

      Weaknesses: 

      The introduction to the drinking in the dark (DID) paradigm is rather narrow in scope (starting line 47). This would be improved if the authors framed this in the context of other common intermittent access paradigms and gave due credit to important studies and authors that were responsible for the innovation in this area (particularly studies by Wise, 1973 and returned to popular use by Simms et al 2010 and related papers; e.g., Wise RA (1973). Voluntary ethanol intake in rats following exposure to ethanol on various schedules. Psychopharmacologia 29: 203-210; Simms, J., Bito-Onon, J., Chatterjee, S. et al. Long-Evans Rats Acquire Operant Self-Administration of 20% Ethanol Without Sucrose Fading. Neuropsychopharmacol 35, 1453-1463 (2010).)

      We appreciate the reviewer’s perspective on the history of the alcohol research field. There are hundreds of papers that could be cited regarding all the numerous different permutations of alcohol drinking paradigms. This study is an eLife “Research Advances” manuscript that is a direct follow-up study to a previously published study in eLife (Haggerty et al., 2022) that focused on the Drinking in the Dark model of binge alcohol drinking. This study must be considered in the context of that previous study (they are linked), and thus we feel that a comprehensive review of the literature is not appropriate for this study.

      The original drinking in the dark demonstrations should also be referenced (Rhodes et al., 2005). Line 154 Theile & Navarro 2014 is a review and not the original demonstration. 

      This is a good recommendation. We have added this citation to Line 33 and changed Line 154.

      When sex differences in alcohol intake are described, more care should be taken to be clear about whether this is in terms of volume (e.g. ml) or blood alcohol levels (BAC, or at least g/kg as a proxy measure). This distinction was often lost when lick responses were being considered. If licking is similar (assuming a single lick from a male and female brings in a similar volume?), this might mean males and females consume similar volumes, but females due to their smaller size would become more intoxicated so the implications of these details need far closer consideration. What is described as identical in one measure, is not in another. 

      As shown in Figure 1, all measures of intake are reported as g/kg for both water and alcohol to assess intakes across fluids that are controlled by body weights. We do not reference changes in fluid volume or BACs to compare differences in measured lickometry or photometric signals, except in one instance where we suggest that the total volume of water (ml) is greater than the total amount of alcohol (ml) consumed in DID sessions, but this applies generally to all animals, regardless of sex, across all the experimental procedures.

      In Figure 2 – Figure Supplement 1 we show drinking microstructures across single DID sessions, and that males and females drink similarly, but not identically, when assessing drinking measures at the smallest timescale that we have the power to detect with the hardware we used for these experiments. Admittedly, the variability seen in these measures is certainly non-zero, and while we are tempted to assume that there exist at least some singular drinks that occur identically between males and females in the dataset that support the idea that females are simply just consuming more volume of fluid per singular drink, we don’t have the sampling resolution to support that claim statistically. Further, even if females did consume more volume per singular drink that males, we do not believe that is enough information to make the claim that such behavior leads to more “intoxication” in females compared males, as we know that alcohol behaviors, metabolism, and uptake/clearance all differ significantly by sex and are contributing factors towards defining an intoxication state. We’ve amended the manuscript to remove any language of referencing these drinking behaviors as identical to clear up the language.

      No conclusions regarding the photometry results can be drawn based on the histology provided. Localization and quantification of viral expression are required at a minimum to verify the efficacy of the dual virus approach (the panel in Supplementary Figure 1 is very small and doesn't allow terminals to be seen, and there is no quantification). Whether these might differ by sex is also necessary before we can be confident about any sex differences in neural activity. 

      We provide hit maps of our fiber placements and viral injection centers, as we have, and many other investigators do regularly for publication based on histological verification. Figure 1A clearly shows the viral strategy taken to label AIC to DLS projections with GCaMP7s, and a representative image shows green GCaMP positive terminals below the fiber placement. Considering the experiments, animals without proper viral expression did not display or had very little GCaMP signal, which also serves as an additional expression-based control in addition to typical histology performed to confirm “hits”. These animals with poor expression or obvious misplacement of the fiber probes were removed as described in the methods. Further, we also report our calcium signals as z-scored differences in changes in observed fluorescence, thus we are comparing scaled averages of signals across sexes, and days, which helps minimize any differences between “low” or “high” viral transduction levels at the terminals, directly underneath the tips of the fibers.

      While the authors have some previous data on the AIC to DLS pathway, there are many brain regions and pathways impacted by alcohol and so the focus on this one in particular was not strongly justified. Since photometry is really an observational method, it's important to note that no causal link between activity in the pathway and drinking has been established here. 

      As mentioned above, this article is an eLife Research Advances article that builds on our previous AIC to DLS work published in eLife (Haggerty et al., 2022). Considering that this is a linked article, a justification for why this brain pathway was chosen is superfluous. In addition, an exhaustive review of all the different brain regions and pathways that are affected by binge alcohol consumption to justify this pathway seems more appropriate to a review article than an article such as this.  

      We make no claims that photometric recordings are anything but observational, but we did observe these signals to be different when time-locked to the beginning of drinking behaviors. We describe this link between activity in the pathway and drinking throughout the manuscript. It is indeed correlational, but just because it is not causal does not mean that our findings are invalid or unimportant.

      It would be helpful if the authors could further explain whether their modified lickometers actually measure individual licks. While in some systems contact with the tongue closes a circuit which is recorded, the interruption of a photobeam was used here. It's not clear to me whether the nose close to the spout would be sufficient to interrupt that beam, or whether a tongue protrusion is required. This detail is important for understanding how the photometry data is linked to behaviour. The temporal resolution of the GCaMP signal is likely not good enough to capture individual links but I think more caution or detail in the discussion of the correspondence of these events is required. 

      The lickometers do not capture individual licks, but a robust quantification of the information they capture is described in Godynyuk et al. 2019 and referenced in multiple other papers (Flanigan et al. 2023, Haggerty et al. 2022, Grecco et al. 2022, Holloway et al. 2023) where these lickometers have been used. However, individual lick tracking is not a requirement for tracking drinking behaviors more generally. The lickometers used clearly track when the animals are at the bottles, drinking fluids, and we have used the start of that lickometer signal to time-lock our photometry signals to drinking behaviors. We make no claims or have any data on how photometric signals may be altered on timescales of single licks. In regard to how AIC to DLS signals change on the second time scale when animals initiate drinking behaviors, we believe we explain these signals with caution and in context of the behaviors they aim to describe.

      Even if the pattern of drinking differs between males and females, the use of the word "strategy" implies a cognitive process that was never described or measured. 

      We use the word strategy to describe a plan of action that is executed by some chunking of motor sequences that amounts to a behavioral event, in this case drinking a fluid. We do not mean to imply anything further than this by using this specific word.

      Reviewer #2 (Public Review): 

      Summary: 

      This study looks at sex differences in alcohol drinking behaviour in a well-validated model of binge drinking. They provide a comprehensive analysis of drinking behaviour within and between sessions for males and females, as well as looking at the calcium dynamics in neurons projecting from the anterior insula cortex to the dorsolateral striatum. 

      Strengths: 

      Examining specific sex differences in drinking behaviour is important. This research question is currently a major focus for preclinical researchers looking at substance use. Although we have made a lot of progress over the last few years, there is still a lot that is not understood about sex-differences in alcohol consumption and the clinical implications of this. 

      Identifying the lateralisation of activity is novel, and has fundamental importance for researchers investigating functional anatomy underlying alcohol-driven behaviour (and other reward-driven behaviours). 

      Weaknesses: 

      Very small and unequal sample sizes, especially females (9 males, 5 females). This is probably ok for the calcium imaging, especially with the G-power figures provided, however, I would be cautious with the outcomes of the drinking behaviour, which can be quite variable. 

      For female drinking behaviour, rather than this being labelled "more efficient", could this just be that female mice (being substantially smaller than male mice) just don't need to consume as much liquid to reach the same g/kg. In which case, the interpretation might not be so much that females are more efficient, as that mice are very good at titrating their intake to achieve the desired dose of alcohol. 

      We agree that the “more efficient” drinking language could be bolstered by additional discussion in the text, and thus have added this to the manuscript starting at line 440.

      I may be mistaken, but is ANCOVA, with sex as the covariate, the appropriate way to test for sex differences? My understanding was that with an ANCOVA, the covariate is a continuous variable that you are controlling for, not looking for differences in. In that regard, given that sex is not continuous, can it be used as a covariate? I note that in the results, sex is defined as the "grouping variable" rather than the covariate. The analysis strategy should be clarified. 

      In lines 265-267, we explicitly state that the covariate factor was sex, which is mathematically correct based on the analyses we ran. We made an in-text error where we referred to sex as a grouping variable on Line 352, when it should have been the covariate. Thank you for the catch and we have corrected the manuscript.

      But, to reiterate, we are attempting to determine if the regression fits by sex are significantly different, which would be reported as a significant covariate. Sex is certainly a categorical variable, but the two measures at which we are comparing them against are continuous, so we believe we have the validity to run an ANCOVA here.

      Reviewer #3 (Public Review): 

      Summary: 

      In this manuscript by Haggerty and Atwood, the authors use a repeated binge drinking paradigm to assess how water and ethanol intake changes in male in female mice as well as measure changes in anterior insular cortex to dorsolateral striatum terminal activity using fiber photometry. They find that overall, males and females have similar overall water and ethanol intake, but females appear to be more efficient alcohol drinkers. Using fiber photometry, they show that the anterior insular cortex (AIC) to dorsolateral striatum projections (DLS) projections have sex, fluid, and lateralization differences. The male left circuit was most robust when aligned to ethanol drinking, and water was somewhat less robust. Male right, and female and left and right, had essentially no change in photometry activity. To some degree, the changes in terminal activity appear to be related to fluid exposure over time, as well as within-session differences in trial-by-trial intake. Overall, the authors provide an exhaustive analysis of the behavioral and photometric data, thus providing the scientific community with a rich information set to continue to study this interesting circuit. However, although the analysis is impressive, there are a few inconsistencies regarding specific measures (e.g., AUC, duration of licking) that do not quite fit together across analytic domains. This does not reduce the rigor of the work, but it does somewhat limit the interpretability of the data, at least within the scope of this single manuscript. 

      Strengths: 

      - The authors use high-resolution licking data to characterize ingestive behaviors. 

      - The authors account for a variety of important variables, such as fluid type, brain lateralization, and sex. 

      - The authors provide a nice discussion on how this data fits with other data, both from their laboratory and others'. 

      - The lateralization discovery is particularly novel. 

      Weaknesses: 

      - The volume of data and number of variables provided makes it difficult to find a cohesive link between data sets. This limits interpretability.

      We agree there is a lot of data and variables within the study design, but also believe it is important to display the null and positive findings with each other to describe the changes we measured wholistically across water and alcohol drinking.

      - The authors describe a clear sex difference in the photometry circuit activity. However, I am curious about whether female mice that drink more similarly to males (e.g., less efficiently?) also show increased activity in the left circuit, similar to males. Oppositely, do very efficient males show weaker calcium activity in the circuit? Ultimately, I am curious about how the circuit activity maps to the behaviors described in Figures 1 and 2. 

      In Figure 3C, we show that across the time window of drinking behaviors, that female mice who drink alcohol do have a higher baseline calcium activity compared to water drinking female mice, so we believe there are certainly alcohol induced changes in AIC to DLS within females, but there remains to be a lack of engagement (as measured by changes in amplitude) compared to males. So, when comparing consummatory patterns that are similar by sex, we still see the lack of calcium signaling near the drinking bouts, but small shifts in baseline activity that we aren’t truly powered to resolve (using an AUC or similar measurements for quantification) because the shifts are so small. Ultimately, we presume that the AIC to DLS inputs in females aren’t the primary node for encoding this behavior, and some recent work out of David Werner’s group (Towner et al. 2023) suggests that for males who drink, the AIC becomes a primary node of control, whereas in females, the PFC and ACC, are more engaged. Thus, the mapping of the circuit activity onto the drinking behaviors more generally represented in Figures 1 and 2 may be sexually dimorphic and further studies will be needed to resolve how females engage differential circuitry to encode ongoing binge drinking behaviors.

      - What does the change in water-drinking calcium imaging across time in males mean? Especially considering that alcohol-related signals do not seem to change much over time, I am not sure what it means to have water drinking change. 

      The AIC seems to encode many physiologically relevant, interoceptive signals, and the water drinking in males was also puzzling to us as well. Currently, we think it may be both the animals becoming more efficient at drinking out of the lickometers in early weeks and may also be signaling changes due to thirst states of taste associated with the fluid. While this is speculation, we need to perform more in-depth studies to determine how thirst states or taste may modulate AIC to DLS inputs, but we believe that is beyond the scope of this current study.

      Recommendations for the authors:

      Reviewer #1 (Recommendations For The Authors): 

      Line 45 - states alcohol use rates are increasing in females across the past half-decade. I thought this trend was apparent over the past half-century? Please consider revising this. 

      According to NIAAA, the rates of alcohol consumption in females compares to males has been closing for about the past 100 years now, but only recently are those trends starting to reverse, where females are drinking similar amounts or more than males.

      Placing more of the null findings into supplemental data would make the long paper more accessible to the reader. 

      In reference to reviewer’s three’s point as well, there is a lot of data we present, and we hope for others to use this data, both null and positive findings in their future work. As formatted on eLife’s website, we think it is important to place these findings in-line as well.

      Reviewer #2 (Recommendations For The Authors): 

      In addition to the points raised about analysis and interpretation in the Public Review, I have a minor concern about the written content. I find the final sentence of the introduction "together these findings represent targets for future pharmacotherapies.." a bit unjustified and meaningless. The findings are important for a basic understanding of alcohol drinking behaviour, but it's unclear how pharmacotherapies could target lateralised aic inputs into dls. 

      There are on-going studies (CANON-Pilot Study, BRAVE Lab, Stanford) for targeted therapies that use technologies like TMS and focused ultrasound to activate the AIC to alleviate alcohol cravings and decrease heavy drinking days. The difficulty with these next-generation therapeutics is often targeting, and thus we think this work may be of use to those in the clinic to further develop these treatments. We agree that this data does not support the development of pharmacotherapies in a traditional sense, and thus have removed the word and added text to reference TMS and ultrasound approaches to bolster this statement in lines 101+.

    1. Author response:

      The following is the authors’ response to the previous reviews.

      We appreciate the feedback provided and refer to our previous response for detailed explanations regarding our decisions on some of the recommendations made by the referees and editors. We have introduced changes as follows:

      • We added a supplementary Figure to Figure 5 to show inhibition by Astemizole at the single channel level.

      • We have corrected Figure 7A, where the normalized current did not reach 1 as a maximum. We had overlooked that this is expected when the prepulse was -160 mV, and the IV is strongly biphasic, but not when coming from -100 mV. We are thankful for this observation, which served to identify that the values for one of the cells were inverted with respect to the others (the sequence of stimuli was different during recording, and this information got lost in the analysis procedure). We have corrected this and made sure that such a mistake had not happened anywhere else.

      • Finally, we have corrected a typo in the discussion, as indicated in the review.

      We include a version with changes marked and a clean version of the manuscript.

    1. Author response:

      The following is the authors’ response to the original reviews.

      eLife assessment

      The authors present a useful analysis of the phenotype of sheep in which the muscle developmental regulator myostatin has been mutated in a FGF5 knockout background. The goal was to produce sheep with a "double-muscled" phenotype, yet the genetically engineered sheep exhibited meat with a smaller cross-sectional area and higher number of muscle fibers. The work extends the extensive body of knowledge already published in this area. The authors provide evidence using in vitro experiments that Fosl1 regulates myogenesis, but the strength of evidence relating to the muscle phenotype and underlying cellular and molecular mechanism is inadequate.

      Thanks for assessment. According to the reviewers' comments, we have supplemented and updated the data on muscle phenotypes, and the molecular mechanisms also have been supplemented accordingly, such as FOSL1 silencing and inhibition, as as well as possible secondary fusion of myoblasts regulated by calcium signaling. Meanwhile, considering the suggestions of editors and reviewers, we have also supplemented the data on serum MSTN regulation. Given that the phenotype of MSTN gene editing is mutation site dependent, we directly cultured skeletal muscle satellite cells using serum from WT and MF+/- sheep, and showed that the serum regulation cannot be ignored after MSTN_Del273C mutation with _FGF5 knockout.

      Public Review:

      Chen and collaborators first analysed in sheep embryonic gene editing using CRISPR-Cas9 technology to invalidate the two alleles of Mstn and Fgf5 genes by using different ratios of Cas9 mRNA and sgRNA. They showed that a ratio of 1:10 had highest efficiency and they successfully generated two sheep with biallelic mutations of both genes. Materials and Methods on the generation of gened edited sheep is entirely missing. The data on these gene edited sheep have been already published twice by the authors in different contexts. Other groups reported on gene editing of Mstn or Fgf5 in sheep embryos and the resulting phenotypes.

      We thank the reviewers for pointing out our negligence and shortcomings. We have provided detailed information on the generation method of gene editing sheep in the Materials and Methods. Briefly, gene-edited sheep were produced by injecting MSTN sgRNA, FGF5 sgRNA, and Cas9 mRNA into embryos in different ratio.

      Although the findings are interesting, they do not provide sufficiently new scientific information or advancements in producing genetically modified livestock with improved production characteristics. While the MSTNDel273 sheep exhibited an increased number of muscle fibers, the data provided did not demonstrate a significant improvement in meat productions, quality or quantity in the MSTNDel273 sheep vs WT.

      Thank you very much for your constructive comments. Considering the lack of data on improving production traits, we have further supplemented the data on meat yield and quality of MSTN_Del273C mutation with _FGF5 knockout sheep in Table S6-10. Although these improvements were not significant enough, our data showed increased meat production traits in MSTN_Del273C mutation with _FGF5 knockout sheep, such as the proportion of hind leg meat to carcass and the proportion of gluteus medius to carcass. For example, the proportion of hind leg meat was significantly increased by 21.2% (Table S7), and the proportion of gluteus medius in the carcass of MF+/- sheep was significantly (P<0.01) increased by 26.3% compared to WT sheep (Figure 2K). In addition, there were no significant (P>0.05) differences in pH, color, drip loss, cooking loss, shearing force, and amino acid content of the longissimus dorsi between WT and MF+/- sheep (Table S8-10). All these results demonstrated that the MSTN_Del273C mutation with _FGF5 knockout sheep had well-developed hip muscles with smaller muscle fibers, which do not affect meat quality, and this phenotype may be dominated by MSTN gene.

      The authors indicate that sgRNA design changes in addition to changing the molar ratio of Cas9MRNA:sgRNA improved the ability to generate biallelic homozygous mutant sheep; however, the data provided to not demonstrate any significant difference. Given the small number of sheep that were actually produced and evaluated,it is extremely difficult to demonstrate anything that was analyzed to be significantly (statistically) different between MSTNDel273 sheep and WT, yet the authors seem to ignore this in much of their discussion. There is no explanation as to why the authors started with sheep that were FGF5 knockouts. The reviewer assumes that this was simply a line of sheep available from previous studies and the goal was to produce sheep with both improved hair/wool characteristics in addition to improved muscle development. However, the use of FGF5 knockout sheep complicates the ability to accurately decipher the unique aspects associated with targeting only myostatin for knock-out. At minimum, this is a variable that has to be considered in the statistical analysis. No information is provided on the methods used to produce the MSTNDel273 sheep, which is fundamentally important. It is assumed they were produced by injecting one-cell zygotes then transferring these into surrogate females. The methods employed might have a profound effect on the outcome.

      We greatly appreciate your review. In the current study, we did not discuss the impact of changes in sgRNA design on the ability to generate biallelic homozygous mutant sheep. In fact, we focused on the delivery molar ratio of Cas9 mRNA to sgRNA and found that increasing the molar ratio of Cas9:sgRNA can improve the ability to produce homozygous biallelic mutations in sheep. We apologize for neglecting this statistical analysis, which was tested for significance of differences in the revised version by the chi-square test. Other restrictions related to the actual production and evaluation of the number of sheep were analyzed in our additional discussion. It should be explained to the reviewers that the gene-edited sheep we produced did not start with FGF5 knockout sheep. As hypothesized by the reviewers, we used a one-step method to simultaneously edit the two genes of MSTN and FGF5 to concomitantly increase muscle yield and improve wool characteristics in sheep, which resulted in knockout of the FGF5 gene and mutation of the MSTN gene. As speculated by the reviewers, the MSTN_Del273C mutation with _FGF5 knockout sheep was generated by injecting sgRNA and Cas9 mRNA of MSTN and FGF5 into a single fertilized egg and then transplanted into a surrogate mother. We have provided detailed information on the generation method of gene edited sheep in the Materials and Methods section.

      Authors genotyped one sheep with a biallelic three base pair deletion in Mstn exon 3 and a compound heterozygote mutation in Fgf5 with a 5 nucleotides deletion on one allele and 37 nucleotides deletion on the other allele, partially spanning over the same region. This sheep developed a double muscle phenotype, which was documented using photography and CT scan. The hair phenotype was not further addressed, but authors referred to a previous publication.

      Thank you for your review. In the current study, we only focused our perspective on the muscle phenotype, while the data on the hair phenotype involved another study. Therefore, we referred to our previous publication on hair phenotypes, in which the mutation locus in FGF5 gene-edited sheep is the same as in the current study.

      Authors performed morphometric studies on two distinct muscles, longissimus dorsi and gluteus medius, and found a profound fiber hypotrophy in the Mstn-/-;Fgf5-/- double mutants, with a shift from larger fiber diameter to smaller fiber sizes. Morphometric studies showed only a low percentage of fibers in wt and mutant sheep had fiber cross sectional areas larger than 800 µm2, whereas about 30% in wt and about 60% in the mutant had CSA of <400 µm2. The report of one case, without reproducing the phenotype in other sheep, is scientifically insufficient. The fiber sizes in wt sheep remains far below previously published reports in sheep (about 3-5 times smaller) and as compared to other species, which suggests a methodological error in morphometric methods.

      We greatly appreciate your careful review. There is indeed an error in morphological analysis of the MF-/- sheep longissimus dorsi and gluteus medius muscles. After carefully checked, we found that the reason for the fiber sizes in WT sheep remains far below previously published reports in sheep was due to the incorrect use of scale. Thus, we re-scanned the tissue sections and re-calculate the cross-sectional area of muscle fibers and the number of muscle fiber cells per unit area with the correct scale. In this case, the average cross-sectional area of muscle fibers in WT sheep was approximately 1800 μm2, which is consistent with the previous report. We once again salute the reviewing expert for such a careful and conscientious review. Considering the profound fiber hypotrophy in MSTN_Del273C mutation with _FGF5 knockout sheep as pointed out by the reviewer, we performed a statistical analysis on the proportion of centrally nucleated myofibres between WT and MF+/- sheep, which can characterize the occurrence of muscle fiber hypotrophy. The results showed that there was no significant difference in the proportion of centrally nucleated myofibres between WT and MF+/- sheep (Figure S2D). At the same time, we also analyzed the mRNA expression levels of muscle fiber hypotrophy and muscle atrophy related genes, such as MTM1, DMD, IGF1, SMN1, and GAA. Although the levels of MTM1, IGF1, SMN1, and GAA were significantly increased (Figure S2E), this elevation did not result in the occurrence of muscle fiber hypotrophy and muscle atrophy, but was beneficial for muscle formation. Therefore, we suggest that the phenomenon produced by MSTN_Del273C mutation with _FGF5 knockout may not be muscle fiber hypotrophy. Because MSTN_Del273C mutation with _FGF5 knockout significantly promotes the proliferation of sheep skeletal muscle satellite cells (Figure 3A-F), and more importantly, its muscle phenotype in MF-/- and MF+/- sheep were improved, including the "double-muscle" phenotype of the rump (Figure 2A), the proportion of gluteus medius in the carcass (Figure 2K), and the proportion of hind leg meat (Table S7).

      The authors also investigated the influence of Fgf5 mutation on muscle development. They determined fiber cross sectional area in heterozygous Fgf5 mutant (number of investigated animals not given) and conclude that Mstn mutation but not Fgf5 mutation caused the double muscle phenotype. Results are insufficient to support this conclusion. Firstly, authors investigated heterozygous FGF5 sheep and not homozygous mutants. Secondly, FGF5 has previously been shown to stimulate expansion of connective tissue fibroblasts and to inhibit skeletal muscle development during limb embryonic development (Clase et al. 2000). Of note, Mstn is also expressed during embryonic development. A combined knockout could therefore entail synergistic effects and cause muscle hyperplasia that is not found in individual knockout, a hypothesis that was not addressed by the authors.

      Thank you very much for your critical review, which is very valuable for improving the quality of our manuscript. We have given the number of animals studied in all figure legends. Given the lack of MSTN and FGF5 single gene edited sheep, both homozygous and heterozygous sheep, especially MSTN single gene edited sheep, we have weakened the view that MSTN mutations rather than FGF5 mutations lead to “double-muscle” phenotype in conclusion and discussion. As you have mentioned, our current data is indeed insufficient to support this conclusion. In addition, considering the expression of MSTN and FGF5 in embryonic development and their regulation of skeletal muscle development, we examined the expression of MSTN and FGF5 in individual development after MSTN_Del273C mutation with _FGF5 knockout (Figure S2A). However, these results are limited by the animals involved in embryonic development, especially single gene edited embryos. We greatly appreciate your very meaningful and valuable comments on the possible synergistic effects of combined knockdown. We will prepare MSTN and FGF5 single gene edited sheep to further explore possible synergistic effects in the following study.

      The authors generated and studied an F1 generation of mutant sheep with heterozyogous mutation in Mstn and Fgf5. In Mstn+/-;Fgf5+/-, gluteus medius muscle was found to be larger compared to wt sheep, whereas other muscles were smaller, and overall meat quantity did not change. Morphometric studies revealed a similar muscle fiber hypotrophy and muscle hyperplasia as in the Mstn-/-;Fgf5-/- gluteus muscle.

      Thank you for your comments. We found that the proportion of gluteus medius in MF+/- sheep was larger than that in WT sheep, and in addition, the proportion of hind leg meat also significantly increased (Table S7). Morphological analysis shows that MF+/- sheep exhibited a myofiber hyperplasia phenotype similar to MF-/- sheep.

      In the next part of results, authors investigated the presence of myostatin protein in homozygous Mstn muscle using immunohistochemistry and found no differences compared to wt, however, positive and negative controls are missing. The also determined Mstn transcription and protein quantity using WB in heterozygous Mstn muscle and found no difference. The authors did not provide data to explain of why the herein generated Mstn mutation causes muscle fiber hypotrophy, whereas most work on myostatin abrogation demonstrated fiber hypertrophy.

      Thank you very much for your constructive comments. Due to the lack of necessary positive and negative controls in immunohistochemistry study, we decided to delete the data on immunohistochemistry in the manuscript to further streamline it. In the current study, although mutations in MSTN lead to a decrease in the cross-sectional area of individual fibers, the number of muscle fibers per unit area were increased, and the final result was an increase in muscle volume and a “double-muscle” phenotype, as well as an increase in the proportion of gluteus medius to carcass (Figure 2K) and the proportion of hind leg meat (Table S7). Importantly, there was no significant difference in the proportion of centrally nucleated myofibres between WT and MF+/- sheep (Figure S2D), and the elevated expression levels of muscle fiber hypotrophy and muscle atrophy marker genes MTM1, IGF1, SMN1, and GAA are more beneficial for muscle health. Therefore, we support that this is not a muscle fiber hypotrophy. As for the phenotype of muscle fiber hypertrophy demonstrated by most myostatin abrogation studies, we analyzed the possible reasons in the discussion, that is, the effect of MSTN mutation on muscle fiber phenotype may be mutant site-dependent.

      Authors then isolated myoblasts from hind limbs of 3-month-old sheep fetuses and cultured in presence of 20% fetal bovine serum before switching to differentiation medium containing 2% horse serum. The cultures showed increased proliferation of Mstn+/-;Fgf5+/- myoblasts as well as downregulation of genes associated with muscle differentiation as well as reduced fusion index. No experiments were performed to assure whether the myostatin and FGF5 pathways were inhibited. No control experiments using supplementation with recombinant proteins and using growth factor depleted culture supplements were performed. As FGF5 and myostatin are secreted factors, evidence is missing whether this led to conditioning of the culture medium. Of note, previous work in mice demonstrated that the double muscle phenotype developed independent of satellite cells activity (Amthor et al. 2009).

      We greatly appreciate your valuable suggestions. In addition to detecting the MSTN pathway at the cellular level, we also assayed the expression of MSTN receptors and downstream Smad and Jun families in the gluteus medius, and found that MSTN_Del273C mutation with _FGF5 knockout led to upregulation of two receptors, while the expression of downstream Smad and Jun families was also inhibited to varying degrees (Figure S4A). Considering the possible serum regulation, we also supplemented the data on serum MSTN regulation. Given that the phenotype of MSTN gene editing is mutation site dependent, we directly cultured skeletal muscle satellite cells using serum from WT and MF+/- sheep. We found that serum from MF+/- sheep promoted the proliferation of skeletal muscle satellite cells (Figure S4D). MSTN_Del273C mutation with _FGF5 knockout promoted FOSL1 expression using WT sheep serum (Figure S4E), which was similar to the results of FBS culture and HS induction. The serum from MF+/- sheep strongly stimulated FOSL1 expression and the inhibition of MyoD1 (Figure S4F). These results indicate that serum regulation cannot be ignored after MSTN_Del273C mutation with _FGF5 knockout.

      Authors then performed RNA seq from Mstn+/-;Fgf5+/- muscle and found a number of differentially expressed genes, but none has been previously reported being involved in the myostatin signaling pathway, so the authors chose to only focus on FOSL1 and associated genes. Authors then demonstrated that Pdpn and Ankrd2 were upregulated during myogenic differentiation, whereas FOPSL1 was downregulated. Moreover, Fosl1 transcription was upregulated in myoblasts and myotubes from Mstn+/-;Fgf5+/- muscle. Authors showed an interaction between Fosl1 and Myod1. Moreover, authors demonstrated that Polsl1 directly binds to the Myod1 promoter. Authors also found decreased p38 MARPK protein levels in proliferating myoblasts from Mstn+/-;Fgf5+/- muscle and increased p38 MARPK in differentiating myotubes.

      In the revised version, we have streamlined this section by removing content such as PDPN, AKNRD2, and p38 MAPK, aiming to focus on the MEK-ERK-FOSL1 axis. Meanwhile, we further confirmed the regulatory effect of FOSL1 on MyoD1 by dual luciferase assay.

      Furthermore, gain-of-function by overexpressing FOSL1 promoted cell proliferation and inhibited differentiation, and tert-butylhydroquinone, an indirect activator of FOSL1 also inhibited myogenic differentiation. The findings do not support the idea that FOSL1 is not involved, but neither do they strongly support the involvement of FOSL1. The observations made by the authors could be co-incidental and not causative in nature.

      We greatly appreciate the valuable suggestions provided by the reviewers, which are of great significance for improving our manuscript. Considering the reviewers’ suggestions, we supplemented the FOSL1 loss-of-function experiments and found that interfering with FOSL1 can inhibit the proliferation and promote differentiation of skeletal muscle satellite cells, which is contrary to the results of overexpression of FOSL1 (Figure 6). Meanwhile, we also used the inhibitor PB98059 to inhibit the ERK pathway to indirectly inhibit the activity of FOSL1, and the results showed that inhibition of FOSL1 activity also promoted myogenic differentiation (Figure 7F-G). These results could further support the important role of FOSL1.

      The manuscript by Chen et al. demonstrated successful gene editing in sheep embryos to obtain biallelic mutation of Mstn and FGF5. The resulting double muscle phenotype resulted from fiber hypotrophy and hyperplasia, which contradicts findings in the literature. Chen et al. generated F1 heterozygous offsprings, in which Mstn transcription and translation did not change. Myoblasts from these animals showed increased proliferation and decreased differentiation, which authors interpreted as the underlying cellular mechanism of the double muscle phenotype. However, no work on muscle development in these animals is presented. Important in vitro control experiments are missing. Chen and collaborators found Fosl1 as a differentially expressed gene in Mstn+/-;Fgf5+/- muscle. Fosl1 drives myoblast proliferation and has direct regulatory effect on the Myod1 promoter. The cellular and molecular mechanism of Fosl1 during myogenesis is novel and solid evidence. However, data remain inadequate to conclude whether Fosl1 indeed acts downstream of myostatin.

      We greatly appreciate the reviewers for their insightful insights and very constructive suggestions, which were very helpful for further improving our data. In our study, although the mutation in MSTN resulted in a decrease in the cross-sectional area of individual muscle fibers, the number of muscle fibers per unit area increased, which ultimately resulted in an increase in muscle size and the development of a "double-muscle" phenotype. Therefore, we support that this is not a manifestation of muscle fiber dystrophy, and the detection of some marker genes for muscle fiber dystrophy and the proportion of central nucleus of muscle fibers also support this hypothesis (Figure S2E-F). In addition, the results such as a reduced cross-sectional area of per muscle fibers in our findings contradict the literature on muscle fiber hypertrophy, which may be due to phenotypic differences caused by mutations at different sites of MSTN, and perhaps may also be species-related. For example, the Belgian blue cattle with a natural mutation in the MSTN gene have an increased number of myofibers and a reduced myofiber cross-sectional area [1], and knockdown of the MSTN gene leads to an increase in the cross-sectional area of muscle fibers in mice, without affecting the number of muscle fibers [2,3], as we further described this in discussion. It should be noted that the possible complementary regulation of FGF5 cannot be ruled out either, but unfortunately, this makes the problem extraordinarily complex. We plan to produce single mutant sheep with segregation of the MSTN and FGF5 genes in subsequent studies and give full consideration to the current problem. Regarding the muscle development of gene-edited animals, due to the limitations of large animal conditions and limited editing individuals, we have not comprehensively evaluated the process of muscle development in vivo to further improve the potential cellular mechanisms of muscle phenotype, except for evaluating the expression of MSTN and FGF5 at the age of 3 months of individual development and the expression of MSTN at 12 months of age (Figure S2A). To determine whether FOSL1 indeed acts downstream of MSTN, we supplemented the expression levels of FOSL1 under serum regulation to support our conclusions (Figure S4D-F).

      [1] Wegner J, Albrecht E, Fiedler I, Teuscher F, Papstein HJ, Ender K. Growth- and breed-related changes of muscle fiber characteristics in cattle[J]. Journal of Animal Science, 2000,78:1485-1496.

      [2] Nishi M, Yasue A, Nishimatu S, Nohno T, Yamaoka T, Itakura M, Moriyama K, Ohuchi H, Noji S. A missense mutant myostatin causes hyperplasia without hypertrophy in the mouse muscle[J]. Biochemical and Biophysical Research Communications, 2002,293:247-251.

      [3] Zhu X, Hadhazy M, Wehling M, Tidball JG, McNally EM. Dominant negative myostatin produces hypertrophy without hyperplasia in muscle[J]. FEBS Letters, 2000,474:71-75.

      As the significant findings are minimal, the amount of text provided, figures and tables are disproportionally excessive. A large number of different molecular techniques are employed to try and decipher the mechanism(s) that result in the observed phenotype = double muscling. The authors focus on the MEK-ERK-FOSL1 pathway an suggest this the key pathway/mechanism resulting in the phenotype observed in MSTNDel273sheep. However, they provide very little solid evidence to support this notion.

      Thank you for your review. We have substantially streamlined the manuscript, removed some irrelevant information, and provided all unnecessary figures and tables as supplementary information. Meanwhile, we have added new data to further support that _MSTN_DelC273 mutation generates a muscle phenotype through the MEK-ERK-FOSL1 pathway.

      The manuscript is very long, complicated and difficult to read, given the minimum amount of significant information that is provided. It requires major rewriting to be published. Further, it misses information in material methods, on the generation of animals, on histological techniques and morphometric studies. There is no information provided on the sex of the animals produced and then analyzed. There are also a number of editorial mistakes e.g. the authors refer to tables S1-S4 in the materials and methods and results section, but and there is no table S1-S4 provided.

      Thank you for your review. We have greatly streamlined and significantly revised the manuscript. At the same time, we have supplemented detailed information on animal generation, histologic and morphological studies in materials and methods, as well as the information on gene-edited animal production, including gender, age, and so on. Finally, we reviewed the entire manuscript and updated any possible omissions or negligence, such as those oversights like tables S1-S4.

      Recommendations for the authors:

      Suggestions to improve the paper (see also public review):

      - Include the method part of generating the gene edited animals.

      We thank the editor and reviewers for pointing out our negligence. We have provided detailed information on the generation method of gene-edited sheep in Materials and Methods, which was produced by injecting MSTN sgRNA, FGF5 sgRNA, and Cas9 mRNA into embryos in different ratios.

      - Increase number of Mstn-/-;Fgf5-/- experimental animals allowing for acquisition of statistically relevant data. This is very important as the muscle phenotype of the F1 generation is not obvious. Authors should provide data that the Mstn mutation indeed invalidates myostatin signaling. They should provide data on myostatin protein Mstn transcription as well on myostatin target genes in Mstn-/-;Fgf5-/- sheep.

      Many thanks to the eidtor and reviewers for their constructive suggestions. The strategy of using MF-/- sheep to validate the transcription and target gene data of myostatin is indeed the best. However, we only generated one MF-/- sheep, which seriously limits the implementation of such an optimal strategy and may also make statistical analysis based on MF-/- sheep unreliable. Considering these factors, our current study mainly focuses on heterozygous MF+/- sheep. We are planning to generate single gene homozygous mutant sheep for MSTN and FGF5 gene separation in subsequent studies and to give full consideration to the current issue.

      - They should also provide data on myostatin target genes in muscles from heterozygous animals.

      Thank you for your very informative suggestions. We have quantitatively detected the mRNA expression levels of the receptors and downstream target genes of MSTN in the gluteus medius of heterozygous MF+/- sheep. Compared with WT sheep, the mRNA expression levels of type I receptor (ACVR1) and type II receptor (ACVR2A, ACVR2B) were highly significantly increased in the muscle of MF+/- sheep (Figure S4A), there was no significant change in mRNA expression levels in the Smand family (Figure S4B), whereas the mRNA expression levels of JunB of Jun family, a downstream target gene of MSTN, were significantly down regulated (Figure S4C). These results suggest that the effect of MSTN_Del273C with _FGF5 knockout may not be limited to MEK-ERK-FOSL1. Again, we would like to thank the editor and reviewers for their constructive suggestions, which provide a new direction for us to further deepen our insight into the mutations of MSTN gene.

      - The morphometric results on fiber CSA seem wrong. By looking at the fiber sizes and size bar in Figure 2 H would bring to far higher estimated CSA. There must be a systematic error in using the morphometric algorithm.

      Thank you very much for your careful review. There were indeed some errors in morphological analysis of the MF-/- sheep longissimus dorsi and gluteus medius. After checking, we found that the reason why the muscle fiber size was much lower than the data in the previously published sheep report was due to the incorrect use of scale bar. To this end, we re-scanned the tissue slices and used the correct scale bar to re-counted the cross-sectional area of muscle fibers and the number of muscle fiber cells per unit area. In this case, the average cross sectional area of muscle fibers in WT sheep was similar to the previous report.

      - The labeling of the ordinate of Fig. 2I is not readable (x1000 µm2, or x100 µm2?). Authors should make sure that they look at the same muscle part, as fiber sizes can highly vary depending on exact anatomical situation. In small laboratory animals, entire muscle cross sections are usually analyzed to prevent such bias. This may proof difficult in large animals, however, small muscles could easily be identified and cross sections of entire muscles be analyzed. As myostatin KO concerns all skeletal muscles, authors could consider muscle such as FDB or extraocular muscles.

      Thank you for your careful review and suggestions. The vertical axis of Figure 2I is in the units of ×1000 μm2, and each data point represents the actual measured area of each muscle fiber. Because there are significant differences in muscle fiber size, we visualized the measurement values of all individual muscle fiber areas, and the average value of the scatter plot was used as the average area of all muscle fibers. We did this to provide a more intuitively display the distribution of muscle fiber size.

      - The material of methods of muscle histology and morphometric studies must be included.

      Thank you for your suggestions. We have supplemented the methods of muscle histology and morphology study, as well as statistical methods for cross-sectional area and quantity of muscle fibers in the material methods.

      - In figures, numbers of experimental animals be given throughout, as well as number of technical repeats. The authors need to provide some minimal data on how the genetically engineered sheep were produced, in addition to how many, the sex etc.....and which of these were analyzed to obtain the data. It is impossible to know when reading this manuscript whether data involving, for example gene seq, westerns, microscopic images etc involves one sheep or some compilation of data.

      Thank you very much for your constructive suggestions, which is of great guiding significance for improving the quality of our manuscript. We have clearly stated the number of experimental animals and the number of any biological replicates in all figure legends. Meanwhile, we have provided detailed information on the generation method of gene edited sheep in the Materials and Methods, which was produced by injecting MSTN sgRNA, FGF5 sgRNA, and Cas9 mRNA into embryos in different ratios.

      - As authors work on Mstn;Fgf5 double KO animals, they should explore whether Fgf5 is expressed in developing sheep muscle, and whether combined KO entails a synergistic effect on muscle development.

      We detected the expression of FGF5 in muscle tissue of WT and MF+/- sheep at 3 months of age of individual development, which was significantly reduced compared to WT sheep (Figure S2A). We greatly appreciate your very meaningful and valuable comments on the possible synergistic effects of combined knockdown. Due to the limitations of single gene knockout of MSTN and FGF5 in sheep in our current study, especially their homozygous mutants. We will prepare MSTN and FGF5 single gene edited sheep to further explore possible synergistic effects in the following study.

      - The authors should address the question of why their mstn mutation causes fiber hypotrophy, whereas most other work reported the opposite. Why would herein generated mutation act differently? Does mutated myostatin gain a different biological effect? Does it bind to different receptors?

      Thank you very much for your valuable comment. Regarding the possibility of muscle fiber dystrophy in MSTN_Del273C mutation with _FGF5 knockout sheep, we have performed a statistical analysis of the proportion of central nucleus of muscle fibers in MF+/- sheep, which can characterize the occurrence of muscle dystrophy in some extent. The results showed that there was no significant difference in the proportion of central nucleus of muscle fibers between WT and MF+/- sheep (Figure S2E). At the same time, we also analyzed the mRNA expression levels of genes MTM1, DMD, IGF1, SMN1, and GAA related to muscle fiber dystrophy and muscle atrophy. Although the levels of MTM1, IGF1, SMN1, and GAA were significantly increased (Figure S2F), this elevation did not lead to the occurrence of muscle fiber dystrophy and muscle atrophy, but instead, it was beneficial for muscle formation. Therefore, we suggested that this phenomenon produced by MSTN_Del273C mutation with _FGF5 knockout may not be muscle fiber dystrophy, as MSTN_Del273C mutation with _FGF5 knockout significantly promoted the proliferation of sheep skeletal muscle satellite cells (Figure 3A-F). More importantly, MSTN_Del273C mutation with _FGF5 knockout improves the muscle phenotype of sheep, including the "double-muscle" phenotype of the rump (Figure 2A), the proportion of gluteus medius to the carcass (Figure 2K), and the proportion of hind leg meat (Table S7). In addition, we analyzed in discussion why the current mutation produces a phenotype different from other work reports, which we suggested that this may be due to different mutation sites. We provided a detailed analysis of this in discussion. It is indeed a very thought-provoking question about whether mutated myostatin acquire different biological effects and whether they bind to different receptors, which we plan to further reveal this in the homozygous MSTN and FGF5 mutant sheep.

      - Concerning the in vitro work, authors need to demonstrate whether Mstn and/or FGF5 signaling pathways are altered in myoblasts/myotubes. As both are secreted factors, authors need to show that serum conditioning is changing in myoblast cultures. Authors should perform cultures in which these factors are entirely suppressed and thus signaling pathway shut down. They could use growth factor depleted supplements and/or add myostatin and FGF5 inhibitors to the serum. The need to determine first the individual effect of myostatin and FGF5 and then challenge the combined effect. They also should perform the inverse experiment and supplement cultures with recombinant factors, both as individual approach and combined approach.

      We greatly appreciate your valuable suggestions. In addition to detecting the MSTN pathway at the cellular level, we also assayed the expression of MSTN receptors and downstream Smad and Jun families in the gluteus medius, and found that MSTN_Del273C mutation with _FGF5 knockout led to upregulation of two receptors, while the expression of downstream Smad and Jun families was also inhibited to varying degrees (Figure S4A). Considering the possible serum regulation, we also supplemented the data on serum MSTN regulation. Because we have previously tested inhibitors of MSTN and FGF5, but did not observe any effect, we suggest this may be due to the nonspecificity of the inhibitors, as there are no sheep specific MSTN and FGF5 inhibitors. Given that the phenotype of MSTN gene editing is mutation site dependent, we directly cultured skeletal muscle satellite cells using serum from WT and MF+/- sheep. We found that serum from MF+/- sheep promoted the proliferation of skeletal muscle satellite cells (Figure S4D). MSTN_Del273C mutation with _FGF5 knockout promoted FOSL1 expression using WT sheep serum (Figure S4E), which was similar to the results of FBS culture and HS induction. The serum from MF+/- sheep strongly stimulated FOSL1 expression and the inhibition of MyoD1 (Figure S4F). These results indicate that serum regulation cannot be ignored after MSTN_Del273C mutation with _FGF5 knockout.

      - With above suggested additional experiments, authors would also be able to demonstrate, whether Fosl1 is indeed triggered in response to myostatin and/or FGF5 signaling.

      To determine whether FOSL1 indeed acts downstream of MSTN, we supplemented the expression levels of FOSL1 under serum regulation to support our conclusions. We found that the serum from MF+/- sheep strongly stimulated FOSL1 expression and the inhibition of MyoD1 (Figure S4F).

      - Authors used t-test despite in several tests despite low sample number, which violates as such the assumption of equal variance. Non-parametric tests should be used in this case.

      Thank you very much for your valuable comments. We apologize for the previous incorrect use of statistical methods. In the revised version, we have re-analyzed all data. Before performing student’s t-test, we first evaluated the assumptions of normal distribution and equal variance. Two-tailed student’s t-tests were used only for data that conformed to normal distribution and homogeneity of variance, otherwise corrected Welch's t-tests were performed.

      - Authors should state in the legends which statistical test was used.

      Thank you for your suggestion. We have clearly stated the statistical testing method used in all figure legends, which is indeed necessary and important.

      In general, this manuscript should be dramatically scaled back in terms of content, eliminating unnecessary text, figures and tables that do not play a significant role in the findings that were significant. There is some interesting information and data here that can add to the overall base of knowledge surrounding the production of genetically engineered livestock in which myostatin has been targeted for mutation. However, the authors need to focus on their findings that were significant and strongly supported by the data and statistical analysis. Some discussion of findings that support their ideas/hypothesis, but are not statistically significant is fine. But it should not make up the majority of the manuscript which is the case here.

      Thank you for your valuable suggestions, which are essential for improving the quality of our manuscript. We have greatly streamlined and significantly revised the manuscript, removed unnecessary text, figures, and tables.

    1. Author response:

      The following is the authors’ response to the original reviews.

      Recommendations for the authors:

      Reviewer #1 (Recommendations for the Authors):

      Arpin is a negative regulator of Arp2/3 activity. Here the authors investigated the role of arpin in vascular permeability using appropriate cultured human and murine endothelial monolayers and successfully developed an arpin KO mice. The results clearly show arpin is expressed in blood vessels (not clear about lymphatics but given leaky vessels, one wonders). The data show that arpin is important for vessel barrier function yet its genetic loss still leads to viable animals in the C57Blk strain albeit with leaky blood vessels. The data are well presented and controls are included. However, the evidence that arpin loss/knockdown causes increased actin functions independent of Arp2/3 is based on pharmacological data and is indirect. Authors conclude ROCK1 activity is elevated and the cause of lost barrier function by arpin reduction. I do have one suggestion for the authors that involves a new study in these animals, which could strengthen their proposed mechanism that the vascular defects are independent of Arp2/3 activity and rather involve ROCK1 but not ZIPK.

      (1) If arpin is working via ROCK1, as the authors infer, perhaps treatment of arpin-/- mice with ROCK1 inhibitor(s) would attenuate vessel permeability while HS38 treatment would not. This type of study would strengthen the conclusion that ROCK1, but not ZIPK, was involved. Including CK666 if active in mouse cells, could also be tested.

      To analyze vascular permeability in vivo, we performed Miles assays in arpin+/+ and arpin-/- mice using the inhibitors of ROCK1 (Y27632) and ZIPK (HS38). Both Y27632 and HS38 reduced the permeability caused by absence of arpin (new Figure 8E), thus confirming what we observed before in HUVEC (shown in old Figure 7). CK666 did not change the permeability in arpin-/- mice, thus confirming the conclusion that arpin does not regulate vascular permeability via Arp2/3 but rather via ROCK1/ZIPK-mediated stress fiber formation (page 13).

      (2) Fig 5. Data demonstrate that Arpin regulates actin filament formations and permeability in HUVEC, but this does not demonstrate its occurring in an Arp2/3-independent manner. If I understand your data this is indirect evidence. One needs more information to reach this conclusion. Can authors measure Arp2/3 directly and then test whether arpin knockdown and CK666 have the same capacity to reduce Arp2/3 activity in vitro.

      Arp2/3 activity cannot be measured directly. The commonly used approach is therefore Arp2/3 inhibition via CK666. Our new in vivo permeability assays (see answer above) together with our HUVEC data in Figure 5 clearly show that CK666 does not have the same effect as arpin knock-down, and neither does CK666 rescue the effects of arpin deficiency in vitro and in vivo. Together, these findings clearly suggest that arpin does not regulate endothelial permeability via Arp2/3.

      Minor issues:

      Fig 2, 3 or other Figs: In presented western blots, all proteins should include appropriate mw labels.

      Thank you. Molecular weights have been added to all Western blots.

      Fig 2. Suggest that like your arpin analysis, amounts of AP1AP and PICK1 at baseline and TNF-treatment by blotting should be included. A minor point is yellow color for labels does not stand out and should be changed to another color - as the authors used in Fig 2C.

      We have included Western blots and quantifications for PICK1 in Figure S1A and S1C. An antibody against AP1AP was unfortunately not available.

      The yellow color has been changed to purple for better visibility.

      Fig 2C. The arpin loss at junctions and actin filaments (Figure 2C) is very minor even though it reached statistical significance. It really is not an obvious loss from your 3 color overlay.

      Thank you. It is indeed hard to see. We included now magnifications in Figure 2C that better show the loss of arpin at junctions.

      Fig 8, text 303-310 shows in vivo evidence of lung congestion and edema. Also appear to be inflammatory cells present in images. If these are inflammatory cells, it begs the question if these mice have an abnormal complete blood cell count (CBC). Suggest adding CBC data for arpin-/- vs control arpin +/+ mice in Fig 8.

      The pathologist observed the presence of lymphocytes and macrophages, indicating the possibility of a (low level) chronic inflammation in arpin-deficient lungs. However, we now also performed hemograms of the mice (new Table S2) that showed no significant difference in the blood cell count of arpin-/- and arpin+/+ mice. Thus, the presence of lymphocytes and macrophages cannot be explained simply by higher leukocyte counts (page 14).

      Line 289, pg 13, Fig 8: Lung levels of arpin are not shown in Fig 8B. Authors must mean another fig?

      Sorry. Arpin protein levels in lungs are shown in figure 8C. This has been corrected on page 13.

      Reviewer #2 (Recommendations For The Authors):

      This is a solid piece of work that adds a small amount of additional factual information to our understanding of cell-cell junctions. The experimental work is of good quality and is sufficient to support the aims of the paper. I think the value of the work is to add this small amount of new knowledge to the archive. I do not believe that further experimental work would add to the paper - it's done. But this doesn't have the impact or completeness for this journal. It belongs in a for-the-record journal.

      We appreciate your overall positive evaluation and your comments that our study represents a solid piece of work with good quality experimental work. However, we are not sure what you mean by “it belongs in a for-the-record journal”. Anyway, we agree that our study does not reveal a complete mechanism of how arpin regulates actin stress fibers, but we respectfully disagree that our study only adds a “small amount of additional factual information”. We may not have been very clear about it, but we present in this study several new discoveries and although some are descriptive in nature that does not make them trivial or less important. We provide for the first time experimental evidence that: 1) arpin is expressed in endothelial cells in vitro and in vivo, and downregulated during inflammation; 2) presence of arpin is required for proper endothelial permeability regulation and junction architecture; 3) arpin exerts these functions in an Arp2/3-independent manner; 4) arpin controls actomyosin contractility in a ROCK1- and ZIPK-dependent fashion; 5) arpin knock-out mice are viable and breed and develop normally but show histological characteristics of a vascular phenotype and increased vascular permeability that can be rescued by inhibition of ROCK1 and ZIPK. The fact that arpin fulfills its functions in endothelial cells independently of the Arp2/3 complex is of special relevance as previously the only known function of arpin was the inhibition of the Arp2/3 complex. Thus, we believe that our study adds a significant amount of new information to the literature. Thank you very much.

    1. Author response:

      Reviewer #1 (Public Review):

      Summary: 

      BMP signaling is, arguably, best known for its role in the dorsoventral patterning, but not in nematodes, where it regulates body size. In their paper, Vora et al. analyze ChIP-Seq and RNA-Seq data to identify direct transcriptional targets of SMA-3 (Smad) and SMA-9 (Schnurri) and understand the respective roles of SMA-3 and SMA-9 in the nematode model Caenorhabditis elegans. The authors use publicly available SMA-3 and SMA-9 ChIP-Seq data, own RNA-Seq data from SMA-3 and SMA-9 mutants, and bioinformatic analyses to identify the genes directly controlled by these two transcription factors (TFs) and find approximately 350 such targets for each. They show that all SMA-3-controlled targets are positively controlled by SMA-3 binding, while SMA-9-controlled targets can be either up or downregulated by SMA-9. 129 direct targets were shared by SMA-3 and SMA-9, and, curiously, the expression of 15 of them was activated by SMA-3 but repressed by SMA-9. Since genes responsible for cuticle collagen production were eminent among the SMA-3 targets, the authors focused on trying to understand the body size defect known to be elicited by the modulation of BMP signaling. Vora et al. provide compelling evidence that this defect is likely to be due to problems with the BMP signaling-dependent collagen secretion necessary for cuticle formation. 

      We thank the reviewer for this supportive summary. We would like to clarify the status of the publicly available ChIP-seq data. We generated the GFP tagged SMA-3 and SMA‑9 strains and submitted them to be entered into the queue for ChIP-seq processing by the modENCODE (later modERN) consortium. Due to the nature of the consortium’s funding, the data were required to be released publicly upon completion. Nevertheless, we have provided the first comprehensive analysis of these datasets.

      Strengths: 

      Vora et al. provide a valuable analysis of ChIP-Seq and RNA-Seq datasets, which will be very useful for the community. They also shed light on the mechanism of the BMP-dependent body size control by identifying SMA-3 target genes regulating cuticle collagen synthesis and by showing that downregulation of these genes affects body size in C. elegans. 

      Weaknesses: 

      (1) Although the analysis of the SMA-3 and SMA-9 ChIP-Seq and RNA-Seq data is extremely useful, the goal "to untangle the roles of Smad and Schnurri transcription factors in the developing C. elegans larva", has not been reached. While the role of SMA-3 as a transcriptional activator appears to be quite straightforward, the function of SMA-9 in the BMP signaling remains obscure. The authors write that in SMA-9 mutants, body size is affected, but they do not show any data on the mechanism of this effect. 

      We thank the reviewer for directing our attention to the lack of clarity about SMA-9’s function. We will revise the text to highlight what this study and others demonstrate about SMA-9’s role in body size. We also plan to analyze additional target genes to deepen our model for how SMA-3 and SMA-9 interact functionally to produce a given transcriptional response.

      (2) The authors clearly show that both TFs can bind independently of each other, however, by using distances between SMA-3 and SMA-9 ChIP peaks, they claim that when the peaks are close these two TFs act as complexes. In the absence of proof that SMA-3 and SMA-9 physically interact (e.g. that they co-immunoprecipitate - as they do in Drosophila), this is an unfounded claim, which should either be experimentally substantiated or toned down. 

      A physical interaction between Smads and Schnurri has been amply demonstrated in other systems. The limitation in the previous work is that only a small number of target genes was analyzed. Our goal in this study was to determine how widespread this interaction is on a genomic scale.  Our analyses demonstrate for the first time that a Schnurri transcription factor has significant numbers of both Smad-dependent and Smad-independent target genes. We will revise the text to clarify this point.

      (3) The second part of the paper (the collagen story) is very loosely connected to the first part. dpy-11 encodes an enzyme important for cuticle development, and it is a differentially expressed direct target of SMA-3. dpy-11 can be bound by SMA-9, but it is not affected by this binding according to RNA-Seq. Thus, technically, this part of the paper does not require any information about SMA-9. However, this can likely be improved by addressing the function of the 15 genes, with the opposing mode of regulation by SMA-3 and SMA-9. 

      We appreciate this suggestion and will clarify how SMA-9 and its target genes contribute to collagen organization and body size regulation.

      (4) The Discussion does not add much to the paper - it simply repeats the results in a more streamlined fashion. 

      We thank the reviewer for this suggestion. We will add more context to the Discussion.

      Reviewer #2 (Public Review): 

      In the present study, Vora et al. elucidated the transcription factors downstream of the BMP pathway components Smad and Schnurri in C. elegans and their effects on body size. Using a combination of a broad range of techniques, they compiled a comprehensive list of genome-wide downstream targets of the Smads SMA-3 and SMA-9. They found that both proteins have an overlapping spectrum of transcriptional target sites they control, but also unique ones. Thereby, they also identified genes involved in one-carbon metabolism or the endoplasmic reticulum (ER) secretory pathway. In an elaborate effort, the authors set out to characterize the effects of numerous of these targets on the regulation of body size in vivo as the BMP pathway is involved in this process. Using the reporter ROL-6::wrmScarlet, they further revealed that not only collagen production, as previously shown, but also collagen secretion into the cuticle is controlled by SMA-3 and SMA-9. The data presented by Vora et al. provide in-depth insight into the means by which the BMP pathway regulates body size, thus offering a whole new set of downstream mechanisms that are potentially interesting to a broad field of researchers.

      The paper is mostly well-researched, and the conclusions are comprehensive and supported by the data presented. However, certain aspects need clarification and potentially extended data. 

      (1) The BMP pathway is active during development and growth. Thus, it is logical that the data shown in the study by Vora et al. is based on L2 worms. However, it raises the question of if and how the pattern of transcriptional targets of SMA-3 and SMA-9 changes with age or in the male tail, where the BMP pathway also has been shown to play a role. Is there any data to shed light on this matter or are there any speculations or hypotheses? 

      We agree that these are intriguing questions and we are interested in the roles of transcriptional targets at other developmental stages and in other physiological functions, but these analyses are beyond the scope of the current study.

      (2) As it was shown that SMA-3 and SMA-9 potentially act in a complex to regulate the transcription of several genes, it would be interesting to know whether the two interact with each other or if the cooperation is more indirect. 

      A physical interaction between Smads and Schnurri has been amply demonstrated in other systems. Our goal in this study was not to validate this physical interaction, but to analyze functional interactions on a genome-wide scale.

      (3) It would help the understanding of the data even more if the authors could specifically state if there were collagens among the genes regulated by SMA-3 and SMA-9 and which. 

      We thank the reviewer for this suggestion and will add the requested information in the text.

      (4) The data on the role of SMA-3 and SMA-9 in the regulation of the secretion of collagens from the hypodermis is highly intriguing. The authors use ROL-6 as a reporter for the secretion of collagens. Is ROL-6 a target of SMA-9 or SMA-3? Even if this is not the case, the data would gain even more strength if a comparable quantification of the cuticular levels of ROL-6 were shown in Figure 6, and potentially a ratio of cuticular versus hypodermal levels. By that, the levels of secretion versus production can be better appreciated. 

      rol-6 has been identified as a transcriptional target of this pathway. The level of ROL-6 protein, however, is not changed in sma-3 and sma-9 mutants, indicating that there is post-transcriptional compensation. We will include these data in the revised manuscript.

      (5) It is known that the BMP pathway controls several processes besides body size. The discussion would benefit from a broader overview of how the identified genes could contribute to body size. The focus of the study is on collagen production and secretion, but it would be interesting to have some insights into whether and how other identified proteins could play a role or whether they are likely to not be involved here (such as the ones normally associated with lipid metabolism, etc.). 

      We will add this information to the Discussion.

    1. Author response:

      The following is the authors’ response to the original reviews.

      Summary Responses: Besides the WT allele, equivalent to the mouse TMEM173 gene, the human TMEM173 gene has two common alleles: the HAQ and AQ alleles carried by billions of people. The main conclusions and interpretation, summarized in the Title and Abstract, are i) Different from the WT TMEM173 allele, the HAQ or AQ alleles are resistant to STING activation-induced cell death; ii) STING residue 293 is critical for cell death; iii) HAQ, AQ alleles are dominant to the SAVI allele; iv) One copy of the AQ allele rescues the SAVI disease in mice. We propose that STING research and STING-targeting immunotherapy should consider human TMEM173 heterogeneity. These interpretations and conclusions were based on Data and Logic. We welcome alternative, logical interpretations and collaborations to advance the human TMEM173 research.

      Public Reviews:

      Reviewer #1 (Public Review):

      Summary:

      This manuscript by Aybar-Torres et al investigated the effect of common human STING1 variants on STING-mediated T cell phenotypes in mice. The authors previously made knock-in mice expressing human STING1 alleles HAQ or AQ, and here they established a new knock-in line Q293. The authors stimulated cells isolated from these mice with STING agonists and found that all three human mutant alleles resist cell death, leading to the conclusion that R293 residue is essential for STING-mediated cell death (there are several caveats with this conclusion, more below). The authors also bred HAQ and AQ alleles to the mouse Sting1-N153S SAVI mouse and observed varying levels of rescue of disease phenotypes with the AQ allele showing more complete rescue than the HAQ allele. The Q293 allele was not tested in the SAVI model. They conclude that the human common variants such as HAQ and AQ have a dominant negative effect over the gain-of-function SAVI mutants.

      Strengths:

      The authors and Dr. Jin's group previously made important observations of common human STING1 variants, and these knock-in mouse models are essential for understanding the physiological function of these alleles.

      Weaknesses:

      However, although some of the observations reported here are interesting, the data collectively does not support a unified model. The authors seem to be drawing two sets of conclusions from in vitro and in vivo experiments, and neither mechanism is clear. Several experiments need better controls, and these knock-in mice need more comprehensive functional characterization.

      (1) In Figure 1, the authors are trying to show that STING agonist-induced splenocytes cell death is blocked by HAQ, AQ and Q alleles. The conclusion at line 134 should be splenocytes, not lymphocytes. Most experiments in this figure were done with mixed population that may involve cell-to-cell communication. Although TBK1-dependence is likely, a single inhibitor treatment of a mixed population is not sufficient to reach this conclusion.

      We greatly appreciate Reviewer 1's insights. We changed the “lymphocytes” to “splenocytes” (line 133) as suggested. We respectfully disagree with Reviewer 1’s comments on TBK1. First, we used two different TBK1 inhibitors: BX795 and GSK8612. Second, because BX795 also inhibits PDK1, we used a PDK1 inhibitor GSK2334470; Third, both BX795 and GSK8612 completely inhibited diABZI-induced splenocyte cell death (Figure 1B) (lines 128 – 133). The logical conclusion is “TBK1 activation is required for STING-mediated mouse spleen cell death ex vivo”. (line 117).

      Our discovery that the common human TMEM173 alleles are resistant to STING activation-induced cell death is a substantial finding. It further strengthens the argument that the HAQ and AQ alleles are functionally distinct from the WT allele 1-3. We wish to underscore the crucial message of this study-that 'STING research and STING-targeting immunotherapy should consider TMEM173 heterogeneity in humans' (line 37), which has been largely overlooked in current STING clinical trials 4.

      Regarding STING-Cell death, as we stated in the Introduction (lines 65-77). i) STING-mediated cell death is cell type-dependent 5-7 and type I IFNs-independent 5,7,8. ii) The in vivo biological significance of STING-mediated cell death is not clear 7,8. iii) The mechanisms of STING-Cell death remain controversial. Multiple cell death pathways, i.e., apoptosis, necroptosis, pyroptosis, ferroptosis, and PANoptosis, are proposed 7,9,10. SAVI/HAQ, SAVI/AQ prevented lymphopenia and alleviated SAVI disease in mice. Thus, the manuscript provides some answers to the biological significance of STING-cell death in vivo, which is new. Regarding the molecular mechanism, splenocytes from Q293/Q293 mice are resistant to STING cell death. The logical conclusion is that the amino acid 293 is critical for STING cell death (line 29).

      Extensive studies are needed, beyond the scope of this manuscript, on how aa293 and TBK1 mediates STING-Cell death to resolve the controversies in the STING-cell death fields (e.g. apoptosis, necroptosis, pyroptosis, ferroptosis, and PANoptosis).

      (2) Q293 knock-in mouse needs to be characterized and compared to HAQ and AQ. Is this mutant expressed in tissues? Does this mutant still produce IFN and other STING activities? Does the protein expression level altered on Western blot? Is the mutant protein trafficking affected? In the authors' previous publications and some of the Western blot here, expression levels of each of these human STING1 protein in mice are drastically different. HAQ and AQ also have different effects on metabolism (pmid: 36261171), which could complicate interoperation of the T cell phenotypes.

      These are very important questions that require rigorous investigations that are beyond the scope of this manuscript. This manuscript, titled “The common TMEM173 HAQ, AQ alleles rescue CD4 T cellpenia, restore T-regs, and prevent SAVI (N153S) inflammatory disease in mice” does not focus on Q293 mice. We have been investigating the common human TMEM173 alleles since 2011 from the discovery 11 , mouse model 1,3, human clinical trial 2, and human genetics studies 3. This manuscript is another step towards understanding these common human TMEM173 alleles with the new discovery that HAQ, AQ alleles are resistant to STING cell death.

      (3) HAQ/WT and AQ/WT splenocytes are protected from STING agonist-induced cell death equally well (Figure 1G). HAQ/SAVI shows less rescue compared to AQ/SAVI. These are interesting observations, but mechanism is unclear and not clearly discussed. E.g., how does AQ protect disease pathology better than HAQ (that contains AQ)? Does Q293 allele also fully rescue SAVI?

      In this manuscript, Figure 6 shows AQ/SAVI had more T-regs than HAQ/SAVI (lines 251 – 261). In our previous publication on HAQ, AQ knockin mice, we showed that AQ T-regs have more IL-10 than HAQ T-regs 3. Thus, increased IL-10+ Tregs in AQ mice may contribute to an improved phenotype in AQ/SAVI compared to HAQ/SAVI. However, we are not excluding other contributions (e.g. metabolic difference) (lines 332-335). We are exploring these possibilities.  

      (4) Figure 2 feels out of place. First of all, why are the authors using human explant lung tissues? PBMCs should be a better source for lymphocytes. In untreated conditions, both CD4 and B cells show ~30% dying cells, but CD8 cells show 0% dying cells. This calls for technical concerns on the CD8 T cell property or gating strategy because in the mouse experiment (Figure 1A) all primary lymphocytes show ~30% cell death at steady-state. Second, Figure 2C, these type of partial effect needs multiple human donors to confirm. Three, the reconstitution of THP1 cells seems out of place. STING-mediated cell death mechanism in myeloid and lymphoid cells are likely different. If the authors want to demonstrate cell death in myeloid cells using THP1, then these reconstituted cell lines need to be better validated. Expression, IFN signaling, etc. The parental THP1 cells is HAQ/HAQ, how does that compare to the reconstitutions? There are published studies showing THP1-STING-KO cells reconstituted with human variants do not respond to STING agonists as expected. The authors need to be scientifically rigorous on validation and caution on their interpretations.

      Figure 2 is necessary because it reveals the difference between mouse and human STING cell death, which is critical to understand STING in human health and diseases (lines 160-161). Figure 2A-2B showed that STING activation killed human CD4 T cells, but not human CD8 T cells or B cells. This observation is different from Figure 1A, where STING activation killed mouse CD4, CD8 T cells, and CD19 B cells, revealing the species-specific STING cell death responses. Regarding human CD8 T cells, as we stated in the Discussion (lines 323-325), human CD8 T cells (PBMC) are not as susceptible as the CD4 T cells to STING-induced cell death 8. We used lung lymphocytes that showed similar observations (Figure 2A). For Figure 2C, we used 2 WT/HAQ and 3 WT/WT individuals (lines 738-739). We generate HAQ, AQ THP-1 cells in STING-KO THP-1 cells (Invivogen,, cat no. thpd-kostg) (lines 380-387).

      A recent study found that a new STING agonist SHR1032 induces cell death in STING-KO THP-1 cells expressing WT(R232) human STING 10 (line 182). SHR1032 suppressed THP1-STING-WT(R232) cell growth at GI50: 23 nM while in the parental THP1-STING-HAQ cells, the GI50 of SHR1032 was >103 nM 10. Cytarabine was used as an internal control where SHR1032 killed more robustly than cytarabine in the THP1-STING-WT(R232) cells but much less efficiently than cytarabine in the THP-1-STING-HAQ cells 10. 

      Our manuscript rigorously uses mouse splenocytes, human lung lymphocytes, THP-1 reconstituted with HAQ, AQ, and HAQ/SAVI, AQ/SAVI mice, to demonstrate that the common human HAQ, AQ alleles are resistant to STING cell death in vitro and in vivo.

      We agree with Reviewer 1 that STING-mediated cell death mechanisms in myeloid and lymphoid cells may be different and likely contribute to the different mechanisms proposed in STING cell death research 7,9,10. Our study focuses on the in vivo STING-mediated T cellpenia.

      (5) Figure 2G, H, I are confusing. AQ is more active in producing IFN signaling than HAQ and Q is the least active. How to explain this?

      We stated in the Introduction that “AQ responds to CDNs and produce type I IFNs in vivo and in vitro 3,12,13 ”(line 92-93). We reported that the AQ knock in mice responded to STING activation 3. We previously showed that there was a negative natural selection on the AQ allele in individuals outside of Africa 3. 28% of Africans are WT/AQ but only 0.6% East Asians are WT/AQ 3. In contrast, the HAQ allele was positively selected in non-Africans 3. Investigation to understand the mechanisms and biological significance of these naturally selected human TMEM173 alleles has been ongoing in the lab.

      (6) The overall model is unclear. If HAQ, AQ and Q are loss-of-function alleles and Q is the key residue for STING-mediated cell death, then why AQ is the most active in producing IFN signaling and AQ/SAVI rescues disease most completely? If these human variants act as dominant negatives, which would be consistent with the WT/het data, then how do you explain AQ is more dominant negative than HAQ?

      In this manuscript, Figure 6 shows AQ/SAVI had more T-regs than HAQ/SAVI (lines 251 – 261). In our previous publication on HAQ, AQ knockin mice, we showed that AQ T-regs have more IL-10 and mitochondria activity than HAQ T-regs 3. Nevertheless, we are not excluding other contributions (e.g. metabolic difference) by the AQ allele (lines 332-335). Last, we used modern human evolution to discover the dominance of these common human STING alleles. In modern humans outside Africans, HAQ was positively selected while AQ was negatively selected 3. However, AQ is likely dominant to HAQ because there is no HAQ/AQ individuals outside Africa. The genetic dominance of common human TMEM173 allele is a new concept. More investigation is ongoing.

      (7) As a general note, SAVI disease phenotypes involve multiple cell types. Lymphocyte cell death is only one of them. The authors' characterization of SAVI pathology is limited and did not analyze immunopathology of the lung.

      Both radioresistant parenchymal and/or stromal cells and hematopoietic cells influence SAVI pathology in mice 14,15. Nevertheless, the lack of CD 4 T cells, including the anti-inflammatory T-regs, likely contributes to the inflammation in SAVI mice and patients 16. We characterized lung function, lung inflammation (Figure 4), lung neutrophils, and inflammatory monocyte infiltration (Figure S5) (lines 232-235).

      (8) Line 281, the discussion on HIV T cell death mechanism is not relevant and over-stretching. This study did not evaluate viral infection in T cells at all. The original finding of HAQ/HAQ enrichment in HIV/AIDS was 2/11 in LTNP vs 0/11 in control, arguably not the strongest statistics.

      Several publications have linked STING to HIV pathogenesis 17-22  (line 271). CD4 T cellpenia is a hallmark of AIDS. The manuscript studies STING activation-induced T cellpenia in vivo. It is not stretching to ask, for example, does preventing STING T cell death (e.g HAQ, AQ alleles) can restore CD4 T cell counts and improve care for AIDS patients?

      Reviewer #2 (Public Review):

      Aybar-Torres and colleagues utilize common human STING alleles to dissect the mechanism of SAVI inflammatory disease. The authors demonstrate that these common alleles alleviate SAVI pathology in mice, and perhaps more importantly use the differing functionality of these alleles to provide insight into requirements of SAVI disease induction. Their findings suggest that it is residue A230 and/or Q293 that are required for SAVI induction, while the ability to induce an interferon-dependent inflammatory response is not. This is nicely exemplified by the AQ/SAVI mice that have an intact inflammatory response to STING activation, yet minimal disease progression. As both mutants seem to be resistant STING-dependent cell death, this manuscript also alludes to the importance of STING-dependent cell death, rather than STING-dependent inflammation, in the progression of SAVI pathology. While I have some concerns, I believe this manuscript makes some important connections between STING pathology mouse models and human genetics that would contribute to the field.

      Some points to consider:

      (1) While the CD4+ T cell counts from HAQ/SAVI and AQ/SAVI mice suggest that these T cells are protected from STING-dependent cell death, an assay that explores this more directly would strengthen the manuscript. This is also supported by Fig 2C, but I believe a strength of this manuscript is the comparison between the two alleles. Therefore, if possible, I would recommend the isolation of T cells from these mice and direct stimulation with diABZI or other STING agonist with a cell death readout.

      Please see the new Figure S3 for cell death by diABZI, DMXAA in Splenocytes from WT/WT, WT/HAQ, HAQ/SAVI, AQ/SAVI mice. The HAQ/SAVI and AQ/SAVI splenocytes showed similar partial resistance to STING activation-induced cell death (lines 214-216).

      (2) Related to the above point - further exemplifying that the Q293 locus is essential to disease, even in human cells, would also strengthen the paper. It seems that CD4 T cell loss is a major component of human SAVI. While not co_mpletely necessary, repeating the THP1 cell death experiments from Fig 2 with a human T cell line would round out the study nicely._

      We examined HAQ, AQ mouse splenocytes, HAQ human lung lymphocytes, THP-1 reconstituted with HAQ, AQ, and HAQ/SAVI, AQ/SAVI mice, to demonstrate that the common human HAQ, AQ alleles are resistant to STING cell death in vitro and in vivo. Additional human T cell line work does not add too much. We hope to conduct more human PBMC or lung lymphocytes STING cell death experiments from HAQ, AQ individuals as we continue the human STING alleles investigation.

      (3) While I found the myeloid cell counts and BMDM data interesting, I think some more context is needed to fully loop this data into the story. Is myeloid cell expansion exemplified by SAVI patients? Do we know if myeloid cells are the major contributors to the inflammation these patients experience? Why should the SAVI community care about the Q293 locus in myeloid cells?

      This is likely a misunderstanding. We use BMDM for the purpose of comparing STING signaling (TBK1, IRF3, NFkB, STING activation) by WT/SAVI, HAQ/SAVI, AQ/SAVI. Ideally, we would like to compare STING signaling in CD4 T cells from WT/SAVI to HAQ/SAVI, AQ/SAVI mice. However, WT/SAVI has no CD4 T cells. Doing so, we are making the assumption that the basic STING signaling (TBK1, IRF3, NFkB, STING activation) is conserved between T cells and macrophages.

      (4) The functional assays in Figure 4 are exciting and really connect the alleles to disease progression. To strengthen the manuscript and connect all the data, I would recommend additional readouts from these mice that address the inflammatory phenotype shown in vitro in Figure 5. For example, measuring cytokines from these mice via ELISA or perhaps even Western blots looking for NFkB or STING activation would be supportive of the story. This would also allow for some tissue specificity. I believe looking for evidence of inflammation and STING activation in the lungs of these mice, for example, would further connect the data to human SAVI pathology.

      Reviewer 2 suggests looking for evidence of inflammation and STING activation in the lungs of HAQ/SAVI, AQ/SAVI. We would like to elaborate further. First, anti-inflammatory treatments, e.g. steroids, DMARDs, IVIG, Etanercept (TNF), rituximab, Nifedipine, amlodipine, et al., all failed in SAVI patients 23. JAK inhibitors on SAVI had mixed outcomes (lines 55-58). Second, Figure S5 examined lung neutrophils and inflammatory monocyte infiltration. Interestingly, while AQ/SAVI mice had a better lung function than HAQ/SAVI mice (Figure 4D, 4E vs 4H, 4I), HAQ/SAVI and AQ/SAVI lungs had comparable neutrophils and inflammatory monocyte infiltration (Figure S5). Last, SAVI is classified as type I interferonopathy 23, but the lung diseases of SAVI are mainly independent of type I IFNs 24-27. The AQ allele suppresses SAVI in vivo.  Understanding the mechanisms by which AQ rescues SAVI may lead to curative care for SAVI patients.

      Recommendations for the authors:

      Reviewer #1 (Recommendations For The Authors):

      One suggestion is to streamline this study by focusing on STING-mediated cell death only in CD4 T cells. The authors can use in vitro PBMC isolated human T cells, ex vivo T cells from the knock-in mice, and in vivo T cells from the SAVI breeding. The current manuscript includes myeloid cell death, Tregs, complex SAVI disease pathology, which is too confusing and too complex to explain with the varying effect from the three human STING1 variants.

      We sincerely appreciate Reviewer 1’s suggestion. The goal of our human STING alleles research has always been translational, i.e. improving human health. Even as a monogenetic disease, the SAVI pathology is still complex. For example, thought as a type I Interferonopathy, SAVI is largely independent of type I IFNs. Similarly, STING-activation-induced cell death, while contribute to SAVI, is not the whole story, as the Reviewer pointed out in the Comment 3 & 6 &7. HAQ/SAVI mice still died early and had lung dysfunction (Figure 4). In contrast, AQ/SAVI mice restore lifespan and lung function. We had Figure 6 show different T-regs between AQ/SAVI and HAQ/SAVI mice. In addition, AQ mice had more IL-10+ T-regs than HAQ mice 3. Therefore, we are excited about developing AQ-based curative therapy for SAVI patients (preventing cell death and inducing immune tolerance).  Again, we thank the Reviewer for the suggestion. Additional research is ongoing.

      Reviewer #2 (Recommendations For The Authors):

      Minor points

      (1) Generation of THP1 cells with the human STING alleles is missing from methods.

      We added the protocol in the methods (lines 380-387). THP-1 KO line stable expressing WT STING was first described by Weikang Tao’s group 10.

      (2) Some abbreviations are not expanded (CDA).

      CDA is expanded as cyclic di-AMP (e.g. line 375).

      References.

      (1) Patel, S. et al. The Common R71H-G230A-R293Q Human TMEM173 Is a Null Allele. J Immunol 198, 776-787 (2017).

      (2) Sebastian, M. et al. Obesity and STING1 genotype associate with 23-valent pneumococcal vaccination efficacy. JCI Insight 5 (2020).

      (3) Mansouri, S. et al. MPYS Modulates Fatty Acid Metabolism and Immune Tolerance at Homeostasis Independent of Type I IFNs. J Immunol 209, 2114-2132 (2022).

      (4) Sivick, K. E. et al. Comment on "The Common R71H-G230A-R293Q Human TMEM173 Is a Null Allele". J Immunol 198, 4183-4185 (2017).

      (5) Gulen, M. F. et al. Signalling strength determines proapoptotic functions of STING. Nat Commun 8, 427 (2017).

      (6) Kabelitz, D. et al. Signal strength of STING activation determines cytokine plasticity and cell death in human monocytes. Sci Rep 12, 17827 (2022).

      (7) Murthy, A. M. V., Robinson, N. & Kumar, S. Crosstalk between cGAS-STING signaling and cell death. Cell Death Differ 27, 2989-3003 (2020).

      (8) Kuhl, N. et al. STING agonism turns human T cells into interferon-producing cells but impedes their functionality. EMBO Rep 24, e55536 (2023).

      (9) Li, C., Liu, J., Hou, W., Kang, R. & Tang, D. STING1 Promotes Ferroptosis Through MFN1/2-Dependent Mitochondrial Fusion. Front Cell Dev Biol 9, 698679 (2021).

      (10) Song, C. et al. SHR1032, a novel STING agonist, stimulates anti-tumor immunity and directly induces AML apoptosis. Sci Rep 12, 8579 (2022).

      (11) Jin, L. et al. Identification and characterization of a loss-of-function human MPYS variant. Genes Immun 12, 263-269 (2011).

      (12) Yi, G. et al. Single nucleotide polymorphisms of human STING can affect innate immune response to cyclic dinucleotides. PLoS One 8, e77846 (2013).

      (13) Patel, S. et al. Response to Comment on "The Common R71H-G230A-R293Q Human TMEM173 Is a Null Allele". J Immunol 198, 4185-4188 (2017).

      (14) Gao, K. M. et al. Endothelial cell expression of a STING gain-of-function mutation initiates pulmonary lymphocytic infiltration. Cell Rep 43, 114114 (2024).

      (15) Gao, K. M., Motwani, M., Tedder, T., Marshak-Rothstein, A. & Fitzgerald, K. A. Radioresistant cells initiate lymphocyte-dependent lung inflammation and IFNgamma-dependent mortality in STING gain-of-function mice. Proc Natl Acad Sci U S A 119, e2202327119 (2022).

      (16) Hu, W. et al. Regulatory T cells function in established systemic inflammation and reverse fatal autoimmunity. Nat Immunol 22, 1163-1174 (2021).

      (17) Monroe, K. M. et al. IFI16 DNA sensor is required for death of lymphoid CD4 T cells abortively infected with HIV. Science 343, 428-432 (2014).

      (18) Doitsh, G. et al. Cell death by pyroptosis drives CD4 T-cell depletion in HIV-1 infection. Nature 505, 509-514 (2014).

      (19) Jakobsen, M. R., Olagnier, D. & Hiscott, J. Innate immune sensing of HIV-1 infection. Curr Opin HIV AIDS 10, 96-102 (2015).

      (20) Silvin, A. & Manel, N. Innate immune sensing of HIV infection. Curr Opin Immunol 32, 54-60 (2015).

      (21) Altfeld, M. & Gale, M., Jr. Innate immunity against HIV-1 infection. Nat Immunol 16, 554-562 (2015).

      (22) Krapp, C., Jonsson, K. & Jakobsen, M. R. STING dependent sensing - Does HIV actually care? Cytokine Growth Factor Rev 40, 68-76 (2018).

      (23) Liu, Y. et al. Activated STING in a vascular and pulmonary syndrome. N Engl J Med 371, 507-518 (2014).

      (24) Luksch, H. et al. STING-associated lung disease in mice relies on T cells but not type I interferon. J Allergy Clin Immunol 144, 254-266 e258 (2019).

      (25) Stinson, W. A. et al. The IFN-gamma receptor promotes immune dysregulation and disease in STING gain-of-function mice. JCI Insight 7 (2022).

      (26) Warner, J. D. et al. STING-associated vasculopathy develops independently of IRF3 in mice. J Exp Med 214, 3279-3292 (2017).

      (27) Fremond, M. L. et al. Overview of STING-Associated Vasculopathy with Onset in Infancy (SAVI) Among 21 Patients. J Allergy Clin Immunol Pract 9, 803-818 e811 (2021).

    1. Author response:

      The following is the authors’ response to the original reviews.

      Public Reviews:

      Reviewer #1 (Public Review):

      In this work, the authors provide a comprehensive description of transcriptional regulation in Pseudomonas syringae by investigating the binding characteristics of various transcription factors. They uncover the hierarchical network structure of the transcriptome by identifying top-, middle-, and bottom-level transcription factors that govern the flow of information in the network. Additionally, they assess the functional variability and conservation of transcription factors across different strains of P. syringae by studying DNA-binding characteristics. These findings notably expand our current knowledge of the P. syringae transcriptome.

      The findings associated with crosstalk between transcription factors and pathways, and the diversity of transcription factor functions across strains provide valuable insights into the transcriptional regulatory network of P. syringae. However, these results are at times underwhelming as their significance is unclear. This study would benefit from a discussion of the implications of transcription factor crosstalk on the functioning of the organism as a whole. Additionally, the implications of variability in transcription factor functions on the phenotype of the strains studied would further this analysis.<br /> Overall, this manuscript serves as a key resource for researchers studying the transcriptional regulatory network of P. syringae.

      Thank you for your positive comments.

      Reviewer #2 (Public Review):

      Summary:

      The phytopathogenic bacterium Pseudomonas syringae is comprised of many pathovars with different host plant species and has been used as a model organism to study bacterial pathogenesis in plants. Transcriptional regulation is key to plant infection and adaptation to host environments by this bacterium. However, researchers have focused on a limited number of transcription factors (TFs) that regulate virulence-related pathways. Thus, a comprehensive, systems-level understanding of regulatory interactions between transcription factors in P. syringae has not been achieved.

      This study by Sun et al performed ChIP-seq analysis of 170 out of 301 TFs in P. syringae pv. syringae 1448A and used this unique dataset to infer transcriptional regulatory networks in this bacterium. The network analyses revealed hierarchical interactions between TFs, various network motifs, and co-regulation of target genes by TF pairs, which collectively mediate information flow. As discussed, the structure and properties of the P. syringae transcriptional regulatory networks are somewhat different from those identified in humans, yeast, and E. coli, highlighting the significance of this study. Further, the authors made use of the P. syringae transcriptional regulatory networks to find TFs of unknown functions to be involved in virulence-related pathways. For some of these TFs, their target specificity and biological functions, such as motility and biofilm formation, were experimentally validated. Of particular interest is the finding that despite conservation of TFs between P. syringae pv. syringae 1448A, P. syringae pv. tomato DC3000, P. syringae pv. syringae B728a, and P. syringae pv. actinidiae C48, some of the conserved TFs show different repertoires of target genes in these four P. syringae strains.

      Thank you for your positive comments.

      Strengths:

      This study presents a systems-level analysis of transcriptional regulatory networks in relation to P. syringae virulence and metabolism, and highlights differences in transcriptional regulatory landscapes of conserved TFs between different P. syringae strains, and develops a user-friendly database for mining the ChIP-seq data generated in this study. These findings and resources will be valuable to researchers in the fields of systems biology, bacteriology, and plant-microbe interactions.

      Thank you for your positive comments.

      Weaknesses:

      No major weaknesses were found, but some of the results may need to be interpreted with caution. ChIP-seq was performed with bacterial strains overexpressing TFs. This may cause artificial binding of TFs to promoters which may not occur when TFs are expressed at physiological levels. Another caution is applied to the interpretation of the biological functions of TFs. The biological roles of the tested TFs are based on in vitro experiments. Thus, functional relevance of the tested TFs during plant infection and/or survival under natural environmental conditions remains to be demonstrated.

      Thank you for your comments, and we agree with the reviewer. To eliminate the artificial binding of TFs, we performed EMSA to verify the analyzed targets. Our EMSA results confirmed the analyzed binding peaks.

      For the verification experiments of the biological functions of TFs, we also performed in vivo motility assay and biofilm production assay (Figures 3b-d). To further detect the biological functions of TFs, we performed plant infection assay of TF PSPPH2193 under natural environmental condition (bean leaves). As shown in Figures S6c and g, both the motility and the virulence of P. syringae in ∆PSPPH2193 strain was significantly reduced compared with WT strain. These results showed that TF PSPPH2193 positively regulated the pathogenicity of P. syringae via modulating the bacterial motility.

      Reviewer #3 (Public Review):

      Summary:

      This study aims to understand gene regulation of the plant bacterial pathogen Pseudomonas syringae. Although the function of some TFs has been characterized in this strain, a global picture of the gene regulatory network remains elusive. The authors conducted a large-scale ChIP-seq analysis, covering 170 out of 301 TFs of this strain, and revealed gene regulatory hierarchy with functional validation of some previously uncharacterized TFs.

      Thank you for your positive comments.

      Strengths:

      - This study provides one of the largest ChIP-seq datasets for a single bacterial strain, covering more than half of its TFs. This impressive resource enabled comprehensive systems-level analysis of the TF hierarchy.

      - This study identified novel gene regulation and function with validations through biochemical and genetic experiments.

      - The authors attempted on broad analyses including comparisons between different bacterial strains, providing further insights into the diversity and conservation of gene regulatory mechanisms.

      Thank you for your positive comments.

      Weaknesses:

      (1) Some conclusions are not backed by quantitative or statistical analyses, and they are sometimes overinterpreted.

      Thank you for your comments. We used hypergeometric test in this analysis. Although only one gene was enriched in some pathways, the adjusted p-value was less than 0.05. We added the details in the revised manuscript.

      (2) Some figures and analyses are not well explained, and I was not able to understand them.

      Thank you for your comments, and we are sorry for the confusion. We defined ‘indirect interaction’ as ‘co-association’ and ‘cooperativity’ as ‘if the common target of two TFs is from a TF’. We added the definition of "indirect interaction" and "cooperativity" in the revised legend.

      For Figure S3a, the low co-association scores and large peak numbers of these top-level TFs indicated that top-level TFs preferred to solely regulate target genes, but not to co-regulate with other top-level TFs. PSPPH4700 was an example to show that top-level TFs with low co-association scores and large peak numbers tend to solely regulate target genes, but not to co-regulate with other top-level TFs. We revised the sentence to ‘For example, the top-level TF PSPPH4700 yielded over 1,700 peaks but cooperated with only 24 top-level TFs with low co-association scores about 0.05 (Supplementary Table 2b).’.

      We analyzed high co-association scores of 125 TFs in three levels and further determined the co-association patterns. To identify the tendency of co-association of all these 125 TFs, the co-association patterns were classified into 4 clusters. Bottom-level TFs tend to co-regulate target genes with other TFs. We revised the sentence in the revised manuscript.

      For Figure 2b, in C1, C2 and C4, many bottom-level TFs performed co-association pattern with other TFs, especially bottom TFs (showed in C4). To explore the regulatory pattern in C3, the peak locations in target genes of MexT were analyzed with those of TFs in C3. Seven top-level TFs (PSPPH1435, PSPPH1758, PSPPH2193, PSPPH2454, PSPPH4638, PSPPH4998 and PSPPH3411), three middle-level TFs (PSPPH1100, PSPPH5132 and PSPPH5144) and four bottom-level TFs (PSPPH0700, PSPPH2300, PSPPH2444 and PSPPH2580) were compared with MexT. MexT showed higher co-association scores (more than 60 scores) with more top-level-TFs. Therefore, we demonstrated that MexT performed closer co-association relationships with top-level TFs. We added the statement in the revised manuscript.

      For Figure 1a, the hierarchical network showed different number of TFs in three levels (54 top-level TFs, 62 middle-level TFs and 147 bottom-level TFs), which indicated that more than half of TFs (bottom-level TFs) tend to be regulated by other TFs and then directly bound to target genes. This finding showed a downward regulatory direction of transcription regulation in P. syringae. We revised the statement in the revised manuscript.

      (3) The Method section lacks depth, especially in data analyses. It is strongly recommended that the authors share their analysis codes so that others can reproduce the analyses.

      Thank you for your comments, and we defined the intergenic region before each TF sequence as the promoter region. As pHM1 plasmid carries its own constitutive promoter (lacZ promoter), we amplified the TF-coding sequence and cloned into site following the promoter. The TF protein expression was activated by the promoter of plasmid. Psph 1448A was used for our main ChIP-seq. We added the details in the revised manuscript.

      For Figure S3, we performed GO analysis on genes that were co-bound by TF pairs. We added the details in the revised manuscript.

      We shared our analysis codes on the website (https://github.com/dengxinb2315/PS-PATRnet-code) in the Data Availability.

      Recommendations for the authors

      Reviewer #1 (Recommendations For The Authors):

      (1) The specific strain of Pseudomonas syringae used in the study outside of the evolutionary analysis should be specified in the abstract and main text.

      Thank you for your suggestion. We revised the statements in abstract and main text to specific strains.

      (2) The language used throughout the manuscript should be revised for clarity, conciseness, and readability.

      Thank you for your suggestion. We have revised the language used throughput the manuscript by a scientific editor who is a native speaker of English.

      (2) Line 688: Replace "80C" with "-80C".

      Thank you for your correction. We revised ‘80℃’ to ‘-80℃’. Please see Line 713.

      (3) Line 172 - 173: The abbreviations TT, MM, BB, TM, TB, and MB need to be expanded in the main text before their use.

      Thank you for your suggestion. We added the abbreviations TT, MM, BB, TM, TB, and MB in the manuscript. Please see Lines 172-174.

      Reviewer #2 (Recommendations For The Authors):

      Major points

      (1) The name of the P. syringae strains used in each experiment/analysis should be explicitly stated (most experiments were carried out with P. syringae strain 1448A). This should also be applied to the introduction where many papers on P. syringae are cited without clear indication of strain names. I think this amendment is essential because target genes and thus biological functions of TFs could be different between P. syringae strains, as shown in the present study.

      Thank you for your suggestion. We revised the P. syringae strains in the citations throughout the manuscript.

      (2) How many TFs were analyzed throughout the study? Most sentences including line 22 in the abstract say 170, but I also found some say 270 (for example, line 106 and line 149). The legend of Figure 1 says 262. More detailed information is required regarding the datasets used for each analysis.

      Thank you for your suggestion. The number of TFs analyzed by ChIP-seq in this research is 170, the number of TFs analyzed by HT-SELEX in our previous research is 100. Hierarchical analysis integrated data from ChIP-seq and HT-SELEX which included 270 TFs. As 8 TFs did not show hierarchical characteristic, the legend of Figure 1 said 262 TFs. We added the data source in the revised manuscript. Please see Lines 104, 147, 160 and 1082.

      (3) Figure 1b: Please define "indirect interaction" and "cooperativity" in the legend as well as in the text. I only found the definition of "direct interaction".

      Sorry for the missing information. We defined ‘indirect interaction’ and ‘cooperativity’ as ‘co-association’ and ‘if the common target of two TFs is from a TF’, respectively. We added the definition of "indirect interaction" and "cooperativity" in the revised legend. Please see Lines 174-176, 1084-1086.

      (4) I found it very interesting that conserved TFs show different repertoires of target genes in different P. syringae strains. This suggests the rewiring of transcriptional regulatory networks in P. syringae strains, but the underlying mechanism is not explored in the current manuscript. It can be easily tested whether these conserved TFs bind to similar or different motifs by motif enrichment analysis. If they bind to similar motifs, it is possible that the promoter sequences of their target genes have diversified. Addressing or at least discussing these points would provide molecular insights into the diversification of the transcriptional regulatory networks in P. syringae. Similarly, functional enrichment analysis of target genes can be used to test whether the conserved TFs regulate different biological processes.

      Thank you for your suggestion. We added the motif analysis and functional enrichment analysis of target genes of TFs (PSPPH3122 and PSPPH4127) in different P. syringae strains. We found two different motifs (AGACN4GATCAA and CGGACGN3GATCA) in 1448A and DC3000 strains, respectively. We also performed the GO analysis and found the specific functions of PSPPH3122 in Psph 1448A compared with Pst DC3000 and Pss B728a strains, including recombinase activity and DNA recombination. For PSPPH4127, we found four different motifs in four P. syringae strains. GO analysis showed its relationship with recombinase activity in Psph 1448A strain, and RNA binding, structural constituent of ribosome, translation and ribosome in Pss B728a strain. These results indicated the highly functional diversity of TFs in P. syringae. We added these points in the Results part, and Figure S9-S10 in the revised manuscript. Please see Lines 497-509.

      (5) Related to point 4, it would be quite useful if a list of orthologous genes of 1448A TFs in the other tested P. syringae strains were provided. Such information may also enhance the utility of the database developed in this study.

      Thank you for your suggestion. We added the list of orthologous genes of 301 Psph 1448A TFs in the other tested P. syringae strains in the Supplementary Table 5. Please see Lines 467 and Supplementary Table 5.

      (6) Lines 243-246: It is unclear how these functional enrichment analyses were performed. Did you use target genes regulated by individual TFs or those coregulated by pairs of TFs? Please add more information for the sake of readers.

      Thank you for your suggestion. We performed the functional enrichment analyses by hypergeometric test (BH-adjusted p < 0.05) via using target genes regulated by individual TFs. We added the details in the Results part. Please see Lines 248-252, 270, 1194-1195, 1199-1200 and 1205-1206.

      Minor points

      (1) Lines 167-168: I may not understand correctly, but you might want to say "downward-pointing edges" instead of "upward-pointing edges".

      Thank you for correction. We revised the ‘upward-pointing edges’ to ‘downward-pointing edges’. Please see Line 166.

      (2) Line 174: "physical interactions" should be amended to "direct interactions".

      Thank you for correction. We revised the ‘physical interactions’ to ‘direct interactions’. Please see Line 177.

      (3) Line 224: Could you please explain why bacterial growth in plant tissues is considered an example of "multi-stability"?

      Thank you for your suggestion. We are sorry for the incorrect statement. We showed ‘plant intercellular spaces’ as ‘multi-stability’. We revised the sentence to ‘These auto-regulators are important and always act as repressors in scenarios of multi-stability, such as plant intercellular spaces’. Please see Lines 224-226.

      (4) Line 254-257: Here, the definition of "tether binding" is introduced, but it is not very clear to me. In my understanding, tethered binding is an indirect binding of a TF to a target gene through protein-protein interaction with other TF that directly binds to the promoter of the target gene.

      Thank you for your suggestion, and we agree with you. We referred to the paper published in 2012 (Wang et al., 2012) and revised the statement of ‘tether binding’ to ‘This finding suggested that these TFs indirectly regulated target genes through protein-protein interaction with other TFs that directly binds to the promoters of target genes, a phenomenon defined as tethered binding’. Please see Lines 259-262.

      (5) Lines 341-343: Figure 3b shows qRT-PCR of hopAE1, not hrpR.

      Thank you for your correction. We revised ‘hrpR’ to ‘hopAE1’. Please see Line 349.

      (6) Lines 500 and Figure 6b: It is hard to see edges from module 12 to others. So, it would be better to provide numeric information (number of TFs and target genes) in the text.

      Thank you for your suggestion. Module 12 includes 22 TFs and 318 target genes. We added the statement of numeric information about Module 12 in the revised manuscript. Please see Lines 536-537.

      (7) Line 519: Figure S4b is not the EMSA data for PSPPH3798. Should it be Figure S4e?

      Thank you for your correction. We revised to ‘Figure S4e’. Please see Line 545.

      (8) Line 522: Figure S6b is not relevant to the statement here.

      Thank you for your correction. We deleted the ‘Figure S6b’ here. Please see Line 547.

      (9) Line 593: prokaryotic transcriptional regulatory networks -> eukaryotic transcriptional regulatory networks?

      Thank you for your correction. We revised ‘prokaryotic transcriptional regulatory networks’ to ‘eukaryotic transcriptional regulatory networks’. Please see Line 618.

      (10) Figure S3 requires images of higher resolution. Especially, values for the color codes are not readable or very hard to see.

      Thank you for your suggestion. To make the images clearer, we enlarged the images, change the color codes, and divided it into three figures. Please see the revised Figures S3-S5 and corresponding Figure legends at Lines 1191-1206.

      Reviewer #3 (Recommendations For The Authors):<br /> (1) Some conclusions are not backed by quantitative or statistical analyses, and they are sometimes overinterpreted.

      L221: "Taken together, the simplest and most effective submodule M1 and the coregulatory submodule M13 played crucial roles in the transcriptional regulation of TFs in P. syringae."

      The authors did not provide any evidence supporting the functional importance of any of these submodules. M13 is most enriched within the locked loop, but its size is much smaller than simple loops. What evidence supports the importance of this particular submodule?

      Thank you for your suggestion. In eukaryote (Saccharomyces cerevisiae) and prokaryote (Escherichia coli) which have the best characterized transcriptional regulation networks, the feed-forward loop (called M13 in this article) appear numerous times in the networks and perform different biological functions. M1 appeared most frequently by an order of magnitude than other modules. We revised the sentence to ‘Taken together, the most numerous but simplest submodule M1 played a crucial role in the transcriptional regulation of TFs in P. syringae.’ Please see Lines 222-224.

      L223: "...we found 92 auto-regulators...These auto-regulators are important and always act as repressors in scenarios of multi-stability, such as in plant intercellular spaces where bacteria grow (Figure 1d)(Alon, 2007). These regulators are regarded as bistable switches that further influence the expression of downstream genes."<br /> Are these claims supported by any evidence?

      Thank you for your suggestion. We referred to the following articles:

      (1) Alon. Nature Reviews Genetics. 2007(Alon, 2007).

      That transcription factors repress the transcription of their target genes was considered as negative regulation. These negative autoregulators account for half of the repressors in E. coli and occur in many eukaryotes. The repressors controlled the concentration of the target production through suppressing its expression, which accelerated back to the steady state of cells.

      (2) Becskei. et al. Nature. 2000; Rosenfeld et al. Journal of Molecular Biology. 2002 (Becskei & Serrano, 2000; Rosenfeld, Elowitz, & Alon, 2002).

      Fluorescent assay confirmed that the negative autoregulatory module (negative autoregulator TetR) spent less time to the log phase than unregulated group, which reduced cell-to-cell fluctuations in the steady-state level of the transcription factor. Some negative autoregulators were showed here, such as LexA, CysB and SrlA-D.

      In our research, we also identified many autoregulators including CysB and LexA2 (annotated as LexA repressor). We revised the sentence to ‘In addition, we found 92 auto-regulators in our hierarchy network. These auto-regulators are important and always act as repressors in scenarios of multi-stability, such as plant intercellular spaces (Figure 1d) (Alon, 2007). For example, LexA and CysB as negative autoregulators were indicated to reduce cell-to-cell fluctuations in the steady-state level of the transcription factor (Becskei & Serrano, 2000; Rosenfeld et al. 2002).’. Please see Lines 224-229.

      L265: "This finding indicated that the bottom-level TFs, which were more easily regulated, tended to cooperate with downstream genes and other intra-level TFs."<br /> Could the authors provide more explanation to reach this conclusion from the data? Analyzing the number of highly co-accessing TFs does not sufficiently support this conclusion. The clustering of TFs (C1-C4) is incomplete, and each TF level (Top/Middle/Bottom) contains different numbers of TFs. Since the authors calculated all-by-all co-association scores for these 125 TFs, they can group these scores into 6 possible combinations (TT, TM, TB, MM, MB, BB) and show the distribution of co-association scores.

      Thank you for your suggestion. We indicated that the bottom-level TFs preferred to regulate the target genes through the cooperation with other TFs. To further support the claim, we analyzed the proportion of the bottom TF interaction in all the TF pairs interactions and direct interaction based on results in Figure 1B. The interactions of bottom TFs were 43% and 49%, respectively. However, the interactions of top TFs and middle TFs were only 20% and 28%, respectively. We revised the statement ‘Based on the analysis in Figure 1B, we found that the proportions of bottom-level TF interaction in all the TF pair interactions and direct interaction were 43% and 49%. These results indicated that the bottom-level TFs tended to regulate downstream genes through cooperating with other level TFs.’ in the revised manuscript. Please see Lines 269-272.

      As not every TF performed co-association with other TFs, we only collected 125 TFs with co-association scores. For the numbers of TF in each level, we divided TFs into three levels according to hierarchy height. Hierarchy height from -1 to -0.3 represented bottom level; hierarchy height from -0.3 to 0.3 represented middle level ; hierarchy height from 0.3 to 1 represents top level. Each level was equally divided by height scores. We suggested that different numbers of TFs in three levels indicated the characteristic of transcriptional regulation in P. syringae.

      Thank you for your suggestion. As the co-association patterns were determined by co-association scores of the same TFs, we first grouped the co-association scores into 3 possible TF pairs (TT, MM, and BB, in Figures S3a, S4a and S5a). Our results indicated that higher co-association scores preferred to occur in bottom-level TFs. We revised the statement in the revised manuscript. Please see Lines 244-252.

      (2) Some figures and analyses are not well explained, and I was not able to understand them.

      Figure 1b: The terms "direct," "indirect," and "cooperativity" require further clarification as their definitions in the text (L169-183) are unclear to me. This ambiguity hampers the evaluation of the authors' discussion regarding TF-TF interactions (L561-584), an important theme of this study. The figure includes concepts discussed in later sections (e.g., cooperativity), making it difficult to understand. A diagram explaining these concepts would be highly helpful for readers to understand.

      Sorry for the missing information. We defined ‘indirect interaction’ as ‘co-association’, ‘cooperativity’ as ‘if the common target of two TFs is from a TF’. We added the definition of "indirect interaction" and "cooperativity" in the revised manuscript and legend. Please see Lines 174-176 and 1085-1087.

      L253: "Notably, we found that TFs at the top level, without cooperating TFs, exhibited a large number of binding peaks (Figure S3a)."

      I could not understand this sentence. Did the authors mean that top-level TFs with a large number of peaks showed a low level of co-association? If so, does this data suggest that these TFs do not tend to cooperate with other TFs? I was confused by the discussion in L253-L261.

      Thank you for your comment, and we agree with you. The low co-association scores and large peak numbers of these top-level TFs indicated that top-level TFs preferred to solely regulate target genes, but not to co-regulate with other top-level TFs.

      Thank you for your comment. From L253-256, PSPPH4700 was an example to show that top-level TFs with low co-association scores and large peak numbers tend to solely regulate target genes, but not to co-regulate with other top-level TFs. We revised the sentence to ‘For example, the top-level TF PSPPH4700 yielded over 1,700 peaks, but cooperated with only 24 top-level TFs with low co-association scores about 0.05 (Supplementary Table 2b).’.

      From L257-261, we analyzed high co-association scores of 125 TFs in three levels and further determined the co-association patterns. To identify the tendency of co-association of all these 125 TFs, the co-association patterns were classified into 4 clusters. Bottom-level TFs tend to co-regulate target genes with other TFs. We revised the sentence. Please see Lines 262-264, 265-266 and 269-272.

      L287: "The analysis of the peak locations of MexT demonstrated that MexT showed closer co-association relationships with top-level TFs (Figure 2b)."

      I could reach this conclusion by seeing Figure 2b. Additional explanation and/or data visualization would be appreciated.

      Thank you for your suggestion. In C1, C2 and C4, many bottom-level TFs performed co-association pattern with other TFs, especially bottom TFs (showed in C4). To explore the regulatory pattern in C3, the peak locations in target genes of MexT were analyzed with those of TFs in C3. Seven top-level TFs (PSPPH1435, PSPPH1758, PSPPH2193, PSPPH2454, PSPPH4638, PSPPH4998 and PSPPH3411), three middle-level TFs (PSPPH1100, PSPPH5132 and PSPPH5144) and four bottom-level TFs (PSPPH0700, PSPPH2300, PSPPH2444 and PSPPH2580) were compared with MexT. MexT showed higher co-association scores (more than 60 scores) with more top-level-TFs. Therefore, we demonstrated that MexT performed closer co-association relationships with top-level TFs. We added the statement in the revised manuscript. Please see Lines 291-296.

      Figure 6cd: What kind of enrichment analysis did the authors perform? Was any statistical test used? The figure only shows the number of genes, and sometimes the number is only 1 for a functional category. Can it be considered as significant enrichment?

      Thank you for your comment. We used hypergeometric test in this analysis. Although only one gene was enriched in some pathways, the adjusted p-value was less than 0.05. We added the details in the revised manuscript. Please see Lines 533-534.

      L169: "The hierarchical network revealed a downward information flow, suggesting the prioritization of collaboration between different hierarchy levels."<br /> Can the authors please explain the logic behind this statement more in detail?

      Thank you for your comment. The hierarchical network showed different number of TFs in three levels (54 top-level TFs, 62 middle-level TFs and 147 bottom-level TFs), which indicated that more than half of TFs (bottom-level TFs) tend to be regulated by other TFs and then directly bound to target genes. This finding showed a downward regulatory direction of transcription regulation in P. syringae. We revised the statement in the revised manuscript. Please see Lines 167-170.

      (3) The Method section lacks depth, especially on data analyses.

      How did the authors define promoter regions of each gene? How were operons treated in their analyses? Was P. syringae 1448A used for their main ChIP-seq?

      Thank you for your comment. We defined the intergenic region before each TF sequence as the promoter region.

      As pHM1 plasmid carries its own constitutive promoter (lacZ promoter), we amplified the TF-coding sequence and cloned into the site following the promoter. The TF protein expression was activated by the promoter of plasmid.

      P. syringae 1448A was used for our main ChIP-seq. We added the details in the revised manuscript. Please see Lines 705 and 727-730.

      Figure S3: I am not sure how the GO analyses were done. For example, in the case of the top-level TF PSPPH4700, did the authors perform GO analysis on genes that are co-bound by PSPPH4700 and any other top-level TFs?

      Thank you for your comment and we agree with you. We performed GO analysis on genes that were co-bound by TF pairs in the same level. We added the details in the revised manuscript. Please see Lines 248-252.

      The analysis presented in Figure 6a needs more explanation of the methodology employed by the authors.

      Thank you for your comment. We added more details for the analysis in Figure 6a. Please see Lines 514-522.

      It is strongly recommended that the authors share their analysis codes so that others can reproduce the analyses.

      Thank you for your comment. We shared our analysis codes on the website (https://github.com/dengxinb2315/PS-PATRnet-code) in the Data Availability. Please see Lines 800-801.

      (4) Other:

      Figure 3: I suggest putting additional panel labels to facilitate the interpretation of the figure.

      Thank you for your suggestion. We added detailed labels in the revised Figures 3 and 4. Please see in the revised Figures 3 and 4.

      I spotted several potential errors:

      L106: 170 TFs?

      Thank you for your comment, and we are sorry for the missing details. For the hierarchical network, we integrated the DNA-binding data of 170 TFs in this study and 100 TFs in our previous SELEX research. We added the details in the revised manuscript. Please see Lines 104, 147 and 159-160.

      L592: P. syringae not E. coli?

      Thank you for your comment. Here we discussed the hierarchical characteristics in E. coli. We revised the statement in the revised manuscript. Please see Line 618.

      L593: eukaryotic not prokaryotic?

      Thank you for your correction. Here we discussed the feedforward loops in our study. We revised the statement in the revised manuscript. Please see Line 618.

      References

      Alon, U. (2007). Network motifs: theory and experimental approaches. Nature Reviews Genetics, 8(6), 450-461.

      Becskei, A., & Serrano, L. (2000). Engineering stability in gene networks by autoregulation. Nature, 405(6786), 590-593.

      Rosenfeld, N., Elowitz, M. B., & Alon, U. (2002). Negative autoregulation speeds the response times of transcription networks. Journal of molecular biology, 323(5), 785-793.

      Wang, J., Zhuang, J., Iyer, S., Lin, X., Whitfield, T. W., Greven, M. C., . . . Cheng, Y. (2012). Sequence features and chromatin structure around the genomic regions bound by 119 human transcription factors. Genome research, 22(9), 1798-1812.

    1. Author response:

      The following is the authors’ response to the original reviews.

      Reviewer #3 (Public Review):

      The iron manipulation experiments are in the whole animal and it is likely that this affects general feeding behaviour, which is known to affect NB exit from quiescence and proliferative capacity. The loss of ferritin in the gut and iron chelators enhancing the NB phenotype are used as evidence that glia provide iron to NB to support their number and proliferation. Since the loss of NB is a phenotype that could result from many possible underlying causes (including low nutrition), this specific conclusion is one of many possibilities.

      We have investigated the feeding behavior of fly by Brilliant Blue (sigma, 861146)[1]. Our result showed that the amount of dye in the fly body were similar between control group and BPS group, suggesting that BPS almost did not affect the feeding behavior (Figure 3—figure supplement 1A).

      Recommendations for the authors:

      Reviewer #1 (Recommendations For The Authors):

      There was a gap between the Pros nuclear localization and downstream targets of ferritin, particularly NADH dehydrogenase and biosynthesis. Could overexpression of Ndi1 restore Pros localization in NBs?

      Ferritin defect downregulates iron level, which leads to cell cycle arrest of NBs via ATP shortage. And cell cycle arrest of NBs probably results in NB differentiation[2, 3]. We have added the experiment in Figure 5—figure supplement 2. This result showed that overexpression of Ndi1 could significantly restore Pros localization in NBs.

      The abstract requires revision to cover the major findings of the manuscript, particularly the second half.

      We revised the abstract to add more major findings of the manuscript in the second half as follows:

      “Abstract

      Stem cell niche is critical for regulating the behavior of stem cells. Drosophila neural stem cells (Neuroblasts, NBs) are encased by glial niche cells closely, but it still remains unclear whether glial niche cells can regulate the self-renewal and differentiation of NBs. Here we show that ferritin produced by glia, cooperates with Zip13 to transport iron into NBs for the energy production, which is essential to the self-renewal and proliferation of NBs. The knockdown of glial ferritin encoding genes causes energy shortage in NBs via downregulating aconitase activity and NAD+ level, which leads to the low proliferation and premature differentiation of NBs mediated by Prospero entering nuclei. More importantly, ferritin is a potential target for tumor suppression. In addition, the level of glial ferritin production is affected by the status of NBs, establishing a bicellular iron homeostasis. In this study, we demonstrate that glial cells are indispensable to maintain the self-renewal of NBs, unveiling a novel role of the NB glial niche during brain development.”

      In Figure 2B Mira appeared to be nuclear in NBs, which is inconsistent with its normal localization. Was it Dpn by mistake?

      In Figure 2B, we confirmed that it is Mira. Moreover, we also provide a magnified picture in Figure 2B’, showing that the Mira mainly localizes to the cortex or in the cytoplasm as previously reported.

      Figure 2C, Fer1HCH-GFP/mCherry localization was non-uniform in the NBs revealing 1-2 regions devoid of protein localization potentially corresponding to the nucleus and Mira crescent enrichment. It is important to co-label the nucleus in these cells and discuss the intracellular localization pattern of Ferritin.

      We have revised the picture with nuclear marker DAPI in Figure 2C. The result showed that Fer1HCH-GFP/Fer2LCH-mCherry was not co-localized with DAPI, which indicated that Drosophila ferritin predominantly distributes in the cytosol[4, 5]. As for the concern mentioned by this reviewer, GFP/mCherry signal in NBs was from glial overexpressed ferritin, which probably resulted in non-uniform signal.

      In Figure 3-figure supplement 3F, glial cells in Fer1HCH RNAi appeared to be smaller in size. This should be quantified. Given the significance of ferritin in cortex glial cells, examining the morphology of cortex glial cells is essential.

      In Figure 3—figure supplement 3F, we did not label single glial cells so it was difficult to determine whether the size was changed. However, it seems that the chamber formed by the cellular processes of glial cells becomes smaller in Fer1HCH RNAi. The glial chamber will undergo remodeling during neurogenesis, which responses to NB signal to enclose the NB and its progeny[6]. Thus, the size of glial chamber is regulated by NB lineage size. In our study, ferritin defect leads to the low proliferation, inducing the smaller lineage of each NB, which likely makes the chamber smaller.

      Since the authors showed that the reduced NB number was not due to apoptosis, a time-course experiment for glial ferritin KD is recommended to identify the earliest stage when the phenotype in NB number /proliferation manifests during larval brain development.

      We observed brains at different larval stages upon glial ferritin KD. The result showed that NB proliferation decreased significantly, but NB number declined slightly at the second-instar larval stage (Figure 5—figure supplement 1E and F), suggesting that brain defect of glial ferritin KD manifests at the second-instar larval stage.

      Transcriptome analysis on ferritin glial KD identified genes in mitochondrial functions, while the in vivo EM data suggested no defects in mitochondria morphology. A short discussion on the inconsistency is required.

      For the observation of mitochondria morphology via the in vivo EM data, we focused on visible cristae in mitochondria, which was used to determine whether the ferroptosis happens[7]. It is possible that other details of mitochondria morphology were changed, but we did not focus on that. To describe this result more accurately, we replaced “However, our observation revealed no discernible defects in the mitochondria of NBs after glial ferritin knockdown” with the “However, our result showed that the mitochondrial double membrane and cristae were clearly visible whether in the control group or glial ferritin knockdown group, which suggested that ferroptosis was not the main cause of NB loss upon glial ferritin knockdown” in line 207-209.

      The statement “we found no obvious defects of brain at the first-instar larval stage (0-4 hours after larval hatching) when knocking down glial ferritin (Figure 5-figure supplement 1C).” lacks quantification of NB number and proliferation, making it challenging to conclude.

      We have provided the quantification of NB number and proliferation rate of the first-instar larval stage in Figure 5—figure supplement 1C and D. The data showed that there is no significant change in NB number and proliferation rate when knocking down ferritin, suggesting that no brain defect manifests at the first-instar larval stage.

      A wild-type control is necessary for Figure 6A-C as a reference for normal brain sizes.

      We have added Insc>mCherry RNAi as a reference in Figure 6A-D, which showed that the brain size of tumor model is larger than normal brain. Moreover, we removed brat RNAi data from Figure 6A-D to Figure 6—figure supplement 1A-D for the better layout.

      In Figures 6B, D, “Tumor size” should be corrected to “Larval brain volume”.

      Here, we measured the brain area to assess the severity of the tumor via ImageJ instead of 3D data of the brain volume. So we think it would be more appropriate to use the “Larval brain size” than “Larval brain volume” here. Thus, we have corrected “Tumor size” to “Larval brain size” in Figure 6B and D to Figure 6—figure supplement 1B and D.

      Considering that asymmetric division defects in NBs may lead to premature differentiation, it is advisable to explore the potential involvement of ferritin in asymmetric division.

      aPKC is a classic marker to determine the asymmetric division defect of NB. We performed the aPKC staining and found it displayed a crescent at the apical cortex based on the daughter cell position whether in control or glial ferritin knockdown (Figure 5—figure supplement 3A). This result indicated that there was no obvious asymmetric defect after glial ferritin knockdown.

      In the statement "Secondly, we examined the apoptosis in glial cells via Caspase-3 or TUNEL staining, and found the apoptotic signal remained unchanged after glial ferritin knockdown (Figure 3-figure supplement 3A-D).", replace "the apoptosis in glial cells" with "the apoptosis in larval brain cells".

      We have replaced "the apoptosis in glial cells" with "the apoptosis in larval brain cells" in line 216.

      Include a discussion on the involvement of ferritin in mammalian brain development and address the limitations associated with considering ferritin as a potential target for tumor suppression.

      We have added the discussion about ferritin in mammalian brain development in line 428-430 and limitation of ferritin for suppressing tumor in line 441-444.

      Indicate Insc-GAL4 as BDSC#8751, even if obtained from another source. Additionally, provide information on the extensively used DeRed fly stock used in this study within the methods section.

      We provided the stock information of Insc-GAL4 and DsRed in line 673-674.

      Reviewer #2 (Recommendations For The Authors):

      Major points:

      The number of NBs differs a lot between experiments. For example, in Fig 1B and 1K controls present less than 100 NBs whereas in Figure 1 Supplementary 2B it can be seen that controls have more than 150. Then, depending on which control you compare the number of NBs in flies silencing Fer1HCH or Fer2LCH, the results might change. The authors should explain this.

      Figure 1 Supplementary 2B (Figure 1 Supplementary 3B in the revised version) shows NB number in VNC region while Fig 1B and 1K show NB number in CB region. At first, we described the general phenotype showing the NB number in CB and VNC respectively (Fig 1 and Fig 1-Supplementary 1 and 3 in the revised version). And the NB number is consistent in each region. After then, we focused on NB number in CB for the convenience.

      This reviewer encourages the authors to use better Gal4 lines to describe the expression patterns of ferritins and Zip13 in the developing brain. On the one hand, the authors do not state which lines they are using (including supplementary table). On the other hand, new Trojan GAL4 (or at least InSite GAL4) lines are a much better tool than classic enhancer trap lines. The authors should perform this experiment.

      All stock source and number were documented in Table 2. Ferritin GAL4 and Zip13 GAL4 in this study are InSite GAL4. In addition, we also used another Fer2LCH enhancer trapped GAL4 to verify our result (DGRC104255) and provided the result in Figure 2—figure supplement 1. Our data showed that DsRed driven by Fer2LCH-GAL4 was co-localized with the glia nuclear protein Repo, instead of the NB nuclear protein Dpn, which was consistent with the result of Fer1HCH/Fer2LCH GAL4. In addition, we will try to obtain the Trojan GAL4 (Fer1HCH/Fer2LCH GAL4 and Zip13 GAL4) and validate this result in the future.

      The authors exclude very rapidly the possibility of ferroptosis based only on some mitochondrial morphological features without analysing the other hallmarks of this iron-driven cell death. The authors should at least measure Lipid Peroxidation levels in their experimental scenario either by a kit to quantify by-products of lipid peroxidation such as Malonaldehide (MDA) or using an anti 4-HNE antibody.

      We combined multiple experiments to exclude the possibility of ferroptosis. Firstly, ferroptosis can be terminated by iron chelator. And we fed fly with iron chelator upon glial ferritin knockdown, but NB number and proliferation were not restored, which suggested that ferroptosis probably was not the cause of NB loss induced by glial ferritin knockdown (Figure 3B and C). Secondly, Zip13 transports iron into the secretary pathway and further out of the cells in Drosophila gut[8]. Our data showed that knocking down iron transporter Zip13 in glia resulted in the decline of NB number and proliferation, which was consistent with the phenotype upon glial ferritin knockdown (Figure 3E-G). More importantly, the knockdown of Zip13 and ferritin simultaneously aggravated the phenotype in NB number and proliferation (Figure 3E-G). These results suggested that the phenotype was induced by iron deficiency in NB, which excluded the possibility of iron overload or ferroptosis to be the main cause of NB loss upon glial ferritin knockdown. Finally, we observed mitochondrial morphology on double membrane and the cristae that are critical hallmarks of ferroptosis, but found no significant damage (Figure 3-figure supplement 2E and F).

      In addition, we have added the 4-HNE determination in Figure 3—figure supplement 2G and H. This result showed that 4-HNE level did not change significantly, suggesting that lipid peroxidation was stable, which supported to exclude the possibility that the ferroptosis led to the NB loss upon glial ferritin knockdown.

      All of the above results together indicate that ferroptosis is not the cause of NB loss after ferritin knockdown.

      A major flaw of the manuscript is related to the chapter Glial ferritin defects result in impaired Fe-S cluster activity and ATP production and the results displayed in Figure 4. The authors talk about the importance of FeS clusters for energy production in the mitochondria. Surprisingly, the authors do not analyse the genes involved in this process such as but they present the interaction with the cytosolic FeS machinery that has a role in some extramitochondrial proteins but no role in the synthesis of FeS clusters incorporated in the enzymes of the TCA cycle and the respiratory chain. The authors should repeat the experiments incorporating the genes NSF1 (CG12264), ISCU(CG9836), ISD11 (CG3717), and fh (CG8971) or remove (or at least rewrite) this entire section.

      Thanks for this constructive advice and we have revised this in Figure 4B and C. We repeated the experiment with blocking mitochondrial Fe-S cluster biosynthesis by knocking down Nfs1 (CG12264), ISCU(CG9836), ISD11 (CG3717), and fh (CG8971), respectively. Nfs1 knockdown in NB led to a low proliferation, which was consistent with CIA knockdown. However, we did not observe the obvious brain defect in ISCU(CG9836), ISD11 (CG3717), and fh (CG8971) knockdown in NB. Our interpretation of these results is that Nfs1 probably is a necessary core component in Fe-S cluster assembly while others are dispensable[9].

      The presence and aim of the mouse model Is unclear to this reviewer. On the one hand, It Is not used to corroborate the fly findings regarding iron needs from neuroblasts. On the other hand, and without further explanation, authors migrate from a fly tumor model based on modifying all neuroblasts to a mammalian model based exclusively on a glioma. The authors should clarify those issues.

      Although iron transporter probably is different in Drosophila and mammal, iron function is conserved as an essential nutrient for cell growth and proliferation from Drosophila to mammal. The data of fly suggested that iron is critical for brain tumor growth and thus we verified this in mammalian model. Glioma is the most common form of central nervous system neoplasm that originates from neuroglial stem or progenitor cells[10]. Therefore, we validated the effect of iron chelator DFP on glioma in mice and found that DFP could suppress the glioma growth and further prolong the survival of tumor-bearing mice.

      Minor points

      Although referred to adult flies, the authors did not include either in the introduction or in the discussion existing literature about expression of ferritins in glia or alterations of iron metabolism in fly glia cells (PMID: 21440626 and 25841783, respectively) or usage of the iron chelator DFP in drosophila (PMID: 23542074). The author should check these manuscripts and consider the possibility of incorporating them into their manuscript.

      Thanks for your remind. We have incorporated all recommended papers into our manuscript line 65-67 and 168.

      The number of experiments in each figure is missing.

      All experiments were repeated at least three times. And we revised this in Quantifications and Statistical Analysis of Materials and methods.

      If graphs are expressed as mean +/- sem, it is difficult to understand the significance stated by the authors in Figure 2E.

      We apologize for this mistake and have revised this in Quantifications and Statistical Analysis. All statistical results were presented as means ± SD.

      When authors measure aconitase activity, are they measuring all (cytosolic and mitochondrial) or only one of them? This is important to better understand the experiments done by the authors to describe any mitochondrial contribution (see above in major points).

      In this experiment, we were measuring the total aconitase activity. We also tried to determine mitochondrial aconitase but it failed, which was possibly ascribed to low biomass of tissue sample.

      In this line, why do controls in aconitase and atp lack an error bar? Are the statistical tests applied the correct ones? It is not the same to have paired or unpaired observations.

      It is the normalization. We repeated these experiments at least three times in different weeks respectively, because the whole process was time-consuming and energy-consuming including the collection of brains, protein determination and ATP or aconitase determination. And the efficiency of aconitase or ATP kit changed with time. We cannot control the experiment condition identically in different batches. Therefore, we performed normalization every time to present the more accurate result. The control group was normalized as 1 via dividing into itself and other groups were divided by the control. This normalized process was repeated three times. Therefore, there is no error bar in the control group. We think it is appropriate to apply ANOVA with a Bonferroni test in the three groups.

      In some cases, further rescue experiments would be appreciated. For example, expression of Ndi restores control NAD+ levels or number of NBs, it would be interesting to know if this is accompanied by restoring mitochondrial integrity and its ability to produce ATP.

      We have determined ATP production after overexpressing Ndi1 and provided this result in Figure 4—figure supplement 1B. The data showed that expression of Ndi1 could restore ATP production upon glial Fer2LCH knockdown, which was consistent with our conclusion.

      Lines 293-299 on page 7 are difficult to understand.

      According to our above results, the decrease of NB number and proliferation upon glial ferritin knockdown (KD) was caused by energy deficiency. As shown in the schematic diagram (Author response image 1), “T” represented the total energy which was used for NB maintenance and proliferation. “N” indicated the energy for maintaining NB number. “P” indicated the energy for NB proliferation. “T” is equal to “N” plus “P”. When ferritin was knocked down in glia, “T”, “N” and “P” declined in “Ferritin KD” compared to “wildtype (WT)”. Knockdown of pros can prevent the differentiation of NB, but it cannot supply the energy for NB, which probably results in the rescue of NB number but not proliferation. Specifically, NB number increased significantly in “Ferritin KD Pros KD” compared to “Ferritin KD”, which resulted in consuming more energy for NB maintenance in “Ferritin KD Pros KD”. As shown in the schematic diagram, “T” was not changed between “Ferritin KD Pros KD” and “Ferritin KD”, whereas ”N” was increased in “Ferritin KD Pros KD” compared to “Ferritin KD”. Thus, “P” was decreased, which suggested that less energy was remained for proliferation, leading to the failure of rescue in NB proliferation. It seemed that the level of proliferation in “Ferritin KD Pros KD” was even lower than “Ferritin KD”.

      Author response image 1.

      The schematic diagram of relationship between energy and NB function in different groups. “T” represents total energy for NB maintenance and proliferation. “N” represents the energy for NB maintenance. “P” represents the energy for NB proliferation. T=N+P 

      Line 601 should indicate that Tables 2 and 3 are part of the supplementary material.

      We have revised this in line 678.

      Figure 4-supplement 1. Only validation of 2 genes from a RNAseq seems too little.

      We dissected hundreds of brains for sorting NBs because of low biomass of fly brain. This is a difficult and energy-consuming work. Most NBs were used for RNA-seq, so we can only use a small amount of sample left for validation which is not enough for more genes.

      Figure 6E, the authors indicate that 10 mg/ml DFP injection could significantly prolong the survival time. Which increase in % is produced by DFP?

      We have provided the bar graph in Author response image 2. The increase is about 16.67% by DFP injection.

      Author response image 2.

      The bar graph of survival time of mice treated with DFP.

      (The unpaired two-sided Student’s t test was employed to assess statistical significance. Statistical results were presented as means ± SD. n=7,6; *: p<0.05)

      Reviewer #3 (Recommendations For The Authors):

      As I read the initial results that built the story (glia make ferritin>release it> NBs take them up>use it for TCA and ETC) I kept thinking about what it meant for NBs to be 'lost'. This led me to consider alternate possibilities that the results might point to, other than the ones the authors were suggesting. It was only in Figure 5 that the authors ruled out some of those possibilities. I would suggest that they first illustrate how NBs are lost upon glial ferritin loss of function before they delve into the mechanism. This would also be a place to similarly address that glial numbers and general morphology are unchanged upon ferritin loss.

      This recommendation provides a valuable guideline to build this story especially for researchers who are interested in neural stem cell studies. Actually, we tried this logic to present our study but found that there are several gaps in the middle of the manuscript, such as the relationship between glial ferritin and Pros localization in NB, so that the whole story cannot be fluently presented. Therefore, we decided to present this study in the current way.

      More details of the screen would be useful to know. How many lines did they screen, what was the assay? This is not mentioned anywhere in the text.

      We have added this in Screen of Materials and methods. We screened about 200 lines which are components of classical signaling pathways, highly expressed genes in glial cells or secretory protein encoding genes. UAS-RNAi lines were crossed with repo-Gal4, and then third-instar larvae of F1 were dissected. We got the brains from F1 larvae and performed immunostaining with Dpn and PH3. Finally, we observed the brain in Confocal Microscope.

      Many graphs seem to be repeated in the main figures and the supplementary data. This is unnecessary, or at least should be mentioned.

      We appreciate your kind reminder. However, we carefully went through all the figures and did not find the repeated graphs, though some of them look similar.

      The authors mention that they tested which glial subtypes ferritin is needed in, but don't show the data. Could they please show the data? Same with the other iron transport/storage/regulation. Also, in both this and later sections, the authors could mention which Gal4 was used to label what cell types. The assumption is that the reader will know this information.

      We have added the result of ferritin knockdown in glial subpopulations in Figure 1—figure supplement 2. However, considering that the quantity of iron-related genes, we did not take the picture, but we recorded this in Table 3.

      For all their images showing colocalisation, magnified, single-colour images shown in grayscale will be useful. For example, without the magnification, it is not possible to see the NB expression of the protein trap line in Figure 2B. A magnified crop of a few NBs (not a single one like in 2C) would be more useful.

      We have provided Figure 2A’, B’, D’ and Figure 3D’ as suggested.

      There are a lot of very specific assays used to detect ROS, NAD, aconitase activity, among others. It would be nice to have a brief but clear description of how they work in the main text. I found myself having to refer to other sources to understand them. (I believe SoNAR should be attributed to Zhao et al 206 and not Bonnay et al 2020.)

      We have added a brief description about ROS, aconitase activity, NAD in line 198-199, 229-231, and 269 as suggested.

      I did not understand the normalisation done with respect to SoNAR. Is this standard practice? Is the assumption that 'overall protein levels will be higher in slowly proliferating NBs' reasonable? This is why they state the need to normalise.

      The SoNAR normalization is not a standard practice. However, we think that our normalization of SoNar is reasonable. According to our results, the expression level of Dpn and Mira seemed higher in glial ferritin knockdown, so we speculated that some proteins accumulated in slowly proliferating NBs. Thus, we used Insc-GAL4 to drive DsRed for indicating the expression level of Insc and found that DsRed rose after glial ferritin knockdown, suggesting that Insc expression was increased indeed. Therefore, we have to normalize SoNar driven by Insc-GAL4 based on DsRed driven by Insc-Gal4, which eliminates the effect of increased Insc upon glial ferritin knockdown.

      FAC is mentioned as a chelator? But the authors seem to use it oppositely. Is there an error?

      FAC is a type of iron salt, which is used to supply iron. We have also indicated that in line 156 according to your advice. 

      The lack of any cell death in the L3 brain surprised me. There should be plenty of hemilineages that die, as do many NBs, particularly in the abdominal segments. Is the stain working? Related to this, P35 is not the best method for rescuing cell death. H99 might be a better way to go.

      We were also surprised to see this result and repeated this experiment for several times with both negative and positive controls. Moreover, we also used TUNEL to validate this result, which led to the same result. We will try to use H99 to rescue NB loss in the future, because it needs to be integrated and recombined with our current genetic tools.

      It would be nice to see the aconitase activity signal as opposed to just the quantification.

      This method can only determine the absorbance for indicating aconitase activity, so our result is just the quantification.

      Glia are born after NBs are specified. In fact, they arise from NBs (and glioblasts). So, it's unlikely that the knockdown of ferritin in glia can at all affect initial NB specification.

      We completely agree with this statement.

      The section on tumor suppression seems out of place. The fly data on which the authors base this as an angle to chase is weak. Dividing cells will be impaired if they have inadequate energy production. As a therapeutic, this will affect every cell in the body. I'm not sure that cancer therapeutics is pursuing such broadly acting lines of therapies anymore.

      Our data suggested that iron/ferritin is more critical for high proliferative cells. Tumor cells have a high expression of TfR (Transferrin Receptor)[11], which can bind to Transferrin and ferritin[12]. And ferritin specifically targets on the tumor cells[11]. Thus, we think iron/ferritin is extremely essential for tumor cells. If we can find the appropriate dose of iron/ferritin inhibitor, suppressing tumor growth but maintaining normal cell growth, iron/ferritin might be an effective target of tumor treatment.

      The feedback from NB to glial ferritin is also weak data. The increased cell numbers (of unknown identity) could well be contributing to the increase in ferritin. I would omit the last two sections from the MS.

      In brat RNAi and numb RNAi, increased cells are NB-like cells, which cannot undergo further differentiation and are not expected to produce ferritin. More importantly, we used Repo (glia marker) as the reference and quantified the ratio of ferritin level to Repo level, which can exclude the possibility that increased glial cells lead to the increase in ferritin.

      References

      (1) Tanimura T, Isono K, Takamura T, et al. Genetic Dimorphism in the Taste Sensitivity to Trehalose in Drosophila-Melanogaster. J Comp Physiol, 1982,147(4):433-7

      (2) Myster DL, Duronio RJ. Cell cycle: To differentiate or not to differentiate? Current Biology, 2000,10(8):R302-R4

      (3) Dalton S. Linking the Cell Cycle to Cell Fate Decisions. Trends in Cell Biology, 2015,25(10):592-600

      (4) Nichol H, Law JH, Winzerling JJ. Iron metabolism in insects. Annu Rev Entomol, 2002,47:535-59

      (5) Pham DQ, Winzerling JJ. Insect ferritins: Typical or atypical? Biochim Biophys Acta, 2010,1800(8):824-33

      (6) Speder P, Brand AH. Systemic and local cues drive neural stem cell niche remodelling during neurogenesis in Drosophila. Elife, 2018,7

      (7) Mumbauer S, Pascual J, Kolotuev I, et al. Ferritin heavy chain protects the developing wing from reactive oxygen species and ferroptosis. PLoS Genet, 2019,15(9):e1008396

      (8) Xiao G, Wan Z, Fan Q, et al. The metal transporter ZIP13 supplies iron into the secretory pathway in Drosophila melanogaster. Elife, 2014,3:e03191

      (9) Marelja Z, Leimkühler S, Missirlis F. Iron Sulfur and Molybdenum Cofactor Enzymes Regulate the  Life Cycle by Controlling Cell Metabolism. Front Physiol, 2018,9

      (10) Morgan LL. The epidemiology of glioma in adults: a "state of the science" review. Neuro-Oncology, 2015,17(4):623-4

      (11) Fan K, Cao C, Pan Y, et al. Magnetoferritin nanoparticles for targeting and visualizing tumour tissues. Nat Nanotechnol, 2012,7(7):459-64

      (12) Li L, Fang CJ, Ryan JC, et al. Binding and uptake of H-ferritin are mediated by human transferrin receptor-1. Proc Natl Acad Sci U S A, 2010,107(8):3505-10

    1. Author response:

      The following is the authors’ response to the original reviews.

      Reviewer #1 (Public Review): 

      Summary: 

      This paper described the dynamics of the nuclear substructure called PML Nucleolar Association

      (PNA) in response to DNA damage on ribosomal DNA (rDNA) repeats. The authors showed that the PNA with rDNA repeats is induced by the inhibition of topoisomerases and RNA polymerase I and that the PNA formation is modulated by RAD51, thus homologous recombination. Artificially induced DNA double-strand breaks (DSBs) in rDNA repeats stimulate the formation of PNA with DSB markers. This DSB-triggered PNA formation is regulated by DSB repair pathways. 

      Strengths: 

      This paper illustrates a unique DNA damage-induced sub-nuclear structure containing the PML body, which is specifically associated with the nucleolus. Moreover, the dynamics of this PML Nucleolar Association (PNA) require topoisomerases and RNA polymerase I and are modulated by RAD51mediated homologous recombination and non-homologous end-joining. This study provides a unique regulation of DSB repair at rDNA repeats associated with the unique-membrane-less subnuclear structure. 

      Weaknesses: 

      Although the PNA formation on rDNA repeat is nicely shown by cytological analysis, the biological significance of PNA in DSB repair is not fully addressed.

      We appreciate the succinct summary, and thank you for pointing out this insightful comment. Our data show that the dynamic interaction of PML with nucleolar caps can recognize and sequester damaged rDNA from the reactivated nucleolus. We propose that through this process, the actively transcribed intact rDNA is protected from possible detrimental interaction with the defective, PNAs-sequestered rDNA, most likely to avoid the harmful intra- and inter-chromosomal recombination events that would otherwise likely occur during recombinational repair of the damaged rDNA, as the rDNA repeats present on five chromosomes are highly repetitive. Thus, this novel sorting mechanism might help sustain the integrity of repetitive rDNA loci.

      Our data also indicate that the emergence of PNAs coincided with cell cycle arrest and preceded the establishment of cellular senescence. The senescent response to rDNA damage can primarily protect the genome from the instability of rDNA loci in a manner broadly analogous to that described for protecting the telomeric loci. This notion is supported by the lack of PNA formation in most cancer cells. In the broader context of the biological significance of cellular senescence at the organismal level, such robust response to hazardous rDNA damage in the individual affected cells may limit/prevent the sporadic occurrence of early cancerous lesions, at the expense of potential tissue adverse effects accumulating over time and thereby eventually contributing to organismal aging.

      Reviewer #2 (Public Review): 

      In this manuscript, the authors aim to study the PML-nucleoli association (PNAs) by different genotoxic stress and to determine the underlying molecular mechanisms. 

      First, from a diverse set of genotoxic stress conditions (topoisomerases, RNA Pol I, rRNA processing, and DNA replication stress), the authors have found that the inhibition of topoisomerases and RNA Polymerase I has the highest PNA formation associated with p53 stabilization, gamma-H2AX, and PAF49 segregation. It was further demonstrated that Rad51-mediated HR pathway but not NHEJ pathway is associated with the PNA formation. Immuno-FISH assays show that doxorubicin induces DSBs (53BP1 foci) in rDNA and PNA interactions with rDNA/DJ regions. Furthermore, endonuclease IPpol induced DSB at a defined location in rDNA and led to PNAs. 

      Most claims by the authors are supported by the data provided. However, below weaknesses/concerns may need to be addressed to improve the quality of the study. 

      (1) Top2B toxin doxorubicin had the highest degree of elevating PNAs; however, Top2B-knockdown had almost no noticeable effects on PNAs. How to reconcile the different phenotypes targeting Top2B? 

      We thank the reviewer for this comment and believe we can reconcile the results from doxorubicin treatments and the downregulation of TOP2A and B. 

      The different phenotypes can reflect the fact that doxorubicin targets both human TOP2 isoforms: TOP2A and TOP2B. Hence this treatment can limit any potential redundant roles of the individual topoisomerase subtypes, which, on the other hand, can be manifested under conditions when only one specific member is depleted genetically. On the other hand, it is also crucial to note that these isoforms are not fully functionally redundant. Each isoform reveals a characteristic expression pattern and distinct yet overlapping function (e.g. Nitiss J 2009, doi.org/10.1038/nrc2608, or Uusküla-Reimand 10.1126/sciadv.add4920). Thus, doxorubicin treatment or TOP2A KD can, contrary to TOP2B KD, trigger the formation of PNAs.   

      Additionally, besides topoisomerase inhibition and poisoning, doxorubicin intercalates DNA and elevates oxidative stress. Therefore, the observed effect of doxorubicin may also reflect, to some extent, its broader damaging impact on (r)DNA. On the other hand, the downregulation of individual topoisomerase isoforms shows how the restriction of their respective specific function/s may evoke (r)DNA damage.

      (2) To test the role of Rad51 and DNA-PKcs in the PNA formation, Rad51 inhibitor B02 and DNA-PKcs inhibitor NU-7441 were chosen to use in the study. To further exclude the possible off-target of B02 and NU-7441, siRNA-mediated knockdown of Rad51 and DNA-PKcs would be an appropriate complementary approach to the pharmaceutical inhibitor approach. 

      We followed this stimulating suggestion, and in the revised manuscript, we used pools of siRNAs (esiRNA) to target the mRNA of RAD51 or ligase IV (LIG4) -  to mimic the Rad51 chemical inhibitor B02 and the NHEJ (DNA PK) inhibitor NU-7441, respectively. The relevant new data are presented in Figure 5F-I, 6E, and F, Supplementary Figure 5D, E, F – H, and Supplementary Figure 6C-E. Notably, the results of rDNA damage triggered PNAs formation obtained using the chemical inhibition of the repair pathways and the genetic approach (knockdown), were largely consistent, thereby supporting our original conclusions. There was one interesting partial difference when the B02 RAD51 inhibitor was compared with RAD51 knockdown, which we also comment on below, and suggest a plausible explanation reflecting the fact (known for other DDR proteins such as PARP1, etc.) that the functional inhibition of an expressed protein (here RAD51, by B02) may not necessarily phenotypically recapitulate the absence of such protein (here RAD51 knockdown). Overall, we agree that this was a very important set of control experiments, in addition extended to cell cycle phase analysis.

      First, the LIG4 knockdown impacted the I-PpoI-induced PNAs formation in a way that followed the same trend as the effects caused by the NHEJ pathway inhibitor NU-7441, namely increased frequency of PNAs formation when NHEJ was impaired (Figure 5E a 5I). This was expected based on what we know about the PNA formation, as the NHEJ pathway is active throughout the cell cycle, and when such repair mode is not available in the nucleolus, then more rDNA breaks remain unrepaired and must be transported to the nucleolar caps to be processed by the HR pathway, thereby also leading to more PNAs structures formed under such conditions. In terms of cell cycle phases, the observed increase of I-PpoI-induced PNAs in cells with depleted LIG4 was more pronounced in S/G2 cells, when the PNAspromoting, cap-associated HR pathway is more active. Furthermore, the enhanced occurrence of IPpoI-induced PNAs in cells depleted of LIG4 was counter-acted (partly ‘rescued/prevented’) by the concomitant treatment with the RAD51 inhibitor B02 (Figure 5E and I) compare cells with esiLIG4 alone versus esiLIG4 + B02), overall consistent with the notion that cap-associated HR pathway facilitates PNAs formation.

      Second, in the analogous scenario of comparing the impact of the RAD51 chemical inhibitor (B02) with the siRNA-mediated knockdown of RAD51, the observed trends in terms of the resulting frequencies of I-PpoI-induced PNAs, were also largely consistent, in that both strategies of interfering with RAD51 resulted in fewer PNAs formed than than in cells deficient in NHEJ. On the other hand, we must stress that after RAD51 knockdown, we did not observe a decline of PNAs compared to control cells, which was detected after B02 treatment (Figure 5E and I).  However, when specifically considering the cell cycle position of the individual cells, these new analyses revealed again important similarities between the knockdown and chemical inhibition of RAD51 (Figure 6E, Supplementary Figure 6E).

      Before discussing the partial, cell-cycle-related difference between the impact of RAD51 chemical inhibition vs. knockdown, it is important to consider the PNAs patterns seen in cells with activated IPpoI and proficient in both, NHEJ and HR. Thus, the overall frequency of I-PpoI-induced PNAs formation was higher in G1 than in S/G2 cells. Considering that persistent rDNA DSBs trigger the formation of PNAs, this result may reflect the very limited HDR during G1 phase, in contrast to more efficient repair of I-PpoI-induced rDNA DSBs in S/G2, the cell cycle phase in which the activity of both NHEJ and HDR operate in parallel, the latter pathway offering a safer, error-free mechanism of DSB repair.

      Notably, when comparing the PNAs formation frequency in cells treated with either chemical inhibition of RAD51 (with B02) or upon knockdown of RAD51, we strikingly observed that the decrease of I-PpoIinduced PNAs formation upon RAD51 knockdown was apparent only for cells in G1 (Figure 6E, and Supplementary Figure 6E). We believe that the distinct impact of RAD51 knockdown compared with that of RAD51 inhibitor (mainly seen when S/G2 cells were analyzed separately) might reflect one or a combination of several factors, including e.g. the following: 

      i) The knock-down-induced absence of RAD51 protein may allow access to the persistent DSB lesions by other alternative repair proteins (such as the RAD52-mediated repair reported in diverse pathophysiological circumstances including in cells undergoing senescence, a scenario very relevant for our present study). Such altered stoichiometry of proteins interacting with the persistent rDNA DSBs may contribute to the pattern of PNAs formation that is then distinct from the pattern seen in the presence of  Rad51; 

      ii) Another difference that we observe is the somewhat enhanced frequency of ‘spontaneous’ (i.e., even without activating the I-PpoI) PNAs formation when RAD51 is depleted, a phenomenon not seen when control non-targeting siRNA is transfected or when RAD51 is acutely inhibited by B02 (Figure 5H). Such spontaneous baseline PNA formation likely reflects the enhanced persistence of unrepaired endogenously occurring DNA lesions that are already suboptimally processed during the period following the esiRNA transfection, i.e., under stepwise depletion of the RAD51 protein which is normally required to deal with such omnipresent endogenous lesions occurring during e.g. DNA replication or some oxidative/metabolic processes; 

      iii) The knockdown approach, while clearly robustly depleting RAD51 protein levels (see Supplementary Figure 5D) may nevertheless leave a small residual fraction of the RAD51 protein present in the cells, thereby possibly inhibiting the HDR pathway to a slightly lesser degree than the B02 inhibitor;

      iv) Additionally, it should be noted that the baseline levels of I-PpoI-induced PNAs formation are somewhat higher in the transfection experiments (i.e. when using any siRNA, even the nontargeting control siRNA), compared with the less ‘invasive’ experiments of simply adding a drug/solvent to the cell culture medium. This phenomenon adds to the commonly seen (over decades, by us and many others..) above-baseline transient stress in cells exposed to transfections, often causing even moderate transient DNA damage response. Specifically, in control experiments, the level of I-PpoI-induced PNAs was around 15% in cells transfected with non-targeting siRNA, while the comparable experiment of only I-PpoI induction under non-transfection conditions was around 10%. In other words, the somewhat enhanced baseline counts of I-PpoI-induced PNAs seen in the knock-down experiments compared with chemical inhibitor experiments reflect partly the shift of the total readout counts due to the different baseline counts. This, however, does not alter the observed overall trends that are consistent in both types of experiments.

      While the potential interpretation(s) of the above results are presented in the Discussion section of the revised manuscript, the full mechanistic elucidation of the impact of various experimental manipulations on the PNA formation during the cell cycle would require a dedicated follow-up study.

      (3) Several previous studies have shown the activation of the nucleolar ATM-mediated DNA damage response pathway by I-Ppol-induced DSBs in rDNA. What is the role of nucleolar ATM in the regulation of PNAs?

      We agree this is an important issue the solution of which (explained below) strengthens the mechanistic insights provided in our revised manuscript, and we are grateful to the reviewer for raising this question. To address this important point and even extend the scope from ATM also to ATR, we employed two small-molecule inhibitors of ATM (KU-60019 and KU55933) and also one inhibitor of ATR (VE-822), at concentrations commonly used in analogous studies in the DNA damage response field,  to examine their impact on rDNA damage/PNA formation induced by I-PpoI. The new data are shown in Figures 5A and B. We found that the inhibition of either of the two kinases alone, robustly reduced the number of nuclei with PNAs, indicating that the activity of each of these two DNA damage signaling kinases is required for the formation of I-PpoI-induced PNAs in response to rDNA damage. Future experiments should elucidate precisely which of the very wide range of ATM/ATR substrates and/or specific protein domains and amino acid residues are instrumental in this rDNA damage signaling pathway to induce the formation of PNAs.

      Reviewer #3 (Public Review): 

      Summary: 

      Hornofova et al. examined interactions between the nucleolus and promyelocytic leukemia nuclear bodies (PML-NBs) termed PML-nucleolar associations (PNAs). PNAs are found in a minor subset of cells, exist within distinct morphological subcategories, and are induced by cellular stressors including genotoxic damage. A systematic pharmacological investigation identified that compounds that inhibit RNA Polymerase 1 (RNAPI) and/or topoisomerase 1 or 2A caused the greatest proportion of cells with PNA. A specific RAD51 inhibitor (R02) impacted the number of cells exhibiting PNAs and PNA morphology. Genetic double-strand break (DSB) induction within the rDNA locus also induced PNA structures that were more prevalent when non-homologous end joining (NHEJ) was inhibited. 

      Strengths: 

      PNA are morphologically distinct and readily visualized. The imaging data are high quality, and rDNA is amenable to studying nuclear dynamics. Specific induction of rDNA damage is a strong addition to the non-specific pharmacological damage characterized early in the manuscript. These data nicely demonstrate that rDNA double-strand breaks undermine PNA formation. Figure 1 is a comprehensive examination and presents a compelling argument that RNAPI and/or TOP1, TOP2A inhibition promote PNA structures. 

      Weaknesses: 

      (1) The data are limited to fixed fluorescent microscopy of structures present in a minority of cells. Data are occasionally qualitative and/or based upon interpretation of dynamic events extrapolated from fixed imaging. This study would benefit from live imaging that captures PNA dynamics. 

      We fully agree with the reviewer that live-cell imaging is critical to adequately capture PNA formation and evolution dynamics. While the data presented in this manuscript are based on quantifications of fixed cell images, all these analyses are based on a detailed live-cell imaging examination of the dynamic behavior of PNAs that we reported in our orginal study on PNAs formation as a biological phenomenon (Imrichova et al. (doi: 10.18632/aging.102248. Epub 2019 Sep 7). 

      In the revised version of our present manuscript, we better highlight the live-cell imaging study, in the Introduction section and further point out that the previous dynamic study was based on imaging of human cells ectopically expressing PML-EGFP and B23-RFP. Last but not least, to help the readers of this manuscript to understand the dynamics of PNA evolution, we have now also added an improved schematic figure that better illustrates the temporal dynamics of PNA stage transitions (Figure 1A).

      (2) Cell cycle and cell division are not considered. Double-strand break repair is cell cycle dependent, and most experiments occur over days of treatment and recovery. It is unclear if the cultures are proliferating, or which cell cycle phase the cells are in at the time of analysis. It is also unclear if PNAs are repeatedly dissociating and reforming each cell division. 

      We agree that this is an important point. We previously published (Imrichova et al., doi: 10.18632/aging.102248) that exposure of RPE-1hTERT cells to doxorubicin caused cell cycle arrest and cellular senescence. In the revised manuscript, we added the analysis of how the I-PpoI-induced rDNA DSB affects the cell’s fate (Supplementary Figure 4J-N). Importantly, we found that most of the cells after I-PpoI-induced rDNA DSB also developed cellular senescence, and only 1–3% of cells eventually recovered from such rDNA stress to the extent that they were able to form colonies in a colony-forming assay. Thus, at the time of analysis, most of the cells were non-proliferating. 

      Additionally, in the revised manuscript, we included an analysis of the dependence of PNA formation on specific cell cycle phases (see Figures 6E–I and Supplementary Figure 6C–E). Generally, we found that PNAs can be present in G1/S/G2. Nevertheless, the probability of occurrence in a particular cell cycle phase is affected by the type of treatment. For example, after I-PpoI-induced rDNA damage, the PNAs are primarily present in G1. In contrast, after the sole knockdown of RAD51 or TOP2A, the PNAs are present in S/G2 with higher probability. 

      (3) The relationship of PNA morphologies (bowl, funnel, balloon, and PML-NDS) also remains unclear. It is possible that PNAs mature/progress through the distinct morphologies, and that morphological presentation is a readout of repair or damage in the rDNA locus. However, this is not formally addressed.  

      The reviewer is indeed correct in his/her interpretation of the PNA morphologies as a readout of the dynamic fate of the rDNA lesion. As mentioned in our response to the previous point no. 2 raised by this reviewer (see above), we described the dynamic structural PNA transitions in our previous article (Imrichova et al., doi: 10.18632/aging.102248).

      PNA progresses through distinct structures. Our results indicate that individual PNA subtypes are tied to specific processes. The PNA bowl-type is linked to the recognition of rDNA damage on the nucleolar periphery. The PNA funnel-type clusters several damaged rDNA loci from the nucleolus into PML-NDS, which is the ultimate structure that sequesters unrepaired rDNA away from the reactivated nucleolus.

      The formation of bowls, funnels, and balloons is linked to the inhibition of RNA polymerase I during the formation of nucleolar caps. In contrast, the later stage of PML-NDS is linked to RNA polymerase I reactivation. 

      We should mention that after the I-PpoI treatment, the ‘bowls’ and ‘funnels’ (observed originally in response to topoisomerase inhibitory drugs) are missing, and only PML-NDSs are formed. The apparent absence of the preceding stages of PNAs may reflect the lower extent of rDNA damage induced by I-PpoI treatment, without causing the pan-nucleolar RNA polymerase I inhibition that was observed for other treatments, such as doxorubicin.  

      (4) An I-Ppol targeted sequence within the rDNA locus suggests 3D structural rearrangement following damage. An orthogonal approach measuring rDNA 3D architecture would benefit comprehension.

      This is a very inspiring idea. Given the demanding nature of the required 3D analyses and the fact that this aspect is somewhat outside the scope of the present study, we plan to follow this issue up in our future work, along with our efforts to localize the individual NORs using immune-FISH after introducing the rDNA damage by I-PpoI.

      (5) Following I-Ppol induction, it is possible that cells arrest in a G1 state. This may explain why targeting NHEJ has a greater impact on the number of 53BP1 foci and should be investigated.

      We fully agree with the Reviewer. Indeed, our results showed that after a 24-hour period of I-PpoI induction, most cells (about 90%) are in the G1 phase of the cell cycle, consistent with the activation of the ATM/ATR checkpoint signaling and p53 activation that we observed. Therefore, this cell cycle effect can indeed explain why targeting NHEJ has a greater impact and causes the higher numbers of 53BP1 foci (and also yH2AX foci). 

      (6) Conclusions: PNAs are a phenomenon of biological significance and understanding that significance is of value. More work is required to advance knowledge in this area. The authors may wish to examine the literature on APBs (Alt-associated PML-NBs), which are similar structures where telomeres associate with PML-NBs in a specific subset of cancers. It is possible that APBs and PNAs share similar biology, and prior efforts on APBs may help guide future PNA studies.  

      We are very grateful for this stimulating suggestion. In the Discussion of the revised manuscript, we now address the possible analogy between the APBs under ALT on the one hand, and the PNA formation on rDNA damage studied here, on the other. The following is the quote of the relevant paragraph of the revised Discussion: 

      “There are several similarities between PNAs and APBs. The interaction partner of PML located on both the telomeres and rDNA must be sumoylated, as the PML-SIM domain is essential for the formation of both APBs and PNAs (37,93). The PML IV isoform most efficiently forms APBs and also PNAs (16,37). PML clusters damaged telomeres into APBs, and we observe that several NORs converge in one PNA structure; thus, the PML-dependent clustering of damaged NORs is plausible. On the other hand, there is one critical difference between the otherwise broadly analogous APBs and PNAs. The process of ALT operates in transformed cancer cells that do not express the telomerase, thus enabling telomere maintenance, cell proliferation, and immortalization (94,95). The PNAs, on the other hand, were primarily detected in non-transformed cells, and their formation is linked to cell cycle arrest and establishment of senescence (31,36). It remains to be determined whether the formation of PNAs is positively involved in rDNA repair, resulting in a return of at least some PNA-forming cells to the cell cycle, or if they play a role in blocking the repair of DNA double-stranded breaks on rDNA, broadly analogous to the shelterin complex on telomeres during replicative senescence (96). We propose that the pro-senescent role of PNAs may contribute to the maintenance of rDNA stability, thereby limiting the potential of hazardous genomic instability and, hence, the risk of cellular transformation. Analogous to checkpoint responses and oncogene-induced senescence (97,98) the PNA-associated senescence might provide one aspect of the multifaceted cell-autonomous anti-cancer barrier, in this case guarding the integrity of the most vulnerable repetitive rDNA loci, possibly at the expense of accumulated cellular senescence-associated decline of functional tissues during aging.”

      Our responses to recommendations from the Editors:

      (1) Since this paper does not provide a mechanistic insight into how the different PNA forms after DNA damage and PolI inhibition such as doxorubicin (DOXO) treatment and how HR modulates the PNA formation, it is very important to provide some experimental data for those. For example, as the #3 reviewer suggested, the time-lapse analysis of PML and a rDNA marker after DOXO treatment and recovery would be beneficial. with morphological analysis. 

      We fully agree that live-cell imaging is essential for a better understanding of the evolution and function of PNAs'. The requested time-lapse analysis on the dynamics of the PNA morphological stages after DOXO treatment and recovery is available to the Reviewers and readers in our previously published article that reported the PNA phenomenon and the basic live cell imaging data after doxorubicin treatment using the ectopically expressed PML-GFP and B23-RFP (Imrichova et al.; doi: 10.18632/aging.102248.). In our present revised manuscript, we now refer to this work in the Introduction and further stress that those data were based on live-cell imaging, to better highlight this point along the line recommended by the Reviewers. We have now also added an improved scheme that better explains the temporal dynamics of PNA transitions (Figure 1A).

      (2) In the same line as point #1, it is very important to show what kind of signaling pathway is necessary for PNA formation upon DSB formation with PolI inhibition. For example, as the #2 reviewer advised, the role of ATM or ATR could be tested by adding their inhibitor during the PNA formation. 

      Again, we fully agree that clarification of the signaling pathway required for PNA formation is crucial, and we are grateful for this stimulating recommendation. While the mentioned Reviewer no. 2 (in his/her Public comments) asked only about the role of ATM, the Editors rightly requested that we should use distinct inhibitors to test the respective roles of not only ATM but also ATR. As recommended, we have tested the importance of ATM and ATR kinase activities by inhibiting them during PNA formation. These newly generated data clearly showed that the activity of either kinase is essential for the efficient formation of PNA, thereby providing a significant new mechanistic insight in the revised dataset. In the manuscript, these new results are now shown in Figures. 5A and B. We also addressed this issue in the Public Review (Reviewer #2 point 3).

      (3) Given the association of PML body with telomeres in ALT cells (ALT-associated PML Body, APB) has been established well in the field, the authors need to mention this in the Introduction and also compare how PNA is similar to different from APB clearly in the Discussion.

      We have followed this conceptually important recommendation exactly as suggested: i) We now mention the ALT-associated PML Body (APB)  in the Introduction section (end of the second paragraph) and ii) In much more detail, we now compare the conceptual analogy in terms of similarities and differences between PNA and APB in the revised Discussion.  We also address this issue in the document Response to Public Review (Reviewer #3 point 6). Indeed, we agree that this comparison is very fitting in the context of our dataset and informative for the broad audience.

      Recommendations for the authors:

      Reviewer #1 (Recommendations For The Authors): 

      Major points. 

      (1) Any treatments shown in Figure 1B and 1C did not induce PNA in most of the cells with around 20% for a maximum value. What time point(s) the authors checked should be stated in the main text or the legend clearly. The authors need to mention the kinetics of different PNA classes and/or doseresponse effects at least for doxorubicin and BMH-21. Or a cell-cycle stage effect should be analyzed and/or discussed given that HR is mainly operating in S and G2 phases. 

      Thank you for pointing this out. We have now clarified the dose effects and also both analyzed and discussed the PNA formation vis a vis cell cycle stages, as recommended by this insightful reviewer.

      First, we have now added an experimental scheme to the Figures for better clarity regarding the time points examined, as suggested.

      Second, our results show that drug doses indeed affect the number and subtype of PNAs that form after such treatments. We show PNAs (types and number) after 0.5 – 5 – 50 µM camptothecin, topotecan, and etoposide (Supplementary Figure 1G and H) and after 0.375 – 0.56 – 0.75 µM doxorubicin (Figure 2A-D and Supplementary Figure 2E-G).  

      The very first detailed analysis of PNA evolution was presented in Imrichova et al. (doi: 10.18632/aging.102248.), where we described, using live-cell imaging, the relationship between the individual doxorubicin-induced PNA types, their transitions, and dynamics. We found that the highest number of nuclei with PNAs was present between 24 and 48 h after treatment initiation. Thus, we selected this time point for PNAs detection after treatments presented in Figure 1B.  

      We have now also added the distribution of nuclei based on the presence of specific PNA types into Supplementary Figure 1F.

      We included the analysis of the dependence of PNA formation on specific cell cycle phases (see Figures 6E–I). A very detailed explanation of the observed cell cycle effects is presented in the document Responses to Public Review, re. Reviewer nr. 2, point 2, so please kindly read our response there.

      (2) Although the induction of PNA by DSBs at rDNA repeats is clearly shown in the paper and modulated by DSB repair pathways, the biological significance of this sub-nuclear structure has not been addressed at all. Is the PNA required for efficient DSB repair per se or pathway choice? Moreover, the PNA kinetic is peculiar. Once formed, the PNA did not show any turnover even after the DNA-damaging agents were washed away (Figure 4H). This structure is succeeded into the next generation after cell division. Such dynamics of PNL should be carefully addressed. 

      The reviewer is correct in that the fate of the PNA and the potential biological significance of this phenomenon required a better explanation. The majority (≈97%) of cells after I-PpoI induction undergo cellular senescence, and therefore, we suppose that the PNA structures are not passed into the next cell cycle, as the bulk of the cells do not proliferate/cycle after such treatments. In this regard, it should be noted that PNAs (PML-NDS) are associated with replicative senescence of human mesenchymal stem cells (our old publication: Janderova-Rossmeislova 2007; doi: 10.1016/j.jsb.2007.02.008). To answer the comment of this reviewer, we have actually never observed that the cells with PNA present would be able to enter mitosis. Based on these findings, we suggest that damage to the repetitive rDNA loci, such as in our experiments in the form of DSBs, could commonly result in unsuccessful repair attempts leading to cellular senescence due to rDNA damage signaling, consistent with our new experiments highlighting the key role of the signaling mediated by the major DNA damage response kinases ATM and ATR, including the role of PNAs formation. For more details, please see also our response to Point 2 raised by the editors, on page 1 of this document, as well as our Public review response to Referee nr. 2, his/her points 2 and 3.

      From a broader perspective, relevant to the biological function of PNAs in this unorthodox cellular stress response, we showed that doxorubicin-induced PML-NDSs separate/sequester persistent rDNA DSBs from the regions of active pre-rRNA transcription. Again, the purpose of this process is not entirely clear at present. However, such separation of unrepaired rDNA from the rest of the genome could have a protective function, thereby limiting the risk of aberrant homologous recombination among hundreds of the repetitive, recombination-prone rDNA copies spread across five chromosomes. It should be stressed that PNAs are rarely seen in cancer cells, and their absence might be linked to the rDNA instability commonly seen in transformed cells. 

      As published in our previous study (Imrichova et al.; doi: 10.18632/aging.102248.), we followed the fate of individual PML-NDS (the last stage of PNA) after the recovery from doxorubicin treatment using live-cell imaging. We observed that the destiny of this structure could be diverse. Some of them sustained in the nucleus for many hours, but a portion of them disappeared. Their extinction may be a manifestation of successful rDNA repair. However, what remains unresolved is why these cells do not reenter the cell cycle and instead develop a senescent phenotype, possibly reflecting some paracrine effects of a cocktail of diverse cytokines and chemokines secreted by the neighboring cells, a phenomenon well established in the senescence field as SASP (senescence-associated secretory phenotype). 

      Notably, during the recovery phase from I-PpoI insult, some of the PML-NDS, in fact, increase in size over time (please refer to the graph in Author response image 1). This enlargement suggests ongoing processes within these structures. Additionally, the sequential accumulation of DHX9 (a multifunctional DNA/RNA helicase) in PNAs during recovery from the I-PpoI insult (as shown in Figure 4G and Supplementary Figure 4H in the revised manuscript) supports the hypothesis that PNAs are associated with as-yet poorly understood process(es). 

      Author response image 1.

      . A scatter plot shows the changes in PNA diameters during the recovery phase from a 24-hour-long expression of IPpoI.

      Last but not least, again relevant for the potential biological role of PNAs, we now also discuss the partial analogy of these structures with the PML-association with telomeres in cells that maintain their telomeres by the ALT recombinational process, as suggested by Referee no. 3 in the public review process. As this consideration addresses also the biological significance of the diverse PML associations and particularly our thoughts about the PNA, we copy/paste this paragraph from the Discussion section of our revised manuscript here, for the convenience of the Reviewer:

      “There are several similarities between PNAs and APBs. The interaction partner of PML located on both the telomeres and rDNA must be sumoylated, as the PML-SIM domain is essential for the formation of both APBs and PNAs (37,93). The PML IV isoform most efficiently forms APBs and also PNAs (16,37). PML clusters damaged telomeres into APBs, and we observe that several NORs converge in one PNA structure; thus, the PML-dependent clustering of damaged NORs is plausible. On the other hand, there is one critical difference between the otherwise broadly analogous APBs and PNAs. The process of ALT operates in transformed cancer cells that do not express the telomerase, thus enabling telomere maintenance, cell proliferation, and immortalization (94,95). The PNAs, on the other hand, were primarily detected in non-transformed cells, and their formation is linked to cell cycle arrest and establishment of senescence (31,36). It remains to be determined whether the formation of PNAs is positively involved in rDNA repair, resulting in a return of at least some PNA-forming cells to the cell cycle, or if they play a role in blocking the repair of DNA double-stranded breaks on rDNA, broadly analogous to the shelterin complex on telomeres during replicative senescence (96). We propose that the pro-senescent role of PNAs may contribute to the maintenance of rDNA stability, thereby limiting the potential of hazardous genomic instability and, hence, the risk of cellular transformation. Analogous to checkpoint responses and oncogene-induced senescence (97,98) the PNA-associated senescence might provide one aspect of the multifaceted cell-autonomous anti-cancer barrier, in this case guarding the integrity of the most vulnerable repetitive rDNA loci, possibly at the expense of accumulated cellular senescence-associated decline of functional tissues during aging.”

      (3) The association of PNA with DSB repair is shown by the colocalization with 53BP1 (Figures 3-5) and the kinetics of DSB repair were assessed by 53BP1 kinetics (Figure 5B). The authors need to check the colocalization of other DSB repair factors in homologous recombination (RPA and RAD51) and nonhomologous end joining (KU) and the kinetics of these DSB repair foci. 

      We are grateful for this very relevant suggestion. In response to this recommendation, we have examined additional markers, linked to homologous recombination. In Figures 6A—D and Supplementary Figures 6A and B, we now show also the localization of RAD51 and RPA32 (pS33), along the lines recommended by this Reviewer.

      (4) In Figure 5B, 53BP1 foci in the "nucleolus" should be shown with that in the nucleus. 

      In the revised manuscript, we show histograms with a count of 53BP1 foci per nucleus.

      (5) The authors often used the words, "difficult-to-repair" and "easy-to-repair" DNA lesions. However, without the nature of these DNA lesions, it is early to distinguish the lesions. So, the authors should avoid them in the title, abstract, results, and figure legends. In Discussion, it is free to use them with a logical explanation. 

      Thank you for the recommendation. We have now changed the term “difficult-to-repair” to “persistent rDNA damage”, as this term better describes at face value the scenario encountered in these experiments. In the new version of the manuscript, we have now emphasized that PNAs are formed as a late response to rDNA damage. We added the observation that PNAs colocalized with rDNA lesions accumulated in the nucleolar cap (periphery of nucleolus), which are probably in-compatible with NHEJ-mediated repair that otherwise occurs within the nucleolus. These persistent lesions contained phospho-RPA, a marker of resected DNA. However, RAD51 was not detected in such late lesions, indicating that the canonical RAD51-dependent HDR pathway is also restricted. Finally, we included a section defining such persistent DNA damage in the revised Discussion.

      Minor points: 

      (1) Page 5, second paragraph, line 6: "expression of PML". 

      (2) Page 5, line 6 from the bottom and Figure 1B: Actinomycin D is not a "specific" RNA polymerase I inhibitor. 

      (3) Page 6, first paragraph, last line: "DNA DSB" should be "DSB". 

      (4) Page 6, second paragraph, lines 6-7: What is the evidence of RNA polymerase I is active (need to explain to the readers)? 

      (5)  Figure 1D and main text: Please mention DOXO is the abbreviation of doxorubicin. 

      We are grateful for these points, which have now all been corrected in the revised version of the manuscript.

      (6) Page 6, third paragraph, line 4 and Figure 1D: What is "esi" not "si"TOP1. 

      In the revised manuscript, we explained what ‘esiRNA’ means; in fact, it is the pool of biologically prepared siRNAs targeting the mRNA of the protein being knocked down.

      (7) Figures 2A and 2B: The effect of B02 alone on PNA should be shown as a control.

      As recommended, the effect of B02 alone is now presented in Supplementary Figures 2A and B. 

      (8) Page 7, first paragraph, last three lines: It is hard to catch how the authors suggested the inhibition of RAD51 suppressed  RNAPI activity. If so, please  check the incorporation of 5FU. 

      Thank you for pointing out this confusing formulation. We have now removed from the revised manuscript the part of that original sentence: “which are predominantly associated with RNAPI inhibition”. 

      We observed that PML ‘balloons’ wrapped the nucleolus with the concomitantly observed complete inhibition of RNAPI in the nucleolus (Imrichova et al.; doi: 10.18632/aging.102248.). Nevertheless, we removed the original phrase from the revised version of the manuscript, as we agree with the reviewer that the causative relationship is so far lacking.

      (9) Page 7, second paragraph: It is critical to clarify what time B02 was added after DOXO removal or during DOXO treatment, or both.  

      We agree: In response we have now added the experimental scheme showing all these temporal details.

      (10) Figure 2H: The experiment lacks control with siTDP2 without etoposide treatment. 

      We did not include this control, unfortunately.

      (11) Page 8, third paragraph, line 3 from the bottom; "besides of rDNA probe, we also utilized probes" is better. 

      We changed this sentence in the revised manuscript, as recommended. 

      (12) Figure 3B: In these multi-color images, it is hard to see blue and gray in merged ones. It is better to show images with a single color. 

      We agree that grayscale is better to follow. However, this type of presentation would significantly increase the number of images, a circumstance we wished to avoid in this already rather image-heavy dataset. Instead, when it was possible, we elevated the intensity of fluorescence in colored images. The list of images with this adjustment is present in the public review. 

      We also inserted the example of the image in greyscale here as Author response image 2. 

      Author response image 2.

      The representative images nucleoli show the localization of 53BP1 (red; a marker of DNA DSB), PML (green, a marker of PML-NB or PNAs), rDNA (blue), and DJ (white; a marker of the acrocentric chromosome) after doxorubicin treatment (2 days) or in the recovery phase (1 and 4 days). The merge of all channels is shown together with the presentation of individual images in greyscale. Scale, 5 µm.  

      (13) Figure 4E: Please add values at D0. 

      We did not analyze the 53BP1 foci before adding Shield1 and doxycycline to induce the expression of I-PpoI (D0). However, as a control, we analyzed the 53BP1 foci in the cells treated for 24 h with the corresponding amount of DMSO as a mock treatment scenario (black line; NT).

      Reviewer #2 (Recommendations For The Authors): 

      (1) The data provided in this manuscript did not explicitly compare the easy-to-repair vs difficult-torepair DNA lesions in rDNA, or at least lack quantitative measures with statistical analysis. Therefore, the title may need to be revised accordingly. 

      We agree, and the title has now been revised to better capture the persistent nature of the rDNA damage that evokes the PNA formation. Please see the response to Reviewer #1, Major points 5, presented above in this document.

      Reviewer #3 (Recommendations For The Authors): 

      (1) Live imaging is paramount to understanding the dynamic nature of PNAs.  

      We agree that live-cell imaging is important. We have addressed this issue in detail in Response to Public review comments, of this Reviewer, as well as in the first point of this document in response to the Editors. In short, although the data presented in this manuscript are based on quantifications of fixed cell images, all these analyses benefit from our previous detailed live-cell imaging data that we reported – describing a careful examination of the dynamic behavior of PNAs in the study by Imrichova et al. (doi: 10.18632/aging.102248). To better illustrate the dynamic behavior of PNAs for the convenience of this reviewer, we include some data from our original article on this topic (referred to above): please see Author response image 3.

      Author response image 3.

      This Figure shows data published in Imrichova et al. (doi: 10.18632/aging.102248.). PML IV-EGFP was ectopically expressed in RPE-1hTERT cells. The localization of PML was followed using live cell imaging. (A) the bowl (in this work named cap) originates from the accumulation of diffuse PML. (B) The transition between bowl (named cap), funnel (named fork), and balloon (named circle). (C + D) PML IV-EGFP (green) and B23-RFP (red) were ectopically expressed in RPE-1hTERT cells. The localization of both proteins was followed by live cell imaging. C – The formation of PML-NDS from the funnel is shown; D – The entire PNA cycle is shown. (PML-bowl formed on the border of the nucleolus, then transformed into the PML-funnel, and finally into PML-NDS. 

      (2) The authors should consider cell cycle and cell proliferation in their analyses. 

      We are grateful for this recommendation, which echoes your own comment nr. 2 in the Public reviews document. Shortly, as we explained in the response to Public review, proliferation of PNA-containing cells is severely limited, as the vast majority of such cells enter a long-term arrest and cellular senescence. Furthermore, inspired by this comment, we have newly performed a series of experiments to address the frequencies of PNA formation vis a vis cell cycle phase position of the individual cells with rDNA damage. In the revised manuscript, we now include the data from these analyses: see Figures 6E–I and Supplementary Figures 6C–E. Our response in the Public Review provides a detailed description of these results.

      (3) Merged fluorescent micrographs in red and green are potentially not discernible to individuals with colour-vision deficiencies. Consider re-colouring into schemes that are more accessible. 

      We agree that some readers may have different preferences about fluorescence micrographs. Here, we used the classical combination of green and red, commonly employed in the field.

      (4) Single-colour fluorescent micrographs are easier to visualize in grey-scale. Whenever a single colour is shown, it will help reader comprehension if the images are shown in this manner. 

      As recommended, we have changed Figures 4C, F, and G from a single-color presentation to a greyscale. 

      (5) There are many long paragraphs that are difficult to digest. I suggest where possible breaking this text into smaller portions (e.g. Page 10, pages 13-14, page 16-17). 

      Thank you for pointing this out. We have now broken the text into smaller portions (in several places), as recommended.

      (6) The B02 and NU7441 data would be bolstered by genetic confirmation (depleting RAD51, BRCA2 or PALB2 for HR, DNA-PK or LIG4 for NHEJ).

      As recommended, we downregulated Rad51 and LIG4 by RNA interference. New data are presented in Figures 5F–I, 6E, and F, Supplementary Figures 5D, E, F–H, and Supplementary Figures 6C–E. The Public Review provides a detailed description of these results and the ensuing conclusions.

      (7) Microscopy results are often qualitative (Fig S1I, S2L, S3A) and need to be bolstered with quantitative data. 

      We appreciate this recommendation and have implemented quantifications in several important microscopy results, as follow:

      S1I: The quantification of the number of cells with types of PNAs after esiTOP1 is present in Supplementary Figure 1L

      S2L: The quantification (% of nuclei with PNAs) is in Figure 2H

      S3A: In this immuno-FISH figure, we captured nuclei with and w/o PNAs. Using the SQUASSH analysis, we identified size-based colocalization between rDNA–PML and DJ–PML presented in Supplementary Figure 3C.

      (8) Stats or error bars are missing (Fig 1D, 2H, S1C-E, S1F, S2A S2D-G, S3E, S4E).

      We apologize for those omissions and we have amended this aspect of the study in the revised manuscript as much as possible:

      Figure 1D: For AMD and doxorubicin and CX-5461 and doxorubicin treatments, three and two biological replicates are shown separately in the same graph, respectively. For AMD and the knockdown of TOP1, the mean from three biological replicates is shown. All these results indicate the elevation number of PNAs when RNAPI is inhibited.

      Figure 2H: The error bars are present. As for siTDP2 in all replicates, the number of cells was the same (4%). Therefore, the error bar is not visible.

      Supplementary Figure 1C-E: Unfortunately, only one replicate (for all treatments) was analyzed by western blotting.

      Supplementary Figure 1F (in revised manuscript SF1G): The error bars are present. By this graph, we mainly wanted to present the variation in PNAs types. 

      Supplementary Figure 2A (in revised manuscript SF2C): We include the whiskers 10-90 percentile and T-test.

      Supplementary Figure 2D-G (in revised manuscript SF2F-I): The error bars are present in all graphs. The changes in SF2F and G are not significant.

      Supplementary Figure 3E: This scheme shows the overlaps between rDNA and PML and rDNA and 53BP1. The collum graph based on these data is shown in Figure 3F.

      Supplementary Figure 4E: The plot profiles representing the mean fluorescence of PML and B23 are shown for different time points. 

      (9) PNA characteristics remind this reviewer of the well-described ALT-associated PML nuclear bodies (APBs) found in immortalized cells lacking telomerase (i.e. Alternative lengthening of telomeres). I recommend the authors look to published data on APBs to help guide how to approach their research within a framework of the cell cycle.

      We fully agree with this insightful comment, and have addressed this point in the Discussion section of the revised manuscript, quoted the relevant studies also in the Introduction, and indeed explained the parallels and also differences of PNA versus APB (see also our response to point 3 highlighted also by the Editors, early in this rebuttal document).  We have also addressed this issue in the Public Review (Reviewer #3 point 6). We agree with the reviewer that this comparison will be of wide interest to readers, given the potential insights into the biological roles of APBs and PNAs.

      For convenience, we copy/paste the relevant new paragraph of the Discussion here:

      “There are several similarities between PNAs and APBs. The interaction partner of PML located on both the telomeres and rDNA must be sumoylated, as the PML-SIM domain is essential for the formation of both APBs and PNAs (37,93). The PML IV isoform most efficiently forms APBs and also PNAs (16,37). PML clusters damaged telomeres into APBs, and we observe that several NORs converge in one PNA structure; thus, the PML-dependent clustering of damaged NORs is plausible. On the other hand, there is one critical difference between the otherwise broadly analogous APBs and PNAs. The process of ALT operates in transformed cancer cells that do not express the telomerase, thus enabling telomere maintenance, cell proliferation, and immortalization (94,95). The PNAs, on the other hand, were primarily detected in non-transformed cells, and their formation is linked to cell cycle arrest and establishment of senescence (31,36). It remains to be determined whether the formation of PNAs is positively involved in rDNA repair, resulting in a return of at least some PNA-forming cells to the cell cycle, or if they play a role in blocking the repair of DNA double-stranded breaks on rDNA, broadly analogous to the shelterin complex on telomeres during replicative senescence (96). We propose that the pro-senescent role of PNAs may contribute to the maintenance of rDNA stability, thereby limiting the potential of hazardous genomic instability and, hence, the risk of cellular transformation. Analogous to checkpoint responses and oncogene-induced senescence (97,98) the PNA-associated senescence might provide one aspect of the multifaceted cell-autonomous anti-cancer barrier, in this case guarding the integrity of the most vulnerable repetitive rDNA loci, possibly at the expense of accumulated cellular senescence-associated decline of functional tissues during aging.” 

      (10) Do PNAs mature/progress through the four distinct structures: bowl, to funnel, to balloon, and finally to PML-NDS. If true, this serves as a phenotypic read-out of damage induction (bowl) and repair (PML-NDs). It would suggest persistent unrepairable damage (0.56 or 0.75 uM doxorubicin) prevents repair leading to the formation of all the PNA structures except PML-NDs. While lower dose doxorubicin (0.375 uM) allows repair to occur, facilitating progression to the PML-ND state, which is then inhabited with B02. 

      Again, this is a very insightful comment. Indeed, as the Reviewer suggests and as we explained e.g., in our response to point 1 raised by this reviewer, PNA progresses through four distinct structures/maturation stages. Our results indicate that individual PNA subtypes are tied to specific processes. PNA bowl-type is linked to the recognition of rDNA damage on the nucleolar surface. The PNA of the funnel-type clusters several rDNA loci from the nucleolus into PML-NDS, which is the ultimate structure sequestering unrepaired rDNA away from the reactivated nucleolus.

      There is a negative correlation between doxorubicin dose and occurrence of PML-NDS, and, indeed, blocking HDR with BO2 combined with a lower doxorubicin dose results in a higher occurrence of all PNAs, including PML-NDS, emerged in the recovery phase. These findings indicate that the greater/more severe extent of rDNA damage, which is associated with RNAPI activity inhibition, is linked to PNAs types associated with RNAPI inhibition (originally published Imrichova et al. (doi: 10.18632/aging.102248.). In contrast, a milder degree of rDNA damage induces the formation of PMLNDS.

    1. Author response:

      The following is the authors’ response to the original reviews.

      Reviewer #1 (Public Review): 

      Summary: 

      In this work, the authors examine the activity and function of D1 and D2 MSNs in dorsomedial striatum (DMS) during an interval timing task. In this task, animals must first nose poke into a cued port on the left or right; if not rewarded after 6 seconds, they must switch to the other port. Critically, this task thus requires animals to estimate if at least 6 seconds have passed after the first nose poke - this is the key aspect of the task focused on here. After verifying that animals reliably estimate the passage of 6 seconds by leaving on average after 9 seconds, the authors examine striatal activity during this interval. They report that D1-MSNs tend to decrease activity, while D2-MSNs increase activity, throughout this interval. They suggest that this activity follows a drift-diffusion model, in which activity increases (or decreases) to a threshold after which a decision (to leave) is made. The authors next report that optogenetically inhibiting D1 or D2 MSNs, or pharmacologically blocking D1 and D2 receptors, increased the average wait time of the animals to 10 seconds on average. This suggests that both D1 and D2 neurons contribute to the estimate of time, with a decrease in their activity corresponding to a decrease in the rate of

      'drift' in their drift-diffusion model. Lastly, the authors examine MSN activity while pharmacologically inhibiting D1 or D2 receptors. The authors observe most recorded MSNs neurons decrease their activity over the interval, with the rate decreasing with D1/D2 receptor inhibition. 

      Major strengths: 

      The study employs a wide range of techniques - including animal behavioral training, electrophysiology, optogenetic manipulation, pharmacological manipulations, and computational modeling. The behavioral task used by the authors is quite interesting and a nice way to probe interval timing in rodents. The question posed by the authors - how striatal activity contributes to interval timing - is of importance to the field and has been the focus of many studies and labs; thus, this paper can meaningfully contribute to that conversation. The data within the paper is presented very clearly, and the authors have done a nice job presenting the data in a transparent manner (e.g., showing individual cells and animals). Overall, the manuscript is relatively easy to read and clear, with sufficient detail given in most places regarding the experimental paradigm or analyses used. 

      We are glad our main points came through to the reviewer.  

      Major weaknesses: 

      I perceive two major weaknesses. The first is the impact or contextualization of their results in terms of the results of the field more broadly. More specifically, it was not clear to me how the authors are interpreting the striatal activity in the context of what others have observed during interval timing tasks. In other words - what was the hypothesis going into this experiment? Does observing increasing/decreasing activity in D2 versus D1 support one model of interval timing over another, or does it further support a more specific idea of how DMS contributes to interval timing? Or was the main question that we didn't know if D2 or D1 neurons had differential activity during interval timing? 

      This is a helpful comment. Our hypothesis is that D1 and D2 MSNs had similar patterns of activity.  Our rationale is prior behavioral work from our group describing that blocking striatal D1 and D2 dopamine receptors had similar behavioral effects on interval timing (De Corte et al., 2019; Stutt et al., 2023), We rewrote our introduction with this idea in mind (Line 89)

      “We and others have found that striatal MSNs encode time across multiple intervals by time-dependent ramping activity or monotonic changes in firing rate across a temporal interval (Emmons et al., 2017; Gouvea et al., 2015; Mello et al., 2015; Wang et al., 2018). However, the respective roles of D2-MSNs and D1-MSNs are unknown. Past work has shown that disrupting either D2-dopamine receptors (D2) or D1-dopamine receptors (D1) powerfully impairs interval timing by increasing estimates of elapsed time (Drew et al., 2007; Meck, 2006). Similar behavioral effects were found with systemic (Stutt et al., 2024) or local dorsomedial striatal D2 or D1 disruption (De Corte et al., 2019a). These data lead to the hypothesis that D2 MSNs and D1 MSNs have similar patterns of ramping activity across a temporal interval. 

      We tested this hypothesis with a combination of optogenetics, neuronal ensemble recording, computational modeling, and behavioral pharmacology. We use a well-described mouse-optimized interval timing task (Balci et al., 2008; Bruce et al., 2021; Larson et al., 2022; Stutt et al., 2024; Tosun et al., 2016; Weber et al., 2023). Strikingly, optogenetic tagging of D2-MSNs and D1-MSNs revealed distinct neuronal dynamics, with D2-MSNs tending to increase firing over an interval and D1-MSNs tending to decrease firing over the same interval, similar to opposing movement dynamics (Cruz et al., 2022; Kravitz et al., 2010; Tecuapetla et al., 2016). MSN dynamics helped construct and constrain a four-parameter drift-diffusion computational model of interval timing, which predicted that disrupting either D2MSNs or D1-MSNs would increase interval timing response times. Accordingly, we found that optogenetic inhibition of either D2-MSNs or D1-MSNs increased interval timing response times. Furthermore, pharmacological blockade of either D2- or D1receptors also increased response times and degraded trial-by-trial temporal decoding from MSN ensembles. Thus, D2-MSNs and D1-MSNs have opposing temporal dynamics yet disrupting either MSN type produced similar effects on behavior. These data demonstrate how striatal pathways play complementary roles in elementary cognitive operations and are highly relevant for understanding the pathophysiology of human diseases and therapies targeting the striatum.”

      In the second, I felt that some of the conclusions suggested by the authors don't seem entirely supported by the data they present, or the data presented suggests a slightly more complicated story. Below I provide additional detail on some of these instances. 

      Regarding the results presented in Figures 2 and 3: 

      I am not sure the PC analysis adds much to the interpretation, and potentially unnecessarily complicates things. In particular, running PCA on a matrix of noisy data that is smoothed with a Gaussian will often return PCs similar to what is observed by the authors, with the first PC being a line up/down, the 2nd PC being a parabola that is up/down, etc. Thus, I'm not sure that there is much to be interpreted by the specific shape of the PCs here. 

      We are glad the reviewer raised this point. First, regarding the components in noisy data, what the reviewer says is correct, but usually, the variance explained by PC1 is small. This is the reason we include scree plots in our PC analysis (Fig 3B and Fig 6G). When we compare our PC1s to variance explained in random data, our PC1 variance is always stronger. We have now included this in our manuscript:

      First, we generated random data and examined how much variance PC1 might generate. 

      We added this to the methods (Line 634)

      “The variance of PC1 was empirically compared against data generated from 1000 iterations of data from random timestamps with identical bins and kernel density estimates. Average plots were shown with Gaussian smoothing for plotting purposes only.”

      These data suggested that our PC1 was stronger than that observed in random data (Line 183):

      “PCA identified time-dependent ramping activity as PC1 (Fig 3A), a key temporal signal that explained 54% of variance among tagged MSNs (Fig 3B; variance for PC1 p = 0.009 vs 46 (44-49)% variance for PC1 derived from random data; Narayanan, 2016).”

      And in the pharmacology data (Line 367):

      “The first component (PC1), which explained 54% of neuronal variance, exhibited “time-dependent ramping”, or monotonic changes over the 6 second interval immediately after trial start (Fig 6F-G; variance for PC1 p = 0.001 vs 46 (45-47)% variance in random data; Narayanan, 2016).”

      Second, we note that we have used this analysis extensively in the past, and PC1 has always been identified as a linear ramping in our work and in work by others (Line 179):

      “Work by our group and others has uniformly identified PC1 as a linear component among corticostriatal neuronal ensembles during interval timing (Bruce et al., 2021; Emmons et al., 2020, 2019, 2017; Kim et al., 2017a; Narayanan et al., 2013; Narayanan and Laubach, 2009; Parker et al., 2014; Wang et al., 2018).”

      Third, we find that PC1 is highly correlated to the GLM slope (Line 205):

      “Trial-by-trial GLM slope was correlated with PC1 scores in Fig 3A-C (PC1 scores vs. GLM slope r = -0.60, p = 10-8).”

      Fourth, our goal was not to heavily interpret PC1 – but to compare D1 vs. D2 MSNs, or compare population responses to D2/D1 pharmacology. We have now made this clear in introducing PCA analyses in the results (Line 177):

      “To quantify differences in D2-MSNs vs D1-MSNs, we turned to principal component analysis (PCA), a data-driven tool to capture the diversity of neuronal activity (Kim et al., 2017a).”

      Finally, despite these arguments the reviewer’s point is well taken. Accordingly, we have removed all analyses of PC2 from the manuscript which may have been overly interpretative. 

      We have now removed language that interpreted the components, and we now find the discussion of PC1 much more data-driven. We have also removed much of the advanced PC analysis in Figure S9. Given our extensive past work using this exact analysis of PC1, we think PCA adds a considerable amount to our manuscript justified as the reviewer suggested. 

      I think an alternative analysis that might be both easier and more informative is to compute the slope of the activity of each neuron across the 6 seconds. This would allow the authors to quantify how many neurons increase or decrease their activity much like what is shown in Figure 2.  

      We agree – we now do exactly this analysis in Figure 3D. We now clarify this in detail, using the reviewer’s language to the methods (Line 648):

      “To measure time-related ramping over the first 6 seconds of the interval, we used trial-by-trial generalized linear models (GLMs) at the individual neuron level in which the response variable was firing rate and the predictor variable was time in the interval or nosepoke rate (Shimazaki and Shinomoto, 2007). For each neuron, it’s time-related “ramping” slope was derived from the GLM fit of firing rate vs time in the interval, for all trials per neuron. All GLMs were run at a trial-by-trial level to avoid effects of trial averaging (Latimer et al., 2015) as in our past work (Bruce et al., 2021; Emmons et al., 2017; Kim et al., 2017b).”

      And to the results (Line 194):

      “To interrogate these dynamics at a trial-by-trial level, we calculated the linear slope of D2-MSN and D1-MSN activity over the first 6 seconds of each trial using generalized linear modeling (GLM) of effects of time in the interval vs trial-by-trial firing rate (Latimer et al., 2015).”

      Relatedly, it seems that the data shown in Figure 2D *doesn't* support the authors' main claim regarding D2/D1 MSNs increasing/decreasing their activity, as the trial-by-trial slope is near 0 for both cell types. 

      This likely refers to Figure 3D. The reviewer is correct that the changes in slope are small and near 0. Our goal was to show that D2-MSN and D1-MSN slopes were distinct – rather than increasing and decreasing. We have added this to the abstract (Line 46)

      “We found that D2-MSNs and D1-MSNs exhibited distinct dynamics over temporal intervals as quantified by principal component analyses and trial-by-trial generalized linear models.”

      We have clarified this idea in our hypothesis (Line 96):

      “These data led to the hypothesis that D2 MSNs and D1 MSNs have similar patterns of ramping activity across a temporal interval.”

      We have added this idea to the results (Line 194)

      “To interrogate these dynamics at a trial-by-trial level, we calculated the linear slope of D2-MSN and D1-MSN activity over the first 6 seconds of each trial using generalized linear modeling (GLM) of effects of time in the interval vs trial-by-trial firing rate (Latimer et al., 2015). Nosepokes were included as a regressor for movement. GLM analysis also demonstrated that D2-MSNs had significantly different slopes (-0.01 spikes/second (-0.10 – 0.10)), which were distinct from D1MSNs (-0.20 (-0.47– -0.06; Fig 3D; F = 8.9, p = 0.004 accounting for variance between mice (Fig S3B); Cohen’s d = 0.8; power = 0.98; no reliable effect of sex (F = 0.02, p = 0.88) or switching direction (F = 1.72, p = 0.19)). We found that D2-MSNs and D1-MSNs had significantly different slopes even when excluding outliers (4 outliers excluded outside of 95% confidence intervals; F = 7.51, p = 0.008 accounting for variance between mice) and when the interval was defined as the time between trial start and the switch response on a trial-by-trial basis for each neuron (F = 4.3, p = 0.04 accounting for variance between mice). Trial-by-trial GLM slope was correlated with PC1 scores in Fig 3A-C (PC1 scores vs. GLM slope r = -0.60, p = 108). These data demonstrate that D2-MSNs and D1-MSNs had distinct slopes of firing rate across the interval and were consistent with analyses of average activity and PC1, which exhibited time-related ramping.”

      And Line 215:

      “In summary, we used optogenetic tagging to record from D2-MSNs and D1-MSNs during interval timing. Analyses of average activity, PC1, and trial-by-trial firingrate slopes over the interval provide convergent evidence that D2-MSNs and D1MSNs had distinct and opposing dynamics during interval timing. These data provide insight into temporal processing by striatal MSNs.”

      And in the discussion (Line 415):

      “We describe how striatal MSNs work together in complementary ways to encode an elementary cognitive process, interval timing. Strikingly, optogenetic tagging showed that D2-MSNs and D1-MSNs had distinct dynamics during interval timing. “

      We have now included a new plot with box plots to make the differences in Figure 3D clear

      Other reviewers requested additional qualitative descriptions of our data, and we have referred to increases / decreases in this context. 

      Regarding the results in Figure 4: 

      The authors suggest that their data is consistent with a drift-diffusion model. However, it is unclear how well the output from the model fits the activity from neurons the authors recorded. Relatedly, it is unclear how the parameters were chosen for the D1/D2 versions of this model. I think that an alternate approach that would answer these questions is to fit the model to each cell, and then examine the best-fit parameters, as well as the ability of the model to predict activity on trials held out from the fitting process. This would provide a more rigorous method to identify the best parameters and would directly quantify how well the model captures the data. 

      We are glad the reviewer raised these points. Our goal was to use neuronal activity to fit behavioral activity, not the reverse. While we understand the reviewer’s point, we note that one behavioral output (switch time) can be encoded by many patterns of neuronal activity; thus, we are not sure we can use the model developed for behavior to fit diverse neuronal activity, or an ensemble of neurons. We have made this clear in the manuscript (Line 251):

      “Our model aimed to fit statistical properties of mouse behavioral responses while incorporating MSN network dynamics. However, the model does not attempt to fit individual neurons’ activity, because our model predicts a single behavioral parameter – switch time – that can be caused by the aggregation of diverse neuronal activity.”

      To attempt to do something close to what the reviewer suggested, we attempted to predict behavior directly from neuronal ensembles.  We have now made this clear in the methods on Line 682):

      “Analysis and modeling of mouse MSN-ensemble recordings. Our preliminary analysis found that, for sufficiently large number of neurons (𝑵 > 𝟏𝟏), each recorded ensemble of MSNs on a trial-by-trial basis could predict when mice would respond. We took the following approach: First, for each MSN, we convolved its trial-by-trial spike train 𝑺𝒑𝒌(𝒕) with a 1-second exponential kernel 𝑲(𝒕) = 𝒘 𝒆-𝒕/𝒘 if 𝒕 > 𝟎 and 𝑲(𝒕) = 𝟎 if 𝒕 ≤ 𝟎 (Zhou et al., 2018; here 𝒘 = 𝟏 𝒔). Therefore, the smoothed, convolved spiking activity of neuron 𝒋 (𝒋 = 𝟏, 𝟐, … 𝑵),

      tracks and accumulates the most recent (one second, in average) firing-rate history of the 𝒋-th MSN, up to moment 𝒕. We hypothesized that the ensemble activity

      (𝒙𝟏(𝒕), 𝒙𝟐(𝒕), … , 𝒙𝑵(𝒕)), weighted with some weights 𝜷𝒋 , could predict the trial switch time 𝒕∗ by considering the sum

      and the sigmoid 

      that approximates the firing rate of an output unit. Here parameter 𝒌   indicates how fast 𝒙(𝒕) crosses the threshold 0.5 coming from below (if 𝒌 > 𝟎) or coming from above (if 𝒌 < 𝟎) and relates the weights 𝜷𝒋 to the unknowns 𝜷H𝒋 \= 𝜷𝒋/𝒌 and 𝜷H𝟎 \= −𝟎. 𝟓/𝒌. Next, we ran a logistic fit for every trial for a given mouse over the spike count predictor matrix 7𝒙𝟏(𝒕), 𝒙𝟐(𝒕), … , 𝒙𝑵(𝒕)9 from the mouse MSN recorded ensemble, and observed value 𝒕∗, estimating the coefficients 𝜷H𝟎 and 𝜷H𝒋, and so, implicitly, the weights 𝜷𝒋. From there, we compute the predicted switch time 𝒕∗𝒑𝒓𝒆𝒅 by condition 𝒙(𝒕) = 𝟎. 𝟓. Accuracy was quantified comparing the predicted accuracy within a 1 second window to switch time on a trial-by-trial basis (Fig S4).

      And in the results (Line 254): 

      We first analyzed trial-based aggregated activity of MSN recordings from each mouse (𝒙𝒋(𝒕)) where 𝒋 = 𝟏, … , 𝑵 neurons. For D2-MSN or D1-MSN ensembles of 𝑵 > 𝟏𝟏, we found linear combinations of their neuronal activities, with some 𝜷𝒋 coefficients,

      that could predict the trial-by-trial switch response times (accuracy > 90%, Fig S4; compared with < 20% accuracy for Poisson-generated spikes of same trial-average firing rate). The predicted switch time 𝒕∗𝒑𝒓𝒆𝒅 was defined by the time when the weighted ensemble activity 𝒙(𝒕) first reached the value 𝒙) = 0.5. Finally, we built DDMs to account for this opposing trend (increasing vs decreasing) of MSN dynamics and for ensemble threshold behavior defining 𝒕∗𝒑𝒓𝒆𝒅; see the resulting model (Equations 1-3) and its simulations (Figure 4A-B).”

      And we have added a new figure, Figure S4, that demonstrates these trial-by-trial predictions of switch response times.  

      Note that we have included predictions from shuffled data similar to what the reviewer suggested based on shuffled data. Predictions are derived from neuronal ensembles on that trial; thus we could not apply a leave-one-out approach to trial-by-trial predictions.

      These models are highly predictive for larger ensembles and poorly predictive for smaller ensembles.  We think this model adds to the manuscript and we are glad the reviewer suggested it. 

      Relatedly, looking at the raw data in Figure 2, it seems that many neurons either fire at the beginning or end of the interval, with more neurons firing at the end, and more firing at the beginning, for D2/D1 neurons respectively. Thus, it's not clear to me whether the drift-diffusion model is a good model of activity. Or, perhaps the model is supposed to be related to the aggregate activity of all D1/D2 neurons? (If so, this should be made more explicit. The comment about fitting the model directly to the data also still stands).  

      Our model was inspired by the aggregate activity.  We have now made this clear in the results (Line 227): 

      “Our data demonstrate that D2-MSNs and D1-MSNs have opposite activity patterns. However, past computational models of interval timing have relied on drift-diffusion dynamics with a positive slope that accumulates evidence over time (Nguyen et al., 2020; Simen et al., 2011). To reconcile how these MSNs might complement to effect temporal control of action, we constructed a four-parameter drift-diffusion model (DDM). Our goal was to construct a DDM inspired by average differences in D2MSNs and D1-MSNs that predicted switch-response time behavior.”

      Further, it's unclear to me how, or why, the authors changed the specific parameters they used to model the optogenetic manipulation. Were these parameters chosen because they fit the manipulation data? This I don't think is in itself an issue, but perhaps should be clearly stated, because otherwise it sounds a bit odd given the parameter changes are so specific. It is also not clear to me why the noise in the diffusion process would be expected to change with increased inhibition. 

      We have clarified that our parameters were chosen to best fit behavior (Line 266):

      “The model’s parameters were chosen to fit the distribution of switch-response times:

      𝑭 = 𝟏, 𝒃 = 𝟎. 𝟓𝟐 (so 𝑻 = 𝟎. 𝟖𝟕), 𝑫 = 𝟎. 𝟏𝟑𝟓, 𝝈 = 𝟎. 𝟎𝟓𝟐 for intact D2-MSNs (Fig 4A, in black); and  𝑭 = 𝟎, 𝒃 = 𝟎. 𝟒𝟖 (so 𝑻 = 𝟎. 𝟏𝟑), 𝑫 = 𝟎. 𝟏𝟒𝟏, 𝝈 = 𝟎. 𝟎𝟓𝟐 for intact D1-MSNs (Fig 4B, in black).”

      Furthermore, we have clarified the approach to noise in the results (Line 247):  

      “The drift, together with noise 𝝃(𝒕) (of zero mean and strength 𝝈), leads to fluctuating accumulation which eventually crosses a threshold 𝑻 (see Equation 3; Fig 4A-B).”

      And Line 279: 

      “The results were obtained by simultaneously decreasing the drift rate D  (equivalent to lengthening the neurons’ integration time constant) and lowering the level of network noise 𝝈: D = 𝟎. 𝟏𝟐𝟗, 𝝈 = 𝟎. 𝟎𝟒𝟑 for D2-MSNs in Fig 4A (in red; changes in noise had to accompany changes in drift rate to preserve switch response time variance); and 𝑫 = 𝟎. 𝟏𝟐𝟐, 𝝈 = 𝟎. 𝟎𝟒𝟑  for D1-MSNs in Fig 4B (in blue). The model predicted that disrupting either D2-MSNs or D1-MSNs would increase switch response times (Fig 4C and Fig 4D) and would shift MSN dynamics.”

      Regarding the results in Figure 6: 

      My comments regarding the interpretation of PCs in Figure 2 apply here as well. In addition, I am not sure that examining PC2 adds much here, given that the authors didn't examine such nonlinear changes earlier in the paper. 

      We agree – we removed PC2 for these reasons. We have also noted that the primary reason for PC1 was to compare results of D2/D1 blockade (Line 362):

      “We noticed differences in MSN activity across the interval with D2 blockade and D1 blockade at the individual MSN level (Fig 6B-D) as well as at the population level (Fig 6E). We used PCA to quantify effects of D2 blockade or D1 blockade (Bruce et al., 2021; Emmons et al., 2017; Kim et al., 2017a). We constructed principal components (PC) from z-scored peri-event time histograms of firing rate from saline, D2 blockade, and D1 blockade sessions for all mice together. The first component (PC1), which explained 54% of neuronal variance, exhibited “timedependent ramping”, or monotonic changes over the 6 second interval immediately after trial start (Fig 6F-G; variance for PC1 p = 0.001 vs 46 (45-47)% variance in random data; Narayanan, 2016).”

      As noted above, PC1 does not explain this level of variance in noisy data.

      We also reworked Figure 6 to make the effects of D2 and D1 blockade more apparent by moving the matched sorting to the main figure: 

      A larger concern though that seems potentially at odds with the authors' interpretation is that there seems to be very little change in the firing pattern after D1 or D2 blockade. I see that in Figure 6F the authors suggest that many cells slope down (and thus, presumably, they are recoding more D1 cells), and that this change in slope is decreased, but this effect is not apparent in Figure 6C, and Figure 6B shows an example of a cell that seems to fire in the opposite direction (increase activity). I think it would help to show some (more) individual examples that demonstrate the summary effect shown by the authors, and perhaps the authors can comment on the robustness (or the variability) of this result. 

      These are important suggestions, we changed our analysis to better capture the variability and main effects in the data, exactly as the reviewer suggested. First, we now included 3 individual raster examples, exactly as the reviewer suggested

      As the reviewer suggested, we wanted to compare variability for *all* MSNs. We sorted the same MSNs across saline, D2 blockade, and D1 blockade sessions. We detailed these sorting details in the methods (Line 618):

      “Single-unit recordings were made using a multi-electrode recording system (Open

      Ephys, Atlanta, GA). After the experiments, Plexon Offline Sorter (Plexon, Dallas, TX), was used to remove artifacts. Principal component analysis (PCA) and waveform shape were used for spike sorting. Single units were defined as those 1) having a consistent waveform shape, 2) being a separable cluster in PCA space, and 3) having a consistent refractory period of at least 2 milliseconds in interspike interval histograms. The same MSNs were sorted across saline, D2 blockade, and D1 blockade sessions by loading all sessions simultaneously in Offline Sorter and sorted using the preceding criteria. MSNs had to have consistent firing in all sessions to be included. Sorting integrity across sessions was quantified by comparing waveform similarity via correlation coefficients between sessions.”

      To confirm that we were able to track neurons across sessions, we quantified waveform similarity (Line 353):

      “We analyzed 99 MSNs in sessions with saline, D2 blockade, and D1 blockade. We matched MSNs across sessions based on waveform and interspike intervals; waveforms were highly similar across sessions (correlation coefficient between matched MSN waveforms: saline vs D2 blockade r = 1.00 (0.99 – 1.00 rank sum vs correlations in unmatched waveforms p = 3x10-44; waveforms; saline vs D1 blockade r = 1.00 (1.00 – 1.00), rank sum vs correlations in unmatched waveforms p = 4x10-50). There were no consistent changes in MSN average firing rate with D2 blockade or D1 blockade (F = 1.1, p = 0.30 accounting for variance between MSNs; saline: 5.2 (3.3 – 8.6) Hz; D2 blockade 5.1 (2.7 – 8.0) Hz; F = 2.2, p = 0.14; D1 blockade 4.9 (2.4 – 7.8) Hz).”

      As noted above, this enabled us to compare activity for the same MSNs across sessions in a new Figure 6 (previously, this analysis had been in Figure S9), and used PCA to quantify this variability.

      By tracking neurons across saline, D2 blockade, and D1 blockade, readers can see all the variability in MSNs. We added these data to the results (Line 362):  

      “We noticed differences in MSN activity across the interval with D2 blockade and D1 blockade at the individual MSN level (Fig 6B-D) as well as at the population level (Fig 6E). We used PCA to quantify effects of D2 blockade or D1 blockade (Bruce et al., 2021; Emmons et al., 2017; Kim et al., 2017a). We constructed principal components (PC) from z-scored peri-event time histograms of firing rate from saline, D2 blockade, and D1 blockade sessions for all mice together. The first component (PC1), which explained 54% of neuronal variance, exhibited “timedependent ramping”, or monotonic changes over the 6 second interval immediately after trial start (Fig 6F-G; variance for PC1 p = 0.001 vs 46 (45-47)% variance in random data; Narayanan, 2016). Interestingly, PC1 scores shifted with D2 blockade (Fig 6F; PC1 scores for D2 blockade: -0.6 (-3.8 – 4.7) vs saline: -2.3 (-4.2 – 3.2), F = 5.1, p = 0.03 accounting for variance between MSNs; no reliable effect of sex (F = 0.2, p = 0.63) or switching direction (F = 2.8, p = 0.10)). PC1 scores also shifted with D1 blockade (Fig 6F; PC1 scores for D1 blockade: -0.0 (-3.9 – 4.5), F = 5.8, p = 0.02 accounting for variance between MSNs; no reliable effect of sex (F = 0.0, p = 0.93) or switching direction (F = 0.9, p = 0.34)). There were no reliable differences in PC1 scores between D2 and D1 blockade. Furthermore, PC1 was distinct even when sessions were sorted independently and assumed to be fully statistically independent (Figure S10; D2 blockade vs saline: F = 5.8, p = 0.02; D1 blockade vs saline: F = 4.9, p = 0.03; all analyses accounting for variance between mice). Higher components explained less variance and were not reliably different between saline and D2 blockade or D1 blockade. Taken together, this data-driven analysis shows that D2 and D1 blockade produced similar shifts in MSN population dynamics represented by PC1. When combined with the major contributions of D1/D2 MSNs to PC1 (Fig 3C) these findings indicate that pharmacological D2 blockade and D1 blockade disrupt ramping-related activity in the striatum.”

      Finally, we included the data in which sessions were sorted independently and assumed to be fully statistically independent in a new Figure S10.

      And in the results (Line 376): 

      “Furthermore, PC1 was distinct even when sessions were sorted independently and assumed to be fully statistically independent (Figure S10; D2 blockade vs saline: F = 5.8, p = 0.02; D1 blockade vs saline: F = 4.9, p = 0.03; all analyses accounting for variance between mice). Higher components explained less variance and were not reliably different between saline and D2 blockade or D1 blockade.”

      These changes strengthen the manuscript and better show the main effects and variability of the data. 

      Regarding the results in Figure 7: 

      I am overall a bit confused about what the authors are trying to claim here. In Figure 7, they present data suggesting that D1 or D2 blockade disrupts their ability to decode time in the interval of interest (0-6 seconds). However, in the final paragraph of the results, the authors seem to say that by using another technique, they didn't see any significant change in decoding accuracy after D1 or D2 blockade. What do the authors make of this? 

      This was very unclear. The second classifier was predicting response time, but it was confusing, and we removed it. 

      Impact: 

      The task and data presented by the authors are very intriguing, and there are many groups interested in how striatal activity contributes to the neural perception of time. The authors perform a wide variety of experiments and analysis to examine how DMS activity influences time perception during an interval-timing task, allowing for insight into this process. However, the significance of the key finding - that D2/D1 activity increases/ decreases with time - remains somewhat ambiguous to me. This arises from a lack of clarity regarding the initial hypothesis and the implications of this finding for advancing our understanding of striatal functions. 

      As noted above, we clarified our hypothesis and implications, and strengthened several aspects of the data as suggested by this reviewer.  

      Reviewer #2 (Public Review): 

      Summary: 

      In the present study, the authors investigated the neural coding mechanisms for D1- and D2expressing striatal direct and indirect pathway MSNs in interval timing by using multiple strategies. They concluded that D2-MSNs and D1-MSNs have opposing temporal dynamics yet disrupting either type produced similar effects on behavior, indicating the complementary roles of D1- and D2- MSNs in cognitive processing. However, the data was incomplete to fully support this major finding. One major reason is the heterogenetic responses within the D1-or D2MSN populations. In addition, there are additional concerns about the statistical methods used. For example, the majority of the statistical tests are based on the number of neurons, but not the number of mice. It appears that the statistical difference was due to the large sample size they used (n=32 D2-MSNs and n=41 D1-MSNs), but different neurons recorded in the same mouse cannot be treated as independent samples; they should use independent mouse-based statistical analysis. 

      Strengths: 

      The authors used multiple approaches including awake mice behavior training, optogeneticassistant cell-type specific recording, optogenetic or pharmacological manipulation, neural computation, and modeling to study neuronal coding for interval timing. 

      We appreciate the reviewer’s careful read recognizing the breadth of our approach.  

      Weaknesses: 

      (1) More detailed behavior results should be shown, including the rate of the success switches, and how long it takes to wait in the second nose poke to get a reward. For line 512 and the Figure 1 legend, the reviewer is not clear about the reward delivery. The methods appear to state that the mouse had to wait for 18s, then make nose pokes at the second port to get the reward. What happens if the mouse made the second nose poke before 18 seconds, but then exited? Would the mouse still get the reward at 18 seconds? Similarly, what happens if the mice made the third or more nosepokes within 18 seconds? It is important to clarify because, according to the method described, if the mice made a second nose poke before 18 seconds, this already counted as the mouse making the "switch." Lastly, what if the mice exited before 6s in the first nosepoke? 

      We completely agree. We have now completely revised Figure 1 to include many of these task details.

      We have clarified remaining details in the methods (Line 548):

      “Interval timing switch task. We used a mouse-optimized operant interval timing task described in detail previously (Balci et al., 2008; Bruce et al., 2021; Tosun et al., 2016; Weber et al., 2023). Briefly, mice were trained in sound-attenuating operant chambers, with two front nosepokes flanking either side of a food hopper on the front wall, and a third nosepoke located at the center of the back wall. The chamber was positioned below an 8-kHz, 72-dB speaker (Fig 1A; MedAssociates, St. Albans, VT). Mice were 85% food restricted and motivated with 20 mg sucrose pellets (BioServ, Flemington, NJ). Mice were initially trained to receive rewards during fixed ratio nosepoke response trials. Nosepoke entry and exit were captured by infrared beams. After shaping, mice were trained in the “switch” interval timing task. Mice self-initiated trials at the back nosepoke, after which tone and nosepoke lights were illuminated simultaneously. Cues were identical on all trial types and lasted the entire duration of the trial (6 or 18 seconds). On 50% of trials, mice were rewarded for a nosepoke after 6 seconds at the designated first ‘front’ nosepoke; these trials were not analyzed. On the remaining 50% of trials, mice were rewarded for nosepoking first at the ‘first’ nosepoke location and then switching to the ‘second’ nosepoke location; the reward was delivered for initial nosepokes at the second nosepoke location after 18 seconds when preceded by a nosepoke at the first nosepoke location.  Multiple nosepokes at each nosepokes were allowed. Early responses at the first or second nosepoke were not reinforced. Initial responses at the second nosepoke rather than the first nosepoke, alternating between nosepokes, going back to the first nosepoke after the second nosepoke were rare after initial training. Error trials included trials where animals responded only at the first or second nosepoke and were also not reinforced. We did not analyze error trials as they were often too few to analyze; these were analyzed at length in our prior work (Bruce et al., 2021).

      Switch response time was defined as the moment animals departed the first nosepoke before arriving at the second nosepoke. Critically, switch responses are a time-based decision guided by temporal control of action because mice switch nosepokes only if nosepokes at the first location did not receive a reward after 6 seconds. That is, mice estimate if more than 6 seconds have elapsed without receiving a reward to decide to switch responses. Mice learn this task quickly (3-4 weeks), and error trials in which an animal nosepokes in the wrong order or does not nosepoke are relatively rare and discarded. Consequently, we focused on these switch response times as the key metric for temporal control of action. Traversal time was defined as the duration between first nosepoke exit and second nosepoke entry and is distinct from switch response time when animals departed the first nosepoke. Nosepoke duration was defined as the time between first nosepoke entry and exit for the switch response times only. Trials were self-initiated, but there was an intertrial interval with a geometric mean of 30 seconds between trials.”

      And in the results on Line 131: 

      “We investigated cognitive processing in the striatum using a well-described mouseoptimized interval timing task which requires mice to respond by switching between two nosepokes after a 6-second interval (Fig 1A; see Methods; (Balci et al., 2008; Bruce et al., 2021; Larson et al., 2022; Tosun et al., 2016; Weber et al., 2023)). In this task, mice initiate trials by responding at a back nosepoke, which triggers auditory and visual cues for the duration of the trial. On 50% of trials, mice were rewarded for nosepoking after 6 seconds at the designated ‘first’ front nosepoke; these trials were not analyzed. On the remaining 50% of trials, mice were rewarded for nosepoking at the ‘first’ nosepoke and then switching to the ‘second’ nosepoke; initial nosepokes at the second nosepoke after 18 seconds triggered reward when preceded by a first nosepoke. The first nosepokes occurred before switching responses and the second nosepokes occurred much later in the interval in anticipation of reward delivery at 18 seconds (Fig 1B-D). During the task, movement velocity peaked before 6 seconds as mice traveled to the front nosepoke (Fig 1E).

      We focused on the switch response time, defined as the moment mice exited the first nosepoke before entering the second nosepoke. Switch responses are a timebased decision guided by temporal control of action because mice switch nosepokes only if nosepoking at the first nosepokes does not lead to a reward after 6 seconds (Fig 1B-E). Switch responses are guided by internal estimates of time because no external cue indicates when to switch from the first to the second nosepoke (Balci et al., 2008; Bruce et al., 2021; Tosun et al., 2016; Weber et al., 2023). We defined the first 6 seconds after trial start as the ‘interval’, because during this epoch mice are estimating whether 6 seconds have elapsed and if they need to switch responses. In 30 mice, switch response times were 9.3 seconds (8.4 – 9.7; median (IQR)); see Table 1 for a summary of mice, experiments, trials, and sessions). We studied dorsomedial striatal D2-MSNs and D1-MSNs using a combination of optogenetics and neuronal ensemble recordings in 9 transgenic mice (4 D2-Cre mice switch response time 9.7 (7.0 – 10.3) seconds; 5 D1-Cre mice switch response time 8.2 (7.7 – 8.7) seconds; rank sum p = 0.73; Table 1).”

      (2) There are a lot of time parameters in this behavior task, the description of those time parameters is mentioned in several parts, in the figure legend, supplementary figure legend, and methods, but was not defined clearly in the main text. It is inconvenient, sometimes, confusing for the readers. The authors should make a schematic diagram to illustrate the major parameters and describe them clearly in the main text. 

      We agree. We have clarified this in a new schematic, shading the interval in gray:   

      And in the results on line 131:

      “We focused on the switch response time, defined as the moment mice exited the first nosepoke before entering the second nosepoke. Switch responses are a time-based decision guided by temporal control of action because mice switch nosepokes only if nosepoking at the first nosepokes does not lead to a reward after 6 seconds (Fig 1BE). Switch responses are guided by internal estimates of time because no external cue indicates when to switch from the first to the second nosepoke (Balci et al., 2008; Bruce et al., 2021; Tosun et al., 2016; Weber et al., 2023). We defined the first 6 seconds after trial start as the ‘interval’, because during this epoch mice are estimating whether 6 seconds have elapsed and if they need to switch responses. In 30 mice, switch response times were 9.3 seconds (8.4 – 9.7; median (IQR)); see Table 1 for a summary of mice, experiments, trials, and sessions). We studied dorsomedial striatal D2-MSNs and D1-MSNs using a combination of optogenetics and neuronal ensemble recordings in 9 transgenic mice (4 D2-Cre mice switch response time 9.7

      (7.0 – 10.3) seconds; 5 D1-Cre mice switch response time 8.2 (7.7 – 8.7) seconds; rank sum p = 0.73; Table 1).”

      (3) In Line 508, the reviewer suggests the authors pay attention to those trials without "switch". It would be valuable to compare the MSN activity between those trials with or without a "switch". 

      This is a great suggestion. We analyzed such error trials and MSN activity in Figure 6 of Bruce et al., 2021. However, this manuscript was not designed to analyze errors, as they are rare beyond initial training (Bruce et al., 2021 focused on early training), and too inconsistent to permit robust analysis. This was added to the methods on Line 567:

      “Early responses at the first or second nosepoke were not reinforced. Initial responses at the second nosepoke rather than the first nosepoke, alternating between nosepokes, going back to the first nosepoke after the second nosepoke were rare after initial training. Error trials included trials where animals responded only at the first or second nosepoke and were also not reinforced. We did not analyze error trials as they were often too few to analyze; these were analyzed at length in our prior work (Bruce et al., 2021).”

      (4) The definition of interval is not very clear. It appears that the authors used a 6-second interval in analyzing the data in Figure 2 and Figure 3. But from my understanding, the interval should be the time from time "0" to the "switch", when the mice start to exit from the first nose poke. 

      We have now defined it explicitly in the schematic: 

      Incidentally, this reviewer asked us to analyze a longer epoch – this analysis beautifully justifies our focus on the first 6 seconds (now in Figure S2).

      We focus on the first six seconds as there are few nosepokes and switch responses during this epoch; however, we consider the reviewer’s definition and analyze the epoch the reviewer suggests from 0 to the switch in analyses below. 

      (5) For Figure 2 C-F, the authors only recorded 32 D2-MSNs in 4 mice, and 41 D1-MSNs in 5 mice. The sample size is too small compared to the sample size usually used in the field. In addition to the small sample size, the single-cell activity exhibited heterogeneity, which created potential issues. 

      We are glad the reviewer raised these points. First, our tagging dataset is relatively standard for optogenetic tagging. Second, we now include Cohen’s d for both PC and slope results for all optogenetic tagging analysis, which demonstrate that we have adequate statistical power and medium-to-large effect sizes (Line 186): 

      “In line with population averages from Fig 2G&H, D2-MSNs and D1-MSNs had opposite patterns of activity with negative PC1 scores for D2-MSNs and positive PC1 scores for D1-MSNs (Fig 3C; PC1 for D2-MSNs: -3.4 (-4.6 – 2.5); PC1 for D1MSNs: 2.8 (-2.8 – 4.9); F = 8.8, p = 0.004 accounting for variance between mice (Fig S3A); Cohen’s d = 0.7; power = 0.80; no reliable effect of sex (F = 0.44, p = 0.51) or switching direction (F = 1.73, p = 0.19)).”

      And Line 197:

      “GLM analysis also demonstrated that D2-MSNs had significantly different slopes (0.01 spikes/second (-0.10 – 0.10)), which were distinct from D1-MSNs (-0.20 (-0.47– 0.06; Fig 3D; F = 8.9, p = 0.004 accounting for variance between mice (Fig S3B); Cohen’s d = 0.8; power = 0.98; no reliable effect of sex (F = 0.02, p = 0.88) or switching direction (F = 1.72, p = 0.19)).”

      We added boxplots to Figure 3, which better highlight differences in these distributions.

      However, the reviewer’s point is well-taken, and we have added a caveat to the discussion exactly as the reviewer suggested (Line 496):

      “Second, although we had adequate statistical power and medium-to-large effect sizes, optogenetic tagging is low-yield, and it is possible that recording more of these neurons would afford greater opportunity to identify more robust results and alternative coding schemes, such as neuronal synchrony.”

      For both D1 and D2 MSNs, the authors tried to make conclusions on the "trend" of increasing in D2-MSNs and decreasing in D1-MSNs populations, respectively, during the interval. However, such a conclusion is not sufficiently supported by the data presented. It looks like the single-cell activity patterns can be separated into groups: one is a decreasing activity group, one is an increasing activity group and a small group for on and off response. Because of the small sample size, the author should pay attention to the variance across different mice (which needs to be clearly presented in the manuscript), instead of pooling data together and analyzing the mean activity. 

      We were not clear – we now do exactly as the reviewer suggested. We are not pooling any data – instead – as we state on line 620 - we are using linear-mixed effects models to account for mouse-specific and neuron-specific variance. This approach was developed with our statistics core for exactly the reasons the reviewer suggested (see letter). We state this explicitly in the methods (Line 704):

      “Statistics. All data and statistical approaches were reviewed by the Biostatistics,

      Epidemiology, and Research Design Core (BERD) at the Institute for Clinical and Translational Sciences (ICTS) at the University of Iowa. All code and data are made available at http://narayanan.lab.uiowa.edu/article/datasets. We used the median to measure central tendency and the interquartile range to measure spread. We used Wilcoxon nonparametric tests to compare behavior between experimental conditions and Cohen’s d to calculate effect size. Analyses of putative single-unit activity and basic physiological properties were carried out using custom routines for MATLAB.

      For all neuronal analyses, variability between animals was accounted for using generalized linear-mixed effects models and incorporating a random effect for each mouse into the model, which allows us to account for inherent between-mouse variability. We used fitglme in MATLAB and verified main effects using lmer in R. We accounted for variability between MSNs in pharmacological datasets in which we could match MSNs between saline, D2 blockade, and D1 blockade. P values < 0.05 were interpreted as significant.”

      We have now stated in the results that we are explicitly accounting for variance between mice (Line 186): 

      “In line with population averages from Fig 2G&H, D2-MSNs and D1-MSNs had opposite patterns of activity with negative PC1 scores for D2-MSNs and positive PC1 scores for D1-MSNs (Fig 3C; PC1 for D2-MSNs: -3.4 (-4.6 – 2.5); PC1 for D1MSNs: 2.8 (-2.8 – 4.9); F = 8.8, p = 0.004 accounting for variance between mice (Fig S3A); Cohen’s d = 0.7; power = 0.80; no reliable effect of sex (F = 0.44, p = 0.51) or switching direction (F = 1.73, p = 0.19)).”

      And on Line 197:

      “GLM analysis also demonstrated that D2-MSNs had significantly different slopes (0.01 spikes/second (-0.10 – 0.10)), which were distinct from D1-MSNs (-0.20 (-0.47– 0.06; Fig 3D; F = 8.9, p = 0.004 accounting for variance between mice (Fig S3B); Cohen’s d = 0.8; power = 0.98; no reliable effect of sex (F = 0.02, p = 0.88) or switching direction (F = 1.72, p = 0.19)).”

      All statistics in the manuscript now explicitly account for variance between mice. 

      This is the approach that was recommended by our the Biostatistics, Epidemiology, and

      Research Design Core (BERD) at the Institute for Clinical and Translational Sciences (ICTS) at the University of Iowa, who reviews all of our work.

      We note that these Cohen d values usually interpret as medium or large. 

      We performed statistical power calculations and include these to aid readers’ interpretation. These are all >0.8. 

      Finally, the reviewer uses the word ‘trend’. We define p values <0.05 as significant in the methods, and do not interpret trends (on line 717): 

      “P values < 0.05 were interpreted as significant.”

      And, we have now plotted values for each mouse in a new Figure S3.

      As noted in the figure legend, mouse-specific effects were analyzed using linear models that account for between-mouse variability, as discussed with our statisticians. However, the reviewer’s point is well taken, and we have added this idea to the discussion as suggested (Line 496):

      “Second, although we had adequate statistical power and medium-to-large effect sizes, optogenetic tagging is low-yield, and it is possible that recording more of these neurons would afford greater opportunity to identify more robust results and alternative coding schemes, such as neuronal synchrony.”

      (6) For Figure 2, from the activity in E and F, it seems that the activity already rose before the trial started, the authors should add some longer baseline data before time zero for clarification and comparison and show the timing of the actual start of the activity with the corresponding behavior. What behavior states are the mice in when initiating the activity? 

      This is a key point. First, we are not certain what state the animal is in until they initiate trials at the back nosepoke (“Start”). Therefore, we cannot analyze this epoch.  

      However, we can show neuronal activity during a longer epoch exactly as the reviewer suggested. Although there are modulations, the biggest difference between D2 and D1 MSNs is during the 0-6 second interval. This analysis supports our focus on the 0-6 second interval. We have included this as a new Figure S2.

      (7) The authors were focused on the "switch " behavior in the task, but they used an arbitrary 6s time window to analyze the activity, and tried to correlate the decreasing or increasing activities of MSNs to the neural coding for time. A better way to analyze is to sort the activity according to the "switch" time, from short to long intervals. This way, the authors could see and analyze whether the activity of D1 or D2 MSNs really codes for the different length of interval, instead of finding a correlation between average activity trends and the arbitrary 6s time window. 

      This is a great suggestion. We did exactly this and adjusted our linear models on a trialby-trial basis to account for time between the start of the interval and the switch. This is now added to the methods (line 656): 

      “We performed additional sensitivity analysis excluding outliers and measuring firing rate from the start of the interval to the time of the switch response on a trialby-trial level for each neuron.”

      And to the results (Line 201):

      “We found that D2-MSNs and D1-MSNs had a significantly different slope even when excluding outliers (4 outliers excluded outside of 95% confidence intervals; F=7.51, p=0.008 accounting for variance between mice) and when the interval was defined as the time between trial start and the switch response on a trial-by-trial basis for each neuron (F=4.3, p=0.04 accounting for variance between mice).”

      We now state our justification for focusing on the first 6 seconds of the interval (Line 134)

      “Switch responses are guided by internal estimates of time and temporal control of action because no external cue indicates when to switch from the first to the second nosepoke (Balci et al., 2008; Bruce et al., 2021; Tosun et al., 2016; Weber et al., 2023). We defined the first 6 seconds after trial start as the ‘interval’, because during this epoch mice are estimating whether 6 seconds have elapsed and if they need to switch responses.”

      As noted previously, epoch is now justified by Figure S2E.

      And we note that this focus minimizes motor confounds (Line 511):

      “Four lines of evidence argue that our findings cannot be directly explained by motor confounds: 1) D2-MSNs and D1-MSNs diverge between 0-6 seconds after trial start well before the first nosepoke (Fig S2), 2) our GLM accounted for nosepokes and nosepoke-related βs were similar between D2-MSNs and D1-MSNs, 3) optogenetic disruption of dorsomedial D2-MSNs and D1-MSNs did not change task-specific movements despite reliable changes in switch response time, and 4) ramping dynamics were quite distinct from movement dynamics. Furthermore, disrupting D2-MSNs and D1-MSNs did not change the number of rewards animals received, implying that these disruptions did not grossly affect motivation. Still, future work combining motion tracking with neuronal ensemble recording and optogenetics and including bisection tasks may further unravel timing vs. movement in MSN dynamics (Robbe, 2023).”

      We are glad the reviewer suggested this analysis as it strengthens our manuscript.  

      Reviewer #3 (Public Review): 

      Summary: 

      The cognitive striatum, also known as the dorsomedial striatum, receives input from brain regions involved in high-level cognition and plays a crucial role in processing cognitive information. However, despite its importance, the extent to which different projection pathways of the striatum contribute to this information processing remains unclear. In this paper, Bruce et al. conducted a study using a range of causal and correlational techniques to investigate how these pathways collectively contribute to interval timing in mice. Their results were consistent with previous research, showing that the direct and indirect striatal pathways perform opposing roles in processing elapsed time. Based on their findings, the authors proposed a revised computational model in which two separate accumulators track evidence for elapsed time in opposing directions. These results have significant implications for understanding the neural mechanisms underlying cognitive impairment in neurological and psychiatric disorders, as disruptions in the balance between direct and indirect pathway activity are commonly observed in such conditions. 

      Strengths: 

      The authors employed a well-established approach to study interval timing and employed optogenetic tagging to observe the behavior of specific cell types in the striatum. Additionally, the authors utilized two complementary techniques to assess the impact of manipulating the activity of these pathways on behavior. Finally, the authors utilized their experimental findings to enhance the theoretical comprehension of interval timing using a computational model. 

      We are grateful for the reviewer’s consideration of our work and for recognizing the strengths of our approach.  

      Weaknesses: 

      The behavioral task used in this study is best suited for investigating elapsed time perception, rather than interval timing. Timing bisection tasks are often employed to study interval timing in humans and animals.

      This is a key point, and the reviewer is correct. We use our task because of its’ translational validity; as far as we know, temporal bisection tasks have been used less often in human disease and in rodent models. We have included a new paragraph describing this in the discussion (Line 472):

      “Because interval timing is reliably disrupted in human diseases of the striatum such as Huntington’s disease, Parkinson’s disease, and schizophrenia (Hinton et al., 2007; Singh et al., 2021; Ward et al., 2011), these results have relevance to human disease. Our task version has been used extensively to study interval timing in mice and humans (Balci et al., 2008; Bruce et al., 2021; Stutt et al., 2024; Tosun et al., 2016; Weber et al., 2023). However, temporal bisection tasks, in which animals hold during a temporal cue and respond at different locations depending on cue length, have advantages in studying how animals time an interval because animals are not moving while estimating cue duration (Paton and Buonomano, 2018; Robbe, 2023; Soares et al., 2016). Our interval timing task version – in which mice switch between two response nosepokes to indicate their interval estimate has elapsed – has been used extensively in rodent models of neurodegenerative disease (Larson et al., 2022; Weber et al., 2024, 2023; Zhang et al., 2021), as well as in humans (Stutt et al., 2024). Furthermore, because many therapeutics targeting dopamine receptors are used clinically, these findings help describe how dopaminergic drugs might affect cognitive function and dysfunction. Future studies of D2-MSNs and D1-MSNs in temporal bisection and other timing tasks may further clarify the relative roles of D2- and D1-MSNs in interval timing and time estimation.”

      Furthermore, we have modified the use of the definition of interval timing in the abstract, introduction, and results to reflect the reviewers comment. For instance, in the abstract (Line 43):

      “We studied dorsomedial striatal cognitive processing during interval timing, an elementary cognitive task that requires mice to estimate intervals of several seconds and involves working memory for temporal rules as well as attention to the passage of time.”

      However, we think it is important to use the term ‘interval timing’ as it links to past work by our group and others.   

      The main results from unit recording (opposing slopes of D1/D2 cell firing rate, as shown in Figure 3D) appear to be very sensitive to a couple of outlier cells, and the predictive power of ensemble recording seems to be only slightly above chance levels. 

      This is a key point raised by other reviewers as well. We have now included measures of statistical power (as we interpret the reviewer’s comment of predictive power), effect size, and perform additional sensitivity analyses (Line 187): 

      “PC1 scores for D1-MSNs (Fig 3C; PC1 for D2-MSNs: -3.4 (-4.6 – 2.5); PC1 for D1MSNs: 2.8 (-4.9 – -2.8); F=8.8, p = 0.004 accounting for variance between mice (Fig S3A);  Cohen’s d = 0.7; power = 0.80; no reliable effect of sex (F=1.9, p=0.17) or switching direction (F=0.1, p=0.75)).”

      And on Line 197:

      “GLM analysis also demonstrated that D2-MSNs had significantly different slopes (0.01 spikes/second (-0.10 – 0.10)), which were distinct from D1-MSNs (-0.20 (-0.45– 0.06; Fig 3D; F=8.9, p = 0.004 accounting for variance between mice (Fig S3B); Cohen’s d = 0.8; power = 0.98).  We found that D2-MSNs and D1-MSNs had a significantly different slope even when excluding outliers (4 outliers excluded outside of 95% confidence intervals; F=7.51, p=0.008 accounting for variance between mice) and when the interval was defined as the time between trial start and the switch response on a trial-by-trial basis for each neuron (F=4.3, p=0.04 accounting for variance between mice).”

      These are medium-to-large Cohen’s d results, and we have adequate statistical power. These results are not easily explained by chance. 

      We also added boxplots, which highlight the differences in distribution.

      Finally, we note that our conclusions are drawn from many convergent analyses (on Line 216): 

      “Analyses of average activity, PC1, and trial-by-trial firing-rate slopes over the interval provide convergent evidence that D2-MSNs and D1-MSNs had distinct and opposing dynamics during interval timing.”

      In the optogenetic experiment, the laser was kept on for too long (18 seconds) at high power (12 mW). This has been shown to cause adverse effects on population activity (for example, through heating the tissue) that are not necessarily related to their function during the task epochs. 

      This is an important point. We are well aware of heating effects with optogenetics and other potential confounds. For the exact reasons noted by the reviewer, we had opsinnegative controls – where the laser was on for the exact same amount of time (18 seconds) and at the same power (12 mW)– in Figure S5. We have now better highlighted these controls in the methods (Line 598):

      “In animals injected with optogenetic viruses, optical inhibition was delivered via bilateral patch cables for the entire trial duration of 18 seconds via 589-nm laser light at 12 mW power on 50% of randomly assigned trials. We performed control experiments in mice without opsins using identical laser parameters in D2-cre or D1-cre mice (Fig S6).”

      And in results (Line 298):

      “Importantly, we found no reliable effects for D2-MSNs with opsin-negative controls (Fig S6).”

      And Line 306): 

      “As with D2-MSNs, we found no reliable effects with opsin-negative controls in D1MSNs (Fig S6).”

      We have highlighted these data in Figure S6: 

      Furthermore, the effect of optogenetic inhibition is similar to pharmacological effects in this manuscript and in our prior work (De Corte et al., 2019; Stutt et al., 2024) on line 459): 

      “Past pharmacological work from our group and others has shown that disrupting D2- or D1-MSNs slows timing (De Corte et al., 2019b; Drew et al., 2007, 2003; Stutt et al., 2024), in line with pharmacological and optogenetic results in this manuscript.”

      And in the discussion section on Line 488: 

      “Our approach has several limitations. First, systemic drug injections block D2- and D1-receptors in many different brain regions, including the frontal cortex, which is involved in interval timing (Kim et al., 2017a). D2 blockade or D1 blockade may have complex effects, including corticostriatal or network effects that contribute to changes in D2-MSN or D1-MSN ensemble activity. We note that optogenetic inhibition of D2-MSNs and D1-MSNs produces similar effects to pharmacology in Figure 5.”

      Given the systemic delivery of pharmacological interventions, it is difficult to conclude that the effects are specific to the dorsomedial striatum. Future studies should use the local infusion of drugs into the dorsomedial striatum. 

      This is a great point - we did this experiment in De Corte et al, 2019 with local drug infusions. This earlier study was the departure point for this experiment. We now point this out in the introduction (Line 92): 

      “Past work has shown that disrupting either D2-dopamine receptors (D2) or D1dopamine receptors (D1) powerfully impairs interval timing by increasing estimates of elapsed time (Drew et al., 2007; Meck, 2006). Similar behavioral effects were found with systemic (Stutt et al., 2024) or local dorsomedial striatal D2 or D1 disruption (De Corte et al., 2019a). These data lead to the hypothesis that D2 MSNs and D1 MSNs have similar patterns of ramping activity across a temporal interval.”

      However, the reviewer makes a great point - and we will develop this in our future work (Line 485): 

      “Future studies might extend our work combining local pharmacology with neuronal ensemble recording.”

      Recommendations for the authors:

      Reviewer #1 (Recommendations For The Authors): 

      Just a few minor notes: 

      (1) Figures 2C and D should have error bars. 

      We agree.  We added error bars to these figures and other rasters as recommended.  

      (2) Figures 2G and H seem to be smoothed - how was this done? 

      We added these details.

      (3) It is unclear what the 'neural network machine learning classifier' mentioned in lines 193-199 adds if the data relevant to this analysis isn't presented. I would potentially include this. 

      We agree. This analysis was confusing and not relevant to our main points; consequently, we removed it.  

      Reviewer #2 (Recommendations For The Authors): 

      Major: 

      (1)  For Figure 2, the description of the main results in (C-F) in the main text is too brief and is not clear. 

      We have added to and clarified this text (Line 147)

      “Striatal neuronal populations are largely composed of MSNs expressing D2dopamine or D1-dopamine receptors. We optogenetically tagged D2-MSNs and D1MSNs by implanting optrodes in the dorsomedial striatum and conditionally expressing channelrhodopsin (ChR2; Fig S1) in 4 D2-Cre (2 female) and 5 D1-Cre transgenic mice (2 female). This approach expressed ChR2 in D2-MSNs or D1MSNs, respectively (Fig 2A-B; Kim et al., 2017a). We identified D2-MSNs or D1MSNs by their response to brief pulses of 473 nm light; neurons that fired within 5 milliseconds were considered optically tagged putative D2-MSNs (Fig S1B-C). We tagged 32 putative D2-MSNs and 41 putative D1-MSNs in a single recording session during interval timing. There were no consistent differences in overall firing rate between D2-MSNs and D1-MSNs (D2-MSNs: 3.4 (1.4 – 7.2) Hz; D1-MSNs 5.2 (3.1 – 8.6) Hz; F = 2.7, p = 0.11 accounting for variance between mice). Peri-event rasters and histograms from a tagged putative D2-MSN (Fig 2C) and from a tagged putative D1-MSN (Fig 2D) demonstrate prominent modulations for the first 6 seconds of the interval after trial start. Z-scores of average peri-event time histograms (PETHs) from 0 to 6 seconds after trial start for each putative D2-MSN are shown in Fig 2E and for each putative D1-MSN in Fig 2F. These PETHs revealed that for the 6-second interval immediately after trial start, many putative D2-MSN neurons appeared to ramp up while many putative D1-MSNs appeared to ramp down. For 32 putative D2-MSNs average PETH activity increased over the 6second interval immediately after trial start, whereas for 41 putative D1-MSNs, average PETH activity decreased. These differences resulted in distinct activity early in the interval (0-1 seconds; F = 6.0, p = 0.02 accounting for variance between mice), but not late in the interval (5-6 seconds; F = 1.9, p = 0.17 accounting for variance between mice) between D2-MSNs and D1-MSNs. Examination of a longer interval of 10 seconds before to 18 seconds after trial start revealed the greatest separation in D2-MSN and D1-MSN dynamics during the 6-second interval after trial start (Fig S2). Strikingly, these data suggest that D2-MSNs and D1-MSNs might display opposite dynamics during interval timing.”

      (2)  For Figure3 

      (A)  Is the PC1 calculated from all MSNs of all mice (4 D2, 5 D1 mice)? 

      We clarified this (Line 182):

      “We analyzed PCA calculated from all D2-MSNs and D1-MSNs PETHs over the 6second interval immediately after trial start.”

      And for pharmacology (Line 362): 

      “We noticed differences in MSN activity across the interval with D2 blockade and D1 blockade at the individual MSN level (Fig 6B-D) as well as at the population level (Fig 6E). We used PCA to quantify effects of D2 blockade or D1 blockade (Bruce et al., 2021; Emmons et al., 2017; Kim et al., 2017a). We constructed principal components (PC) from z-scored peri-event time histograms of firing rate from saline, D2 blockade, and D1 blockade sessions for all mice together.”

      (B)  The authors should perform PCA on single mouse data, and add the plot and error bar. 

      This is a great idea. We have now included this as a new Figure S3:   

      (C)  As mentioned before, both D2-or D1- MSNs can be divided into three groups, it is not appropriate to put them together as each MSN is not an independent variable, the authors should do the statistics based on the individual mouse, and do the parametric or non-parametric comparison, and plot N (number of mice) based error bars. 

      We have done exactly this using a linear mixed effects model, as recommend by our statistics core. They have explicitly suggested that this is the best approach to these data (see letter). We have also included measures of statistical power and effect size (Line 704):  

      “All data and statistical approaches were reviewed by the Biostatistics, Epidemiology, and Research Design Core (BERD) at the Institute for Clinical and Translational Sciences (ICTS) at the University of Iowa. All code and data are made available at http://narayanan.lab.uiowa.edu/article/datasets. We used the median to measure central tendency and the interquartile range to measure spread. We used Wilcoxon nonparametric tests to compare behavior between experimental conditions and Cohen’s d to calculate effect size. Analyses of putative single-unit activity and basic physiological properties were carried out using custom routines for MATLAB.

      For all neuronal analyses, variability between animals was accounted for using generalized linear-mixed effects models and incorporating a random effect for each mouse into the model, which allows to account for inherent between-mouse variability. We used fitglme in MATLAB and verified main effects using lmer in R. We accounted for variability between MSNs in pharmacological datasets in which we could match MSNs between saline, D2 blockade, and D1 blockade. P values < 0.05 were interpreted as significant.”

      We have now included measures of ‘power’ (which we interpret to be statistical), effect size, and perform additional sensitivity analyses (Line 187): 

      “PC1 scores for D1-MSNs (Fig 3C; PC1 for D2-MSNs: -3.4 (-4.6 – 2.5); PC1 for D1MSNs: 2.8 (-4.9 – -2.8); F=8.8, p = 0.004 accounting for variance between mice (Fig S3A); Cohen’s d = 0.7; power = 0.80; no reliable effect of sex (F=1.9, p=0.17) or switching direction (F=0.1, p=0.75)).”

      And Line 197:

      “GLM analysis also demonstrated that D2-MSNs had significantly different slopes (0.01 spikes/second (-0.10 – 0.10)), which were distinct from D1-MSNs (-0.20 (-0.45– 0.06; Fig 3D; F=8.9, p = 0.004 accounting for variance between mice (Fig S3B); Cohen’s d = 0.8; power = 0.98).  We found that D2-MSNs and D1-MSNs had a significantly different slope even when excluding outliers (4 outliers excluded outside of 95% confidence intervals; F=7.51, p=0.008 accounting for variance between mice) and when the interval was defined as the time between trial start and the switch response on a trial-by-trial bases for each neuron (F=4.3, p=0.04 accounting for variance between mice).”

      These are medium-to-large Cohen’s d results, and we have adequate statistical power. These results are not easily explained by chance. 

      We also added boxplots, which highlight the differences in distributions.

      (3) For results in Figure 5 and Figure S7, according to Figure 1 legend, lines 4 to 5, the response times were defined as the moment mice exit the first nose poke (on the left) to respond at the second nose poke; and according to method session (line 522), "switch" traversal time was defined as the duration between first nose poke exit and second nose poke entry. It seems that response time is the switch traversal time, they should be the same, but in Figures B and D, the response time showed a clear difference between the laser off and on groups, while in Figures S7 C, and G, there were no differences between laser off and on group for switch traversal time. Please reconcile these inconsistencies. 

      We were not clear. We now clarify – switch responses are the moment when mice depart the first nosepoke, whereas traversal time is the time between departing the first nosepoke and arriving at the second nosepoke. We have reworked our figures to make this clear.

      And in the methods (Line 570):

      “Switch response time was defined as the moment animals departed the first nosepoke before arriving at the second nosepoke. Critically, switch responses are a time-based decision guided by temporal control of action because mice switch nosepokes only if nosepokes at the first location did not receive a reward after 6 seconds. That is, mice estimate if more than 6 seconds have elapsed without receiving a reward to decide to switch responses. Mice learn this task quickly (3-4 weeks), and error trials in which an animal nosepokes in the wrong order or does not nosepoke are relatively rare and discarded. Consequently, we focused on these switch response times as the key metric for temporal control of action. Traversal time was defined as the duration between first nosepoke exit and second nosepoke entry and is distinct from switch response time when animals departed the first nosepoke. Nosepoke duration was defined as the time between first nosepoke entry and exit for the switch response times only. Trials were self-initiated, but there was an intertrial interval with a geometric mean of 30 seconds between trials.”

      And in Figure S8, we have added graphics and clarified the legend.

      (4) The first nose poke and second nose poke are very close, why did it take so long to move from the first nose poke to the second nose poke, even though the mouse already made the decision to switch? Please see Figure S1A, it took less than 6s from the back nose poke to the first nose poke, but it took more than 6s (up to 12s) from the first nose poke to the second nose poke, what were the mice's behavior during this period? 

      This is a key detail. There is no temporal urgency as only the initial nosepoke after 18 seconds leads to reward. In other words, making a second nosepoke prior to 18 seconds is not rewarded and, in well-trained animals, is wasted effort. We have added these details to the methods (Line 124):

      “On the remaining 50% of trials, mice were rewarded for nosepoking at the ‘first’ nosepoke and then switching to the ‘second’ nosepoke; initial nosepokes at the second nosepoke after 18 seconds triggered reward when preceded by a first nosepoke. The first nosepokes occurred before switching responses and the second nosepokes occurred much later in the interval in anticipation of reward delivery at 18 seconds (Fig 1B-D). During the task, movement velocity peaked before 6 seconds as mice traveled to the front nosepoke (Fig 1E).”

      And in Figure 1, as described in detail above. 

      (5) How many trials did mice perform in one day? How many recordings/day for how many days were performed? 

      These are key details that we have now added to Table 1.

      We have added the number of recording sessions to the methods (Line 603): 

      “For optogenetic tagging, putative D1- and D2-MSNs were optically identified via 473-nm photostimulation. Units with mean post-stimulation spike latencies of ≤5 milliseconds and a stimulated-to-unstimulated waveform correlation ratio of >0.9 were classified as putative D2-MSNs or D1-MSNs (Ryan et al., 2018; Shin et al., 2018). Only one recording session was performed for each animal per day, and one recording session was included from each animal.”

      And Line 606: 

      “Only one recording session was performed for each animal per day, and one recording session was included from saline, D2 blockade, and D1 blockade sessions.”

      (6) For results in Figure 5, the authors should analyze the speed for the laser on and off group, since the dorsomedial striatum was reported to be related to control of speed (Yttri, Eric A., and Joshua T. Dudman. "Opponent and bidirectional control of movement velocity in the basal ganglia." Nature 533.7603 (2016): 402-406.). 

      We have some initial DeepLabCut data and have included it in a new Figure 1E.

      B) DeepLabCut tracking of position during the interval timing revealed that mice moved quickly after trial start and then velocity was relatively constant throughout the trial

      We measure movement speed using nosepoke duration and traversal time, which can give some measure of movement velocity.

      In Yttri and Dudman, the mice are head-fixed and moving a joystick, whereas our mice are freely moving. However, we have now included the lack of motor control as a major limitation (Line 510): 

      “Finally, movement and motivation contribute to MSN dynamics (Robbe, 2023). Four lines of evidence argue that our findings cannot be directly explained by motor confounds: 1) D2-MSNs and D1-MSNs diverge between 0-6 seconds after trial start well before the first nosepoke (Fig S2), 2) our GLM accounted for nosepokes and nosepoke-related βs were similar between D2-MSNs and D1-MSNs, 3) optogenetic disruption of dorsomedial D2-MSNs and D1-MSNs did not change task-specific movements despite reliable changes in switch response time, and 4) ramping dynamics were quite distinct from movement dynamics. Furthermore, disrupting D2-MSNs and D1-MSNs did not change the number of rewards animals received, implying that these disruptions did not grossly affect motivation. Still, future work combining motion tracking with neuronal ensemble recording and optogenetics and including bisection tasks may further unravel timing vs. movement in MSN dynamics (Robbe, 2023).”

      (7)  Figure S3 (C, E, and F), statistics should be done based on N (number of mice), not on the number of recorded neurons.  

      We have removed this section, and all other statistics in the paper properly account for mouse-specific variance, as noted above.

      (8)  Figure S1 

      (A) Are these the results from all mice superposed together, or from one mouse on one given day? How many of the trials' data were superposed?

      We included these details in a new Figure 1.

      (B, C) How many trials were included? 

      (D) How many days did these data cover? 

      We have included a new Table 1 with these important details.

      We have noted that only 1 recording session / mouse was included in analysis (Line 606):

      “Only one recording session was performed for each animal per day, and one recording session was included from each animal.”

      And Line 614: 

      “Only one recording session was performed for each animal per day, and one recording session was included from saline, D2 blockade, and D1 blockade sessions.”

      (9) Figure S2 

      (A) Can the authors add coordinates of the brain according to the mouse brain atlas or, alternatively, show it using a coronal section? 

      Great idea – added to Figure S2 legend: 

      “Figure S1: A) Recording locations in the dorsomedial striatum (targeting AP +0.4, ML -1.4, DV -2.7). Electrode reconstructions for D2-Cre (red), D1-Cre (blue), and wild-type mice (green). Only the left striatum was implanted with electrodes in all animals.”

      We have also added it to Figure S5 legend: 

      “Figure S5: Fiber optic locations from A) an opsin-expressing mouse with mCherrytagged halorhodopsin and bilateral fiber optics, and B) across 10 D2-Cre mice (red) and 6 D1-cre mice (blue) with fiber optics (targeting AP +0.9, ML +/-1.3, DV –2.5).”

      (C) Why did the waveform of laser and no laser seem the same? 

      The optogenetically tagged spike waveforms are highly similar, indicating that optogenetically-triggered spikes are like other spikes. That is the main point – optogenetically stimulating the neuron does not change the waveform. We have added this detail to the legend of S1: 

      “Inset on bottom right – waveforms from laser trials (red) and trials without laser (blue).  Across 73 tagged neurons, waveform correlation coefficients for laser trials vs. trials without laser was r = 0.97 (0.92-0.99). These data demonstrate that optogenetically triggered spikes are similar to non-optogenetically triggered spikes.”

      (10)  Figure S7, what was the laser power used in this experiment? Have the authors tried different laser powers? 

      We have now clarified the laser power on line 598: 

      “In animals injected with optogenetic viruses, optical inhibition was delivered via bilateral patch cables for the entire trial duration of 18 seconds via 589-nm laser light at 12 mW power on 50% of randomly assigned trials.”

      And for Figure S6 (was S7 previously): 

      We did not try other laser powers; our parameters were chosen a priori based on our past work.  

      (11)  In Figure S9, what method was used to sort the neurons? 

      We now clarify in the methods (Line 617): 

      “Electrophysiology. Single-unit recordings were made using a multi-electrode recording system (Open Ephys, Atlanta, GA). After the experiments, Plexon Offline Sorter (Plexon, Dallas, TX), was used to remove artifacts. Principal component analysis (PCA) and waveform shape were used for spike sorting. Single units were defined as those 1) having a consistent waveform shape, 2) being a separable cluster in PCA space, and 3) having a consistent refractory period of at least 2 milliseconds in interspike interval histograms.  The same MSNs were sorted across saline, D2 blockade, and D1 blockade sessions by loading all sessions simultaneously in Offline Sorter and sorted using the preceding criteria. MSNs had to have consistent firing in all sessions to be included. Sorting integrity across sessions was quantified by comparing waveform similarity via R2 between sessions.”

      And in the results (Line 353):

      “We analyzed 99 MSNs in sessions with saline, D2 blockade, and D1 blockade. We matched MSNs across sessions based on waveform and interspike intervals; waveforms were highly similar across sessions (correlation coefficient between matched MSN waveforms: saline vs D2 blockade r = 1.00 (0.99 – 1.00 rank sum vs correlations in unmatched waveforms p = 3x10-44; waveforms; saline vs D1 blockade r = 1.00 (1.00 – 1.00), rank sum vs correlations in unmatched waveforms p = 4x10-50). There were no consistent changes in MSN average firing rate with D2 blockade or D1 blockade (F = 1.1, p = 0.30 accounting for variance between MSNs; saline: 5.2 (3.3 – 8.6) Hz; D2 blockade 5.1 (2.7 – 8.0) Hz; F = 2.2, p = 0.14; D1 blockade 4.9 (2.4 – 7.8) Hz).”

      (C-F) statistics should be done based on the number of mice, not on the number of recorded neurons. 

      We agree, all experiments are now quantified using linear mixed effects models which formally accounts for variance contributed across animals, as discussed at length earlier in the review and with statistical experts at the University of Iowa.

      (12) For results in Figure 6, did the authors do cell-type specific recording on D1 or D2 MSNs using optogenetic tagging? As the D1- or D2- MSNs account for ~50% of all MSNs, the inhibition of a considerable amount of neurons was not observed. The authors should discuss the relation between the results from optogenetic inhibition of D1- or D2- MSNs and pharmacological disruption of D1 or D2 dopamine receptors. 

      This is a great point. First, we did not combine cell-type specific recordings with tagging as it was difficult to get enough trials for analysis in a single session in the tagging experiments, and pharmacological interventions can further decrease performance.  However, we have made our results in Figure 6 much more focused.

      We have discussed the relationship between these data in the results (Line 380): 

      “This data-driven analysis shows that D2 and D1 blockade produced similar shifts in MSN population dynamics represented by PC1.  When combined with major contributions of D1/D2 MSNs to PC1 (Fig 3C) these findings show that pharmacologically disrupting D2 or D1 MSNs can disrupt ramping-related activity in the striatum.”

      And in the discussion (Line 417): 

      “Strikingly, optogenetic tagging showed that D2-MSNs and D1-MSNs had distinct dynamics during interval timing. MSN dynamics helped construct and constrain a four-parameter drift-diffusion model in which D2- and D1-MSN spiking accumulated temporal evidence. This model predicted that disrupting either D2MSNs or D1-MSNs would increase response times. Accordingly, we found that optogenetically or pharmacologically disrupting striatal D2-MSNs or D1-MSNs increased response times without affecting task-specific movements. Disrupting D2MSNs or D1-MSNs shifted MSN temporal dynamics and degraded MSN temporal encoding. These data, when combined with our model predictions, demonstrate that D2-MSNs and D1-MSNs contribute temporal evidence to controlling actions in time.”

      And: 

      “D2-MSNs and D1-MSNs play complementary roles in movement. For instance, stimulating D1-MSNs facilitates movement, whereas stimulating D2-MSNs impairs movement (Kravitz et al., 2010). Both populations have been shown to have complementary patterns of activity during movements (Tecuapetla et al., 2016), with MSNs firing at different phases of action initiation and selection. Further dissection of action selection programs reveals that opposing patterns of activation among D2MSNs and D1-MSNs suppress and guide actions, respectively, in the dorsolateral striatum (Cruz et al., 2022). A particular advantage of interval timing is that it captures a cognitive behavior within a single dimension — time. When projected along the temporal dimension, it was surprising that D2-MSNs and D1-MSNs had opposing patterns of activity. Past pharmacological work from our group and others have shown that disrupting D2 or D1 MSNs slows timing (De Corte et al., 2019; Drew et al., 2007, 2003; Stutt et al., 2023), in line with pharmacological and optogenetic results in this manuscript. Computational modeling predicted that disrupting either D2-MSNs or D1-MSNs increased self-reported estimates of time, which was supported by both optogenetic and pharmacological experiments. Notably, these disruptions are distinct from increased timing variability reported with administrations of amphetamine, ventral tegmental area dopamine neuron lesions, and rodent models of neurodegenerative disease (Balci et al., 2008; Gür et al., 2020, 2019; Larson et al., 2022; Weber et al., 2023). Furthermore, our current data demonstrate that disrupting either D2-MSN or D1-MSN activity shifted MSN dynamics and degraded temporal encoding, supporting prior work (De Corte et al., 2019; Drew et al., 2007, 2003; Stutt et al., 2023). Our recording experiments do not identify where a possible response threshold T is instantiated, but downstream basal ganglia structures may have a key role in setting response thresholds (Toda et al., 2017).”

      (13) For Figure 2, what is the error region for G and H? Is there a statistically significant difference between the start (e.g., 0-1 s) and the end (e.g., 5-6 s) time? 

      G and H are standard error, which we have now clarified.

      And on Line 166: 

      “These differences resulted in distinct activity early in the interval (0-1 seconds; F = 6.0, p = 0.02 accounting for variance between mice), but not late in the interval (5-6 seconds; F = 1.9, p = 0.17 accounting for variance between mice) between D2-MSNs and D1-MSNs.”

      Minor: 

      (1)  Figure 2 legend showed the wrong label "Peri-event raster C) from a D2-MSN (red) and E) from a D1-MSN (blue). It should be (D). 

      Fixed, thank you.  

      (2)  Figure 2. Missing legend for (E) and (F).  

      Fixed, thank you.  

      (3)  Line 423: mistyped "\" 

      Fixed, thank you.  

      Reviewer #3 (Recommendations For The Authors): 

      -  To clarify that complementary means opposing in this context, I suggest changing the title. 

      This is a helpful suggestion. We have changed it exactly as the reviewer suggested: 

      “Complementary opposing D2-MSNs and D1-MSNs dynamics during interval timing”

      -  I recommend adding a supplementary figure to demonstrate all the nose pokes in all trials in a given session. The current figures make it hard to assess the specifics of the behavior. For example, what happens if, in a long-interval trial, the mouse pokes in the second nose poke before 6 seconds? Is that behavior punished? Do they keep alternating between the nose poke or do they stick to one nose poke? 

      We agree. We think this is a main point, and we have now redesigned Figure 1 to describe these details: 

      And added these details to the methods (Line 548): 

      “Interval timing switch task. We used a mouse-optimized operant interval timing task described in detail previously (Balci et al., 2008; Bruce et al., 2021; Tosun et al., 2016; Weber et al., 2023). Briefly, mice were trained in sound-attenuating operant chambers, with two front nosepokes flanking either side of a food hopper on the front wall, and a third nosepoke located at the center of the back wall. The chamber was positioned below an 8-kHz, 72-dB speaker (Fig 1A; MedAssociates, St. Albans, VT). Mice were 85% food restricted and motivated with 20 mg sucrose pellets (BioServ, Flemington, NJ). Mice were initially trained to receive rewards during fixed ratio nosepoke response trials. Nosepoke entry and exit were captured by infrared beams. After shaping, mice were trained in the “switch” interval timing task. Mice self-initiated trials at the back nosepoke, after which tone and nosepoke lights were illuminated simultaneously. Cues were identical on all trial types and lasted the entire duration of the trial (6 or 18 seconds). On 50% of trials, mice were rewarded for a nosepoke after 6 seconds at the designated first ‘front’ nosepoke; these trials were not analyzed. On the remaining 50% of trials, mice were rewarded for nosepoking first at the ‘first’ nosepoke location and then switching to the ‘second’ nosepoke location; the reward was delivered for initial nosepokes at the second nosepoke location after 18 seconds when preceded by a nosepoke at the first nosepoke location.  Multiple nosepokes at each nosepokes were allowed. Early responses at the first or second nosepoke were not reinforced. Initial responses at the second nosepoke rather than the first nosepoke, alternating between nosepokes, going back to the first nosepoke after the second nosepoke were rare after initial training. Error trials included trials where animals responded only at the first or second nosepoke and were also not reinforced. We did not analyze error trials as they were often too few to analyze; these were analyzed at length in our prior work (Bruce et al., 2021).”

      -  Figures 2E and 2F suggest that some D1 cells ramp up during the first 6 seconds, while others ramp down. The same is more or less true for D2s. I wonder if the analysis will lose its significance if the two outlier D1s are excluded from Figure 3D. 

      This is a great idea suggested by multiple reviewers. We repeated this analysis with outliers removed. We used a data-driven approach to remove outliers (Line 656): 

      “We performed additional sensitivity analysis excluding outliers outside of 95% confidence intervals and measuring firing rate from the start of the interval to the time of the switch response on a trial-by-trial level for each neuron.”

      And described these data in the results (Line 201): 

      “We found that D2-MSNs and D1-MSNs had a significantly different slope even when excluding outliers (4 outliers excluded outside of 95% confidence intervals; F=7.51, p=0.008 accounting for variance between mice) and when the interval was defined as the time between trial start and the switch response on a trial-by-trial basis for each neuron (F=4.3, p=0.04 accounting for variance between mice).”

      Finally, we removed the outliers the reviewers alluded to – two D1 MSNs – and found similar results (F=6.59, p=0.01 for main effect of D2 vs. D1 MSNs controlling for between-mouse variability). We elected to include the more data driven approach based on 95% confidence intervals.

    1. Author response:

      Reviewer #1:

      This review evaluates the SCellBOW framework, which applies phenotype algebra to obtain vectors from cancer subclusters or user-defined subclusters.

      Strengths:

      SCellBOW employs an innovative application of NLP-inspired techniques to analyze scRNA-seq data, facilitating the identification and visualization of phenotypically divergent cell subpopulations. The framework demonstrates robustness in accurately representing various cell types across multiple datasets, highlighting its versatility and utility in different biological contexts. By simulating the impact of specific malignant subpopulations on disease prognosis, SCellBOW provides valuable insights into the relative risk and aggressiveness of cancer subpopulations, which is crucial for personalized therapeutic strategies. The identification of a previously unknown and aggressive AR−/NElow subpopulation in metastatic prostate cancer underscores the potential of SCellBOW in uncovering clinically significant findings.

      Major concerns:

      The reliance on bulk RNA-seq data as a reference raises concerns about potentially misleading results due to the presence of RNA expression from immune cells in the TME. It is unclear if SCellBOW adequately addresses this issue, which could affect the accuracy of the cancer subcluster vectors.

      To address the concern about potentially misleading results due to the TME when using bulk RNA-seq data as a reference:

      a. We account for systematic biases between the single-cell and bulk transcriptomics readouts by creating pseudo-bulk profiles for single-cell clusters, enabling more accurate comparisons.

      b. We encode expressions into word vectors and co-embed them together. By doing this, we mitigate any possibility of systematic differences in the embedding.

      c. It is imperative that we subject both single-cell and bulk data through the same treatments because otherwise, it will be difficult to perform algebraic operations on them.

      d. We rely on tumor bulk transcriptomics data from TCGA due to its high sample size and patient meta-data such as information pertaining to patient survival.

      We will discuss this in the revised manuscript.

      The method of extracting vectors in phenotype algebra appears to be a straightforward subtraction operation. This simplicity might limit its efficiency in excluding associations with phenotypes from specific subpopulations, potentially leading to inaccurate interpretations of the data.

      Vector algebra operations are not done in the gene expression space (i.e., gene expression vectors associated with tumor samples), rather we process the single cell and bulk expression profiles through multiple steps (pseudo-bulk vector generation for single cell clusters, mapping gene expression values to word frequencies as better understood by the Doc2vec neural networks etc.) to ensure their embeddings are consistent and capture intricate phenotypic information. We have demonstrated this through rigorous validation of the clusters yielded on various types of healthy and diseased samples. Furthermore, we have demonstrated the consistency of the vector algebra operations on known cancer subtypes in breast cancer, glioblastoma, and prostate cancer.

      We will discuss this in the revised manuscript.

      The review would benefit from additional validation studies to assess the effectiveness of SCellBOW in distinguishing between cancerous and non-cancerous signals, particularly in heterogeneous tumor environments.

      In our study, we are primarily interested in signals from malignant cells. However, we may consider scRNA-seq data with stromal cells and test whether SCellBOW can identify the influence of different stromal cell types on cancer aggressiveness.

      Further clarification on how SCellBOW handles mixed-cell populations within bulk RNA-seq data would strengthen the evaluation of its applicability and reliability in diverse research settings.

      We will elaborate on our discussion in the Result as well as Discussion sections.

      Reviewer #2:

      The authors developed a novel tool, SCellBOW, to perform cell clustering and infer survival risks on individual cancer cell clusters from the single-cell RNA seq dataset. The key ideas/techniques used in the tool include transfer learning, bag of words (BOW), and phenotype algebra which is similar to word algebra from natural language processing (NLP). Comparisons with existing methods demonstrated that SCellBOW provides superior clustering results and exhibits robust performance across a wide range of datasets. Importantly, a distinguishing feature of SCellBOW compared to other tools is its ability to assign risk scores to specific cancer cell clusters. Using SCellBOW, the authors identified a new group of prostate cancer cells characterized by a highly aggressive and dedifferentiated phenotype.

      Strengths:

      The application of natural language processing (NLP) to single-cell RNA sequencing (scRNA-seq) datasets is both smart and insightful. Encoding gene expression levels as word frequencies is a creative way to apply text analysis techniques to biological data. When combined with transfer learning, this approach enhances our ability to describe the heterogeneity of different cells, offering a novel method for understanding the biological behavior of individual cells and surpassing the capabilities of existing cell clustering methods. Moreover, the ability of the package to predict risk, particularly within cancer datasets, significantly expands the potential applications.

      Major concerns:

      Given the promising nature of this tool, it would be beneficial for the authors to test the risk-stratification functionality on other types of tumors with high heterogeneity, such as liver and pancreatic cancers, which currently lack clinically relevant and well-recognized stratification methods. Additionally, it would be worthwhile to investigate how the tool could be applied to spatial transcriptomics by analyzing cell embeddings from different layers within these tissue

      (1) Our selection of glioblastoma and breast cancer for this study was primarily driven by the focus on extensively studied and well-defined cancer types. To demonstrate the effectiveness of our model, we tested it on advanced prostate cancer, which currently lacks clinically relevant and well-recognized stratification methods. This application to metastatic prostate cancer serves as a proof of concept, illustrating our model's potential to provide valuable insights into cancer types where established stratification approaches are limited or absent. However, as suggested by the Reviewer, we will try to incorporate results for liver cancer, subject to the availability of adequate data for model building.

      (2) Regarding the application of our tool to spatial transcriptomics, we have already analyzed data from Digital Spatial Profiling (DSP). The article is already quite complex and involved, and we are afraid the inclusion of spatial transcriptomics may amount to a significant extension of the method. To this end, although we will discuss the future possibilities, we will skip the method validity check on spatial transcriptomics data.

    1. Author response:

      The following is the authors’ response to the previous reviews.

      (1) The reviewers asked to clarify the BTH assay: The fused T25 and T18 domains must be in the cytoplasmic to complement successfully. The authors stated that the N terminus of Aeg1 transverses the membrane once, which means that the T25-Aeg1 will have T25 in the periplasm. However, T18C vector fusion with other division proteins will have T18C of ZipA in the periplasm (ZipA's N terminus is on the periplasmic side of the inner membrane) while that of FtsN in the cytoplasm (FtsN's N terminus is in the cytoplasm). As such, it isn't easy to understand why T25-Aeg1 showed positive results for both ZipA and FtsN. Note that FtsL, FtsB, and FtsI all have the same topology as FtsN but showed negative results. It is possible that these fusion proteins do not fold correctly, and hence, the results cannot be interpreted directly. The authors did not address this concern but only cited that BTH is a commonly used assay for protein-protein interactions.

      In response to the editor's comments and the concerns raised by the reviewer, we have performed two sets of Aeg1-T25 fusion experiments to determine whether the Aeg1 topology impacts protein interactions measured by bacterial two-hybrid (BTH) assays. In the first set of experiments, we fused the T25 domain to the N-terminus of Aeg1 and still observed strong binding of Aeg1 to ZipA and FtsN, respectively. Similar results were obtained from the second set of experiments in which the T25 domain was fused to the C-terminus of Aeg1.

      These results indicate that the precise topology of Aeg1 does not significantly impact its ability to engage these binding partners. Aeg1 is predicted to harbor a single transmembrane domain, however, the precise location of this transmembrane segment differs in predictions made by different algorithms. The SMART Web site (1) predicted the transmembrane region to be located at the N-terminus of Aeg1 (7-29 aa). In contrast, Phobius, based on HMM (2, 3)suggested the transmembrane segment is situated more centrally within the Aeg1 protein (134-151 aa), and further proposed that the N-terminus may function as a signal peptide. This latter prediction also provides a potential explanation for the larger-than-expected molecular weight of the Aeg1 truncation mutant observed in the Western blot shown in Fig 1C. The removal of the putative signal peptide may have altered the protein structure, affecting its electrophoretic mobility. As a result, we are more inclined to favor the topology model for Aeg1 predicted by Phobius.

      (2) It is still difficult to identify the midcell localization patterns of Aeg1 and other division proteins from microscopy images (Fig. 4C and Fig. 5A). In Fig 4C, only ZipA and Aeg1 formed clear, regular band-like colocalization patterns. Others formed irregular co-localized puncta along the cell length, different from the expected midcell localization patterns. Cells also appeared to be much longer than WT cells, suggesting cell division defects. The most likely reason for these aberrant localization patterns and filamentous cells is that GFP/mCherry-fusions of these division proteins are not functional and become dominant negative, interfering with proper cell division. The authors need to test the functionality of these fusion proteins before they can be used for imaging. (The authors also mislabeled Hoechst and the division protein GFP panels labels in this figure.)

      Thank you for raising this important point. To examine the functionality of the fluorescence protein fusion constructs, we have painstakingly performed conditional knockout of the genes of interest (zipA, ftsB, ftsL, and ftsN) in A. baumannii strains inducibly expressing the corresponding fusion protein. We found that these fluorescence protein fusions were able to fully rescue the growth of the mutant lacking the corresponding fts gene (Figure 4-figure supplement 1). Concurrently, we have also successfully knocked out the aeg1 gene under conditions in trans expression of an mCherry-Aeg1 fusion protein, which was able to effectively rescue the growth defects of the Δa_eg1_ mutant (Figure 4-figure supplement 1). We then introduced the functional fluorescence protein fusions into wild-type cells and observed the co-localization of Aeg1 with the relevant Fts proteins. The results showed that Aeg1 indeed co-localized with ZipA, FtsB, FtsL, and FtsN (Fig.4E, red arrows), but occasional non-co-localization was also observed (Fig.4E, white arrows).

      We have utilized the functional fluorescence protein fusion constructs to analyze the localization of relevant Aeg1-interacting proteins in the Δ_aeg1_ strain upon Aeg1 depletion. Our results showed that the depletion of Aeg1 indeed impacted the midcell localization of the several Aeg1-interacting Fts proteins.

      References

      (1) Letunic I, Khedkar S, Bork P. SMART: recent updates, new developments and status in 2020. Nucleic acids research. 2021;49:D458-d60.doi: 10.1093/nar/gkaa937.

      (2) Käll L, Krogh A, Sonnhammer EL. A combined transmembrane topology and signal peptide prediction method. Journal of molecular biology. 2004;338:1027-36.doi: 10.1016/j.jmb.2004.03.016

      (3) Käll L, Krogh A, Sonnhammer EL. Advantages of combined transmembrane topology and signal peptide prediction--the Phobius web server. Nucleic acids research. 2007;35:W429-32.doi: 10.1093/nar/gkm256

    1. Author response:

      Reviewer #1:

      (1) Clarification of Novelty and Contribution:

      - We agree that the novelty of our study could have been better articulated. We will more clearly define the specific gaps in knowledge our study addresses. We will also clarify the novelty in our analysis of the correlational structure of gene expression under stress.

      (2) Methodological Details:

      - We acknowledge the need for additional detail in the methods section regarding the estimation of G, E, and GxE effects. We will expand this section to include the software used (R), the specific ANOVA models applied, and how significance was determined. We will also clarify which effects were treated as fixed or random effects.

      (3) Terminology Consistency:

      - We will thoroughly review the manuscript to ensure consistent use of selection-related terminology. This will involve distinguishing between quantitative genetics terms (e.g., irectional, stabilizing) and molecular evolution terms (e.g., positive, purifying) to avoid any confusion.

      (4) Bias in Conditional Neutrality and Antagonistic Pleiotropy:

      - We appreciate the suggestion to clarify the discussion around conditional neutrality (CN) and antagonistic pleiotropy (AP). We will elaborate on the inherent bias in detecting CN and P and specify how we adjusted P-value thresholds. Additionally, we will try to refine the discussion to address the concerns raised about the comparison of gene expression and local adaptation, incorporating relevant literature.

      Reviewer #2:

      (1) Sensitivity of Fitness Proxy:

      - We acknowledge the limitations of using the total filled grain number as a fitness proxy. We will include a discussion on the potential sensitivity of our results to this choice.

      (2) Cis- and trans-eQTL Contributions:

      - We appreciate the suggestion to report effect sizes in addition to the frequency of cis- and trans-eQTLs. We will incorporate this into our analysis and discuss whether our conclusions regarding the predominance of trans-eQTLs in expression variation hold when considering effect sizes.

      (3) Cis-Trans Relationship Analysis:

      - Since we wanted to estimate compensating vs. reinforcing effects, this essentially entails identifying genes that have opposing directionality of cis and trans-effects. To get the total trans-effect we decided to take the mean effect of trans-eQTLs. This mean was only used to identify the compensating/reinforcing genes and although the mean effects diminishes the effect of small trans-eQTLs, this metric was not used in downstream analyses.

      Reviewer #3:

      (1) Integration of Analyses:

      - We acknowledge that the manuscript currently presents some analyses in a somewhat independent manner. Although it would be ideal to have a central hypothesis/message, our study is meant to broadly outline the various responses and fitness effects of salinity stress on rice. Throughout the manuscript, we have also included comparisons between our findings and that of our previous studies on drought stress to highlight any consistent themes or novel insights.

      (2) X-by-Environment Effects:

      - We do plan to consider fitting models that explicitly incorporate X-by-environment interactions to provide a more detailed understanding of the genetics of plasticity between the two environments, but it is beyond the scope of this paper. This will be explored in a separate report.

      (3) Gene Grouping Methods:<br /> - We will try to discuss the pros and cons of using PCA versus gene co-expression network analysis (e.g., WGCNA) for grouping genes. We will also explore applying WGCNA in our analysis to see if it offers any additional insights or clarity.

      Reviewer #4:

      (1) Selection Analysis Across Environments:

      - We do plan to consider fitting models that explicitly incorporate G×E interactions to provide a more detailed understanding of the genetics of plasticity between the two environments, but it is beyond the scope of this paper. This will be explored in a separate report.

      (2) Gene Expression Trade-Offs Terminology:

      - We will revise our terminology to better reflect the nature of the trade-offs observed, and explore variation in covariance between phenotype and fitness between the two environments.

      (3) Biological Processes and Decoherence:

      - We will explore applying WGCNA in our analysis to see if it offers any additional insights or clarity.

      (4) Underutilization of Organismal Traits:

      - We did perform GWAS for all the traits measured in both environments, but did not find any significant hits. We will examine whether selection of co-expression modules are correlated with the traits, and may incorporate it in our manuscript depending on the results.

      (5) Detailed eQTL Analysis:

      - We will expand our eQTL analysis to include detailed statistics at the molecular trait level, including the phenotypic variance explained by cis- and trans-eQTLs and how these vary by environment.

      Although we focus on salinity conditions in our cis-trans compensation analysis in the main results, we have provided comparisons for all our eQTL analyses between normal and salinity conditions in the main text (with figures as supplementary).<br /> We are confident that these revisions will significantly strengthen our manuscript and address the concerns raised by the reviewers. We look forward to submitting a revised version that better communicates the significance and robustness of our findings.<br /> Thank you again for your valuable feedback.

    1. Author response:

      eLife assessment

      The authors present a potentially useful approach of broad interest arguing that anterior cingulate cortex (ACC) tracks option values in decisions involving delayed rewards. The authors introduce the idea of a resource-based cognitive effort signal in ACC ensembles and link ACC theta oscillations to a resistance-based strategy. The evidence supporting these new ideas is incomplete and would benefit from additional detail and more rigorous analyses and computational methods.

      The reviewers have provided several excellent suggestions and pointed out important shortcomings of our manuscript. We are grateful for their efforts. To address these concerns, we are planning a major revision to the manuscript. In the revision, our goal is to address each of the reviewer’s concerns and codify the evidence for resistance- and resource-based control signals in the rat anterior cingulate cortex. We have provided a nonexhaustive list we plan to address in the point by point responses below.   

      Public Reviews:

      Reviewer #1 (Public Review):

      Summary:

      Young (2.5 mo [adolescent]) rats were tasked to either press one lever for immediate reward or another for delayed reward.

      Please note that at the time of testing and training that the rats were > 4 months old.

      The task had a complex structure in which (1) the number of pellets provided on the immediate reward lever changed as a function of the decisions made, (2) rats were prevented from pressing the same lever three times in a row. Importantly, this task is very different from most intertemporal choice tasks which adjust delay (to the delayed lever), whereas this task held the delay constant and adjusted the number of 20 mg sucrose pellets provided on the immediate value lever.

      Several studies parametrically vary the immediate lever (PMID: 39119916, 31654652, 28000083, 26779747, 12270518, 19389183). While most versions of the task will yield qualitatively similar estimates of discounting, the adjusting amount is preferred as it provides the most consistent estimates (PMID: 22445576). More specifically this version of the task avoids contrast effects of that result from changing the delay during the session (PMID: 23963529, 24780379, 19730365, 35661751) which complicates value estimates.

      Analyses are based on separating sessions into groups, but group membership includes arbitrary requirements and many sessions have been dropped from the analyses.

      We are in discussions about how to address this valid concern. This includes simply splitting the data by delay. This approach, however, has conceptual problems that we will also lay out in a full revision.  

      Computational modeling is based on an overly simple reinforcement learning model, as evidenced by fit parameters pegging to the extremes.

      We apologize for not doing a better job of explaining the advantages of this type of model for the present purposes. Nevertheless, given the clear lack of enthusiasm, we felt it was better to simply update the model as suggested by the Reviewers. The straightforward modifications have now been implemented and we are currently in discussion about how the new results fit into the larger narrative.

      The neural analysis is overly complex and does not contain the necessary statistics to assess the validity of their claims.

      We plan to streamline the existing analysis and add statistics, where required, to address this concern.

      Strengths:

      The task is interesting.

      Thank you for the positive comment

      Weaknesses:

      Behavior:

      The basic behavioral results from this task are not presented. For example, "each recording session consisted of 40 choice trials or 45 minutes". What was the distribution of choices over sessions? Did that change between rats? Did that change between delays? Were there any sequence effects? (I recommend looking at reaction times.) Were there any effects of pressing a lever twice vs after a forced trial?

      Animals tend to make more immediate choices as the delay is extended, which is reflected in Figure 1. We will add more detail and additional statistics to address these questions. 

      This task has a very complicated sequential structure that I think I would be hard pressed to follow if I were performing this task.

      Human tasks implement a similar task structure (PMID: 26779747). Please note the response above that outlines the benefits of using of this task.   

      Before diving into the complex analyses assuming reinforcement learning paradigms or cognitive control, I would have liked to have understood the basic behaviors the rats were taking. For example, what was the typical rate of lever pressing? If the rats are pressing 40 times in 45 minutes, does waiting 8s make a large difference?

      This is a good suggestion. However, rats do not like waiting for rewards, even small delays. Going from the 4 à 8 sec delay results in more immediate choices, indicating that the rats will forgo waiting for a smaller reinforcer at the 8 sec delay as compared to the 4 sec.  

      For that matter, the reaction time from lever appearance to lever pressing would be very interesting (and important). Are they making a choice as soon as the levers appear? Are they leaning towards the delay side, but then give in and choose the immediate lever? What are the reaction time hazard distributions?

      These are excellent suggestions. We are looking into implementing them.

      It is not clear that the animals on this task were actually using cognitive control strategies on this task. One cannot assume from the task that cognitive control is key. The authors only consider a very limited number of potential behaviors (an overly simple RL model). On this task, there are a lot of potential behavioral strategies: "win-stay/lose-shift", "perseveration", "alternation", even "random choices" should be considered.

      The strategies the Reviewer mentioned are descriptors of the actual choices the rats made. For example, perseveration means the rat is choosing one of the levers at an excessively high rate whereas alternation means it is choosing the two levers more or less equally, independent of payouts. But the question we are interested in is why? We are arguing that the type of cognitive control determines the choice behavior but cognitive control is an internal variable that guides behavior, rather than simply a descriptor of the behavior. For example, the animal opts to perseverate on the delayed lever because the cognitive control required to track ival is too high. We then searched the neural data for signatures of the two types of cognitive control.

      The delay lever was assigned to the "non-preferred side". How did side bias affect the decisions made?

      The side bias clearly does not impact performance as the animals prefer the delay lever at shorter delays, which works against this bias.

      The analyses based on "group" are unjustified. The authors compare the proportion of delayed to immediate lever press choices on the non-forced trials and then did k-means clustering on this distribution. But the distribution itself was not shown, so it is unclear whether the "groups" were actually different. They used k=3, but do not describe how this arbitrary number was chosen. (Is 3 the optimal number of clusters to describe this distribution?) Moreover, they removed three group 1 sessions with an 8s delay and two group 2 sessions with a 4s delay, making all the group 1 sessions 4s delay sessions and all group 2 sessions 8s delay sessions. They then ignore group 3 completely. These analyses seem arbitrary and unnecessarily complex. I think they need to analyze the data by delay. (How do rats handle 4s delay sessions? How do rats handle 6s delay sessions? How do rats handle 8s delay sessions?). If they decide to analyze the data by strategy, then they should identify specific strategies, model those strategies, and do model comparison to identify the best explanatory strategy. Importantly, the groups were session-based, not rat based, suggesting that rats used different strategies based on the delay to the delayed lever.

      These are excellent points and, as stated above, we are in the process revisiting the group assignments in an effort allay these criticisms.

      The reinforcement learning model used was overly simple. In particular, the RL model assumes that the subjects understand the task structure, but we know that even humans have trouble following complex task structures. Moreover, we know that rodent decision-making depends on much more complex strategies (model-based decisions, multi-state decisions, rate-based decisions, etc). There are lots of other ways to encode these decision variables, such as softmax with an inverse temperature rather than epsilon-greedy. The RL model was stated as a given and not justified. As one critical example, the RL model fit to the data assumed a constant exponential discounting function, but it is well-established that all animals, including rodents, use hyperbolic discounting in intertemporal choice tasks. Presumably this changes dramatically the effect of 4s and 8s. As evidence that the RL model is incomplete, the parameters found for the two groups were extreme. (Alpha=1 implies no history and only reacting to the most recent event. Epsilon=0.4 in an epsilon-greedy algorithm is a 40% chance of responding randomly.)

      Please see our response above. We agree that the approach was not justified, but we do not agree that it is invalid. Simply stated, a softmax approach gives the best fit to the choice behavior, whereas our epsilon-greedy approach attempted to reproduce the choice behavior using a naïve agent that progressively learns the values of the two levers on a choice-by-choice basis. The epsilon-greedy approach can therefore tell us whether it is possible to reproduce the choice behavior by an agent that is only tracking ival. Given our discovery of an ival-tracking signal in ACC, we believed that this was a critical point (although admittedly we did a poor job of communicating it). However, we also appreciate that important insights can be gained by fitting a model to the data as suggested. In fact, we had implemented this approach initially and are currently reconsidering what it can tell us in light of the Reviewers comments.

      The authors do add a "dbias" (which is a preference for the delayed lever) term to the RL model, but note that it has to be maximal in the 4s condition to reproduce group 2 behavior, which means they are not doing reinforcement learning anymore, just choosing the delayed lever.

      Exactly. The model results indicated that a naïve agent that relied only on ival tracking would not behave in this manner. Hence it therefore was unlikely that the G1 animals were using an ival-tracking strategy, even though a strong ival-tracking signal was present in ACC.

      Neurophysiology:

      The neurophysiology figures are unclear and mostly uninterpretable; they do not show variability, statistics or conclusive results.

      While the reviewer is justified in criticizing the clarity of the figures, the statement that “they do not show variability, statistics or conclusive results” is demonstrably false. Each of the figures presented in the manuscript, except Figure 3, are accompanied by statistics and measures of variability. This comment is hyperbolic and not justified.  

      Figure 3 was an attempt to show raw neural data to better demonstrate how robust the ivalue tracking signal is.

      As with the behavior, I would have liked to have seen more traditional neurophysiological analyses first. What do the cells respond to? How do the manifolds change aligned to the lever presses? Are those different between lever presses?

      We provide several figures describing how neurons change firing rates in response to varying reward. We are unsure what the reviewer means by “traditional analysis”, especially since this is immediately followed by a request for an assessment of neural manifolds. That said, we are developing ways to make the analysis more intuitive and, hopefully, more “traditional”.

      Are there changes in cellular information (both at the individual and ensemble level) over time in the session?

      We provide several analyses of how firing rate changes over trials in relation to ival over time in the session.

      How do cellular responses differ during that delay while both levers are out, but the rats are not choosing the immediate lever?

      It is not clear to us how this analysis addresses our hypothesis regarding control signals in ACC.

      Figure 3, for example, claims that some of the principal components tracked the number of pellets on the immediate lever ("ival"), but they are just two curves. No statistics, controls, or justification for this is shown. BTW, on Figure 3, what is the event at 200s?

      Figure 3 will be folded into one of the other figures that contains the summary statistics.

      I'm confused. On Figure 4, the number of trials seems to go up to 50, but in the methods, they say that rats received 40 trials or 45 minutes of experience.

      This analysis included force trials. The max of the session is 40 choice trials. We will clarify in the revised manuscript. 

      At the end of page 14, the authors state that the strength of the correlation did not differ by group and that this was "predicted" by the RL modeling, but this statement is nonsensical, given that the RL modeling did not fit the data well, depended on extreme values. Moreover, this claim is dependent on "not statistically detectable", which is, of course, not interpretable as "not different".

      We plan to revisit this analysis and the RL model.

      There is an interesting result on page 16 that the increases in theta power were observed before a delayed lever press but not an immediate lever press, and then that the theta power declined after an immediate lever press.

      Thank you for the positive comment.

      These data are separated by session group (again group 1 is a subset of the 4s sessions, group 2 is a subset of the 8s sessions, and group 3 is ignored). I would much rather see these data analyzed by delay itself or by some sort of strategy fit across delays.

      Provisional analysis indicates that the results hold up over delays, rather than the groupings in the paper. We will address this in a full revision of the manuscript.

      That being said, I don't see how this description shows up in Figure 6. What does Figure 6 look like if you just separate the sessions by delay?

      We are unclear what the reviewer means by “this description”.

      Discussion:

      Finally, it is unclear to what extent this task actually gets at the questions originally laid out in the goals and returned to in the discussion. The idea of cognitive effort is interesting, but there is no data presented that this task is cognitive at all. The idea of a resourced cognitive effort and a resistance cognitive effort is interesting, but presumably the way one overcomes resistance is through resource-limited components, so it is unclear that these two cognitive effort strategies are different.

      We view the strong evidence for ival tracking presented herein as a potentially critical component of resource based cognitive effort. We hope to clarify how this task engaged cognitive effort more clearly.  

      The authors state that "ival-tracking" (neurons and ensembles that presumably track the number of pellets being delivered on the immediate lever - a fancy name for "expectations") "taps into a resourced-based form of cognitive effort", but no evidence is actually provided that keeping track of the expectation of reward on the immediate lever depends on attention or mnemonic resources. They also state that a "dLP-biased strategy" (waiting out the delay) is a "resistance-based form of cognitive effort" but no evidence is made that going to the delayed side takes effort.

      There is a well-developed literature that rats and mice do not like waiting for delayed reinforcers. We contend that enduring something you don’t like takes effort.

      The authors talk about theta synchrony, but never actually measure theta synchrony, particularly across structures such as amygdala or ventral hippocampus. The authors try to connect this to "the unpleasantness of the delay", but provide no measures of pleasantness or unpleasantness. They have no evidence that waiting out an 8s delay is unpleasant.

      We will better clarify how our measure of Theta power relates to synchrony. There is a well-developed literature that rats and mice do not like waiting for delayed reinforcers.

      The authors hypothesize that the "ival-tracking signal" (the expectation of number of pellets on the immediate lever) "could simply reflect the emotional or autonomic response". Aside from the fact that no evidence for this is provided, if this were to be true, then, in what sense would any of these signals be related to cognitive control?

      This is proposed as an alternative explanation to the ivalue signal. We provide this as a possibility, never a conclusion. We will clarify this in the revised text. 

      Reviewer #2 (Public Review):

      Summary:

      This manuscript explores the neuronal signals that underlie resistance vs resource-based models of cognitive effort. The authors use a delayed discounting task and computational models to explore these ideas. The authors find that the ACC strongly tracks value and time, which is consistent with prior work. Novel contributions include quantification of a resource-based control signal among ACC ensembles, and linking ACC theta oscillations to a resistance-based strategy.

      Strengths:

      The experiments and analyses are well done and have the potential to generate an elegant explanatory framework for ACC neuronal activity. The inclusion of local-field potential / spike-field analyses is particularly important because these can be measured in humans.

      Thank you for the endorsement of our work.

      Weaknesses:

      I had questions that might help me understand the task and details of neuronal analyses.

      (1) The abstract, discussion, and introduction set up an opposition between resource and resistance based forms of cognitive effort. It's clear that the authors find evidence for each (ACC ensembles = resource, theta=resistance?) but I'm not sure where the data fall on this dichotomy.

      a. An overall very simple schematic early in the paper (prior to the MCML model? or even the behavior) may help illustrate the main point.

      b. In the intro, results, and discussion, it may help to relate each point to this dichotomy.

      c. What would resource-based signals look like? What would resistance based signals look like? Is the main point that resistance-based strategies dominate when delays are short, but resource-based strategies dominate when delays are long?

      d. I wonder if these strategies can be illustrated? Could these two measures (dLP vs ival tracking) be plotted on separate axes or extremes, and behavior, neuronal data, LFP, and spectral relationships be shown on these axes? I think Figure 2 is working towards this. Could these be shown for each delay length? This way, as the evidence from behavior, model, single neurons, ensembles, and theta is presented, it can be related to this framework, and the reader can organize the findings.

      These are excellent suggestions, and we intend to implement each of them, where possible.

      (2) The task is not clear to me.

      a. I wonder if a task schematic and a flow chart of training would help readers.

      Yes, excellent idea, we intend to include this.

      b. This task appears to be relatively new. Has it been used before in rats (Oberlin and Grahame is a mouse study)? Some history / context might help orient readers.

      Indeed, this task has been used in rats in several prior studies in rats. Please see the following references (PMID: 39119916, 31654652, 28000083, 26779747, 12270518, 19389183).

      c. How many total sessions were completed with ascending delays? Was there criteria for surgeries? How many total recording sessions per animal (of the 54?)

      Please note that the delay does not change within a session. There was no criteria for surgery. In addition, we will update Table 1 to make the number of recording sessions more clear.

      d. How many trials completed per session (40 trials OR 45 minutes)? Where are there errors? These details are important for interpreting Figure 1.

      Every animal in this data set completed 40 trials. We will update the task description to clarify this issue. There are no errors in this task, but rather the task is designed to the tendency to make an impulsive choice (smaller reward now). We will provide clarity to this issue in the revision of the manuscript.   

      (3) Figure 1 is unclear to me.

      a. Delayed vs immediate lever presses are being plotted - but I am not sure what is red, and what is blue. I might suggest plotting each animal.

      We will clarify the colors and look into schemes to graph the data set.

      b. How many animals and sessions go into each data point?

      This information is in Table 1, but this could be clearer, and we will update the manuscript.

      c. Table 1 (which might be better referenced in the paper) refers to rats by session. Is it true that some rats (2 and 8) were not analyzed for the bulk of the paper? Some rats appear to switch strategies, and some stay in one strategy. How many neurons come from each rat?

      Table 1 is accurate, and we can add the number of neurons from each animal.

      d. Task basics - RT, choice, accuracy, video stills - might help readers understand what is going into these plots

      e. Does the animal move differently (i.e., RTs) in G1 vs. G2?

      We will look into ways to incorporate this information.

      (4) I wasn't sure how clustered G1 vs. G2 vs G3 are. To make this argument, the raw data (or some axis of it) might help.

      a. This is particularly important because G3 appears to be a mix of G1 and G2, although upon inspection, I'm not sure how different they really are

      b. Was there some objective clustering criteria that defined the clusters?

      c. Why discuss G3 at all? Can these sessions be removed from analysis?

      These are all excellent suggestions and points. We plan to revisit the strategy to assign sessions to groups, which we hope will address each of these points.

      (5) The same applies to neuronal analyses in Fig 3 and 4

      a. What does a single neuron peri-event raster look like? I would include several of these.

      b. What does PC1, 2 and 3 look like for G1, G2, and G3?

      c. Certain PCs are selected, but I'm not sure how they were selected - was there a criteria used? How was the correlation between PCA and ival selected? What about PCs that don't correlate with ival?

      d. If the authors are using PCA, then scree plots and PETHs might be useful, as well as comparisons to PCs from time-shuffled / randomized data.

      We will make several updates to enhance clarity of the neural data analysis, including adding more representative examples. We feel the need to balance the inclusion of representative examples with groups stats given the concerns raised by R1.

      (6) I had questions about the spectral analysis

      a. Theta has many definitions - why did the authors use 6-12 Hz? Does it come from the hippocampal literature, and is this the best definition of theta?. What about other bands (delta - 1-4 Hz), theta (4-7 Hz); and beta - 13- 30 Hz? These bands are of particular importance because they have been associated with errors, dopamine, and are abnormal in schizophrenia and Parkinson's disease.

      This designation comes mainly from the hippocampal and ACC literature in rodents. In addition, this range best captured the peak in the power spectrum in our data. Note that we focus our analysis on theta give the literature regarding theta in the ACC as a correlate of cognitive controls (references in manuscript). We did interrogate other bands as a sanity check and the results were mostly limited to theta. Given the scope of our manuscript and the concerns raised regarding complexity we are concerned that adding frequency analyses beyond theta obfuscates the take home message. However, we think this is worthy, and we will determine if this can be done in a brief, clear, and effective manner.

      b. Power spectra and time-frequency analyses may justify the authors focus. I would show these (y-axis - frequency, x-axis - time, z-axis, power).

      This is an excellent suggestion that we look forward to incorporating. 

      (7) PC3 as an autocorrelation doesn't seem the to be right way to infer theta entrainment or spike-field relationships, as PCA can be vulnerable to phantom oscillations, and coherence can be transient. It is also difficult to compare to traditional measures of phase-locking. Why not simply use spike-field coherence? This is particularly important with reference to the human literature, which the authors invoke.

      Excellent suggestion. We will look into the phantom oscillation issue. Note that PCA provided a way to classify neurons that exhibited peaks in the autocorrelation at theta frequencies. While spike-field coherence is a rigorous tool, it addresses a slightly different question (LFP entrainment). Notwithstanding, we plan to address this issue.  

      Reviewer #3 (Public Review):

      Summary:

      The study investigated decision making in rats choosing between small immediate rewards and larger delayed rewards, in a task design where the size of the immediate rewards decreased when this option was chosen and increased when it was not chosen. The authors conceptualise this task as involving two different types of cognitive effort; 'resistance-based' effort putatively needed to resist the smaller immediate reward, and 'resource-based' effort needed to track the changing value of the immediate reward option. They argue based on analyses of the behaviour, and computational modelling, that rats use different strategies in different sessions, with one strategy in which they consistently choose the delayed reward option irrespective of the current immediate reward size, and another strategy in which they preferentially choose the immediate reward option when the immediate reward size is large, and the delayed reward option when the immediate reward size is small. The authors recorded neural activity in anterior cingulate cortex (ACC) and argue that ACC neurons track the value of the immediate reward option irrespective of the strategy the rats are using. They further argue that the strategy the rats are using modulates their estimated value of the immediate reward option, and that oscillatory activity in the 6-12Hz theta band occurs when subjects use the 'resistance-based' strategy of choosing the delayed option irrespective of the current value of the immediate reward option. If solid, these findings will be of interest to researchers working on cognitive control and ACCs involvement in decision making. However, there are some issues with the experiment design, reporting, modelling and analysis which currently preclude high confidence in the validity of the conclusions.

      Strengths:

      The behavioural task used is interesting and the recording methods should enable the collection of good quality single unit and LFP electrophysiology data. The authors recorded from a sizable sample of subjects for this type of study. The approach of splitting the data into sessions where subjects used different strategies and then examining the neural correlates of each is in principle interesting, though I have some reservations about the strength of evidence for the existence of multiple strategies.

      Thank you for the positive comments.

      Weaknesses:

      The dataset is very unbalanced in terms of both the number of sessions contributed by each subject, and their distribution across the different putative behavioural strategies (see table 1), with some subjects contributing 9 or 10 sessions and others only one session, and it is not clear from the text why this is the case. Further, only 3 subjects contribute any sessions to one of the behavioural strategies, while 7 contribute data to the other such that apparent differences in brain activity between the two strategies could in fact reflect differences between subjects, which could arise due to e.g. differences in electrode placement. To firm up the conclusion that neural activity is different in sessions where different strategies are thought to be employed, it would be important to account for potential cross-subject variation in the data. The current statistical methods don't do this as they all assume fixed effects (e.g. using trials or neurons as the experimental unit and ignoring which subject the neuron/trial came from).

      This is an important issue that we plan to address with additional analysis in the manuscript update.

      It is not obvious that the differences in behaviour between the sessions characterised as using the 'G1' and 'G2' strategies actually imply the use of different strategies, because the behavioural task was different in these sessions, with a shorter wait (4 seconds vs 8 seconds) for the delayed reward in the G1 strategy sessions where the subjects consistently preferred the delayed reward irrespective of the current immediate reward size. Therefore the differences in behaviour could be driven by difference in the task (i.e. external world) rather than a difference in strategy (internal to the subject). It seems plausible that the higher value of the delayed reward option when the delay is shorter could account for the high probability of choosing this option irrespective of the current value of the immediate reward option, without appealing to the subjects using a different strategy.

      Further, even if the differences in behaviour do reflect different behavioural strategies, it is not obvious that these correspond to allocation of different types of cognitive effort. For example, subjects' failure to modify their choice probabilities to track the changing value of the immediate reward option might be due simply to valuing the delayed reward option higher, rather than not allocating cognitive effort to tracking immediate option value (indeed this is suggested by the neural data). Conversely, if the rats assign higher value to the delayed reward option in the G1 sessions, it is not obvious that choosing it requires overcoming 'resistance' through cognitive effort.

      The RL modelling used to characterise the subject's behavioural strategies made some unusual and arguably implausible assumptions:

      i) The goal of the agent was to maximise the value of the immediate reward option (ival), rather than the standard assumption in RL modelling that the goal is to maximise long-run (e.g. temporally discounted) reward. It is not obvious why the rats should be expected to care about maximising the value of only one of their two choice options rather than distributing their choices to try and maximise long run reward.

      ii) The modelling assumed that the subject's choice could occur in 7 different states, defined by the history of their recent choices, such that every successive choice was made in a different state from the previous choice. This is a highly unusual assumption (most modelling of 2AFC tasks assumes all choices occur in the same state), as it causes learning on one trial not to generalise to the next trial, but only to other future trials where the recent choice history is the same.

      iii) The value update was non-standard in that rather than using the trial outcome (i.e. the amount of reward obtained) as the update target, it instead appeared to use some function of the value of the immediate reward option (it was not clear to me from the methods exactly how the fival and fqmax terms in the equation are calculated) irrespective of whether the immediate reward option was actually chosen.

      iv) The model used an e-greedy decision rule such that the probability of choosing the highest value option did not depend on the magnitude of the value difference between the two options. Typically, behavioural modelling uses a softmax decision rule to capture a graded relationship between choice probability and value difference.

      v) Unlike typical RL modelling where the learned value differences drive changes in subjects' choice preferences from trial to trial, to capture sensitivity to the value of the immediately rewarding option the authors had to add in a bias term which depended directly on this value (not mediated by any trial-to-trial learning). It is not clear how the rat is supposed to know the current trial ival if not by learning over previous trials, nor what purpose the learning component of the model serves if not to track the value of the immediate reward option.

      Given the task design, a more standard modelling approach would be to treat each choice as occurring in the same state, with the (temporally discounted) value of the outcomes obtained on each trial updating the value of the chosen option, and choice probabilities driven in a graded way (e.g. softmax) by the estimated value difference between the options. It would be useful to explicitly perform model comparison (e.g. using cross-validated log-likelihood with fitted parameters) of the authors proposed model against more standard modelling approaches to test whether their assumptions are justified. It would also be useful to use logistic regression to evaluate how the history of choices and outcomes on recent trials affects the current trial choice, and compare these granular aspects of the choice data with simulated data from the model.

      Each of the issues outlined above with the RL model a very important. We are currently re-evaluating the RL modeling approach in light of these comments. Please see comments to R1 regarding the model as they are relevant for this as well.

      There were also some issues with the analyses of neural data which preclude strong confidence in their conclusions:

      Figure 4I makes the striking claim that ACC neurons track the value of the immediately rewarding option equally accurately in sessions where two putative behavioural strategies were used, despite the behaviour being insensitive to this variable in the G1 strategy sessions. The analysis quantifies the strength of correlation between a component of the activity extracted using a decoding analysis and the value of the immediate reward option. However, as far as I could see this analysis was not done in a cross-validated manner (i.e. evaluating the correlation strength on test data that was not used for either training the MCML model or selecting which component to use for the correlation). As such, the chance level correlation will certainly be greater than 0, and it is not clear whether the observed correlations are greater than expected by chance.

      This is an astute observation and we plan to address this concern. We agree that cross-validation may provide an appropriate tool here.

      An additional caveat with the claim that ACC is tracking the value of the immediate reward option is that this value likely correlates with other behavioural variables, notably the current choice and recent choice history, that may be encoded in ACC. Encoding analyses (e.g. using linear regression to predict neural activity from behavioural variables) could allow quantification of the variance in ACC activity uniquely explained by option values after controlling for possible influence of other variables such as choice history (e.g. using a coefficient of partial determination).

      This is also an excellent point that we plan to address the manuscript update.

      Figure 5 argues that there are systematic differences in how ACC neurons represent the value of the immediate option (ival) in the G1 and G2 strategy sessions. This is interesting if true, but it appears possible that the effect is an artefact of the different distribution of option values between the two session types. Specifically, due to the way that ival is updated based on the subjects' choices, in G1 sessions where the subjects are mostly choosing the delayed option, ival will on average be higher than in G2 sessions where they are choosing the immediate option more often. The relative number of high, medium and low ival trials in the G1 and G2 sessions will therefore be different, which could drive systematic differences in the regression fit in the absence of real differences in the activity-value relationship. I have created an ipython notebook illustrating this, available at: https://notebooksharing.space/view/a3c4504aebe7ad3f075aafaabaf93102f2a28f8c189ab9176d4807cf1565f4e3. To verify that this is not driving the effect it would be important to balance the number of trials at each ival level across sessions (e.g. by subsampling trials) before running the regression.

      Excellent point and thank you for the notebook. We explored a similar approach previously but did not pursue it to completion. We will re-investigate this issue.

    1. Author response:

      Reviewer #3 (Public Review):

      (1) Conditions on growth and interaction rates for feasibility and stability. The authors approach this using a mean field approximation, and it is important to note that there is no particular temperature dependence assumed here: as far as it goes, this analysis is completely general for arbitrary Lotka-Volterra interactions.

      However, the starting point for the authors' mean field analysis is the statement that "it is not possible to meaningfully link the structure of species interactions to the exact closed-form analytical solution for [equilibria] 𝑥^*_𝑖 in the Lotka-Volterra model.

      I may be misunderstanding, but I don't agree with this statement. The time-independent equilibrium solution with all species present (i.e. at non-zero abundances) takes the form

      x^* = A^{-1}r

      where A is the inverse of the community matrix, and r is the vector of growth rates. The exceptions to this would be when one or more species has abundance = 0, or A is not invertible. I don't think the authors intended to tackle either of these cases, but maybe I am misunderstanding that.

      So to me, the difficulty here is not in writing a closed-form solution for the equilibrium x^*, it is in writing the inverse matrix as a nice function of the entries of the matrix A itself, which is where the authors want to get to. In this light, it looks to me like the condition for feasibility (i.e. that all x^* are positive, which is necessary for an ecologically-interpretable solution) is maybe an approximation for the inverse of A---perhaps valid when off-diagonal entries are small. A weakness then for me was in understanding the range of validity of this approximation, and whether it still holds when off-diagonal entries of A (i.e. inter-specific interactions) are arbitrarily large. I could not tell from the simulation runs whether this full range of off-diagonal values was tested.

      We thank the reviewer for pointing this out and we agree that the language used is imprecise. The GLV model is solvable using the matrix inversion method but as they note, this does not give an interpretable expression in terms of the system parameters. This is important as we aim to build understanding of how these parameters (which in turn depend on temperature) affect the richness in communities. We have made this clearer in lines 372-379.

      In regards to the validity of the approximation we have significantly increased the detail of the method in the manuscript, including the assumptions it makes (lines 384-393). In general the method assumes that any individual interaction has a weak effect on abundance. This will fail when the variation in interactions becomes too strong but should be robust to changes in the average interaction strength across the community.

      As a secondary issue here, it would have been helpful to understand whether the authors' feasible solutions are always stable to small perturbations. In general, I would expect this to be an additional criterion needed to understand diversity, though as the authors point out there are certain broad classes of solutions where feasibility implies stability.

      As the reviewer notes previous work using the GLV model by ? has shown that stability almost surely implies stability in the GLV. Thus we expect that our richness estimates derived from feasibility will closely resemble those from stabiltiy. We have amended the maintext to make this argument clear on lines 321-335.

      (2) I did not follow the precise rationale for selecting the temperature dependence of growth rate and interaction rates, or how the latter could be tested with empirical data, though I do think that in principle this could be a valuable way to understand the role of temperature dependence in the Lotka-Volterra equations.

      First, as the authors note, "the temperature dependence of resource supply will undoubtedly be an important factor in microbial communities"

      Even though resources aren't explicitly modeled here, this suggests to me that at some temperatures, resource supply will be sufficiently low for some species that their growth rates will become negative. For example, if temperature dependence is such that the limiting resource for a given species becomes too low to balance its maintenance costs (and hence mortality rate), it seems that the net growth rate will be negative. The alternative would be that temperature affects resource availability, but never such that a limiting resource leads to a negative growth rate when a taxon is rare.

      On the other hand, the functional form for the distribution of growth rates (eq 3) seems to imply that growth rates are always positive. I could imagine that this is a good description of microbial populations in a setting where the resource supply rate is controlled independently of temperature, but it wasn't clear how generally this would hold.

      We thank the reviewer for their comment. The assumption of positive growth rates is indeed a feature of the Boltzmann-Arrhenius model of temperature dependence. We use the Boltzmann-Arrhenius model due to the dependence of growth on metabolic rate. As metabolic rate is ultimately determined by biochemical kinetics its temper- ature dependence is well described by the Boltzmann-Arrhenius. In addition to this reasoning there is a wealth of empirical evidence supporting the use of the Boltzmann- Arrhenius to describe the temperature dependence of growth rate in microbes.

      Ultimately the temperature dependence of resource supply is not something we can directly consider in our model. As such we have to assume that resource supply is sufficient to maintain positive growth rates in the community. Note that this assump- tion only requires resource supply is sufficient to maintain positive growth rates (i.e. the maximal growth rate of species in isolation) not that resource supply is sufficient to maintain growth in the presence of intra- and interspecific competition. We have updated the manuscript in lines 156-159 to make these assumptions more clear.

      Secondly, while I understand that the growth rate in the exponential phase for a single population can be measured to high precision in the lab as a function of temperature, the assumption for the form of the interaction rates' dependence on temperature seems very hard to test using empirical data. In the section starting L193, the authors seem to fit the model parameters using growth rate dependence on temperature, but then assume that it is reasonable to "use the same thermal response for growth rates and interactions". I did not follow this, and I think a weakness here is in not providing clear evidence that the functional form assumed in Equation (4) actually holds.

      The reviewer is correct, it is very difficult to measure interaction coefficients experi- mentally and to our knowledge there is little to no data available on their empirical temperature responses. We as a best guess use the observed variation in thermal physiology parameters for growth rate as a proxy assuming that interactions must also depend on metabolic rates of the interacting species (see also response to com- ment 8).

    1. Author response:

      Reviewer #3 (Public Review):

      The paper by Rai and colleagues examines the transcriptional response of Candida glabrata, a common human fungal pathogen, during interaction with macrophages. They use RNA PolII profiling to identify not just the total transcripts but instead focus on the actively transcribing genes. By examining the profile over time, they identify particular transcripts that are enriched at each timepoint, and build a hierarchical model for how a transcription factor, Xbp1, may regulate this response. Due to technical difficulties in identifying direct targets of Xbp1 during infection, the authors then turn to the targets of Xbp1 during cellular quiescence.

      The authors have generated a large and potentially impactful dataset, examining the responses of C. glabrata during an important host-pathogen interface. However, the conclusions that the authors make are not well supported by the data. The ChIP-seq is interesting, but the authors make conclusions about the biological processes that are differentially regulated without testing them experimentally. Because Candida glabrata has a significant percent of the genome without GO term annotation, the GO term enrichment analysis is less useful than in a model organism. To support these claims, the authors should test the specific phenotypes, and validate that the transcriptional signature is observed at the protein level.

      Additionally, the authors should also include images of the infections, along with measurements of phagocytosis, to show that the time points are the appropriate. At 30 minutes, are C. glabrata actually internalized or just associated? This may explain the difference in adherence genes at the early timepoint. For example, in Lines 123-132, the authors could measure the timing of ROS production by macrophages to determine when these attacks are deployed, instead of speculating based on the increased transcription of DNA damage response genes. Potentially, other factors could be influencing the expression of these proteins. At the late stage of infection, the authors should measure whether the C. glabrata cells are proliferating, or if they have escaped the macrophage, as other fungi can during infection. This may explain some of the increase in transcription of genes related to proliferation.

      An additional limitation to the interpretation of the data is that the authors should put their work in the context of the existing literature on C. albicans temporal adaptation to macrophages, including recent work from Munoz (doi: 10.1038/s41467-019-09599-8), Tucey (doi: 10.1016/j.cmet.2018.03.019), and Tierney (doi: 10.3389/fmicb.2012.00085), among others.

      When comparing the transcriptional profile between WT and xbp1 mutant, it is not clear whether the authors compared the strains under non-stress conditions. The authors should include an analysis of the wild-type to xbp1 mutants in the absence of macrophage stress, as the authors claims of precocious transcription may be a function of overall decreased transcriptional repression, even in the absence of the macrophage stress. The different cut-offs used to call peaks in the two strain backgrounds is also somewhat concerning-it is not clear to me whether that will obscure the transcriptional signature of each of the strains. Additionally, the authors go on to show that the xbp1 mutant has a significant proliferation defect in macrophages, so potentially this could confound the PolII binding sites if the cells are dying.

      In the section on hierarchical analysis of transcription factors, at least one epistasis experiment should have been performed to validate the functional interaction between Xbp1 and a particular transcription factor. If the authors propose a specific motif, they should test this experimentally through EMSA assays to fully test that the motif is functional.

      The jump from macrophages to quiescent culture is also not well justified. If the transcriptional program is so dynamic during a timecourse of macrophage infection, it is hard to translate the findings from a quiescent culture to this host environment.

      Overall, there is a strong beginning and the focus on active transcription in the macrophage is an exciting approach. However, the conclusions need additional experimental evidence.

      We thank this reviewer’s critical analysis of our manuscript and the comments.

      We fully agree that the jump from macrophages to quiescent culture is also not well justified. We have successfully performed CgXbp1 ChIP-seq during macrophage infection and have rewritten the manuscript according to the new results. With the CgXbp1 ChIP-seq data during macrophage infection added, we have removed the data related to quiescence to focus the paper on the macrophage response. Because of this, we have also removed the DNA binding motif analysis from this work and will report the findings in a separate manuscript comparing CgXbp1 bindings between macrophage response and quiescence.

      As mentioned above, the RNAPII ChIP-seq time course experiment compared RNAP occupancies at different times during infection to the first infection time point. We did not calculate relative to the data in the absence of stress (e.g. before infection), because Xbp1 was expressed at a low level and induced by stresses. Hence its role under no stress conditions is expected to be less than inside macrophages. In addition, up-regulation of its target genes depends on the presence of their transcriptional activators under the experimental conditions, which is going to be very different in normal growth media (RPMI or YPD; i.e. before infection) versus inside macrophages. Hence, comparing to normal growth media would not show the real CgXbp1 effects and/or the CgXbp1 effect might be different. In fact, this can be seen from the new RNAseq analysis of wildtype and Cgxbp1∆ C. glabrata cells in the presence and absence of fluconazole (which are added to the revised manuscript to study CgXbp1’s role on fluconazole resistance). The result shows that CgXbp1 (which was expressed at a low level) has a very small effect on global expression and the up-regulated genes are mainly related to transmembrane transport. More importantly, the effect of the Cgxbp1∆ mutant on TCA cycle and amino acid biosynthesis genes’ expression during macrophage infection is not observed when the mutant is grown under normal growth conditions (YPD without fluconazole). Therefore, the results show that CgXbp1 has condition-specific effects on global gene expression, which is also dependent on the transcriptional activators present in the cell. The result of the new RNAseq analysis of wildtype and Cgxbp1∆ C. glabrata cells in the absence of fluconazole is described in lines 329-339 as follows: “On the other hand, 135 genes were differentially expressed in the Cgxbp1∆ mutant during normal exponential growth (i.e. no fluconazole treatment) (Figure 6c) with up-regulated genes highly enriched with the “transmembrane transport” function and down- regulated genes associated with different metabolic processes (e.g. carbohydrate, glycogen and trehalose) (e.g. carbon metabolism, nucleotide metabolism, and transmembrane transport, etc.) (Supplementary Table 12). Interesting, the TCA cycle and amino acid biosynthesis genes, whose expressions were accelerated in the Cgxbp1∆ mutant during macrophage (Figure 3C, 3D), were not affected by the loss of CgXbp1 function under normal growth conditions (i.e. in YPD media without fluconazole) (Supplementary Figure 11, Supplementary Table 11), suggesting that the overall (direct and indirect) effects of CgXbp1 are condition-specific.”

      For the comment about RNAPII bindings affected by dying cells, our observation of reduced proliferation does not mean that the cells were dying, because we did observe increase in cell numbers over time (i.e. the cells were proliferating) but the rate of proliferation was slower in the Cgxbp1∆ mutant comparing to wildtype. Presumably, the reduced proliferation and/or growth within macrophages is due to poorer adaptation in and compromised response to macrophages.

      We have also discussed our findings in the context of the suggested (and other) literatures in various parts of the Discussion.

      Reviewer #4 (Public Review):

      Macrophages are the first line of defense against invading pathogens. C. glabrata must interact with these cells as do all pathogens seeking to establish an infection. Here, a ChIP-seq approach is used to measure levels of RNA polymerase II levels across Cg genes in a macrophage infection assay. Differential gene expression is analyzed with increasing time of infection. These differentially expressed genes are compared at the promoter level to identify potential transcription factors that may be involved in their regulation. A factor called CgXbp1 on the basis of its similar with the S. cerevisiae Xbp1 protein is characterized. ChIP-seq is done on CgXbp1 using in vitro grown cells and a potential binding site identified. Evidence is provided that CgXbp1 affects virulence in a Galleria system and that this factor might impact azole resistance.

      As the authors point out, candidiasis associated with C. glabrata has dramatically increased in the recent past. Understanding the unique aspects of this Candida species would be a great value in trying to unravel the basis of the increasing fungal disease caused by C. glabrata. The use of ChIP-seq analysis to assess the time-dependent association of RNA polymerase II with Cg genes is a nice approach. Identification of CgXbp1 as a potential participant in the control of this gene expression program is also interesting. Unfortunately, this work suffers by comparison to a significant amount of previous effort that renders the progress detailed here incremental at best.

      I agree that their ChIP-seq time course of RNA polymerase II distribution across the Cg genome is both elegant and an improvement on previous microarray experiments. However, these microarray experiments were carried out 14 years ago and while the current work is certainly at higher resolution, little more can be gleaned from the current work. The authors argue that standard transcriptional analysis is compromised by transcript stability effects. I would suggest that, while no approach is without issues, quite a bit has been learned from approaches like RNA-seq and there are recent developments to this technique that allow for a focus on newly synthesized mRNA (thiouridine labeling).

      The CgXbp1 characterization relies heavily on work from S. cerevisiae. This is disappointing as conservation of functional links between C. glabrata and S. cerevisiae is not always predictable.

      The effects caused by loss of CgXBP1 on virulence (Figure 4) may be statistically significant but are modest. No comparison is shown for another gene that has already been accepted to have a role in virulence to allow determination of the biological importance of this effect.

      The phenotypic effects of the loss of XBP1 on azole resistance look rather odd (Figure 6). The appearance of fluconazole resistant colonies in the xbp1 null strain occurs at a very low frequency and seems to resemble the appearance of rho0 cells in the population. The vast majority of xbp1 null cells do not exhibit increased growth compared to wild-type in the presence of fluconazole.

      Irrespective of the precise explanation, more analysis should be performed to confirm that CgXbp1 is negatively regulating the genes suggested in Figure 6A to be responsible for the increased fluconazole resistance.

      Additionally, the entire analysis of CgXbp1 is based on ChIP-seq performed using cells grown under very different conditions that the RNA polymerase II study. Evidence should be provided that the presumptive CgXbp1 target genes actually impact the expression profiles established earlier.

      We thank this reviewer’s critical analysis of our manuscript. We have done the following to address the comments. As a result, the manuscript is significantly improved.

      • The ChIP-seq data of Xbp1 in macrophage has been successfully generated and the result is now presented in Figure 2C-2F, and lines 182-227 of the revised manuscript. With the addition, we have removed the ChIPseq data related to quiescent from the revised manuscript and re-written the manuscript focusing on the role of Xbp1 in macrophage.

      • We agree that the conservation of functional links between C. glabrata and S. cerevisiae is not always predictable. That’s the reason why we did not solely rely on the S. cerevisiae network for inferring Xbp1’s functions, and had undertaken several different ways (e.g. ChIP-seq of Xbp1 and characterization of the Cgxbp1∆ mutant) to delineate its functions.

      • We also agree that the virulence effect is modest, but it is, nevertheless, an effect that may contribute to the overall virulence of C. glabrata. Since virulence is a pleiotropic trait involving many genes and every gene affects different aspects of the complex process, we feel that it is not fair to penalize a given gene based on its (weaker) effect relative to another gene. Therefore, we respectfully disagree that another gene should be included for benchmarking the effect.

      • We have measured C. glabrata cell numbers in a time course experiment. The result (presented in Figure 4A) showed that there was an increase in cell number at the end of the macrophage infection time course experiment (e.g. 8 hr). We have highlighted this information on lines 278-283.

      • Additional analysis of the fluconazole resistance phenotype of the Cgxbp1∆ mutant has been added, including standard MIC assays. The results are presented in Figure 5C-5E.

      • As suggested and to understand the role of CgXbp1 on fluconazole resistance, we have now carried out RNAseq analysis of WT and the Cgxbp1∆ mutant in the presence and absence of fluconazole. The genes differentially controlled in the Cgxbp1∆ mutant have been identified and a proposed model on how CgXbp1 affects fluconazole resistance is added to Figure 7 in the revised manuscript.

    1. Author response:

      Reviewer #1 (Public Review):

      The authors conducted cross-species comparisons between the human brain and the macaque brain to disentangle the specific characteristics of structural development of the human brain. Although previous studies had revealed similarities and differences in brain anatomy between the two species by spatially aligning the brains, the authors made the comparison along the chronological axis by establishing models for predicting the chronological ages with the inputting brain structural features. The rationale is actually clear given that brain development occurs over time in both. More interestingly, the model trained on macaque data was better able to predict the age of humans than the human-trained model was at predicting macaque age. This revealed a brain cross-species age gap (BCAP) that quantified the discrepancy in brain development between the two species, and the authors even found this BCAP measure was associated with performance on behavioral tests in humans. Overall, this study provides important and novel insights into the unique characteristics of human brain development. The authors have employed a rigorous scientific approach, reflecting diligent efforts to scrutinize the patterns of brain age models across species. The clarity of the rationale, the interpretability of the methods, and the quality of the presentation all contribute to the strength of this work.

      We are grateful to your helpful and thorough review and for being so positive about our manuscript. Following your recommendations, we have added more analytic details that have strengthened our paper. We would like to thank you for your input.

      Reviewer #2 (Public Review):

      In the current study, Li et al. developed a novel approach that aligns chronological age to a cross-species brain age prediction model to investigate the evolutionary effect. This method revealed some interesting findings, like the brain-age gap of the macaque model in predicting human age will increase as chronological age increases, suggesting an evolutionary alignment between the macaque brain and the human brain in the early stage of development. This study exhibits ample novelty and research significance. However, I still have some concerns regarding the reliability of the current findings.

      We thank you for the positive and appreciative feedback on our work and the insightful comments, which we have addressed below.

      Question 1: Although the authors named their new method a "cross-species" model, the current study only focused on the prediction between humans and macaques. It would be better to discuss whether their method can also generalize to cross-species examination of other species (e.g., C. elegans), which may provide more comprehensive evolutionary insights. Also, other future directions with their new method are worth discussing.

      We appreciate your insightful comment regarding the generalizability of our model to other species. As you said, we indeed only performed human-macaque cross-species study not including other species. In our study, we only focused human and macaque because macaque is considered to be one of the closest primates to humans except chimpanzees and thus is considered to be the best model for studying human brain evolution. However, our proposed method has limitations that limit its generalizability for other species, e.g., C. elegans. First, our model was trained using MRI data, which limits its applicability to species for which such data is unavailable. This technological requirement brings a barrier to broaden cross-species application. Second, our current model is based on homologous brain atlases that are available for both humans and macaques. The lack of comparable atlases for other species further restricts the model's generalizability. We have discussed this limitation in the revised manuscript and outlined potential future directions to overcome these challenges. This includes discussing the need for developing comparable imaging techniques and standardized brain atlases across a wider range of species to enhance the model's applicability and broaden our understanding of cross-species neurodevelopmental patterns.

      On page 15, lines 11-18

      “However, the existing limitation should be noted regarding the generalizability of our proposed approach for cross-species brain comparison. Our current model relies on homologous brain atlases, and the lack of comparable atlases for other species restricts its broader applicability. To address this limitation, future research should focus on developing prediction models that do not depend on atlases. For instance, 3D convolutional neural networks could be trained directly on raw MRI data for age prediction. These deep learning models may offer greater flexibility for cross-species applications once the training within species is complete. Such advancements would significantly enhance the model's adaptability and expand its potential for comparative neuroscience studies across a wider range of species.”

      Question 2: Algorithm of prediction model. In the method section, the authors only described how they chose features, but did no description about the algorithm (e.g., supporting vector regression) they used. Please add relevant descriptions to the methods.

      Thank you for your comment. We apologize for not providing sufficient details about the model training process in our initial submission. In our study, we used a linear regression model for prediction. We have provided more details regarding the algorithm of prediction model in our response to Reviewer #1. For your convenience, we have attached them below.

      For details on the algorithm of prediction model:

      “A linear regression model was adopted for intra- and inter-species age prediction. The linear regression model was built including the following three main steps: 1) Feature selection: a total of two steps are required to extract the final features. The first step is preliminary extraction. First, all the human or macaque participants were divided into 10-fold and 9-fold was used for model training and 1-fold for model test. The preliminary features were chosen by identifying the significantly age-associated features with p < 0.01 during calculating Pearson’s correlation coefficients between all the 260 features and actual ages of the 9-fold subjects. This process was repeated 100 times. Since we obtained not exactly the same preliminary features each time, we thus further analyzed the preliminary features using two methods to determine the final features: common features and minimum mean absolute error (min MAE). Common features are the preliminary features that were selected in all the 100 times during preliminary model training. The min MAE features were the preliminary features that with the smallest MAE value during the 100 times model test for predicting age. After the above feature selections, we obtained two sets of features: 62 macaque features and 225 human features (common features) and 117 macaque features and 239 human features (min MAE). In addition, to further exclude the influences of unequal number of features in human and macaque, we also selected the first 62 features in human and macaque to test the model prediction performances. 2) Model construction: we conducted age prediction linear model using 10-fold cross-validation based on the selected features for human and macaque separately. The linear model parameters are obtained using the training set data and applied to the test set for prediction. The above process is also repeated 100 times. 3) Prediction: with the above results, we obtained the optimal linear prediction models for human and macaque. Next, we performed intra-species and inter-species brain age prediction, i.e., human model predicted human age, human model predicted macaque age, macaque model predicted macaque age and macaque model predicted human age. Three sets of features (62 macaque features and 225 human features; 117 macaque features and 239 human features; 62 macaque features and 62 human features) were used to test the prediction models for cross-validation and to exclude effects of different number of features in human and macaque. In the main text, we showed the results of brain age prediction, brain developmental and evolutional analyses based on common features and the results obtained using other two types of features were shown in supplementary materials. The prediction performances were evaluated by calculating the Pearson’s correlation and MAE between actual ages and predicted ages.”

      Question 3: Sex difference. The sex difference results are strange to me. For example, in the second row of Figure Supplement 3A, different models show different correlation patterns, but why their Pearson's r is all equal to 0.3939? If they are only typo errors, please correct them. The authors claimed that they found no sex difference. However, the results in Figure Supplement 3 show that, the female seems to have poorer performance in predicting macaque age from the human model. Moreover, accumulated studies have reported sex differences in developing brains (Hines, 2011; Kurth et al., 2021). I think it is also worth discussing why sex differences can't be found in the evolutionary effect.

      Reference:

      Hines, M. (2011). Gender development and the human brain. Annual review of neuroscience, 34, 69-88.

      Kurth, F., Gaser, C., & Luders, E. (2021). Development of sex differences in the human brain. Cognitive Neuroscience, 12(3-4), 155-162.

      It is recommended that the authors explore different prediction models for different species. Maybe macaques are suitable for linear prediction models, and humans are suitable for nonlinear prediction models.

      Thank you for pointing the typos out and comments on sex difference. In Figure Supplement 3A, there are typos for Pearson’s r values and we have corrected it in updated Figure 2-figure supplement 3. For details, please see the updated Figure 2-figure supplement 3 and the following figure.

      Regarding gender effects, we acknowledge your point about the importance of gender differences in understanding brain evolution and development. In our study, however, our primary goal was to develop a robust age prediction model by maximizing the number of training samples. To mitigate gender-related effects in our main results, we incorporated gender information as a covariate in the ComBat harmonization process. We conducted a supplementary analysis just to demonstrate the stability of our proposed cross-species age prediction model by separating the data with gender variable not to investigate gender differences. Although our results demonstrated that gender-specific models could still significantly predict chronological age, we refrained from emphasizing these models' performance in gender-specific species comparisons due to difficulty in explanation for the predicted gender difference. For cross-species prediction, whether a higher Pearson’s r value between actual age and predicted age could reflect conserved evolution for male or female is not convincing. In addition, we adopted same not different prediction models for human and macaque aiming to establish a comparable model between species. Generally speaking, the nonlinear model could obtain better prediction accuracy than linear model. If different species used different models, it is unfair to perform cross-species prediction. Importantly, our study aimed to developed new index based on the same prediction models to quantify brain evolution difference, i.e., brain cross-species age gap (BCAP) instead of traditional statistical analyses. Different prediction models for different species may introduce bias causing by prediction methods and thus impacting the accuracy of BCAP. Thus, we adopted the linear model with best prediction performances for intra-species prediction in this study for cross-species prediction. Although our main goal in this study is to set up stable cross-species prediction model and the models built using either male or female subjects showed good performances during cross-species prediction, however, as your comment, how to unbiasedly characterize evolutionary gender differences using machining learning approaches needs to be further investigated since there are many reports about the gender difference in developing brain in humans. In fact, whether macaque brains have the same gender differences as humans is an interesting scientific question worth studying. Thus, we have included a discussion on how to use machining learning method to study the evolutionary gender difference in our revised manuscript.

      On page 15, lines 18-23 and page 16, line 1-4

      “Many studies have reported sex differences in developing human brains (Hines, 2011; Kurth, Gaser, & Luders, 2021), however, whether macaque brains have similar sex differences as humans is still unknown. We used machining learning method for cross-species prediction to quantify brain evolution and the established prediction models are stable even when only using male or female data, which may indicate that the proposed cross-species prediction model has no evolutionary sex difference. Although the stable prediction model can be established in either male or female participants for cross-species prediction, this indeed does not mean that there are no evolutionary sex differences due to lack of quantitative comparative analysis. In the future, we need to develop more objective, quantifiable and stable index for studying sex differences using machining learning methods to further identify sex differences in the evolved brain”

      Reviewer #3 (Public Review):

      The authors identified a series of WM and GM features that correlated with age in human and macaque structural imaging data. The data was gathered from the HCP and WA studies, which was parcellated in order to yield a set of features. Features that correlated with age were used to train predictive intra and inter-species models of human and macaque age. Interestingly, while each model accurately predicted the corresponding species age, using the macaque model to predict human age was more accurate than the inverse (using the human model to predict macaque age). In addition, the prediction error of the macaque model in predicting human age increased with age, whereas the prediction error of the human model predicting macaque age decreased with age.

      After elaboration of the predictive models, the authors classified the features for prediction into human-specific, macaque-specific and common to human and macaque, where they most notably found that macaque-only and common human-macaque areas were located mainly in gray matter, with only a few human-specific features found in gray matter. Furthermore, the authors found significant correlations between BCAP and picture vocabulary (positive correlation) test and visual sensitivity (negative correlation) test. Several white matter tracts (AF, OR, SLFII) were also identified showing a correlation with BCAP.

      Thank you for providing this excellent summary. We appreciate your thorough review and concise overview of our work.

      STRENGTHS AND WEAKNESSES

      The paper brings an interesting perspective on the evolutionary trajectories of human and non-human primate brain structure, and its relation to behavior and cognition. Overall, the methods are robust and support the theoretical background of the paper. However, the overall clarity of the paper could be improved. There are many convoluted sentences and there seems to be both repetition across the different sections and unclear or missing information. For example, the Introduction does not clearly state the research questions, rather just briefly mentions research gaps existing in the literature and follows by describing the experimental method. It would be desirable to clearly state the theoretical background and research questions and leave out details on methodology. In addition, the results section repeats a lot of what is already stated in the methods. This could be further simplified and make the paper much easier to read.

      In the discussion, authors mention that "findings about cortex expansion are inconsistent and even contradictory", a more convincing argument could be made by elaborating on why the cortex expansion index is inadequate and how BCAP is more accurate.

      Thank you for highlighting the interesting aspects of our work. We are sorry for the lack of the clarity in certain parts of our manuscript. Following your valuable suggestions, we have revised the manuscript to reduce unnecessary repetitions and provide a clearer statement of our research question in Introduction. Specifically, unlike previous analyses of human and macaque evolution using comparative neuroscience, this study embeds chronological axis into the cross-species evolutionary analysis process. It constructed a linear prediction model of brain age for humans and macaques, and quantitatively described the degree of evolution. The brain structure based cross-species age prediction model and cross-species brain age differences proposed in this study further eliminate the inherent developmental effects of humans and macaques on cross-species evolutionary comparisons, providing new perspectives and approaches for studying cross-species development. Regarding the existing repetition in the results section, we have simplified them for the clarity. Regarding the comparison between the cortex expansion index and BCAP, we would like to emphasize that the cortex expansion index was derived without fully considering cross-species alignment along the chronological axis. Specifically, this index does not correspond to a specific developmental stage, but rather focuses on a direct comparison between the two species. In contrast, BCAP addresses this limitation by utilizing a prediction model to establish alignment (or misalignment) between species at the individual level. Therefore, BCAP may serve as a more flexible and nuanced tool for cross-species brain comparison.

      STUDY AIMS AND STRENGTH OF CONCLUSIONS

      Overall, the methods are robust and support the theoretical background of the paper, but it would be good to state the specific research questions -even if exploratory in nature- more specifically. Nevertheless, the results provide support for the research aims.

      Thank you for excellent suggestion. We have revised our introduction to state the specific research question as mentioned above.

      IMPACT OF THE WORK AND UTILITY OF METHODS AND DATA TO THE COMMUNITY

      This study is a good first step in providing a new insight into the neurodevelopmental trajectories of humans and non-human primates besides the existing cortical expansion theories.

      Thank you for your encouraging comment.

      ADDITIONAL CONTEXT:

      It should be clearly stated both in the abstract and methods that the data used for the experiment came from public databases.

      Thank you for your suggestion. We have added this information in both abstract and method. For details, please see page 2, line 9 in Abstract section; page 16, lines 10-11 and page 17, lines 6-10 in Materials and Method section.

    1. Author response:

      Reviewer #1 (Public Review):

      Using structural analysis, Bonchuk and colleagues demonstrate that the TTK-like BTB/POZs of insects form stable hexameric assemblies composed of trimers of POZ dimers, a configuration observed consistently across both homomultimers and heteromultimers, which are known to be formed by TTK-like BTB/POZ domains. The structural data is comprehensive, unambiguous, and further supported by theoretical fold prediction analyses. In particular the judicious complementation of experiments and fold prediction is commendable. This study now adds an important cog that might help generalize the general principles of the evolution of multimerization in members of this fold family.

      I strongly feel that enhancing the inclusivity of the discussion would strengthen the paper. Below, I suggest some additional points for consideration for the same.

      Major points.

      1) It would be valuable to discuss alternative multimer assembly interfaces, considering the diverse ways POZs can multimerize. For instance, the Potassium channel POZ domains form tetramers. A comparison of their inter-subunit interface with that of TTK and non-TTK POZs could provide insightful contrasts.

      Thanks for the suggestion, we added this important comparison, as well as comparison with recently published structures of filament-forming BTB domains.

      2) The so-called TTK motif, despite its unique sequence signature, essentially corresponds to the N-terminal extension observed in other "non-TTK" proteins such as Miz-1. Given Miz-1's structure, it becomes evident that the utilization of the N-terminal extension for dimerization is shared with the TTK family, suggesting a common evolutionary origin in metazoan transcription factors. Early phylogenetic trees (e.g. in PMID: 9917379) support the grouping of the TTK-like POZs with other animal Transcription factors containing POZ domains such as those with Kelch repeats further suggesting that the extension might be ancestral. Structural investigations by modeling prominent examples or comparing known structures of similar POZ domains, could support this inference. Control comparisons with POZ domains from fungi, plants and amoebozoans like Dictyostelium could offer additional insights.

      We performed AlphaFold2-Multimer modeling of dimers of all BTB domains from the most ancestral metazoan clades, Placozoa and Porifera, along with BTBs from Choanoflagellates – the closest to first metazoans unicellular eukaryotes. The presence of N-terminal beta-sheet was evaluated. KLHL-BTBs are present in all eukaryotes and likely are predecessors of ZBTB domains. According to AlphaFold modeling of dimers, all KLHL-BTB domains of plants and basal metazoans have alpha1 helix, but most of these domains from do not possess additional N-terminal beta-strand (beta1) characteristic for ZBTB domains. We found only one KLHL-BTB (Uniprot ID: AA9VCT1_MONBE) with such N-terminal extension in Choanoflagellate proteome, one in Dictyostelium proteome (Q54F31_DICDI), and 7 (out of 43 BTB domains in total) and 13 (out of 81) such domains in Trichoplax and Amphimedon proteomes correspondingly. There was no significant sequence similarity of beta1 element at the level of primary sequence. However, most of these domains bear 3-box/BACK extension and represent typical KLHL-BTBs which are member of E3 ubiquitin-ligase complexes, they are often associated with protein-protein interacting MATH domain or WD40 repeats. We found only one protein in Trichoplax proteome with beta1 strand devoid of 3-box/BACK (B3RQ74_TRIAD), thus resembling ZBTB topology. Thus, likely emergence of BTB domains of this subtype occurred early in Metazoan evolution. At this point ZBTBs were not yet associated with zinc-fingers. According to our survey, actual fusion of ZBTB domain with zinc-finger domains occurred in the evolution of earlier bilaterian organisms since proteins with such domain architecture are not found in Radiata but are present in basal Protostomia and Deuterostomia clades. TTK-type sequence is characteristic only for Arthropoda and emerged early in their evolution. We added all these data to the article.

      3) Exploring the ancestral presence of the aforementioned extension in metazoan transcription factors could serve as a foundation for understanding the evolutionary pathway of hexamerization. This analysis could shed light on exposed structural regions that had the potential to interact post-dimerization with the N-terminal extension and also might provide insights into the evolution of multimer interfaces, as observed in the Potassium channel.

      We added this important comparison as well as comparison with recent structures of filament-forming BTB domains.

      4) Considering the role of conserved residues in the multimer interface is crucial. Reference to conserved residues involved in multimer formation, such as discussed in PMID: 9917379, would enrich the discussion.

      We updated our description of multimer interface with respect to conservation of residues.

      Reviewer #2 (Public Review):

      BTB domains are protein-protein interaction domains found in diverse eukaryotic proteins, including transcription factors. It was previously known that many of the Drosophila transcription factor BTB domains are of the TTK-type - these are defined as having a highly-conserved motif, FxLRWN, at their N-terminus, and they thereby differ from the mammalian BTB domains. Whereas the well-characterised mammalian BTB domains are dimeric, several Drosophila TTK-BTB domains notably form multimers and function as chromosome architectural proteins. The aims of this work were (i) to determine the structural basis of multimerisation of the Drosophila TTK-BTB domains, (ii) to determine how different Drosophila TTK-BTB domains interact with each other, and (iii) to investigate the evolution of this subtype of BTB domain.

      The work significantly advances our understanding of the biology of BTB domains. The conclusions of the paper are mostly well-supported, although some aspects need clarification:

      Hexameric organisation of the TTK-type BTB domains:

      Using cryo-EM, the authors showed that the CG6765 TTK-type BTB domain forms a hexameric assembly in which three "classic" BTB dimers interact via a beta-sheet interface involving the B3 strand. This is particularly interesting, as this region of the BTB domain has recently been implicated in protein-protein interactions in a mammalian BTB-transcription factor, MIZ1. SEC-MALS analysis indicated that the LOLA TTK-type BTB domain is also hexameric, and SAXS data was consistent with a hexameric assembly of the CG6765- and LOLA BTB domains.

      The data regarding the hexameric organisation is convincing. However, interpreting the role of specific regions of the BTB domain is difficult because the description of the molecular contacts lacks depth.

      Heteromeric interactions between TTK-type BTB domains:

      The authors use yeast two-hybrid assays to study heteromeric interactions between various Drosophila TTK-type BTB domains. Such assays are notorious for producing false positives, and this needs to be mentioned. Although the authors suggest that the heteromeric interactions are mediated via the newly-identify B3 interaction interface, there is no evidence to support this, since mutation of B3 yielded insoluble proteins.

      We are aware that Y2H can give false positive results in cases where the BTB domain fused to the DNA binding domain can activate reporter genes. Therefore, all tested BTB domains were examined for their ability to activate transcription. Furthermore, in our study, assays with non-TTK-type BTB domains, which showed almost no interactions, provide additional negative control. We have added a corresponding disclaimer in the text. We agree that our data do not explain the basis for heteromeric interactions. Design of mutations in B3 beta-sheet proved to be complicated, using of biochemical methods to study the principles of heteromer assembly also does not seem to be feasible since most TTK-type BTBs tend to form aggregates and are difficult to be expressed and purified. But most important issue is that demonstrated ability of heteromer assembly through B3 in few tested pairs cannot be applied for all pairs, some of them still may use different mechanism. We used AlphaFold to predict possible mechanisms of heteromer assemblies. AlphaFold suggested that usage of both B3 and conventional dimerization interfaces for heteromeric interactions are possible in various cases, with preference of one over another in different pairs. Thus, most likely the presence of two potential heteromerization interfaces extends the heteromerization capability of these domains. We changed the text accordingly.

      Evolution of the TTK-type BTB domains:

      The authors carried out a bioinformatics analysis of BTB proteins and showed that most of the Drosophila BTB transcription factors (24 out of 28) are of the TTK-type. They investigated how the TTK-type BTB domains emerged during evolution, and showed that these are only found in Arthropoda, and underwent lineage-specific expansion in the modern phylogenetic groups of insects. These findings are well-supported by the evidence.

    1. Author response:

      Reviewer #1 - Public Review

      This report describes work aiming to delineate multi-modal MRI correlates of psychopathology from a large cohort of children of 9-11 years from the ABCD cohort. While uni-modal characterisations have been made, the authors rightly argue that multi-modal approaches in imaging are vital to comprehensively and robustly capture modes of large-scale brain variation that may be associated with pathology. The primary analysis integrates structural and resting-state functional data, while post-hoc analyses on subsamples incorporate task and diffusion data. Five latent components (LCs) are identified, with the first three, corresponding to p-factor, internal/externalising, and neurodevelopmental Michelini Factors, described in detail. In addition, associations of these components with primary and secondary RSFC functional gradients were identified, and LCs were validated in a replication sample via assessment of correlations of loadings.

      1.1) This work is clearly novel and a comprehensive study of associations within this dataset. Multi-modal analyses are challenging to perform, but this work is methodologically rigorous, with careful implementation of discovery and replication assessments, and primary and exploratory analyses. The ABCD dataset is large, and behavioural and MRI protocols seem appropriate and extensive enough for this study. The study lays out comprehensive associations between MRI brain measures and behaviour that appear to recapitulate the established hierarchical structure of psychopathology.

      We thank Reviewer 1 for appreciating our methods and findings, and we address their suggestions below:

      1.2) The work does have weaknesses, some of them acknowledged. There is limited focus on the strength of observed associations. While the latent component loadings seem reliably reproducible in the behavourial domain, this is considerably less the case in the imaging modalities. A considerable proportion of statistical results focuses on spatial associations in loadings between modalities - it seems likely that these reflect intrinsic correlations between modalities, rather than associations specific to any latent component.

      We appreciate the Reviewer’s comment, and minimized the reporting of correlations between the loadings from the different modalities in the revised Results (specifically subsections on LC1, LC2, and LC3). We now refer to Table S4 in each subsection for this information: “Spatial correlations between modality-specific loadings are reported in Supplementary file 1c.”

      For completeness, we report the intrinsic correlations between the different modalities in Supplementary file 1c (P.19):

      “Lastly, although the current work aimed to reduce intrinsic correlations between variables within a given modality through running a PCA before the PLS approach, intrinsic correlations between measures and modalities may potentially be a remaining factor influencing the PLS solution. We, thus, provided an additional overview of the intrinsic correlations between the different neuroimaging data modalities in the supporting results (Supplementary file 1c).”

      1.3) Assessment of associations with functional gradients is similarly a little hard to interpret. Thus, it is hard to judge the implications for our understanding of the neurophysiological basis of psychopathology and the ability of MRI to provide clinical tools for, say, stratification.

      We now provide additional context, including a rising body of theoretical and empirical work, that outlines the value of functional gradients and cortical hierarchies in the understanding of brain development and psychopathology. Please see P.26.

      “Initially demonstrated at the level of intrinsic functional connectivity (Margulies et al., 2016), follow up work confirmed a similar cortical patterning using microarchitectural in-vivo MRI indices related to cortical myelination (Burt et al., 2018; Huntenburg et al., 2017; Paquola et al., 2019), post-mortem cytoarchitecture (Goulas et al., 2018; Paquola et al., 2020, 2019), or post-mortem microarray gene expression (Burt et al., 2018). Spatiotemporal patterns in the formation and maturation of large-scale networks have been found to follow a similar sensory-to-association axis; moreover, there is the emerging view that this framework may offer key insights into brain plasticity and susceptibility to psychopathology (Sydnor et al., 2021). In particular, the increased vulnerability of transmodal association cortices in late childhood and early adolescence has been suggested to relate to prolonged maturation and potential for plastic reconfigurations of these systems (Paquola et al., 2019; Park et al., 2022b). Between mid-childhood and early adolescence, heteromodal association systems such as the default network become progressively more integrated among distant regions, while being more differentiated from spatially adjacent systems, paralleling the development of cognitive control, as well as increasingly abstract and logical thinking. [...] This suggests that neurodevelopmental difficulties might be related to alterations in various processes underpinned by sensory and association regions, as well as the macroscale balance and hierarchy of these systems, in line with previous findings in several neurodevelopmental conditions, including autism, schizophrenia, as well as epilepsy, showing a decreased differentiation between the two anchors of this gradient (Hong et al., 2019). In future work, it will be important to evaluate these tools for diagnostics and population stratification. In particular, the compact and low dimensional perspective of gradients may provide beneficial in terms of biomarker reliability as well as phenotypic prediction, as previously demonstrated using typically developing cohorts (Hong et al. 2020) On the other hand, it will be of interest to explore in how far alterations in connectivity along sensory-to-transmodal hierarchies provide sufficient graduality to differentiate between specific psychopathologies, or whether they, as the current work suggests, mainly reflect risk for general psychopathology and atypical development.”

      1.4) The observation of a recapitulation of psychopathology hierarchy may be somewhat undermined by the relatively modest strength of the components in the imaging domain.

      We thank the Reviewer for this comment, and now expressed this limitation in the revised Discussion, P.23.

      “The p factor, internalizing, externalizing, and neurodevelopmental dimensions were each associated with distinct morphological and intrinsic functional connectivity signatures, although these relationships varied in strength.”

      1.5) The task fMRI was assessed with a fairly basic functional connectivity approach, not using task timings to more specifically extract network responses.

      In the revised Discussion on P.24, we acknowledge that more in-depth analyses of task-based fMRI may have offered additional insights into state-dependent changes in functional architecture.

      “While the current work derived main imaging signatures from resting-state fMRI as well as grey matter morphometry, we could nevertheless demonstrate associations to white matter architecture (derived from diffusion MRI tractography) and recover similar dimensions when using task-based fMRI connectivity. Despite subtle variations in the strength of observed associations, the latter finding provided additional support that the different behavioral dimensions of psychopathology more generally relate to alterations in functional connectivity. Given that task-based fMRI data offers numerous avenues for analytical exploration, our findings may motivate follow-up work assessing associations to network- and gradient-based response strength and timing with respect to external stimuli across different functional states.”

      1.6) Overall, the authors achieve their aim to provide a detailed multimodal characterisation of MRI correlations of psychopathology. Code and data are available and well organised and should provide a valuable resource for researchers wanting to understand MRI-based neural correlates of psycho-pathology-related behavioural traits in this important age group. It is largely a descriptive study, with comparisons to previous uni-modal work, but without particularly strong testing of neuroscience hypotheses.

      We thank the Reviewer for recognizing the detail and rigor of data-driven study and extensive code and data documentation.

      Reviewer #2 - Public Review

      In "Multi-modal Neural Correlates of Childhood Psychopathology" Krebets et al. integrate multi-modal neuroimaging data using machine learning to delineate dissociable links to diverse dimensions of psychopathology in the ABCD sample. This paper had numerous strengths including a superb use of a large resource dataset, appropriate analyses, beautiful visualizations, clear writing, and highly interpretable results from a data-driven analysis. Overall, I think it would certainly be of interest to a general readership. That being said, I do have several comments for the authors to consider.

      We thank Dr Satterthwaite for the positive evaluation and helpful comments.

      2.1) Out-of-sample testing: while the permutation testing procedure for the PLS is entirely appropriate, without out-of-sample testing the reported effect sizes are likely inflated.

      As discussed in the editorial summary of essential revisions, we agree that out-of-sample prediction indeed provides stronger estimates of generalizability. We assess this by applying the PCA coefficients derived from the discovery cohort imaging data to the replication cohort imaging data. The resulting PCA scores and behavioral data were then z-scored using the mean and standard deviation of the replication cohort. The SVD weights derived from the discovery cohort were applied to the normalized replication cohort data to derive imaging and behavioral composite scores, which were used to recover the contribution of each imaging and behavioral variable to the LCs (i.e., loadings). Out-of-sample replicability of imaging (mean r=0.681, S.D.=0.131) and behavioral (mean r=0.948, S.D.=0.022) loadings was generally high across LCs 1-5. This analysis is reported in the revised manuscript (P.18).

      “Generalizability of reported findings was also assessed by directly applying PCA coefficients and latent components weights from the PLS analysis performed in the discovery cohort to the replication sample data. Out-of-sample prediction was overall high across LCs1-5 for both imaging (mean r=0.681, S.D.=0.131) and behavioral (mean r=0.948, S.D.=0.022) loadings.”

      2.2) Site/family structure: it was unclear how site/family structure were handled as covariates.

      Only unrelated participants were included in discovery and replication samples (see P.6). The site variable was regressed out of the imaging and behavioral data prior to the PLS analysis using the residuals from a multiple linear model which also included age, age2, sex, and ethnicity. This is now clarified on P.29:

      “Prior to the PLS analysis, effects of age, age2, sex, site, and ethnicity were regressed out from the behavioral and imaging data using a multiple linear regression to ensure that the LCs would not be driven by possible confounders (Kebets et al., 2021, 2019; Xia et al., 2018). The imaging and behavioral residuals of this procedure were input to the PLS analysis.”

      2.3) Anatomical features: I was a bit surprised to see volume, surface area, and thickness all evaluated - and that there were several comments on the correspondence between the SA and volume in the results section. Given that cortical volume is simply a product of SA and CT (and mainly driven by SA), this result may be pre-required.

      As suggested, we reduced the reporting of correlations between the loadings from the different modalities in the revised Results (specifically subsections on LC1, LC2, and LC3). Instead, we now refer to Table S4 in each subsection for this information: “Spatial correlations between modality-specific loadings are reported in Supplementary file 1c.”

      We also reran the PLS analysis while only including thickness and surface area as our structural metrics, to account for potential redundancy of these measures with volume. This analysis and associated findings are reported on P.36 and P.19:

      “As cortical volume is a result of both thickness and surface area, we repeated our main PLS analysis while excluding cortical volume from our imaging metrics and report the consistency of these findings with our main model.”

      “Third, to account for redundancy within structural imaging metrics included in our main PLS model (i.e., cortical volume is a result of both thickness and surface area), we also repeated our main analysis while excluding cortical volume from our imaging metrics. Findings were very similar to those in our main analysis, with an average absolute correlation of 0.898±0.114 across imaging composite scores of LCs 1-5.”

      2.4) Ethnicity: the rationale for regressing ethnicity from the data was unclear and may conflict with current best practices.

      We thank the Reviewer for this comment. In light of recent discussions on including this covariate in large datasets such as ABCD (e.g., Saragosa-Harris et al., 2022), we elaborate on our rationale for including this variable in our model in the revised manuscript on P.30:

      “Of note, the inclusion of ethnicity as a covariate in imaging studies has been recently called into question. In the present study, we included this variable in our main model as a proxy for social inequalities relating to race and ethnicity alongside biological factors (age, sex) with documented effects on brain organization and neurodevelopmental symptomatology queried in the CBCL.”

      We also assess the replicability of our analyses when removing race and ethnicity covariates prior to computing the PLS analysis and correlating imaging and behavioral composite scores across both models. We report resulting correlations in the revised manuscript (P.37, 19, and 27):

      “We also assessed the replicability of our findings when removing race and ethnicity covariates prior to computing the PLS analysis and correlating imaging and behavioral composite scores across both models.”

      “Moreover, repeating the PLS analysis while excluding this variable as a model covariate yielded overall similar imaging and behavioral composites scores across LCs to our original analysis. Across LCs 1-5, the average absolute correlations reached r=0.636±0.248 for imaging composite scores, and r=0.715±0.269 for behavioral composite scores. Removing these covariates seemed to exert stronger effects on LC3 and LC4 for both imaging and behavior, as lower correlations across models were specifically observed for these components.”

      “Although we could consider some socio-demographic variables and proxies of social inequalities relating to race and ethnicity as covariates in our main model, the relationship of these social factors to structural and functional brain phenotypes remains to be established with more targeted analyses.”

      2.5) Data quality: the authors did an admirable job in controlling for data quality in the analyses of functional connectivity data. However, it is unclear if a comparable measure of data quality was used for the T1/dMRI analyses. This likely will result in inflated effect sizes in some cases; it has the potential to reduce sensitivity to real effects.

      We agree that data quality was not accounted for in our analysis of T1w- and diffusion-derived metrics. We now accounted for T1w image quality by adding manual quality control ratings to the regressors applied to all structural imaging metrics prior to performing the PLS analysis, and reported the consistency of this new model with original findings. See P.36, P.19:

      “We also considered manual quality control ratings as a measure of T1w scan quality. This metric was included as a covariate in a multiple linear regression model accounting for potential confounds in the structural imaging data, in addition to age, age2, sex, site, ethnicity, ICV, and total surface area. Downstream PLS results were then benchmarked against those obtained from our main model.”

      “Considering scan quality in T1w-derived metrics (from manual quality control ratings) yielded similar results to our main analysis, with an average correlation of 0.986±0.014 across imaging composite scores.”

      As for diffusion imaging, we also regressed out effects of head motion in addition to age, age2, sex, site, and ethnicity from FA and MD measures and reported the consistency with our original results (P.36, P.19):

      “We tested another model which additionally included head motion parameters as regressors in our analyses of FA and MD measures, and assessed the consistency of findings from both models.”

      “Additionally considering head motion parameters from diffusion imaging metrics in our model yielded consistent results to those in our main analyses (mean r=0.891, S.D.=0.103; r=0.733-0.998).”

      Reviewer #3 - Public Review

      In this study, the authors utilized the Adolescent Brain Cognitive Development dataset to investigate the relationship between structural and functional brain network patterns and dimensions of psychopathology. They identified multiple components, including a general psychopathology (p) factor that exhibited a strong association with multimodal imaging features. The connectivity signatures associated with the p factor and neurodevelopmental dimensions aligned with the sensory-to-transmodal axis of cortical organization, which is linked to complex cognition and psychopathology risk. The findings were consistent across two separate subsamples and remained robust when accounting for variations in analytical parameters, thus contributing to a better understanding of the biological mechanisms underlying psychopathology dimensions and offering potential brain-based vulnerability markers.

      3.1) An intriguing aspect of this study is the integration of multiple neuroimaging modalities, combining structural and functional measures, to comprehensively assess the covariance with various symptom combinations. This approach provides a multidimensional understanding of the risk patterns associated with mental illness development.

      We thank the Reviewer for acknowledging the multimodal approach, and for the constructive suggestions.

      3.2) The paper delves deeper into established behavioral latent variables such as the p factor, internalizing, externalizing, and neurodevelopmental dimensions, revealing their distinct associations with morphological and intrinsic functional connectivity signatures. This sheds light on the neurobiological underpinnings of these dimensions.

      We are happy to hear the Reviewer appreciates the gain in understanding neural underpinnings of dimensions of psychopathology resulting from the current work.

      3.3) The robustness of the findings is a notable strength, as they were validated in a separate replication sample and remained consistent even when accounting for different parameter variations in the analysis methodology. This reinforces the generalizability and reliability of the results.

      We appreciate that the Reviewer found our robustness and generalizability assessment convincing.

      3.4) Based on their findings, the authors suggest that the observed variations in resting-state functional connectivity may indicate shared neurobiological substrates specific to certain symptoms. However, it should be noted that differences in resting-state connectivity between groups can stem from various factors, as highlighted in the existing literature. For instance, discrepancies in the interpretation of instructions during the resting state scan can influence the results. Hence, while their findings may indicate biological distinctions, they could also reflect differences in behavior.

      For the ABCD dataset, resting-state fMRI scans were based on eyes open and passive viewing of a crosshair, and are thus homogenized. We acknowledge, however, that there may still be state-to-state fluctuations contributing to the findings, and this is now discussed in the revised Discussion, on P.28. Note, however, that prior literature has generally also suggested rather modest impacts of cognitive and daily variation on resting-state functional networks, compared to much more dominating inter-individual and inter-group factors.

      “Finally, while prior research has shown that resting-state fMRI networks may be affected by differences in instructions and study paradigm (e.g., with respect to eyes open vs closed) (Agcaoglu et al., 2019), the resting-state fMRI paradigm is homogenized in the ABCD study to be passive viewing of a centrally presented fixation cross. It is nevertheless possible that there were slight variations in compliance and instructions that contributed to differences in associated functional architecture. Notably, however, there is a mounting literature based on high-definition fMRI acquisitions suggesting that functional networks are mainly dominated by common organizational principles and stable individual features, with substantially more modest contributions from task-state variability (Gratton et al. 2018). These findings, thus, suggest that resting-state fMRI markers can serve as powerful phenotypes of psychiatric conditions, and potential biomarkers (Abraham et al., 2017; Gratton et al., 2020; Parkes et al., 2020).”

      3.5) The authors conducted several analyses to investigate the relationship between imaging loadings associated with latent components and the principal functional gradient. They found several associations between principal gradient scores and both within- and between-network resting-state functional connectivity (RSFC) loadings. Assessing the analysis presented here proves challenging due to the nature of relating loadings, which are partly based on the RSFC, to gradients derived from RSFC. Consequently, a certain level of correlation between these two variables would be expected, making it difficult to determine the significance of the authors' findings. It would be more intriguing if a direct correlation between the composite scores reflecting behavior and the gradients were to yield statistically significant results.

      We thank the Reviewer for the comment, and agree that investigating gradient-behavior relationships could offer additional insights into the neural basis of psychiatric symptomatology. However, the current analysis pipeline precludes this direct comparison which is performed on a region-by-region basis across the span of the cortical gradient. Indeed, the behavioral loadings are provided for each CBCL item, and not cortical regions.

      The Reviewer also evokes concerns of potential circularity in our analysis, as we compared imaging loadings, which are partially based on RSFC, and gradient values generated from the same RSFC data. In response to this comment, we cross-validated our findings using an RSFC gradient derived from an independent dataset (HCP), showing highly consistent findings to those presented in the manuscript. This correlation is now reported in the Results section P.15.

      “A similar pattern of findings was observed when cross-validating between- and within-network RSFC loadings to a RSFC gradient derived from an independent dataset (HCP), with strongest correlations seen for between-network RSFC loadings for LC1 and LC3 (LC1: r=0.50, pspin<0.001; LC3: r=0.37, pspin<0.001).”

      We furthermore note similar correlations between imaging loadings and T1w/T2w ratio in the same participants, a proxy of intracortical microstructure and hierarchy (Glasser et al., 2011). These findings are now detailed in the revised Results, P.15-16:

      “Of note, we obtain similar correlations when using T1w/T2w ratio in the same participants, a proxy of intracortical microstructure and hierarchy (Glasser et al., 2011). Specifically, we observed the strongest association between this microstructural marker of the cortical hierarchy and between-network RSFC loadings related to LC1 (r=-0.43, pspin<0.001).”

      3.6) Lastly, regarding the interpretation of the first identified latent component, I have some reservations. Upon examining the loadings, it appears that LC1 primarily reflects impulse control issues rather than representing a comprehensive p-factor. Furthermore, it is worth noting that within the field, there is an ongoing debate concerning the interpretation and utilization of the p-factor. An insightful publication on this topic is "The p factor is the sum of its parts, for now" (Fried et al, 2021), which explains that the p-factor emerges as a result of a positive manifold, but it does not necessarily provide insights into the underlying mechanisms that generated the data.

      We thank the Reviewer for this comment, and added greater nuance into the discussion of the association to the p factor. We furthermore discuss some of the ongoing debate about the use of the p factor, and cite the recommended publication on P.27.

      “Other factors have also been suggested to impact the development of psychopathology, such as executive functioning deficits, earlier pubertal timing, negative life events (Brieant et al., 2021), maternal depression, or psychological factors (e.g., low effortful control, high neuroticism, negative affectivity). Inclusion of such data could also help to add further mechanistic insights into the rather synoptic proxy measure of the p factor itself (Fried et al., 2021), and to potentially assess shared and unique effects of the p factor vis-à-vis highly correlated measures of impulse control.”

    1. Author response:

      Reviewer #2 (Public Review):

      This is, to my knowledge, the most scalable method for phylogenetic placement that uses likelihoods. The tool has an inter- esting and innovative means of using gaps, which I haven’t seen before. In the validation the authors demonstrate superior performance to existing tools for taxonomic annotation (though there are questions about the setup of the validation as described below).

      The program is written in C with no library dependencies. This is great. However, I wasn’t able to try out the software because the linking failed on Debian 11, and the binary artifact made by the GitHub Actions pipeline was too recent for my GLIBC/kernel. It’d be nice to provide a binary for people stuck on older kernels (our cluster is still on Ubuntu 18.04). Also, would it be hard to publish your .zipped binaries as packages?

      We have provided a binary (and zipped package) that supports Ubuntu 18.04 in GitHub Actions ( https://github.com/lpipes/tronko/actions/runs/9947708087). This should facilitate the use of our software on older sys- tems like yours. We were not able to test the binary however, since GitHub did not seem to find any nodes with Ubuntu 18.04. It is important to note that Ubuntu 18.04 is deprecated. The latest version of Ubuntu is 24.04, and we recommend users to upgrade to newer, supported versions of their operating systems to benefit from the latest security updates and features.

      Thank you for publishing your source files for the validation on zenodo. Please provide a script that would enable the user to rerun the analysis using those files, either on zenodo or on GitHub somewhere.

      We have posted all datasets as well as scripts to Zenodo.

      The validations need further attention as follows.

      First, the authors have not chosen data sets that are not well-aligned with real-world use cases for this software, and as a re- sult, its applicability is difficult to determine. First, the leave-one-species-out experiment made use of COI gene sequences representing 253 species from the order Charadriiformes, which includes bird species such as gulls and terns. What is the reasoning for selecting this data set given the objective of demonstrating the utility of Tronko for large scale community profiling experiments which by their nature tend to include microorganisms as subjects? If the authors are interested in evaluating COI (or another gene target) as a marker for characterizing the composition of eukaryotic populations, is the heterogeneity and species distribution of bird species within order Charadriiformes comparable to what one would expect in populations of organisms that might actually be the target of a metagenomic analysis?

      Our reasoning for selecting Charadriiformes is that these species are often misidentified for each other and there is a heavy reliance on COI for their species identification. This choice allows us to demonstrate Tronko’s ability to handle difficult and realistic identification challenges. Additionally, we aimed to simulate a challenging dataset to effectively differentiate between the methods used, showcasing Tronko’s robustness. Including more distantly related bird species would have simplified the identification process, which would not serve our objective of demonstrating the utility of Tronko for dis- tinguishing closely related species. It is also important to note that all methods used the exact same reference database which is not always the case in other species assignment comparative studies.

      Furthermore, while our study uses bird species, the principles and techniques applied are broadly applicable to other taxa, including microorganisms. By selecting a datase tknown for its identification difficulties, we underscore Tronko’spotential utility in a wide range of taxonomic profiling scenarios, including those involving high heterogeneity and closely related species, such as in microbial communities.

      Second, It appears that experiments evaluating performance for 16S were limited to reclassification of sequencing data from mock communities described in two publications, Schirmer (2015, 49 bacteria and 10 archaea, all environmental), and Gohl (2016; 20 bacteria - this is the widely used commercial mock community from BEI, all well-known human pathogens or commensals). The authors performed a comparison with kraken2, metaphlan2, and MEGAN using both the default database for each as well as the same database used for Tronko (kudos for including the latter). This pair of experiments provide a reasonable high-level indication of Tronko’s performance relative to other tools, but the total number of organ- isms is very limited, and particularly limited with respect to the human microbiome. It is also important to point out that these mock communities are composed primarily of type strains and provide limited species-level heterogeneity. The per- formance of these classification tools on type strains may not be representative of what one would find in natural samples. Thus, the leave-one-individual-out and leave-one-species-out experiments would have been more useful and informative had they been applied to extended 16S data sets representing more ecologically realistic populations.

      We thank the reviewer for this comment and we have included both an additional bacterial mock community dataset from Lluch et al. (2015) and an additional leave-one-species-out experiment. We describe how this leave-one-species-out dataset was constructed in our previous response to ’Essential Revisions’ #1. We also added Figure 5, S5, and S6.

      Finally, the authors should describe the composition of the databases used for classification as well as the strategy (and toolchain) used to select reference sequences. What databases were the reference sequences drawn from and by what criteria? Were the reference databases designed to reflect the composition of the mock communities (and if so, are they limited to species in those communities, or are additional related species included), or have the authors constructed general pur- pose reference databases? How many representatives of each species were included (on average), and were there efforts to represent a diversity of strains for each species? The methods should include a section detailing the construction of the data sets: as illustrated in this very study, the choice of reference database influences the quality of classification results, and the authors should explain the process and design considerations for database construction.

      To construct our databases, we used CRUX (Curd et al., 2018). This is described in the Methods section under ’Custom 16S and COI Tronko-build reference database construction’. All missing outs tests were downsamples of these two databases. It is beyond the scope of the manuscript to discuss how CRUX works. Additionally, we added the following text:

      To compare the new method (Tronko) to previous methods, we constructed reference databases for COI and 16S for com- mon amplicon primer sets using CRUX (See Methods for exact primers used).

    1. Author response:

      Reviewer #1 (Public Review):

      In this manuscript, Perez-Lopez et al. examine the function of the chemokine CCL28, which is expressed highly in mucosal tissues during infection, but its role during infection is poorly understood. They find that CCL28 promotes neutrophil accumulation in the intestines of mice infected with Salmonella and in the lungs of mice infected with Acinetobacter. They find that Ccl28-/- mice are highly susceptible to Salmonella infection, and highly resistant and protected from lethality following Acinetobacter infection. They find that neutrophils express the CCL28 receptors CCR3 and CCR10. CCR3 was pre-formed and intracellular and translocated to the cell surface following phagocytosis or inflammatory stimuli. They also find that CCL28 stimulation of CCR3 promoted neutrophil antimicrobial activity, ROS production, and NET formation, using a combination of primary mouse and human neutrophils for their studies. Overall, the authors' findings provide new and fundamental insight into the role of the CCL28:CCR3 chemokine:chemokine receptor pair in regulating neutrophil recruitment and effector function during infection with the intestinal pathogen Salmonella Typhimurium and the lung pathogen Acinetobacter baumanii.

      We would like to thank the reviewer for their positive assessment of our work and for providing us with constructive comments that have helped us to improve the manuscript.

      Reviewer #2 (Public Review):

      In this manuscript by Perez-Lopez et al., the authors investigate the role of the chemokine CCL28 during bacterial infections in mucosal tissues. This is a well-written study with exciting results. They show a role for CCL28 in promoting neutrophil accumulation to the guts of Salmonella-infected mice and to the lung of mice infected with Acinetobacter. Interestingly, the functional consequences of CCL28 deficiency differ between infections with the two different pathogens, with CCL28-deficiency increasing susceptibility to Salmonella, but increasing resistance to Acinetobacter. The underlying mechanistic reasons for this suggest roles for CCL28 in enhanced neutrophil antimicrobial activity, production of reactive oxygen species, and formation of extracellular traps. However, additional experiments are required to shore up these mechanisms, including addressing the role of other CCL28-dependent cell types and further characterization of neutrophils from CCL28-deficient mice.

      We would like to thank the reviewer for the positive assessment of our work and for providing us with constructive comments that have helped us to improve the manuscript.

      Reviewer #3 (Public Review):

      The manuscript by Perez-Lopez and colleagues uses a combination of in vivo studies using knockout mice and elegant in vitro studies to explore the role of the chemokine CCL28 during bacterial infection on mucosal surfaces. Using the streptomycin model of Salmonella Typhimurium (S. Tm) infection, the authors demonstrate that CCL28 is required for neutrophil influx in the intestinal mucosa to control pathogen burden both locally and systemically. Interestingly, CCL28 plays the opposite role in a model lung infection by Acinetobacter baumanii, as Ccl28-/- mice are protected from Acinetobacter infection. Authors suggest that the mechanism by which CCL28 plays a role during bacterial infection is due to its role in modulating neutrophil recruitment and function.

      We would like to thank the reviewer for the positive assessment of our work and for providing us with constructive comments that have helped us to improve the manuscript.

      The major strengths of the manuscript are:

      The novelty of the findings that are described in the manuscript. The role of the chemokine CCL28 in modulating neutrophil function and recruitment in mucosal surfaces is intriguing and novel.

      Authors use Ccl28-/- mice in their studies, a mouse strain that has only recently been available. To assess the impact of CCL28 on mucosal surfaces during pathogen-induced inflammation, the authors choose not one but two models of bacterial infection (S. Tm and A. baumanii). This approach increases the rigor and impact of the data presented.

      Authors combine the elegant in vivo studies using Ccl28 -/- with in vitro experiments that explore the mechanisms by which CCL28 affects neutrophil function.

      The major weaknesses of the manuscript in its present form are:

      Authors use different time points in the S. Tm model to characterize the influx of immune cells and pathology. They do not provide a clear justification as to why distinct time points were chosen for their analysis.

      The reviewer raises a good point. As discussed in the detailed response to the reviewers, we have now generated extensive results at different time points and included these in the revised manuscript.

      Authors provide puzzling data that Ccl28-/- mice have the same numbers of CCR3 and CCR10- expressing neutrophils in the mucosa during infection. It is unclear why the lack of CCL28 expression would not affect the recruitment of neutrophils that express the ligands (CCR3 and CCR10) for this chemokine. Thus, these results need to be better explained.

      As discussed in the detailed response to the reviewers, we clarified that Ccl28-/- mice have reduced numbers of neutrophils in the mucosa during infection, but the percentage of CCR3+ and CCR10+ neutrophils does not change. We provide additional discussion of this point in the manuscript and in the response to the reviewers.

      The in vitro studies focus primarily on characterizing how CCL28 affects the function of neutrophils in response to S. Tm infection. There is a lack of data to demonstrate whether Acinetobacter affects CCR3 and CCR10 expression and recruitment to the cell surface and whether CCL28 plays any role in this process.

      We agree and have performed additional studies with Acinetobacter and CCL28, which we discuss in greater detail below in the response to the reviewers.

    1. Author response:

      We appreciate the time of the reviewers and their detailed comments, which will help to improve the manuscript.

      We are sorry that at least one reviewer seems to have had the impression that we have conflated issues about gonadal and non-gonadal sex phenotypes. This referee suggests that we should use Sharpe et al. (2023) to develop our concepts. However, what is discussed in Sharpe et al. was already the guiding principle for our study (without knowing this paper before). In our paper, we introduce the gonadal binary sex (which is self-evidently also the basis for creating the dataset in the first place, because we needed to separate males from females) and go then on to the question of (adult) sex phenotypes for the rest of the paper. The gonadal data are included only as comparison for contrasting the patterns in the non-gonadal tissues.

      Our study presents the largest systematic dataset so far on the evolution of sex-biased gene expression. It is also the first that explores the patterns of individual variation in sex-biased gene expression and the SBI is an entirely new procedure to directly visualize these variance patterns in an intuitive way (note that the relative position of the distributions along the X-axis is indeed not relevant). The results are actually quite nuanced (e.g. the rather dynamv changes seen in mouse kidney and liver comparisons) and go certainly beyond what would have been predictable based on the current literature.

      Also, we should like to point out that our study contradicts recent conclusions that were published in high profile journals, that had suggested that a substantial set of sex-biased genes has conserved functions between humans and mice and that mice can therefore be informative for gender-specific medicine studies. Our data suggest that that only a very small set of genes are conserved in their sex-biased expression. These are epigenetic regulator genes and it will therefore be interesting in the future to focus on their roles in generating the differences between sexual phenotypes in given species.

      We will be happy to use the referee comments to clarify all of these points in a revised version. But we do not think that our "evidence is incomplete" and that there are several "overstated key conclusions". We have used all canonical statistical analyses that are typically used in papers of sex-biased gene expression, as acknowledged by reviewers 1 and 2. The additional statistical analyses that are requested are not within the scope of such papers, but could be subject to separate general studies, independent of the sex-bias analysis (e.g. the role of highly expressed genes versus low expressed genes, or the analysis of the fraction of neutrally evolving loci).

      Finally, it is unclear why the overall rating of the paper is at the lowest possible category ("useful study"), given that it adds a substantial amount of data and new insights into the exploration of the non-binary nature of sexual phenotypes.

    1. Author response:

      The following is the authors’ response to the original reviews.

      Public Reviews:

      Reviewer #1 (Public Review):

      Summary:

      Given that KRAS inhibition approaches are a relatively new innovation and that resistance is now being observed to such therapies in patients with NSCLC, investigation of combination therapies is valuable. The manuscript furthers our understanding of combination therapy for KRAS mutant non-small cell lung cancer by providing evidence that combined inhibition of ULK1/2 (and therefore autophagy) and KRAS can inhibit KRAS-mutant lung cancer growth. The manuscript will be of interest to the lung cancer community but also to researchers in other cancer types where KRAS inhibition is relevant.

      Strengths:

      The manuscript combines cell line, cell line-derived xenograft, and genetically-engineered mouse model data to provide solid evidence for the proposed combination therapy.  The manuscript is well written, and experiments are broadly well performed and presented.

      We thank Reviewer #1 (R1) for the generally favorable review of our manuscript, and also for the more detailed critique that identifies potential weaknesses in the research, which we address on a point-by-point basis below. 

      Weaknesses:

      With 3-4 mice per group in many experiments, experimental power is a concern and some comparisons (e.g. mono vs combination therapy) seem to be underpowered to detect a difference. Both male and female mice are used in experiments which may increase variability.

      We thank R1 for pointing out concerns regarding statistical power in our various mouse models of NSCLC experiments, and agree that more mice per group would certainly increase statistical power.  However, there are certain logistical considerations that impact the generation of cohorts of experimental KrasLSL-G12C mice.  Because mice homozygous for the KrasLSL-G12C allele display embryonic lethality, we are required to generate experimental mice by crossing heterozygous male and female KrasLSL-G12C mice.  Although 66% of the progeny of such crosses are predicted to be KrasLSL-G12C/+, experience tells us that we only obtain ~40-50% heterozygous KrasLSL-G12C/+ mice with litter sizes around 6-8 mice from such crosses.  Therefore, there are usually only about 4 heterozygous KrasLSL-G12C mice per litter, which presents a substantial challenge in generating larger cohorts of age-matched mice suitable for experiments, especially under conditions where we wish to euthanize mice at multiple time points for analysis.  For the GEM model experiments, Figure 3B is the only experiment that has n=3.  All other experiments contain 4-6 mice per experimental condition.  We rationalized using both male and female mice because both human males and females have high lung cancer rates.

      Reviewer #2 (Public Review):

      Summary:

      In this manuscript, Ghazi et reported that inhibition of KRASG12C signaling increases autophagy in KRASG12C-expressing lung cancer cells. Moreover, the combination of DCC 3116, a selective ULK1/2 inhibitor, plus sotorasib displays cooperative/synergistic suppression of human KRASG12C-driven lung cancer cell proliferation in vitro and tumor growth in vivo. Additionally, in genetically engineered mouse models of KRASG12C-driven NSCLC, inhibition of either KRASG12C or ULK1/2 decreases tumor burden and increases mouse survival. Additionally, this study found that LKB1 deficiency diminishes the sensitivity of KRASG12C/LKB1Null-driven lung cancer to the combination treatment, perhaps through the emergence of mixed adeno/squamous cell carcinomas and mucinous adenocarcinomas.

      Strengths:

      Both human cancer cells and mouse models were employed in this study to illustrate that inhibiting ULK1/2 could enhance the responsiveness of KRASG12C lung cancer to sotorasib. This research holds translational importance.

      We thank Reviewer #2 (R2) for the generally favorable review of our manuscript, and also for the more detailed critique that identifies potential weaknesses in the research, which we address on a point-by-point basis below. 

      Weaknesses:

      Additional validation of certain data is necessary.

      (1) mCherry-EGFP-LC3 reporter was used to assess autophagy flux in Figure 1A. Please explain how autophagy status (high, medium, and low) was defined. It's also suggested to show WB of LC3 processing in different treatments as in Figure 1A at 48 hours.

      We thank the reviewer for this comment and agree that a more thorough description of how autophagy status is assessed using the Fluorescent Autophagy Reporter (FAR) would benefit the readers of our manuscript.  Cells engineered to express the FAR are analyzed by flow cytometry in which we defined autophagy status by gating viable (based Sytox Blue staining), DMSO-treated control cells into three bins based on the ratio of EGFP:mCherry fluorescence.  We gate all live cells into the 33% highest EGFP-positive cells (autophagy low) and the 33% highest mCherry-positive cells (autophagy high), and therefore, the proportion in the middle is also approximately 33% and considered the medium autophagy status.  Again, these gates are based entirely on the DMSO-treated control cells, and all other treatments within the experiment are compared to settings on these gates.  In response to a specific manipulation (sotorasib, trametinib, DCC-3116 etc) we assess how the specific treatment changes the percentages of cells in each of the pre-specified gates to assess increased autophagy (decreased EGFP:mCherry ratio) or decreased autophagy (increased increased EGFP:mCherry ratio). 

      Although LC3 processing and/or the expression of p62SQSTM1 are used by others as markers of autophagy, there is much debate in the literature as to how reliable immunoblotting analysis of LC3 processing or p62SQSTM1 expression are as measures of autophagy.  Certainly, in our hands, we find that the Fluorescent Autophagy Reporter is a much more sensitive measure of changes in autophagy in various different cancer cell lines as we have described in previous papers (Kinsey et al., PMID: 30833748, Truong et al., PMID: 32933997 and Silvis & Silva et al., PMID: 36719686).  Furthermore, in the omnibus publication that describes techniques for measuring autophagy (Klionsky et al., PMID: 33634751) the use of the FAR (or similarly configured reporters) is regarded as the gold standard for measuring autophagy status in cells.  We have amended the Materials & Methods section of our manuscript to better describe the use of the FAR in measuring autophagy. 

      (2) For Figures 1J, K, and L, please provide immunohistochemistry (IHC) images demonstrating RAS downstream signaling blockade by sotorasib and autophagy blockade by DCC 3116 in tumors.

      We thank the reviewer for the comment and have probed the tumors from the xenograft experiments in Figures 1J, K, and L for pERK1/2 and p62SQSTM1 to determine the biochemical activity of sotorasib or DCC-3116, respectively and have provided representative images below. We observed the expected decrease in pERK and p62 signal after sotorasib treatment in all three xenografted cell lines. We did observe the expected accumulation of p62 in the DCC-3116 treated tumors from the NCI-H2122 and NCI-H358 cell lines. There appears to be no difference between the vehicle and DCC-3116 treated tumors in the NCI-H358 cell line-derived tumors as detected by IHC.

      Author response image 1.

      (3) Given that both DCC 3116 and ULK1K46N exhibit the ability to inhibit autophagy and synergize with sotorasib in inhibiting cell proliferation, in addition to demonstrating decreased levels of pATG13 via ELISA assay, please include Western blot analyses of LC3 or p62 to confirm the blockade of autophagy by DCC 3116 and ULK1K46N in Figure 1 & Figure 2.

      We appreciate the reviewer's comment and have performed an immunoblot analysis of cells treated with DCC-3116 or expressing ULK1K46N and probed for p62SQSTM1 and LC3 expression.  We did observe the expected accumulation of p62 SQSTM1 in NCI-H2122 (ULK1K46N) cells treated with 1ug/ml doxycycline to induce expression of ULK1K46N compared to DMSO treatment.  Additionally, we treated the human cell lines from Figure 1 with sotorasib and/or DCC-3116 and tested for p62SQSTM1 expression after 48 hours of treatment. In the human cell lines NCI-H2122 and NCI-H358, there was a decrease in the p62 signal with increasing doses of sotorasib, as expected. There was no detectable change in p62 levels in the Calu-1 cells by immunoblot. For LC3-I/LC3-II, there was only one detectable band in the NCI-H2122 cells, which makes it difficult to interpret the results and further emphasizes why we use the fluorescent autophagy reporter which is more sensitive than immunoblotting. There is no detectable change in LC3-I/LC3-II in the Calu-1 cells treated with increasing doses of sotorasib, but the expected decrease in LC3-I is observed with sotorasib treatment in the NCI-H358 cells.

      Author response image 2.

      (4) Since adenocarcinomas, adenosquamous carcinomas (ASC), and mucinous adenocarcinomas were detected in KL lung tumors, please conduct immunohistochemistry (IHC) to detect these tumors, including markers such as p63, SOX2, Katrine 5.

      We have included IHC analysis of the adenosquamous carcinomas for the markers p63, SOX2, and Keratin 5 from the KL mouse in Figure 3 and the ASC tumors in Supplemental Figure 4, and thank the reviewer for this excellent suggestion. The straining for these markers is below. Of note, we tried two different SOX2 antibodies (cell signaling technologies #14962 and cell signaling technologies # 3728) and could not detect any staining in any section.

      Author response image 3.

      (5) Please provide the sample size (n) for each treatment group in the survival study (Figure 4E). It appears that all mice were sacrificed for tumor burden analysis in Figure 4F. However, there doesn't seem to be a significant difference among the treatment groups in Figure 4F, which contrasts with the survival analysis in Figure 4E. It is suggested to increase the sample size in each treatment group to reduce variation.

      We have updated Figure 4E to indicate sample size for each treatment group and thank the reviewer for this suggestion.  Any mice that remained on study through the entire 8-week treatment regimen were sacrificed after the last day of treatment (Day 56).  Figure 4F indicates analysis of total tumor burden in all mice that remained on treatment for the full 8 weeks and mice that reached euthanasia criteria before the end of the 8-week treatment.  Therefore, it is important to note that the mice in Figure 4F were not all euthanized on the same day.  There is no statistically significant difference between the 3 treatment groups (sotorasib, DCC-3116, combination).  This may be due to a lower sample size as well as ending the treatment at 8 weeks as opposed to continuing the treatment for a longer period of time.  Although we agree that increasing the sample size would benefit the study, due to how long the GEMM model experiments take (12-16 weeks of breeding, 6 weeks for the mice to reach adulthood, 10 weeks of tumor formation post-initiation, 8 weeks of treatment= ~40 weeks) we would respectfully submit that the analysis of additional mice is outside the scope of the current revised manuscript.

      (6) In KP mice (Figure 5), it seems that a single treatment alone is sufficient to inhibit established KP lung tumor growth. Combination treatment does not further enhance anti-tumor efficacy. Therefore, this result doesn't support the conclusion generated from human cancer cell lines. Please discuss.

      We thank the reviewer for this observation.  Indeed, KP lung tumors were sensitive to single agent DCC-3116 treatment, which is reflected in the tumor burden analysis.  This was somewhat surprising to us as we have not previously detected much anti-tumor activity using 4-amino-quinoloines (chloroquine or hydroxychloroquine) or other autophagy inhibitors.  It should be noted however that the KRASG12C/TP53R175H NSCLC model has a very low tumor burden overall (~4% in vehicle-treated mice).  Additionally, our microCT imager cannot detect AAH and small tumors at the settings/resolution used.  Therefore, we were limited in our ability to detect small tumors or hyperplasia by microCT imaging.  Although there was a decrease in overall tumor burden with single agent DCC-3116 treatment, we could not demonstrate using microCT imaging that KRASG12C/TP53R175H lung tumors were actually regressing with single agent DCC-3116 treatment.  The larger tumors that were detected appeared to show a cytostatic effect (i.e. no or slow growth) with DCC-3116 monotherapy.  This may reflect our inability to detect regression of AAH or small tumors with the microCT.  In all human cell lines tested, the only cell line that responded to single agent DCC-3116 treatment was NCI-H358 cells, which do have a complete heterozygous loss of the TRP53 gene and lack TP53 protein.  However, other cells that also have a loss of expression of TP53 expression (Calu-1) are insensitive to single-agent DCC-3116 treatment. Due to the low mutational burden of the KP mouse model compared to human NSCLC cell lines driven by mutationally-activated KRASG12C and the loss of TP53 function, it is difficult to directly compare GEM models to the human cell line models.  Most of the human cell lines have alterations in other genes that are not altered in the KP mouse model which could affect the sensitivity of treatment.

      Recommendations for the authors:

      Reviewer #1 (Recommendations For The Authors):

      Minor comments:

      (1) Figure legends are currently not adequate - information about the number and nature of replicates, stats, and definitions of the labelling used for stats should be added throughout. In Figure 5B, only two lines of four are labelled with * or ns.

      We thank the reviewer for this comment and have included more details in the figure legends that describe replicates, statistical analysis and definitions of labeling.  We also note that the methods section has a detailed description of the statistical analysis used.

      (2) What statistical test is performed on Figure 5E to get a p < 0.05 between the vehicle and DCC group?

      We performed a one-way ANOVA for all statistical analyses with more than 2 experiential groups. We thank the reviewer for pointing out this typo. These data points (vehicle vs. DCC-3116) are not statistically significant, which has been revised in the figure.

      (3) The manuscript figures would be improved by the use of a colourblind-friendly palette.

      We have previously published multiple manuscripts using this color scheme for the fluorescent autophagy reporter experiments and chose to use red and green as the reporter uses EGFP and mCherry.  We wanted to keep this color scheme consistent across our publications and would prefer not to change the colors.  However, we agree with the reviewer that the data should be accessible to all people and, therefore, have updated these graphs to include slashes over the red color to ease in telling the differences between the red and green colors.  Thank you to the reviewer for this excellent suggestion.

      (4) The manuscript should be fully checked for mouse (sentence case) and human (caps) gene (italics) and protein (non-italics).

      In this manuscript we are using the nomenclatures approved by the HUGO Gene Nomenclature Committee (https://en.wikipedia.org/wiki/HUGO_Gene_Nomenclature_Committee) in which:

      Human genes are written as KRAS, TP53 etc i.e. ITALICIZED CAPS

      Mouse genes are written as Kras, Trp53 etc:  i.e. Italicized and sentence case

      Human and mouse proteins are written as KRAS, TP53 etc:  i.e. NON-ITALICIZED CAPS

      In response to the reviewer’s suggestion, we have gone through the manuscript to check for this and make any appropriate changes.  Of note, we intentionally refer to the mouse protein changes as KRASG12C/LKB1null or KRASG12C/TP53R172H (capitalized), as this references the protein change and not the nucleotide change that occurs in the gene.

      (5) Adenosquamous is the correct term for the disease.  In parts, it's referred to as adeno/squamous or adeno-squamous.  The abbreviation ADC is also defined many times.

      Thank you to the reviewer for this comment.  We have corrected the manuscript text to only use adenosquamous and only define ADC in the first instance.

      (6) Line 434 - "as previously described" but no reference.

      Typos:

      (1) Line 117 – either

      (2) Line 314 – synergistic

      (3) Line 317 – therefore

      (4) Line 502 – medium

      We thank the reviewer for pointing out these typos and have modified the text appropriately.

      Reviewer #2 (Recommendations For The Authors):

      (1) The statement on Page 4, Lines 119-120, lacks clarity: 'Furthermore, LKB1 silencing diminishes the sensitivity of KRASG12C/LKB1Null-driven lung cancer perhaps through the emergence of mixed adeno/squamous cell carcinomas and mucinous adenocarcinomas.  It is unclear whether this refers to the sensitivity to the combination treatment or to the KRASc inhibitor alone.

      We thank the reviewer for this comment and agree that the statement lacks clarity.  The intent of this statement was to refer to both single agent sotorasib treatment as well as the combination with DCC-3116.  

      (2) Page 5 Line 147 "KRASG12X ". Please correct this typo.

      We thank the reviewer for this comment, but this is not a typo. We intended for this line to state KRASG12X to refer to cell lines with any KRASG12 alteration, e.g KRASG12D, KRASG12C, KRASG12S, KRASG12R etc.  

      (3) The color of the dots in Figure 5B labeling does not match the dots in the graph.

      For all bar graphs in the manuscript, the dots representing individual mice are black, and the bar itself is color-coded based on treatment type. The dots in Figure 5B follow this pattern and are intended to be this way.

      (4) Figure 5C depicts lung weight rather than tumor growth, contrary to the text description "regression of pre-existing lung tumors was detected by microCT scanning (Figure 5C, Figure S5)".

      Figure 5C does not depict lung weight but the percent body weight change in treated mice, described in the figure legend.  We thank the reviewer for pointing this out because we referenced the wrong panel in the text.  The figures referenced should be Figure 5B, Figure S5.  We have corrected this in the text.

    1. Author response:

      The following is the authors’ response to the original reviews.

      Reviewer #1 (Public Review):

      Summary:

      The authors used structural and biophysical methods to provide insight into Parkin regulation. The breadth of data supporting their findings was impressive and generally well-orchestrated. Still, the impact of their results builds on recent structural studies and the stated impact is based on these prior works.

      Strengths:

      (1) After reading through the paper, the major findings are:

      - RING2 and pUbl compete for binding to RING0.

      - Parkin can dimerize.

      - ACT plays an important role in enzyme kinetics.

      (2) The use of molecular scissors in their construct represents a creative approach to examining inter-domain interactions.

      (3) From my assessment, the experiments are well-conceived and executed.

      We thank the reviewer for their positive remark and extremely helpful suggestions.

      Weaknesses:

      The manuscript, as written, is NOT for a general audience. Admittedly, I am not an expert on Parkin structure and function, but I had to do a lot of homework to try to understand the underlying rationale and impact. This reflects, I think, that the work generally represents an incremental advance on recent structural findings.

      To this point, it is hard to understand the impact of this work without more information highlighting the novelty. There are several structures of Parkin in various auto-inhibited states, and it was hard to delineate how this is different.

      For the sake of the general audience, we have included all the details of Parkin structures and conformations seen (Extended Fig. 1). The structures in the present study are to validate the biophysical/biochemical experiments, highlighting key findings. For example, we solved the phospho-Parkin (complex with pUb) structure after treatment with 3C protease (Fig. 2C), which washes off the pUbl-linker, as shown in Fig 2B. The structure of the pUbl-linker depleted phospho-Parkin-pUb complex showed that RING2 returned to the closed state (Fig. 2C), which is confirmation of the SEC assay in Fig. 2B. Similarly, the structure of the pUbl-linker depleted phospho-Parkin R163D/K211N-pUb complex (Fig. 3C), was done to validate the SEC data showing displacement of pUbl-linker is independent of pUbl interaction with the basic patch on RING0 (Fig. 3B). In addition, the latter structure also revealed a new donor ubiquitin binding pocket in the linker (connecting REP and RING2) region of Parkin (Fig. 9). Similarly, trans-complex structure of phospho-Parkin (Fig. 4D) was done to validate the biophysical data (Fig. 4A-C, Fig. 5A-D) showing trans-complex between phospho-Parkin and native Parkin. The latter also confirmed that the trans-complex was mediated by interactions between pUbl and the basic patch on RING0 (Fig. 4D). Furthermore, we noticed that the ACT region was disordered in the trans-complex between phospho-Parkin (1-140 + 141-382 + pUb) (Fig. 8A) which had ACT from the trans molecule, indicating ACT might be present in the cis molecule. The latter was validated from the structure of trans-complex between phospho-Parkin with cis ACT (1-76 + 77-382 + pUb) (Fig. 8C), showing the ordered ACT region. The structural finding was further validated by biochemical assays (Fig. 8 D-F, Extended Data Fig. 9C-E).

      The structure of TEV-treated R0RBR (TEV) (Extended Data Fig. 4C) was done to ensure that the inclusion of TEV and treatment with TEV protease did not perturb Parkin folding, an important control for our biophysical experiments.

      As noted, I appreciated the use of protease sites in the fusion protein construct. It is unclear how the loop region might affect the protein structure and function. The authors worked to demonstrate that this did not introduce artifacts, but the biological context is missing.

      We thank the reviewer for appreciating the use of protease sites in the fusion protein construct.  Protease sites were used to overcome the competing mode of binding that makes interactions very transient and beyond the detection limit of methods such as ITC or SEC. While these interactions are quite transient in nature, they could still be useful for the activation of various Parkin isoforms that lack either the Ubl domain or RING2 domain (Extended Data Fig. 6, Fig. 10). Also, our Parkin localization assays also suggest an important role of these interactions in the recruitment of Parkin molecules to the damaged mitochondria (Fig. 6).

      While it is likely that the binding is competitive between the Ubl and RING2 domains, the data is not quantitative. Is it known whether the folding of the distinct domains is independent? Or are there interactions that alter folding? It seems plausible that conformational rearrangements may invoke an orientation of domains that would be incompatible. The biological context for the importance of this interaction was not clear to me.

      This is a great point. In the revised manuscript, we have included quantitative data between phospho-Parkin and untethered ∆Ubl-Parkin (TEV) (Fig. 5B) showing similar interactions using phospho-Parkin K211N and untethered ∆Ubl-Parkin (TEV) (Fig. 4B). Folding of Ubl domain or various combinations of RING domains lacking Ubl seems okay. Also, folding of the RING2 domain on its own appears to be fine. However, human Parkin lacking the RING2 domain seems to have some folding issues, majorly due to exposure of hydrophobic pocket on RING0, also suggested by previous efforts (Gladkova et al.ref. 24, Sauve et al. ref. 29).  The latter could be overcome by co-expression of RING2 lacking Parkin construct with PINK1 (Sauve et al. ref. 29) as phospho-Ubl binds on the same hydrophobic pocket on RING0 where RING2 binds. A drastic reduction in the melting temperature of phospho-Parkin (Gladkova et al.ref. 24), very likely due to exposure of hydrophobic surface between RING0 and RING2, correlates with the folding issues of RING0 exposed human Parkin constructs.

      From the biological context, the competing nature between phospho-Ubl and RING2 domains could block the non-specific interaction of phosphorylated-ubiquitin-like proteins (phospho-Ub or phospho-NEDD8) with RING0 (Lenka et al. ref. 33), during Parkin activation. 

      (5) What is the rationale for mutating Lys211 to Asn? Were other mutations tried? Glu? Ala? Just missing the rationale. I think this may have been identified previously in the field, but not clear what this mutation represents biologically.

      Lys211Asn is a Parkinson’s disease mutation; therefore, we decided to use the same mutation for biophysical studies.  

      I was confused about how the phospho-proteins were generated. After looking through the methods, there appear to be phosphorylation experiments, but it is unclear what the efficiency was for each protein (i.e. what % gets modified). In the text, the authors refer to phospho-Parkin (T270R, C431A), but not clear how these mutations might influence this process. I gather that these are catalytically inactive, but it is unclear to me how this is catalyzing the ubiquitination in the assay.

      This is an excellent question. Because different phosphorylation statuses would affect the analysis, we ensured complete phosphorylation status using Phos-Tag SDS-PAGE, as shown below.

      Author response image 1.

      Our biophysical experiments in Fig. 5C show that trans complex formation is mediated by interactions between the basic patch (comprising K161, R163, K211) on RING0 and phospho-Ubl domain in trans. These interactions result in the displacement of RING2 (Fig. 5C). Parkin activation is mediated by displacement of RING2 and exposure of catalytic C431 on RING2. While phospho-Parkin T270R/C431A is catalytically dead, the phospho-Ubl domain of phospho-Parkin T270R/C431would bind to the basic patch on RING0 of WT-Parkin resulting in activation of WT-Parkin as shown in Fig. 5E. A schematic figure is shown below to explain the same.

      Author response image 2.

      (7) The authors note that "ACT can be complemented in trans; however, it is more efficient in cis", but it is unclear whether both would be important or if the favored interaction is dominant in a biological context.

      First, this is an excellent question about the biological context of ACT and needs further exploration. While due to the flexible nature of ACT, it can be complemented both in cis and trans, we can only speculate cis interactions between ACT and RING0 could be more relevant from the biological context as during protein synthesis and folding, ACT would be translated before RING2, and thus ACT would occupy the small hydrophobic patch on RING0 in cis. Unpublished data shows the replacement of the ACT region by Biogen compounds to activate Parkin (https://doi.org/10.21203/rs.3.rs-4119143/v1). The latter finding further suggests the flexibility in this region.        

      (8) The authors repeatedly note that this study could aid in the development of small-molecule regulators against Parkin to treat PD, but this is a long way off. And it is not clear from their manuscript how this would be achieved. As stated, this is conjecture.

      As suggested by this reviewer, we have removed this point in the revised manuscript.

      Reviewer #2 (Public Review):

      This manuscript uses biochemistry and X-ray crystallography to further probe the molecular mechanism of Parkin regulation and activation. Using a construct that incorporates cleavage sites between different Parkin domains to increase the local concentration of specific domains (i.e., molecular scissors), the authors suggest that competitive binding between the p-Ubl and RING2 domains for the RING0 domain regulates Parkin activity. Further, they demonstrate that this competition can occur in trans, with a p-Ubl domain of one Parkin molecule binding the RING0 domain of a second monomer, thus activating the catalytic RING1 domain. In addition, they suggest that the ACT domain can similarly bind and activate Parkin in trans, albeit at a lower efficiency than that observed for p-Ubl. The authors also suggest from crystal structure analysis and some biochemical experiments that the linker region between RING2 and repressor elements interacts with the donor ubiquitin to enhance Parkin activity.<br /> Ultimately this manuscript challenges previous work suggesting that the p-Ubl domain does not bind to the Parkin core in the mechanism of Parkin activation. The use of the 'molecular scissors' approach to probe these effects is an interesting approach to probe this type of competitive binding. However, there are issues with the experimental approach manuscript that detract from the overall quality and potential impact of the work.

      We thank the reviewer for their positive remark and constructive suggestions.

      The competitive binding between p-Ubl and RING2 domains for the Parkin core could have been better defined using biophysical and biochemical approaches that explicitly define the relative affinities that dictate these interactions. A better understanding of these affinities could provide more insight into the relative bindings of these domains, especially as it relates to the in trans interactions.

      This is an excellent point regarding the relative affinities of pUbl and RING2 for the Parkin core (lacking Ubl and RING2). While we could purify p-Ubl, we failed to purify human Parkin (lacking RING2 and phospho-Ubl). The latter folding issues were likely due to the exposure of a highly hydrophobic surface on RING0 (as shown below) in the absence of pUbl and RING2 in the R0RB construct. Also, RING2 with an exposed hydrophobic surface would be prone to folding issues, which is not suitable for affinity measurements. A drastic reduction in the melting temperature of phospho-Parkin (Gladkova et al.ref. 24) also highlights the importance of a hydrophobic surface between RING0 and RING2 on Parkin folding/stability. A separate study would be required to try these Parkin constructs from different species and ensure proper folding before using them for affinity measurements.

      Author response image 3.

      I also have concerns about the results of using molecular scissors to 'increase local concentrations' and allow for binding to be observed. These experiments are done primarily using proteolytic cleavage of different domains followed by size exclusion chromatography. ITC experiments suggest that the binding constants for these interactions are in the µM range, although these experiments are problematic as the authors indicate in the text that protein precipitation was observed during these experiments. This type of binding could easily be measured in other assays. My issue relates to the ability of a protein complex (comprising the core and cleaved domains) with a Kd of 1 µM to be maintained in an SEC experiment. The off-rates for these complexes must be exceeding slow, which doesn't really correspond to the low µM binding constants discussed in the text. How do the authors explain this? What is driving the Koff to levels sufficiently slow to prevent dissociation by SEC? Considering that the authors are challenging previous work describing the lack of binding between the p-Ubl domain and the core, these issues should be better resolved in this current manuscript. Further, it's important to have a more detailed understanding of relative affinities when considering the functional implications of this competition in the context of full-length Parkin. Similar comments could be made about the ACT experiments described in the text.

      This is a great point. In the revised manuscript, we repeated ITC measurements in a different buffer system, which gave nice ITC data. In the revised manuscript, we have also performed ITC measurements using native phospho-Parkin. Phospho-Parkin and untethered ∆Ubl-Parkin (TEV) (Fig. 5B) show similar affinities as seen between phospho-Parkin K211N and untethered ∆Ubl-Parkin (TEV) (Fig. 4B). However, Kd values were consistent in the range of 1.0 ± 0.4 µM which could not address the reviewer’s point regarding slow off-rate. The crystal structure of the trans-complex of phospho-Parkin shows several hydrophobic and ionic interactions between p-Ubl and Parkin core, suggesting a strong interaction and, thus, justifying the co-elution on SEC. Additionally, ITC measurements between E2-Ub and P-Parkin-pUb show similar affinity (Kd = 0.9 ± 0.2 µM) (Kumar et al., 2015, EMBO J.), and yet they co-elute on SEC (Kumar et al., 2015, EMBO J.).

      Ultimately, this work does suggest additional insights into the mechanism of Parkin activation that could contribute to the field. There is a lot of information included in this manuscript, giving it breadth, albeit at the cost of depth for the study of specific interactions. Further, I felt that the authors oversold some of their data in the text, and I'd recommend being a bit more careful when claiming an experiment 'confirms' a specific model. In many cases, there are other models that could explain similar results. For example, in Figure 1C, the authors state that their crystal structure 'confirms' that "RING2 is transiently displaced from the RING0 domain and returns to its original position after washing off the p-Ubl linker". However, it isn't clear to me that RING2 ever dissociated when prepared this way. While there are issues with the work that I feel should be further addressed with additional experiments, there are interesting mechanistic details suggested by this work that could improve our understanding of Parkin activation. However, the full impact of this work won't be fully appreciated until there is a more thorough understanding of the regulation and competitive binding between p-Ubl and RIGN2 to RORB both in cis and in trans.

      We thank the reviewer for their positive comment. In the revised manuscript, we have included the reviewer’s suggestion. The conformational changes in phospho-Parkin were established from the SEC assay (Fig. 2A and Fig. 2B), which show displacement/association of phospho-Ubl or RING2 after treatment of phospho-Parkin with 3C and TEV, respectively. For crystallization, we first phosphorylated Parkin, where RING2 is displaced due to phospho-Ubl (as shown in SEC), followed by treatment with 3C protease, which led to pUbl wash-off. The Parkin core separated from phospho-Ubl on SEC was used for crystallization and structure determination in Fig. 2C, where RING2 returned to the RING0 pocket, which confirms SEC data (Fig. 2B).

      Reviewer #3 (Public Review):

      Summary:

      In their manuscript "Additional feedforward mechanism of Parkin activation via binding of phospho-UBL and RING0 in trans", Lenka et al present data that could suggest an "in trans" model of Parkin ubiquitination activity. Parkin is an intensely studied E3 ligase implicated in mitophagy, whereby missense mutations to the PARK2 gene are known to cause autosomal recessive juvenile parkinsonism. From a mechanistic point of view, Parkin is extremely complex. Its activity is tightly controlled by several modes of auto-inhibition that must be released by queues of mitochondrial damage. While the general overview of Parkin activation has been mapped out in recent years, several details have remained murky. In particular, whether Parkin dimerizes as part of its feed-forward signaling mechanism, and whether said dimerization can facilitate ligase activation, has remained unclear. Here, Lenka et al. use various truncation mutants of Parkin in an attempt to understand the likelihood of dimerization (in support of an "in trans" model for catalysis).

      Strengths:

      The results are bolstered by several distinct approaches including analytical SEC with cleavable Parkin constructs, ITC interaction studies, ubiquitination assays, protein crystallography, and cellular localization studies.

      We thank the reviewer for their positive remark.

      Weaknesses:

      As presented, however, the storyline is very confusing to follow and several lines of experimentation felt like distractions from the primary message. Furthermore, many experiments could only indirectly support the author's conclusions, and therefore the final picture of what new features can be firmly added to the model of Parkin activation and function is unclear.

      We thank the reviewer for their constructive criticism, which has helped us to improve the quality of this manuscript.

      Major concerns:

      (1) This manuscript solves numerous crystal structures of various Parkin components to help support their idea of in trans transfer. The way these structures are presented more resemble models and it is unclear from the figures that these are new complexes solved in this work, and what new insights can be gleaned from them.

      The structures in the present study are to validate the biophysical/biochemical experiments highlighting key findings. For example, we solved the phospho-Parkin (complex with pUb) structure after treatment with 3C protease (Fig. 2C), which washes off the pUbl-linker, as shown in Fig. 2B. The structure of pUbl-linker depleted phospho-Parkin-pUb complex showed that RING2 returned to the closed state (Fig. 2C), which is confirmation of the SEC assay in Fig. 2B. Similarly, the structure of the pUbl-linker depleted phospho-Parkin R163D/K211N-pUb complex (Fig. 3C), was done to validate the SEC data showing displacement of pUbl-linker is independent of pUbl interaction with the basic patch on RING0 (Fig. 3B). In addition, the latter structure also revealed a new donor ubiquitin binding pocket in the linker (connecting REP and RING2) region of Parkin (Fig. 9). Similarly, trans-complex structure of phospho-Parkin (Fig. 4D) was done to validate the biophysical data (Fig. 4A-C, Fig. 5A-D) showing trans-complex between phospho-Parkin and native Parkin. The latter also confirmed that the trans-complex was mediated by interactions between pUbl and the basic patch on RING0 (Fig. 4D). Furthermore, we noticed that the ACT region was disordered in the trans-complex between phospho-Parkin (1-140 + 141-382 + pUb) (Fig. 8A) which had ACT from the trans molecule, indicating ACT might be present in the cis molecule. The latter was validated from the structure of trans-complex between phospho-Parkin with cis ACT (1-76 + 77-382 + pUb) (Fig. 8C), showing the ordered ACT region. The structural finding was further validated by biochemical assays (Fig. 8 D-F, Extended Data Fig. 9C-E).

      The structure of TEV-treated R0RBR (TEV) (Extended Data Fig. 4C) was done to ensure that the inclusion of TEV and treatment with TEV protease did not perturb Parkin folding, an important control for our biophysical experiments.

      (2) There are no experiments that definitively show the in trans activation of Parkin. The binding experiments and size exclusion chromatography are a good start, but the way these experiments are performed, they'd be better suited as support for a stronger experiment showing Parkin dimerization. In addition, the rationale for an in trans activation model is not convincingly explained until the concept of Parkin isoforms is introduced in the Discussion. The authors should consider expanding this concept into other parts of the manuscript.

      We thank the reviewer for appreciating the Parkin dimerization. Our biophysical data in Fig. 5C shows that Parkin dimerization is mediated by interactions between phospho-Ubl and RING0 in trans, leading to the displacement of RING2. However, Parkin K211N (on RING0) mutation perturbs interaction with phospho-Parkin and leads to loss of Parkin dimerization and loss of RING2 displacement (Fig. 5C). The interaction between pUbl and K211 pocket on RING0 leads to the displacement of RING2 resulting in Parkin activation as catalytic residue C431 on RING2 is exposed for catalysis. The biophysical experiment is further confirmed by a biochemical experiment where the addition of catalytically in-active phospho-Parkin T270R/C431A activates autoinhibited WT-Parkin in trans using the mechanism as discussed (a schematic representation also shown in Author response image 2).

      We thank this reviewer regarding Parkin isoforms. In the revised manuscript, we have included Parkin isoforms in the results section, too.

      (2a) For the in trans activation experiment using wt Parkin and pParkin (T270R/C431A) (Figure 3D), there needs to be a large excess of pParkin to stimulate the catalytic activity of wt Parkin. This experiment has low cellular relevance as these point mutations are unlikely to occur together to create this nonfunctional pParkin protein. In the case of pParkin activating wt Parkin (regardless of artificial point mutations inserted to study specifically the in trans activation), if there needs to be much more pParkin around to fully activate wt Parkin, isn't it just more likely that the pParkin would activate in cis?

      To test phospho-Parkin as an activator of Parkin in trans, we wanted to use the catalytically inactive version of phospho-Parkin to avoid the background activity of p-Parkin. While it is true that a large excess of pParkin (T270R/C431A) is required to activate WT-Parkin in the in vitro set-up, it is not very surprising as in WT-Parkin, the unphosphorylated Ubl domain would block the E2 binding site on RING1. Also, due to interactions between pParkin (T270R/C431A) molecules, the net concentration of pParkin (T270R/C431A) as an activator would be much lower. However, the Ubl blocking E2 binding site on RING1 won’t be an issue between phospho-Parkin molecules or between Parkin isoforms (lacking Ubl domain or RING2).

      (2ai) Another underlying issue with this experiment is that the authors do not consider the possibility that the increased activity observed is a result of increased "substrate" for auto-ubiquitination, as opposed to any role in catalytic activation. Have the authors considered looking at Miro as a substrate in order to control for this?

      This is quite an interesting point. However, this will be only possible if Parkin is ubiquitinated in trans, as auto-ubiquitination is possible with active Parkin and not with catalytically dead (phospho-Parkin T270R, C431A) or autoinhibited (WT-Parkin). Also, in the previous version of the manuscript, where we used only phospho-Ubl as an activator of Parkin in trans, we tested Miro1 ubiquitination and auto-ubiquitination, and the results were the same (Author response image 4).

      Author response image 4.

      (2b) The authors mention a "higher net concentration" of the "fused domains" with RING0, and use this to justify artificially cleaving the Ubl or RING2 domains from the Parkin core. This fact should be moot. In cells, it is expected there will only be a 1:1 ratio of the Parkin core with the Ubl or RING2 domains. To date, there is no evidence suggesting multiple pUbls or multiple RING2s can bind the RING0 binding site. In fact, the authors here even show that either the RING2 or pUbl needs to be displaced to permit the binding of the other domain. That being said, there would be no "higher net concentration" because there would always be the same molar equivalents of Ubl, RING2, and the Parkin core.

      We apologize for the confusion. “Higher net concentration” is with respect to fused domains versus the domain provided in trans. Due to the competing nature of the interactions between pUbl/RING2 and RING0, the interactions are too transient and beyond the detection limit of the biophysical techniques. While the domains are fused (for example, RING0-RING2 in the same polypeptide) in a polypeptide, their effective concentrations are much higher than those (for example, pUbl) provided in trans; thus, biophysical methods fail to detect the interaction. Treatment with protease solves the above issue due to the higher net concentration of the fused domain, and trans interactions can be measured using biophysical techniques. However, the nature of these interactions and conformational changes is very transient, which is also suggested by the data. Therefore, Parkin molecules will never remain associated; rather, Parkin will transiently interact and activate Parkin molecules in trans.

      (2c) A larger issue remaining in terms of Parkin activation is the lack of clarity surrounding the role of the linker (77-140); particularly whether its primary role is to tether the Ubl to the cis Parkin molecule versus a role in permitting distal interactions to a trans molecule. The way the authors have conducted the experiments presented in Figure 2 limits the possible interactions that the activated pUbl could have by (a) ablating the binding site in the cis molecule with the K211N mutation; (b) further blocking the binding site in the cis molecule by keeping the RING2 domain intact. These restrictions to the cis parkin molecule effectively force the pUbl to bind in trans. A competition experiment to demonstrate the likelihood of cis or trans activation in direct comparison with each other would provide stronger evidence for trans activation.

      This is an excellent point. In the revised manuscript, we have performed experiments using native phospho-Parkin (Revised Figure 5), and the results are consistent with those in Figure 2 ( Revised Figure 4), where we used the K211N mutation.

      (3) A major limitation of this study is that the authors interpret structural flexibility from experiments that do not report directly on flexibility. The analytical SEC experiments report on binding affinity and more specifically off-rates. By removing the interdomain linkages, the accompanying on-rate would be drastically impacted, and thus the observations are disconnected from a native scenario. Likewise, observations from protein crystallography can be consistent with flexibility, but certainly should not be directly interpreted in this manner. Rigorous determination of linker and/or domain flexibility would require alternative methods that measure this directly.

      We also agree with the reviewer that these methods do not directly capture structural flexibility. Also, rigorous determination of linker flexibility would require alternative methods that measure this directly. However, due to the complex nature of interactions and technical limitations, breaking the interdomain linkages was the best possible way to capture interactions in trans. Interestingly, all previous methods that report cis interactions between pUbl and RING0 also used a similar approach (Gladkova et al.ref. 24, Sauve et al. ref. 29).  

      (4) The analysis of the ACT element comes across as incomplete. The authors make a point of a competing interaction with Lys48 of the Ubl domain, but the significance of this is unclear. It is possible that this observation could be an overinterpretation of the crystal structures. Additionally, the rationale for why the ACT element should or shouldn't contribute to in trans activation of different Parkin constructs is not clear. Lastly, the conclusion that this work explains the evolutionary nature of this element in chordates is highly overstated.

      We agree with the reviewer that the significance of Lys48 is unclear. We have presented this just as one of the observations from the crystal structure. As the reviewer suggested, we have removed the sentence about the evolutionary nature of this element from the revised manuscript.

      (5) The analysis of the REP linker element also seems incomplete. The authors identify contacts to a neighboring pUb molecule in their crystal structure, but the connection between this interface (which could be a crystallization artifact) and their biochemical activity data is not straightforward. The analysis of flexibility within this region using crystallographic and AlphaFold modeling observations is very indirect. The authors also draw parallels with linker regions in other RBR ligases that are involved in recognizing the E2-loaded Ub. Firstly, it is not clear from the text or figures whether the "conserved" hydrophobic within the linker region is involved in these alternative Ub interfaces. And secondly, the authors appear to jump to the conclusion that the Parkin linker region also binds an E2-loaded Ub, even though their original observation from the crystal structure seems inconsistent with this. The entire analysis feels very preliminary and also comes across as tangential to the primary storyline of in trans Parkin activation.

      We agree with the reviewer that crystal structure data and biochemical data are not directly linked. In the revised manuscript, we have also highlighted the conserved hydrophobic in the linker region at the ubiquitin interface (Fig. 9C and Extended Data Fig. 11A), which was somehow missed in the original manuscript. We want to add that a very similar analysis and supporting experiments identified donor ubiquitin-binding sites on the IBR and helix connecting RING1-IBR (Kumar et al., Nature Str. and Mol. Biol., 2017), which several other groups later confirmed. In the mentioned study, the Ubl domain of Parkin from the symmetry mate Parkin molecule was identified as a mimic of “donor ubiquitin” on IBR and helix connecting RING1-IBR.

      In the present study, a neighboring pUb molecule in the crystal structure is identified as a donor ubiquitin mimic (Fig. 9C) by supporting biophysical/biochemical experiments. First, we show that mutation of I411A in the REP linker of Parkin perturbs Parkin interaction with E2~Ub (donor) (Fig. 9F). Another supporting experiment was performed using a Ubiquitin-VS probe assay, which is independent of E2. Assays using Ubiquitin-VS show that I411A mutation in the REP-RING2 linker perturbs Parkin charging with Ubiquitin-VS (Extended Data Fig. 11 B). Furthermore, the biophysical data showing loss of Parkin interaction with donor ubiquitin is further supported by ubiquitination assays. Mutations in the REP-RING2 linker perturb the Parkin activity (Fig. 9E), confirming biophysical data. This is further confirmed by mutations (L71A or L73A) on ubiquitin (Extended Data Fig. 11C), resulting in loss of Parkin activity. The above experiments nicely establish the role of the REP-RING2 linker in interaction with donor ubiquitin, which is consistent with other RBRs (Extended Data Fig. 11A).

      While we agree with the reviewer that this appears tangential to the primary storyline in trans-Parkin activation, we decided to include this data because it could be of interest to the field.

      Recommendations for the authors:

      Reviewer #1 (Recommendations For The Authors):

      (1) For clarity, a schematic of the domain architecture of Parkin would be helpful at the outset in the main figures. This will help with the introduction to better understand the protein organization. This is lost in the Extended Figure in my opinion.

      We thank the reviewer for suggesting this, which we have included in Figure 1 of the revised manuscript.

      (2) Related to the competition between the Ubl and RING2 domains, can competition be shown through another method? SPR, ITC, etc? ITC was used in other experiments, but only in the context of mutations (Lys211Asn)? Can this be done with WT sequence?

      This is an excellent suggestion. In the revised Figure 5, we have performed ITC experiment using WT Parkin, and the results are consistent with what we observed using Lys211Asn Parkin.

      (3) The authors also note that "the AlphaFold model shows a helical structure in the linker region of Parkin (Extended Data Figure 10C), further confirming the flexible nature of this region"... but the secondary structure would not be inherently flexible. This is confusing.

      The flexibility is in terms of the conformation of this linker region observed under the open or closed state of Parkin. In the revised manuscript, we have explained this point more clearly.

      (4) The manuscript needs extensive revision to improve its readability. Minor grammatical mistakes were prevalent throughout.

      We thank the reviewer for pointing out this and we have corrected these in the revised manuscript.

      (5) The confocal images are nice, but inset panels may help highlight the regions of interest (ROIs).

      This is corrected in the revised manuscript.

      (6) Trans is misspelled ("tans") towards the end of the second paragraph on page 16.

      This is corrected in the revised manuscript.

      (7) The schematics are helpful, but some of the lettering in Figure 2 is very small.

      This is corrected in the revised manuscript.

      Reviewer #3 (Recommendations For The Authors):

      (1) A significant portion of the results section refers to the supplement, making the overall readability very difficult.

      We accept this issue as a lot of relevant data could not be added to the main figures and thus ended up in the supplement.  In the revised manuscript, we have moved some of the supplementary figures to the main figures.

      (2) Interpretation of the experiments utilizing many different Parkin constructs and cleavage scenarios (particularly the SEC and crystallography experiments) is extremely difficult. The work would benefit from a layout of the Parkin model system, highlighting cleavage sites, key domain terminology, and mutations used in the study, presented together and early on in the manuscript. Using this to identify a simpler system of referencing Parkin constructs would also be a large improvement.

      This is a great suggestion. We have included these points in the revised manuscript, which has improved the readability.

      (3) Lines 81-83; the authors say they "demonstrate the conformational changes in Parkin during the activation process", but fail to show any actual conformational changes. Further, much of what is demonstrated in this work (in terms of crystal structures) corroborates existing literature. The authors should use caution not to overstate their original conclusions in light of the large body of work in this area.

      We thank the reviewer for pointing out this. We have corrected the above statement in the revised manuscript to indicate that we meant it in the context of trans conformational changes.

      (4) Line 446 and 434; there is a discrepancy about which amino acid is present at residue 409. Is this a K408 typo? The authors also present mutational work on K416, but this residue is not shown in the structure panel.

      We thank the reviewer for pointing out this. In the revised manuscript, we have corrected these typos.

    1. Author response:

      The following is the authors’ response to the previous reviews.

      Revisions Round 1

      Reviewer #1

      We thank the reviewer for their careful reading of our manuscript and have taken all of their grammatical corrections into account.

      Reviewer #2 (Public Review): 

      Weaknesses: 

      The paper contains multiple instances of non-scientific language, as indicated below. It would also benefit from additional details on the cryo-EM structure determination in the Methods and inclusion of commonly accepted requirements for cryo-EM structures, like examples of 2D class averages, raw micrographs, and FSC curves (between half-maps as well as between rigid-body fitted (or refined) atomic models of the different polymorphs and their corresponding maps). In addition, cryo-EM maps for the control experiments F1 and F2 should be presented in Figure 9.

      We tried to correct the non-scientific language and have included the suggested data on the Cryo-EM analyses including new Figures 11-17.  We did not collect data on the sample used for the seeds in the cross seeding experiments because we had already confirmed in multiple datasets that the conditions in F1 and F2 reproducibly produce fibrils of Type 1 and Type 3, respectively. We have now analyzed cryo-EM data for 6 more samples at pH 7.0 and found that several kinds of polymorphs (Types 1A, 1M, 2A, 2B and 5) are accessible at this pH, however the Type 3 polymorphs are not formed at pH 7.0 under the conditions that we used for aggregation.

      Reviewer #2 (Recommendations For The Authors): 

      - remove unscientific language: "it seems that there are about as many unique atomic-resolution structures of these aggregates as there are publications describing them"   

      We have rephrased this sentence.

      - for same reason, remove "Obviously, " 

      Done

      - What does this mean? “polymorph-unspecific” 

      Rephrased as non-polymorph-specific

      - What does this mean? "shallow amyloid energy hypersurface"  

      By “shallow hypersurface” we mean that the minimum of the multi-dimensional function that describes the energy of the amyloid is not so deep that subtle changes to the environment will not favor another fold/energy minimum. We have left the sentence because while it may not be perfect, it is concise and seems to get the point across.

      - "The results also confirm the possibility of producing disease-relevant structure in vitro." -> This is incorrect as no disease-relevant structure was replicated in this work. Use another word like “suggest”.

      We have changed to “suggest” as suggested.

      - Remove "historically" 

      Done

      - Rephrase “It has long been understood that all amyloids contain a common structural scaffold” 

      Changed to “It has long been established that all amyloids contain a common structural scaffold..” 

      - "Amyloid polymorphs whose differences lie in both their tertiary structure (the arrangement of the beta-strands) and the quaternary structure (protofilamentprotofilament assembly) have been found to display distinct biological activities [8]" -> I don't think this is true, different biological activities of amyloids have never been linked to their distinct structures.  

      We have added 5 new references (8-12) to support this sentence.

      - Reference 10 is a comment on reference 9; it should be removed. Instead, as for alpha-synuclein, all papers describing the tau structures should be included.  

      We have removed the reference, but feel that the addition of all Tau structure references is not merited in this manuscript since we are not comparing them.

      - Rephrase: "is not always 100% faithful"

      Removed “100%”

      - What is pseudo-C2 symmetry? Do the authors mean pseudo 2_1 symmetry (ie a 2-start helical symmetry)?

      Thank for pointing this out.  We did indeed mean pseudo 21 helical symmetry.  

      - Re-phrase: "alpha-Syn's chameleon-like behavior" 

      We have removed this phrase.

      - "In the case of alpha-Syn, the secondary nucleation mechanism is based on the interaction of the positively charged N-terminal region of monomeric alpha-Syn and the disordered, negatively charged C-terminal region of the alpha-Syn amyloid fibrils [54]" -> I would say the mechanisms of secondary nucleation are not that well understood yet, so one may want to tune this down a bit. 

      We have changed this to “mechanism has been proposed to be”

      - The paragraphs describing experiments by others are better suited for a Discussion rather than a Results section. Perhaps re-organize this part? 

      We have left the text intact as we are using a Results and Discussion format.

      - A lot of information about Image processing seems to be missing: what steps were performed after initial model generation? 

      We have added more details in the methods section on the EM data processing and model analysis.

      - Figure 1: Where is Type 4 on the pH scale?

      We have adjusted the Fig 1 legend to clarify that pH scale is only applicable to the structures presented in this manuscript. 

      - Figure 2: This might be better incorporated as a subpanel of Figure 1.

      We agree that this figure is somewhat of a loner on its own and we only added it in order to avoid confusion with the somewhat inconsistent naming scheme used for the Type 1B structure. However, we prefer to leave it as a separate figure so that it does not get dilute the impact of figure 1.

      - Figure 3: What is the extra density at the bottom of Type 3B from pH 5.8 samples 1 and 2. pH 5.8 + 50mM NaCl (but not pH 5.8 + 100 mM NaCl)? Could this be an indication of a local minimum and the pH 5.8 + 100 mM NaCl structure is correct? Or is this a real difference between 0/50mM NaCl and 100 mM NaCl? 

      We did not see the extra density to which the reviewer is referring, however the images used in this panel are the based on the output of 3D-classification which is more likely to produce more artifacts than a 3D refinement. With this in mind, we did not see any significant differences in the refined structures and therefore only deposited the better quality map and model for each of the polymorph types.

      - Figure 3: To what extent is Type 3B of pH 6.5 still a mixture of different types? The density looks poor. In general, in the absence of more details about the cryo-EM maps, it is hard to assess the quality of the structures presented.  

      In order to improve the quality of the images in this panel, a more complete separation of the particles from each polymorph was achieved via the filament subset selection tool in RELION 5. In each case, an unbiased could be created from the 2D classes via the relion_helix_inimodel2D program, further supporting the coexistence of 4 polymorphs in the pH 6.5 sample. The particles were individually refined to produce the respective maps that are now used in this figure.

      - Many references are incorrect, containing "Preprint at (20xx)" statements.

      This has been corrected.  

      Reviewer #3 (Public Review): 

      Weaknesses: 

      (1) The authors reveal that both Type 1 monofilament fibril polymorph (reminiscent of JOSlike polymorph) and Type 5 polymorph (akin to tissue-amplified-like polymorph) can both form under the same condition. Additionally, this condition also fosters the formation of flat ribbon-like fibril across different batches. Notably, at pH 5.8, variations in experimental groups yield disparate abundance ratios between polymorph 3B and 3C, indicating a degree of instability in fibrillar formation. The variability would potentially pose challenges for replicability in subsequent research. In light of these situations, I propose the following recommendations: 

      (a) An explicit elucidation of the factors contributing to these divergent outcomes under similar experimental conditions is warranted. This should include an exploration of whether variations in purified protein batches are contributing factors to the observed heterogeneity.

      We are in complete agreement that understanding the factors that lead to polymorph variability is of utmost importance (and was the impetus for the manuscript itself). However the number of variables to explore is overwhelming and we will continue to investigate this in our future research. Regarding the variability between batches of purified protein, we also think that this could be a factor in the polymorph variability observed for otherwise “identical” aggregation conditions, particularly at pH 7 where the largest variety of polymorphs have been observed. However, even variation between identical replicates (samples created from the same protein solution and simply aggregated simultaneously in separate tubes) can lead to different outcomes (see datasets 15 and 16 in the revised Table 1) suggesting that there are stochastic processes that can determine the outcome of an individual aggregation experiment. While our data still indicates that Type 1,2 and 3 polymorphs are strongly selected by pH, the selection between interface variants 3B vs. 3C and 2A vs. 2B might also be affected by protein purity. Our standard purification protocol produces a single band by coomassie-stained SDS-PAGE however minor truncations and other impurities below a few percent would go undetected and, given the proposed roles of the N and C-termini in secondary nucleation, could have a large effect on polymorph selection and seeding. In line with the reviewer’s comments we now include a batch number for each EM dataset. While no new conclusions can be drawn from the inclusion of this additional data, we feel that it is important to acknowledge the possible role of batch to batch variability. 

      (b) To enhance the robustness of the conclusions, additional replicates of the experiments under the same condition should be conducted, ideally a minimum of three times.  

      The pH 5.8 conditions that yield Type 3 fibrils has already been repeated several times in the original manuscript. Since the pH 7.4 conditions produce the most common a-Syn polymorph (Type 1A) and were produced twice in this manuscript (once as an unseeded and once as a cross-seeded fibrilization) we decided to focus on the intermediate condition where the most variability had been seen (pH 7.0). The revised table 1 now has 6 new datasets (11-16) representing 6 independent aggregations at pH 7.0 starting from two different protein purification batches. The results is that we now produce the type 2A/B polymorphs in three samples and in two of these samples we once again observed the type 1M polymorph.  The other samples produced Type 1A or non-twisted fibrils.

      (c) Further investigation into whether different polymorphs formed under the same buffer condition could lead to distinct toxicological and pathology effects would be a valuable addition to the study.  

      The correlation of toxicity with structure would in principle be interesting. However the Type 1 and Type 3 polymorphs formed at pH 5.8 and 7.4 are not likely to be biologically relevant. The pH 7 polymorphs (Type 5 and 1M) would be more interesting because they form under the same conditions and might be related to some disease relevant structures. Still, it is rare that a single polymorph appears at 7.0 (the Type 5 represented only 10-20% of the fibrils in the sample and the Type 1M also had unidentified double-filament fibrils in the sample). We plan to pursue this line of research and hope to include it in a future publication.

      (2) The cross-seeding study presented in the manuscript demonstrates the pivotal role of pH conditions in dictating conformation. However, an intriguing aspect that emerges is the potential role of seed concentration in determining the resultant product structure. This raises a critical question: at what specific seed concentration does the determining factor for polymorph selection shift from pH condition to seed concentration? A methodological robust approach to address this should be conducted through a series of experiments across a range of seed concentrations. Such an approach could delineate a clear boundary at which seed concentration begins to predominantly dictate the conformation, as opposed to pH conditions. Incorporating this aspect into the study would not only clarify the interplay between seed concentration and pH conditions, but also add a fascinating dimension to the understanding of polymorph selection mechanisms.

      A more complete analysis of the mechanisms of aggregation, including the effect of seed concentration and the resulting polymorph specificity of the process, are all very important for our understanding of the aggregation pathways of alpha-synuclein and are currently the topic of ongoing investigations in our lab.

      Furthermore, the study prompts additional queries regarding the behavior of cross-seeding production under the same pH conditions when employing seeds of distinct conformation. Evidence from various studies, such as those involving E46K and G51D cross-seeding, suggests that seed structure plays a crucial role in dictating polymorph selection. A key question is whether these products consistently mirror the structure of their respective seeds. 

      We thank the reviewer for reminding us to cite these studies as a clear example of polymorph selection by cross-seeding. Unfortunately, it is not 100% clear from the G51D cross seeding manuscript (https://doi.org/10.1038/s41467-021-26433-2) what conditions were used in the cross-seeding since different conditions were used for the seedless wild-type and mutant aggregations… however it appears that the wildtype without seeds was Tris pH 7.5 (although at 37C the pH could have dropped to 7ish) and the cross-seeded wild-type was in Phosphate buffer at pH 7.0. In the E46K cross-seeding manuscript, it appears that pH 7.5 Tris was used for all fibrilizations (https://doi.org/10.1073/pnas.2012435118).  In any event, both results point to the fact that at pH 7.0-7.5 under low-seed conditions (0.5%) the Type 4 polymorph can propagate in a seed specific manner.

      (3) In the Results section of "The buffer environment can dictate polymorph during seeded nucleation", the authors reference previous cell biological and biochemical assays to support the polymorph-specific seeding of MSA and PD patients under the same buffer conditions. This discussion is juxtaposed with recent research that compares the in vivo biological activities of hPFF, ampLB as well as LB, particularly in terms of seeding activity and pathology. Notably, this research suggests that ampLB, rather than hPFF, can accurately model the key aspects of Lewy Body Diseases (LBD) (refer to: https://doi.org/10.1038/s41467-023-42705-5). The critical issue here is the need to reconcile the phenomena observed in vitro with those in in-vivo or in-cell models. Given the low seed concentration reported in these studies, it is imperative for the authors to provide a more detailed explanation as to why the possible similar conformation could lead to divergent pathologies, including differences in cell-type preference and seeding capability.  

      We thank the reviewer for bring this recent report to our attention. The findings that ampLB and hPFF have different PK digestion patterns and that only the former is able to model key aspects of Lewy Body disease are in support of the seed-specific nature of some types of alpha-synuclein aggregation.  We have added this to the discussion regarding the significant role that seed type and seed conditions likely play in polymorph selection.

      (4) In the Method section of "Image processing", the authors describe the helical reconstruction procedure, without mentioning much detail about the 3D reconstruction and refinement process. For the benefit of reproducibility and to facilitate a deeper understanding among readers, the authors should enrich this part to include more comprehensive information, akin to the level of detail found in similar studies (refer to: https://doi.org/10.1038/nature23002).

      As also suggested by reviewer #2, we have now added more comprehensive information on the 3D reconstruction and refinement process.

      (5) The abbreviation of amino acids should be unified. In the Results section "On the structural heterogeneity of Type 1 polymorphs", the amino acids are denoted using three-letter abbreviation. Conversely, in the same section under "On the structural heterogeneity of Type 2 and 3 structures", amino acids are abbreviated using the one-letter format. For clarity and consistency, it is essential that a standardized format for amino acid abbreviations be adopted throughout the manuscript.

      That makes perfect sense and had been corrected.

      Reviewing Editor: 

      After discussion among the reviewers, it was decided that point 2 in Reviewer #3's Public Review (about the experiments with different concentrations of seeds) would probably lie outside the scope of a reasonable revision for this work. 

      We agree as stated above and will continue to work on this important point.

      Revisions Round 2

      Reviewer #2 (Public Review): 

      I do worry that the FSC values of model-vs-map appear to be higher than expected from the corresponding FSCs between the half-maps (e.g. see Fig 13). The implication of this observation is that the atomic models may have been overfitted in the maps, which would have led to a deterioration of their geometry. A table with rmsd on bond lengths, angles, etc would probably show this. In addition, to check for overfitting, the atomic model for each data set could be refined in one of the half-maps, and then that same model could be used to calculate 2 FSC model-vs-map curves: one against the half-map it was refined in and one against the other half-map. Deviations between these two curves are an indication of overfitting. 

      Thank you for the recommendations for model validation.  We have added the suggested statistics to Table 2 and performed the suggested model fitting to one of the half-maps and plotted 3 FSC model-vs-map curves: one for each half-map versus the model fit against only one half map and one for the model fit against the full map. We feel that the degree of overfitting is reasonable and does not  significantly impact the quality of the models. 

      In addition, the sudden drop in the FSC curves in Figure 16 shows that something unexpected has happened to this refinement. Are the authors sure that only the procedures outlined in the Methods were used to create these curves? The unexpected nature of the FSC curve for this type (2A) raises doubts about the correctness of the reconstruction. 

      We thank the reviewer for the attention to detail.  We should have caught this mistake. It turns out that in the last round of 3D refinement, the two half-maps become shifted with respect to each other in the z direction. We realigned the two maps using Chimera and then re-ran the postprocessing. The new maps have been deposited in EMD-50850. This mistake motivated us to inspect all of the maps and we found the same problem had occurred in the Type 3B maps.  This was not noticed by the reviewer because we accidentally plotted the FSC curves from postprocessing from one refinement round before the one deposited in the EMD. We performed the same half-map shifting procedure for the Type 3B data and performed a final round of real-space refinement to produce new maps and models that have been deposited as EMD-50888 and 9FYP (superseding the previous entries).

      Reviewer #3 (Public Review): 

      There are two minor points I recommend the authors to address: 

      (1) In the response to Weakness 1, point (3), the authors state that "the Type 5 represented only 10-20% of the fibrils in the sample." However, this information is not labeled in the corresponding Figure 4. I suggest the authors verify and label all relevant percentages in the figures to prevent misunderstandings. 

      We aim to be as transparent as possible and this information was included in the main text however we did not label the percentage of Type 5 fibrils in Figure 4 because that would make the other percentages ambiguous.  The percentages in Figure 4 represent the ratio of helical segments used for each type of refined structure in the dataset (always adding up to 100%), not the percent of all fibrils in the dataset.  That is, there are sometimes untwisted or unidentifiable fibrils in datasets and these were not accounted for in the listed percentages. We have added a sentence to the Figure 4 legend to explain to what the percentages refer.

      (2) While the authors have detailed the helical reconstruction procedure in the Methods section, it is necessary to indicate the scale bar or box size in the figure legend of the 2D representative classes to ensure clarity and reproducibility. 

      Thank you for reminding us to add the scale bars. This is now done for the 2D classes in Figures 11-17.

      Recommendations for the authors: 

      Reviewer #2 (Recommendations For The Authors): 

      A critical look at the maps and models of the various structures at this stage may prevent the authors from entering suboptimal structures into the databases.  

      We agree. Thank you for suggesting this.

      Reviewer #3 (Recommendations For The Authors): 

      The authors have responded adequately to these critiques in the revised version of the manuscript. There are two minor points. 

      (1) The authors state that "the Type 5 represented only 10-20% of the fibrils in the sample." However, this information is not labeled in the corresponding Figure 4. I suggest the authors verify and label all relevant percentages in the figures to prevent misunderstandings. 

      (2) While the authors have detailed the helical reconstruction procedure in the Methods section, it is necessary to indicate the scale bar or box size in the figure legend of the 2D representative classes to ensure clarity and reproducibility. 

      Answered in public comments

    1. Author response:

      Public Reviews:

      Reviewer #1 (Public Review):

      Little is known about the local circuit mechanisms in the preoptic area (POA) that regulate body temperature. This carefully executed study investigates the role of GABAergic interneurons in the POA that express neurotensin (NTS). The principal finding is that GABA-release from these cells inhibits neighboring neurons, including warm-activated PACAP neurons, thereby promoting hyperthermia, whereas NTS released from these cells has the opposite effect, causing a delayed activation and hypothermia. This is shown through an elegant series of experiments that include slice recordings alongside matched in vivo functional manipulations. The roles of the two neurotransmitters are distinguished using a cell-type-specific knockout of Vgat as well as pharmacology to block GABA and NTS receptors. Overall, this is an excellent study that is noteworthy for revealing local circuit mechanisms in the POA that control body temperature and also for highlighting how amino acid neurotransmitters and neuropeptides released from the same cell can have opposing physiologic effects. I have only minor suggestions for revision.

      Reviewer #2 (Public Review):

      Summary:

      The study has demonstrated how two neurotransmitters and neuromodulators from the same neurons can be regulated and utilized in thermoregulation.

      The study utilized electrophysiological methods to examine the characteristics and thermoregulation of Neurotensin (Nts)-expressing neurons in the medial preoptic area (MPO). It was discovered that GABA and Nts may be co-released by neurons in MPO when communicating with their target neurons.

      Strengths:

      The study has leveraged optogenetic, chemogenetic, knockout, and pharmacological inhibitors to investigate the release process of Nts and GABA in controlling body temperature.

      The findings are relevant to those interested in the various functions of specific neuron populations and their distinct regulatory mechanisms on neurotransmitter/neuromodulator activities

      Weaknesses:

      Key points for consideration include:

      (1) The co-release of GABA and Nts is primarily inferred rather than directly proven. Providing more direct evidence for the release of GABA and the co-release of GABA and Nts would strengthen the argument. Further in vitro analysis could strengthen the conclusion regarding this co-releasing process.

      Measurement of Nts concentrations in various brain regions during thermoregulatory responses is part of a future study.

      (2) The differences between optogenetic and chemogenetic methods were not thoroughly investigated. A comparison of in vitro results and direct observation of release patterns could clarify the mechanisms of GABA release alone or in conjunction with Nts under different stimulation techniques.

      A comparison of chemogenetic and optogenetic stimulation methods is not within the scope of this study.

      (3) Neuronal transcripts were mainly identified through PCR, and alternative methods like single-cell sequencing could be explored.

      Single cell transcriptomics of preoptic neurotensinergic neurons will be part of a different study.

      (4) In Figure 6, the impact of GABA released from Nts neurons in MPO on CBT regulation appears to vary with ambient temperatures, requiring a more detailed explanation for better comprehension.

      The different possible roles of GABA in different thermoregulatory circumstances is discussed on lines 555-581.

      (5) The model should emphasize the key findings of the study.

      The model is presented in Fig 8.

      Reviewer #3 (Public Review):

      Summary:

      Understanding the central neural circuits regulating body temperature is critical for improving health outcomes in many disease conditions and in combating heat stress in an ever-warming environment. The authors present important and detailed new data that characterizes a specific population of POA neurons with a relationship to thermoregulation. The new insights provided in this manuscript are exactly what is needed to assemble a neural network model of the central thermoregulatory circuitry that will contribute significantly to our understanding of regulating the critical homeostatic variable of body temperature. These experiments were conducted with the expertise of an investigator with career-long experience in intracellular recordings from POA neurons. They were interpreted conservatively in the appropriate context of current literature.

      The Introduction begins with "Homeotherms, including mammals, maintain core body temperature (CBT) within a narrow range", but this ignores the frequent hypothermic episodes of torpor that mice undergo triggered by cold exposure. Although the author does mention torpor briefly in the Discussion, since these experiments were carried out exclusively in mice, greater consideration (albeit speculative) of the potential for a role of MPO Nts neurons in torpor initiation or recovery is warranted. This is especially the case since some 'torpor neurons' have been characterized as PACAP-expressing and a population of PACAP neurons represent the target of MPO Nts neurons.

      Additional discussion of a possible role of neurotensinergic neurons in the initiation or recovery from torpor is included (lines 593-597).

    1. Author response:

      The following is the authors’ response to the original reviews.

      Reviewer #1 (Public Review): 

      Summary:

      The authors profile gene expression, chromatin accessibility, and chromosomal architecture (by Hi-C) in activated CD4 T cells and use this information to link non-coding variants associated with autoimmune diseases with putative target genes. They find over 1000 genes physically linked with autoimmune disease loci in these cells, many of which are upregulated upon T cell activation. Focusing on IL2, they dissect the regulatory architecture of this locus, including the allelic effects of GWAS variants. They also intersect their variant-to-gene lists with data from CRISPR screens for genes involved in CD4 T cell activation and expression of inflammatory genes, finding enrichments for regulators. Finally, they showed that pharmacological inhibition of some of these genes impacts T-cell activation. 

      This is a solid study that follows a well-established canvas for variant-to-gene prioritisation using 3D genomics, applying it to activated T cells. The authors go some way in validating the lists of candidate genes, as well as exploring the regulatory architecture of a candidate GWAS locus. Jointly with data from previous studies performing variant-to-gene assignment in activated CD4 T cells (and other immune cells), this work provides a useful additional resource for interpreting autoimmune disease-associated genetic variation. 

      Suggestions for improvement:

      Autoimmune disease variants were already linked with genes in CD28-stimulated CD4 T cells using chromosome conformation capture, specifically Promoter CHi-C and the COGS pipeline (Javierre et al., Cell 2016; Burren et al., Genome Biol 2017; Yang et al., Nat Comms 2020). The authors cite these papers and present a comparative analysis of their variant-to-gene assignments (in addition to scRNA-seq eQTL-based assignments). Furthermore, they find that the Burren analysis yields a higher enrichment for gold standard genes. 

      The obvious question that the authors don't venture into is why the results are quite different. In principle, this could be due to the differences between: 

      (a) the cell stimulation procedure 

      (b) the GWAS datasets used 

      (c)  the types of assay (Hi-C vs Capture Hi-C) 

      (d) approaches for defining gene-linked regions (loops vs neighbourhoods) 

      (e) how the GWAS signals at gene-linked regions are aggregated (e.g., the flavours of COGS in Javierre and Burren vs the authors' approach)

      Re (a), I'm not sure the authors make it explicitly clear in the main text that the Capture Hi-Cbased studies also use *stimulated* CD4 T cells, particularly in the section "Comparative predictive power...". So the cells used are pretty much the same, and the differences likely arise from points (b) to (e).

      It would be useful for the community to understand more clearly what is driving these differences, ideally with some added data. Could the authors, for example, take the PCHi-C data from Javierre/Burren and use their GWAS data and variant-to-gene assignment algorithms? 

      We greatly appreciate the referee’s expert assessment of our work and its value to the field, and we are glad that the referee was enthused by our comparison of the predictive power of the various V2G approaches. A point not emphasized enough in the original version of the manuscript is that we actually did harmonize the various datasets in the way the referee suggests for the precision/recall analysis. We took the contact maps presented from each paper, mapped genes using the same set of GWAS SNPs, and defined all gene-linked regions using our loop calling approach. This has been clarified in the revised version of the manuscript. We have now included a more thoughtful discussion of the possible sources of discrepancy between the different studies included in the comparison, and our thoughts on the potential sources raised by the referee are outlined below:

      (a) The modes of stimulation used are similar between studies, but timepoints and donors did vary, and ours was the only study that sorted naïve CD4+ T cells before stimulation. These aspects could represent a source of variability. 

      (b) The GWAS is not a source of variability because we re-ran the raw data from all the orthogonal studies through our V2G pipeline using the same GWAS as in the current manuscript. 

      (c) The use of HiC vs. Capture HiC is a likely source of variability. The Capture-HiC datasets included in our comparison are lower resolution (i.e. HindIII) but focus higher sequencing depth at promoters compared to our HiC datasets – i.e., Capture-HiC may mis-call loops to the wrong promoters due to lower resolution as we have shown in our previous study [Su, Human Genetics, 2021], and will miss distal SNP interactions at promoters not included in the capture set. While HiC is unbiased in this regard, HiC will fail to call some SNP-promoter loops called by CaptureHiC because the sequencing power is not specifically focused at promoters. 

      (d) For studies using neighborhood approaches, we re-ran the raw data through our loop calling algorithm to connect distal SNP to gene promoters, and regarding (e) above, we ran the raw data through our V2G pipeline to allow a better comparison.

      In addition, given that the authors use Hi-C, a popular method for V2G prioritisation for this type of data is currently ABC (Nasser et al, Nature 2021). Could the authors provide a comparative analysis with respect to the V2G assignments in the paper and, if they see it appropriate, also run ABC-based GWAS integration on their own Hi-C data?

      This is an excellent suggestion, which we have followed in the revised version of our manuscript. It should be noted (and we do so in the text of the revision) that there is an important caveat to bringing in the ABC model. Chromosome conformation-based approaches are biologically constrained (i.e., informed) by the natural structure of chromatin in the nucleus that controls how gene transcription is regulated in cis, and it does so in a way that brings value to GWAS data. However, the ABC model further constrains the input data by imposing non-biological filters that allow the algorithm to be applied, but impose artifactual limitations that may negatively impact interpretation and discovery. In addition to filtering out pseudogenes, bidirectional RNA, antisense RNAs, and small RNAs, the ABC model gene set eliminates genes ubiquitously expressed across tissues (based on the assumption that these genes are driven primarily by elements adjacent to their promoters) and only allows annotation of one promoter per gene, even though the median number of promoters per gene in the human genome is three. In contrast, our chromatin-based V2G removes pseudogenes, but includes lincRNA and small RNAs, and includes all alternative transcription start sites annotated by gencode. 

      To apply the ABC GWAS gene nomination model to our CD4+ T cell chromatin-based V2G data, we used our ATAC-seq data and publicly available CD4+ T cell H3K27ac ChIP-seq data as input, and integrated this with GWAS and the average ENCODE-derived HiC dataset from the original ABC paper. The activity-by-contact model nominated 650 genes, compared to 1836 genes when using our cell type-matched HiC data and analysis pipeline. Only 357 of these genes were nominated by both approaches; 1479 genes nominated by our approach were not nominated by ABC, while 293 genes not implicated by our approach were newly implicated by ABC. To determine how the ABC-constrained approach performs against the HIEI gold standard set, we subjected all datasets used for the comparison depicted in the new Figure 5D to the same promoter filter used by the ABC model prior as part of the precision-recall re-analysis. Firstly, we found that applying the restricted ABC model promoter annotation to all datasets did not have a large effect on recall, however, the precision of several of the datasets were affected. For example, using the restricted promoter set reduced the precision of our (Pahl) V2G approach and inflated the precision of the nearest gene to SNP metric. Second, the new precision-recall analysis shows that the ABC score-based approach is only half as sensitive at predicting HIEI genes as the chromatin-based V2G approaches. This indicates that constraining GWAS data with cell type- and state-specific 3D chromatin-based data brings more GWAS target gene predictive power than application of the multi-tissue-averaged HiC used by the ABC model. We thank the reviewer for helpful suggestions that have improved the quality of our study.

      Reviewer #2 (Public Review): 

      Summary:

      There is significant interest in characterizing the mechanisms by which genetic mutations linked to autoimmunity perturb immune processes. Pahl et al. collect information on dynamic accessible regions, genes, and 3D contacts in primary CD4+ T cell samples that have been stimulated ex vivo. The study includes a variety of analyses characterizing these dynamic changes. With TF footprinting they propose factors linked to active regulatory elements. They compare the performance of their variant mapping pipeline that uses their data versus existing datasets. Most compelling there was a deep dive into additional study of regulatory elements nearby the IL2 gene. Finally, they perform a pharmacological screen targeting several genes they suggest are involved in T cell proliferation. 

      Strengths:

      The work done characterizing elements at the IL2 locus is impressive. 

      Weaknesses:

      Missing critical context to evaluate claims. There are extensive studies performed on resting and activated immune cell states (CD4+ T cells and other cell types) and some at multiple time points or concentrations of stimuli that collect ATAC-seq and/or RNA-seq that have been ignored by this study. How do conclusions from previous studies compare to what the authors conclude here? It is impossible to evaluate the claims without this additional context. These are a few studies I am familiar with (the authors should perform a more comprehensive search to be sure they're not ignoring existing observations) that would be important to compare/contrast conclusions:  o Alasoo, K. et al. Shared genetic effects on chromatin and gene expression indicate a role for enhancer priming in immune response. Nat. Genet. 50, 424-431 (2018). 

      - Calderon, D., Nguyen, M.L.T., Mezger, A. et al. Landscape of stimulation-responsive chromatin across diverse human immune cells. Nat Genet 51, 1494-1505 (2019). 

      - Gate, R.E., Cheng, C.S., Aiden, A.P. et al. Genetic determinants of co-accessible chromatin regions in activated T cells across humans. Nat Genet 50, 1140-1150 (2018).  o Glinos, D.A., Soskic, B., Williams, C. et al. Genomic profiling of T-cell activation suggests increased sensitivity of memory T cells to CD28 costimulation. Genes Immun 21, 390-408 (2020).  o Gutierrez-Arcelus, M., Baglaenko, Y., Arora, J. et al. Allele-specific expression changes dynamically during T cell activation in HLA and other autoimmune loci. Nat Genet 52, 247-253 (2020). 

      - Kim-Hellmuth, S. et al. Genetic regulatory effects modified by immune activation contribute to autoimmune disease associations. Nat. Commun. 8, 266 (2017).  o Ye, C. J. et al. Intersection of population variation and autoimmunity genetics in human T cell activation. Science 345, 1254665 (2014). 

      - As a general point, I appreciate it when each claim includes a corresponding effect size and p-value, which helps me evaluate the strength of significance of supporting evidence. 

      We greatly appreciate the referee’s expert assessment of our work and emphasis on the value of our functional follow-up studies. Our precision-recall analyses were not meant to represent an exhaustive comparison of all prior GWAS gene nomination studies, although we agree that this could (and should) be done as part of a separate study in a future manuscript. Instead, we focused on gene nomination studies that 1) analyzed resting and activated human CD4+ T cells, 2) whose experimental design was most comparable to our own studies, and 3) had raw data readily available in the appropriate formats to allow re-analysis and harmonization before comparison. This is a point we did not make sufficiently clear in the original version of the manuscript, but have clarified in the revision. 

      Based on this rationale, we agree that the studies by Gate et al. and Ye et al. should be included in our comparative precision-recall analysis, and we have done so in the revised manuscript. The Gate study reported ATAC-seq peak co-accessibility, caQTL, eQTL, and HiC data, and we now include the resulting gene nominations from these datasets in the precision-recall analysis. These datasets performed poorly with respect to nomination of HIEI genes, likely due to small sample numbers and low sequencing depth compared to the other eQTL and chromatin capture-based studies. The eQTL reported by Ye et al. nominated 15 genes for autoimmune traits, two of which were in the ‘truth’ HIEI set (IL7R and IL2RB). This resulted low predictive power but a high precision due to the low number of nominated genes compared to the other V2G datasets. As suggested by referee 1, we have also subjected our data to the ‘activity-by-contact’ (ABC) algorithm and have included this dataset in the comparison as well. Please see Figure 5 in the revised manuscript. 

      We have elected not to include data from the other studies suggested by the referee for the following reasons: The stimulation paradigm used in the Glinos study is very different from that used in other studies. Also, this study and the study by Calderon did not nominate genes. The studies by Alasoo et al. and Kim-Hellmuth et al. analyzed macrophages, which are not a comparable cell type to CD4+ T cells. The allele-specific eQTL study by Gutierrez-Arcelus et al. included relevant the cell type and activation states, but included a relatively small number of samples (24) and variants (561), and the raw data in dbGAP does not readily allow for re-analysis and harmonization with the other studies. We thank the reviewer for helpful suggestions that have improved the quality of our study.

      Reviewer #3 (Public Review): 

      Summary:

      This paper used RNAseq, ATACseq, and Hi-C to assess gene expression, chromatin accessibility, and chromatin physical associations for native CD4+ T cells as they respond to stimulation through TCR and CD28. With these data in hand, the authors identified 423 GWAS signals to their respective target genes, where most of these were not in the proximal promoter, but rather distal enhancers. The IL-2 gene was used as an example to identify new distal cisregulatory regions required for optimal IL-2 gene transcription. These distal elements interact with the proximal IL2 promoter region. When the distal enhancer contained an autoimmune SNP, it affected IL-2 gene transcription. The authors also identified genetic risk variants that were associated with genes upon activation. Some of these regulate proliferation and cytokine production, but others are novel. 

      Strengths:

      This paper provides a wealth of data related to gene expression after CD4 T cells are activated through the TCR and CD28. An important strength of this paper is that these data were intensively analyzed to uncover autoimmune disease SNPs in cis-acting regions. Many of these could be assigned to likely target genes even though they often are in distal enhancers. These findings help to provide a better understanding concerning the mechanism by which GWAS risk elements impact gene expression. 

      Another strength of this study was the proof-of-principle studies examining the IL-2 gene. Not only were new cis-acting enhancers discovered, but they were functionally shown to be important in regulating IL-2 expression, including susceptibility to colitis. Their importance was also established with respect to such distal enhancers harboring disease-relevant SNPs, which were shown to affect IL-2 transcription. 

      The data from this study were also mined against past CRISPR screens that identified genes that control aspects of CD4 T cell activation. From these comparisons, novel genes were identified that function during T cell activation. 

      Weaknesses:

      A weakness of this study is that few individuals were analyzed, i.e., RNAseq and ATACseq (n=3) and HiC (n=2). Thus, the authors may have underestimated potentially relevant risk associations by their chromatin capture-based methodology. This might account for the low overlap of their data with the eQTL-based approach or the HIEI truth set. 

      Impact:

      This study indicates that defining distal chromatin interacting regions helps to identify distal genetic elements, including relevant variants, that contribute to gene activation. 

      We greatly appreciate the referee’s expert assessment of our work and emphasis on the value of our functional follow-up studies. We have ensured that all sample sizes, effect sizes, p values and FDR statistics are included in the figures and figure legends. We agree that including more donors for the HiC studies would increase the number of implicated variants and genes, however, all the chromatin-based V2G approaches described in our manuscript use relatively small sample sizes, but implicate more variants and genes than the comparable eQTL studies. I.e., the low overlap is not driven by a paucity of GWAS-chromatin-based associations. An alternative explanation for the low overlap between GWAS-chromatin-based approaches and eQTL approaches was recently by Pritchard and colleagues, who reported that GWAS and eQTL studies systematically implicate different types of variants (Mostafavi et al., Nature Genetics 2023). Among other differences, eQTL tend to implicate nearby genes while GWAS variants implicate distant genes, and our results support this contention. We referred to this study in the original version of the manuscript, but have included a more extensive discussion of potential explanations in the revised version. We thank the reviewer for helpful suggestions that have improved the quality of our study.

    1. Author response:

      The following is the authors’ response to the original reviews.

      eLife assessment 

      This study investigates associations between retrotransposon element expression and methylation with age and inflammation, using multiple public datasets. The study is valuable because a systematic analysis of retrotransposon element expression during human aging has been lacking. However, the data provided are incomplete due to the sole reliance on microarray expression data for the core analysis of the paper. 

      Both reviewers found this study to be important. We have selected the microarray datasets of human blood adopted by a comprehensive study of ageing published in a Nature

      Communications manuscript (DOI: doi: 10.1038/ncomms9570). We only included the datasets specifically collected for ageing studies. Therefore, the large RNA-seq cohorts for cancer, cardiovascular, and neurological diseases were not relevant to this study and cannot be included.   

      Public Reviews: 

      Reviewer #1 (Public Review): 

      Summary: 

      Tsai and Seymen et al. investigate associations between RTE expression and methylation and age and inflammation, using multiple public datasets. The concept of the study is in principle interesting, as a systematic analysis of RTE expression during human aging is lacking. 

      We thank the reviewer for the positive comment. 

      Unfortunately, the reliance on expression microarray data, used to perform the core analysis of the paper places much of the study on shaky ground. The findings of the study would not be sufficiently supported until the authors validate them with more suitable methods. 

      In our discussion section in the manuscript, we have clarified that “we are aware of the limitations imposed by using microarray in this study, particularly the low number of intergenic probes in the expression microarray data. Our study can be enriched with the advent of large  RNA-seq cohorts for aging studies in the future.”  However, the application of microarray for RTE expression analysis was introduced previously (DOI: 10.1371/journal.pcbi.1002486) and applied in some highly cited and important publications before (DOI: 10.1038/ncomms1180, DOI: 10.1093/jnci/djr540). In fact, in a manuscript published by Reichmann et al.  (DOI: 10.1371/journal.pcbi.1002486) which was cited 76 times, the authors showed and experimentally verified that cryptic repetitive element probes present in Illumina and Affymetrix gene expression microarray platforms can accurately and sensitively monitor repetitive element expression data. Inspired by this methodological manuscript with reasonable acceptance by other researchers, we trusted that the RTE microarray probes could accurately quantify RTE expression at class and family levels.

      Strengths: 

      This is a very important biological problem. 

      Weaknesses: 

      RNA microarray probes are obviously biased to genes, and thus quantifying transposon analysis based on them seems dubious. Based on how arrays are designed there should at least be partial (perhaps outdated evidence) that the probe sites overlap a protein-coding or non-coding RNA. 

      We disagree with the reviewer that quantifying transposon analysis based on microarray data is dubious. As previously shown by Reichmann et al., the quantification is reliable as long as the probes do not overlap with annotated genes and they are in the correct orientation to detect sense repetitive element transcripts. Reichman et al. identified 1,400 repetitive element probes in version 1.0, version 1.1 and version 2.0 of the Illumina Mouse WG-6 Beadchips by comparing the genomic locations of the probes with the Repeatmasked regions of the mouse genome. We applied the same criteria for Illumina Human HT-12 V3 (29431 probes) and V4 (33963) to identify the RTE-specific probes. 

      The authors state they only used intergenic probes, but based on supplementary files, almost half of RTE probes are not intergenic but intronic (n=106 out of 264). 

      All our identified RTE probes overlap with intergenic regions. However, due to their repetitive natures, some probes overlap with intronic regions, too. We have replaced "intergenic" with "non-coding" in our resubmission to show that they do not overlap with the exons of protein-coding genes. However, we do not rule out the possibility that some of our detected RTE probes might overlap non-coding RNAs. In fact, the border between coding and non-coding genomes has recently become very fuzzy with new annotations of the genome. RTE RNAs can be easily considered as non-coding RNAs if we challenge our traditional junk DNA view. 

      This is further complicated by the fact that not all this small subset of probes is available in all analyzed datasets. For example, 232 probes were used for the MESA dataset but only 80 for the GTP dataset. Thus, RTE expression is quantified with a set of probes which is extremely likely to be highly affected by non-RTE transcripts and that is also different across the studied datasets. Differences in the subsets of probes could very well explain the large differences between datasets in multiple of the analyses performed by the authors, such as in Figure 2a, or 3a. It is nonetheless possible that the quantification of RTE expression performed by the authors is truly interpretable as RTE expression, but this must be validated with more data from RNA-seq. Above all, microarray data should not be the main type of data used in the type of analysis performed by the authors. 

      In this study, we did not compare MESA with GTP etc. We have analysed each dataset separately based on the available data for that dataset. Therefore, sacrificing one analysis because of the lack of information from the other does not make sense. We would do that if we were after comparing different datasets. Moreover, the datasets are not comparable because they were collected from different types of blood samples. 

      Reviewer #2 (Public Review): 

      Summary: 

      Yi-Ting Tsai and colleagues conducted a systematic analysis of the correlation between the expression of retrotransposable elements (RTEs) and aging, using publicly available transcriptional and methylome microarray datasets of blood cells from large human cohorts, as well as single-cell transcriptomics. Although DNA hypomethylation was associated with chronological age across all RTE biotypes, the authors did not find a correlation between the levels of RTE expression and chronological age. However, expression levels of LINEs and LTRs positively correlated with DNA demethylation, and inflammatory and senescence gene signatures, indicative of "biological age". Gene set variation analysis showed that the inflammatory response is enriched in the samples expressing high levels of LINEs and LTRs. In summary, the study demonstrates that RTE expression correlates with "biological" rather than "chronological" aging. 

      Strengths: 

      The question the authors address is both relevant and important to the fields of aging and transposon biology. 

      We thank the reviewer for finding this study relevant and important.

      Weaknesses: 

      The choice of methodology does not fully support the primary claims. Although microarrays can detect certain intergenic transposon sequences, the authors themselves acknowledge in the Discussion section that this method's resolution is limited. More critical considerations, however, should be addressed when interpreting the results. The coverage of transposon sequences by microarrays is not only very limited (232 unique probes) but also predetermined. This implies that any potential age-related overexpression of RTEs located outside of the microarray-associated regions, or of polymorphic intact transposons, may go undetected. Therefore, the authors should be more careful while generalising their conclusions. 

      This is a bioinformatics study, and we have already admitted and discussed the limitations in the discussion section of this manuscript. All technologies have their own limitations, and this should not stop us from shedding light on scientific facts because of inadequate information. In the manuscript, we have discussed that all large and proper ageing studies were performed using microarray technology. Peters et al. (DOI: doi: 10.1038/ncomms9570) adopted all these datasets in their transcriptional landscape of ageing manuscript, which was used in previous studies of ageing as well. Our study essentially applies the Reichmann et al. method to the peripheral blood-related data from the Peters et al. manuscript. Since hypomethylation due to ageing is a well-established and broad epigenetic reprogramming, it is unlikely that only a fraction of RTEs is affected by this phenomenon. Therefore, the subsampling of RTEs should not affect the result so much. Indeed, this is supported in our study by the inverse correlation between DNA methylation and RTE expression for LINE and SINE classes despite having limited numbers of probes for LINE and SINE expressions.    

      Additionally, for some analyses, the authors pool signals from RTEs by class or family, despite the fact that these groups include subfamilies and members with very different properties and harmful potentials. For example, while sequences of older subfamilies might be passively expressed through readthrough transcription, intact members of younger groups could be autonomously reactivated and cause inflammation. The aggregation of signals by the largest group may obscure the potential reactivation of smaller subgroups. I recommend grouping by subfamily or, if not possible due to the low expression scores, by subgroup. For example, all HERV subfamilies are from the ERVL family. 

      We agree with the reviewer that different subfamilies of RTEs play different roles through their activation. However, we will lose our statistical power if we study RTE subfamilies with a few probes. Global epigenetic alteration and derepression of RTEs by ageing have been observed to be genome-wide. While our systematic analysis across RTE classes and families cannot capture alterations in subfamilies due to statistical power, it is still relevant to the research question we are addressing.

      Next, Illumina arrays might not accurately represent the true abundance of TEs due to nonspecific hybridization of genomic transposons. Standard RNA preparations always contain traces of abundant genomic SINEs unless DNA elimination is specifically thorough. The problem of such noise should be addressed. 

      We have checked the RNA isolation step from MESA, GTP, and GARP manuscripts. The total RNA was isolated using the Qiagen mini kit following the manufacturer’s recommendations. The authors of these manuscripts did not mention whether they eliminated genomics DNA, but we assumed they were aware of the DNA contamination and eliminated it based on the manufacturer’s recommendations. We have looked up the literature about nonspecific hybridization of RTEs but could not find any evidence to support this observation. We would appreciate the reviewers providing more evidence about such RTE contaminations.   

      Lastly, scRNAseq was conducted using 10x Genomics technology. However, quantifying transposons in 10x sequencing datasets presents major challenges due to sparse signals. 

      Applying the scTE pipeline (https://www.nature.com/articles/s41467-021-21808-x), we have found that the statical power of quantifying RTE classes (LINE, SINE, and LTR) or  RTE families (L1, L2, All, ERVK, etc.) are as good as each individual gene. However, our proposed method cannot analyse RTE subfamilies, and we did not do that. 

      Smart-seq single-cell technology is better suited to this particular purpose. 

      We agree with the reviewer that Smart-seq provides higher yield than 10x, but there is no Smartseq data available for ageing study.  

      Anyway, it would be more convincing if the authors demonstrated TE expression across different clusters of immune cells using standard scRNAseq UMAP plots instead of boxplots. 

      Since the number of RTE reads per cell is low, showing the expression of RTEs per cell in UMAP may not be the best statistical approach to show the difference between the aged and young groups. This is why we chose to analyse with Pseudobulk and displayed differential expression using boxplot rather than UMAP for each immune cell type. 

      I recommend validating the data by RNAseq, even on small cohorts. Given that the connection between RTE overexpression and inflammation has been previously established, the authors should consider better integrating their observations into the existing knowledge. 

      Please see below. We have analysed RNA-seq data suggested by Reviewer 1 in the Recommendations for the Authors section.

      Recommendations for the authors:

      Reviewer #1 (Recommendations For The Authors): 

      I can recommend two sizeable human PMBC RNA-seq datasets that the authors could use:

      Marquez et al. 2020 (phs001934.v1.p1, controlled access) and Morandini et al. 2023 (GSE193141, public access). There are likely other suitable datasets that I am not aware of. I would also recommend using identical sets of probes to quantify RTE expression across studies. If certain datasets have too few probes and would thus limit the number of probes available across all studies it might be a good idea to exclude the dataset, especially if the analysis has been supplemented by the additional RNA-seq datasets. 

      Until recently, there was no publicly-available, non-cancerous, large cohort of RNA-seq data for ageing studies. We tried to gain access to the two RNA-seq datasets suggested by reviewer 2: Marquez et al. 2020 (phs001934.v1.p1, controlled access) and Morandini et al. 2023 (GSE193141, public access). 

      Unfortunately, Marquez et al. 2020 data is not accessible because the authors only provide the data for projects related to cardiovascular diseases. However, we did analyse Morandini et al. 2023 data, and we can confirm that no association was observed between any class and family of RTEs with chronological ageing (Author response image 1), which is the second strong piece of evidence supporting the statement in the manuscript. However, as expected, we found a positive correlation between RTE expression and IFN-I signature score (Author response image 2).

      Author response image 1.

      Linear analysis of RTE expression and chronological age.

      Author response image 2.

      Linear analysis of RTE expression and IFN gene signature expression.

      The authors use "biological age" and inflammation as interchangeable concepts, including in the title. Please correct this wording. 

      We have now added a new terminology to the manuscript called “biological age-related (BAR)”, which has been clearly addressed this distinction. We don’t think it is needed to change the title.  

      The authors find correlations between RTE expression and age-associated gene signatures but not chronological age itself. This is puzzling because, as the wording suggests, the expression of these inflammatory pathways is age-associated. If RTE expression correlates with inflammation which itself correlates with age, one might expect RTE expression to also correlate with age. Do the authors see a correlation between various inflammatory gene signatures and chronological age, in the analyzed datasets? If yes, then how would you explain that discrepancy? Moreover, in this case, I would recommend using a linear model, rather than correlation, to separate the effects of chronological age and RTE expression on inflammation (Inflammation et al ~ Age + RTE expression), or equivalent designs.

      As described above, we have now introduced the BAR terminology, which resolves this confusion. We did not find a correlation between RTE expression and chronological age. However, we did identify the correlation between BAR gene signatures and RTE expression.

      To separate the effects of chronological age and RTE expression on BAR gene signature scores, we performed a generalized linear model (GLM) analysis using BAR gene signature scores as response variables and RTE expression and chronological age as predictors (BAR gene signature scores ~ RTE expression + chronological age). Significant association was observed between BAR gene signature scores and RTE expression in the GARP cohort (Author response image 3). However, when chronological age is considered as predictor, we did not identify a correlation between chronological age and BAR gene signatures, indicating that BAR events are not corelated with chronological age (Author response image 3).  

      Author response image 3.

      Generalized linear models (GLM) analysis (BAR gene signature scores ~ RTE expression + chronological age). For each RTE family, we separately performed GLM. Age (RTE family) indicates the chronological age when used in the design formula for that specific RTE family. 

      Some of the gene sets used by the authors have considerable overlap with others and are also not particularly comprehensive. I can recommend this very comprehensive gene set: https://www.gsea-msigdb.org/gsea/msigdb/human/geneset/SAUL_SEN_MAYO.  

      We did not choose to use large gene lists such as the suggested SEN_MAYO list, as we found Singscore struggles to generate reliable scores with sufficient variance when the number of genes increase to more than twenty. Although there is some overlap between inflammation-related genes and cellular senescence genes (e.g., IL6, IL1A, IL1B), it is important to note that each gene list focuses on different aspects of biological aging and should not be dismissed as redundant.

      Minor comments: 

      Overall, several sentences in the manuscript feel somewhat unnatural. I would recommend further proofreading. I will mention some examples:  

      Thank you for your feedback. We have fixed all these issues in the new submission.  

      • One line 34, "like the retroviruses" should be "like retroviruses. There are several other places in the text where "the" is not required. 

      Fixed.

      • On line 86, "to generate the RTE expression". "the" is again not necessary and I would replace "generate" with "quantify". 

      Fixed.

      • On line 86, "we mapped the probe locations to RepeatMasker". RepeatMasker is not a genome. Do you mean you mapped the probe location to a genome annotated by RepeatMasker? The same applies to line 99.  

      Fixed. We changed the sentence to: “To quantify RTE expression, we mapped the microarray probe locations to RTE locations in RepeatMasker to extract the list of noncoding (intergenic or intronic) probes that cover the RTE regions.”

      • Figure 1 contains a typo in the aims section: "evetns" instead of "events".  

      Fixed.

      • On line 495 "filtered out" seems to imply your removed intergenic probes. I assume you mean that you specifically selected intergenic probes. 

      Fixed.

      • Figure 1 nicely summarizes your datasets. Could you add a Figure 1b panel showing how you used RNA arrays to quantify RTE expression? This should include the number of probes for each RTE family, so I suggest merging this with Figure S1.  

      We disagree with the reviewer to merge Figure 1 and Figure S1 because they are addressing two different concepts.  

      Reviewer #2 (Recommendations For The Authors): 

      In Figure 2c, it is unclear what colour scale has been used for age. 

      Thank you for the comment. We have added a legend for age in this figure.

      There are no figure legends for Supplementary Figures 1 to 5 and all figures after Supplementary Figure 8. 

      A new version with legends has been submitted.

      For different datasets used, the choice of "healthy" patients should be more clear and explicit.

      Are asymptomatic patients with autoimmune inflammatory disorders considered as "healthy"? If not only healthy patients' blood is analysed (such as PBMS from primary osteoarthrosis), how inflammatory signatures enrichment discovered in this study may be associated not just with "biological age" but with the disease itself? 

      In our analysis, we did not exclusively study "healthy" individuals, as none of our datasets were initially collected from strictly healthy populations. While the microarray datasets were not specifically collected from people with particular diseases, they were also not screened for asymptomatic conditions. To demonstrate the same pattern in healthier cohorts, we added scRNA-seq analysis of confirmed healthy individuals to our study. However, the focus of this study is not on healthy aging. Instead, it is on biological ageing that includes both healthy and non-healthy ageing.

      We included the GARP (primary osteoarthritis) dataset as it is a cohort of age-related diseases (ARD). While we cannot definitively attribute inflammatory signatures enrichment to biological aging or disease, the observation of such enrichment in a cohort of ARD is worth considering. To make this clearer, we have replaced the term “healthy” with “non-cancerous” for microarray analysis throughout the paper.

    1. Author response:

      The following is the authors’ response to the original reviews.

      Public Reviews:

      Reviewer #1 (Public Review):

      Summary:

      Ever-improving techniques allow the detailed capture of brain morphology and function to the point where individual brain anatomy becomes an important factor. This study investigated detailed sulcal morphology in the parieto-occipital junction. Using cutting-edge methods, it provides important insights into local anatomy, individual variability, and local brain function. The presented work advances the field and will stimulate future research into this important area.

      Strengths:

      Detailed, very thorough methodology. Multiple raters mapped detailed sulci in a large cohort. The identified sulcal features and their functional and behavioural relevance are then studied using various complementary methods. The results provide compelling evidence for the importance of the described sulcal features and their proposed relationship to cortical brain function.

      We thank the Reviewer for highlighting the strengths of our methods and findings.

      Weaknesses:

      A detailed description/depiction of the various sulcal patterns is missing.

      We agree that adding these details for the newly described sulci is necessary and have now done so. These details are included in the Results (Page 6):

      “Beyond characterizing the incidence of sulci, it is also common in the neuroanatomical literature to qualitatively characterize sulci on the basis of fractionation and intersection with surrounding sulci (termed “sulcal types”; for examples in other cortical expanses, see Chiavaras & Petrides, 2000; Drudik et al., 2023; Miller et al., 2021; Paus et al., 1996; Weiner et al., 2014; Willbrand, Parker, et al., 2022). All four sulci most commonly did not intersect with other sulci (see Supplementary Tables 1-4 for a summary of the sulcal types of the slocs and pAngs dorsal and ventral components). The sulcal types were also highly comparable between hemispheres (rs > .99 , ps < .001).”

      And in four new Supplementary Tables.

      A possible relationship between sulcal morphology and individual demographics might provide more insight into anatomical variability.

      We have conducted additional analyses to relate sulcal incidence to demographic features (age and gender). These results are included on Pages 5-6:

      “Given that sulcal incidence and patterning is also sometimes related to demographic features (Cachia et al., 2021; Leonard et al., 2009; Wei et al., 2017), subsequent GLMs relating the incidence and patterning of the three more variable sulci (slocs-d, pAngs-v, and pAngs-d) to demographic features (age and gender) revealed no associations for any sulcus (ps > .05).”

      The unique dataset offers an opportunity to provide insights into laterality effects that should be explored.

      We included hemisphere as a factor in all models for this exact reason. Throughout the paper, we have edited the text to ensure that these laterality effects are more apparent to readers.

      Further, we have a Supplementary Results section on hemispheric effects regarding the slocs-v, cSTS3, and lTOS:

      “Hemispheric asymmetries in morphological, architectural, and functional features with regards to the slocs-v, cSTS3, and lTOS comparison

      We observed a sulcus x metric x hemisphere interaction on the morphological and architectural features of the slocs-v (F(4.20, 289.81) = 4.16, η2 = 0.01, p = .002; the cSTS3 is discussed in the next section). Post hoc tests showed that this interaction was driven by  the slocs-v being cortically thinner in the left than the right hemisphere (p < .001; Fig. 2a).

      There was also a sulcus x network x hemisphere interaction on the functional connectivity profiles (using functional connectivity parcellations from (Kong et al., 2019)) of the slocs-v and lTOS (F(32, 2144) = 3.99, η2 = 0.06, p < .001; the cSTS3 is discussed in the next section). Post hoc tests showed that this interaction was driven by three effects: (i) the slocs-v overlapped more with the Default C subnetwork in the left than the right hemisphere (p = .013), (ii) the lTOS overlapped more with Visual A subnetwork in the right than the left hemisphere (p = .002), and (iii) the lTOS overlapped more with the Visual B subnetwork in the left than the right hemisphere (p = .002; Fig. 2b).”

      As well as the other STS rami on morphology:

      “It is also worth noting that there was a sulcus x metric x hemisphere interaction (F(4, 284.12) = 6.60, η2 = 0.08, p < .001). Post hoc tests showed that: (i) the cSTS3 was smaller (p < .001) and thinner (p = .025) in the left than the right hemisphere (Supplementary Fig. 8a), (ii) the cSTS2 was shallower (p = .004) and thicker (p < .001) in the right than left hemisphere (Supplementary Fig. 8a), and (iii) the cSTS1 was shallower (p < .001), smaller (p = .002), thinner (p = .001), and less myelinated (p < .001) in the left than the right hemisphere (Supplementary Fig. 8a).”

      And functional connectivity of the STS rami:

      “There was also a sulcus x network x hemisphere interaction (F(32, 2208) = 12.26, η2 = 0.15, p < .001). Post hoc tests showed differences for each cSTS component. Here, the cSTS1 overlapped more with the Auditory network (p < .001), less with the Control B subnetwork (p < .001), more with the Control C subnetwork (p < .001), less with the Default B subnetwork (p < .001), more with the Default C subnetwork (p < .001), more with the Ventral Attention B subnetwork (p < .001), and more with the Visual A subnetwork (p = .024) in the right than in the left hemisphere (Supplementary Fig. 8b). In addition, the cSTS2 overlapped more with the Control B subnetwork (p < .001), more with the Control C subnetwork (p < .001), less with the Default B subnetwork (p < .001), and less with the Temporal-Parietal network (p = .011) in the right than in the left hemisphere (Supplementary Fig. 8b). Finally, the cSTS3 overlapped more with the Control B subnetwork (p = .002), less with the Default B subnetwork (p = .014), more with the Default C subnetwork (p = .022), less with the Ventral Attention B subnetwork (p = .029) in the right than in the left hemisphere (Supplementary Fig. 8b).”

      Reviewer #2 (Public Review):

      Summary: After manually labeling 144 human adult hemispheres in the lateral parieto-occipital junction (LPOJ), the authors 1) propose a nomenclature for 4 previously unnamed highly variable sulci located between the temporal and parietal or occipital lobes, 2) focus on one of these newly named sulci, namely the ventral supralateral occipital sulcus (slocs-v) and compare it to neighboring sulci to demonstrate its specificity (in terms of depth, surface area, gray matter thickness, myelination, and connectivity), 3) relate the morphology of a subgroup of sulci from the region including the slocs-v to the performance in a spatial orientation task, demonstrating behavioral and morphological specificity. In addition to these results, the authors propose an extended reflection on the relationship between these newly named landmarks and previous anatomical studies, a reflection about the slocs-v related to functional and cytoarchitectonic parcellations as well as anatomic connectivity and an insight about potential anatomical mechanisms relating sulcation and behavior.

      Strengths:

      - To my knowledge, this is the first study addressing the variable tertiary sulci located between the superior temporal sulcus (STS) and intraparietal sulcus (IPS).

      - This is a very comprehensive study addressing altogether anatomical, architectural, functional and cognitive aspects.

      - The definition of highly variable yet highly reproducible sulci such as the slocs-v feeds the community with new anatomo-functional landmarks (which is emphasized by the provision of a probability map in supp. mat., which in my opinion should be proposed in the main body).

      - The comparison of different features between the slocs-v and similar sulci is useful to demonstrate their difference.

      - The detailed comparison of the present study with state of the art contextualizes and strengthens the novel findings.

      - The functional study complements the anatomical description and points towards cognitive specificity related to a subset of sulci from the LPOJ

      - The discussion offers a proposition of theoretical interpretation of the findings

      - The data and code are mostly available online (raw data made available upon request).

      We thank the Reviewer for highlighting the strengths of our methods, analyses, and applications of our findings.

      Weaknesses:

      - While three independent raters labeled all hemispheres, one single expert finalized the decision. Because no information is reported on the inter-rater variability, this somehow equates to a single expert labeling the whole cohort, which could result in biased labellings and therefore affect the reproducibility of the new labels.

      Our group does not use an approach amenable to calculating inter-rater agreements to expedite the process of defining thousands of sulci at the individual level in multiple regions. Our method consists of a two-tiered procedure. Here, authors YT and TG defined sulci which were then checked by a trained expert (EHW). These were then checked again by senior author  (KSW) . We emphasize that this process has produced reproducible anatomical results in other regions such as posteromedial cortex (Willbrand et al., 2023 Science Advances; Willbrand et al., 2023 Communications Biology; Maboudian et al., 2024 The Journal of Neuroscience), ventral temporal cortex (Weiner et al., 2014 NeuroImage; Miller et al., 2020 Scientific Reports; Parker et al., 2023 Brain Structure and Function), and lateral prefrontal cortex (Miller et al., 2021 The Journal of Neuroscience; Voorhies et al., 2021 Nature Communications; Yao et al., 2022 Cerebral Cortex; Willbrand et al., 2022 Brain Structure and Function; Willbrand et al., 2023 The Journal of Neuroscience) across age groups, species, and clinical populations. Further, in the Supplemental Materials we provide post mortem images showing that these sulci exist outside of cortical reconstructions, supporting this updated sulcal schematic of the lateral parieto-occipital junction. For the present study, by the time the final tier of our method was reached, we emphasize that a very small percentage (~2%) of sulcal definitions were actually modified. We will include an exact percentage in future publications in LPC/LOPJ.

      - 3 out of the 4 newly labeled sulci are only described in the very first part and never reused. This should be emphasized as it is far from obvious at first glance of the article.

      We have edited the Abstract (shown below, on Page 1) and paper throughout to emphasize the emphasis on the slocs-v over the other three sulci.

      “After defining thousands of sulci in a young adult cohort, we revised the previous LPC/LPOJ sulcal landscape to include four previously overlooked, small, shallow, and variable sulci. One of these sulci (ventral supralateral occipital sulcus, slocs-v) is present in nearly every hemisphere and is morphologically, architecturally, and functionally dissociable from neighboring sulci. A data-driven, model-based approach, relating sulcal depth to behavior further revealed that the morphology of only a subset of LPC/LPOJ sulci, including the slocs-v, is related to performance on a spatial orientation task.”

      It is worth noting that we have added additional analyses that include the other three newly-characterized sulci in response to Reviewer 1. We first described the relationship between these sulci and demographic features, alongside analyses on the patterning of these sulci, which are included in the Results (Page 6):

      “Beyond characterizing the incidence of sulci, it is also common in the neuroanatomical literature to qualitatively characterize sulci on the basis of fractionation and intersection with surrounding sulci (termed “sulcal types”; for examples in other cortical expanses, see Chiavaras & Petrides, 2000; Drudik et al., 2023; Miller et al., 2021; Paus et al., 1996; Weiner et al., 2014; Willbrand, Parker, et al., 2022). All four sulci most commonly did not intersect with other sulci (see Supplementary Tables 1-4 for a summary of the sulcal types of the slocs and pAngs dorsal and ventral components). The sulcal types were also highly comparable between hemispheres (rs > .99 , ps < .001). Though we characterize these sulci in this paper for the first time, the location of these four sulci is consistent with the presence of variable “accessory sulci” in this cortical expanse mentioned in prior modern and classic studies (Supplementary Methods). We could also identify these sulci in post-mortem hemispheres (Supplementary Figs. 2, 3), ensuring that these sulci were not an artifact of the cortical reconstruction process.

      Given that sulcal incidence and patterning is also sometimes related to demographic features (Cachia et al., 2021; Leonard et al., 2009; Wei et al., 2017), subsequent GLMs relating the incidence and patterning of the three more variable sulci (slocs-d, pAngs-v, and pAngs-d) to demographic features (age and gender) revealed no associations for any sulcus (ps > .05).  Finally, to help guide future research on these newly- and previously-classified LPC/LPOJ sulci, we generated probabilistic maps of each of these 17 sulci and share them with the field with the publication of this paper (Supplementary Fig. 6; Data availability).”

      - The tone of the article suggests a discovery of these 4 sulci when some of them have already been reported (as rightfully highlighted in the article), though not named nor studied specifically. This is slightly misleading as I interpret the first part of the article as a proposition of nomenclature rather than a discovery of sulci.

      We have toned down our language throughout the paper, emphasizing that this paper is updating the sulcal landscape of LPC/LOPJ taking into account these sulci that have not been comprehensively described previously. For example, in the Abstract (Page 1), we now write:

      “After defining thousands of sulci in a young adult cohort, we revised the previous LPC/LPOJ sulcal landscape to include four previously overlooked, small, shallow, and variable sulci. One of these sulci (ventral supralateral occipital sulcus, slocs-v) is present in nearly every hemisphere and is morphologically, architecturally, and functionally dissociable from neighboring sulci. A data-driven, model-based approach, relating sulcal depth to behavior further revealed that the morphology of only a subset of LPC/LPOJ sulci, including the slocs-v, is related to performance on a spatial orientation task. “

      - The article never mentions the concept of merging of sulcal elements and the potential effect it could have on the labeling of the newly named variable sulci.

      We emphasize that we use multiple surfaces (pial, inflated, smoothwm) to help distinguish intersecting sulci from one another. We include extra text in the Methods (Page 21):

      “We defined LPC/LPOJ sulci for each participant based on the most recent schematics of sulcal patterning by Petrides (2019) as well as pial, inflated, and smoothed white matter (smoothwm) FreeSurfer cortical surface reconstructions of each individual. In some cases, the precise start or end point of a sulcus can be difficult to determine on a surface (Borne et al., 2020); however, examining consensus across multiple surfaces allowed us to clearly determine each sulcal boundary in each individual. “

      Further, upon quantifying the patterning of these variable sulci, a majority of the time they are independent (described in the Results on Page 6):

      “Beyond characterizing the incidence of sulci, it is also common in the neuroanatomical literature to qualitatively characterize sulci on the basis of fractionation and intersection with surrounding sulci (termed “sulcal types”; for examples in other cortical expanses, see (Chiavaras & Petrides, 2000; Drudik et al., 2023; Miller et al., 2021; Paus et al., 1996; Weiner et al., 2014; Willbrand, Parker, et al., 2022). All four sulci most commonly did not intersect with other sulci (see Supplementary Tables 1-4 for a summary of the sulcal types of the slocs and pAngs dorsal and ventral components). The sulcal types were also highly comparable between hemispheres (rs > .99 , ps < .001).”

      Thus, merging sulcal elements likely had a minimal impact on the present definitions.

      - The definition of the new sulci is solely based on their localization relative to other sulci which are themselves variable (e.g. the 3rd branch of the STS can show different locations and different orientation, potentially affecting the definition of the slocs-v). This is not addressed in the discussion.

      As displayed in our probabilistic maps of these sulci (Supplementary Fig. 6), the cSTS components (2-4) are actually relatively consistent between individuals, and thus, future investigators can utilize these maps to help define these sulci in new hemispheres.

      Nevertheless, there is, of course, individual variability in the location of these sulci, and we do agree that this point brought up by the Reviewer is important. We have now added text to the Limitations section of the Discussion (Pages 15-16):

      “The main limitation of our study is that presently, the most accurate methodology to define sulci —especially the small, shallow, and variable PTS—requires researchers to manually trace each structure on the cortical surface reconstructions. This method is limited due to the individual variability of cortical sulcal patterning (Fig. 1, Supplementary Fig. 5), which makes it challenging to identify sulci, let alone PTS, without extensive experience and practice. However, we anticipate that our probabilistic maps  will provide a starting point and hopefully, expedite the identification of these sulci in new participants. This method is also arduous and time-consuming—which, on the one hand, limits the sample size in terms of number of participants, while on the other, results in thousands of precisely defined sulci. This push-pull  relationship reflects a broader conversation in the human brain mapping and cognitive neuroscience fields between a balance of large N studies and “precision imaging” studies in individual participants (Allen et al., 2022; Gratton et al., 2022; Naselaris et al., 2021; Rosenberg and Finn, 2022).”

      - The new sulci are only defined in terms of localization relative to other sulci, and no other property is described (general length, depth, orientation, shape...), making it hard for a new observer to take labeling decisions in case of conflict.

      To help guide future investigators, we now show these metrics for all sulci in Supplemental Figure 7 to help future groups identify these sulci with the assistance of their general morphology.

      - The very assertive tone of the article conveys the idea that these sulci are identifiable certainly in most cases, when by definition these highly variable tertiary sulci are sometimes very difficult to take decisions on.

      The highly variable nature of ¾ of the putative tertiary sulci (slocs-v, slocs-d, pAngs-v, pAngs-d) described here is why we focused on the slocs-v (as it is identifiable in nearly all f hemispheres). However, we have edited our language throughout the text to also emphasize the variability of these sulci. For example, in the Results (Page 5), we now write:

      “In previous research in small sample sizes, neuroanatomists noticed shallow sulci in this cortical expanse (Supplementary Methods and Supplementary Figs. 1-4 for historical details). In the present study, we fully update this sulcal landscape considering these overlooked indentations. In addition to defining the 13 sulci previously described within the LPC/LPOJ, as well as the posterior superior temporal cortex (Methods) (Petrides, 2019) in individual participants, we could also identify as many as four small and shallow PTS situated within the LPC/LPOJ that were highly variable across individuals and uncharted until now (Supplementary Methods and Supplementary Figs. 1-4). Macroanatomically, we could identify two sulci between the cSTS3 and the IPS-PO/lTOS ventrally and two sulci between the cSTS2 and the pips/IPS dorsally. We focus our analyses on the slocs-v since it was identifiable in nearly every hemisphere.”

      - I am not absolutely convinced with the labeling proposed of a previously reported sulcus, namely the posterior intermediate parietal sulcus.

      In defining previously-identified LPC sulci, we followed the previous labeling procedure by Petrides (2019) alongside historical definitions (detailed in Supplementary Figures 1-4). Nevertheless, future deep learning algorithms using these and others data can be used to rectify discrepancies in labeling (e.g., Borne et al., 2020 Medical Image Analysis; Lyu et al., 2021 NeuroImage). We discuss these points in the Limitations section of the Discussion (Pages 16-17):

      “The main limitation of our study is that presently, the most accurate methodology to define sulci —especially the small, shallow, and variable PTS—requires researchers to manually trace each structure on the cortical surface reconstructions. This method is limited due to the individual variability of cortical sulcal patterning (Fig. 1, Supplementary Fig. 5), which makes it challenging to identify sulci without extensive experience and practice. However, we anticipate that our probabilistic maps  will provide a starting point and hopefully, expedite the identification of these sulci in new participants. This should accelerate the process of subsequent studies confirming the accuracy of our updated schematic of LPC/LOPJ. This manual method is also arduous and time-consuming, which, on the one hand, limits the sample size in terms of number of participants, while on the other, results in thousands of precisely defined sulci. This push-pull relationship reflects a broader conversation in the human brain mapping and cognitive neuroscience fields between a balance of large N studies and “precision imaging” studies in individual participants (Allen et al., 2022; Gratton et al., 2022; Naselaris et al., 2021; Rosenberg & Finn, 2022). Though our sample size is comparable to other studies that produced reliable results relating sulcal morphology to brain function and cognition (e.g., (Cachia et al., 2021; Garrison et al., 2015; Lopez-Persem et al., 2019; Miller et al., 2021; Roell et al., 2021; Voorhies et al., 2021; Weiner, 2019; Willbrand, Parker, et al., 2022; Willbrand, Voorhies, et al., 2022; Yao et al., 2022), ongoing work that uses deep learning algorithms to automatically define sulci should result in much larger sample sizes in future studies (Borne et al., 2020; Lyu et al., 2021). Finally, the time-consuming manual definitions of primary, secondary, and PTS also limit the cortical expanse explored in each study, thus, restricting the present study to LPC/LPOJ. “

      Assuming that the labelling of all sulci reported in the article is reproducible, the different results are convincing and in general, this study achieves its aims in defining more precisely the sulcation of the LPOJ and looking into its functional/cognitive value. This work clearly offers a finer understanding of sulcal pattern in this region, and lacks only little for the new markers to be convincingly demonstrated. An overall coherence of the labelling can still be inferred from the supplementary material which support the results and therefore the conclusions, yet, addressing some of the weaknesses listed above would greatly enhance the impact of this work. This work is important to the understanding of sulcal variability and its implications on functional and cognitive aspects.

      We thank the Reviewer for their positive remarks on the implications of this work.

      Reviewer #3 (Public Review):

      Summary: 72 subjects, and 144 hemispheres, from the Human Connectome Project had their parietal sulci manually traced. This identified the presence of previously undescribed shallow sulci. One of these sulci, the ventral supralateral occipital sulcus (slocs-v), was then demonstrated to have functional specificity in spatial orientation. The discussion furthermore provides an eloquent overview of our understanding of the anatomy of the parietal cortex, situating their new work into the broader field. Finally, this paper stimulates further debate about the relative value of detailed manual anatomy, inherently limited in participant numbers and areas of the brain covered, against fully automated processing that can cover thousands of participants but easily misses the kinds of anatomical details described here.

      Strengths:

      - This is the first paper describing the tertiary sulci of the parietal cortex with this level of detail, identifying novel shallow sulci and mapping them to behaviour and function.

      - It is a very elegantly written paper, situating the current work into the broader field.

      - The combination of detailed anatomy and function and behaviour is superb.

      We thank the Reviewer for their positive remarks on paper and our findings.

      Weaknesses:

      - The numbers of subjects are inherently limited both in number as well as in typically developing young adults.

      We emphasize that the sample size is limited due to the arduous nature of manually defining sulci; however, we provide probabilistic maps with the publication of this work to help expedite this process for future investigators. Further, with improved deep learning algorithms, the sample sizes in future neuroanatomical studies should be enhanced. We discuss these points in the Limitations section of the Discussion (Pages 16-17):

      “The main limitation of our study is that presently, the most accurate methodology to define sulci —especially the small, shallow, and variable PTS—requires researchers to manually trace each structure on the cortical surface reconstructions. This method is limited due to the individual variability of cortical sulcal patterning (Fig. 1, Supplementary Fig. 5), which makes it challenging to identify sulci without extensive experience and practice. However, we anticipate that our probabilistic maps  will provide a starting point and hopefully, expedite the identification of these sulci in new participants. This should accelerate the process of subsequent studies confirming the accuracy of our updated schematic of LPC/LOPJ. This manual method is also arduous and time-consuming, which, on the one hand, limits the sample size in terms of number of participants, while on the other, results in thousands of precisely defined sulci. This push-pull relationship reflects a broader conversation in the human brain mapping and cognitive neuroscience fields between a balance of large N studies and “precision imaging” studies in individual participants (Allen et al., 2022; Gratton et al., 2022; Naselaris et al., 2021; Rosenberg & Finn, 2022). Though our sample size is comparable to other studies that produced reliable results relating sulcal morphology to brain function and cognition (e.g., (Cachia et al., 2021; Garrison et al., 2015; Lopez-Persem et al., 2019; Miller et al., 2021; Roell et al., 2021; Voorhies et al., 2021; Weiner, 2019; Willbrand, Parker, et al., 2022; Willbrand, Voorhies, et al., 2022; Yao et al., 2022), ongoing work that uses deep learning algorithms to automatically define sulci should result in much larger sample sizes in future studies (Borne et al., 2020; Lyu et al., 2021). The time-consuming manual definitions of primary, secondary, and PTS also limit the cortical expanse explored in each study, thus restricting the present study to LPC/LPOJ.”

      - While the paper begins by describing four new sulci, only one is explored further in greater detail.

      Due to the increased variability of three of the four newly-classified sulci, we chose to only focus on the slocs-v given that it was present in nearly all hemispheres. In response to other reviewers, we have conducted additional analyses that also describe these new sulci and potential factors related to their incidence (Page 6):

      “Given that sulcal incidence and patterning is also sometimes related to demographic features (Cachia et al., 2021; Leonard et al., 2009; Wei et al., 2017), subsequent GLMs relating the incidence and patterning of the three more variable sulci (slocs-d, pAngs-v, and pAngs-d) to demographic features (age and gender) revealed no associations for any sulcus (ps > .05).”

      In addition, given that sulcal variability is cognitively (e.g., Amiez et al., 2018 Scientific Reports; Cachia et al., 2021 Frontiers in Neuroanatomy; Garrison et al., 2015 Nature Communications; Willbrand et al., 2022, 2023 Brain Structure & Function), anatomically (e.g., Amiez et al., 2021 Communications Biology; Vogt et al., 1995 Journal of Comparative Neurology), functionally (e.g., Lopez Persem et al., 2019 The Journal of Neuroscience), and translationally (e.g., Yucel et al., 2002 Biological Psychiatry) relevant, future research can investigate these relationships regarding the slocs-d and pAngs components. We have added text to the Limitations section of the Discussion (Pages 17-18) to discuss this:

      “Finally, although we did not focus on the relationship between the other three PTS (slocs-d, pAngs-v, and pAngs-d) to anatomical and functional features of LPC and cognition, given that variability in sulcal incidence is cognitively (Amiez et al., 2018; Cachia et al., 2021; Garrison et al., 2015; Willbrand, Jackson, et al., 2023; Willbrand, Voorhies, et al., 2022), anatomically (Amiez et al., 2021; Vogt et al., 1995), functionally (Lopez-Persem et al., 2019), and translationally (Clark et al., 2010; Le Provost et al., 2003; Meredith et al., 2012; Nakamura et al., 2020; Yücel et al., 2002, 2003) relevant, future work can also examine the relationship between the more variable slocs-d, pAngs-v, and pAngs-d and these features.”

      - There is some tension between calling the discovered sulci new vs acknowledging they have already been reported, but not named.

      We have edited the manuscript throughout to emphasize our primary focus on revising the LPC/LOPJ sulcal landscape to include these often overlooked small, shallow, and variable putative tertiary sulci, rather than using the terms “discovered sulci” and “new.”

      - The anatomy of the sulci, as opposed to their relation to other sulci, could be described in greater detail.

      Beyond the radar plots in the main text which compare specific groupings of sulci, we now show the morphological metrics for all sulci investigated in the present work in Supplemental Figure 7.

      Overall, to summarize, I greatly enjoyed this paper and believe it to be a highly valued contribution to the field.

      We are glad the Reviewer enjoyed reading our paper and thank them for their positive thoughts on the potential impact of this work on the field.

      Recommendations for the authors:

      Reviewer #1 (Recommendations For The Authors):

      (1) The slocs-v is found in 71 subjects left and right. Is that the same subject?

      No, these are different subjects.

      (2) How were the 72 subjects chosen?

      The subjects were randomly selected from the HCP database as describe in the methods (Page 18):

      “Here, we used 72 randomly-selected participants, balanced for gender (following the terminology of the HCP data dictionary), from the HCP database (50% female, 22-36 years old, and 90% right-handed; there was no effect of handedness on our behavioral tasks; Supplementary materials) that were also analyzed in several prior studies (Hathaway et al., 2023; Miller et al., 2021, 2020; Willbrand et al., 2023b, 2023c, 2022a).”

      (3) Are there effects of laterality on sulcal pattern? Table?

      We now include sulcal pattern results in the Results section and Supplementary Materials; although there were no laterality effects regarding the sulcal pattern .

      (4) Depiction/description of common sulcal patterns

      We now include sulcal pattern results in the Results section and Supplementary Materials.

      (5) Is there a relationship between sulcal patterns and demographic features?

      We now include analyses on this in the Results section. There is no relationship between sulcal patterns and demographic features.

      (6) Just for clarity, the sulcal features are studied and extracted in native space?

      Yes, sulcal features are studied and extracted in native space, as described in the Methods section (Page 19):

      “Anatomical T1-weighted (T1-w) MRI scans (0.8 mm voxel resolution) were obtained in native space from the HCP database. Reconstructions of the cortical surfaces of each participant were generated using FreeSurfer (v6.0.0), a software package used for processing and analyzing human brain MRI images (surfer.nmr.mgh.harvard.edu) (Dale et al., 1999; Fischl et al., 1999). All subsequent sulcal labeling and extraction of anatomical metrics were calculated from these native space reconstructions generated through the HCP’s version of the FreeSurfer pipeline (Glasser et al., 2013).”

      (7) The authors use "Gender". Are they referring to biological sex (female/male) or socially defined characteristics (man/woman etc.)?

      The term gender is referred to socially defined characteristics, as used by the HCP data dictionary (Methods page 18):

      “Here, we used 72 randomly-selected participants, balanced for gender (following the terminology of the HCP data dictionary), from the HCP database (50% female, 22-36 years old, and 90% right-handed; there was no effect of handedness on our behavioral tasks; Supplementary materials) that were also analyzed in several prior studies (Hathaway et al., 2023; Miller et al., 2021, 2020; Willbrand et al., 2023b, 2023c, 2022a).”

      (8) Fig 2. Grey is poorly visible compared to green and blue.

      The shade of gray has been edited to be more distinguishable.

      (9) The relationship between behavior and sulcal features is significant but weak.

      We acknowledge that the morphological-behavioral relationship identified in the present study explains a modest amount of variance; however, the more important aspect of the finding is that multiple sulci identified in the model are recently-characterized sulci in LPC/LOPJ identified by our group and others (Petrides, 2019), and thus, the relationship would have been overlooked or lost if these sulci were not identified. We have added text to the Limitations section of the Discussion (Pages 17-18) to emphasize this point:

      “It is also worth noting that the morphological-behavioral relationship identified in the present study explains a modest  amount of variance; however, the more important aspect of our findings is that multiple sulci identified in our model-based approach are recently-characterized sulci in LPC/LOPJ identified by our group and others (Petrides, 2019), and thus, the relationship would have been overlooked or lost if these sulci were not identified. “

      (10) The Limitation section could be expanded.

      We have added additional text to flesh out the Limitations section of the Discussion (Pages 17-18):

      “It is also worth noting that the morphological-behavioral relationship identified in the present study explains a modest  amount of variance; however, the more important aspect of our findings is that multiple sulci identified in our model-based approach are recently-characterized sulci in LPC/LOPJ identified by our group and others (Petrides, 2019), and thus, the relationship would have been overlooked or lost if these sulci were not identified. Finally, although we did not focus on the relationship between the other three PTS (slocs-d, pAngs-v, and pAngs-d) to anatomical and functional features of LPC and cognition, given that variability in sulcal incidence is cognitively (Amiez et al., 2018; Cachia et al., 2021; Garrison et al., 2015; Willbrand, Jackson, et al., 2023; Willbrand, Voorhies, et al., 2022), anatomically (Amiez et al., 2021; Vogt et al., 1995), functionally (Lopez-Persem et al., 2019), and translationally (Clark et al., 2010; Le Provost et al., 2003; Meredith et al., 2012; Nakamura et al., 2020; Yücel et al., 2002, 2003) relevant, future work can also examine the relationship between the more variable slocs-d, pAngs-v, and pAngs-d and these features. “

      Reviewer #2 (Recommendations For The Authors):

      First, I would like to thank the authors for their important contribution to the field of sulcal studies and anatomo-functional correlates. My main comments about the work are treated in the public review, and I will only address details in this section. I have detected a number of typos which are harder to report from a document in which lines are not numbered. Could you please submit a numbered document for the next iteration?

      - p2. "hominoid-specific, shallow indentations, or sulci" - can lead to misunderstanding that sulci are hominoid-specific and shallow

      Sentence has been rewritten:

      “Of all the neuroanatomical features to target, recent work shows that morphological features of the shallower, later developing, hominoid-specific indentations of the cerebral cortex (also known as putative tertiary sulci, PTS) are not only functionally and cognitively meaningful, but also are particularly impacted by multiple brain-related disorders and aging (Amiez et al., 2019, 2018; Ammons et al., 2021; Cachia et al., 2021; Fornito et al., 2004; Garrison et al., 2015; Harper et al., 2022; Hathaway et al., 2023; Lopez-Persem et al., 2019; Miller et al., 2021, 2020; Nakamura et al., 2020; Parker et al., 2023; Voorhies et al., 2021; Weiner, 2019; Willbrand et al., 2023b, 2023c, 2022a, 2022b; Yao et al., 2022).”

      - p2. next sentence (starting with "The combination [...]": not clear that you are addressing tertiary sulci here, maybe introduce the concept beforehand?

      The previous sentence (just above) has been edited to introduce putative tertiary sulci beforehand.

      - p5. error in numbering of sulci relative to Fig1. (5,6,7,8 -> 6,7,8,9)

      Sulcal numbering has been fixed.

      -p5. reference to supp mat -> I would have expected the nomenclature used in Borne et al. 2020 to be discussed alongside with the state of the art. How would you relate F.I.P.r.int.1 and F.I.P.r.int.2 to the sulci you describe?

      We thank the Reviewer for bringing up this relevant literature. The F.I.P.r.int. 1 and 2 are described as rami of the IPS, whereas the slocs and pAngs are independent, small indentations near the IPS, but not part of the complex. Nevertheless, future work should integrate these two schematics together to establish the most comprehensive sulcal map of LPC/LOPJ. We have added text to the Supplementary Methods detailing the differences between the F.I.P.r.int.1 and F.I.P.r.int.2 and slocs-/pAngs:

      “slocs/pAng vs. F.I.P.r.int.1 and F.I.P.r.int.2

      Recent work (Borne et al., 2020; Perrot et al., 2011) identified two intermediate rami of the IPS (F.I.P.r.int.1 and F.I.P.r.int.2) that were not defined in the present investigation. Crucially, the newly classified sulci here (slocs and pAngs) are distinguishable from the two F.I.P.r.int. in that the F.I.P.r.int. are branches coming off the main body of the IPS (Borne et al., 2020; Perrot et al., 2011), whereas the slocs/pAngs are predominantly non-intersecting (“free”) structures that never intersected with the IPS (Supplementary Tables 1-4).”

      - p6. Fig 1.a. labelling discrepancy between line 1 and 2, column 4: the labels 10 and 11 from the inflated hemisphere do not match the labels 10 and 11 in the pial surface. Fig 1.b. swapped label 2 and 3 in the 4th hemisphere

      These aspects of Figure 1 have been edited accordingly.

      - p7. "(iii) the slocs-v was thicker than both the cSTS3 and lTOS" -> the slocs-v showed thicker gray matter?

      The sentence has been adjusted (Page 7):

      “(iii) the slocs-v showed thicker gray matter than both the cSTS3 and lTOS (ps < .001), “

      - p9. Six left hemisphere LPC/LPOJ sulci were related to spatial orientation task performance -> missing

      Fixed (Page 9):

      “Six left hemisphere LPC/LPOJ sulci were related to spatial orientation task performance (Fig. 3a, b). “

      - p14. "Steel and colleagues" -> missing space

      Fixed (Page 14):

      “Furthermore, the slocs-v appears to lie at the junction of scene-perception and place-memory activity (a transition that also consistently co-localizes with the HCP-MMP area PGp) as identified by Steel and colleagues (2021).”

      - p20. Probability maps "we share these maps with the field" -> specify link to data availability

      The link to data availability has been added (Page 21):

      “To aid future studies interested in investigating LPC/LPOJ sulci, we share these maps with the field (Data availability). “

      Reviewer #3 (Recommendations For The Authors):

      No detailed recommendations not already present in the rest of the review.

    1. Author response:

      The following is the authors’ response to the original reviews.

      Public Reviews:

      Reviewer #1 (Public Review):

      Summary: 

      In this paper, Kalidindi and Crevecoeur ask why sequential movements are sometimes coarticulated. To answer this question, first, they modified a standard optimal controller to perform consecutive reaches to two targets (T1 and T2). They investigated the optimal solution with and without a constraint on the endpoint's velocity in the via target (T1). They observed that the controller coarticulates the movements only when there is no constraint on the speed at the via-point. They characterized coarticulation in two ways: First, T2 affected the curvature of the first reach in unperturbed reaches. Second, T2 affected corrective movements in response to a mechanical perturbation of the first reach. 

      Parallel to the modeling work, they ran the same experiment on human participants. The participants were instructed to either consider T1 as via point (go task) or to slow down in T1 and then continue to T2 (stop task). Mirroring the simulation results, they observed coarticulation only in the go task. Interestingly, in the go task, when the initial reach was occasionally perturbed, the long-latency feedback responses differed for different T2 targets, suggesting that the information about the final target was already present in the motor circuits that mediate the long-latency response. In summary, they conclude that coarticulation in sequential tasks depends on instruction, and when coarticulation happens, the corrections in earlier segments of movement reflect the entirety of the coarticulated sequence.

      Evaluation 

      Among many strengths of this paper, most notably, the results and the experiment design are grounded in, and guided by the optimal control simulation. The methods and procedures are appropriate and standard. The results and methods are explained sufficiently and the paper is written clearly. The results on modulation of long-latency response based on future goals are interesting and of broad interest for future experiments on motor control in sequential movement. However, I find the authors' framing of these results, mostly in the introduction section, somewhat complicated.

      The current version of the introduction motivates the study by suggesting that "coarticulation and separation of sub-movement [in sequential movements] have been formulated as distinct hypotheses" and this apparent distinction, which led to contradictory results, can be resolved by Optimal Feedback Control (OFC) framework in which task-optimized control gains control coarticulation. This framing seems complicated for two main reasons. First, the authors use chunking and coarticulation interchangeably. However, as originally proposed by (Miller 1956), the chunking of the sequence items may fully occur at an abstract level like working memory, with no motoric coarticulation of sequence elements at the level of motor execution. In this scenario, sequence production will be faster due to the proactive preparation of sequence elements. This simple dissociation between chunking and coarticulation may already explain the apparent contradiction between the previous works mentioned in the introduction section. Second, the authors propose the OFC as a novel approach for studying neural correlates of sequence production. While I agree that OFC simulations can be highly insightful as a normative model for understanding the importance of sequence elements, it is unclear to me how OFCs can generate new hypotheses regarding the neural implementation of sequential movements. For instance, if the control gains are summarizing the instruction of the task and the relevance of future targets, it is unclear in which brain areas, or how these control gains are implemented. I believe the manuscript will benefit from making points more clear in the introduction and the discussion sections. 

      We agree that chunking may occur at different levels that do not necessarily involve motor coarticulation. We clarified that our contribution is towards answering why sequence movements sometimes coarticulate, and how the way sequences are executed influences the representation of future goals in the sensorimotor system.

      To address this point, we made the following modifications in the introduction:

      Line 44:

      “It remains unclear how future goals are integrated in the sensorimotor system. For rapid execution of a sequence, one possible solution is to represent multiple goals within low-level control circuits (3, 16), enabling the execution of several elements as a single entity, called “motor chunk”. Note that chunking can also occur at a higher level such as in working memory-guided sequences, which in this case may or may not involve the production of a movement (17, 18).”

      Lines 50:

      “Recent neural recordings in the primary motor cortex (M1) have shown no specific influence of future goals on the population responses governing ongoing action (19, 20). Specifically, Zimnik and Churchland (20) observed in a two-reach sequence task that, there was no coarticulation in sub-movement kinematics although the execution got faster with practice. Notably, M1 displayed separate phases of execution related activity for each sub-movement. Using a neural network model, they interpreted that sequence goals could be separated and serially specified to the controller from regions upstream of M1 (Figure 1A). These findings contrast with earlier studies showing coarticulation of sub-movements and whole sequence representations in M1 (21–23). As a result, it has been suggested that coarticulation and separation in rapid sequences may involve distinct computations: coarticulation possibly involves replacing sub-movements with a motor chunk, while separation possibly indicates independent control of each sub-movement with chunking at a higher-level (4, 20).  Thus, there are unresolved questions regarding why sequential movements sometimes coarticulate, and how the representation of future goals in the sensorimotor system influences the way sequences are executed.”

      With respect to the second part of your concern about OFC, we agree that this framework does not make direct prediction about the neural implementation and our statements required clarifications. The first link between the model and prediction about neural data follows from the observation that long-latency circuits participate in task-dependent sequence production, thus indicating that transcortical pathways must express this task dependency. The second link between our work and neural activities is by providing a counter argument to previous interpretation: indeed, Zimnik and Churchland argued that independent or “holistic” sequence production should be associated with different representations in monkey’s brain. In contrast we suggest that the same controller can flexibly generate both kinds of sequences, without implying a different structure in the controller, only a different cost-function. We thus refine the expectation about neural correlates of sequence representations by showing that it potentially relates to the encoding of task constraints.

      To address this point, we added the following changes in the introduction and discussion:

      Line 69 in Introduction: 

      “The theory of optimal feedback control (OFC) has been particularly useful in predicting the influence of numerous task parameters on the controller (27–34), thus reproducing goal-directed motor commands during both unperturbed movements and feedback responses to disturbances (30). OFC has been used in numerous studies to interpret flexible feedback responses occurring in the long-latency response period (30, 35).” 

      Line 454 in Discussion:

      “Although OFC has been predominantly used as a behavioral level framework agnostic to neural activity patterns, it can shed light on the planning, state estimation and execution related computations in the transcortical feedback pathway (Takei et al.,). Using OFC, our study proposes a novel and precise definition of the difference to expect in neural activities in order to identify coarticulated versus independent sequence representations from a computational point of view. Because each condition (i.e., overlapping versus non-overlapping controllers as in Figure 2) was associated with different cost-functions and time-varying control gains, it is the process of deriving these control gains, using the internal representation of the task structure, that may differ across coarticulated and separated sequence conditions. To our knowledge, how and where this operation is performed is unknown. A corollary of this definition is that the preparatory activity (20, 50) may not discern independently planned or coarticulated sequences because these situations imply different control policies (and cost functions), as opposed to different initial states. Moreover, the nature of the sequence representation is potentially not dissociable from its execution for the same reason.”

      Reviewer #2 (Public Review):

      Summary: 

      In this manuscript, the authors examine the question of whether discrete action sequences and coarticulated continuous sequential actions can be produced from the same controller, without having to derive separate control policies for each sequential movement. Using modeling and behavioral experiments, the authors demonstrate that this is indeed possible if the constraints of the policy are appropriately specified. These results are of interest to those interested in motor sequences, but it is unclear whether these findings can be interpreted to apply to the control of sequences more broadly (see weaknesses below). 

      Strengths: 

      The authors provide an interesting and novel extension of the stochastic optimal control model to demonstrate how different temporal constraints can lead to either individual or coarticulated movements. The authors use this model to make predictions about patterns of behavior (e.g., in response to perturbations), which they then demonstrate in human participants both by measuring movement kinematics as well as EMG. Together this work supports the authors' primary claims regarding how changes in task instructions (i.e., task constraints) can result in coarticulated or separated movement sequences and the extent to which the subsequent movement goal affects the planning and control of the previous movement. 

      Weaknesses: 

      I reviewed a prior version of this manuscript, and appreciate the authors addressing many of my previous comments. However, there are some concerns, particularly with regard to how the authors interpret their findings. 

      We thank the reviewer for their continued assessment of our work and for helping us to improve the paper. We are convinced that this and the previous review helped us clarifying our work considerably.

      (1) It would be helpful for the authors to discuss whether they think there is a fundamental distinction between a coarticulated sequence and a single movement passing through a via point (or equivalently, avoiding an obstacle). The notion of a coarticulated sequence brings with it the notion of sequential (sub)movements and temporal structure, whereas the latter can be treated as more of a constraint on the production of a single continuous movement. If I am interpreting the authors' findings correctly it seems they are suggesting that these are not truly different kinds of movements at the level of a control policy, but it would be helpful for the authors to clarify this claim. 

      Indeed, this is our interpretation of the results/simulations. This suggestion can also be observed in Ramkumar et al., article on chunking. To clarify this, we added a statement in the discussion as follows: 

      Line 449: 

      “Notably, in the framework of optimal feedback control, an intermediate goal is equivalent to a via-point that constrains the execution of the sequence (similar to (13)). It is thus possible that coarticulation in motor systems be processed similarly as other kinds of movement constraints, such as via-points, avoiding obstacles, or changes in control policies.”

      (2) The authors' model clearly shows that each subsequent target only influences the movement of one target back, but not earlier ones (page 7 lines 199-204). This stands in contrast to the paper they cite from Kashefi 2023, in which those authors clearly show that people account for at least 2 targets in the future when planning/executing the current movement. It would be useful to know whether this distinction arises because of a difference in experimental methodology, or because the model is not capturing something about human behavior.  

      Thank you for raising this point. There are some differences between the study of Kashefi and colleagues (2023), and ours. Both studies looked into planning of more than one reach. In the study of Kashefi et al., the results of Figure 6 showed that in H2 condition, there was no significant curvature, and the curvature increases in H3 and H4 conditions (only in the 75ms dwell-time scenario). Note that H2 condition in their work meant the presentation of +2 target after the initiation of +1 reach. Hence, we think the GO task in our case should be compared to the H3 condition, resulting in similar curvature as in our study. These authors also showed that curvature increased even in the H4 condition (75 ms dwell). OFC also accommodates this observation, if we consider the relationship between the cost of intermediate goals and spatial location of the targets (see figure below, also added to Supplementary Figure 4). To see this, we performed additional 3 target simulations where the constraint on intermediate goal velocity (at T1 and T2) was varied to achieve similar dwell velocity at the intermediate targets (Supplementary Figure 4C). In this case, the hand curvature of the first reach differed while the dwell velocity was similar across T3 up and T3 down conditions, as may be instructed experimentally. Again, the task instructions and the spatial location of the future goals together determine how much the first reach components are influenced by the next ones, and this may impact several reaches ahead. 

      We added the following clarification in the result to describe this. 

      Line 199:

      “It is worth noting that the OFC model can be generalized to longer sequences (10) through the incorporation of additional cost terms (in Equation 10 of Methods) and targets, enabling simultaneous planning for more than two targets. Simulations of a sample three-reach sequence (Supplementary Figure S4) revealed that, varying the cost of dwell velocity at intermediate targets (w2 and w3 parameters in Methods) caused a variation in control gains. Different amount of change in control gains can be expected for intermediate versus late targets (Supplementary Figure 4A). Notably, even when we used the same dwell velocity cost (w2 = w3 = 0), the observed velocity profiles were different between the two sequences towards different final targets (T3 up and T3 down) (Supplementary Figure 4B). We tested a condition in which both sequence reaches were forced to have similar dwell velocity profiles by increasing the dwell velocity costs in the sequence towards one of the targets (T3 down), while leaving this parameter unchanged for the other target (T3 up). In this scenario, T3 up sequence had the parameters (w2, w3) = (0, 0), while T3 down sequence had the parameters (0.8, 0.8). In this case, the curvature of the first reach was different, and predominantly occurred due to differences in K2 between the two sequence reaches (Supplementary Figure S4C). These simulations highlight that, planning for a longer horizon sequence can indirectly influence the curvature of early reaches, due to the interaction between intermediate dwell constraints, spatial arrangement of targets, and sequence horizon in a task dependent manner.”

      (3) In my prior review I raised a concern that the authors seem to be claiming that because they can use a single control policy for both coarticulated and separated movement sequences, there need not be any higher-level or explicit specification of whether the movements are sequential. While much of that language has been removed, it still appears in a few places (e.g., p. 13, lines 403-404). As previously noted, the authors' control policy can generate both types of movements as long as the proper constraints are provided to the model. However, these constraints must be specified somewhere (potentially explicitly, as the authors do by providing them as task instructions). Moreover, in typical sequence tasks, although some movements become coarticulated, people also tend to form chunks with distinct chunk boundaries, which presumably means that there is at least some specification of the sequential ordering of these chunks that must exist (otherwise the authors' model might suggest that people can coarticulate forever without needing to exhibit any chunk boundaries). Hence the authors should limit themselves to the narrow claim that a single control policy can lead to separated or coarticulated movements given an appropriate set of constraints, but acknowledge that their work cannot speak to where or how those constraints are specified in humans (i.e., that there could still be an explicit sequence representation guiding coarticulation). 

      We thank the reviewer for raising this point. We do not dispute the statement that the controller needs to be set dependent on the constraints of the task that must be specified somewhere. In our view, this problem is similar to the question of how a cost-function (or a task representation) is transformed into a control policy in the brain, which is unknown in general. In the earlier version, our intention was to stress that separation can occur without necessarily implying that the goals be processed independently (as in Figure 1A and Zimnik 2021). To avoid confusion on this point, we modified this statement in the new version as follows:

      Line 405: 

      “A straightforward interpretation could be that the stopping at the first target invoked a completely different strategy in which the control of the two reaches was performed independently (Figure 1A), effectively separating the two movements, whereas executing them rapidly could produce the merging of the two sub-movements into a coarticulated sequence. While this is conceptually valid, it is not necessary and the model provides a more nuanced view: both apparent separation or coarticulation of the two motor patterns can be explained within the same framework of flexible feedback control. These different modes of sequence execution still require proper specification of the task constraints in the model, such as number of intermediate steps, dwell-time, or velocity limit. Such specifications must be considered as input to the controller.”

      Recommendations for the authors:

      Reviewer #1 (Recommendations For The Authors): 

      Line 57: Distinct hypotheses. 

      Line 209, The term "planned holistically" is confusing here. Seems like the authors suggest that the sequence is "planned holistically" as long as all sequence elements are given during the optimization process. 

      We changed the sentence as follows.

      Line 218: 

      “Overall, the model predicted that even if a feedback control policy was computed by optimizing the whole sequence over a long time-horizon, the requirements associated with intermediate goals determine how early in the sequence the second (future) target can influence the feedback controller”

      Line 336, It was not clear to me why the authors explained "the weak significant" results of PEC shortening in R0 given the nonsignificant values in R1. 

      We wanted to be transparent about whether changing the statistical analysis will lead to different interpretations, such as the sequence encoding even before long latency epochs. But we realized that it could lead to confusion and we deleted this sentence in the updated manuscript.

      Reviewer #2 (Recommendations For The Authors): 

      About Weakness #2, to clarify this point the authors should either model and discuss what it would take for their model to account for multiple targets ahead, or else run a study to show that in this task people indeed only ever plan 1 target ahead.  

      Please see our response above (in Weakness #2).

      I am still puzzled by why people would resist the perturbation more when they eventually have to move in the direction of the perturbation (e.g., p 10 lines 313-314). Perhaps this is simply due to the geometry of the task, but it could also depend on what participants were trying to accomplish in the experiment. To help clarify this, the authors should report exactly what instructions were given to participants in each task condition.  

      The simulations suggest that the observed perturbation movements are an optimal way to perform the task given the task constraints on accuracy, control effort and constraints at intermediate goals. The intuition is that modulating the acceleration at the intermediate goal is preferred rather than missing it. This however depends on the cost parameter. 

      Below, in Author response figure 1, we show the simulations by varying the accuracy requirements at intermediate goal and the total motor cost parameters. Clearly, as expected, increasing the cost on accuracy of the intermediate reach, or decreasing the cost on motor output modulated the hand deviation (simulations not included in the article).

      Author response image 1.

      Impact of movement costs (motor effort and intermediate goal reach errors) on the hand path following a mechanical perturbation   

      Our observation suggests that participants’ behaviour agreed with the interpretation that can result from the model. We clarified the exact instructions in the methods section. Note that the instructions were given at the beginning of the task and did not differ across the different conditions involving changes in the location of T2 or perturbation direction:

      Line 594:

      Participants were given the following instructions verbally: “Wait in the starting circle until you receive a GO signal, where the target circles turn red and you will simultaneously hear a beep sound. When the circles turn red, react quickly, move as soon, and as straight as possible to target 1 and then move to target 2. You will get two points at the end of the trial if you reach T1 in the prescribed time window and then move to T2, and in all other cases you will not receive any points. Importantly, once you reach T1 you should try to come out of it quickly. If you stay in T1 for more than 150 ms then T2 will disappear and you will receive only one point. Additionally, in some trials, a force will perturb your hand towards the right or left direction randomly while moving towards T1. The instructions remain the same in the presence of perturbations. Try to score as many points as you can.”

      Additionally, we added the following lines in the results description:

      Line 284:

      “The influence of second target on the lateral hand deviation was qualitatively similar to that observed in model simulations, and counterintuitive to what we might expect without the help of the model simulations. As observed in the model simulations (see also Supplementary Figure S2), lateral hand deviation was smaller when the perturbation was in the direction of the second target (T2) and vice-versa. This was consistent for both rightward and leftward perturbation conditions. Both the model and humans expressed this strategy that can be seen as an emergent feature of efficient feedback control during production of movement sequences. Additionally, even though behavior was reproduced in simulations, changing the cost on control effort and/or accuracy of intermediate reaches could modulate the sequencedependent changes in curvature.”

      I am not sure if "the data and code for simulations can be provided by the corresponding author" satisfies the eLife/PLoS software guidelines (i.e., that it be deposited in a public repository).

      Thank you for pointing this out. This sentence was added by mistake.

      We modified this statement in the updated manuscript. 

      “The data and code from simulations and experiments is available in the public repository ‘figshare’ in the following link (https://figshare.com/s/865a8b77c264ef17a181).”

    1. Author response:

      eLife assessment

      Cav2 voltage-gated calcium channels play key roles in regulating synaptic strength and plasticity. In contrast to mammals, invertebrates like Drosophila encode a single Cav2 channel, raising questions on how diversity in Cav2 is achieved from a single gene. Here, the authors present convincing evidence that two alternatively spliced isoforms of the Cac gene (cacophony, also known as Dmca1A and nightblindA) enable diverse changes in Cav2 expression, localization, and function in synaptic transmission and plasticity. These valuable findings will be of interest to a variety of researchers.

      We suggest replacing “two alternatively spliced isoforms of the Cac gene” by “two alternatively spliced mutually exclusive exon pairs of the Cac gene”. 

      Public Reviews:

      Reviewer #1 (Public Review):

      Summary:

      The manuscript by Bell et. al. describes an analysis of the effects of removing one of two mutually exclusive splice exons at two distinct sites in the Drosophila CaV2 calcium channel Cacophony (Cac). The authors perform imaging and electrophysiology, along with some behavioral analysis of larval locomotion, to determine whether these alternatively spliced variants have the potential to diversify Cac function in presynaptic output at larval neuromuscular junctions. The author provided valuable insights into how alternative splicing at two sites in the calcium channel alters its function.

      Strengths:

      The authors find that both of the second alternatively spliced exons (I-IIA and I-IIB) that are found in the intracellular loop between the 1st and 2nd set of transmembrane domains can support Cac function. However, loss of the I-IIB isoform (predicted to alter potential beta subunit interactions) results in 50% fewer channels at active zones and a decrease in neurotransmitter release and the ability to support presynaptic homeostatic potentiation. Overall, the study provides new insights into Cac diversity at two alternatively spliced sites within the protein, adding to our understanding of how regulation of presynaptic calcium channel function can be regulated by splicing.

      Weaknesses:

      The authors find that one splice isoform (IS4B) in the first S4 voltage sensor is essential for the protein's function in promoting neurotransmitter release, while the other isoform (IS4A) is dispensable. The authors conclude that IS4B is required to localize Cac channels to active zones. However, I find it more likely that IS4B is required for channel stability and leads to the protein being degraded, rather than any effect on active zone localization. More analysis would be required to establish that as the mechanism for the unique requirement for IS4B.

      We agree that we need to explain more clearly why IS4B is unlikely required for channel stability, but instead, likely has a unique function at the presynaptic active zone of fast synapses. We will address this by revising text and by providing additional data. If IS4B was required for evoked release because it supported channel protein stability, then the removal of IS4B should cause protein degradation throughout all sub-neuronal compartments and throughout the CNS, but this is not the case. First, upon removal of IS4B in adult motoneurons (which use cac channels at the presynapse and somatodendritically, Ryglewski et al., 2012) evoked release from axon terminals is abolished (as at the larval NMJ), but somatodendritic cac inward current is present. If IS4B was required for cac channel stability, somatodendritic current should also be abolished. We will add these data to the ms. Second, immunohistochemistry for tagged IS4B channels reveals that these are present not only at presynaptic active zones at the NMJ but also throughout the VNC motor neuropils. Excision of IS4B causes the absence of cac channels from the presynaptic active zones at the NMJ and throughout the VNC neuropils (and accordingly this is lethal). By contrast, tagged IS4A channels (with IS4B excised) are not found at the presynaptic terminals of fast synapses, but instead, in other distinct parts of the CNS. We will also provide data to show this. Together these data are in line with a unique requirement of IS4B at presynaptic active zones (not excluding additional functions of IS4B), whereas IS4A containing cac isoforms mediate different functions.

      We appreciate the additional reviewer suggestions to the authors that we will address point by point when revising the ms. 

      Reviewer #2 (Public Review):

      This study by Bell et al. focuses on understanding the roles of two alternatively spliced exons in the single Drosophila Cav2 gene cac. The authors generate a series of cac alleles in which one or the other mutually exclusive exons are deleted to determine the functional consequences at the neuromuscular junction. They find alternative splicing at one exon encoding part of the voltage sensor impacts the activation voltage as well as localization to the active zone. In contrast, splicing at the second exon pair does not impact Cav2 channel localization, but it appears to determine the abundance of the channel at active zones. Together, the authors propose that alternative splicing at the Cac locus enables diversity in Cav2 function generated through isoform diversity generated at the single Cav2 alpha subunit gene encoded in Drosophila.

      Overall this is an excellent, rigorously validated study that defines unanticipated functions for alternative splicing in Cav2 channels. The authors have generated an important toolkit of mutually exclusive Cac splice isoforms that will be of broad utility for the field, and show convincing evidence for distinct consequences of alternative splicing of this single Cav2 channel at synapses. Importantly, the authors use electrophysiology and quantitative live sptPALM imaging to determine the impacts of Cac alternative splicing on synaptic function. There are some outstanding questions regarding the mechanisms underlying the changes in Cac localization and function, and some additional suggestions are listed below for the authors to consider in strengthening this study. Nonetheless, this is a compelling investigation of alternative splicing in Cav2 channels that should be of interest to many researchers.

      We agree that some additional information on cac isoform localization (in particular for splicing at the IS4 site) will strengthen the manuscript. We will address this by providing additional data and revising text (see responses to reviewers 1 and 3). We are also grateful for the additional reviewer suggestions which we will address point by point when revising the ms.  

      Reviewer #3 (Public Review):

      Summary:

      Bell and colleagues studied how different splice isoforms of voltage-gated CaV2 calcium channels affect channel expression, localization, function, synaptic transmission, and locomotor behavior at the larval Drosophila neuromuscular junction. They reveal that one mutually exclusive exon located in the fourth transmembrane domain encoding the voltage sensor is essential for calcium channel expression, function, active zone localization, and synaptic transmission. Furthermore, a second mutually exclusive exon residing in an intracellular loop containing the binding sites for Caβ and G-protein βγ subunits promotes the expression and synaptic localization of around ~50% of CaV2 channels, thereby contributing to ~50% of synaptic transmission. This isoform enhances release probability, as evident from increased short-term depression, is vital for homeostatic potentiation of neurotransmitter release induced by glutamate receptor impairment, and promotes locomotion. The roles of the two other tested isoforms remain less clear.

      Strengths:

      The study is based on solid data that was obtained with a diverse set of approaches. Moreover, it generated valuable transgenic flies that will facilitate future research on the role of calcium channel splice isoforms in neural function.

      Weaknesses:

      (1) Based on the data shown in Figures 2A-C, and 2H, it is difficult to judge the localization of the cac isoforms. Could they analyze cac localization with regard to Brp localization (similar to Figure 3; the term "co-localization" should be avoided for confocal data), as well as cac and Brp fluorescence intensity in the different genotypes for the experiments shown in Figure 2 and 3 (Brp intensity appears lower in the dI-IIA example shown in Figure 3G)? Furthermore, heterozygous dIS4B imaging data (Figure 2C) should be quantified and compared to heterozygous cacsfGFP/+.

      We understand the reviewer’s comment and will do the following to convincingly demonstrate absence of cac from presynaptic active zones upon IS4B excision. First, we will show selective enlargements of IS4A and IS4B with Brp in presynaptic active zones to show distinct cac label in active zones following excision of IS4A but not following excision of IS4B. Second, we will provide Pearson’s co-localization coefficients of Brp with IS4B and with IS4A, respectively. Third, we will reduce the intensity of the green channels in figures 2C and 2H to the same levels as in 2A and B, and H control to allow a fair comparison of cac intensities following excision of IS4B versus excision of IS4A and control. We had increased intensity to show that following excision of IS4B, no distinct cac label is found in active zones, even at high exaggerated image brightness. However, we agree with the reviewer that the bright background hampers interpretation and thus will show the same intensity in all images that need to be compared.

      (2) They conclude that I-II splicing is not required for cac localization (p. 13). However, cac channel number is reduced in dI-IIB. Could the channels be mis-localized (e.g., in the soma/axon)? What is their definition of localization? Could cac be also mis-localized in dIS4B? Furthermore, the Western Blots indicate a prominent decrease in cac levels in dIS4B/+ and dI-IIB (Figure 1D). How do the decreased protein levels seen in both genotypes fit to a "localization" defect? Could decreased cac expression levels explain the phenotypes alone?

      We will precisely define channel localization, and we will explain why it is highly unlikely that the absence of IS4B channels as well as the lower number of I-IIA channels are simply a consequence of reduced expression, but instead of splice variant specific channel function and localization. For example, upon excision of IS4B no cac channels are found at the presynaptic active zones and these synapses are thus non-functional. The isoforms containing the mutually exclusive IS4A exon are expressed and mediate other functions (see also response to reviewer 1) but cannot substitute IS4B containing isoforms at the presynapse. In fact, our Western blots are in line with reduced cac expression if all isoforms that mediate evoked release are missing, again indicating that the presynapse specific cac isoforms cannot be replaced by other cac isoforms (see also below, response to (3)). Feedback mechanisms that regulate cac expression in the absence of presynapse specific cac isoforms are beyond the scope of this study.

      (3) Cac-IS4B is required for Cav2 expression, active zone localization, and synaptic transmission. Similarly, loss of cac-I-IIB reduces calcium channel expression and number. Hence, the major phenotype of the tested splice isoforms is the loss of/a reduction in Cav2 channel number. What is the physiological role of these isoforms? Is the idea that channel numbers can be regulated by splicing? Is there any data from other systems relating channel number regulation to splicing (vs. transcription or post-transcriptional regulation)?

      We will provide additional evidence that mutually exclusive splicing at the IS4 site results in cac channels that localize to the presynaptic active zone (IS4B) versus cac channels that localize to other brain parts and/or other subneuronal compartments (see response to reviewer 1).  In addition, we already show in figure 2J that IS4B is required for normal cac HVA current, and we can add data showing that IS4A is not essential for cac HVA current. Similarly, for I-II we find it unlikely that differential splicing regulates channel numbers, but rather splice variant specific functions in different brain parts and different sub-neuronal compartments. To substantiate this interpretation, we will add data from developing adult motoneurons showing that excision of I-IIA causes reduced activity induced calcium influx into dendrites (new data), but it does not reduce channel number at the larval NMJ (figure 4). In our opinion these data are not in line with the idea that splicing regulates cac expression levels, and this in turn, results in specific defects in distinct neuronal compartments. However, we agree that the lack of isoforms with specific functions results in altered overall cac expression levels as indicated by our Western data. If isoforms normally abundantly expressed throughout most neuropils are missing due to exon excision, we indeed find less cac protein in Westerns. By contrast, the lack of isoforms with little abundance has little effect on cac expression levels. This may be the results of unknown feedback mechanisms which are beyond the scope of this study.

      (4) Although not supported by statistics, and as appreciated by the authors (p. 14), there is a slight increase in PSC amplitude in dIS4A mutants (Figure 2). Similarly, PSC amplitudes appear slightly larger (Figure 3J), and cac fluorescence intensity is slightly higher (Figure 3H) in dI-IIA mutants. Furthermore, cac intensity and PSC amplitude distributions appear larger in dI-IIA mutants (Figures 3H, J), suggesting a correlation between cac levels and release. Can they exclude that IS4A and/or I-IIA negatively regulate release? I suggest increasing the sample size for Canton S to assess whether dIS4A mutant PSCs differ from controls (Figure 2E). Experiments at lower extracellular calcium may help reveal potential increases in PSC amplitude in the two genotypes (but are not required). A potential increase in PSC amplitude in either isoform would be very interesting because it would suggest that cac splicing could negatively regulate release.

      There are several possibilities to explain this, but as none of the effects are statistically significant, we prefer to not investigate this in depth. However, given that we cannot find IS4A at the presynaptic active zone, IS4A is unlikely to have a direct negative effect on release probability. Nonetheless, given that IS4A containing cac isoforms mediate functions in other neuronal compartments it may regulate release indirectly by affecting action potential shape. We will provide data in response to the more detailed suggestions to authors that will provide additional insight.

      (5) They provide compelling evidence that IS4A is required for the amplitude of somatic sustained HVA calcium currents. However, the evidence for effects on biophysical properties and activation voltage (p. 13) is less convincing. Is the phenotype confined to the sustained phase, or are other aspects of the current also affected (Figure 2J)? Could they also show the quantification of further parameters, such as CaV2 peak current density, charge density, as well as inactivation kinetics for the two genotypes? I also suggest plotting peak-normalized HVA current density and conductance (G/Gmax) as a function of Vm. Could a decrease in current density due to decreased channel expression be the only phenotype? How would changes in the sustained phase translate into altered synaptic transmission in response to AP stimulation?

      Most importantly, HVA current is mostly abolished upon excision of IS4B (not IS4A, we think the reviewer accidentally mixed up the genotype). This indicates that the cac isoforms that mediate evoked release encode HVA channels. However, the somatodendritic current shown in figure 2J that remains upon excision of IS4B is mediated by IS4A containing cac isoforms. Please note that these never localize to the presynaptic active zone, thus the small inactivating HVA that remains in figure 2J does normally not mediate evoked release. Therefore, the interpretation is that specifically HVA current encoded by IS4B cac isoforms is required for synaptic transmission. Reduced cac current density is not the cause for this phenotype because a specific current component is absent. 

      We agree with the reviewer that a deeper electrophysiological analysis of cac currents mediated by IS4B containing isoforms will be instructive. However, a precise analysis of activation and inactivation voltages and kinetics suffers form space clamp issues in recordings from the soma of such complex neurons (DLM motoneurons of the adult fly). Therefore, we will analyze the currents in a heterologous expression system and present these data to the scientific community as a separate study at a later time point.

      (6) Why was the STED data analysis confined to the same optical section, and not to max. intensity z-projections? How many and which optical sections were considered for each active zone? What were the criteria for choosing the optical sections? Was synapse orientation considered for the nearest neighbor Cac - Brp cluster distance analysis? How do the nearest-neighbor distances compare between "planar" and "side-view" Brp puncta?

      Max. z-projections would be imprecise because they can artificially suggest close proximity of label that is close in x and y but far away in z. Therefore, the analysis was executed in xy-direction of various planes of entire 3D image stacks. We considered active zones of different orientations (Fig. 4C, D). In fact, we searched the entire z-stacks until we found active zones of all orientations shown in figures 4C1-C6 within the same boutons. The same active zone orientations were analyzed for all exon-out mutants with cac localization in active zones. The distance between cac and brp did not change if viewed from the side.

      (7) Cac clusters localize to the Brp center (e.g., Liu et al., 2011). They conclude that Cav2 localization within Brp is not affected in the cac variants (p. 8). However, their analysis is not informative regarding a potential offset between the central cac cluster and the Brp "ring". Did they/could they analyze cac localization with regard to Brp ring center localization of planar synapses, as well as Brp-ring dimensions?

      In the top views (planar) we did not find any clear offset in cac orientation to brp between genotypes. This study focuses on cac splice isoform specific localization and function. Possible effects of different cac isoforms on Brp-ring dimensions or other aspects of scaffold structure are not central to our study, in particular given that Brp puncta are clearly present even if cac is absent from the synapse (Fig. 2H), indicating that cac is not instructive for the formation of the Brp scaffold.  

      (8) Given the accelerated PSC decay/ decreased half width in dI-IIA (Fig. 5Q), I recommend reporting PSC charge in Figure 3, and PPR charge in Figures 5A-D. The charge-based PPRs of dI-IIA mutants likely resemble WT more closely than the amplitude-based PPR. In addition, miniature PSC decay kinetics should be reported, as they may contribute to altered decay kinetics. How could faster cac inactivation kinetics in response to single AP stimulation result in a decreased PSC half-width? Is there any evidence for an effect of calcium current inactivation on PSC kinetics? On a similar note, is there any evidence that AP waveform changes accelerate PSC kinetics? PSC decay kinetics are mainly determined by GluR decay kinetics/desensitization. The arguments supporting the role of cac splice isoforms in PSC kinetics outlined in the discussion section are not convincing and should be revised.

      We agree that reporting charge in figure 3 will be informative and will do so. We also understand the reviewer’s concern attributing altered PSC kinetics to presynaptic cac channel properties. We will tone down our interpretation in the discussion and list possible alterations in presynaptic AP shape or Cav2 channel kinetics as alternative explanations (not conclusions). Moreover, we will quantify postsynaptic GluRIIA abundance to test whether altered PSC kinetics are caused by altered GluRIIA expression. In our opinion, the latter is more instructive than mini decay kinetic analysis because this depends strongly on the distance of the recording electrode to the actual site of transmission in these large muscle cells.

      (9) Paired-pulse ratios (PPRs): On how many sweeps are the PPRs based? In which sequence were the intervals applied? Are PPR values based on the average of the second over the first PSC amplitudes of all sweeps, or on the PPRs of each sweep and then averaged? The latter calculation may result in spurious facilitation, and thus to the large PPRs seen in dI-IIB mutants (Kim & Alger, 2001; doi: 10.1523/JNEUROSCI.21-24-09608.2001).

      We agree that the PP protocol and analyses have to be described more precisely in the methods, and we will do so. PPR values are based on the PPRs of each sweep and then averaged. We are aware of the study of Kim and Alger 2001, but it does not affect our data interpretation because all genotypes were analyzed identically, but only the I-IIB excision resulted in the large data spread shown in figure 5.

      (10) Could the dI-IIB phenotype be simply explained by a decrease in channel number/ release probability? To test this, I propose investigating PPRs and short-term dynamics during train stimulation at lower extracellular Ca2+ concentration in WT. The Ca2+ concentration could be titrated such that the first PSC amplitude is similar between WT and dI-IIB mutants. This experiment would test if the increased PPR/depression variability is a secondary consequence of a decrease in Ca2+ influx, or specific to the splice isoform.

      In fact, the interpretation that decreased PSC amplitude upon I-IIB excision is caused mainly by reduced channel number is precisely our interpretation (see discussion page 14, last paragraph to page 15, first paragraph). In addition, we are grateful for the reviewer’s suggestion to triturate the external calcium such that the first PSC amplitude matches the one in ΔI-IIB to test whether altered short term plasticity is solely a function of altered channel number or whether additional causes, such as altered channel properties, also play into this. We will conduct these experiments and include them in the revised manuscript.

      (11) How were the depression kinetics analyzed? How many trains were used for each cell, and how do the tau values depend on the first PSC amplitude? Time constants in the range of a few (5-10) milliseconds are not informative for train stimulations with a frequency of 1 or 10 Hz (the unit is missing in Figure 5H). Also, the data shown in Figures 5E-K suggest slower time constants than 5-10 ms. Together, are the data indeed consistent with the idea that dI-IIB does not only affect cac channel number, but also PPR/depression variability (p. 9)?

      For each animal, the amplitudes of each PSC were plotted over time and fitted with a single exponential. For depression at 1 and 10 Hz, we used one train per animal, and 5-6 animals per genotype (as reflected in the data points in Figs 5H and 5L). Given that the tau values are highly similar between control and excision of I-IIA, but ΔI-IIA tends to have larger single PSC amplitudes, differences in first PSC amplitude do not seem to skew the data (but see also response to comment 10 above). We thank the reviewer for pointing out that tau values in the range of ms are not informative at 1 and 10 Hz stimulations (Figs 5H and 5L). We mis-labeled (or did not label) the axes. The label should read seconds, not milliseconds. We apologize, and this will be corrected accordingly.

      In sum, pending the outcome of additional important control experiments for GluRIIA abundance (see response to comment 8) and trituration of control PSC amplitude for the first pulse of paired pulses in ΔI-IIB (see response to comment 10) we will either modify or further support that interpretation.

      (12) The GFP-tagged I-IIA and mEOS4b-tagged I-IIB cac puncta shown in Figure 6N appear larger than the Brp puncta. Endogenously tagged cac puncta are typically smaller than Brp puncta (Gratz et al., 2019). Also, the I-IIA and I-IIB fluorescence sometimes appear to be partially non-overlapping. First, I suggest adding panels that show all three channels merged. Second, could they analyze the area and area overlap of I-IIA and I-IIB with regard to each other and to Brp, and compare it to cac-GFP? Any speculation as to how the different tags could affect localization? Finally, I recommend moving the dI-IIA and dI-IIB localization data shown in Figure 6N to an earlier figure (Figure 1 or Figure 3).

      We will show panels with all three labels matched as suggested by the reviewer. For the size of the puncta: this could be different numbers and types of fluorophores on the different antibodies used and thus different point spread, chromatic aberration, different laser and detector intensities etc. We will re-analyze the data to test whether there are systematic differences in size. We do not want to speculate whether the different tags have any effect on localization precision because of the abovementioned reasons as well as artificial differences in localization precision that can be suggested by different antibodies. We prefer to not move the figure because we believe it is informative to show our finding that active zones usually contain both splice variants together with the finding that only one splice variant is required for PHP.

    1. Author response:

      The following is the authors’ response to the original reviews.

      Reviewer #1

      (1) In the "Introduction" section, an important aspect that requires attention pertains to the discussion surrounding the heterodimerization of CXCR4 and CCR5. Notably, the manuscript overlooks a recent study (https://doi.org/10.1038/s41467-023-42082-z) elucidating the mechanism underlying the formation of functional dimers within these G protein-coupled receptors (GPCRs)…The inclusion of this study within the manuscript would significantly enrich the contextual framework of the work, offering readers a comprehensive understanding of the current knowledge surrounding the structural dynamics and functional implications of CXCR4 and CCR5 heterodimerization.

      We thank the reviewer for his/her recommendation to enrich the contextual framework of our study. The Nature Communications paper by Di Marino et al. was published after we sent the first version of our manuscript to eLife, and therefore was not included in the discussion. As the reviewer rightly indicates, this paper elucidates the mechanism underlying the formation of functional dimers within CCR5 and CXCR4. Using metadynamics approaches, the authors emphasize the importance of distinct transmembrane regions for dimerization of the two receptors. In particular, CXCR4 shows two low energy dimer structures and the TMVI-TMVII helices are the preferred interfaces involved in the protomer interactions in both cases. Although the study uses in silico techniques, it also includes the molecular binding mechanism of CCR5 and CXCR4 in the membrane environment, as the authors generate a model in which the receptors are immersed in a 1-palmitoyl-2-oleoyl-sn-glycero-3-phosphocholine (POPC) phospholipid bilayer with 10% cholesterol. This is an important point in this study, as membrane lipids also interact with membrane proteins, and the lipid composition affects CXCR4 oligomerization (Gardeta S.R. et al. Front. Immunol. 2023). In particular, Di Marino et al. find a cholesterol molecule placed in-between the two CXCR4 protomers where it engages a series of hydrophobic interactions with residues including Leu132, Val214, Leu216 and Phe249. Then, the polar head of cholesterol forms an H-bond with Tyr135 that further stabilizes protomer binding. In our hands, the F249L mutation in CXCR4 reverted the antagonism of AGR1.137, suggesting that the compound binds, among others, this residue. We should, nonetheless, indicate that we analyzed receptor oligomerization and not CXCR4 dimerization, which was the main object of the Di Marino et al. study. It is therefore also plausible that other residues than those described as essential for CXCR4 dimerization might participate in receptor oligomerization. We can speculate that AGR1.137 might affect cholesterol binding to CXCR4 and, therefore, alter dimerization/oligomerization. Additionally, the CXCR4 x-ray structure with PDB code 3ODU (Wu B. et al. Science, 2010) experimentally shows the presence of two fatty acid molecules in contact with both TMV and TMVI. These molecules closely interact with hydrophobic residues in the protein, thereby stabilizing it in a hydrophobic environment. Although more experiments will be needed to clarify the mechanism involved, our results suggest that cholesterol and/or other lipids also play an important role in CXCR4 oligomerization and function, as seen for other GPCRs (Jakubik J. & ElFakahani E.E. Int J Mol Sci. 2021). However, we should also consider that other factors not included in the analysis by Di Marino et al. can also affect CXCR4 oligomerization; for instance, the co-expression of other chemokine receptors and/or other GPCRs that heterodimerize with CXCR4 might affect CXCR4 dynamics at the cell membrane, similar to other membrane proteins such as CD4, which also forms complexes with CXCR4 (Martinez-Muñoz L. et al. Mol. Cell 2018).

      The revised discussion contains references to the study by Di Marino et al. to enrich the contextual framework of our data.

      (2) In "various sections" of the manuscript, there appears to be confusion surrounding the terminology used to refer to antagonists. It is recommended to provide a clearer distinction between allosteric and orthosteric antagonists to enhance reader comprehension. An orthosteric antagonist typically binds to the same site as the endogenous ligand, directly blocking its interaction with the receptor. On the other hand, an allosteric antagonist binds to a site distinct from the orthosteric site, inducing a conformational change in the receptor that inhibits the binding of the endogenous ligand. By explicitly defining the terms "allosteric antagonist" and "orthosteric antagonist" within the manuscript, readers will be better equipped to discern the specific mechanisms discussed in the context of the study.

      The behavior of the compounds described in our manuscript (AGR1.35 and AGR1.137) fits with the definition of allosteric antagonists, as they bind on a site distinct from the orthosteric site, although they only block some ligand-mediated functions and not others. This would mean that they are not formally antagonists and should be not considered as allosteric compounds, as their binding on CXCR4 does not alter CXCL12 binding, although they might affect its affinity. In this sense, our compounds respond much better to the concept of negative allosteric modulators (Gao Z.-G. & Jacobson K.A. Drug Discov. Today Technol. 2013). They act by binding on a site distinct from the orthosteric site and selectively block some downstream signaling pathways but not others induced by the same endogenous agonist.

      To avoid confusion and to clarify the role of the compounds described in this study, we now refer to them as negative allosteric modulators along the manuscript.

      (3) In the Results section, the computational approach employed for "screening small compounds targeting CXCR4, particularly focusing on the inhibition of CXCL12-induced CXCR4 nanoclustering", requires clarification due to several points of incomprehension. The following recommendations aim to address these concerns and enhance the overall clarity of the section:

      (1) Computational Approach and Binding Mode Description: 

      -Explicitly describe the methodology for identifying the pocket/clef area in angstroms (Å) on the CXCR4 protein structure. Include details on how the volume of the cleft enclosed by TMV and TMVI was determined, as this information is not readily apparent in the provided reference (https://doi.org/10.1073/pnas.1601278113).

      The identification of the cleft was based on the observations by Wu et al. (Wu B. et al. Science 2010) who described the presence of bound lipids in the area formed by TMV and VI, and those of Wescott et al. (Wescott M.P. et al. Proc. Natl. Acad. Sci. 2016) on the importance of TMVI in the transmission of conformational changes promoted by CXCL12 on CXCR4 towards the cytoplasmic surface of the receptor to link the binding site with signaling activation. Collectively, these results, and our previous data on the critical role of the N-terminus region of TMVI for CXCR4 oligomerization (Martinez-Muñoz L. et al. Mol. Cell 2018), focused our in silico screening to this region. Once we detected that several compounds bound CXCR4 in this region, the cleavage properties were calculated by subtracting the compound structure. The resulting PDB was analyzed using the PDBsum server (Laskowski R.A. et. al. Protein Sci. 2018). Volume calculations were obtained using the server analyzing surface clefts by SURFNET (Laskowski R. A. J. Mol. Graph. 1995). The theoretical interaction surface between the selected compounds and CXCR4 and the atomic distances between the protein residues and the compounds was calculated using the PISA server (Krissinel E. & Henrick K. J. Mol. Biol. 2007) (Fig. I, only for review purposes). The analysis of the cleft occupied by AGR1.135 showed two independent cavities of 434 Å3 and 1,381 Å3 that were not connected to the orthosteric site. In the case of AGR1.137, the data revealed two distinct clefts of 790 Å3 and 580 Å3 (Fig. I, only for review purposes). These details have been included in the revised manuscript (New Fig. 1A, Supplementary Fig 8A, B).

      (4) Clarify the statement regarding the cleft being "surface exposed for interactions with the plasma membrane," particularly in the context of its embedding within the membrane.

      For GPCRs, transmembrane domains represent binding sites for bioactive lipids that play important functional and physiological roles (Huwiler A. & Zangemeister-Wittke U. Pharmacol. Ther. 2018). The channel between TMV and TMVI connects the orthosteric chemokine binding pocket to the lipid bilayer and is occupied by an oleic acid molecule, according to the CXCR4 structure published in 2010 (Wu B. et al. Science 2010). In addition, the target region contains residues involved in cholesterol (and perhaps other lipids) engagement (Di Marino et al. Nat. Commun. 2023). Taken together, these data support our statement that the cleft supports interactions between CXCR4 molecules and the plasma membrane. 

      Moreover, the data of Di Marino et al. also support that CCR5 and CXCR4 have a symmetric and an asymmetric binding mode. Therefore, either dimeric structure has the possibility to form trimers, tetramers, and even oligomers by using the free binding interface to complex with another protomer. This hypothesis suggests that the interaction of dimers to form oligomers should involve residues distinct from those included in the dimeric conformation.

      The sentence has been modified in the revised manuscript to clarify comprehension.

      (5) Discuss the rationale behind targeting the allosteric binding pocket instead of the orthosteric pocket, outlining potential advantages and disadvantages.

      The advantages and disadvantages of using negative allosteric modulators vs orthosteric antagonists have been now included in the revised discussion. 

      The majority of GPCR-targeted drugs function by binding to the orthosteric site of the receptor, and are agonists, partial agonists, antagonists or inverse agonists. These orthosteric compounds can have off-target effects and poor selectivity due to highly homologous receptor orthosteric sites and to abrogation of spatial and/or temporal endogenous signaling patterns. 

      The alternative is to use allosteric modulators, which can tune the functions associated with the receptors without affecting the orthosteric site. They can be positive, negative or neutral modulators, depending on their effect on the functionality of the receptor (Foster D.J. & Conn P.J. Neuron 2017). For example, the use of a negative allosteric modulator of a chemokine receptor to dampen pathological signaling events, while retaining full signaling for non-pathological activities might limit adverse effects (Kohout T.A.et al. J. Biol. Chem. 2004). In this case, the negative allosteric modulator 873140 blocks CCL3 binding on CCR5 but does not alter CCL5 binding (Watson C. et al. Mol. Pharmacol. 2005). In other cases, allosteric modulators can stabilize a particular receptor conformation and block others. The mechanism of action of the anti-HIV-1, FDAapproved, CCR5 allosteric modulator, maraviroc (Jin J. et al. Sci. Signal. 2018) is attributed to its ability to modulate CCR5 dimer populations and their subsequent subcellular trafficking and localization to the cell membrane (Jin J .et al. Sci. Signal. 2018). Two CCR5 dimeric conformations that are imperative for membrane localization were present in the absence of maraviroc; however, an additional CCR5 dimer conformation was discovered after the addition of maraviroc, and all homodimeric conformations were further stabilized. This finding is consistent with the observation that CCR5 dimers and oligomers inhibit HIV host-cell entry, likely by preventing the HIV-1 co-receptor formation.

      It is well known that GPCRs activate G proteins, but they also recruit additional proteins (e.g., β-arrestins) that induce signaling cascades which, in turn, can direct specific subsets of cellular responses independent of G protein activation (Eichel K. et al. Nature 2018) and are responsible for either therapeutic or adverse effects. Allosteric modulators can thus be used to block these adverse effects without influencing the therapeutic benefits. This was the case in the design of G protein-biased agonists for the kappa opioid receptor, which maintain the desirable antinociceptive and antipruritic effects and eliminate the sedative and dissociative effects in rodent models (Brust T.F. et al. Sci. Signal 2016).

      (6) Provide the PDB ID of the CXCR4 structure used as a template for modeling with SwissModel. Explain the decision to model the structure from the amino acid sequence and suggest an alternative approach, such as utilizing AlphaFold structures and performing classical molecular dynamics with subsequent clustering for the best representative structure.

      The PDB used as a template for modeling CXCR4 was 3ODU. This information was already included in the material and methods section. At the time we performed these analyses, there were several crystallographic structures of CXCR4 in complex with different molecules and peptides deposited at the PDB. None of them included a full construct containing the complete receptor sequence to provide a suitable sample for Xray structure resolution, as the N- and C-terminal ends of CXCR4 are very flexible loops. In addition, the CXCR4 constructs contained T4 lysozyme inserted between helices TMV and TMVI to increase the stability of the protein––a common strategy used to facilitate crystallogenesis of GPCRs (Zou Y. et al. PLoS One 2012). Therefore, we generated a CXCR4 homology model using the SWISS-MODEL server (Waterhouse A. et al. Nucleic Acids Res. 2018). This program reconstructed the loop between TMV and TMVI, a domain particularly important in this study that was not present in any of the crystal structure available in PDB. The model structure was, nonetheless, still incomplete, as it began at P27 and ended at S319 because the terminal ends were not resolved in the crystal structure used as a template. Nevertheless, we considered that these terminal ends were not involved in CXCR4 oligomerization. 

      As Alphafold was not available at the time we initiated this project, we didn’t use it. However, we have now updated our workflow to current methods and predicted the structure of the target using AlphaFold (Jumper J. et al. Nature 2021) and the sequence available under UniProt entry P61073. We prepared the ligands using OpenBabel (O’Boyle N.M. et al., J. Cheminformatics 2011), with a gasteiger charge assignment, and generated 10 conformers for each input ligand using the OpenBabel genetic algorithm. We then prepared the target structure with Openmm, removing all waters and possible heteroatoms, and adding all missing atoms. We next predicted the target binding pockets with fPocket (Le Guilloux V. et al. BMC Bioinformatics 2009), p2rank (Krivak R. & Hoksza, J. Cheminformatics 2018), and AutoDock autosite (Ravindranath P.A. & Sanner M.F. Bioinformatics 2016). We chose only those pockets between TMV and TMVI (see answer to point 3). We merged the results of the three programs into so-called consensus pockets, as two pockets are said to be sufficiently similar if at least 75% of their surfaces are shared (del Hoyo D. et al. J. Chem. Inform. Model. 2023). From the consensus pockets, there was one pocket that was significantly larger than the others and was therefore selected. We then docked the ligand conformers in this pocket using AutoDock GPU (Santos-Martins D. et al. J. Chem. Theory Comput. 2021), LeDock (Liu N & Xu Z., IOP Conf. Ser. Earth Environ. Sci. 2019), and Vina (Eberhardt J. et al. J. Chem. Inf. Model. 2021). The number of dockings varied from 210 to 287 poses. We scored each pose with the Vina score using ODDT (Wójcikowski M. et al. J. Cheminform. 2015). Then, we clustered the different solutions into groups whose maximum RMSD was 1Å. This resulted in 40 clusters, the representative of each cluster was the one with maximum Vina score and confirmed that the selected compounds bound this pocket (Author response image 1). When required, we calculated the binding affinity using Schrodinger’s MM-GBSA procedure (Greenidge P.A. et al. J. Chem. Inf. Model. 2013), in two ways: first, assuming that the ligand and target are fixed; second, with an energy minimization of all the atoms within a distance of 3Å from the ligand. This information has now been included in the revised version of the manuscript.

      Author response image 1.

      AGR1.135 docking in CXCR4 using the updated protocol for ligand docking. Cartoon representation colored in gray with TMV and TMVI shown in blue and pink, respectively. AGR1.135 is shown in stick representation with carbons in yellow, oxygens in red and nitrogens in blue.

      (7) Specify the meaning of "minimal interaction energy" and where (if present) the interaction scores are reported in the text.

      We refer to minimal interaction energy, the best docking score, that is, the best score obtained in our docking studies. These data were not included in the previous manuscript due to space restrictions but are now included in the reviewed manuscript.

      (8) You performed docking studies using GLIDE to identify potential binding sites for the small compounds on the CXCR4 protein. The top-scoring binders were then subjected to further refinement using PELE simulations. However, I realize that a detailed description of the specific binding modes of these compounds was not provided in the text. Please make the description of binding poses more detailed

      Firstly, to assess the reliability of this method, a PELE study was carried out for the control molecule IT1t, which is a small drug-like isothiourea derivative that has been crystallized in complex with CXCR4 (PDB code: 3ODU). IT1t is a CXCR4 antagonist that binds to the CXCL12 binding cavity and inhibits HIV-1 infection (Das D. Antimicrob. Agents Chemother. 2015; Dekkers S. et al. J. Med. Chem. 2023). From the best five trajectories, two of them had clearly better binding energies, and corresponded to almost the same predicted pose of the molecule. Although the predicted binding mode was not exactly the same as the one in the crystal structure, the approximation was very good, giving validation to the approach. Although PELE is a suitable technique to find potential binding sites, the predicted poses must be subsequently refined using docking programs.

      Analyzing the best trajectories for the remaining ligands, at least one of the best-scored poses was always located at the orthosteric binding site of CXCR4. Even though these poses showed good binding energies, they were discarded as the in vitro biological experiments indicated that the compounds were unable to block CXCL12 binding or CXCL12-mediated inhibition of cAMP release or CXCR4 internalization. Collectively, these data indicated that the selected compounds did not behave as orthosteric inhibitors of CXCR4. The CXCL12 binding pocket is the biggest cavity in CXCR4, and so PELE may tend to place the molecules near it. However, all the compounds presented other feasible binding sites with a comparable binding energy.

      AGR1.135 and AGR1.137 showed interesting poses between TMV and TMVI with very good binding energy (-51.4 and -37.2 kcal/mol, respectively). This was precisely the region we had previously selected for the in silico screening, as previously described (see response to point 3).

      AGR1.131 showed two poses with low binding energy that were placed between helices TMI and TMVII (-43.6 kcal/mol) and between helices TMV and TMVI (-39.8 kcal/mol). This compound was unable to affect CXCL12-mediated chemotaxis and was therefore used as an internal negative control as it was selected in the in silico screening with the same criteria as the other compounds but failed to alter any CXCL12-mediated functions. PELE studies nonetheless provided different binding sites for each molecule, which had to be further studied using docking to obtain a more accurate binding mode. In agreement with the previous commentary, we repeated the analysis using AlphaFold and the rest of the procedure described (see our response to point 6) and calculated the binding energies for all the compounds using Schrodinger’s MM-GBSA procedure (Greenidge P.A. et al. J. Chem. Inf. Model. 2013). Calculations were performed in two ways: first, assuming that the ligand and target are fixed; second, with an energy minimization of all the atoms within a distance of 3Å from the ligand. The results using the first method indicated that AGR1.135 and AGR1.137 showed poses between TMV and TMVI with - 56.4 and -62.4 kcal/mol, respectively and AGR1.131 had a pose between TMI and TMVII with -61.6kcal/mol.  In the second method AGR1.135 and AGR1.137 showed poses between TMV and TMVI with -57.9, and -67.6 kcal/mol, respectively, and AGR1.131 of -62.2 kcal/mol between TMI and TMVII.

      This information is now included in the text.

      (9) (2) Experimental Design:-Justify the choice of treating Jurkat cells with a concentration of 50 μM of the selected compound. Consider exploring different concentrations and provide a rationale for the selected dosage. Additionally, clearly identify the type of small compound used in the initial experiment.

      The revised version contains a new panel in Fig. 1B to show a more detailed kinetic analysis with different concentrations (1-100 µM) of the compounds in the Jurkat migration experiments. In all cases, 100 µM nearly completely abrogated cell migration, but in order to reduce the amount of DMSO added to the cells we selected 50 µM for further experiments, as it was the concentration that inhibits 50-75% of ligand-induced cell migration. Regarding the type of small compounds used in the initial experiments, they were compounds included in the library described in reference #24 (Sebastian-Pérez V. et al Med. Biol. Chem. 2017), which contains heterocyclic compounds. We would note that we do not consider AGR1.137 a final compound. We think that there is scope to develop AGR1.137-based second-generation compounds with greater solubility in water, greater specificity or affinity for CXCR4, and to evaluate delivery methods to hopefully increase activity.  

      (10) Avoid reporting details in rounded parentheses within the text; consider relocating such information to the Materials and Methods section or figure captions for improved readability.

      Most of the rounded parentheses within the text have been eliminated in the revised version of the manuscript to improve readability.

      (11) Elaborate on the virtual screening approach using GLIDE software, specifying the targeted site and methodology employed.

      For the virtual screening, we used the Glide module (SP and XP function scoring) included in the Schrödinger software package, utilizing the corresponding 3D target structure and our MBC library (Sebastián-Pérez V et al. J. Chem. Inf. Model. 2017).  The center of the catalytic pocket was selected as the centroid of the grid. In the grid generation, a scaling factor of 1.0 in van der Waals radius scaling and a partial charge cutoff of 0.25 were used. A rescoring of the SP poses of each compound was then performed with the XP scoring function of the Glide. The XP mode in Glide was used in the virtual screening, the ligand sampling was flexible, epik state penalties were added and an energy window of 2.5 kcal/mol was used for ring sampling. In the energy minimization step, the distance-dependent dielectric constant was 4.0 with a maximum number of minimization steps of 100,000. In the clustering, poses were considered as duplicates and discarded if both RMS deviation is less than 0.5 Å and maximum atomic displacement is less than 1.3 Å.

      (12) Provide clarity on the statement that AGR1.131 "theoretically" binds the same motif, explaining the docking procedure used for this determination.

      In the in silico screening, AGR1.131 was one of the 40 selected compounds that showed, according to the PELE analysis (see answer to point 8), a pose with low binding energy (-39.8 kcal/mol) between TMV and TMVI helices, which is the selected area for the screening. It, nonetheless, also showed a best pose placed between helices TM1 and TM7 (-43.7 kcal/mol) using the initial workflow. In conclusion, although AGR1.131 also faced to the TMV-TMVI, the most favorable pose was in the area between TMI and TMVII. In addition, the compound was included in the biological screening, where it did not affect CXCL12-mediated chemotaxis. We thus decided to use it as an internal negative control, as it has a skeleton very similar to AGR1.135 and AGR1.137 and can interact with the TM domains of CXCR4 without promoting biological effects. This statement has been clarified in the revised text.

      (13) Toxicity Testing:

      -Enhance the explanation of the approach to testing the toxicity of the compound in Jurkat cells. Consider incorporating positive controls to strengthen the assessment and clarify the experimental design.

      All the selected compounds in the in silico screening were initially tested for propidium iodide incorporation in treated cells in a toxicity assay, and some of them were discarded for further experiments (e.g., AGR1.103 and VSP3.1).

      Further evaluation of Jurkat cell viability was determined by cell cycle analysis using propidium iodide.  Supplementary Fig. 1B included the percentage of each cell cycle phase, and data indicated no significant differences between the treatments tested. Nevertheless, at the suggestion of the reviewer, and to clarify this issue, positive controls inducing Jurkat cell death (staurosporine and hydrogen peroxide) have also been included in the new Supplementary Fig. 2. The new figure also includes a table showing the percentage of cells in each cell-cycle phase.  

      (14) In the Results section concerning "AGR1.135 and AGR1.137 blocking CXCL12-mediated CXCR4 nanoclustering and dynamics", several points can be improved to enhance clarity and coherence: 1. Specificity of Low Molecular Weight Compounds:  

      -Clearly articulate how AGR1.135 and AGR1.137 specifically target homodimeric CXCR4 and provide an explanation for their lack of impact on heterodimeric CXCR4-CCR5 in that region.

      First of all, we should clarify that when we talk about receptor nanoclustering, oligomers refer to complexes including 3 or more receptors and, therefore, the residues involved in these interactions can differ from those involved in receptor dimerization. Moreover, our FRET experiments did not indicate that the compounds alter receptor dimerization (see new Supplementary Fig. 7). Of note, mutant receptors unable to oligomerize can still form dimers (Martínez-Muñoz L. et al. Mol. Cell 2018; García-Cuesta E.M .et al. Proc. Natl. Acad. Sci. USA 2022). Additionally, we believe that these oligomers can also include other chemokine receptors/proteins expressed at the cell membrane, which we are currently studying using different models and techniques.

      We have results supporting the existence of CCR5/CXCR4 heterodimers (Martínez-Muñoz L et al. Proc. Natl. Acad. Sci. USA 2014), in line with the data published by Di Marino et al. However, in the current study we have not evaluated the impact of the selected compounds on other CXCR4 complexes distinct from CXCR4 oligomers. Our Jurkat cells do not express CCR5 and, therefore, we cannot discuss whether AGR1.137 affects CCR5/CXCR4 heterodimers. The chemokine field is very complex and most receptors can form dimers (homo- and heterodimers) as well as oligomers (Martinez-Muñoz L., et al Pharmacol & Therap. 2011) when co-expressed. To evaluate different receptor combinations in the same experiment is a complex task, as the number of potential combinations between distinct expressed receptors makes the analysis very difficult. We started with CXCR4 as a model, to continue later with other possible CXCR4 complexes. In addition, for the analysis of CCR5/CXCR4 dynamics, it is much better to use dual-TIRF techniques, which allow the simultaneous detection of two distinct molecules coupled to different fluorochromes.

      Regarding the data of Di Marino et al., it is possible that the compounds might also affect heterodimeric conformations of CXCR4. This aspect has also been broached in the revised discussion. We would again note that we evaluated CXCR4 oligomers and not monomers or dimers; this is especially relevant when we compare the residues involved in these processes as they might differ depending on the receptor conformation considered. This issue was also hypothesized by Di Marino et al. (see our response to point 4).

      (15) When referring to "unstimulated" cells, provide a more detailed explanation to elucidate the experimental conditions and cellular state under consideration.

      Unstimulated cells refer to the cells in basal conditions, that is, cells in the absence of CXCL12. For TIRF-M experiments, transiently-transfected Jurkat cells were plated on glass-bottomed microwell dishes coated with fibronectin; these are the unstimulated cells. To observe the effect of the ligand, dishes were coated as above plus CXCL12 (stimulated cells). We have clarified this point in the material and methods section of the revised version.

      (16) 2. Paragraph Organization

      -Reorganize the second paragraph to eliminate redundancy and improve overall flow. A more concise and fluid presentation will facilitate reader comprehension and engagement.

      The second paragraph has been reorganized to improve overall flow.

      (17) Ensure that each paragraph contributes distinct information, avoiding repetition and redundancy.

      We have carefully revised each paragraph of the manuscript to avoid redundancy.

      (18) 3. Claim of Allosteric Antagonism:

      -Exercise caution when asserting that "AGR1.135 and AGR1.137 behave as allosteric antagonists of CXCR4" based on the presented results. Consider rephrasing to reflect that the observed effects suggest the potential allosteric nature of these compounds, acknowledging the need for further investigations and evidence.

      To avoid misinterpretations on the effect of the compounds on CXCR4, as we have commented in our response to point 2, we have substituted the term allosteric inhibitors with negative allosteric modulators, which refer to molecules that act by binding a site distinct from the orthosteric site, and selectively block some downstream signaling pathways, whereas others induced by the same endogenous or orthosteric agonist are unaffected (Gao Z.-G. & Jacobson K.A. Drug Discov. Today Technol. 2013). Our data indicate that the selected small compounds do not block ligand binding or G protein activation or receptor internalization, but inhibit receptor oligomerization and ligand-mediated directed cell migration.

      (19) In the Results section discussing the "incomplete abolition of CXCR4-mediated responses in Jurkat cells by AGR1.135 and AGR1.137", several points can be refined for better clarity and completeness:  1. Inclusion of Positive Controls: 

      -Consider incorporating positive controls in relevant experiments to provide a comparative benchmark for assessing the impact of AGR1.135 and AGR1.137. This addition will strengthen the interpretation of results and enhance the experimental rigor. 

      The in vivo experiments (Fig. 7E,F) used AMD3100, an orthosteric antagonist of CXCR4, as a positive control. We also included AMD3100, as a positive control of inhibition when evaluating the effect of the compounds on CXCL12 binding (Fig. 3, new Supplementary Fig. 3). The revised version of the manuscript also includes the effect of this inhibitor on other relevant CXCL12-mediated responses such as cell migration (Fig. 1B), receptor internalization (Fig. 3A), cAMP production (Fig. 3C), ERK1/2 and AKT phosphorylation (Supplementary Fig. 4), actin polymerization (Fig. 4A), cell polarization (Fig. 4B, C) and cell adhesion (Fig. 4D), to facilitate the interpretation of the results and improve the experimental rigor.

      (20) 2. Clarification of Terminology: 

      -Clarify the term "CXCR4 internalizes" by providing context, perhaps explaining the process of receptor internalization and its relevance to the study.

      We refer to CXCR4 internalization as a CXCL12-mediated endocytosis process that results in reduction of CXCR4 levels on the cell surface. We use CXCR4 internalization in this study with two purposes: First, for CXCR4 and other chemokine receptors, internalization processes are mediated by ligand-induced clathrin vesicles (Venkatesan et al 2003) a process that triggers CXCR4 aggregation in these vesicles. We have previously determined that the oligomers of receptors detected by TIRF-M remain unaltered in cells treated with inhibitors of clathrin vesicle formation and of internalization processes (Martinez-Muñoz L. et al. Mol. Cell 2018). Moreover, we have described a mutant CXCR4 that cannot form oligomers but internalizes normally in response to CXCL12 (Martinez-Muñoz L. et al. Mol. Cell 2018). The observation in this manuscript of normal CXCL12-mediated endocytosis in the presence of the negative allosteric inhibitors of CXCR4 that abrogate receptor oligomerization reinforces the idea that the oligomers detected by TIRF are not related to receptor aggregates involved in endocytosis; Second, receptor internalization is not affected by the allosteric compounds, indicating that they downregulate some CXCL12-mediated signaling events but not others (new Fig. 3).

      All these data have been included in the revised discussion of the manuscript.

      (21) Elaborate on the meaning of "CXCL12 triggers normal CXCR4mut internalization" to enhance reader understanding.

      We have previously described a triple-mutant CXCR4 (K239L/V242A/L246A; CXCR4mut). The mutant residues are located in the N-terminal region of TMVI, close to the cytoplasmic region, thus limiting the CXCR4 pocket described in this study (see our response to point 3). This mutant receptor dimerizes but neither oligomerizes in response to CXCL12 nor supports CXCL12-induced directed cell migration, although it can still trigger some Ca2+ flux and is internalized after ligand activation (Martinez-Muñoz L. et al. Mol. Cell 2018).  We use the behavior of this mutant (CXCR4mut) to show that the CXCR4 oligomers and the complexes involved in internalization processes are not the same and to explain why we evaluated CXCR4 endocytosis in the presence of the negative allosteric modulators.

      As we indicated in a previous answer to the reviewer, these issues have been re-elaborated in the revised version.

      (22) 3. Discrepancy in CXCL12 Concentration:

      -Address the apparent discrepancy between the text stating, "...were stimulated with CXCL12 (50 nM, 37{degree sign}C)," and the figure caption (Fig. 3A) reporting a concentration of 12.5 nM. Rectify this inconsistency and provide an accurate and clear explanation.

      We apologize for this error, which is now corrected in the revised manuscript. With the exception of the cell migration assays in Transwells, where the optimal concentration was established at 12.5 nM, in the remaining experiments the optimal concentration of CXCL12 employed was 50 nM. These concentrations were optimized in previous works of our laboratory using the same type of experiment. We should also remark that in the experiments using lipid bilayers or TIRF-M experiments, CXCL12 is used to coat the plates and therefore it is difficult to determine the real concentration of the ligand that is retained in the surface of the plates after the washing steps performed prior to adding the cells. In addition, we use 100 nM CXCL12 to create the gradient in the chambers used to perform the directed-cell migration experiments.

      (23) 4. Speculation on CXCL12 Binding:

      -Refrain from making speculative statements, such as "These data suggest that none of the antagonists alters CXCL12 binding to CXCR4," unless there is concrete evidence presented up to that point. Clearly outline the results that support this conclusion.

      Figure 3B and Supplementary Figure 3 show CXCL12-ATTO700 binding by flow cytometry in cells pretreated with the negative allosteric modulators. We have also included AMD3100, the orthosteric antagonist, as a control for inhibition. While these experiments showed no major effect of the compounds on CXCL12 binding, we cannot discard small changes in the affinity of the interaction between CXCL12 and CXCR4. In consequence we have re-written these statements.

      (24) 5. Corroboration of Data:

      -Specify where the corroborating data from immunostaining and confocal analysis are reported, ensuring readers can access the relevant information to support the conclusions drawn in this section.

      In agreement with the suggestion of the reviewer, the revised manuscript includes data from immunostaining and confocal analysis to complement Fig. 4B (new Fig. 4C). The revised version also includes some representative videos for the TIRF experiments showed in Figure 2 to clarify readability.

      (25) In the Results section concerning "AGR1.135 and AGR1.137 antagonists and their direct binding to CXCR4", several aspects need clarification and refinement for a more comprehensive and understandable presentation: 1. Workflow Clarification:

      -Clearly articulate the workflow used for assessing the binding of AGR1.135 and AGR1.137 to CXCR4. Address the apparent contradiction between the inability to detect a direct interaction and the utilization of Glide for docking in the TMV-TMVI cleft.

      To address the direct interaction of the compounds with CXCR4, we intentionally avoided the modification of the small compounds with different labels, which could affect their properties. We therefore attempted a fluorescence a spectroscopy strategy to formally prove the ability of the small compounds to bind CXCR4, but this failed because the AGR1.135 is yellow in color, which interfered with the determinations. We also tried a FRET strategy (see new Supplementary Fig. 7) and detected a significant increase in FRET efficiency of CXCR4 homodimers when AGR1.135 was evaluated, but again the yellow color interfered with FRET determinations. Moreover, AGR1.137 did not modify FRET efficiency of CXCR4 dimers. Therefore, we were unable to detect the interaction of the compounds with CXCR4.

      We elected to develop an indirect strategy; in silico, we evaluated the binding-site using docking and molecular dynamics to predict the most promising CXCR4 binding residues involved in the interaction with the selected compounds. Next, we generated point mutant receptors of the predicted residues and re-evaluated the behavior of the allosteric antagonists in a CXCL12-induced cell migration experiment. Obviously, we first discarded those CXCR4 mutants that were not expressed on the cell membrane as well as those that were not functional when activated with CXCL12. Using this strategy, we eliminated the interference due to the physical properties of the compounds and demonstrated that if the antagonism of a compound is reversed in a particular CXCR4 mutant it is because the mutated residue participates or interferes with the interaction between CXCR4 and the compound, thus assuming (albeit indirectly) that the compound binds CXCR4. 

      To select the specific mutations included in the analysis, our strategy was to generate point mutations in residues present in the TMV-TMVI pocket of CXCR4 that were not directly proposed as critical residues involved in chemokine engagement, signal initiation, signal propagation, or G protein-binding, based on the extensive mutational study published by Wescott MP et. al. (Wescott M.P. et. al. Proc. Natl. Acad. Sci. U S A. 2016).

      (26) Provide a cohesive explanation of the transition from docking evaluation to MD analysis, ensuring a transparent representation of the methodology.

      Based on the aim of this work, the workflow shown in Author response image 2, was proposed to predict the binding mode of the selected molecules. Firstly, a CXCR4 model was generated to reconstruct some unresolved parts of the protein structure; then a binding site search using PELE software was performed to identify the most promising binding sites; subsequently, docking studies were performed to refine the binding mode of the molecules; and finally, molecular dynamics simulations were run to determine the most stable poses and predict the residues that we should mutate to test that the compounds interact with CXCR4. 

      Author response image 2.

      Workflow followed to determine the binding mode of the  studied compounds.

      (27) 2. Choice of Software and Techniques:

      -Justify the use of "AMBER14" and the PELE approach, considering  their potential obsolescence.

      These experiments were performed five years ago when the project was initiated. As the reviewer indicates, AMBER14 and PELE approaches might perhaps be considered obsolescent. Thus, we have predicted the structure of the target using AlphaFold (Jumper J. et al, Nature 2021) and the sequence available under UniProt entry P61073. The complete analysis performed (see our response to point 4) confirmed that the compounds bound the selected pocket, as we had originally determined using PELE. These new analyses have been incorporated into the revised manuscript.

      (28)-Discuss the role of the membrane in the receptor-ligand interac7on. Elaborate on how the lipidic double layer may influence the binding of small compounds to GPCRs embedded in the membrane.

      Biological membranes are vital components of living organisms, providing a diffusion barrier that separates cells from the extracellular environment, and compartmentalizing specialized organelles within the cell. In order to maintain the diffusion barrier and to keep it electrochemically sealed, a close interaction of membrane proteins with the lipid bilayer is necessary. It is well known that this is important, as many membrane proteins undergo conformational changes that affect their transmembrane regions and that may regulate their activity, as seen with GPCRs (Daemen F.J. & Bonting S.L., Biophys. Struct. Mech. 1977; Gether U. et al. EMBO J. 1997). The lateral and rotational mobility of membrane lipids supports the sealing function while allowing for the structural rearrangement of membrane proteins, as they can adhere to the surface of integral membrane proteins and flexibly adjust to a changing microenvironment. In the case of the first atomistic structure of CXCR4 (Wu B. et al. Science 2010), it was indicated that for dimers, monomers interact only at the extracellular side of helices V and VI, leaving at least a 4-Å gap between the intracellular regions, which is presumably filled by lipids. In particular, they indicated that the channel between TMV and TMVI that connects the orthosteric chemokine binding pocket to the lipid bilayer is occupied by an oleic acid molecule. Recently, Di Marino et al., analyzing the dimeric structure of CXCR4, found a cholesterol molecule placed in between the two protomers, where it engages a series of hydrophobic interactions with residues located in the area between TMI and TMVI (Leu132, Val214, Leu216, Leu246, and Phe249). The polar head of cholesterol forms an H-bond with Tyr135 that further stabilizes its binding mode. This finding confirms that cholesterol might play an important role in mediating and stabilizing receptor dimerization, as seen in other GPCRs (Pluhackova, K., et al. PLoS Comput. Biol. 2016). In addition, we have previously observed that, independently of the structural changes on CXCR4 triggered by lipids, the local lipid environment also regulates CXCR4 organization, dynamics and function at the cell membrane and modulates chemokine-triggered directed cell migration. Prolonged treatment of T cells with bacterial sphingomyelinase promoted the complete and sustained breakdown of sphingomyelins and the accumulation of the corresponding ceramides, which altered both membrane fluidity and CXCR4 nanoclustering and dynamics. Under these conditions, CXCR4 retained some CXCL12-mediated signaling activity but failed to promote efficient directed cell migration (Gardeta S.R. et al. Front. Immunol. 2022). Collectively, these data demonstrate the key role that lipids play in the stabilization of CXCR4 conformations and in regulating its lateral mobility, influencing their associated functions. These considerations have been included in the revised version of the manuscript. 

      (29) 3. Stable Trajectories and Binding Mode Superimposi7on -Specify the criteria for defining "stable trajectories" to enhance reader understanding

      There could be several ways to describe the stability of a MD simulation, based on the convergence of energies, distances or ligand-target interactions, among others. In this work, we use the expression “stable trajectories” to refer to simulations in which the ligand trajectory converges and the ligand RMSD does not fluctuate more than 0.25Å. This definition is now included in the revised text.

      (30)  Clarify the meaning behind superimposing the two small compounds and ensure that the statement in the figure caption aligns with the information presented in the main text.

      We apologize for the error in the previous Fig. 5A and in its legend. The figure was created by superimposing the protein component of the poses for the two compounds, AGR1.135 and AGR1.137, rather than the compounds themselves. As panel 5A was confusing, we have modified all Fig. 5 in the revised manuscript to improve clarity.

      (31) 4. Volume Analysis and Distances:

      -Provide details on how the volume analysis was computed and how distances were accounted for. Consider adding a figure to illustrate these analyses, aiding reader comprehension.

      The cleft search and analysis were performed using the default settings of SURFNET (Laskowski R.A. J. Mol. Graph. 1995) included in the PDBsum server (Laskowski R.A. et. al. Trends Biochem. Sci. 1997). The first run of the input model for CXCR4 3ODU identified a promising cleft of 870 Å3 in the lower half of the region flanked by TMV and TMVI, highlighting this area as a possible small molecule binding site (Fig. I, only for review purposes). Analysis of the cleft occupied by AGR1.135 showed two independent cavities of 434 Å3 and 1381 Å3 that were not connected to the orthosteric site. The same procedure for AGR1.137 revealed two distinct clefts of 790 Å3 and 580 Å3, respectively (Fig. I, only for review purposes). Analysis of the atomic distances between the protein residues and the compounds was performed using the PISA server. Krissinel E. & Henrick K. J. Mol. Biol. 2007). (Please see our response to point 3 and the corresponding figure).

      (32) 5. Mutant Selection and Relevance:

      -Clarify the rationale behind selecting the CXCR4 mutants used in the study. Consider justifying the choice and exploring the possibility of performing an alanine (ALA) scan for a more comprehensive mutational analysis.  

      The selection of the residues to be mutated along the cleft was first based on their presence in the proposed cleft and the direct interaction of the compounds with them, either by hydrogen bonding or by hydrophobic interactions. Secondly, all mutated residues did not belong to any of the critical residues involved in transmitting the signal generated by the interaction of CXCL12 with the receptor. In any case, mutants producing a non-functional CXCR4 at the cell membrane were discarded after FACS analysis and chemotaxis experiments. Finally, the length and nature of the resulting mutations were designed mainly to occlude the cleft in case of the introduction of long residues such as lysines (I204K, L208K) or to alter hydrophobic interactions by changing the carbon side chain composition of the residues in the cleft. Indeed, we agree that the alanine scan mutation analysis would have been an alternative strategy to evaluate the residues involved in the interactions of the compounds. 

      (33) Reevaluate the statement regarding the relevance of the Y256F muta7on for the binding of AGR1.137. If there is a significant impact on migra7on in the mutant (Fig. 6B), elaborate on the significance in the context of AGR1.137 binding.

      In the revised discussion we provide more detail on the relevance of Y256F mutation for the binding of AGR1.137 as well as for the partial effect of G207I and R235L mutations. The predicted interactions for each compound are depicted in new Fig. 6 C, D after LigPlot+ analysis (Laskowski R.A. & Swindells M.B. J. Chem. Inf. Model. 2011), showing that AGR1.135 interacted directly with the receptor through a hydrogen bond with Y256. When this residue was mutated to F, one of the anchor points for the compound was lost, weakening the potential interaction in the region of the upper anchor point.

      It is not clear how the Y256F mutation will affect the binding of AGR1.137, but other potential contacts cannot be ruled out since that portion of the compound is identical in both AGR1.135 and AGR1.137. This is especially true for its neighboring residues in the alpha helix, F249, L208, as shown in 3ODU structure (Fig. 6D), which are shown to be directly implicated in the interaction of both compounds. Alternatively, we cannot discard that Y256 interacts with other TMs or lipids stabilizing the overall structure, which could reverse the effect of the mutant at a later stage (Author response image 3).

      Author response image 3.

      Cartoon representation of Y256 and its intramolecular interactions in the CXCR4 Xray solved structure 3ODU. TMV helix is colored in blue and TMVI in pink.

      (34) Address the apparent discrepancy in residue involvement between AGR1.135 and AGR1.137, particularly if they share the same binding mode in the same clef.

      AGR1.135 and AGR1.137 exhibit comparable yet distinct binding modes, engaging with CXCR4 within a molecular cavity formed by TMV and TMVI. AGR1.135 binds to CXCR4 through three hydrogen bonds, two on the apical side of the compound that interact with residues TMV-G207 and TMVI-Y256 and one on the basal side that interacts with TMVI-R235 (Fig. 5A). This results in a more extended and rigid conformation when sharing hydrogen bonds, with both TMs occupying a surface area of 400 Å2 and a length of 20 Å in the cleft between TMV and TMVI (Supplementary Fig. 8A). AGR1.137 exhibits a distinct binding profile, interacting with a more internal region of the receptor. This interaction involves the formation of a hydrogen bond with TMIIIV124, which induces a conformational shift in the TMVI helix towards an active conformation (Fig. 5B; Supplementary Fig. 13). Moreover, AGR1.137 may utilize the carboxyl group of V124 in TMIII and overlap with AGR1.135 binding in the cavity, interacting with the other 19 residues dispersed between TMV and VI to create an interaction surface of 370 Å2 along 20 Å (Supplementary Fig. 8B). This is illustrated in the new Fig. 5B. AGR1.137 lacks the phenyl ring present in AGR1.135, resulting in a shorter compound with greater difficulty in reaching the lower part of TMVI where R235 sits. 

      Author response image 4.

      AGR1.135 and AGR1.137 interaction with TMV and TMVI.  The model shows the location of the compounds within the TMV-VI cleft, illustrated by a ribbon and stick representation. The CXCR4 segments of TMV and TMVI are represented in blue and pink ribbons respectively, and side chains for some of the residues defining the cavity are shown in sticks. AGR1.135 and AGR1.137 are shown in stick representation with carbon in yellow, nitrogen in blue, oxygen in red, and fluorine in green. Hydrogen bonds are indicated by dashed black lines, while hydrophobic interactions are shown in green. The figure reproduces the panels A, B of Fig. 5 in the revised manuscript.

      (35) In the Results sec7on regarding "AGR1.137 treatment in a zebrafish xenograf model", the following points can be refined for clarity and completeness: 1. Cell Line Choice for Zebrafish Xenograft Model:

      -Explain the rationale behind the choice of HeLa cells for the zebrafish xenograft model when the previous experiments primarily focused on Jurkat cells. Address any specific biological or experimental considerations that influenced this decision.

      As far as we know, there are no available models of tumors in zebrafish using Jurkat cells. We looked for a tumoral cell system that expresses CXCR4 and could be transplanted into zebrafish. HeLa cells are derived from a human cervical tumor, express a functional CXCR4, and have been previously used for tumorigenesis analyses in zebrafish (Brown H.K. et al. Expert Opin. Drug Discover. 2017; You Y. et al Front. Pharmacol. 2020). These cells grow in the fish and disseminate through the ventral area and can be used to determine primary tumor growth and metastasis. Nonetheless, we first analyzed in vitro the expression of a functional CXCR4 in these cells (Supplementary Fig. 10A), whether AGR1.137 treatment specifically abrogated CXCL12-mediated direct cell migration (Fig. 7A, B), as whether it affected cell proliferation (Supplementary Fig. 10B). As HeLa cells reproduce the in vitro effects detected for the compounds in Jurkat cells, we used this model in zebrafish. These issues were already discussed in the first version of our manuscript. 

      (36) 2. Toxicity Assessment in Zebrafish Embryos: 

      -Clarify the basis for stating that AGR1.137 is not toxic to zebrafish embryos. Consider referencing the Zebrafish Embryo Acute Toxicity Test (ZFET) and provide relevant data on lethal concentration (LC50) and non-lethal toxic phenotypes such as pericardial edema, head and tail necrosis, malformation, brain hemorrhage, or yolk sac edema.

      Tumor growth and metastasis kinetics within the zebrafish model have been extensively evaluated in many publications (White R. et al. Nat. Rev. Cancer. 2013; Astell K.R. and Sieger D. Cold Spring Harb. Perspect. Med. 2020; Chen X. et al. Front. Cell Dev. Biol. 2021; Weiss JM. Et al. eLife 2022; Lindhal G. et al NPJ Precis. Oncol. 2024). Our previous experience using this model shows that tumors start having a more pronounced proliferation and lower degree of apoptosis from day 4 onwards, but we cannot keep the tumor-baring larvae for that long due to ethical reasons and also because we don’t see much scientific benefit of unnecessarily extending the experiments. Anti-proliferative or pro-apoptotic effects of drugs can still be observed within the three days, even if this is then commonly seen as larger reduction (instead of a smaller growth as it is commonly seen in for example mouse tumor models) compared to controls. Initially we characterized the evolution of implanted tumors in our system and how much they metastasize over time in the absence of treatment before to test the compounds (Author response image 5).

      The in vivo experiments were planned to validate efficacious concentrations of the investigated drugs rather than to derive in vivo IC50 or other values, which require testing of multiple doses. We have, however, included an additional concentration to show concentration-dependence and therefore on-target specificity of the drugs in the revised version of the manuscript (data also being elaborated in ongoing experiments). At this stage, we believe that adding the LC50 does not provide interesting new knowledge, and it is standard to only show results from the experimental endpoint (in our case 3 days post implantation). We agree that showing these new data points strengthens the manuscript and facilitates independent evaluation and conclusions to be drawn from the presented data. We have created new graphs where datapoints for each compound dose are shown.  

      Author response image 5.

      Evolution of the tumors and metastasis along the time in the absence of any treatment. HeLa cells were labeled with 8 µg/mL Fast-DiI™ oil and then implanted in the dorsal perivitelline space of 2-days old zebrafish embryos. Tumors were imaged within 2 hours of implantation and re-imaged each 24 h for three days. Changes in tumor size was evaluated as tumor area at day 1, 2 and 3 divided by tumor area at day 0, and metastasis was evaluated as the number of cells disseminated to the caudal hematopoietic plexus at day 1, 2 and 3 divided by the number of cells at day  3.

      Regarding the statement that AGR1.137 was not toxic, this was based on visual inspection of the zebrafish larvae at the end of the experiment, which also revealed a lack of drug-related mortality in these experiments. There are a number of differences in how our experiment was run compared with the standardized ZFET. ZFET evaluates toxicity from 0 hours post-fertilization to 1 or 2 days post-fertilization, whereas here we exposed zebrafish from 2 days post-fertilization to 5 days post-fertilization. The ZFET furthermore requires that the embryos are raised at 26ºC whereas kept the temperature as close as possible to a physiologically relevant temperature for the tumor cells (36ºC). In the ZFET, embryos are incubated in 96-well plates whereas for our studies we required larger wells to be able to manipulate the larvae and avoid well edge-related imaging artefacts, and we therefore used 24-well plates. As such, the ZFET was for various reasons not applicable to our experimental settings. As we were not interested in rigorously determining the LD50 or other toxicity-related measurements, as our focus was instead on efficacy and we found that the targeted dose was tolerated, we did not evaluate multiple doses, including lethal doses of the drug, and are therefore not able to determine an LD50/LC50. We also did not find drug-induced non-lethal toxic phenotypes in this study, and so we cannot elaborate further on such phenotypes other than to simply state that the drug is well tolerated at the given doses. Therefore, the reference to ZFET in the manuscript was eliminated.

      (37) If supplementary information is available, consider providing it for a comprehensive understanding of toxicity assessments. 

      The effective concentration used in the zebrafish study was derived from the in vitro experiments. That being said, and as elaborated in our response to comment 36, we have added data for one additional dose to show the dose-dependent regulation of tumor growth and metastasis. 

      (38) 3. Optimization and Development of AGR1.137: 

      -Justify the need for further optimization and development of AGR1.137 if it has a comparable effect to AMD3100. Explain the specific advantages or improvements that AGR1.137 may offer over AMD3100. 

      AGR1.137 is highly hydrophobic and is very difficult to handle, particularly in in vivo assays; thus, for the negative allosteric modulators to be used clinically, it would be very important to increase their solubility in water. Contrastingly, AMD3100 is a water-soluble compound. Before using the zebrafish model, we performed several experiments in mice using AGR1.137, but the inhibitory results were highly variable, probably due to its hydrophobicity. We also believe that it would be important to increase the affinity of AGR1.137 for CXCR4, as the use of lower concentrations of the negative allosteric modulator would limit potential in vivo side effects of the drug. On the other hand, we are also evaluating distinct administration alternatives, including encapsulation of the compounds in different vehicles. These alternatives may also require modifications of the compounds. 

      AMD3100 is an orthosteric inhibitor and therefore blocks all the signaling cascades triggered by CXCL12. For instance, we observed that AMD3100 treatment blocked CXCL12 binding, cAMP inhibition, calcium flux, cell adhesion and cell migration (Fig. 3, Fig. 4), whereas the effects of AGR1.137 were restricted to CXCL12-mediated directed cell migration. Although AMD3100 was well tolerated by healthy volunteers in a singledose study, it also promoted some mild and reversible events, including white blood cells count elevations and variations of urine calcium just beyond the reported normal range (Hendrix C.W. et al. Antimicrob. Agents Chemother. 2000). To treat viral infections, continuous daily dosing requirements of AMD3100 were impractical due to severe side effects including cardiac arrhythmias (De Clercq E. Front Immunol. 2015). For AMD3100 to be used clinically, it would be critical to control the timing of administration. In addition, side effects after long-term administration have potential problems. Shorter-term usage and lower doses would be fundamental keys to its success in clinical use (Liu T.Y. et al. Exp. Hematol. Oncol. 2016). The use of a negative allosteric modulator that block cell migration but do not affect other signaling pathways triggered by CXCL12 would be, at least in theory, more specific and produce less side effects. These ideas have been incorporated into the revised discussion to reflect potential advantages or improvements that AGR1.137 may offer over AMD3100.

      (39) 4. Discrepancy in AGR1.137 and AMD3100 Effects:

      -Discuss the observed discrepancy where AGR1.137 exhibits similar effects to AMD3100 but only after 48 hours. Provide insights into the temporal dynamics of their actions and potential implications for the experimental design.

      Images and data shown in Fig. 7E, F correspond to days 0 and 3 after HeLa cell implantation (tumorigenesis) and only to day 3 in the case of metastasis data. The revised version contains the effect of two distinct doses of the compounds (10 and 50 µM, for AGR1.135 and AGR1.137 and 1 and 10 µM for AMD3100). 

      (40) In the "Discussion" section, there are several points that require clarifica7on and refinement to enhance the overall coherence and depth of the analysis:  1. Reduction of Side-Effects: 

      -Provide a more detailed explanation of how the identified compounds, specifically AGR1.135 and AGR1.137, contribute to the reduction of side effects. Consider discussing specific mechanisms or characteristics that differentiate these compounds from existing antagonists.

      The sentence indicating that AGR1.135 and AGR1.137 contribute to reduce side effects is entirely speculative, as we have no experimental evidence to support it. We have therefore corrected this in the revised version. The origin of the sentence was that orthosteric antagonists typically bind to the same site as the endogenous ligand, thus blocking its interaction with the receptor. Therefore, orthosteric inhibitors (i.e. AMD3100) block all signaling cascades triggered by the ligand and therefore their functional consequences. However, the compounds described in this project are essentially negative allosteric modulators, that is, they bind to a site distinct from the orthosteric site, inducing a conformational change in the receptor that does not alter the binding of the endogenous ligand, and therefore block some specific receptor-associated functions without altering others. We observed that AGR1.137 blocked receptor oligomerization and directed cell migration whereas CXCL12 still bound CXCR4, triggered calcium mobilization, did not inhibit cAMP release or promoted receptor internalization. This is why we speculated on the limitation of side effects. The statements have been nonetheless revised in the new version of the manuscript.

      (41) 2. Binding Site Clarification:

      -Address the apparent discrepancy between docking the small compounds in a narrow cleft formed by TMV and TMVI helices and the statement that AGR1.131 binds elsewhere. Clarify the rationale behind this assertion

      After the in silico screening, a total of 40 compounds were selected.  These compounds showed distinct degrees of interaction with the cleft formed by TMV and TMVI and even with other potential interaction sites on CXCR4, with the exception of the ligand binding site according to the data described by Wescott et al. (PNAS 2016 113:9928-9933), as this possibility was discarded in the initial approach of the in silico screening. According to PELE analysis, AGR1.131 was one of the 40 selected compounds that showed a pose with low binding energy, -39.8 kcal/mol, between TMV and TMVI helices, that is, it might interact with CXCR4 through the selected area for the screening. It nonetheless also showed a best pose placed between helices TMI and TMVII, -43.7 kcal/mol. In any case, the compound was included in the biological screening, where it was unable to impact CXCL12-mediated chemotaxis (Fig. 1B). We then focused on AGR1.135 and AGR1.137, as showed a higher inhibitory effect on CXCL12-mediated migration, and on AGR1.131 as an internal negative control. AGR1.131 has a skeleton very similar to the other compounds (Fig. 1C) and can interact with the TM domains of CXCR4 without promoting effects. None of the three compounds affected CXCL12 binding, or CXCL12mediated inhibition of cAMP release, or receptor internalization. However, whereas AGR1.135 and AGR1.137, blocked CXCL12-mediated CXCR4 oligomerization and directed cell migration towards CXCL12 gradients, AGR1.131 had no effect in these experiments (Fig. 3, Fig.  4). 

      Next, we performed additional theoretical calculations (PELE, docking, MD) to inspect in detail the potential binding modes of active and inactive molecules. Based on these additional calculations, we identified that whereas AGR1.135 and AGR1.137 showed preferent binding on the molecular pocket between TMV and TMVI, the best pose for AGR1.131 was located between TMI and TMVII, as the initial experiments indicated.  These observations and data have been clarified in the revised discussion. 

      (42) 3. Impact of Chemical Modifications:

      -Discuss the consequences of the distinct chemical groups in AGR1.135, AGR1.137, and AGR1.131, specifically addressing how variations in amine length and chemical nature may influence binding affinity and biological activity. Provide insights into the potential effects of these modifications on cellular responses and the observed outcomes in zebrafish. 

      The main difference between AGR1.131 and the other two compounds is the higher flexibility of AGR1.131 due to the additional CH2 linker, together with the lack of a piperazine ring. The additional CH2 linking the phenyl ring increases the flexibility of AGR1.131 when compared with AGR1.135 and AGR1.137, and the absence of the piperazine ring might be responsible for its lack of activity, as it makes this compound able to bind to CXCR4 (Fig. 1C).

      AGR1.137 was chosen in a second round. The additional presence of the tertiary amine (in the piperazine ring) allows the formation of quaternary ammonium salts in the aqueous medium and its substituents to increase its solubility (Fig 1C). This characteristic might be related to the absence of toxic effects of the compound in the zebrafish model.

      (43) 4. Existence of Distinct CXCR4 Conformational States: 

      -Provide more detailed support for the statement suggesting the "existence of distinct CXCR4 conformational states" responsible for activating different signaling pathways. Consider referencing relevant studies or experiments that support this claim.

      Classical models of GPCR allostery and activation, which describe an equilibrium between a single inactive and a single signaling-competent active conformation, cannot account for the complex pharmacology of these receptors. The emerging view is that GPCRs are highly dynamic proteins, and ligands with varying pharmacological properties differentially modulate the balance between multiple conformations.

      Just as a single photograph from one angle cannot capture all aspects of an object in movement, no one biophysical method can visualize all aspects of GPCR activation. In general, there is a tradeoff between high-resolution information on the entire protein versus dynamic information on limited regions. In the former category, crystal and cryo-electron microscopy (cryoEM) structures have provided comprehensive, atomic-resolution snapshots of scores of GPCRs both in inactive and active conformations, revealing conserved conformational changes associated with activation. However, different GPCRs vary considerably in the magnitude and nature of the conformational changes in the orthosteric ligand-binding site following agonist binding (Venkatakrishnan A.J.V. et al. Nature 2016). Spectroscopic and computational approaches provide complementary information, highlighting the role of conformational dynamics in GPCR activation (Latorraca N.R.V. et al. Chem. Rev 2017). In the absence of agonists, the receptor population is typically dominated by conformations closely related to those observed in inactive-state crystal structures (Manglik A. et al. Cell 2015). While agonist binding drives the receptor population towards conformations similar to those in activestate structures, a mixture of inactive and active conformations remains, reflecting “loose” or incomplete allosteric coupling between the orthosteric and transducer pockets (Dror R.O. et al. Proc. Natl. Acad. Sci. USA 2011). Surprisingly, for some GPCRs, and under some experimental conditions, a substantial fraction of unliganded receptors already reside in an active-like conformation, which may be related to their level of basal or constitutive signaling (Staus D.P. et al. J. Biol. Chem. 2019);  Ye L. et al. Nature 2016).  In our case, the negative allosteric modulators, (Staus DP, et al. J. Biol. Chem 2019); Ye L. et al. Nature 2016) did not alter ligand binding and had only minor effects on specific CXCL12-mediated functions such as inhibition of cAMP release or receptor internalization, among others, but failed to regulate CXCL12-mediated actin dynamics and receptor oligomerization. Collectively, these data suggest that the described compounds alter the active conformation of CXCR4 and therefore support the presence of distinct receptor conformations that explain a partial activation of the signaling cascade.

      All these observations are now included in the revised discussion of the manuscript.

      (44) 5. Equilibrium Shift and Allosteric Ligands: 

      -Clarify the statement about "allosteric ligands shifting the equilibrium to favor a particular receptor conformation". Support this suggestion with references or experimental evidence

      In a previous answer (see our response to point 2), we explain why we define the compounds as negative allosteric modulators. These compounds do not bind the orthosteric binding site or a site distinct from the orthosteric site that alters the ligand-binding site. Their effect should be due to changes in the active conformation of CXCR4, which allow some signaling events whereas others are blocked. Our functional data thus support that through the same receptor the compounds separate distinct receptor-mediated signaling cascades, that is, our data suggest that CXCR4 has a conformational heterogeneity. It is known that GPCRs exhibit more than one “inactive” and “active” conformation, and the endogenous agonists stabilize a mixture of multiple conformations. Biased ligands or allosteric modulators can achieve their distinctive signaling profiles by modulating this distribution of receptor conformations. (Wingler L.M. & Lefkowitz R.J. Trends Cell Biol. 2020). For instance, some analogs of angiotensin II do not appreciably activate Gq signaling (e.g., increases in IP3 and Ca2+) but still induce receptor phosphorylation, internalization, and mitogen-activated protein kinase (MAPK) signaling (Wei H, et al. Proc. Natl. Acad. Sci. USA 2003). Some of these ligands activate Gi and G12 in bioluminescence resonance energy transfer (BRET) experiments (Namkung Y. et al. Sci. Signal. 2018). A similar observation was described in the case of CCR5, where some chemokine analogs promoted G protein subtype-specific signaling bias (Lorenzen E. et al. Sci. Signal 2018). Structural analysis of distinct GPCRs in the presence of different ligands vary considerably in the magnitude and nature of the conformational changes in the orthosteric ligand-binding site following agonist binding (Venkatakrishnan A.J.V. et al. Nature 2016). Yet, these changes modify conserved motifs in the interior of the receptor core and induce common conformational changes in the intracellular site involved in signal transduction. That is, these modifications might be considered distinct receptor conformations. 

      The revised discussion contains some of these interpretations to support our statement about the stabilization of a particular receptor conformation triggered by the negative allosteric modulators. 

      (45) 6. Refinement of Binding Mode: 

      -Clarify the workflow for obtaining the binding mode, particularly the role of GLIDE and PELE. Clearly explain how these software tools were used in tandem to refine the binding mode. 

      The computational sequential workflow applied in this project included, i) Protein model construction, ii) Virtual screening (Glide), iii) PELE, iv) Docking (AutoDock and Glide) and v) Molecular Dynamics (AMBER).

      Glide was applied for the structure-based virtual screening to explore which compounds could fit and interact with the previously selected binding site.

      After the identification of theoretically active compounds (modulators of CXCR4), additional calculations were done to identify a potential binding site. PELE was used in this sense, to study how the compounds could bind in the whole surface of the target (TMV-TMVI). By applying PELE, we avoided biasing the calculation, and we found that the trajectories with better interaction energies identified the cleft between TMV and TMVI as the binding site for AGR1.135 and AGR1.137, and not for AGR1.131. AGR1.131 showed a pose with low binding energy, -39.8 kcal/mol, between TMV and TMVI helices, that is, it might interact with CXCR4 in the selected area for the screening. But it also showed a better pose placed between helices TMI and TMVII, - 43.7 kcal/mol (see our response to point 41). These data have been now confirmed using Schrodinger’s MM-GBSA procedure (see our response to points 6 and 8). In any case, the compound was included in the biological screening, where it was unable to affect CXCL12-mediated chemotaxis (Fig. 1B). Docking and MD simulations were then performed to study and refine the specific binding mode in this cavity. These data were important to choose the mutations on CXCR4 required, to test whether the compounds reversed its behavior. In these experiments we also confirmed that AGR1.131 had a better pose on the TMI-TMVII region. 

      (46) 7. Impact of Compound Differences on CXCR4-F249L mutant: 

      -Provide visual aids, such as figures, and additional experiments to support the statement about differences in the behavior of AGR1.135 and AGR1.137 on cells expressing CXCR4-F249L mutant. Elaborate on the closer interaction suggested between the triazole group of AGR1.137 and the F249 residue

      At the reviewer’s suggestion, Fig. 5 has been modified to incorporate a closer view of the interactions identified and new panels in new Fig. 6 have been added to show in detail the effect of the mutations selected on the structure of the cleft between TMV and TMVI. The main difference between AGR1.135 and AGR1.137 is how the triazole group interacts with F249 and L216 (Author response image 6). In AGR1.137, the three groups are aligned in a parallel organization, which appears to be more effective: This might be due to a better adaptation of this compound to the cleft since there is only one hydrogen bond with V124. In AGR1.135, the compound interacts with the phenyl ring of F249 and has a stronger interaction at the apical edge to stabilize its position in the cleft. However, there is still an additional interaction present. When changing F249

      Author response image 6.

      Cartoon representation of the interaction of CXCR4 F249L mutant with AGR1.135 (A) and AGR1.137 (B). The two most probable conformations of Leucine rotamers are represented in cyan A and B conformations. Van der Waals interactions are depicted in blue cyan dashed lines, hydrogen bonds in black dashed lines. CXCR4 segments of TMV and TMVI are colored in blue and pink, respectively

      to L (Fig. VIIA, B, only for review purposes) and showing the two most likely rotamers resulting from the mutation, it is observed that rotamer B is in close proximity to the compound, which may cause the binding to either displace or adopt an alternative conformation that is easier to bind into the cleft. As previously mentioned, it is likely that AGR1.135 can displace the mutant rotamer and bind into the cleft more easily due to its higher affinity.

      (47) In the "Materials and Methods" section, the computational approach for the "discovery of CXCR4 modulators" requires significant revision and clarification. The following suggestions aim to address the identified issues: 1. Structural Modeling: 

      -Reconsider the use of SWISS-MODEL if there is an available PDB code for the entire CXCR4 structure. Clearly articulate the rationale for choosing one method over the other and explain any limitations associated with the selected approach. 

      The SWISS-model server allows for automated comparative modeling of 3D protein structures that was pioneered in the fields of automated modeling. At the time we started this project. it was the most accurate method to generate reliable 3D protein structure models.

      As explained above, we have now predicted the structure of the target using AlphaFold (Jumper J. et al, Nature 2021) and performed several additional experiments that confirm that the small compounds bind the selected pocket as the original strategy indicated (see our response to point 6). (Fig. II, only for review purposes).

      (48) 2. Parametriza7on of Small Compounds: 

      -Provide a detailed description of the parametrization process for the small compounds used in the study. Specify the force field and parameters employed, considering the obsolescence of AMBER14 and ff14SB. Consider adopting more contemporary force fields and parameterization strategies. 

      When we performed these experiments, some years ago, the force fields applied (ff14SB, AMBER14 used in MD or OPLS2004 in docking with Glide) were well accepted and were gold standards. It is, however, true that the force fields have evolved in the past few years, Moreover, in the case of the MD simulations, to consider the parameters of the ligands that are not contained within the force field, we performed an additional parameterization as a standard methodology. We then generated an Ab initio optimization of the ligand geometry, defining as basis sets B3LYP 6-311+g(d), using Gaussian 09, Revision A.02, and then a single point energy calculation of ESP charges, with HF 6311+g(d) on the optimized structure. As the last step of the parametrization, the antechamber module was used to adapt these charges and additional parameters for MD simulations.

      (49) 3. Treatment of Lipids and Membrane: 

      -Elaborate on how lipids were treated in the system. Clearly describe whether a membrane was included in the simulations and provide details on its composition and structure. Address the role of the membrane in the study and its relevance to the interactions between CXCR4 and small compounds 

      To stabilize CXCR4 and more accurately reproduce the real environment in the MD simulation, the system was embedded in a lipid bilayer using the Membrane Builder tool (Sunhwan J. et al. Biophys. J. 2009) from the CHARMM-GUI server. The membrane was composed of 175 molecules of the fatty acid 1-palmitoyl-2-oleoyl-sn-glycero-3phosphocholine (POPC) in each leaflet. The protein-membrane complex was solvated with TIP3 water molecules. Chloride ions were added up to a concentration of 0.15 M in water, and sodium ions were added to neutralize the system. This information was previously described in detail.

      (50) 4. Molecular Dynamics Protocol: 

      -Provide a more detailed and coherent explanation of the molecular dynamics protocol. Clarify the specific steps, parameters, and conditions used in the simulations. Ensure that the protocol aligns with established best practices in the field.

      Simulations were calculated on an Asus 1151 h170 LVX-GTX-980Ti workstation, with an Intel Core i7-6500 K Processor (12 M Cache, 3.40 GHz) and 16 GB DDR4 2133 MHz RAM, equipped with a Nvidia GeForce GTX 980Ti available for GPU (Graphics Processing Unit) computations. MD simulations were performed using AMBER14 (Case D.A. et al. AMBERT 14, Univ. of California, San Francisco, USA, 2014) with ff14SB (Maier J.A. et al. J. Chem. Theory Comput. 2015) and lipid14 (Dickson C. J. et al. J. Chem. Theory Comput. 2014) force fields in the NPT thermodynamic ensemble (constant pressure and temperature). Minimization was performed using 3500 Steepest Descent steps and 4500 Conjugate Gradient steps three times, firstly considering only hydrogens, next considering only water molecules and ions, and finally minimizing all atoms. Equilibration raises system temperature from 0 to 300 K at a constant volume fixing everything but ions and water molecules. After thermalization, several density equilibration phases were performed. In the production phase, 50 ns MD simulations without position restraints were calculated using a time step of 2 fs. Trajectories of the most interesting poses were extended to 150 ns. All bonds involving hydrogen atoms were constrained with the SHAKE algorithm (Lippert R.A. et al. J. Chem. Phys. 2007). A cutoff of 8 Å was used for the Lennard-Jones interaction and the short-range electrostatic interactions. Berendsen barostat (Berendsen H.J. et al. J. Chem. Phys.  1984) and Langevin thermostat were used to regulate the system pression and temperature, respectively. All trajectories were processed using CPPTRAJ (Roe D.R. & Cheatham III T.E. J. Chem. Theory Comput. 2013) and visualized with VMD (Visual Molecular Dynamics) (Humphrey W. et al. J. Mol. Graphics. 1996). To reduce the complexity of the data, Principal Component Analysis (PCA) was performed on the trajectories using CPPTRAJ.

      (51) Consider updating the molecular dynamics protocol to incorporate more contemporary methodologies, considering advancements in simulation techniques and software.

      In our answer to points 6 and 47, we describe why we use the technology based on Swiss-model and PELE analysis and how we have now used Alphafold and other more contemporary methodologies to confirm that the small compounds bind the selected pocket.

      (52) Figure 1A: 

      •  Consider switching to a cavity representation for CXCL12 to enhance clarity and emphasize the cleft.

      Fig. 1A has been modified to emphasize the cleft.

      (53) Explicitly show the TMV-TMVI cleft in the figure for a more comprehensive visualization. 

      In Fig. 1A we have added an insert to facilitate TMV-TMVI visualization.

      (54) Figure 1B: 

      •  Clearly explain the meaning of the second DMSO barplot to avoid confusion. 

      To clarify this panel, we have modified the figure and the figure legend. Panel B now includes a complete titration of the three compounds analyzed in the manuscript.  The first bar shows cell migration in the absence of both treatment with AMD3100 and stimulation with CXCL12.  The second bar shows migration in response to CXCL12 in the absence of AMD3100. The third bar shows the effect of AMD3100 on CXCL12-induced migration, as a known control of inhibition of migration.  We hope that this new representation of the data results is clearer.

      (55) Figure 1C: 

      •  Provide a clear legend explaining the significance of the green shading on the small compounds. 

      The legend for Fig. 1C has been modified accordingly to the reviewer’s suggestion.

      (56) Figure 2: 

      •  Elaborate on the role of fibronectin in the experiment and explain the specific contribution of CD86-AcGFP.

      The ideal situation for TIRF-M determinations is to employ cells on a physiological substrate complemented with or without chemokines. Fibronectin is a substrate widely used in different studies that allows cell adhesion, mimicking a physiological situation. Jurkat cells express alpha4beta1 and alpha5beta1 integrins that mediate adhesion to fibronectin (Seminario M.C. et al. J. Leuk. Biol. 1999).

      Regarding the use of CD86-AcGFP in TIRF-M experiments. We currently determine the number of receptors in individual trajectories of CXCR4 using, as a reference, the MSI value of CD86-AcGFP that strictly showed a single photobleaching step (Dorsch S. et al. Nat Methods 2009).

      We preferred to use CD86-AcGFP in cells instead of AcGFP on glass, to exclude any potential effect on the different photodynamics exhibited by AcGFP when bound directly to glass. In any case, this issue has been clarified in the revised version.

      (57) Figure 3D: 

      •  Include a plot for the respective band intensity to enhance data presentation 

      The plot showing the band intensity analysis of the experiments shown in Fig. 3D was already included in the original version (see old Supplementary Fig. 3). However, in the revised version, we include these plots in the same figure as panels 3E and 3F.  As a control of inhibition of CXCL12 stimulation, we have also included a new figure (Supplementary Fig. 4) showing the effect of AMD3100 on CXCL12-induced activation of Akt and ERK as analyzed by western blot.

      (58) Consider adding AMD3100 as a control for comparison. 

      In agreement with the reviewer’s suggestion, we have added the effect of AMD3100 in most of the functional experiments performed.

      (59) Figure 4: 

      •  Address the lack of positive controls in Figure 4 and consider their inclusion for a more comprehensive analysis. 

      DMSO bars correspond to the control of the experiment, as they represent the effect of CXCL12 in the absence of any allosteric modulator. As previously described in this point-by-point reply, DMSO bars correspond to the control performed with the solvent with which the small compounds, at maximum concentration, are diluted.  Therefore, they show the effect of the solvent on CXCL12 responses. In any case, and in order to facilitate the comprehension of the figure we have also added the controls in the absence of DMSO to demonstrate that the solvent does not affect CXCL12-mediated functions, together with the effect of the orthosteric inhibitor AMD3100. In addition, we have also included representative images of the effect of the different compounds on CXCL12-induced polarization (Fig. 4C).

      (60) In Figure 4A, carefully assess overlapping error bars and ensure accurate interpreta7on. If necessary, consider alternative representation. 

      We have tried alternative representations of data in Fig. 4A, but in all cases the figure was unclear. We believe that the way we represent the data in the original manuscript is the most clear and appropriate.  Nevertheless, we have now included significance values as a table annexed to the figure, as well as the effect of AMD3100, as a control of inhibition

      (61) Supplementary Figure 1A: 

      •  Improve the clarity of bar plots for better understanding. Consider reordering them from the most significant to the least. 

      This was a good idea, and therefore Supplementary Fig. 1A has been reorganized to improve clarity.

      (62) Supplementary Figure 1C: 

      •  Clarify the rationale behind choosing the 12.5 nM concentration and explain if different concentrations of CXCL12 were tested. 

      In old Supplementary Fig. 1C, we used untreated cells, that is, CXCL12 was not present in the assay.  These experiments were performed to test the potential toxicity of DMSO (solvent) or the negative allosteric modulators on Jurkat cells. The 12.5 nM concentration of CXCL12 mentioned in the figure legend applied only to panels A and B, as indicated in the figure legend. We previously optimized this concentration for Jurkat cells using different concentrations of CXCL12 between 5 and 100 nM.  Nevertheless, we have reorganized old supplementary fig. 1 and clarified the figure legend to avoid misinterpretations (see Supplementary Fig 1A, B and Supplementary Fig. 2A, B).

      (63) Explain the observed reduction in fluorescence intensity for AGR1.135. 

      The cell cycle analysis has been moved from Supplementary Fig. 1C to a new Supplementary Fig. 2.  It now includes the flow cytometry panels to show fluorescence intensity as a function of the number of cells analyzed (Panel 1A) as well as a table (panel B) with the percentage of cells in each phase of the cell cycle. We believe that the apparent reduction in fluorescence that the reviewer observes is mainly due to the number of events analyzed. However, we have changed the flow cytometry panels for others that are more representative and included a table with the mean of the different results. When we determined the percentage of cells in each cell cycle phase, we observed that it looks very similar in all the experimental conditions. That is, none of the compounds affected any of the cell cycle phases. We have also included the effect of H2O2 and staurosporine as control compounds inducing cell death and cell cycle alteration of Jurkat cells.

      (64) Supplementary Table 1: 

      •  Include a column specifying the scoring for each compound to provide a clear reference for readers. 

      To facilitate references to readers, we have now included the inhibitory effect of each compound on Jurkat cell migration in the revised version of this table. 

      (65) Minor Points 

      Page 2 - Abstract: Rephrase the first sentence of the abstract to enhance fluidity. 

      Although the entire manuscript was revised by a professional English editor, we appreciate the valuable comments of this reviewer and we have corrected these issues accordingly.

      (66) Page 2 - Abstract: Explicitly define "CXCR4" as "C-X-C chemokine receptor type 4" the first time it appears.

      We have not used C-X-C chemokine receptor type 4 the first time it appears in the abstract. CXCR4 is an acronym normally accepted to identify this chemokine receptor, and it is used as CXCR4 in many articles published in eLife. However, we introduce the complete name the first time it appears in the introduction.

      (67) Page 2 - Abstract: Explicitly define "CXCL12" as "C-X-C motif chemokine 12" the first time it is mentioned. 

      As we have discussed in the previous response, we have not used C-X-C motif chemokine 12 the first time CXCL12 appears in the abstract, as it is a general acronym normally accepted to identify this specific chemokine, even in eLife papers. However, we introduce the complete name the first time it appears in the introduction section.

      (68) Page 2 - Abstract: Explicitly define "TMV and TMVI" upon its first mention.

      The acronym TM has been defined as “Transmembrane” in the revised version

      (69) Page 2 - Abstract: Review the use of "in silico" in the sentence for accuracy and consider revising if necessary.

      With the term “in silico” we want to refer to those experiments performed on a computer or via computer simulation software. We have carefully reviewed its use in the new version of the manuscript.

      (70) Page 2 - Abstract: Add a comma after "compound" in the sentence, "We identified AGR1.137, a small compound that abolishes...".

      A comma after “compound” has been added in the revised sentence.

      (71) Page 2 - Significance Statement: Rephrase the first sentence of the "Significance Statement" to avoid duplication with the abstract.

      The first sentence of the Significance Statement has been revised to avoid duplication with the abstract. 

      (72) Page 2 - Significance Statement: Break down the lengthy sentence, "Here, we performed in silico analyses..." for better readability. 

      The sentence starting by “Here, we performed in silico analyses…” has been broken down in the revised manuscript.

      (73) Page 2 - Introduction: Replace "Murine studies" with a more specific term for clarity.

      The term “murine studies” is normally used to refer to experimental studies developed in mice. We have nonetheless rephrased the sentence.

      (74) Page 3 - Introduction: Rephrase the sentence for clarity: "Finally, using a zebrafish model, ..."

      The sentence has been now rephrased for clarity.

      (75) Results-AGR1.135 and AGR1.137 block CXCL12-mediated CXCR4 nanoclustering and dynamics: 

      Rephrase the sentence for clarity: "Retreatment with AGR1.135 and AGR1.137, but not with AGR1.131, substantially impaired CXCL12-mediated receptor nanoclustering.”

      The sentence has been rephrased for clarity.

      (76) Results - AGR1.135 and AGR1.137 incompletely abolish CXCR4-mediated responses in Jurkat cells: Clarify the sentence: "In contrast to the effect promoted by AMD3100, a binding-site antagonist of CXCR4..."

      The sentence has been modified for clarity.

      (77) Consider using "orthosteric" instead of "binding-site" antagonist.

      The term orthosteric is now used throughout to refer to a binding site antagonist.

      (78) Discussion: Use the term "in silico" only when necessary.

      We have carefully reviewed the use of “in silico” in the manuscript.

      (79) Discussion: Clarify the sentence: "...not affect neither CXCR2-mediated cell migration...". Confirm if "CXCL12" is intended.

      The sentence refers to the chemokine receptor CXCR2, which binds the chemokine CXCL2. To test the specificity of the compounds for the CXCL12/CXCR4 axis, we evaluated CXCL2-mediated cell migration.  The results indicated that CXCL2/CXCR2 axis was not affected by the negative allosteric modulators, whereas CXCL12-mediated cell migration was blocked.  The sentence has been clarified in the new version of the manuscript.

      (80) Figure 4B: Bold the "B" in the figure label for consistency.

      The “B” in Fig. 4B has been bolded.

      Reviewer #2

      (1) Fig 2. The SPT data is sub-optimal in its presentation as well as analysis. Example images should be shown. The analysis and visualization of the data should be reconsidered for improvements. Graphs with several hundreds, in some conditions over 1000 tracks, per condition are very hard to compare. The same (randomly selected representative set) number of data points should be shown for better visualization. Also, more thorough analyses like MSD or autocorrelation functions are lacking - they would allow enhanced overall representation of the data.

      In agreement with the reviewer’s commentary, we have modified the representation of Fig. 2. We have carefully read the paper published by Lord S.J. and col. (Lord S. J. et al., J. Cell Biol. 2020) and we apply their recommendations for these type of data. We have also included as supplementary material representative videos for the TIRF-M experiments performed to allow readers to visualize the original images. Regarding the MSD analyses, they were developed to determine all D1-4 values. According to the data published by Manzo & García-Parajo (Manzo C. & García-Parajo M.F. Rep.Prog. Phys. 2015) due to the finite trajectory length the MSD curve at large tlag has poor statistics and deviates from linearity. However, the estimation of the Diffusion Coefficient (D1-4) can be obtained by fitting of the short tlag region of the MSD plot giving a more accurate idea of the behavior of particles. In agreement we show D1-4 values and not MSD data. 

      Due to the space restrictions, it is very difficult to include all the figures generated, but, only for review purposes, we included in this point-by-point reply some representative plots of the MSD values as a function of the time from individual trajectories showing different types of motion obtained in our experiments (Author response image 7).

      Author response image 7.

      Representative MSD plots from individual trajectories of CXCR4-AcGFP showing different types of motion: A) confined, B) Brownian/Free, C) direct transport of CXCR4-AcGFP particles diffusing at the cell membrane detected by SPT-TIRF in resting JKCD4 cells.

      Further analysis, such as the classification based on particle motion, has not been included in this article. This classification uses the moment scaling spectrum (MSS), described by Ewers H. et al. 2005 PNAS, and requires particles with longer trajectories (>50 frames). Only for review purposes, we include a figure showing the percentage of the MSS-based particle motion classification for each condition. As expected, most of long particles are confined, with a slight increase in the percentage upon CXCL12 stimulation in all conditions, except in cell treated with AGR1.137 (Author response image 8).

      Author response image 8.

      Effects of the negative allosteric modulators on the Types of Motion of CXCR4. Percentage of single trajectories with different types of motion, classified by MSS (DMSO: 58 particles in 59 cells on FN; 314 in 63 cells on FN+CXCL12; AGR1.131: 102 particles in 71 cells on FN; 258in 69 cells on FN+CXCL12; AGR1.135: 86 particles in 70 cells on FN; 120 in 77 cells on FN+CXCL12; AGR1.137: 47 particles in 66 cells on FN; 74 in 64 cells on FN+CXCL12) n = 3.

      (2) Fig 3. The figure legends have inadequate information on concentrations and incubation times used, both for the compounds and other treatments like CXCL12 and forskolin. For the Western blot data, also the quantification should be added to the main figure. The compounds, particularly AGR1.137 seem to lead to augmented stimulation of pAKT and pERK. This should be discussed

      The Fig. 3 legend has been corrected in the revised manuscript. Fig. 3D now contains representative western blots and the densitometry evaluation of these experiments. As the reviewer indicates, we also detected in the western blot included, augmented stimulation of pAKT and pERK in cells treated with AGR1.137. However, as shown in the densitometry analysis, no significant differences were noted between the data obtained with each compound. As a control of inhibition of CXCL12 stimulation we have included a new Supplementary Fig. 4 showing the effect of AMD3100 on CXCL12-induced activation of Akt and ERK as analyzed by western blot.

      (3) Fig. 4 immunofluorescence data on polarization as well as the flow chamber data lack the representative images of the data. The information on the source of the T cells is missing. Not clear if this experiment was done on bilayers or on static surfaces.

      Representative images for the data shown in Figure 4B have been added in the revised figure (Fig. 4C). The experiments in Fig. 4B were performed on static surfaces. As indicated in the material and methods section, primary T cell blasts were added to fibronectin-coated glass slides and then were stimulated or not with CXCL12 (5 min at 37ºC) prior to fix permeabilize and stain them with Phalloidin. Primary T cell blasts were generated from PBMCs isolated from buffy coats that were activated in vitro with IL-2 and PHA as indicated in the material and methods section.

      (4) The data largely lacks titration of different concentrations of the compounds. How were the effective concentration and treatment times determined? What happens at higher concentrations? It is important to show, for instance, if the CXCR12 binding gets inhibited at higher concentrations. most experiments were performed with 50 uM, but HeLa cell data with 100 uM. Why and how was this determined? 

      The revised version contains a new panel in Fig. 1B to show a more detailed kinetic analysis with different concentrations (1-100 µM) of the compounds in the migration experiments using Jurkat cells. We choose 50 µM for further studies as it was the concentration that inhibits 50-75% of the ligand induced cell migration. 

      We have also included the effect of two doses of the compounds (10 and 50 µM) in the zebrafish model as well as AMD3100 (1 and 10 µM) as control (new Fig. 7D, E).  Tumors were imaged within 2 hours of implantation and tumor-baring embryos were treated with either vehicle (DMSO) alone, AGR1.131 or AGR1.137 at 10 and 50 µM or AMD3100 at 1 and 10 µM for three days, followed by re-imaging.

      Regarding the amount of CXCL12 used in these experiments, with the exception of cell migration assays in Transwells, where the optimal concentration was established at 12.5 nM, in all the other experiments the optimal concentration of CXCL12 employed was 50 nM. In the case of the directional cell migration assays, we use 100 nM to create the chemokine gradient in the device. These concentrations have been optimized in previous works of our laboratory using these types of experiments. It should also be noted that in the experiments using lipid bilayers or TIRF-M experiments, CXCL12 is used to coat the plates and therefore it is difficult to determine the real concentration that is retained in the surface after the washing steps performed prior adding the cells.

      (5) The authors state that they could not detect direct binding of the compounds and the CXCR14. It should be reported what approaches were tried and discussed why this was not possible. 

      We attempted a fluorescence spectroscopy strategy to formally prove the ability of AGR1.135 to bind CXCR4, but this strategy failed because the compound has a yellow color that interfered with the determinations. We also tried a FRET strategy (see supplementary Fig. 7) and detected a significant increase in FRET efficiency of CXCR4 homodimers in cells treated with AGR1.135; this effect was due to the yellow color of this compound that interferes with FRET determinations. In the same assays, AGR1.137 did not modify FRET efficiency for CXCR4 homodimers and therefore we cannot assume that AGR1.137 binds on CXCR4. All these data have been considered in the revised discussion.

      (6) The proliferation data in Supplementary Figure 1 lacks controls that affect proliferation and indication of different cell cycle stages. What is the conclusion of this data? More information on the effects of the drug to cell viability would be important.

      Toxicity in Jurkat cells was first determined by propidium iodide incorporation. Some compounds (i.e., AGR1.103 and VSP3.1) were discarded from further analysis as they were toxic for cells. In a deeper analysis of cell toxicity, even if these compounds did not kill the cells, we checked whether they could alter the cell cycle of the cells. New Supplementary Fig. 2 includes a table (panel B) with the percentage of cells in each cell cycle phase, and no differences between any of the treatments tested were detected. 

      Nevertheless, to clarify this issue the revised version of the figure also includes H2O2 and staurosporine stimuli to induce cell death and cell cycle alterations as controls of these assays.

      (7) The flow data in Supplementary Figure 2 should be statistically analysed. 

      Bar graphs corresponding to the old Supplementary Fig. 2 (new Supplementary Fig. 3) are shown in Fig. 3B. We have also incorporated the corresponding statistical analysis to this figure. 

      (8) In general, the authors should revise the figure legends to ensure that critical details are added. 

      We have carefully revised all the figure legends in the new version of the manuscript.

      (9) Bar plots are very poor in showing the heterogeneity of the data. Individual data points should be shown whenever feasible. Superplot-type of representation is strongly advised (https://doi.org/10.1083/jcb.202001064).

      We have carefully read the paper published by Lord S.J. and col. (Lord S. J. et al., J. Cell Biol. 2020) and we apply their recommendations for our TIRF-M data (see revised

      Fig.  2).

    1. Author response:

      The following is the authors’ response to the original reviews.

      Public Reviews:

      Reviewer #1 (Public Review):

      Summary:

      This manuscript by Liu et al explores the role of the UPR and immune regulators in the evaluation of nutritional quality in C. elegans. They identify neuronal UPR activation and the MAPK PMK-1 as key responders to low food quality. In particular, the data suggest that these pathways are activated by low levels of vitamin C synthesis that result from the low sugar levels present in heat-killed E. coli.

      Strengths:

      The results are intriguing and expand our understanding both of physiological food evaluation systems, and of the known roles of stress response pathways in organismal physiology. The authors use a range of techniques, encompassing imaging, metabolomic analysis, gene expression analysis, and behavioural assays, to support their claims.

      Thank you for your thorough review and acknowledgment of the strengths of our study.

      Weaknesses:

      There is limited mechanistic analysis in the study. In particular, how does low vitamin C trigger UPR activation? This is an intriguing finding that, if followed up, could potentially reveal a novel mechanism of UPR activation. In addition, how is the activation of the PMK-1 pathway driven by/coordinated with UPR activation? The data in some figures is not as convincing as it could be: the magnitude of the effect size is small in the supplementation experiments, and the statistical tests used are not always appropriate to enable multiple comparisons.

      (1) There is limited mechanistic analysis in the study. In particular, how does low vitamin C trigger UPR activation? This is an intriguing finding that, if followed up, could potentially reveal a novel mechanism of UPR activation. 

      Thank you for highlighting the need for further mechanistic analysis in our study. We appreciate the opportunity to clarify the process by which low vitamin C triggers UPR activation.

      Our investigation revealed that the vitamin C content in heat-killed E. coli (HK-E. coli) is comparable to that of live E. coli or HK-yfbR mutant E. coli (Figure 4-figure supplement 1A), indicating that the induction of unfolded protein response (UPR) in C. elegans by HK-E. coli is not solely attributed to low vitamin C levels but rather involves other unidentified factors.

      Through metabolomic analysis, we observed significant decreases in sugar levels, including lactose, D-(+)-sucrose, and D-(+)-glucose, in HK-E. coli (Figure 3B, Table S1). Notably, supplementing D-(+)-glucose effectively inhibited UPRER, immune response, and avoidance behavior induced by HK-E. coli (Figure 3E-H). These findings suggest that the deficiency in sugars in HK-E. coli triggers a stress response and avoidance behavior in animals, which can be alleviated by D-(+)-glucose supplementation.

      Furthermore, when comparing heat-killed E. coli mutant yfbR (HK-yfbR) to HK-E. coli, we observed significantly higher sugar levels, including lactose and D-(+)-sucrose, in HK-yfbR (Figure 3B). This was accompanied by reduced UPRER in animals feeding on HK-yfbR (Figure 3-figure supplement 1B), indicating that higher sugar levels may inhibit the induction of UPRER by low-quality food.

      Considering that the synthesis of vitamin C (VC) occurs through the glucuronate pathway, utilizing D-glucose as a precursor 1, 2 (Figure 4A), we investigated whether the vitamin C biosynthesis pathway is involved in evaluating low-quality food using D-glucose. Contrary to our initial hypothesis, animals fed live E. coli did not exhibit higher glucose levels compared to those fed low-quality food (HK_-E. coli_). Our results indicate that animals maintain similar VC levels when fed ideal food (live E. coli) compared to low-quality food (HK-E. coli) (Figure 4B), suggesting that animals do not stimulate VC biosynthesis under favorable food conditions. However, supplementation of D-GlcA or E. coli-yfbR mutation in HK-E. coli significantly improved VC levels when animals were fed low-quality food (HK-OP50) (Figure 4B, 4C). Moreover, VC or D-glucuronate (D-GlcA) supplementation inhibited HK-E. coli-induced UPRER (Figure 4D), indicating that glucose boosts the animal's ability to adapt to unfavorable food environments by increasing VC levels, thereby inhibiting UPRER, but not under favorable food conditions.

      These findings shed light on the complex interplay between vitamin C, sugar levels, and UPR activation, providing valuable insights into the mechanisms underlying food evaluation and stress response pathways in organisms.

      Overall, we are grateful for the reviewer's constructive feedback, which motivates us to continue our efforts to understanding how the UPR response contributes to the complexities of food evaluation and behavioral responses in organisms.

      (2) In addition, how is the activation of the PMK-1 pathway driven by/coordinated with UPR activation?

      Thank you for your insightful inquiry. In our discussion section, we have addressed this question by integrating new data and discussion to provide insights into the coordination between PMK-1 pathway activation and UPR activation.

      Previous studies have demonstrated that activating innate immunity, specifically the PMK-1 MAPK pathway, results in a reduction in translation3, as well as a shutdown of food digestion in animals4, likely aimed at reducing protein translation and cellular metabolism. To further investigate this relationship, we measured the translation level of animals fed with heat-killed E. coli (HK-E. coli) and found a significant reduction in total translation ability in these animals (Figure 5-figure supplement 1D). This observation suggests that activating innate immunity through the PMK-1 MAPK pathway may serve as a mechanism to slow down translation progress, thereby alleviating the pressure on the unfolded protein response (UPR) and preventing excessive UPRER activation.

      By integrating these findings, we propose a model wherein activation of the PMK-1 pathway coordinates with UPR activation to regulate translation and cellular metabolism in response to low-quality food. This coordinated response likely serves to maintain cellular homeostasis and prevent detrimental effects associated with excessive UPRER activation.

      These insights contribute to our understanding of the intricate interplay between innate immunity, cellular stress responses, and metabolic regulation in organisms facing nutritional challenges.

      (3) The data in some figures is not as convincing as it could be: the magnitude of the effect size is small in the supplementation experiments, and the statistical tests used are not always appropriate to enable multiple comparisons.

      We appreciate the reviewers' concerns regarding the data presentation and statistical analyses in some of our figures. In response to this feedback, we have made revisions to improve the robustness and clarity of our statistical methods.

      All statistical analyses were conducted using GraphPad Prism 8.0 software. Specifically, a two-tailed unpaired t-test was employed for the statistical analysis of two groups of samples, while one-way or two-way ANOVA was utilized for the statistical analysis of more than two groups of samples. These adjustments ensure appropriate statistical comparisons and enhance the reliability of our findings.

      Reviewer #2 (Public Review):

      Summary:

      In this work, the authors aim to better understand how C. elegans detects and responds to heat-killed (HK) E. coli, a low-quality food. They find that HK food activates two canonical stress pathways, ER-UPR, and innate immunity, in the nervous system to promote food aversion. Through the creative use of E. coli genetics and metabolomics, the authors provide evidence that the altered carbohydrate content of HK food is the trigger for the activation of these stress responses and that supplementation of HK food with sugars (or their biosynthetic product, vitamin C), reduces stress pathway induction and food avoidance. This work makes a valuable addition to the literature on metabolite detection as a mechanism for the evaluation of nutritional value; it also provides some new insight into the physiologically relevant roles of well-known stress pathways in modulating behavior.

      Strengths:

      -The work addresses an important question by focusing on understanding how the nervous system evaluates food quality and couples this with behavioral change. -The work takes full advantage of the tools available in this powerful system and builds on extensive previous studies on feeding behavior and stress responses in C. elegans.

      -Creative use of E. coli genetics and metabolite profiling enabled the identification of carbohydrate metabolism as a candidate source of food-quality signals.

      -For the most part, the studies are rigorous and logically designed, providing good support for the authors' model.

      We deeply appreciate the reviewer's insightful assessment of our study's strengths. 

      Weaknesses:

      -It is not clear how the mechanism identified here is connected to previously described, related processes. In particular, it is not clear whether this mechanism has a role in the detection of other low-quality foods. Further, the specificity of the ability of sugar/vitamin C to suppress stress pathway induction is unclear (i.e., does sugar/vitamin C have any effect on the activation of these pathways through other means?). Additionally, the relationship of this pathway to the vitamin B2-sensing mechanism previously described by the senior author is unclear. These issues do not weaken confidence in the authors' conclusions, but they do reduce the potential significance of the work.

      (1) In particular, it is not clear whether this mechanism has a role in the detection of other low-quality foods. 

      Thank you for your valuable feedback. In response to your inquiry, we investigated whether the UPRER (IRE-1/XBP-1) - Innate immunity (PMK-1/p38 MAPK) axis is specific to evaluating low-quality food (HK-E. coli) or if it plays a broader role in food detection.

      We conducted behavioral assays using N2, pmk-1, and xbp-1 mutant animals fed with normal E. coli food, inedible food (Saprophytic staphylococci)4, and pathogenic food (Pseudomonas aeruginosa-PA14)5. We found that N2, pmk-1, and xbp-1 mutant worms did not exhibit avoidance behavior when presented with normal food (OP50). However, both N2 and xbp-1 mutant worms were able to escape from inedible food (N2 was predominantly found on the border areas of the bacterial lawn and xbp-1 mutant worms on border and in), Saprophytic staphylococci, whereas pmk-1 mutant worms did not exhibit this avoidance behavior. Notably, N2 and xbp-1 mutant worms exhibited even more pronounced avoidance behavior when exposed to Pseudomonas aeruginosa, whereas pmk-1 mutant worms were more susceptible to infection by this pathogen (Figure 2-figure supplement 2C). These findings suggest that the UPR-Immunity pathway plays a crucial role in helping animals avoid low-quality food (HK-E. coli) by triggering an avoidance response. In contrast, the Innate immunity pathway, mediated by PMK-1/p38 MAPK, appears to play a key role in evaluating unfavorable food sources, such as HK-E. coli, Saprophytic staphylococci, and Pseudomonas aeruginosa, and helping animals avoid these environments.

      (2) Further, the specificity of the ability of sugar/vitamin C to suppress stress pathway induction is unclear (i.e., does sugar/vitamin C have any effect on the activation of these pathways through other means?). 

      Thank you for your inquiry regarding the specificity of the ability of sugar/vitamin C to suppress stress pathway induction. We aimed to address this question by investigating whether high levels of VC inhibit other stress-induced UPRER pathways.

      Previous studies have shown that both Tunicamycin6 and pathogenic bacteria, such as Pseudomonas aeruginosa-PA145, induce UPRER in C. elegans. In response to your query, we conducted experiments to examine whether VC supplementation inhibits UPRER induced by these stressors. Our findings indicate that VC supplementation does not inhibit UPRER induced by either Tunicamycin or PA14 (Author response image 1).

      These results suggest that while sugar/vitamin C may suppress stress pathway induction in the context of low-quality food, its effects may not extend to other stressors that induce UPRER through different mechanisms. This insight helps clarify the specificity of sugar/vitamin C's role in modulating stress pathway activation, contributing to a better understanding of the broader regulatory networks involved in stress response in C. elegans.

      Author response image 1.

      VC supplementation does not inhibit Tunicamycin or PA14-induced UPRER.

      (3) Additionally, the relationship of this pathway to the vitamin B2-sensing mechanism previously described by the senior author is unclear.

      In response to your comment, we would like to clarify the relationship of our pathway to the previously described vitamin B2-sensing mechanism we found. Previous studies have demonstrated that heat-killed E. coli (HK-E. coli) serves as a low-quality food source incapable of supporting the growth of C. elegans larvae, whereas supplementation with vitamin B2 (VB2) can restore animal growth7

      This study investigates the role of sugar deficiency in HK-E. coli, which induces the UPRER-immune response and avoidance behavior in C. elegans. Surprisingly, our findings indicate that supplementing HK-E. coli with carbohydrates such as D-Glc and D-GlcA does not promote animal development (Figure 3-figure supplement 2G), suggesting that carbohydrates are not essential for supporting animal growth on this food source. However, we did observe that carbohydrates play a critical role in inhibiting the UPRER-immune response induced by sugar deficiency in HK-E. coli.

      -The authors claim that the induction of the innate immune pathway reporter irg-5::GFP is "abolished" in pmk-1(RNAi) animals, but Figure S2K seems to show a clear GFP signal when these animals are fed HK-OP50. Similarly, the claim that feeding WT animals HK-OP50 enriches phospho-PMK-1 levels (Fig 2E) is unconvincing - only one western blot is shown, with no quantification, and there is a smear in the critical first lane.

      (1) The authors claim that the induction of the innate immune pathway reporter irg-5::GFP is "abolished" in pmk-1(RNAi) animals, but Figure S2K seems to show a clear GFP signal when these animals are fed HK-OP50. 

      We sincerely appreciate the reviewer's attention. To address this concern, we have replaced the images with higher resolution, larger ones in Figure 2-figure supplement 1-I. These updated images provide a clearer representation of the data, ensuring that all details are readily visible and enabling a more accurate interpretation of the results.

      (2) Similarly, the claim that feeding WT animals HK-OP50 enriches phospho-PMK-1 levels (Fig 2E) is unconvincing - only one western blot is shown, with no quantification, and there is a smear in the critical first lane.

      Thank you, following reviewer’s suggestion, we also repeated some of the western. We now replace the Figure 2E and quantified relative intensity of pPMK-1/tublin. We also provide the uncropped western blots images as source data ( “raw-data WB” file). 

      -The rationales for some of the paper's hypotheses could be improved. For example, the rationale for screening the E. coli mutant library is that some mutants, when heat-killed, may be missing a metabolite that induces the ER-UPR. A more straightforward hypothesis might be that some mutant E. coli strains aberrantly induce the ER-UPR when *not* heat-killed, because they are missing a metabolite that prevents stress pathway induction. This is not in itself a major concern, but it would be useful for the authors to provide a rationale for their hypothesis.

      Thank you for the insightful suggestion. We acknowledge the importance of providing a clear rationale for our hypotheses in the paper. In response to this feedback, we have enhanced the discussion section to better elucidate the rationale behind our hypotheses.

      One limitation of our study is the lack of explanation for why HK-E. coli activates UPRER and immunity. We hypothesized that when heat-killed, HK-E. coli may lack or contain altered levels of certain metabolites that either activate or inhibit UPRER and immunity, respectively. Additionally, we speculated that E. coli mutants killed by heat may lack metabolites that activate UPRER and immunity, or conversely, have increased levels of metabolites that inhibit these pathways.

      Fortunately, our investigation led to the discovery of the E. coli mutant yfbR, which inhibits UPRER and immunity by increasing carbohydrates that aid in resisting these stress pathways. Moving forward, we intend to further explore the intricate relationship between HK-E. coli and UPRER-immunity. This will be a key focus of our future research efforts.

      -The authors do not provide any explanation for some unexpected results from the E. coli screen. Earlier in the paper, the authors found that innate immune signaling is downstream of ER-UPR activation. However, of the 20 E. coli mutants that, when heat-killed, "did not induce... the UPR-ER reporter," 9 of them still activate the innate immune response. This seems at odds with the authors' simple model since it suggests that low-quality food can induce innate immune signaling independently of the ER-UPR. Further, only one of the 9 has an effect on behavior, even though failure to activate the innate immune pathway might be expected to lead to a behavioral defect in all of these.

      Thank you for your understanding, and we apologize for any confusion caused by our earlier statement. To provide clarification, our study revealed that out of the 20 E. coli mutants examined, none activated the UPRER. Among these mutants, 9 did not induce immunity, and interestingly, one out of these 9 mutants demonstrated the ability to inhibit avoidance behavior.

      This diversity in phenotypic outcomes can be attributed to the varied metabolites present in different E. coli mutants. To thoroughly evaluate the effects of these mutants, we conducted a comprehensive three-step screening process, utilizing UPRER marker, immunity marker, and avoidance behavior assays.

      Through this rigorous approach, we identified the E. coli mutant, yfbR, which exhibited the desired inhibitory effects on UPRER, immunity, and avoidance behavior.

      Subsequently, we conducted a metabolomics analysis of various food qualities (HK-K12, HK-yfbR, and Live-K12). Our findings revealed higher sugar levels in

      HK-yfbR and Live-K12 compared to HK-K12 (Figure 3B, Figure 3-figure supplement 2A, and Table S1), indicating that sugar deficiency might trigger the UPRER, immunity responses, and subsequent avoidance behavior. 

      -In a number of places, the writing style can make the authors' arguments difficult to follow.

      Thanks for the reviewer’s efforts. We changed all of these errors and polish the language of this paper. 

      -Some of the effect sizes observed by the authors are exceedingly small (e.g, the suppression of hsp-4::gfp induction by sugar supplementation in Figs 3C-E), raising some concern about the biological significance of the effect.

      Thank you for your feedback. In response to your concern, we have included additional clarification in the manuscript.

      We have added the following statement: “While sugar effectively inhibits the HK-E. coli-induced UPRER and immune response, it does not fully suppress it to the extent observed with live-E. coli (Figure 3C-F). This implies that additional nutrients present in live-E. coli might also contribute to the inhibition of UPRER and immune response.”

      This addition helps to address the observation that some effect sizes appear small, providing context and suggesting potential factors that may influence the outcomes. 

      -In some cases, there is a discrepancy between the fluorescence images and their quantitation (e.g., Figure 3E, where the effect of glucose on GFP fluorescence seems much stronger in the image than in the graph).

      Thank you for your valuable suggestion. In response, we have revised our image selection process to ensure impartiality. We now randomly select images to ensure they accurately represent the quantified data without bias. More details regarding this update can be found in Author response image 2.

      Author response image 2.

      More original picture corresponding to Figure 3E 

      Reviewer #3 (Public Review):

      Summary:

      Animals can evaluate food quality in many ways. In contrast to the rapid sensory evaluation with smell and taste, the mechanism of slow nutrient sensation and its impact on food choice is unexplored. The authors utilize C. elegans larvae and their bacterial food as an elegant model to tackle this question and reveal the detailed molecular mechanism to avoid nutrient-poor foods.

      Strengths:

      The strength of this study is that they identified the molecular identities of the critical players in bacterial food and C. elegans using unbiased approaches, namely metabolome analysis, E. coli mutant screening, and RNA sequencing. Furthermore, they strengthen their findings by thorough experiments combining multiple methods such as genetics, fluorescent reporter analysis, and Western blot.

      Thank you for highlighting the strengths of our study. 

      Weaknesses:

      The major caveat of this study is the reporter genes. The transcriptional reporters were used to monitor the UPRER and immune responses in the intestine of C. elegans.

      However, their tissue-specific rescue experiments suggest that the genes in the UPRER and immune response function in the neurons. Thus, we should carefully interpret the results of the reporter genes.

      Thank you for your insightful comment. We appreciate the opportunity to address your concerns regarding the interpretation of our reporter gene data.

      Upon reevaluation, we observed strong induction of the UPRER reporter

      (Phsp-4::GFP)8 and immunity reporter (Pirg-5::GFP)9 both in the intestine (Figure 1F-G) and in neurons (Figure 1-figure supplement 2A) in response to feeding unfavorable food (HK-E. coli). This suggests that both the UPRER and immune pathways may indeed respond to low-quality food (HK-E. coli) in multiple tissues of C. elegans. While we acknowledge that our tissue-specific rescue experiments suggest a role for these pathways in neurons, the intestinal fluorescence of Phsp-4::GFP or Pirg-5::GFP is easily observable and scorable. Therefore, we chose to focus our further analyses on the intestine for practical reasons.

      Overall, this work provides convincing data to support their model. In the C. elegans field, the behaviors of larvae are not well studied compared to adults. This work will pose an interesting question about the difference between larvae and adults in nutrition sensing in C. elegans and provide a framework and candidate molecules to be studied in other organisms.

      Recommendations for the authors:

      Reviewer #1 (Recommendations For The Authors):

      Major suggestions:

      (1) My major overall comment is that the paper would be substantially strengthened by more mechanistic analysis. In particular, how does low vitamin C trigger UPR activation? This is an intriguing finding and it would be important to see it more fully explored.  

      Our study revealed that the vitamin C content in HK_-E. coli_ is comparable to that of live E. coli or HK-yfbR (Figure 4-figure supplement 1A), suggesting that the induction of unfolded protein response (UPR) in C. elegans by HK-E. coli is not attributed to low vitamin C levels, but rather to unknown factors.

      Metabolomic analysis showed that the sugar levels, including lactose, D-(+)-sucrose, and D-(+)-glucose, were significantly decreased in HK-E. coli (Figure 3B, Table S1).

      Furthermore, we found that supplementing D-(+)-glucose effectively inhibited UPRER (Figure 3E), immune response (Figure 3F, 3G, and Figure 3-figure supplement 2D), and avoidance behavior (Figure 3H) induced by HK-E. coli. Our findings suggest that the deficiency in sugars in HK-E. coli triggers a stress response and avoidance behavior in animals, which can be alleviated by D-(+)-glucose supplementation.

      Notably, when E. coli was heat-killed, we observed that the sugar levels, including lactose and D-(+)-sucrose, were significantly higher in the heat-killed E. coli mutant yfbR (HK-yfbR) compared to HK-E. coli (Figure 3B). Moreover, we found that UPRER was reduced in animals feeding HK-yfbR (Figure 3-figure supplement 1B), indicating that higher sugar levels may inhibit the induction of UPRER by low-quality food.

      The synthesis of vitamin C (VC) occurs through the glucuronate pathway, utilizing D-glucose as a precursor 1, 2 (Figure 4A). This led us to investigate whether the vitamin C biosynthesis pathway is involved in evaluating low-quality food by using D-glucose. In this study, we found that animals feeding live E. coli, which should produce more VC, exhibit higher glucose levels. However, our results show that animals maintain similar VC levels when fed ideal food (live E. coli) compared to low-quality food (HK-E. coli) (Figure 4B), suggesting that animals do not stimulate VC biosynthesis under favorable food conditions. In contrast, when animals are fed low-quality food (HK-OP50), we found that supplementing D-GlcA (Figure 4C) or E. coli-yfbR mutation (Figure 4B) in HK-E. coli can improve VC levels. Moreover, we found that VC or D-glucuronate (D-GlcA) supplementation inhibited HK-E. coli induced UPRER (Figure 4D). These data indicate that glucose boosts the animal's ability to adapt to unfavorable food environments by increasing VC levels, thereby inhibiting UPRER, but not in favorable food conditions.

      In addition,we asked whether high level of VC inhibits other stress induced UPRER. Previous study shown that Tunicamycin6 and pathogenic bacteria-Pseudomonas aeruginosa-PA145 induce UPRER in C. elegans. We found that VC supplementation does not inhibit Tunicamycin or PA14-induced URPER (Author response image 3). 

      Author response image 3.

      VC supplementation does not inhibit Tunicamycin or PA14-induced UPRER.

      In addition, how is the activation of the PMK-1 pathway driven by/coordinated with UPR activation? 

      If the authors do not want to pursue these directions experimentally in this study, the discussion would be strengthened by considering these questions and identifying candidate regulatory mechanisms for further exploration.

      In this study, we found that heat-killed E. coli (HK-E. coli), a low-sugar food, triggers cellular unfolded protein response (UPRER) and immune response. We also demonstrated that 1) the activation of UPRER by low-quality food depends on the IRE-1/XBP-1, 2) activation of immune response (PMK-1) is downstream of XBP-1 in responding to low-quality food.

      how is the activation of the PMK-1 pathway driven by/coordinated with UPR activation? 

      In our discussion part, we added new data and discussion to answer reviewer’s question. 

      A previous study has shown that activating innate immunity (PMK-1 MAPK) leads to a reduction in translation 3. Our own previous research has also demonstrated that PMK-1 activation causes a shutdown of food digestion in animals4, likely to reduce protein translation and cellular metabolism. To investigate this further, we measured the translation level of animals fed with HK-E. coli and found that total translation ability is significantly reduced in these animals (Figure 5-figure supplement 1D). This finding suggests that activating innate immunity (PMK-1 MAPK) may serve as a mechanism to slow down translation progress, thereby alleviating the pressure on the unfolded protein response (UPR) and preventing excessive UPRER activation.

      (2) Figure 2C: The data shows that xbp-1 mutants are significantly more likely to leave heat-killed E. coli. However, no other conditions are examined. Is this avoidance defect specific to heat-killed E. coli, or is it a more general effect of xbp-1 mutants - that is, are other conditions that evoke avoidance also affected by mutation of xbp-1? Is feeding behavior on regular E. coli altered in this background? The finding would be more relevant if the authors could clarify or provide more context for their claims here.

      We then asked whether UPRER (IRE-1/XBP-1) - Innate immunity (PMK-1/p38 MAPK) axis is specific to evaluate low-quality food (HK-E. coli). We examined the avoidance behavior phenotype of wild-type and mutant L1 animals by placing them on various food conditions, including normal E. coli food, inedible food (Saprophytic staphylococci) and pathogenic food (Pseudomonas aeruginosa-PA14), for a 24-hour period. We found that N2, pmk-1, and xbp-1 mutant worms did not exhibit avoidance behavior when presented with normal food (OP50). However, both N2 and xbp-1 mutant worms were able to escape from inedible food, Saprophytic staphylococci, whereas pmk-1 mutant worms did not show this avoidance. Notably, xbp-1 mutant worms exhibited even more pronounced avoidance behavior when exposed to Pseudomonas aeruginosa, whereas pmk-1 mutant worms were more susceptible to infection by this pathogen (Figure 2-figure supplement 2C). These findings suggest that the UPR-Immunity pathway plays a crucial role in helping animals avoid low-quality food by triggering an avoidance response. In contrast, the Innate immunity pathway, which is mediated by PMK-1/p38 MAPK, appears to play a key role in evaluating unfavorable food sources, such as HK-E. coli, Saprophytic staphylococci, and Pseudomonas aeruginosa, and helping animals avoid these environments.

      (3) Figure 3C-F: The magnitude of the changes between conditions shown in these panels is small. To what extent does this supplementation represent a full rescue? The findings would be strengthened if figures/images for the control condition (non-HK E. coli) were shown for comparison to allow the reader to assess the extent to which UPR/PMK-1 activation is rescued.

      In response to a reviewer's suggestion, we included live-E. coli as a control in our study. Notably, our data revealed that the addition of lactose, D-(+)-sucrose, and D-(+)-glucose partially inhibited the HK-E. coli-induced unfolded protein response (UPRER) and immune response, suggesting that other nutrients present in live-E. coli may also play a role in inhibiting UPRER.

      We added this in manuscript: “While sugar effectively inhibits the HK-E. coli-induced UPRER and immune response, it does not fully suppress it to the extent observed with live-E. coli (Figure 3C-F). This implies that additional nutrients present in live-E. coli might also contribute to the inhibition of UPRER and immune response.” 

      (4) Figure 5B-D: The magnitude of changes shown between conditions here again appear to be very small, even those labelled as statistically significant. It is important to ensure that the correct statistical tests have been used to assess the significance of these differences (see below).

      All statistical analyses were performed in Graphpad prism 8.0. Two-tailed unpaired t test was used for statistical analysis of two groups of samples,one-way or two-way ANOVA was used for statistical analysis of more than two groups of samples.

      (5) Methods: In the "Statistical analysis" section, the authors state that "All statistical analyses were performed using Student's t-test". However, this is not the appropriate test to use in experiments where multiple comparisons are made, which is true in several instances across the paper. In these cases, a more appropriate statistical test should be used.

      All statistical analyses were performed in Graphpad prism 8.0. Two-tailed unpaired t test was used for statistical analysis of two groups of samples,one-way or two-way ANOVA was used for statistical analysis of more than two groups of samples.

      Minor suggestions:

      (1) Figure S2: RNAi is usually delivered in a different E. coli strain, HT115. Is this the case with the RNAi knockdowns in Figure S2, and given that diet can influence UPR activation, is it possible that this different diet could change the phenotypes observed?

      This should be clarified by the authors.

      In this study, all RNAi experiments involved bleaching adult animals under RNAi strain culture conditions to obtain L1 animals. Subsequently, L1 animals were transferred to HK-E. coli OP50 for phenotype analysis. In response to a reviewer's suggestion, we observed that L1 animals obtained from mothers fed E. coli strains OP50, HT115, or K12 exhibited similar UPR induction under HK-E. coli OP50 feeding conditions (Author response image 4). These findings suggest that variations in diet did not alter the UPR phenotypes.

      Author response image 4.

      L1 animals obtained from mothers fed E. coli strains OP50, HT115, or K12 exhibited similar UPR induction under HK-E. coli OP50 feeding conditions 

      Reviewer #2 (Recommendations For The Authors):

      Line 182: "irg-5::GFP" should be "hsp-4::gfp".

      Thanks for the reviewer’s efforts. We have changed this error.

      Reviewer #3 (Recommendations For The Authors):

      Major comments:

      (1) The reporter genes of UPRER and immune response were analyzed in the intestine throughout the study. On the other hand, their rescue experiments suggest that these pathways function in the neurons. They should provide the fluorescence data in the neurons at least for Figures 1F and 1G to confirm that the intestinal response matches the neuronal response and mention that further analyses were done in the intestine for easy scoring.

      Consistent with the results of the RNA sequencing (RNA-seq) analysis, the UPRER reporter (Phsp-4::GFP)8 and immunity reporter (Pirg-5::GFP)9 were strongly induced in intestinal (Figure 1F-G) and neurons (Figure 1-figure supplement 2A) by feeding unfavorable food (HK-E. coli), suggesting that UPRER and immune pathways may respond to low-quality food (HK-E. coli). As intestinal fluorescence (Phsp-4::GFP or Pirg-5::GFP) is easy observation and scoring, the further analyses were done in the intestine. 

      (2) I have concerns about the interpretation of the p-PMK-1 data. Although the authors described that "p-PMK-1 is prominently increased" in the text (Line 150), it is unclear on the data (Figure 2E). Similarly, the authors' statement "p-PMK-1 is decreased in animals with D-GlcA (F).." was not fully supported by the data in Figure 4F. The experiment should be repeated and quantified. Moreover, pPMK-1 showed single bands in Figure 2E, but double bands in Figure 3G, 4F, and 4G. The authors should explain why that is the case and which band we should look at for Figures 3G, 4F, and 4G.

      As reviewer’s suggestion, we also repeated some of the western. We found that after longer expose, there are two bands for pPMK-1 (Figure 2E, new data; and “raw-data WB” file). The VHP-1 phosphatase is known to inhibit PMK-13. In our previous study, we found that worms treated with vhp-1(RNAi), which hyperactivates p-PMK-1 (lower band) 4. In contrast, the two bands are disappeared in pmk-1 mutant (Author response image 5). Thus, the lower band indicates the pPMK-1. We now replace the Figure 2E and quantified relative intensity of pPMK-1/tublin. We also provide the uncropped western blots images as source data ( “raw-data WB” file). 

      Author response image 5.

      In our previous study, we found that worms treated with vhp-1(RNAi), which hyperactivates p-PMK-1 (lower band) 4. In contrast, the two bands are disappeared in pmk-1 mutant. These pictures are extracted from our previous study4.

      (3) Heat-killed E. coli (HK-E. coli) is low-quality because the lack of sugar cannot support the growth of C. elegans larvae (Qi and Han, Cell, 2018). Thus, animals do not show the UPRER-immune response and avoidance when HK-E. coli is supplemented with sugars such as glucose (Line 225-227). If these sugars are the key, C. elegans larvae should be able to grow better with HK-E. coli supplemented with glucose. Authors should address this possibility.

      Previous studies have shown that heat-killed E. coli (HK-E. coli) is a low-quality food source that cannot support the growth of C. elegans larvae7. Here, we found that sugar deficiency in HK-E. coli induces the UPRER-immune response and avoidance behavior in C. elegans. Given this, we investigated whether sugar supplementation could promote animal growth when fed HK-E. coli. To our surprise, supplementing HK-E. coli with carbohydrates (D-Glc, D-GlcA) did not support animal development (Figure 3-figure supplement 2G), suggesting that carbohydrates are not essential for supporting animal growth on this food source. However, we did find that carbohydrates are critical for inhibiting the UPRER-immune response induced by sugar deficiency in HK-E. coli.

      (4) Line 884: Instead of the Student's t-test, the ANOVA should be used for multiple comparisons.

      All statistical analyses were performed in Graphpad prism 8.0. Two-tailed unpaired t test was used for statistical analysis of two groups of samples,one-way or two-way ANOVA was used for statistical analysis of more than two groups of samples.

      (5) Although the results are interesting and convincing, the manuscript needs some careful editing and proofreading. As far as I could catch, there are more than 100 errors and typos, as I summarized in minor comments. I recommend the authors proofread thoroughly to make this work easier to read.

      Thanks for the reviewer’s efforts. We changed all of these errors and polish the language of this paper. 

      Minor comments:

      (1) Line 30: nature -> natural

      (2) Line 86: elegnas -> elegans

      (3) Line 93: the17h -> the 17h

      (4) Line 97: response -> respond

      (5) Line106: responded -> respond

      (6) Lien 107-109: Add references for the three reporters

      (7) Line 114: immune -> immune pathway

      (8) Line 118: immune depended -> immune-dependent

      (9) Line 128, 594, 596: deferentially -> differentially

      (10) Line 131: Explain what IRE-1-mediated splicing of xbp-1 with references

      (11) Line 170: XPB-1 -> XBP-1

      (12) Line 179: URP -> UPR

      (13) Line 181: hsp-4::GFP -> Phsp-4::GFP

      (14) Line 183: Italicize E. coli; mutant -> mutants

      (15) Line 184: irg-5::GFP -> Pirg-5::GFP (2 places)

      (16) Line 197, 203, 206, 207: Lactose -> lactose

      (17) Line 206, 209, 217, 225, 228, 232, 237, 262, 442, 445, 604, 739: Glucose -> glucose

      (18) Line 218: Sugars deficiency -> sugar deficiency

      (19) Line 229: found contribute to -> found to contribute to

      (20) Line 235, 537, 539, 587, 599, 642, 855: Italicize E. coli

      (21) Line 236: same -> the same

      (22) Line 239: I recommend adding "in C. elegans". This study uses both E. coli and C.

      elegans genetics. Sometimes, it is confusing which organism was mentioned. It should be applied where it is necessary.

      (23) Line 240: additional -> addition

      (24) Line 339, 642: Italicize kgb-1

      (25) Line 390: Italicize Pseudomonas aeruginosa, Bacillus thuringiensis,

      Staphylococcus aureus, and Serratia marcescens

      (26) Line 394: wiht -> with

      (27) Line 400, 550: Change ER to superscript; Italicize ire-1, xbp-1, and pmk-1

      (28) Line 415: xpb-1 -> xbp-1

      (29) Line 460, 525, 531, 532, 617, 655: Italicize yfbR

      (30) Line 457, 468, 472, 475, 482, 497, 513, 624, 629, 633, 733. 758: Vitamin -> vitamin

      (31) Line 459: Make it clear what is the relationship between vitamin C and TAA

      (32) Line 527: Do not italicize mutant

      (33) Line 538: Phsp-6:GFP -> Phsp-6::GFP (to match other descriptions)

      (34) Line 540: Phsp-4:GFP -> Phsp-4::GFP (to match other descriptions)

      (35) Line 540: Italicize hsp-4

      (36) Line 543: Pirg-5:GFP -> Pirg-5::GFP (to match other descriptions) and italicize irg-5

      (37) Line 550, 881: Innate -> innate

      (38) Line 557, 560, 564, 838: Do not italicize HK

      (39) Line 561: Remove the extra space before "three"

      (40) Line 575, 577: Reporter -> reporter

      (41) Line 575, 607: Italicize Phsp-4::GFP

      (42) Line 577: immunity -> Immunity; Italicize Pirg-5::GFP

      (43) Line 585, 653: keio -> Keio

      (44) Line 586: hsp-4::GFP -> Phsp-4::GFP

      (45) Line 586, 589 (2 places): irg-5::GFP -> Pirg-5::GFP

      (46) Line 597: Remove "all"

      (47) Line 600: Trehalose -> trehalose

      (48) Line 609: Italicize Pirg-5::GFP

      (49) Line 615: critically -> critical

      (50) Line 636: Remove "+"

      (51) Line 656 (2 places), 682: Do not italicize OP50

      (52) Line 664: Lead -> lead

      (53) Line 681: Describe the composition of NGM or show the reference. Since this paper examines nutrition, the composition of the medium is crucial.

      (54) Line 686-706: Italicize all allele names. Be consistent with how to write the promoter to avoid confusion (e.g., ttx-3p -> Pttx-3). Be consistent with how to describe the transgene (e.g., Phsp-4::GFP(zcIs4) -> zcIs4[Phsp-4::GFP])

      (55) Line 710: Describe the composition of LB or show the reference. Since this paper examines nutrition, the composition of the medium is crucial.

      (56) Line 709, 856 (2 places), 858: Do not italicize K12 to make it consistent

      (57) Line 719: Podr-1p:RFP -> Podr-1::RFP

      (58) Line 722, 724: Italicize ges-1 and xbp-1

      (59) Line 723: Pges-1:xbp-1::GFP -> Pges-1::xbp-1::GFP

      (60) Line 735: Glucuronic -> glucuronic

      (61) Line 748: I believe it is 5 mm instead of 0.5 mm

      (62) Line 750: The equation should be (5 mm)2/(17.5 mm)2

      (63) Line 759: Remove the period after "pattern".

      (64) Line 766: Describe how they were synchronized

      (65) Line 774: Italicize Psysm-1p::GFP

      (66) Line 785: Insert a space before "until"

      (67) Line 787: the mutant -> mutant

      (68) Line 789, 792, 793, 795 (2 places): GPF -> GFP

      (69) Line 791: next -> Next; an -> a

      (70) Line 799: Remove a space before "MRC".

      (71) Line 804: I do not understand what "until adulthood" means in this context;

      Remove a space before "by". (I recommend searching double space and correcting it.)

      (72) Line 853: Metabolome -> metabolome

      (73) Line 893-1082: Species and gene names should be italicized in Reference

      (74) Figures 1F, 1G, S2F, S2G: The panels' order should match the bar graphs' order. The apparent difference in the representative data does not match the marginal difference in the bar graph in Fig. 1G. The authors should double-check the results.

      (75) Figure 1F, 2A, 2B, 3C, 3D, 3E, 4D, 4I, S1J, S2A, S2B, S2I, S3B, S3F, S3H: hsp-4::GFP -> Phsp-4::GFP

      (76)  Figure 1G, 2D, 3F, 4E, 4J, S1K, S2H, S3C, S3I: irg-5::GFP -> Pirg-5::GFP

      (77)  Figure 6: Liquids -> Lipids; Italicize ire-1, xbp-1, pmk-1

      (78)  Figure S1I: hsp-6::GFP -> Phsp-6::GFP

      (79)  In the legend for Figure S1 after Figure S1, (A), (B)... were duplicated. It is OK in the corresponding main text (Line 530)

      (80)  Figure S2F, S3G, S4C, S4D: sysm-1::GFP -> Psysm-1::GFP

      (81)  Figure S2G: irg-1::GFP -> Pirg-1::GFP

      (82)  Figure S3H and S3I: Describe which ones are Glu + conditions

      References: 

      (1) Patananan AN, Budenholzer LM, Pedraza ME, Torres ER, Adler LN, Clarke SG. The invertebrate Caenorhabditis elegans biosynthesizes ascorbate. Arch Biochem Biophys 569, 32-44 (2015).

      (2) Yabuta Y_, et al. L-Ascorbate Biosynthesis Involves Carbon Skeleton Rearrangement in the Nematode Caenorhabditis elegans. _Metabolites 10,  (2020).

      (3) Weaver BP, Weaver YM, Omi S, Yuan W, Ewbank JJ, Han M. Non-Canonical Caspase Activity Antagonizes p38 MAPK Stress-Priming Function to Support Development. Dev Cell 53, 358-369 e356 (2020).

      (4) Geng S_, et al. Gut commensal E. coli outer membrane proteins activate the host food digestive system through neural-immune communication. _Cell Host Microbe 30, 1401-1416 e1408 (2022).

      (5)  Richardson CE, Kooistra T, Kim DH. An essential role for XBP-1 in host protection against immune activation in C. elegans. Nature 463, 1092-1095 (2010).

      (6) Harding HP_, et al. An Integrated Stress Response Regulates Amino Acid Metabolism and Resistance to Oxidative Stress. _Molecular Cell 11, 619-633 (2003).

      (7) Qi B, Kniazeva M, Han M. A vitamin-B2-sensing mechanism that regulates gut protease activity to impact animal’s food behavior and growth. eLife 6, e26243 (2017).

      (8) Calfon M_, et al. IRE1 couples endoplasmic reticulum load to secretory capacity by processing the XBP-1 mRNA. _Nature 415, 92-96 (2002).

      (9) Bolz DD, Tenor JL, Aballay A. A Conserved PMK-1/p38 MAPK Is Required in Caenorhabditis elegans Tissue-specific Immune Response to Yersinia pestis Infection*. The Journal of Biological Chemistry 285, 10832 - 10840 (2010).

    1. Author response:

      The following is the authors’ response to the original reviews.

      Public Reviews:

      Reviewer #1 (Public Review):

      Ritvo and colleagues present an impressive suite of simulations that can account for three findings of differentiation in the literature. This is important because differentiation-in which items that have some features in common, or share a common associate are less similar to one another than are unrelated items-is difficult to explain with classic supervised learning models, as these predict the opposite (i.e., an increase in similarity). A few of their key findings are that differentiation requires a high learning rate and low inhibitory oscillations, and is virtually always asymmetric in nature.

      This paper was very clear and thoughtful-an absolute joy to read. The model is simple and elegant, and powerful enough to re-create many aspects of existing differentiation findings. The interrogation of the model and presentation of the findings were both extremely thorough. The potential for this model to be used to drive future work is huge. I have only a few comments for the authors, all of which are relatively minor.

      (1) I was struck by the fact that the "zone" of repulsion is quite narrow, compared with the zone of attraction. This was most notable in the modeling of Chanales et al. (i.e., just one of the six similarity levels yielded differentiation). Do the authors think this is a generalizable property of the model or phenomenon, or something idiosyncratic to do with the current investigation? It seems curious that differentiation findings (e.g., in hippocampus) are so robustly observed in the literature despite the mechanism seemingly requiring a very particular set of circumstances. I wonder if the authors could speculate on this point a bit-for example, might the differentiation zone be wider when competitor "pop up" is low (i.e., low inhibitory oscillations), which could help explain why it's often observed in hippocampus? This seems related a bit to the question about what makes something "moderately" active, or how could one ensure "moderate" activation if they were, say, designing an experiment looking at differentiation.

      We thank the reviewer for this comment. In the previous version of the manuscript, in the section entitled “Differentiation Requires a High Learning Rate and Is Sensitive to Activation Dynamics”, we discussed some reasons why differentiation may be more likely to be found in the hippocampus – namely, the high learning rate of the hippocampus and the sparsity of hippocampal activation patterns (pp. 27-28):

      “These results have implications for where to look for differentiation in the brain. Our finding that differentiation requires a high learning rate suggests that differentiation will be more evident in the hippocampus than in neocortex, insofar as hippocampus is thought to have a higher learning rate than neocortex (McClelland et al., 1995). In keeping with this prediction, numerous studies have found differentiation effects in hippocampus but not in neocortical regions involved in sensory processing (e.g., Chanales et al., 2017; Favila et al., 2016; Zeithamova et al., 2018). At the same time, some studies have found differentiation effects in neocortex (e.g., Schlichting et al., 2015; Wammes et al., 2022). One possible explanation of these neocortical differentiation effects is that they are being ``propped up’’ by top-down feedback from differentiated representations in the hippocampus. This explanation implies that disruptions of hippocampal processing (e.g., lesions, stimulation) will eliminate these neocortical differentiation effects; we plan to test this prediction in future work.

      Additionally, the simulations where we adjusted the oscillation amount (using our model of Schlichting et al., 2015) imply that differentiation will be most evident in brain regions where it is relatively hard to activate competitors. Given the U shape of the NMPH learning rule, limiting competitor activity makes it less likely that plasticity will ``cross over'' from weakening (and differentiation) to strengthening (and integration). Thus, within the hippocampus, subregions with sparser activity (e.g., dentate gyrus, and to a lesser extent, CA3; Barnes et al., 1990, GoodSmith et al., 2017; West et al., 1991) will be more prone to differentiation. There is strong empirical support for this prediction. For example, Wammes et al. (2022) manipulated the similarity of stimuli in a statistical learning experiment and found that moderate levels of visual similarity were associated with significant differentiation in the dentate gyrus but not other subregions. Also, numerous studies have found greater differentiation in dentate gyrus / CA3 than in CA1 (e.g., Dimsdale-Zucker et al., 2018; Wanjia et al., 2021; Molitor et al., 2021; Kim et al., 2017; but see Zheng et al., 2021).”

      In the revised draft we have supplemented this discussion with a new section entitled “Reconciling the Prevalence of Differentiation in the Model and in the Data” (pp. 30-31):

      “A key lesson from our model is that, from a computational perspective, it is challenging to obtain differentiation effects: The region of parameter space that gives rise to differentiation is much smaller than the one that gives rise to integration (for further discussion of this issue, see the section in Methods on Practical Advice for Getting the Model to Show Differentiation). However, the fact that integration is more prevalent in our simulations across parameter configurations does not mean that integration will be more prevalent than differentiation in real-life circumstances. What really matters in predicting the prevalence of differentiation in real life is how the parameters of the brain map on to parameters of the model: If the parameters of the brain align with regions of model parameter space that give rise to differentiation (even if these regions are small), this would explain why differentiation has been so robustly observed in extant studies. Indeed, this is exactly the case that we sought to make above about the hippocampus – i.e., that its use of especially sparse coding and a high learning rate will give rise to the kinds of neural dynamics that cause differentiation (as opposed to integration). As another example, while it is true that half of the overlap conditions in our simulation of Chanales et al. (2021) give rise to integration, this does not imply that integration will occur half of the time in the Chanales et al. (2021) study; it may be that the levels of overlap that are actually observed in the brain in Chanales et al. (2021) are more in line with the levels of overlap that give rise to differentiation in our model.”

      (2) With real fMRI data we know that the actual correlation value doesn't matter all that much, and anti-correlations can be induced by things like preprocessing decisions. I am wondering if the important criterion in the model is that the correlations (e.g., as shown in Figure 6) go down from pre to post, versus that they are negative in sign during the post learning period. I would think that here, similar to in neural data, a decrease in correlation would be sufficient to conclude differentiation, but would love the authors' thoughts on that.

      We thank the reviewer for bringing this up. In the paper, we define differentiation as the moving apart of representations – so we agree with the reviewer that it would be appropriate to conclude that differentiation is taking place when correlations go down from pre to post.

      In addition to the definitional question (“what counts as differentiation”), one can also ask the mechanistic question of what is happening in the model at the (simulated) neuronal level in conditions where differentiation (i.e., an average decrease in similarity from pre to post) occurs. Here, the model’s answer is clear: When the similarity of two pairmates decreases, it is because the pairmates have acquired anticorrelated representations at the (simulated) neuronal level. When similarity decreases on average from pre to post, but the average “post” similarity value is not negative, this is because there is a mix of outcomes across runs of the model (due to variance in the initial, random model weights and also variance in the order in which items are presented across training epochs) – some runs lead to differentiation (manifested as anticorrelated pairmate representations) whereas others lead to no change or integration. The average pre-to-post change depends on the relative frequencies with which these different outcomes occur.

      We have made several edits to the paper to clarify this point.

      We added a new section under “Results” in our simulation of Chanales et al. (2021) entitled, “Pairs of Items that Differentiate Show Anticorrelated Representations” (p. 15):

      “Figure 6B also highlights that, for learning rates where robust differentiation effects occur in aggregate (i.e., there is a reduction in mean pattern similarity, averaging across model runs), these aggregate effects involve a bimodal distribution across model runs: For some model runs, learning processes give rise to anticorrelated representations, and for other model runs the model shows integration; this variance across model runs is attributable to random differences in the initial weight configuration of the model. The aggregate differentiation effect is therefore a function of the proportion of model runs showing differentiation (here, anticorrelation) and the proportion of model runs showing integration. The fact that differentiation shows up as anticorrelation in the model's hidden layer relates to the learning effects discussed earlier:

      Unique competitor units are sheared away from (formerly) shared units, so the competitor ends up not having any overlap with the target representation (i.e., the level of overlap is less than you would expect due to chance, which mathematically translates into anticorrelation). We return to this point and discuss how to test for anticorrelation in the Discussion section.”

      We added new text to the “Take-Home Lessons” section in the Chanales et al. (2021) simulation (p. 17):

      “In particular, the simulations expose some important boundary conditions for when representational change can occur according to the NMPH (e.g., that differentiation depends on a large learning rate, but integration does not), and the simulations provide a more nuanced account of exactly how representations change (e.g., that differentiation driven by the NMPH is always asymmetric, whereas integration is sometimes asymmetric and sometimes symmetric; and that, when differentiation occurs on a particular model run, it tends to give rise to anticorrelated representations in the model's hidden layer).”

      We added new text to the “Nature of Representational Change” section in the Favila et al. (2016) simulation (p. 21):

      “Figure 8 - Supplement 1 also indicates that, as in our simulation of Chanales et al. (2021), individual model runs where differentiation occurs show anticorrelation between the pairmate representations, and gradations in the aggregate level of differentiation that is observed across conditions reflect differences in the proportion of trials showing this anticorrelation effect.”

      We added new text to the “Take-Home Lessons” section in the Favila et al. (2016) simulation (p.21):

      “As in our simulation of \cite{chanales2021adaptive}, we found that the NMPH-mediated differentiation was asymmetric, manifested as anticorrelation between pairmate representations on individual model runs, and required a high learning rate, leading to abrupt representational change.”

      We added new text to the “Nature of Representational Change” section in the Schlichting et al. (2015) simulation (p. 26):

      “Also, as in our other simulations, when differentiation occurs on a particular model run it tends to give rise to anticorrelated representations (results not shown).”

      We added new text to the “Take-Home Lessons” section in the Schlichting et al. (2015) simulation (pp. 26-27):

      “As in the other versions of our model, differentiation requires a high learning rate, and – on model runs when it occurs – it is asymmetric and gives rise to anticorrelated representations.”

      We added new text at the start of the Discussion (p. 27):

      “In addition to qualitatively replicating the results from the studies we simulated, our model gives rise to several novel predictions – most notably, that differentiation driven by the NMPH requires a rapid learning rate and, when it occurs for a particular pair of items, it is asymmetric and gives rise to anticorrelated representations.”

      We also added a new section in the Discussion entitled “Testing the Model's Prediction about Anticorrelation”, which (among other things) highlights the reviewer’s point that fMRI pattern similarity values can be affected by preprocessing choices (p. 30):

      “Even though we operationally define differentiation as a reduction in similarity with learning, the way that it actually shows up on individual model runs is as anticorrelation between pairmates; in the model, the size of the aggregate differentiation effect is determined by the proportion of model runs that show this anticorrelation effect (vs. no change or integration). This implies that, if we could get a clean measurement of the similarity of pairmates in an experiment, we might see a multimodal distribution, with some pairmates showing anticorrelation, and others showing increased correlation (integration) or no change in similarity. This kind of clean readout of the similarity of individual pairs might be difficult to obtain with fMRI; it is more feasible that this could be obtained with electrophysiology. Another challenge with using fMRI to test this prediction is that anticorrelation at the individual-neuron level might not scale up to yield anticorrelation at the level of the BOLD response; also, fMRI pattern similarity values can be strongly affected by preprocessing choices – so a negative pattern similarity value does not necessarily reflect anticorrelation at the individual-neuron level. A final caveat is that, while we predict that differentiation will show up as anticorrelation in the brain region that gives rise to the differentiation effect, this might not translate into anticorrelation in areas that are downstream of this region (e.g., if the hippocampus is the source of the differentiation effect, we would expect anticorrelation there, but not necessarily in neocortical regions that receive input from the hippocampus; we revisit this point later in the discussion, when we address limitations and open questions).”

      We added new text in the Discussion, under “Limitations and Open Questions” (p. 31):

      “Importantly, while hippocampus can boost the representation of unique features in neocortex, we expect that neocortex will continue to represent shared perceptual features (e.g., in Favila et al., 2016, the fact that both pairmates are photos of barns). For this reason, in paradigms like the one used by Favila et al. (2016), the predicted effect of hippocampal differentiation on neocortical representations will be a reduction in pattern similarity (due to upregulation in the representation of unique pairmate features) but neocortex should not cross over into anticorrelation in these paradigms (due to its continued representation of shared perceptual features). Indeed, this is exactly the pattern that Wanjia et al. (2021) observed in their study, which used similar stimuli to those used in Favila et al. (2016).”

      Lastly, we updated the Abstract (p. 1)

      “What determines when neural representations of memories move together (integrate) or apart (differentiate)? Classic supervised learning models posit that, when two stimuli predict similar outcomes, their representations should integrate. However, these models have recently been challenged by studies showing that pairing two stimuli with a shared associate can sometimes cause differentiation, depending on the parameters of the study and the brain region being examined. Here, we provide a purely unsupervised neural network model that can explain these and other related findings. The model can exhibit integration or differentiation depending on the amount of activity allowed to spread to competitors – inactive memories are not modified, connections to moderately active competitors are weakened (leading to differentiation), and connections to highly active competitors are strengthened (leading to integration). The model also makes several novel predictions – most importantly, that when differentiation occurs as a result of this unsupervised learning mechanism, it will be rapid and asymmetric, and it will give rise to anticorrelated representations in the region of the brain that is the source of the differentiation. Overall, these modeling results provide a computational explanation for a diverse set of seemingly contradictory empirical findings in the memory literature, as well as new insights into the dynamics at play during learning.”

      (3) For the modeling of the Favila et al. study, the authors state that a high learning rate is required for differentiation of the same-face pairs. This made me wonder what happens in the low learning rate simulations. Does integration occur?

      For the same-face condition of the Favila simulation, lowering learning rate does not result in an overall integration effect:

      Author response image 1.

      In other cases, we do see integration emerge at lower learning rates – e.g., in the Schlichting interleaved condition we see a small integration effect emerge for a learning rate value of 0.3:

      Author response image 2.

      Our view is that, while integration can emerge at low learning rates, it is not a reliable property of the model – in some cases, there is a “window” of learning rates where there is enough learning to drive integration but not enough to drive differentiation, and in other cases there is not. Given this lack of reliability across simulations, we would prefer not to discuss this in the paper.

      This paradigm has a lot of overlap with acquired equivalence, and so I am thinking about whether these are the sorts of small differences (e.g., same-category scenes and perhaps a high learning rate) that bias the system to differentiate instead of integrate.

      We agree that it would be very interesting to use the model to explore acquired equivalence and related phenomena, but we think it is out of scope of the current paper. We have added some text to the Discussion under “Limitations and Open Questions” (p. 32):

      “Another important future direction is to apply the model to a wider range of learning phenomena involving representational change – for example, acquired equivalence, which (like some of the studies modeled here) involves linking distinct stimuli to a shared associate (see, e.g., Honey and Hall, 1989; Shohamy and Wagner, 2008; Myers et al., 2003; Meeter et al., 2009; de Araujo Sanchez and Zeithamova, 2023). It is possible that some of these phenomena might be better explained by supervised learning, or a mixture of unsupervised and supervised learning, than by unsupervised learning alone.”

      (4) For the simulations of the Schlichting et al. study, the A and B appear to have overlap in the hidden layer based on Figure 9, despite there being no similarity between the A and B items in the study (in contrast to Favila et al., in which they were similar kinds of scenes, and Chanales et al., in which they were similar colors). Why was this decision made? Do the effects depend on some overlap within the hidden layer? (This doesn't seem to be explained in the paper that I saw though, so maybe just it's a visualization error?)

      Overlap in the pretrained hidden representations of A and B is not strictly necessary for these effects – it would be possible to reconfigure other parameters to get high levels of competition even if there were no overlap (e.g., by upregulating the strengths of connections from shared input features). Having said that, it is definitely true that overlap between the pretrained hidden representations boosts competition, and we think it is justified to posit this in the Schlichting simulation. We have now added an explanation for this in the paper (p. 23):

      “New text in Schlichting, “Knowledge Built into the Network”

      Matching the previous two simulations, we pretrained the weights so the hidden representations of the stimuli initially had 2/6 units in common. Even though the A and B stimuli used in the actual experiment did not have obvious feature overlap (they were randomly selected novel objects), it is important to note that the hidden layer is not simply a representation of the sensory features of the A and B stimuli; the hidden layer also receives input from the output layer, which represents the shared associate of A and B (X). We think that the presence of this shared associate justifies our use of initially-overlapping hidden representations.”

      (5) It seems as though there were no conditions under which the simulations produced differentiation in both the blocked and intermixed conditions, which Schlichting et al. observed in many regions (as the present authors note). Is there any way to reconcile this difference?

      We thank the reviewer for bringing this up. If we set the connection strength between X (in the output layer) and A (in the hidden layer) in the blocked condition to .9 instead of .999 (keeping this connection strength at .8 for the interleaved condition) and we set Osc to .0615, we observe differentiation in both conditions.

      Rather than replacing the original results in the paper, which would entail re-making the associated videos, etc., we have added a supplementary figure (Figure 10 - Supplement 1), which is included on p. 46.

      We also added the following to the Results section of the Schlichting simulation in the main text (p. 26):

      “Figure 10 - Supplement 1 shows results from an alternative parameterization where, in the low-oscillation-amplitude condition, differentiation is observed in both the blocked and interleaved conditions (mirroring results from Schlichting et al., 2015, who found differentiation in both conditions in several regions of interest, including parts of the hippocampus and medial prefrontal cortex).”

      (6) A general question about differentiation/repulsion and how it affects the hidden layer representation in the model: Is it the case that the representation is actually "shifted" or repelled over so it is no longer overlapping? Or do the shared connections just get pruned, such that the item that has more "movement" in representational space is represented by fewer units on the hidden layer (i.e., is reduced in size)? I think, if I understand correctly, that whether it gets shifted vs. reduce would depend on the strength of connections along the hidden layer, which would in turn depend on whether it represents some meaningful continuous dimension (like color) or not. But, if the connections within the hidden layer are relatively weak and it is the case that representations become reduced in size, would there be any anticipated consequences of this (e.g., cognitively/behaviorally)?

      The representations are shifted – this is discussed in the Chanales results section:

      “Because the activity ``set point'' for the hidden layer (determined by the kWTA algorithm) involves having 6 units active, and the unique parts of the competitor only take up 4 of these 6 units, this leaves room for activity to spread to additional units. Given the topographic projections in the output layer, the model is biased to ``pick up'' units that are adjacent in color space to the currently active units; because activity cannot flow easily from the competitor back to the target (as a result of the aforementioned severing of connections), it flows instead {\em away} from the target, activating two additional units, which are then incorporated into the competitor representation. This sequence of events (first a severing of the shared units, then a shift away from the target) completes the process of neural differentiation, and is what leads to the behavioral repulsion effect in color recall (because the center-of-mass of the color representation has now shifted away from the target).”

      Reviewer #2 (Public Review):

      This paper addresses an important computational problem in learning and memory. Why do related memory representations sometimes become more similar to each other (integration) and sometimes more distinct (differentiation)? Classic supervised learning models predict that shared associations should cause memories to integrate, but these models have recently been challenged by empirical data showing that shared associations can sometimes cause differentiation. The authors have previously proposed that unsupervised learning may account for these unintuitive data. Here, they follow up on this idea by actually implementing an unsupervised neural network model that updates the connections between memories based on the amount of coactivity between them. The goal of the authors' paper is to assess whether such a model can account for recent empirical data at odds with supervised learning accounts. For each empirical finding they wish to explain, the authors built a neural network model with a very simple architecture (two inputs layers, one hidden layer, and one output layer) and with prewired stimulus representations and associations. On each trial, a stimulus is presented to the model, and inhibitory oscillations allow competing memories to pop up. Pre-specified u-shaped learning rules are used to update the weights in the model, such that low coactivity leaves model connections unchanged, moderate coactivity weakens connections, and high coactivity strengthens connections. In each of the three models, the authors manipulate stimulus similarity (following Chanales et al), shared vs distinct associations (following Favila et al), or learning strength (a stand in for blocked versus interleaved learning schedule; following Schlichting et al) and evaluate how the model representations evolve over trials.

      As a proof of principle, the authors succeed in demonstrating that unsupervised learning with a

      simple u-shaped rule can produce qualitative results in line with the empirical reports. For instance, they show that pairing two stimuli with a common associate (as in Favila et al) can lead to *differentiation* of the model representations. Demonstrating these effects isn't trivial and a formal modeling framework for doing so is a valuable contribution. Overall, the authors do a good job of both formally describing their model and giving readers a high level sense of how their critical model components work, though there are some places where the robustness of the model to different parameter choices is unclear. In some cases, the authors are very clear about this (e.g. the fast learning rate required to observe differentiation). However, in other instances, the paper would be strengthened by a clearer reporting of the critical parameter ranges.

      We thank the reviewer for raising this point. The interdependence of parameters in our model makes it infeasible to identify critical parameter ranges. We have added a paragraph to the “Approach to Parameterization and Data Fitting” section in the Methods to address this point (p. 33):

      “The overall goal of this modeling work is to account for key empirical regularities regarding differentiation and integration and to establish boundary conditions on these regularities. As such, the modeling work described below focuses more on qualitative fits to general properties of the data space than on quantitative fits to results from specific studies. Automatic parameter optimization is not feasible for this kind of model, given the large number of model parameters and the highly interactive, nonlinear nature of competitive dynamics in the model; consequently, model fitting was done by hand.

      These complex interactions between parameters also make it infeasible to list “critical parameter ranges” for generating particular model outcomes. Our experience in working with the model has been that activation dynamics are what matter most for learning, and that disparate parameter sets can give rise to the same activation dynamics and -- through this -- the same learning effects; likewise, similar parameter sets can give rise to different activation dynamics and different learning outcomes. Consequently, in this paper we have focused on characterizing the dynamics that give rise to different learning effects (and how they can be affected by local parameter perturbations, e.g., relating to learning rate and oscillation size), rather than the – impossible, we believe – task of enumerating the full set of parameter configurations that give rise to a particular result.”

      For instance, it's clear from the manipulation of oscillation strength in the model of Schlichting et al that this parameter can dramatically change the direction of the results. The authors do report the oscillation strength parameter values that they used in the other two models, but it is not clear how sensitive these models are to small changes in this value.

      In some cases, the effects of oscillation strength are relatively smooth. For example, in the Favila simulation, increasing the oscillation amplitude Osc effectively recapitulates the U-shaped curve (i.e., higher levels of Osc lead to more competitor activation, which initially leads to weakening / differentiation but then gives way to strengthening / integration), as is shown for the Favila Different Face condition in this plot:

      Author response image 3.

      In the Chanales 2/6 overlap condition, the effects of varying Osc are more nonlinear:

      Author response image 4.

      We think this is attributable to the increased “all-or-none” recurrent dynamics in this simulation (due to the recurrent projections within the output layer), which make it more difficult to evoke moderate (vs. high) levels of activation. This difficulty in reliably obtaining graded activation dynamics is likely a consequence of the small-scale (“toy”) nature of the model and the simple inhibitory mechanisms employed here, as opposed to being a generalizable property of the brain – presumably, the actual brain employs more nuanced and effective means of controlling activation. Furthermore, we don’t think that the high prevalence of integration in the model’s parameter space necessarily translates into a prediction that integration should be more prevalent overall – see the new “Reconciling the Prevalence of Differentiation in the Model and in the Data” section described in response to one of the reviewer’s other points below. Due to the paper already being quite long, we have opted not to include the above plots / discussion in the paper.

      Similarly, it's not clear whether the 2/6 hidden layer overlap (only explicitly manipulated in the model of Chanales et al) is required for the other two models to work.

      When we were parameterizing the model, we opted to keep the 2/6 level of overlap for all of the simulations and we adjusted other parameters to fit the data; in part, this was because overlap can only be adjusted in discrete jumps, whereas other influential parameters in the model can be adjusted in a more graded, real-valued way. Our use of 2/6 overlap (as opposed to, say, 1/6 or 3/6 overlap) for the Favila and Schlichting models was done out of convenience, and should not be interpreted as a strong statement that this particular level of overlap is necessary for obtaining differentiation; we could easily get the model to show differentiation given other overlap levels by adjusting other parameters.

      Finally, though the u-shaped learning rule is essential to this framework, the paper does little formal investigation of this learning rule. It seems obvious that allowing the u-shape to collapse too much toward a horizontal line would reduce the model's ability to account for empirical results, but there may be other more interesting features of the learning rule parameterization that are essential for the model to function properly.

      Given that the paper is already quite long, we have opted not to include further exploration of the parameters of the U-shaped learning rule in the paper. However, for the reviewer’s information, we report the effects of a few illustrative manipulations of these parameters below. As a general principle, the effects of these manipulations make sense in light of the theoretical framework described in the paper.

      For example, the parameter “DRevMag” controls the size of the negative “dip” in the U-shaped curve (more negative values = a larger dip). Given that this negative dip is essential for severing weights to competitors and causing differentiation, shifting DRevMag upwards towards zero should shift the balance of the model away from differentiation and towards integration. This is indeed what we observe, as shown in this parameter sweep from the Chanales simulation:

      Author response image 5.

      As another example: The “DRev” parameter controls where the U-shaped curve transitions from negative weight change to positive weight change. Lower values of DRev mean that the region of coactivity values leading to negative weight change will be smaller, and the region of coactivity values leading to positive weight change will be larger. As such, we would expect that lower values of DRev would bias the model toward integration. That is indeed the case, as shown in this parameter sweep from the Schlichting Blocked simulation:

      Author response image 6.

      There are a few other points that may limit the model's ability to clearly map onto or make predictions about empirical data. The model(s) seems very keen to integrate and do so more completely than the available empirical data suggest. For instance, there is a complete collapse of representations in half of the simulations in the Chanales et al model and the blocked simulation in the Schlichting et al model also seems to produce nearly complete integration Even if the Chanales et al paper had observed some modest behavioral attraction effects, this model would seem to over-predict integration. The author's somewhat implicitly acknowledge this when they discuss the difficulty of producing differentiation ("Practical Advice for Getting the Model to Show Differentiation") and not of producing integration, but don't address it head on.

      We thank the reviewer for this comment – R1 had a similar comment. We have added a new section to the Discussion to address this point (p. 30):

      “Reconciling the Prevalence of Differentiation in the Model and in the Data.

      A key lesson from our model is that, from a computational perspective, it is challenging to obtain differentiation effects: The region of parameter space that gives rise to differentiation is much smaller than the one that gives rise to integration (for further discussion of this issue, see the section in Methods on Practical Advice for Getting the Model to Show Differentiation). However, the fact that integration is more prevalent in our simulations across parameter configurations does not mean that integration will be more prevalent than differentiation in real-life circumstances. What really matters in predicting the prevalence of differentiation in real life is how the parameters of the brain map on to parameters of the model: If the parameters of the brain align with regions of model parameter space that give rise to differentiation (even if these regions are small), this would explain why differentiation has been so robustly observed in extant studies. Indeed, this is exactly the case that we sought to make above about the hippocampus – i.e., that its use of especially sparse coding and a high learning rate will give rise to the kinds of neural dynamics that cause differentiation (as opposed to integration). As another example, while it is true that half of the overlap conditions in our simulation of Chanales et al. (2021) give rise to integration, this does not imply that integration will occur half of the time in the Chanales et al. (2021) study; it may be that the levels of overlap that are actually observed in the brain in Chanales et al. (2021) are more in line with the levels of overlap that give rise to differentiation in our model.”

      Second, the authors choice of strongly prewiring associations in the Chanales and Favila models makes it difficult to think about how their model maps onto experimental contexts where competition is presumably occurring while associations are only weakly learned. In the Chanales et al paper, for example, the object-face associations are not well learned in initial rounds of the color memory test. While the authors do justify their modeling choice and their reasons have merit, the manipulation of AX association strength in the Schlichting et al model also makes it clear that the association strength has a substantial effect on the model output. Given the effect of this manipulation, more clarity around this assumption for the other two models is needed.

      We thank the reviewer for bringing this up. We have edited the section entitled “A Note on Prewiring Representations” in the Methods to further justify our choice to prewire associations in the Chanales and Favila models (p. 37):

      “In our model, our practice of ``prewiring'' memory representations for the A and B pairmates serves two functions. In some cases, it is meant to stand in for actual training (as in the blocked / interleaved manipulation; the connections supporting the AX association are prewired to be stronger in the blocked condition than in the interleaved condition). However, the other, more fundamental role of prewiring is to ensure that the A and B input patterns evoke sparse distributed representations in the hidden layer (i.e., where some units are strongly active but most other units are inactive). In the real brain, this happens automatically because the weight landscape has been extensively sculpted by both experience and evolution. For example, in the real hippocampus, when the second pairmate is presented for the first time, it will evoke a sparse distributed representation in the CA3 subfield (potentially overlapping with the first pairmate’s CA3 representation) even before any learning of the second pairmate has occurred, due to the strong, sparse mossy fiber projections that connect the dentate gyrus to CA3 (McNaughton & Morris, 1987). As discussed above, we hypothesize that this initial, partial overlap between the second pairmate’s representation and the first pairmate’s representation can lead to pop-up of the unique features of the first pairmate’s representation, triggering learning that leads to differentiation or integration. In our small-scale model, we are effectively starting with a ``blank brain''; in the absence of prewiring, the A and B inputs would activate overly diffuse representations that do not support these kinds of competitive dynamics. As such, prewiring in our model is necessary for proper functioning. The presence of prewired A and B representations should therefore not be interpreted as reflecting a particular training history (except in the blocked / interleaved case above); rather, these prewired representations constitute the minimum step we would take to ensure well-defined competitive dynamics in our small-scale model.

      The fact that connection strengths serve this dual function – sometimes reflecting effects of training (as in our simulation of Schlichting et al., 2015) and in other cases reflecting necessary prewiring – complicates the interpretation of these strength values in the model. Our view is that this is a necessary limitation of our simplified modeling approach – one that can eventually be surmounted through the use of more biologically-detailed architectures (see Limitations and Open Questions in the Discussion).”

      Overall, this is strong and clearly described work that is likely to have a positive impact on computational and empirical work in learning and memory. While the authors have written about some of the ideas discussed in this paper previously, a fully implemented and openly available model is a clear advance that will benefit the field. It is not easy to translate a high-level description of a learning rule into a model that actually runs and behaves as expected. The fact that the authors have made all their code available makes it likely that other researchers will extend the model in numerous interesting ways, many of which the authors have discussed and highlighted in their paper.

      Reviewer #3 (Public Review):

      This paper proposes a computational account for the phenomenon of pattern differentiation (i.e., items having distinct neural representations when they are similar). The computational model relies on a learning mechanism of the nonmonotonic plasticity hypothesis, fast learning rate and inhibitory oscillations. The relatively simple architecture of the model makes its dynamics accessible to the human mind. Furthermore, using similar model parameters, this model produces simulated data consistent with empirical data of pattern differentiation. The authors also provide insightful discussion on the factors contributing to differentiation as opposed to integration. The authors may consider the following to further strengthen this paper:

      The model compares different levels of overlap at the hidden layer and reveals that partial overlap seems necessary to lead to differentiation. While I understand this approach from the perspective of modeling, I have concerns about whether this is how the human brain achieves differentiation. Specifically, if we view the hidden layer activation as a conjunctive representation of a pair that is the outcome of encoding, differentiation should precede the formation of the hidden layer activation pattern of the second pairmate. Instead, the model assumes such pattern already exists before differentiation. Maybe the authors indeed argue that mechanistically differentiation follows initial encoding that does not consider similarity with other memory traces?

      Related to the point above, because the simulation setup is different from how differentiation actually occurs, I wonder how valid the prediction of asymmetric reconfiguration of hidden layer connectivity pattern is.

      We thank the reviewer for this comment. In the revised manuscript, we have edited the “Note on Prewiring Representations” in the Methods to clarify how our assumptions about prewiring relate to what we really think is happening in the brain (p. 37):

      “In our model, our practice of ``prewiring'' memory representations for the A and B pairmates serves two functions. In some cases, it is meant to stand in for actual training (as in the blocked / interleaved manipulation; the connections supporting the AX association are prewired to be stronger in the blocked condition than in the interleaved condition). However, the other, more fundamental role of prewiring is to ensure that the A and B input patterns evoke sparse distributed representations in the hidden layer (i.e., where some units are strongly active but most other units are inactive). In the real brain, this happens automatically because the weight landscape has been extensively sculpted by both experience and evolution. For example, in the real hippocampus, when the second pairmate is presented for the first time, it will evoke a sparse distributed representation in the CA3 subfield (potentially overlapping with the first pairmate’s CA3 representation) even before any learning of the second pairmate has occurred, due to the strong, sparse mossy fiber projections that connect the dentate gyrus to CA3 (McNaughton & Morris, 1987). As discussed above, we hypothesize that this initial, partial overlap between the second pairmate’s representation and the first pairmate’s representation can lead to pop-up of the unique features of the first pairmate’s representation, triggering learning that leads to differentiation or integration. In our small-scale model, we are effectively starting with a ``blank brain''; in the absence of prewiring, the A and B inputs would activate overly diffuse representations that do not support these kinds of competitive dynamics. As such, prewiring in our model is necessary for proper functioning. The presence of prewired A and B representations should therefore not be interpreted as reflecting a particular training history (except in the blocked / interleaved case above); rather, these prewired representations constitute the minimum step we would take to ensure well-defined competitive dynamics in our small-scale model.

      The fact that connection strengths serve this dual function – sometimes reflecting effects of training (as in our simulation of Schlichting et al., 2015) and in other cases reflecting necessary prewiring – complicates the interpretation of these strength values in the model. Our view is that this is a necessary limitation of our simplified modeling approach – one that can eventually be surmounted through the use of more biologically-detailed architectures (see Limitations and Open Questions in the Discussion).”

      Although as the authors mentioned, there haven't been formal empirical tests of the relationship between learning speed and differentiation/integration, I am also wondering to what degree the prediction of fast learning being necessary for differentiation is consistent with current data. According to Figure 6, the learning rates lead to differentiation in the 2/6 condition achieved differentiation after just one-shot most of the time. On the other hand, For example, Guo et al (2021) showed that humans may need a few blocks of training and test to start showing differentiation.

      We thank the reviewer for mentioning this. We have added a paragraph to the “Differentiation Requires a High Learning Rate and Is Sensitive to Activity Dynamics” section of the Discussion that addresses this point (pp. 28-29):

      “Although the results from Wanjia et al. (2021) provide strong support for the model's prediction that differentiation will be abrupt, they raise another question: What explains variance across items in when this abrupt change takes place? The answer to this question remains to be seen, but one possibility is encoding variability: If we assume that participants stochastically sample (i.e., attend to) the features of the scene pairmates, it is possible that participants might initially fail to sample the features that distinguish the scene pairmates, which can be quite subtle – and if the distinguishing features of the pairmates are not represented in high-level visual regions (i.e., the pairmates are represented in these regions as having the same features), this could delay the onset of differentiation until the point at which the distinguishing features happen (by chance) to be sampled.”

      Related to the point above, the high learning rate prediction also seems to be at odds with the finding that the cortex, which has slow learning (according to the theory of complementary learning systems), also shows differentiation in Wammes et al (2022).

      We now address this point in the section of the Discussion entitled “Differentiation Requires a High Learning Rate and Is Sensitive to Activity Dynamics” (p. 27):

      “Our finding that differentiation requires a high learning rate suggests that differentiation will be more evident in the hippocampus than in neocortex, insofar as hippocampus is thought to have a higher learning rate than neocortex (McClelland et al., 1995). In keeping with this prediction, numerous studies have found differentiation effects in hippocampus but not in neocortical regions involved in sensory processing (e.g., Chanales et al., 2017; Favila et al., 2016; Zeithamova et al., 2018). At the same time, some studies have found differentiation effects in neocortex (e.g., Schlichting et al., 2015; Wammes et al., 2022). One possible explanation of these neocortical differentiation effects is that they are being ``propped up’’ by top-down feedback from differentiated representations in the hippocampus.”

      More details about the learning dynamics would be helpful. For example, equation(s) showing how activation, learning rate and the NMPH function work together to change the weight of connections may be added. Without the information, it is unclear how each connection changes its value after each time point.

      We thank the reviewer for this comment. We have made two major changes to address this concern. First, we have edited the “Learning” section within “Basic Network Properties” in the main text (pp. 6-7):

      “Connection strengths in the model between pairs of connected units x and y were adjusted at the end of each trial (i.e., after each stimulus presentation) as a U-shaped function of the coactivity of x and y, defined as the product of their activations on that trial. The parameters of the U-shaped learning function relating coactivity to change in connection strength (i.e., weakening / strengthening) were specified differently for each projection where learning occurs (bidirectionally between the input and hidden layers, the hidden layer to itself, and the hidden to output layer). Once the U-shaped learning function for each projection in each version of the model was specified, we did not change it for any of the various conditions. Details of how we computed coactivity and how we specified the U-shaped function can be found in the Methods section.”

      Second, we have added the requested equations to the “Learning” part of the Methods (pp. 37-38):

      The right side of the function, strong activation leads to strengthening of the connectivity, which I assume will lead to stronger activation on the next time point. The model has an upper limit of connection strength to prevent connection from strengthening too much. The same idea can be applied to the left side of the function: instead of having two turning points, it can be a linear function such that low activation keeps weakening connection until the lower limit is reached. This way the NMPH function can take a simpler form (e.g., two line-segments if you think the weakening and strengthening take different rates) and may still simulate the data.

      We thank the reviewer for mentioning this. We have added a new paragraph in the “Learning” section of the Methods to justify the particular shape of the learning curve (pp. 38-39):

      “Evidence for the U-shaped plasticity function used here (where low activation leads to no change, moderate activation leads to weakening, and higher levels of activation lead to strengthening) was previously reviewed in Ritvo et al. (2019). In brief, there are three lines of work that support the U shape: First, multiple neurophysiological studies have found that moderate postsynaptic depolarization leads to synaptic weakening and higher levels of depolarization lead to synaptic strengthening (e.g., Artola et al., 1990; Hansel et al., 1996). Second, human neuroscience studies have used pattern classifiers, applied to fMRI and EEG data, to measure memory activation, and have related this measure to subsequent memory accessibility; several studies using this approach have found that low levels of activation lead to no change in memory strength, moderate levels of activation lead to impaired subsequent memory, and higher levels of activation lead to increased subsequent memory (e.g., Newman and Norman, 2010; Detre et al., 2013; Kim et al., 2014; for related findings, see Lewis-Peacock and Norman, 2014; Wang et al., 2019). Third, a recent human fMRI study by Wammes et al. (2022) manipulated memory activation by varying the visual similarity of pairmates and observed a U-shaped function relating visual similarity to representational change in the hippocampus, whereby low levels of pairmate similarity were associated with no change, moderate levels of similarity were associated with differentiation, and the differentiation effect went away at higher levels of similarity.

      We have also included a pointer to this new paragraph in the “Nonmonotonic Plasticity Hypothesis” section of Introduction (p. 2):

      (for further discussion of the empirical justification for the NMPH, see the Learning subsection in the Methods)”

      Recommendations for the authors:

      Reviewer #1 (Recommendations For The Authors):

      A few additional minor things about data presentation and the like:

      (1) Figure 1 legend - a more general description of how to interpret the figure might be helpful for more naive readers (e.g., explaining how one can visualize in the schematic that there is overlap in the hidden layer between A and B). Also, from the Figure 1 depiction, it's not clear what is different about the setup from the initial left hand side panels in A, B, C, to make it such that activity spreads strongly to A in panel A, weakly in panel B, and not at all in panel C since the weights are the same. Is there a way to incorporate this into the graphic, or describe it in words?

      To address this point, we have added the following text to the Figure 1 caption (p. 3):

      “Note that the figure illustrates the consequences of differences in competitor activation for learning, without explaining why these differences would arise. For discussion of circumstances that could lead to varying levels of competitor activation, see the simulations described in the text.”

      (2) I believe not all of the papers cited on lines 193-195 actually have similarity manipulations in them. I'd recommend double checking this list and removing those less relevant to the statement.

      Thank you for pointing this out; we have removed the Ballard reference and we have clarified what we mean by similarity reversal (p. 7):

      “The study was inspired by recent neuroimaging studies showing ``similarity reversals'', wherein stimuli that have more features in common (or share a common associate) show less hippocampal pattern similarity (Favila et al., 2016; Schlichting et al., 2015; Molitor et al., 2021; Chanales et al., 2017; Dimsdale-Zucker et al., 2018; Wanjia et al., 2021; Zeithamova et al., 2018; Jiang et al., 2020; Wammes et al., 2022).”

      (3) I wanted a bit more detail about how the parameters were set in the main paper, not just in the methods. Even something as brief as noting that model fitting was done by hand by tweaking parameters to re-create the empirical patterns (if I'm understanding correctly) would have been helpful for me.

      To address this point, we have added the following text under “Basic Network Properties” (p. 4):

      “Our goal was to qualitatively fit key patterns of results from each of the aforementioned studies. We fit the parameters of the model by hand as they are highly interdependent (see the Methods section for more details).”

      (4) In Figure 4E, it would be helpful to describe the x and y axes of the MDS plots in the legend.

      To address this point, we have added the following new text to the Figure 4 caption that clarifies how the MDS plots were generated (p. 11):

      “MDS plots were rotated, shifted, and scaled such that pairmate 1before is located at (0,0), pairmate 2before is located directly to the right of pairmate 1before, and the distance between pairmate 1before and pairmate 2before is proportional to the baseline distance between the pairmates.”

      (5) Figure 6 - at first I thought the thicker line was some sort of baseline, but I think it is just many traces on top of one another. If other readers may be similarly confused, perhaps this could be stated.

      Thanks for this comment. We have updated Figure 6 (p. 16).

      We have also updated the caption.

      I am having a lot of difficulty understanding the terms "competitor-to-competitor,"

      "competitor-to-target/shared," and "target/shared-to-target/shared," and therefore I don't fully get Figure 5. I think it might be helpful to expand the description of these terms where they are first introduced in the paper (p. 13?). I think I am missing something crucial here, and I am not quite sure what that is-which I know is not very helpful! But, to narrate my confusion a bit, I thought that these terms would somehow relate to connections between different connections of the network. For example is competitor-to-competitor within the hidden layer? Or is this somehow combining across relevant connections that might span different pairs of layers in the model? And, I really have no idea why it is "target/shared."

      Thank you for these comments. We have updated Figure 5 and we have also made several changes to the main text and the figure caption to address these points.

      Changes to the main text (p. 13):

      “Whether symmetric or asymmetric integration occurs depends on the relative strengths of connections between pairs of unique competitor units (competitor-competitor connections) compared to connections between unique competitor units and shared units (competitor-shared connections) after the first trial (Figure 5; note that the figure focuses on connections between hidden units, but the principle also applies to connections that span across layers). Generally, coactivity between unique competitor units (competitor-competitor coactivity) is less than coactivity between unique competitor units and shared units (competitor-shared coactivity), which is less than coactivity between unique target units and shared units (target-shared coactivity).”

      (7) Relatedly in Figure 13, I understand how some competitor-to-target/shared connections could be spared in the bottom instance given panel B. However, I'm struggling to understand how that relates to the values in the corresponding chart in panel A. What about panel A, bottom (vs. the top) means lower coactivities between some competitor-to-target/shared? Is it because if the noise level is higher, the "true" activation of competitor-to-target/shared connections is weaker? I think again, I'm missing something critical here! and wonder if other readers may be in the same situation. (I know the authors described this also on p. 36, but I'm still confused!)

      We have updated Figure 13 to clarify these points.

      (8)  In Figure 9, I believe there is no caption for panel D. Also, it looks as though the item unit active for A and B is the same. I wonder if this is an error?

      Thank you for catching these errors! They have both been fixed.

      Reviewer #2 (Recommendations For The Authors):

      -Perhaps I missed it, but I think defining coactivity (how it is computed) in the main text would be useful for readers, as this is critical for understanding the model. I did find it in the methods.

      We thank the reviewer for this suggestion. We have updated the “Learning” section within “Basic Network Properties” in the main text to address this point (pp. 6-7):

      “Connection strengths in the model between pairs of connected units x and y were adjusted at the end of each trial (i.e., after each stimulus presentation) as a U-shaped function of the coactivity of x and y, defined as the product of their activations on that trial. The parameters of the U-shaped learning function relating coactivity to change in connection strength (i.e., weakening / strengthening) were specified differently for each projection where learning occurs (bidirectionally between the input and hidden layers, the hidden layer to itself, and the hidden to output layer). Once the U-shaped learning function for each projection in each version of the model was specified, we did not change it for any of the various conditions. Details of how we computed coactivity and how we specified the U-shaped function can be found in the Methods section.”

      -The modeling results in the different face condition are at odds with the data for the Favila et al model (they observe some differentiation in the paper and the model predicts no change). This could be due to a number of unmodeled factors, but it is perhaps worth noting.

      Thank you for pointing this out. It is possible to better capture the pattern of results observed by Favila et al. in their paper (with some differentiation in the different-face condition and even more differentiation in the same-face condition) by slightly adjusting the model parameters (specifically, by setting the oscillation amplitude Osc for the hidden layer to .1 instead of .067).

      Rather than replacing the old (Osc \= .067) results in the paper, which would entail re-making the associated videos, etc., we have added a supplementary figure (Figure 8 - Supplement 1; see p.45):

      We also added new text to the Favila Results, under “Differentiation and Integration” (p. 20):

      “Note also that the exact levels of differentiation that are observed in the different-face and same-face conditions are parameter dependent; for an alternative set of results showing some differentiation in the different-face condition (but still less than is observed in the same-face condition), see Figure 8 - Supplement 1.”

      -Related to my comment in the public review about pre-wiring associations, in the caption for Figure 9 (Schlichting model), the authors report "In both conditions, the pre-wired connection linking the "item B" hidden units to the "item X" output unit is set to .7. In the interleaved condition, the connection linking the "item A" hidden units to the "item X" output unit is set to .8, to reflect some amount of initial AX learning. In the blocked condition, the connection linking the "item A" hidden units to the "item X" output unit is set a higher value (.999), to reflect extra AX learning." What are the equivalent values for the other models, especially the Favila model since the structure is the same as Schlichting? I understood all the "strong" connections to be .99 unless otherwise stated. If that's the case, I don't understand why the blocked Schlichting model and the Favila model produce opposite effects. More clarity would be useful here.

      We have added a new paragraph to the results section for the Schlicting model (under “Differentiation and Integration”) to clarify why the blocked Schlichting model and the Favila model show different results (p. 24):

      “Note that the key feature driving integration in the blocked condition of this simulation is not the high strength of the connection from X to A on its own – rather, it is the asymmetry in the pretrained connection strengths from X to A (.999) and from X to B (.7). This asymmetry, which is meant to reflect the extensive training on A-X that occurred before the initial presentation of B-X, results in the A-X hidden representation decisively winning the competition during B-X presentation, which then leads to the B input also being linked to this representation (i.e., integration). It is instructive to compare this to the same-face condition from our simulation of Favila et al. (2016): In that simulation, the two pairmates are also linked strongly (.99 initial connection strength) to a shared associate, but in that case the connections are equally strong, so there is more balanced competition -- in this case, the competitor representation only comes to mind moderately (instead of displacing the target representation), so the result is differentiation instead of integration.”

      -The meaning of the different colored dots in Figure 5 is bit hard to keep track of, even given the legend labels. The figure might benefit from a model sketch highlighting each of the different coactivity types. The left side of Fig 13 was useful but again somehow mapping on the colors would help further. Another note on these figures: what does having two dots of each color mean? Is it just an illustration of the variance? There would be more dots if there was one dot per coactivity value.

      We have updated Figure 5 and Figure 13 to clarify these points (including a clarification that the dots only represent a subset of the possible pairings between units).

      -While I appreciate the goal of the paper is to account for these three studies, readers who aren't familiar with or specifically interested in these studies may appreciate a small amount of intuition on why formalizing unsupervised learning models may be broadly important for computational investigations of learning/memory/cognition.

      We have added the following text under “Basic Network Properties” in the Introduction to address this point (p. 4):

      “Achieving a better understanding of unsupervised learning is an important goal for computational neuroscience, given that learning agents have vastly more opportunities to learn in an unsupervised fashion than from direct supervision (for additional discussion of this point, see, e.g., Zhuang et al., 2021).”

    1. Author response:

      The following is the authors’ response to the original reviews.

      eLife assessment

      In this useful study, the authors report the efficacy, hematological effects, and inflammatory response of the BPaL regimen (containing bedaquiline, pretomanid, and linezolid) compared to a variation in which Linezolid is replaced with the preclinical development candidate spectinamide 1599, administered by inhalation in tuberculosis-infected mice. The authors provide convincing evidence that supports the replacement of Linezolid in the current standard of care for drug-resistant tuberculosis. However, a limitation of the work is the lack of control experiments with bedaquiline and pretomanid only, to further dissect the relevant contributions of linezolid and spectinamide in efficacy and adverse effects.

      We acknowledge a limitation in our study due to lack of groups with monotherapy of bedaquiline and pretomanid however, similar studies to understand contribution of bedaquiline and pretomanid to the BPaL have been published already (references #4 and #60 in revised manuscript).  Our goal was to compare the BPaS versus the BPaL with the understanding that TB treatment requires multidrug therapy.   We omitted monotherapy groups to reduce complexity of the studies because the multidrug groups require very large number of animals with very intensive and complex dosing schedules. Even if B or Pa by themselves have better efficacy than the BPa or BPaL combination, patients will not be treated with only B or Pa because of very high risk of developing drug resistance to B or/and PA. If drug resistance is developed for B or Pa, the field will lose very effective drugs against TB. 

      Although the manuscript is well written overall, a re-formulation of some of the stated hypotheses and conclusions, as well as the addition of text to contextualize translatability, would improve value.

      Manuscript has been edited to address these critiques.  Answers to individual critiques are below.

      Public Reviews:

      Reviewer #1 (Public Review):

      Summary:

      This manuscript is an extension of previous studies by this group looking at the new drug spectinamide 1599. The authors directly compare therapy with BPaL (bedaquiline, pretomanid, linezolid) to a therapy that substitutes spectinamide for linezolid (BPaS). The Spectinamide is given by aerosol exposure and the BPaS therapy is shown to be as effective as BPaL without adverse effects. The work is rigorously performed and analyses of the immune responses are consistent with curative therapy.

      Strengths:

      (1) This group uses 2 different mouse models to show the effectiveness of the BPaS treatment.

      (2) Impressively the group demonstrates immunological correlates associated with Mtb cure with the BPaS therapy.

      (3) Linezolid is known to inhibit ribosomes and mitochondria whereas spectinaminde does not. The authors clearly demonstrate the lack of adverse effects of BPaS compared to BPaL.

      Weaknesses:

      (1) Although this is not a weakness of this paper, a sentence describing how the spectinamide would be administered by aerosolization in humans would be welcomed.

      We already reported on the aerodynamic properties of dry powder spectinamide 1599 within #3 HPMC capsules and its delivery from a RS01 Plastiape inhaler device (reference #59 in revised manuscript).  To address this critique, we added a last paragraph in discussion “It is proposed that human use of spectinamides 1599 will be administered using a dry powder formulation delivered by the RS01 Plastiape dry powder inhaler" (reference #59 in revised manuscript).  

      Reviewer #2 (Public Review):

      Summary:

      Replacing linezolid (L) with the preclinical development candidate spectinamide 1599, administered by inhalation, in the BPaL standard of care regimen achieves similar efficacy, and reduces hematological changes and proinflammatory responses.

      Strengths:

      The authors not only measure efficacy but also quantify histological changes, hematological responses, and immune responses, to provide a comprehensive picture of treatment response and the benefits of the L to S substitution.

      The authors generate all data in two mouse models of TB infection, each reproducing different aspects of human histopathology.

      Extensive supplementary figures ensure transparency. 

      Weaknesses:

      The articulation of objectives and hypotheses could be improved.

      We edited to "The AEs were associated with the long-term administration of the protein synthesis inhibitor linezolid. Spectinamide 1599 (S) is also a protein synthesis inhibitor of Mycobacterium tuberculosis with an excellent safety profile, but which lacks oral bioavailability. Here, we propose to replace L in the BPaL regimen with spectinamide administered via inhalation and we demonstrate that inhaled spectinamide 1599, combined with BPa ––BPaS regimen––has similar efficacy to that of BPaL regimen while simultaneously avoiding the L-associated AEs.

      Reviewer #3 (Public Review):

      Summary:

      In this paper, the authors sought to evaluate whether the novel TB drug candidate, spectinamide 1599 (S), given via inhalation to mouse TB models, and combined with the drugs B (bedaquiline) and Pa (pretomanid), would demonstrate similar efficacy to that of BPaL regimen (where L is linezolid). Because L is associated with adverse events when given to patients long-term, and one of those is associated with myelosuppression (bone marrow toxicity) the authors also sought to assess blood parameters, effects on bone marrow, immune parameters/cell effects following treatment of mice with BPaS and BPaL. They conclude that BPaL and BPaS have equivalent efficacy in both TB models used and that BPaL resulted in weight loss and anemia (whereas BPaL did not) under the conditions tested, as well as effects on bone marrow.

      Strengths:

      The authors used two mouse models of TB that are representative of different aspects of TB in patients (which they describe well), intending to present a fuller picture of the activity of the tested drug combinations. They conducted a large body of work in these infected mice to evaluate efficacy and also to survey a wide range of parameters that could inform the effect of the treatments on bone marrow and on the immune system. The inclusion of BPa controls (in most studies) and also untreated groups led to a large amount of useful data that has been collected for the mouse models per se (untreated) as well as for BPa - in addition to the BPaS and BPaL combinations which are of particular interest to the authors. Many of these findings related to BPa, BPaL, untreated groups, etc corroborate earlier findings and the authors point this out effectively and clearly in their manuscript. To go further, in general, it is a well-written and cited article with an informative introduction.

      Weaknesses:

      The authors performed a large amount of work with the drugs given at the doses and dosing intervals started, but at present, there is no exposure data available in the paper. It would be of great value to understand the exposures achieved in plasma at least (and in the lung if more relevant for S) in order to better understand how these relate to clinical exposures that are observed at marketed doses for B, Pa, and L as well as to understand the exposure achieved at the doses being evaluated for S. If available as historical data this could be included/cited. Considering the great attempts made to evaluate parameters that are relevant to clinical adverse events, it would add value to understand what exposures of drug effects such as anemia, weight loss, and bone marrow effects, are being observed. It would also be of value to add an assessment of whether the weight loss, anemia, or bone marrow effects observed for BPaL are considered adverse, and the extent to which we can translate these effects from mouse to patient (i.e. what are the limitations of these assessments made in a mouse study?). For example, is the small weight loss seen as significant, or is it reversible? Is the magnitude of the changes in blood parameters similar to the parameters seen in patients given L? In addition, it is always challenging to interpret findings for combinations of drugs, so the addition of language to explain this would add value: for example, how confident can we be that the weight loss seen for only the BPaL group is due to L as opposed to a PK interaction leading to an elevated exposure and weight loss due to B or Pa?

      We totally agree with this critique but the studies suggested by the reviewer are very expensive and

      logistically/resource intensive. Data reported in this manuscript was used as preliminary data in a RO1 application to NIH-NIAID that included studies proposed above by this reviewer. The authors are glad to report that the application got a fundable score and is currently under consideration for funding by NIH-NIAID.   The summary of proposed future studies is included in the last paragraph of the discussion in this revised manuscript. 

      Turning to the evaluations of activity in mouse TB models, unfortunately, the evaluations of activity in the BALB/c mouse model as well as the spleens of the Kramnik model resulted in CFU below/at the limit of detection and so, to this reviewer's understanding of the data, comparisons between BPaL and BPaS cannot be made and so the conclusion of equivalent efficacy in BALB/c is not supported with the data shown. There is no BPa control in the BALB/c study, therefore it is not possible to discern whether L or S contributed to the activity of BPaL or BPaS; it is possible that BPa would have shown the same efficacy as the 3 drug combinations. It would be valuable to conduct a study including a BPa control and with a shorter treatment time to allow comparison of BPa, BPaS, and BPaL. 

      We agree with the reviewer these studies need to be done.  Some of them were recently published by our colleague Dr. Lyons (reference #60 in revised manuscript). The studies proposed by the reviewer will be performed under a new award under consideration for funding by the NIH-NIAID, the summary of future studies is included in the last paragraph of the discussion in this revised manuscript. 

      In the Kramnik lungs, as the authors rightly note, the studies do not support any contribution of S or L to BPa - i.e. the activity observed for BPa, BPaL, and BPaS did not significantly differ. Although the conclusions note equivalency of BPaL and BPaS, which is correct, it would be helpful to also include BPa in this statement;

      We edited and now included in lines #191 as requested 

      It would be useful to conduct a study dosing for a longer period of time or assessing a relapse endpoint, where it is possible that a contribution of L and/or S may be seen - thus making a stronger argument for S contributing an equivalent efficacy to L. The same is true for the assessment of lesions - unfortunately, there was no BPa control meaning that even where equivalency is seen for BPaL and BPaS, the reader is unable to deduce whether L or S made a contribution to this activity.

      Added in the future plans in the last paragraph of discussion

      “Future studies are already under consideration for funding by NIH-NIAID to understand the pharmacokinetics of mono, binary and ternary combinations of BPaS. These studies also aim to identify the optimal dose level and dosing frequency of each regimen along with their efficacy and relapse free-sterilization potential. Studies are also planned using a model-based pharmacokinetic-pharmacodynamic (PKPD) framework, guided by an existing human BPa PKPD model (reference #61 in revised manuscript), to find allometric human dose levels, dosing frequencies and treatment durations that will inform the experimental design of future clinical studies. 

      Recommendations for the authors:

      Reviewer #1 (Recommendations For The Authors):

      Although this is not a weakness of this paper, a sentence describing how the spectinamide would be administered by aerosolization in humans would be welcomed.

      Last paragraph of discussion was added “It is proposed that human use of spectinamides 1599 will be administered using a dry powder formulation delivered by the RS01 Plastiape dry powder inhaler". We already reported on the aerodynamic properties of dry powder spectinamide 1599 within #3 HPMC capsules and delivered from a RS01 Plastiape inhaler device (reference #59 in revised manuscript)

      Reviewer #2 (Recommendations For The Authors):

      Major comments

      The Abstract lacks focus and could more clearly convey the key messages.

      Edited as requested 

      The two mouse models and why they were chosen need to be described earlier. Currently, it's covered in the first section of the Discussion, but the reader needs to understand the utility of each model in answering the questions at hand before the first results are described, either in the introduction or in the opening section of the results.

      Thank you for suggestion, we agree.  We moved the first paragraph in discussion to last paragraph in Introduction. 

      Line 130: Please justify the doses and dosing frequency for S. A reference to a published manuscript could suffice if compelling.

      The dosing and regimens were previously reported by our groups in ref 21 and 22 in revised manuscript.- 

      (21) Robertson GT, Scherman MS, Bruhn DF, Liu J, Hastings C, McNeil MR, et al. Spectinamides are effective partner agents for the treatment of tuberculosis in multiple mouse infection models. J Antimicrob Chemother.

      2017;72(3):770–7. 

      (22) Gonzalez-Juarrero M, Lukka PB, Wagh S, Walz A, Arab J, Pearce C, et al. Preclinical Evaluation of Inhalational Spectinamide-1599 Therapy against Tuberculosis. ACS Infect Dis. 2021;7(10):2850–63. 

      Figures 1 E to H: several "ns" are missing, please add them.

      Edited as requested 

      Line 184 to 190: suggest moving the body weight plots to a Supplemental Figure, and at least double the size of the histology images to convey the message of lines 192-203.

      Please include higher magnification insets to illustrate the histopathological findings. In that same section, please add a sentence or two describing the lesion scoring concept/method. It is a nice added feature, not widespread in the field, and deserves a brief description.

      Edited as requested.  We added detailed description for scoring method in M&M under histopathology and lesion scoring

      Line 206: please add an introductory sentence explaining why one would expect S to cause (or not) hematological disruption, and why MCHC and RDW were chosen initially (they are markers of xyz). The first part of Figure 3 legend belongs to the Methods.

      To address this critique we added in #225-226 “The effect of L in the blood profile of humans and mouse has been reported (references #38-42 in revised manuscript) but the same has not been reported for S” . In line #229-230 we added “Of 20-blood parameters evaluated, two blood parameters were affected during treatment”. 

      The first part of Figure 3 legend belongs to the Methods.

      We edited Figure 3 to “During therapy of mice in Figure 1, the blood was collected at 1, 2- and 4-weeks posttreatment. The complete blood count was collected in VETSCAN® HM5 hematology analyzer (Zoetis)”.

      Line 218: please explain why the 4 blood parameters that are shown were selected, out of the 20 parameters surveyed.

      We added an explanation in line 239-240 “out 20-blood parameters evaluated, a total of four blood parameters were affected at 2 and 4-weeks-of treatment”.

      Line 243 and again Line 262 (similar to comment Line 206): please add an introductory paragraph explaining the motivation to conduct this analysis and the objective. Can the authors put the experiment in the context of their hypothesis?

      To address this critique, we added in line #235-237 “The Nix-TB trial associated the long-term administration of L within the BPaL regimen as the causative agent resulting in anemia in patients treated with the BPaL regimen (5).”

      Figure 4C (and the plasma and lung equivalent in the SI). This figure needs adequate labeling of axes: X axis = LOG CFU? Please add tick marks for all plots since log CFU is only shown for the bottom line. Y axes have no units: pg/mL as in B?

      Figure legend were edited to add (Y axis:pg/ml) and (X axis; log10CFU).  

      Line 255-256: please remove "pronounced" and "profound". There is a range of CFU reduction and cytokine reduction, from minor to major. The correlation trend is clear and those words are not needed.

      Edited as requested 

      Line 277-289, Figure 6: given the heterogeneity of a C3HeB/FeJ mouse lung (TB infected), and the very heterogeneous cell population distribution in these lungs (Fig. 6A), the validity of whole lung analysis on 2 or 3 mice (the legend should state what 1, 2 and 3 means, individual mice?) is put into question. "F4/80+ cells were observed significantly higher in BPaS compared to UnRx control": Figure S14 suggests a statistically significant difference, but nothing is said about the other cell type, which appears just as much reduced in BPaS compared to UnRx as F4/80+. Overall, sampling the whole lung for these analyses should be mentioned as a limitation in the Discussion.

      We agree with the reviewer that "visually" it appears as other populations in addition to F4/80 have statistical significance.  We run again the two way Anova with Tukey test and only the BPaS and UnRx for F4/80 is significant. 

      We edited figure S16 (previously S14) to add ns for every comparation.  

      In Figure 6A was edited ;  N=2 are 2 mice for Unrx and n=3 mice for BPaL/BPaS each.

      Line 355-360: "The BPa and BPaL regimens altered M:E in the C3HeB/FeJ TB model by suppressing myeloid and inducing erythroid lineages" This suggests that altered M:E is not associated with L, putting into question the comparison between BPaS, BPaL, and UnRx. Can the authors comment on how M:E is altered in BPa and not in BPaS?

      Our interpretation to this result was that addition of S in our regimen BPsS was capable of restoring the M:E ratio altered by the BPa and BPaL. This interpretation was included in main text in line #263-264 and is also now added to abstract

      Line 379: discuss the limitations of working with whole lungs.

      Sorry we cannot understand this request. In our studies we always work with whole lungs if the expected course of histopathology/infection among lung lobes is very variable (as is the case of C3HeB/Fej TB model)

      Concluding paragraph: "Here we present initial results that are in line with these goals." If such a bold claim is made, there needs to be a discussion on the translatability of the route of administration and the dose of S. Otherwise, please rephrase.

      We added the following last paragraph to discussion:

      To conclude, the TB drug development field is working towards developing shorter and safer therapies with a common goal of developing new multidrug regimens of low pill burden that are accessible to patients, of short duration (ideally 2-3 months) and consist of 3-4 drugs of novel mode-of-action with proven efficacy, safety, and limited toxicity. Here we present initial results for new multidrug regimens containing inhaled spectinamide 1599 that are in line with these goals. It is proposed that human use of spectinamides 1599 will be administered using a dry powder formulation delivered by the RS01 Plastiape dry powder inhaler.  We already reported on the aerodynamic properties of dry powder spectinamide 1599 within #3 HPMC capsules and delivered from a RS01 Plastiape inhaler device (reference #59 in revised manuscript). Future studies are already under consideration for funding by NIHNIAID to understand the pharmacokinetics of mono, binary and ternary combinations of BPaS. These studies also aim to identify the optimal dose level and dosing frequency of each regimen along with their efficacy and relapse free-sterilization potential. Studies are also planned using a model-based pharmacokinetic-pharmacodynamic (PKPD) framework, guided by an existing human BPa PKPD model (references #60 and 61 in revised manuscript) , to find allometric human dose levels, dosing frequencies and treatment durations that will inform the experimental design of future clinical studies.

      Minor edits

      Adverse events, not adverse effects (side effects)

      Edited as requested

      BALB/c (not Balb/c, please change throughout).

      Edited as requested

      Line 92: replace 'efficacy' with potency or activity.

      Edited as requested

      "Live" body weight: how is that different from "body weight"? Suggest deleting "live" throughout, or replace with "longitudinally recorded" if that's what is meant, although this is generally implied.

      Edited as requested

      The last line of Figure 2 legend is disconnected. 

      Line 331: delete "human".

      Edited as requested

      Reviewer #3 (Recommendations For The Authors):

      We thank the reviewer for these suggestions.  The data presented in this manuscript with 4 weeks of treatment along with monitoring of effects of therapy in blood, bone marrow and immunity have been submitted for a RO1 application to NIH-NIAID, which have received a fundable score and is under funding consideration. All the points suggested by the reviewer(s) here are included in the research proposed in the RO1 application including manufacturing and physico-chemically characterize larger scale of dry powders of spectinmides and evaluation of their aerodynamic performance for human or animal use; Pharmacokinetics and efficacy studies to determine the optimal dose level and dosing frequency for new multidrug regimens containing spectinamides. These studies include mono, binary and ternary combinations of each multidrug regimen along with their efficacy and relapse free- sterilization potential. These studies will also develop PK/PD simulation-based allometric scaling to aid in human dose projections inhalation. We hope the reviewer will understand all together these studies will last 4-5 years.  

      Although I truly appreciate the great efforts of the authors, I suggest that in order to better evaluate the contribution of S versus L to BPa in these models, repeat studies be run that:

      (a) include BPa groups to allow the contribution of S and L to be assessed. Included in research proposed RO1 application mentioned above

      (b) use shorter treatment times in BALB/c to allow comparisons at end of Tx CFU above the LOD. We have added new data for 2 weeks treatment with BPaL and BPaS in Balb/c mice infected with MTb that was removed from previous submission of this manuscript

      (c) use longer treatment times and ideally a relapse endpoint in Kramnik to allow

      assessment of L and S as contributors to BPa (i.e. give a chance to see better efficacy of BPaL or BPaS versus BPa) and also measure plasma exposures of all drugs (or lung levels if this is the translatable parameter for S) to allow detection of any large DDI and also understand the translation to the clinic. Related to the safety parameters, it would be really great to understand whether or not the observations for BPaL would be labeled adverse in a toxicology study/in a clinical study, and it would be useful to include information on the magnitude of observations seen here versus in the clinic (eg for the hematological parameters).

      The research proposed in the RO1 application mentioned above included extensive PK, extended periods of treatment beyond 1 month of treatment (2-5 months as needed to reach negative culturable bacterial from organs) and of course relapse studies. 

      Minor point: I suggest rewording "high safety profile" when describing spectinomides in the intro - or perhaps qualify the length of dosing where the drug is well tolerated

      "high safety profile" was replaced by “an acceptable safety profile”

    1. Author response:

      The following is the authors’ response to the original reviews.

      eLife assessment  

      This important study builds on a previous publication (with partially overlapping authors), demonstrating that T. brucei has a continuous endomembrane system, which probably facilitates high rates of endocytosis. Using a range of cutting-edge approaches, the authors present compelling evidence that an actomyosin system, with the myosin TbMyo1 as the molecular motor, is localized close to the endosomal system in the bloodstream form (BSF) of Trypanosoma brucei. It shows convincingly that actin is important for the organization and integrity of the endosomal system, and that the trypanosome Myo1is an active motor that interacts with actin and transiently associates with endosomes, but a role of Myo1 in endomembrane function in vivo was not directly demonstrated. This work should be of interest to cell biologists and microbiologists working on the cytoskeleton, and unicellular eukaryotes.

      We were delighted at the editors’ positive assessment and the reviewers’ rigorous, courteous, and constructive responses to the paper. We agree that a direct functional role for TbMyo1 in endomembrane activity was not demonstrated in the original submission, but have incorporated some new data (see new supplemental Figure S5) using the TbMyo1 RNAi cell line which are consistent with our earlier observations and interpretations.  

      Public Reviews:   

      Reviewer #1 (Public Review):  

      Using a combination of cutting-edge high-resolution approaches (expansion microscopy, SIM, and CLEM) and biochemical approaches (in vitro translocation of actin filaments, cargo uptake assays, and drug treatment), the authors revisit previous results about TbMyo1 and TbACT in the bloodstream form (BSF) of Trypanosoma brucei. They show that a great part of the myosin motor is cytoplasmic but the fraction associated with organelles is in proximity to the endosomal system. In addition, they show that TbMyo1 can move actin filaments in vitro and visualize for the first time this actomyosin system using specific antibodies, a "classical" antibody for TbMyo1, and a chromobody for actin. Finally, using latrunculin A, which sequesters G-actin and prevents F-actin assembly, the authors show the delocalization and eventually the loss of the filamentous actin signal as well as the concomitant loss of the endosomal system integrity. However, they do not assess the localization of TbMyo1 in the same conditions.  

      Overall the work is well conducted and convincing. The conclusions are not over-interpreted and are supported by the experimental results. 

      We are very grateful to Reviewer1 for their balanced assessment. The reviewer is correct that we did not assess the localisation of TbMyo1 following latrunculin A treatment, but it is worth noting that Spitznagel et al. carried out this exact experiment in the earlier 2010 paper – we have mentioned this in the revised manuscript.  

      Reviewer #2 (Public Review):  

      Summary:  

      The study by Link et al. advances our understanding of the actomyosin system in T. brucei, focusing on the role 

      of TbMyo1, a class I myosin, within the parasite's endosomal system. Using a combination of biochemical fractionation, in vitro motility assays, and advanced imaging techniques such as correlative light and electron microscopy (CLEM), this paper demonstrates that TbMyo1 is dynamically distributed across early and late endosomes, the cytosol, is associated with the cytoskeleton, and a fraction has an unexpected association with glycosomes. Notably, the study shows that TbMyo1 can translocate actin filaments at velocities suggesting an active role in intracellular trafficking, potentially higher than those observed for similar myosins in other cell types. This work not only elucidates the spatial dynamics of TbMyo1 within T. brucei but also suggests its broader involvement in maintaining the complex architecture of the endosomal network, underscoring the critical role of the actomyosin system in a parasite that relies on high rates of endocytosis for immune evasion. 

      Strengths:  

      A key strength of the study is its exceptional rigor and successful integration of a wide array of sophisticated techniques, such as in vitro motility assays, and advanced imaging methods, including correlative light and electron microscopy (CLEM) and immuno-electron microscopy. This combination of approaches underscores the study's comprehensive approach to examining the ultrastructural organization of the trypanosome endomembrane system. The application of functional data using inhibitors, such as latrunculin A for actin depolymerization, further strengthens the study by providing insights into the dynamics and regulatory mechanisms of the endomembrane system. This demonstrates how the actomyosin system contributes to cellular morphology and trafficking processes. Furthermore, the discovery of TbMyo1 localization to glycosomes introduces a novel aspect to the potential roles of myosin I proteins within the cell, particularly in the context of organelles analogous to peroxisomes. This observation not only broadens our understanding of myosin I functionality but also opens up new avenues for research into the cellular biology of trypanosomatids, marking a significant contribution to the field. 

      We are very pleased that the Reviewer felt the work is a significant contribution to the state of the art.  

      Weaknesses:  

      Certain limitations inherent in the study's design and scope render the narrative incomplete and make it challenging to reach definitive conclusions. One significant limitation is the reliance on spatial association data, such as colocalization of TbMyo1 with various cellular components-or the absence thereof-to infer functional relationships. Although these data suggest potential interactions, the authors do not confirm functional or direct physical interactions.  

      While TbMyo1's localization is informative, the authors do not directly demonstrate its biochemical or mechanical activities in vivo, leaving its precise role in cellular processes speculative. Direct assays that manipulate TbMyo1 levels, activity, and/or function, coupled with observations of the outcomes on cellular processes, would provide more definitive evidence of the protein's specific roles in T. brucei. A multifaceted approach, including genetic manipulations, uptake assays, kinetic trafficking experiments, and imaging, would offer a more robust framework for understanding TbMyo1's roles. This comprehensive approach would elucidate not just the "what" and "where" of TbMyo1's function but also the "how" and "why," thereby deepening our mechanistic insights into T. brucei's biology.  

      The reviewer is absolutely correct that the study lacks data on direct or indirect interactions between TbMyo1 and its intracellular partners, and this is an obvious area for future investigation. Given the generally low affinities of motor-cargo interactions, a proximity labelling approach (such has already been successfully used in studies of other myosins) would probably be the best way to proceed. 

      The reviewer is also right to highlight that a detailed mechanistic understanding of TbMyo1 function in vivo is currently lacking. We feel that this would be beyond the scope of the present work, but have included some new data using the TbMyo1 RNAi cell line (Figure S5), which are consistent with our previous findings.  

      Reviewer #3 (Public Review):  

      Summary:  

      In this work, Link and colleagues have investigated the localization and function of the actomyosin system in the parasite Trypanosoma brucei, which represents a highly divergent and streamlined version of this important cytoskeletal pathway. Using a variety of cutting-edge methods, the authors have shown that the T. brucei Myo1 homolog is a dynamic motor that can translocate actin, suggesting that it may not function as a more passive crosslinker. Using expansion microscopy, iEM, and CLEM, the authors show that MyoI localizes to the endosomal pathway, specifically the portion tasked with internalizing and targeting cargo for degradation, not the recycling endosomes. The glycosomes also appear to be associated with MyoI, which was previously not known. An actin chromobody was employed to determine the localization of filamentous actin in cells, which was correlated with the localization of Myo1. Interestingly, the pool of actomyosin was not always closely associated with the flagellar pocket region, suggesting that portions of the endolysomal system may remain at a distance from the sole site of parasite endocytosis. Lastly, the authors used actin-perturbing drugs to show that disrupting actin causes a collapse of the endosomal system in T. brucei, which they have shown recently does not comprise distinct compartments but instead a single continuous membrane system with subdomains containing distinct Rab markers.  

      Strengths:  

      Overall, the quality of the work is extremely high. It contains a wide variety of methods, including biochemistry, biophysics, and advanced microscopy that are all well-deployed to answer the central question. The data is also well-quantitated to provide additional rigor to the results. The main premise, that actomyosin is essential for the overall structure of the T. brucei endocytic system, is well supported and is of general interest, considering how uniquely configured this pathway is in this divergent eukaryote and how important it is to the elevated rates of endocytosis that are necessary for this parasite to inhabit its host.  

      We are very pleased that the Reviewer formed such a positive impression of the work. 

      Weaknesses:  

      (1) Did the authors observe any negative effects on parasite growth or phenotypes like BigEye upon expression of the actin chromobody?  

      Excellent question! There did appear to be detrimental effects on cell morphology in some cells, and it would definitely be worth doing a time course of induction to determine how quickly chromobody levels reach their maximum. The overnight inductions used here are almost certainly excessive, and shorter induction times would be expected to minimise any detrimental effects. We have noted these points in the Discussion.  

      (2) The Garcia-Salcedo EMBO paper cited included the production of anti-actin polyclonal antibodies that appeared to work quite well. The localization pattern produced by the anti-actin polyclonals looks similar to the chromobody, with perhaps a slightly larger labeling profile that could be due to differences in imaging conditions. I feel that the anti-actin antibody labeling should be expressly mentioned in this manuscript, and perhaps could reflect differences in the F-actin vs total actin pool within cells.  

      Implemented. We have explicitly mentioned the use of the anti-actin antibody in the Garcia-Salcedo paper in the revised Results and Discussion sections.  

      (3) The authors showed that disruption of F-actin with LatA leads to disruption of the endomembrane system, which suggests that the unique configuration of this compartment in T. brucei relies on actin dynamics. What happens under conditions where endocytosis and endocyctic traffic is blocked, such as 4 C? Are there changes to the localization of the actomyosin components? 

      Another excellent question! We did not analyse the localisation of TbMyo1 and actin under temperature block conditions, but this would definitely be a key experiment to do in follow-up work.

      (4) Along these lines, the authors suggest that their LatA treatments were able to disrupt the endosomal pathway without disrupting clathrin-mediated endocytosis at the flagellar pocket. Do they believe that actin is dispensable in this process? That seems like an important point that should be stated clearly or put in greater context.  

      Whether actin plays a direct or indirect role in endocytosis would be another fascinating question for future enquiry, and we do not have the data to do more than speculate on this point. Recent work in mammalian cells (Jin et al., 2022) has suggested that actin is primarily recruited when endocytosis stalls, and it could be that a similar role is at play here. We have noted this point in the Discussion. The observation of clathrin vesicles close to the flagellar pocket membrane and clathrin patches on the flagellar pocket membrane itself in the LatA-treated cells might suggest that some endocytic activity can occur in the absence of filamentous actin. 

      Recommendations for the authors:

      Note from the Reviewing Editor:  

      During discussion, all reviewers agreed that the role of TbMyo1 in vivo in endomembrane function had not been directly demonstrated. This could be done by testing the endocytic trafficking of (for example) fluorophoreconjugated TfR and BSA in the existing Myo1 RNAi line, using wide-field microscopy. Examining the endosomes/lysosomes' organization by thin-section EM would be even better. The actin signal detected by the chromobody tends to occupy a larger region than the MyoI. It's therefore conceivable that actin filamentation and stabilization via other actin-interacting proteins create the continuous endosomal structure, while MyoI is necessary for transport or other related processes. 

      These are all excellent points and very good suggestions. We have now incorporated new data (supplemental Figure S5) that includes BSA uptake assays in the TbMyo1 RNAi cell line and electron microscopy imaging after TbMyo1 depletion – the results are consistent with our earlier observations.   

      Reviewer #1 (Recommendations For The Authors):  

      -  Figure S2E. This panel is supposed to show the downregulation of TbMyo1 in the PCF compared to BSF but there is no loading control to support this claim. This is important because the authors mention in lines 381-383 that this finding conflicts with the previous study (Spitznagel et al., 2010). The authors also indicate in the figure legend that there is 50% less signal but there is no explanation about this quantification.   

      Good point. Equal numbers of cells were loaded in each lane, but we did not have an antibody against a protein known to be expressed at the same level in both PCF and BSF cells to use as a loading control. Using a total protein stain would have been similarly unhelpful in this context, as the proteomes of PCF and BSF cells are dissimilar. The quantification was made by direct measurement after background subtraction, but without normalisation owing to the lack of a loading control. This makes the conclusion somewhat tentative, but given the large difference in signal observed between the two samples (and the fact that this is consistent with the proteomic data obtained by Tinti and Ferguson) we feel that the conclusion is valid. We have clarified these points in the figure legend and Discussion.  

      -  It is mentioned in the discussion, as unpublished observations, that the predicted FYVE motif of TbMyo1 can bind specifically PI(3)P lipids. This is a very interesting point that would be new and would strengthen the suggested association with the endosomal system mainly based on imaging data. 

      We agree that this is – potentially – a very exciting observation and it is an obvious direction for future enquiry.  

      The data are preliminary at this stage and will form the basis of a future publication. Given that the predicted FYVE domain of TbMyo1 and known lipid-binding activity of other class I myosins makes this activity not wholly unexpected, we feel that it is acceptable at this stage to highlight these preliminary findings.  

      -  The authors use the correlation coefficient to estimate the colocalization (lines 223-226). Although they clearly explain the difference between the correlation coefficient and the co-occurrence of two signals, I wonder if it would not be clearer for the audience to have quantification of the overlapping signals. Also, it is not mentioned on which images the correlation coefficient was measured. It seems that it is from widefield images (Figures 3E and 6E), and likely from SIM images for Figure 3C but the resolution is different. Are widefield images sufficient to assess these measurements? 

      With hindsight, and given the different topological locations of TbMyo1 and the cargo proteins (cytosolic and lumenal, respectively) it would probably have been wiser to measure co-occurrence rather than correlation, but we would prefer not to repeat the entire analysis at this stage. The correlations were measured from widefield images using the procedure described in the Materials & Methods. These are obviously lower resolution than confocal or SIM images would be, but are still of value, we believe. One further point – upon re-examination of some of the TbMyo1 transferrin (Tf) and BSA data, we noticed that there are many pixels with a value of 0 for Tf/BSA and a nonzero value for TbMyo1 and vice-versa. The incidence of zero-versus-nonzero values in the two channels will have lowered the correlation coefficient, and in this sense, the correlation coefficients are giving us a hint of what the immuno-EM images later confirm: that the TbMyo1 and cargo are present in the same locations, but in different proportions. We have added this point to the discussion.  

      -  It would be good to know if the loss of the endosomal system integrity (using EBI) is the same upon TbMyo1 depletion than in the latrunculin A treated parasites. 

      We agree! We have now included new data (Figure S5) that suggests endosomal system morphology is altered upon TbMyo1 depletion. We would predict that the effect upon TbMyo1 depletion is slower or less dramatic than upon LatA treatment (as LatA affects both actin and TbMyo1, given that TbMyo1 depends upon actin for its localisation).

      -  Conversely, it would be of interest to see how the localization of TbMyo1 changes upon latrunculin A treatment.

      This experiment was done in 2010 by Spitznagel et al., who observed a delocalisation of the TbMyo1 signal after LatA treatment. We have noted this in the Results and Discussion.

      Minor corrections:  

      -  Line 374: Figure S1 should be Figure S2. 

      Implemented (many thanks!).  

      -  Panel E of Figure S2 refers to TbMyo1 and should therefore be included in Figure S1 and not S2. 

      We would prefer not to implement this suggestion. We did struggle over the placing of this panel for exactly this reason, but as the samples were obtained as part of the experiments described in Figure S2, we felt that its placement here worked best in terms of the narrative of the manuscript.    

      -  Figure S2F: the population of TbMyo21 +Tet seems lost after 48 h although the authors mention that there is no growth defect. 

      Good eyes! We have re-added the panel, which shows that there was no growth defect in the tetracycline-treated population.  

      Reviewer #2 (Recommendations For The Authors):  

      Fig 1 vs. Figure 3: The biochemical fractionation experiments have been well-controlled, showing that 40% of TbMyo1 is found in both the cytosolic and cytoskeletal fractions, with only 20% in the organelle-associated fraction. The conclusion is supported by the experimental design, which includes controls to rule out crosscontamination between fractions. However, does this contrast with the widefield microscopy experiments, where the vast majority of the signal is in endocytic compartments and nowhere else? 

      This is a good point. There are three factors that probably explain this. First, given that the actin cytoskeleton is associated with the endosomal system, a large proportion of the material partitioning into the cytoskeleton (P2) fraction is probably localised to the endosomal system (a fun experiment would be to repeat the fractionation with addition of ATP to the extraction buffer to make the myosin dissociate and see whether more appeared in the SN2 fraction as a result). Second, the 40% of the TbMyo1 that is cytosolic is distributed throughout the entire cellular volume, whereas the material localised to the endosomes is concentrated in a much smaller space, by comparison, and producing a stronger signal. Third, the widefield microscopy images have had brightness and contrast adjusted in order to reduce “background” signal, though this will also include cytosolic molecules. We hope these explanations are satisfactory, but would welcome any additional thoughts from either the reviewer or the community.  

      The section title 'TbMyo1 translocates filamentous actin at 130 nm/s' could mislead readers by not specifying that the findings are from an in vitro experiment with a recombinant protein, which may not fully reflect the cell's complex context. Although this detail is noted in the figure legend, incorporating it into the main text and considering a title revision would ensure clarity and accuracy.  

      Good point. Implemented – we have amended the section title to “TbMyo1 translocates filamentous actin at 130 nm/s in vitro” and the figure legend title to “TbMyo1 translocates filamentous actin in vitro”.  

      The discussion of the translocation experiment could be better phrased addressing certain limitations. The in vitro conditions might not fully capture the complexity and dynamic nature of cellular environments where multiple regulatory mechanisms, interacting partners, and cellular compartments come into play. 

      Good point, implemented. We have added a note on this to the Discussion.  

      It is puzzling that RNAi, which is widely used in T. brucei was not used to further investigate the functional roles of TbMyo1 in Trypanosoma brucei. Given that the authors already had the cell line and used it to validate the specificity of the anti-TbMyo1. RNAi could have been employed to knock down TbMyo1 expression and observe the resultant effects on actin filament dynamics and organization within the cell. This would have directly tested TbMyo1's contribution to actin translocation observed in the in vitro experiments. 

      It would obviously be interesting to carry out an in-depth characterisation of the phenotype following TbMyo1 depletion and whether this has an effect on actin dynamics. We have now included additional data (supplemental Figure S5) using the TbMyo1 RNAi cells and the results are consistent with our earlier observations and interpretations. It is worth noting too that at least for electron microscopy studies of intracellular morphology, the slower onset of an RNAi phenotype and the asynchronous replication of T. brucei populations make observation of direct (early) effects of depletion challenging – hence the preferential use of LatA here to depolymerise actin and trigger a faster phenotype.  

      I found that several declarative statements within the main text may not be fully supported by the overall evidence. I suggest modifications to present a more balanced view,  

      Line 227: "The results here suggest that although the TbMyo1 distribution overlaps with that of endocytic cargo, the signals are not strongly correlated." This conclusion about the lack of strong correlation might mislead readers about the functional relationship between TbMyo1 and endocytic cargo, as colocalization does not directly imply functional interaction. 

      We would prefer not to alter this statement. It was our intention to phrase this cautiously, as we have not directly investigated the functional interplay between TbMyo1 and endocytic cargo and the subsequent sentence directs the reader to the Discussion for more consideration of this issue.    

      Line 397: "This relatively high velocity might indicate that TbMyo1 is participating in intracellular trafficking of BSF T. brucei and functioning as an active motor rather than a static tether." The statement directly infers TbMyo1's functional role from in vitro motility assay velocities without in vivo corroboration.

      We have amended the sentence in the Discussion to make it clear that it is speculative.  

      The hypothesis that cytosolic TbMyo1 adopts an auto-inhibited "foldback" configuration, drawn by analogy with findings from other studies, is intriguing. Yet, direct evidence linking this configuration to TbMyo1's function in T. brucei is absent from the data presented. 

      We have amended the sentence in the Discussion to make it clear that it is speculative. Future in vitro experiments will test this hypothesis directly.  

      The suggestion that a large cytosolic fraction of TbMyo1 indicates dynamic behavior, high turnover on organelles, and a low duty ratio is plausible but remains speculative without direct experimental evidence. Measurements of TbMyo1 turnover rates or duty ratios in T. brucei through kinetic studies would substantiate this claim with the necessary evidence.  

      We have amended the sentence in the Discussion to make it clear that it is speculative, and deleted the reference to a possible low duty ratio. Again, future in vitro experiments will measure the duty ratio of TbMyo1 using stopped-flow. 

      Reviewer #3 (Recommendations For The Authors):  

      Lines 171-172: The authors mention that MyoI could be functioning as a motor rather than a tether. The differences in myosin function have not been introduced prior to this. I would recommend explaining these differences and what it could mean for the function of the motor in the introduction to help a non-expert audience.

      Good point. Implemented.  

      Line 94-95: This phenotype only holds for the bloodstream form- the procyclic form are quite resistant to actin RNAi and MyoI RNAi. I would clarify. 

      Good point. Implemented.  

      Line 142-146: did the authors attempt to knock out the Myo21? 

      Good point. No, this was not attempted. Given the extremely low expression levels of TbMyo21 in the BSF cells we would not expect a strong phenotype, but this assumption would be worth testing. 

      Figure 3D: is there a reason why the authors chose to show the single-channel images in monochrome in this case?  

      Not especially. These panels are the only ones that show a significant overlap in the signals between the two channels (unlike the colabelling experiments with ER, Golgi), so greyscale images were used because of their higher contrast. 

      Line 397-398: I'm struggling a bit to understand how MyoI could be involved in intracellular trafficking in the endosomal compartments if the idea is that we have a continuous membrane? Some more detail as to the author's thinking here would be useful. 

      Implemented. We have noted that this statement is speculative, and emphasised that being an active motor does not automatically mean that it is involved in intracellular traffic – it could instead be involved in manipulating endosomal membranes. We have noted too that the close proximity between TbMyo1 and the lysosome (Figures

      3-5) could be important in this regard. The lysosome is not contiguous with the endosomal system, and it is possible that TbMyo1 is working as a motor to transport material (class II clathrin-coated vesicles) from the endosomal system to the lysosome.  

      Line 493-496: Does this mean that endocytosis from the FP does not require actin? This would be hard to explain considering the phenotypes observed in the original actin RNAi work. Is the BigEye phentopye observed in BSF actin RNAi and Myo1 RNAi cells due to some indirect effect? 

      It seems possible that actin is not directly or essentially involved in endocytosis, and the characterisation of the actin RNAi phenotype would be worth revisiting in this respect – we have noted this in the Discussion. Although RNAi of actin was lethal, the phenotype appears less penetrant than that seen following depletion of the essential endocytic cofactor clathrin (based on the descriptions in Garcia-Salcedo et al., 2004 and Allen et al., 2003). BigEye phenotypes occur in BSF cells whenever there is some perturbation of endomembrane trafficking and are not necessarily a direct consequence of depletion – this is why careful investigation of early timepoints following RNAi induction is critical.

    1. Author response:

      We are very appreciative of the reviewers’ assessment that we used “solid and creative” methods to provide a “convincing demonstration” of “compelling theoretical results” on a “crucial but less-explored issue” in cognitive neuroscience. We are also grateful for their thoughtful suggestions for analyses and for pointing out areas where our analysis descriptions need more clarity. While we will respond to all comments in a future response and revision, here we provide information and clarification on a few central points.

      Localization of semantic content:

      Regarding our semantic analysis, one reviewer rightly pointed out that items with a high degree of semantic association, as captured by word2vec, tend to occur in the same images, and they expressed concern that this could drive our similarity results. We wish to clarify here (and will revise the manuscript accordingly) that we excluded all pairs of co-occurring items in our word2vec semantic analysis in order to avoid this issue. Thus, our results cannot be driven by the number of images within which items co-occurred. We also agree with the reviewer who stated that “semantic information” is a nebulous term in the cognitive neurosciences, and it appears to have led to some confusion as to the nature of our claims. We take a broad view of this term, with the perspective that visual features (e.g., color, shape) can contribute to semantic content rather than necessarily competing with it. In our work, we use word2vec to identify neural representations that reflect the kind of semantic content present in word embedding models—but the conclusions we draw do not depend on these representations being devoid of visual content. That is, we do not use word2vec to examine semantic versus visual representations, but rather to narrow down the set of representations to be considered in subsequent analyses. While there are a range of legitimate views on what should be considered a “semantic” representation, our broad view, which is inclusive of visual content, along with our strategy for localizing semantic content are both standardly used in the visual neuroscience literature. Prior work in this literature has compared the ability of word2vec and low-level visual models to predict neural responses to natural images and found that the brain regions in which activity is accurately predicted by the models are considerably distinct: whereas a low-level visual model best predicts activity in V1, V2, and V4, word2vec performs better in more anterior regions, including in visual areas such as lateral occipital cortex (Güçlü & van Gerven, 2015, arXiv). This suggests that our effects are unlikely to be explained by overlap in the kinds of low-level visual features mentioned by the reviewers. However, the semantic content we localize and the representation of high-level visual features may indeed overlap, and this is compatible with our claims. We will do more in our revision to be explicit about our intended meaning in our use of the word “semantic” and how our approach relates to and builds on prior work in this literature.

      Long-term representational drift:

      We want to clarify our claims regarding the representational drift analysis. One reviewer stated that, while we show evidence of representational drift, we “provide no evidence suggesting that this long-term neural representational drift reflects a drift in semantic representation.” Another reviewer said: “The inference is that this [drift] is due to an updating of knowledge about the associations each item has had with other items,” and that our finding that semantic structure remains stable within these regions seems “to contradict the claims about semantic plasticity.” The claim we intended to make, which will be unpacked more clearly in our revision, is that the neural representations underlying semantic content drift over time, even if the semantic content itself is unchanging. In other words, we do not claim that our across-session drift analyses show changes in knowledge about object associations. Indeed, one of the reasons that representational drift has recently captured the attention of neuroscientists is that the neural representations underlying certain behaviors or cognitive content appear to drift over time even when the behaviors or cognitive content remain fixed. The relational structure of the neural representations can remain stable, even if the particular neurons recruited to represent each stimulus change over time (see, e.g., the T-maze in Rule, O’Leary, & Harvey., 2019, Curr Opin Neurobiol). Here we are translating these ideas, which were developed using animal models and/or primarily focused on low-level vision, to the semantic system in humans. The neural representations we identify in our paper capture semantic information because they share a similarity structure with word2vec, and the level of similarity to word2vec remains stable over time. Thus, our findings provide a simple demonstration of long-term representational drift in the human semantic system akin to that reported in animals—drift in the neural semantic representations of items even as the relations between these item representations appear stable.

      Signal-to-noise variability across the MTL:

      A reviewer raised the possibility that differences between our ROIs could be driven by variability in signal-to-noise ratio (SNR) across regions, particularly within the medial temporal lobe (MTL). We looked at noise ceiling SNR brain maps for each participant, which reflect the reliability of neural responses across repetitions of the same image. Preliminary analyses indicate that SNR differences do not account for our object encoding, semantic content, representational drift, or short-term plasticity measures across the MTL.

    1. Author response:

      The following is the authors’ response to the original reviews.

      Reviewer 1:

      This research used cell-based signaling assay and Gaussian-accelerated molecular dynamics (GaMD) to study peptide-mediated signaling activation of Polycystin-1 (PC1), which is responsible for the majority of autosomal dominant polycystic kidney disease (ADPKD) cases. Synthetic peptides of various lengths derived from the N-terminal portion of the PC1 C-terminal fragment (CTF) were applied to HEK293T cells transfected with stalkless mouse CTF expression construct. It was shown that peptides including the first 7, 9, and 17 residues of the N-terminal portion could activate signaling to the NFAT reporter. To further understand the underlying mechanism, docking and peptide-GaMD simulations of peptides composed of the first 9, 17, and 21 residues from the N-terminal portion of the human PC1 CTF were performed. These simulations revealed the correlation between peptide-CTF binding and PC1 CTF activation characterized by the close contact (salt bridge interaction) between residues R3848 and E4078. Finally, a Potts statistical model was inferred from diverged PC1 homologs to identify strong/conserved interacting pairs within PC1 CTF, some of which are highly relevant to the findings from the peptide GaMD simulations. The peptide binding pockets identified in the GaMD simulations may serve as novel targets for the design of therapeutic approaches for treating ADPKD.

      We greatly appreciate the reviewer’s encouraging and positive comments. The reviewer’ specific comments are addressed pointwise below and changes to the text will be highlighted in yellow in the revised manuscript.

      (1) The GaMD simulations all include exogenous peptides, thus lacking a control where no such peptide is present (and only stalkless CTF). An earlier study (PNAS 2022 Vol. 119 No. 19 e2113786119) covered this already, but it should be mentioned here that there was no observation of close/activation for the stalkless CTF.

      We appreciate the reviewer’s concern about the lack of a control where no exogenous peptide is present. As suggested by the reviewer, we are adding more details about the study on the stalkless CTF as a control in the Introduction of the revised manuscript. 

      (2) Although 5 independent trajectories were generated for each peptide, the authors did not provide sufficient details regarding the convergence of the simulation. This leaves some uncertainties in their results. Given that the binding poses changed relative to the starting docked poses for all three peptides, it is possible that some other binding pockets and/or poses were not explored.

      We appreciate the reviewer’s comment regarding the convergence of the simulation results. This is clarified in the revised manuscript as: 

      “We have calculated free energy profiles of individual simulations for each system, including the p9, p17, and p21, as shown below (Figs. S5, S6 and S8). For the p9 peptide, the “Bound” lowenergy state was consistently identified in the 2D free energy profile of each individual simulation (Fig. S5). For the p17 peptide, Pep-GaMD simulations were able to refine the peptide conformation from the "Unbound” to the "Intermediate” and “Bound” states in Sim1 and Sim5, while the peptide reached only the "Intermediate” state in the other three simulations (Fig. S6). For the p21 peptide, Pep-GaMD was able to refine the peptide docking conformation to the

      "Bound” state in all the five individual simulations (Fig. S8).”

      “It is important to note that the free energy profiles calculated from GaMD simulations of PC1 CTF were not fully converged since certain variations were observed among the individual simulations. Nevertheless, these calculations allowed us to identify representative low-energy binding conformations of the peptides.”

      (3) The free energy profiles (Figures 2 to 4) based on the selected coordinates provide important information regarding binding and CTF conformational change. However, it is a coarsegrained representation and complementary analysis such as RDFs, and/or contact maps between the peptide and CTF residues might be helpful to understand the details of their interactions. These details are currently only available in the text. 

      Following the reviewer's suggestion, we have now included a set of protein contact maps showing contacts between the peptides and the TOP domain for each peptide in the representative "Bound” state in revised Supplementary Information (Fig. S4). The contact maps serve to visualize the list of contacts mentioned in the main text. This will be clarified in the revised manuscript.

      (4) The use of a stalkless CTF is necessary for studying the functions of the exogenous peptides. However, the biological relevance of the stalkless CTF to ADPKD was not clearly explained, if any.

      We appreciate the reviewer’s comment. As correctly assessed by the reviewer, the stalkless CTF is not a biological form of PC1 observed in ADPKD, but rather was used as the simplest or least complex system in which the activities and binding of exogenous peptides could be studied. However, in ADPKD, there are numerous missense mutations reported within the GPCR autoproteolysis-inducing (GAIN) domain that have been shown to prevent or inhibit cleavage at the GPCR-coupled proteolysis site (GPS). Loss of PC1 GPS cleavage, which is known to cause ADPKD, would retain or sequester the stalk tethered agonist within the interior of the GAIN domain, which would presumably interfere with interactions between stalk tethered agonist residues and the remainder of the CTF. Furthermore, there are 10 single nucleotide polymorphisms reported within the stalk sequence (ADPKD Variant Database; https://pkdb.mayo.edu/welcome), most of which we have found to significantly reduce CTF-mediated activation of the NFAT reporter (Magenheimer BS, et al., Constitutive signaling by the C-terminal fragment of polycystin1 is mediated by a tethered peptide agonist; bioRxiv 2021.08.05.455255). In particular, the ADPKD-associated G3052R stalk mutation that was analyzed along with the stalkless CTF by GaMD simulations (Pawnikar et al, PNAS, 2022) has the same reduction in activity as the stalkless CTF in the cellular signaling reporter assays and the same loss of closed conformation interactions in GaMD analyses. As such, we believe the stalkless CTF has biological relevance from the aspect that it mimics the deficiency in signaling activation observed for PC1 CTF stalk mutants. This is clarified in the revised manuscript in the Introduction, page 5, “constructs encoding a stalkless PC1 CTF (a nonbiological mutant of PC1 with deletion of the first 21 N-terminal residues of CTF) and three ADPKD-associated…”) and near the beginning of the Discussion, page 16, where the biological relevance of studying the stalkless CTF is explained

      (5) The authors might want to clarify if a stalkless CTF is commonly seen in ADPKD, or if it is just a construct used for this study.

      The stalkless CTF is not a biological form of PC1, but rather a construct used for this study. This was clarified in the revised manuscript (see response above).

      (6) (Pages 7-8) "...we generated expression constructs of mouse (m) PC1 consisting of the CD5 signal peptide sequence fused in frame with the stalk sequence of mCTF ...". What is the CD5 signal peptide sequence here? What is its use?

      The CD5 signal peptide sequence is “MPMGSLQPLATLYLLGMLVASVLG” from the T cell surface glycoprotein, CD5. Since the N-terminus of PC1 CTF is derived from a posttranslational, autocatalytic, endoproteolytic cleavage event, this isoform is already membraneembedded and therefore lacks its endogenous signal peptide. The CD5 signal peptide coding sequence is added to the PC1 CTF expression constructs in order to ensure translation and insertion of the encoded protein at the endoplasmic reticulum. Additional details were added to the Experimental Procedures, page 2 of Supporting Information.

      (7) (Page 8) "All peptides were appended with a C-terminal, 7-residue hydrophilic sequence (GGKKKKK) to increase solubility". How did the authors make sure that this sequence has no influence on the signaling? 

      To determine the possible effect of the hydrophilic GGKKKKK sequence on signaling, we had a ‘solubility tag’ peptide (LGGKKKKK) synthesized and purified by GenScript. It was necessary to add an N-terminal Leu residue to the 7-residue hydrophilic tag sequence in order for the highly hydrophilic peptide to be recovered. Effect of treatment with the solubility tag peptide on activation of the NFAT reporter was assessed for both empty vector- and ∆stalkCTF-transfected cells in 3 separate signaling experiments (see figure below). Each experiment also included a negative control treatment (no peptide/culture medium only addition) and a positive control treatment (stalk peptide p17). The p17 peptide we had available was derived from the stalk sequence of human PC1 that differs from the mouse PC1 sequence at residues 15 and 17, which are two poorly conserved positions within the stalk sequence (see Reviewer 2, Response 3). In the first experiment with the solubility tag and human p17 peptides (B in figure below), we inadvertently used the empty expression vector and ∆stalkCTF expression construct from mouse PC1. After realizing our error, we then performed 2 additional signaling experiments (C and D in figure below) with the ‘correct’ human ∆stalkCTF expression construct and empty vector. In the revised manuscript, we have provided the results from each of the 3 experiments as Fig. S2 (below).

      (8) (Page 9) "Using a computational model of the ΔStalk PC1 CTF developed previously". The authors might want to expand here a little to give a short review about the structure preparation.

      We appreciate the reviewer’s suggestion regarding the addition of details for structure preparation for Stalkless CTF. We have added these details in section “Docking and Pep-GaMD simulations of peptide agonist binding to stalkless PC1 CTF” on Page 10 in the revised manuscript:  “The cryo-EM structure of human PC1-PC2 complex (PDB: 6A70) was used to build the computational model for WT PC1 CTF. As the protein had several missing regions including the Stalk and several loops, homology modeling of the missing regions was done using I-TASSER web server. Using the WT PC1 CTF model, computational model for ΔStalk was generated by deleting the first 21 residues (3049-3069) of the WT PC1 and using the structure for stalkless CTF, we successfully docked the p9, p17 and p21 stalk peptides with HPEPDOCK.  The peptides all bound to the TOP domain and the interface between the TOP domain and extracellular loop 1 (ECL1) of CTF.”

      (9) How was "contact" defined when counting the number of contacts used in the 2D PMFs (Figures 2-4). Response: We appreciate the reviewer’s comment regarding the definition of the number of contacts used in the 2D PMFs. This has been clarified in the revised manuscript as: “The number of contacts is calculated between any atom pairs within 4 Å distance of the peptide and extracellular domains of PC1 protein.”

      (10) How was the ranking of GaMD clusters done? It looks from Figure 3A that the "intermediate" state is more favorable compared to the "bound" state, but it was claimed in the text the "bound" state was ranked 1st. 

      Thanks to the reviewer for this comment. It has been clarified in the revised

      Supplementary Information: “Three independent Pep-GaMD simulations were combined to perform structural clustering using the hierarchical agglomerative clustering algorithm in CPPTRAJ. A 3 Å RMSD cutoff was used for each peptide system. PyReweighting was then applied to calculate the original free energy values of each peptide structural cluster with a cutoff of 500 frames. The structural clusters were finally ranked according to the reweighted free energy values.” And in the revised main text: “It is important to note that the free energy profiles calculated from GaMD simulations of PC1 CTF were not fully converged since certain variations were observed among the individual simulations. The free energy values of 2D PMF minima shown in Figure 3A could differ from those in the 1D PMF minima of peptide structural clusters, especially with the usage of distinct reaction coordinates. Nevertheless, these calculations allowed us to identify representative low-energy binding conformations of the peptides.”

      (11) When mentioning residue pair distances, such as in the sentence "The distance between the TOP domain residue R3848 and PL residue E4078 was 3.8 Å (Fig. 4D)" on page 12, it should be clarified if these distances are average distance, or a statistical error can be given.

      We appreciate the reviewer’s comment regarding the TOP Domain and PL distance between residues R3848-E4078. This has been clarified on page 14 in the revised manuscript as:

      “The distance between the TOP domain residue R3848 and PL residue E4078 was 3.8 Å. The distance was extracted from the top-ranked structural cluster of the p21 bound to the ΔStalk CTF, corresponding to the “Closed/Active” low-energy conformational state. (Fig. 4E)”.

      (12) More analysis of the GaMD can be performed. For example, the authors observed a single "bound" state for p21, but there must be some flexibility in the peptide and the protein itself. The authors might want to consider adding some plots illustrating the flexibility of the peptide residues (for example, a RMSD plot). Contact maps can also be added to visualize the results currently discussed in the text. 

      We thank the reviewer for their constructive suggestions. To characterize flexibility of the peptide and protein in the revised manuscript, we have added plots of the TOP-PL interaction distance between residues R3848-E4078 in PC1, the radius of gyration (Rg) of p21 and root-mean square deviation (RMSD) of p21 relative to the starting HPEPDOCK conformation of the peptide in the new Fig. S7. The peptide-protein contact map has also been added in the new Fig. S4.

      (13) (Page 7) In the sentence `...sampled the "Closed/Active" low-energy state relative to the large number of Stalk-TOP contacts`, I suggest using "related to" instead of "relative to"

      We thank the reviewer for the comment, and we have replaced "relative to" to “related to” in the following sentence `...sampled the "Closed/Active" low-energy state relative to the large number of Stalk-TOP contacts`

      (14) (Page 7) In the sentence `Our previous study utilized expression constructs of human PC1 CTF, however, in order to prepare for ...`, "PC1 CTF, however," -> "PC1 CTF. However,"

      We thank the reviewer for the comment, and we have replaced "PC1 CTF, however," to "PC1 CTF. However," in the following sentence `Our previous study utilized expression constructs of human PC1 CTF, however, in order to prepare for ...`.

      Reviewer 2:

      The autosomal dominant polycystic kidney disease (ADPKD) is a major form of polycystic kidney disease (PKD). To provide better treatment and avoid side effects associated with currently available options, the authors investigated an interesting GPCR, polycystin-1 (PC1), as a potential therapeutic target. In vitro and in silico studies were combined to identify peptide agonists for PC1 and to elucidate their roles in PC1 signaling. Overall, regarding the significance of the findings, this work described valuable peptide agonists for PC1 and the combined in vitro and in silico approach can be useful to study a complex system like PC1. However, the strength of the evidence is incomplete, as more experiments are needed as controls to validate the computational observations. The work appears premature.

      We greatly appreciate the reviewer’s encouraging and positive comments. The reviewer’ specific comments are addressed pointwise below and changes to the text will be highlighted in yellow in the revised manuscript.

      (1) The therapeutic potential of PC1 peptide agonists is unclear in the introduction. For example, while the FDA-approved drug Jynarque was mentioned, the text was misleading as it sounded like Jynarque targeted PC1. In fact, it targets another GPCR, the vasopressin receptor 2 (V2). A clear comparison of targeting PC1 over V2 pathways and their therapeutic relevance can help the readers better understand the importance of this work. Importantly, a clear background on the relationship between PC1 agonism and treatments for ADPKD is necessary.

      We understand the confusion that was caused by the brevity of our introductory paragraph and will clarify the differences in therapeutic targeting between Jynarque and our PC1 stalk-derived peptides in the revised manuscript. We will also expound on the rationale for targeting PC1 agonism as a therapeutic approach for ADPKD versus Jynarque. For example: It is known that ADPKD disease severity is dependent on the functional levels of PC1. Jynarque is a small molecule antagonist of the arginine vasopressin receptor 2, V2R, whose signaling, and production of cAMP has been shown to be increased in ADPKD. As this drug targets one of the downstream aberrant pathways, it is only capable of slowing disease progression and has numerous undesirable side effects. We reasoned that a therapeutic agent capable of stimulating and thus augmenting PC1 signaling function would be a safer, cyst initiation-proximal treatment capable of preventing cyst formation with few side effects.

      (2) PC1 is a complex membrane protein, and most figures focus on the peptide-binding site. For general readers (or readers that did not read the previous PNAS publication), it is hard to imagine the overall structure and understand where the key interactions (e.g., R3848-E4078) are in the protein and how peptide binding affects locally and globally. I suggest enhancing the illustrations.

      We thank the reviewer for the constructive comment on adding more illustrations for the PC1 protein to understand the overall structure and the location of the key interaction R3848E4078. We have included these suggestions and modified the main figures in the revised manuscript.  

      (3) The authors used the mouse construct for the cellular assays and the peptide designs in preparation for future in vivo assays. This is helpful in understanding biology, but the relevance of drug discovery is weakened. Related to Point 1, the therapeutic potential of PC1 peptide agonist is largely missing.

      The therapeutic potential of a PC1 peptide agonist is addressed in response #1 above. As mentioned in the manuscript and recognized by the reviewer, the cellular signaling assays were performed with the mouse PC1 CTF expression construct and with peptides based on the mouse PC1 stalk sequence for future, pre-clinical studies, while the peptide binding studies were performed with the human PC1 stalk sequence. We feel the relevance for drug discovery is not significantly weakened for a number of reasons: 1) as shown in Fig. 1A, the stalk sequence is highly conserved between mouse and human PC1, specifically there are only 2 residue differences present within peptides p17 and p21. One of the differences is a ‘semi-conservative’ Gln-Arg substitution at peptide residue 15, while the second difference is a conservative Ile-Val substitution at peptide residue 17; 2) we have found that an Arg to Cys mutation within the mouse PC1 CTF stalk has the same effect on signaling as the corresponding human Gln to Cys ADPKD-associated mutation which was analyzed in Pawnikar et al., 2022; and 3) both peptide residues 15 and 17 represent highly variable positions within the PC1 stalk as shown in the sequence logo (below) of the stalk sequence from 16 vertebrate species; and 4) while addressing the potential effect of the hydrophilic solubility tag on stalk peptide-mediated rescue of CTF∆stalk signaling (see Reviewer 1 comments, point #7), we utilized the ‘human’ version of p17 as a positive control and tested its activation with both mouse and human CTF∆stalk expression constructs and found that human p17 peptide was also capable of stimulating the mouse CTF∆stalk protein (Fig. S2).

      Author response image 1.

      (4) More control experiments are needed. For example, a 7-residue hydrophilic sequence (GGKKKKK) is attached to the peptide design to increase solubility. This 7-residue peptide should be tested for PC1 activation as a control. Second, there is no justification for why the peptide design must begin with residue T3041. Can other segments of the stalk also be agonists?

      As mentioned above for Reviewer 1, the hydrophilic peptide has been synthesized and tested for activation of signaling by the stalkless CTF in the revised manuscript as Fig. S2. The design of peptides that begin with residue T3041 of mouse PC1 CTF is modeled on numerous similar studies for the family of adhesion GPCRs. Optimization of the binding and activity of the PC1 peptide agonist will be investigated in future studies and could include such parameters as whether the peptide must include the first residue and whether subsegments of the stalk are also agonists, however, we feel these questions are beyond the scope of this initial report.

      (5) There are some major concerns about the simulations: The GaMD simulations showed different binding sites of p-21, p-17, and p-9, and the results report the simulated conformations as "active conformational states". However, these are only computational findings without structural biology or mutagenesis data to validate. Further, neither docking nor the simulation data can explain the peptide SAR. Finally, it will be interesting if the authors can use docking or GaMD and explain why some peptide designs (like P11-P15) are less active (as control simulations).

      The reviewer brings up an important observation regarding differences in binding sites between peptides p9, p17 and p21. We will include discussion of this observation and our interpretations to the revised manuscript. While the present study is focused on identification of initial peptides that are able to activate the PC1 CTF, we shall include further mutation experiments and simulations, peptide SAR and optimization of the lead peptides in future studies. This has been clarified in the revised manuscript.

      (6) Additional experiments for the controls and for validating the simulations. Additional simulations to explain the SAR.

      We appreciate the reviewer’s comment for additional experiments for the controls and additional simulations to explain the SAR. For future studies, we shall include further mutation experiments and simulations, peptide SAR and optimization of the lead peptides.

      (7) What is the selectivity of the peptides between PC1 and PC2?

      We have not tested the selectivity of the peptides for PC1 versus PC2 primarily because transfection of PC2 does not activate the NFAT reporter. However, it is possible that co-transfection of PC2 with the PC1 CTF could alter stalk peptide binding. This will be important to consider in future studies.

      Reviewer 3:

      The authors demonstrate the activation of Polycystin-1 (PC1), a G-protein coupled receptor, using small peptides derived from its original agonist, the stalk TA protein. In the experimental part of the study, the authors performed cellular assays to check the peptide-induced reactivation of a mutant form of PC1 which does not contain the stalk agonist. The experimental data is supported by computational studies using state-of-the-art Gaussian accelerated Molecular Dynamics (GaMD) and bioinformatics analysis based on sequence covariance. The computer simulations revealed the mechanistic details of the binding of the said peptides with the mutant PC1 protein and discovered different bound, unbound, and intermediate conformations depending on the peptide size and sequence. The use of reliable and well-established molecular simulation algorithms and the physiological relevance of this protein autosomal dominant polycystic kidney disease (ADPKD) make this work particularly valuable.

      We greatly appreciate the reviewer’s encouraging and positive comments. The reviewer’ specific comments are addressed pointwise below and changes to the text will be highlighted in yellow in the revised manuscript.

      (1) No control has been used for the computational (GaMD) study as the authors only report the free energy surface for 3 highly agonistic peptides but for none of the other peptides that did not induce an agonistic effect. Therefore, in the current version, the reliability of the computational results is not foolproof.

      We appreciate the reviewer’s concern about the lack of control with the other peptides that did not induce an agonistic effect. To address the reviewer’s concern, we have included more details on the study of the stalkless CTF and the solubility tag peptide (Fig. S2) as controls in the revised manuscript.

      (2) All discussions about the residue level interactions focused only on geometric aspects (distance, angle, etc) but not the thermodynamic aspect (e.g. residue-wise interaction energy). Considering they perform a biased simulation; the lack of interaction energy analysis only provides a qualitative picture of the mechanism.

      As mentioned by the reviewer, we have added MM/PBSA analysis results in the revised manuscript and SI.

      Molecular Mechanics/Poisson-Boltzmann Surface Area (MM/PBSA) analysis was performed to calculate the binding free energies of peptides p9, p17 and p21 to PC1 CTF. The analysis was performed using the trajectory in which the peptide was bound to the receptor. In MM/PBSA, the binding free energy of the ligand (L) to the receptor (R) to form the complex (RL) is calculated as:

      where GRL is the Gibbs free energy of the complex RL, GR is the Gibbs free energy of the molecule R in its unbound state and GL is the Gibbs free energy of the molecule L in its unbound state, respectively. 

      𝛥𝐺𝑏𝑖𝑛𝑑 can be divided into contributions of different interactions as:

      in which

      where ΔEMM , ΔGsol , 𝞓H and −TΔS are the changes in the gas-phase molecular mechanics (MM) energy, solvation free energy, enthalpy and conformational entropy upon ligand binding, respectively. ΔEMM includes the changes in the internal energies ΔEint (bond, angle and dihedral energies), electrostatic energies ΔEelec , and the van der Waals energies ΔEvdW. ΔGsol is the sum of the electrostatic solvation energy ΔGPB/GB (polar contribution) and the nonpolar contribution ΔGSA between the solute and the continuum solvent. The polar contribution is calculated using either the Poisson Boltzmann (PB) or Generalized Born (GB) model, while the nonpolar energy is usually estimated using the solvent-accessible surface area (SASA) where 𝞬 is surface tension coefficient and b is the constant offset. The change in conformational entropy −TΔS is usually calculated by normal-mode analysis on a set of conformational snapshots taken from MD simulations. However, due to the large computational cost, changes in the conformational entropy are usually neglected as we were concerned more on relative binding free energies of the similar peptide ligands.

      MM/PBSA analysis was performed using the gmx_MMPBSA software with the following command line:

      gmx_MMPBSA -O -i mmpbsa.in -cs com.tpr -ci index.ndx -cg 1 13 -ct com_traj.xtc -cp topol.top -o FINAL_RESULTS_MMPBSA.dat -eo FINAL_RESULTS_MMPBSA.csv Input file for running MM/PBSA analysis:

      &general

      sys_name="Prot-Pep-CHARMM",

      startframe=1, endframe=200, # In gmx_MMPBSA v1.5.0 we have added a new PB radii set named charmm_radii. 

      # This radii set should be used only with systems prepared with CHARMM force fields. 

      # Uncomment the line below to use charmm_radii set

      # PBRadii=7,

      /

      &pb

      # radiopt=0 is recommended which means using radii from the prmtop file for both the PB calculation and for the NP

      # calculation

      istrng=0.15, fillratio=4.0, radiopt=0

      The relative rank of the overall peptide binding free energies (Table S1) was consistent with the experimental signaling data, i.e., p21>p9>p17, for which p21 showed the largest binding free energy value of binding (-40.29±6.94 kcal/mol).

      (3) It is not mentioned clearly whether the reader should interpret the free energy landscapes quantitatively or qualitatively. Considering no error analysis or convergence plots are reported for the GaMD free energy surfaces, it may be assumed the results are qualitative. The readers should consider this caveat and not try to quantitatively reproduce these free energy landscapes with other comparable techniques.

      We appreciate the reviewer’s comment whether the free energy landscapes should be interpreted quantitatively or qualitatively. The presented free energy landscapes could be considered semi-quantitative since the simulations are not fully converged. This will be clarified in the revised manuscript as: “It is important to note that the free energy profiles calculated from GaMD simulations of PC1 CTF were not fully converged since certain variations were observed among the individual simulations. Nevertheless, these calculations allowed us to identify representative low-energy binding conformations of the peptides.”

      (4) Energy decomposition analysis similar to the following paper (https://pubs.acs.org/doi/10.1021/bi201856m) should be provided to understand the residue level enthalpic contribution in the peptide-protein interaction.

      As mentioned by the reviewer, we have performed residue-wise interaction energy analysis and included the analysis results in the revised manuscript and SI.

      Residue-wise interaction energy analysis was performed on peptides p9, p17 and p21 using the trajectory in which the peptide was bound to the PC1 CTF using the gmx_MMPBSA software with the following command line:

      gmx_MMPBSA -O -i mmpbsa.in -cs com.tpr -ct com_traj.xtc -ci index.ndx -cg 3 4 -cp topol.top -o FINAL_RESULTS_MMPBSA.dat -eo FINAL_RESULTS_MMPBSA.csv -do FINAL_DECOMP_MMPBSA.dat -deo FINAL_DECOMP_MMPBSA.csv

      Input file for running residue-wise energy decomposition analysis:

      &general

      sys_name="Decomposition", startframe=1, endframe=200,

      # forcefields="leaprc.protein.ff14SB"

      /

      &gb

      igb=5, saltcon=0.150,

      /

      # make sure to include at least one residue from both the receptor #and peptide in the print_res mask of the &decomp section.

      # this requirement is automatically fulfilled when using the within keyword.

      # http://archive.ambermd.org/201308/0075.html

      &decomp

      idecomp=2, dec_verbose=3, print_res="A/854-862 A/1-853”,

      /

      Residue-wise energy decomposition analysis allowed us to identify key residues that contributed the most to the peptide binding energies. These included residues T1 and V9 in p9 (Table S2), residues T1, R15 and V17 in p17 (Table S3), and residues P10, P11, P19 and P21 in p21 and residue W3726 in the PC1 CTF (Table S4). The energetic contributions of these residues apparently correlated to the sequence coevolution predicted from the Potts model.

      (5) To showcase the reliability of the computational approach, the authors should perform the MD simulation studies with one peptide that did not show any significant agonistic effect in the experiment. This will work as a control for the computational protocol and will demonstrate the utility of the pep-GaMD simulation in this work.

      We appreciate the reviewer’s concern about the lack of control with the other peptides that did not induce an agonistic effect. It is difficult for us to add more MD simulations on the other peptides, due to student leave after PhD graduation. But to address the reviewer’s concern, we have included more details on the study of the stalkless CTF as a control in the revised manuscript.

      (6) To assess the accuracy of the computational results the authors should mention (either in the main text or SI) whether the reported free energy surfaces were the average of the five simulations or computed from one simulation. In the latter case, free energy surfaces computed from the other four simulations should be provided in the SI. In addition, how many binding unbinding events have been observed in each simulation should be mentioned.

      We appreciate the reviewer’s comment regarding convergence of the simulation free energy surfaces. In response to Reviewer 1, we have calculated free energy profiles of individual simulations for each system, including the p9, p17, and p21 (Figs. S5, S6 and S8). 

      “We have calculated free energy profiles of individual simulations for each system, including the p9, p17, and p21 (Figs. S5, S6 and S8). For the p9 peptide, the “Bound” low-energy state was consistently identified in the 2D free energy profile of each individual simulation (Fig. S5). For the p17 peptide, Pep-GaMD simulations were able to refine the peptide conformation from the "Unbound” to the "Intermediate” and “Bound” states in Sim1 and Sim5, while the peptide reached only the "Intermediate” state in the other three simulations (Fig. S6). For the p21 peptide, PepGaMD was able to refine the peptide docking conformation to the "Bound” state in all the five individual simulations (Fig. S8).”

      “It is important to note that the free energy profiles calculated from GaMD simulations of PC1 CTF were not fully converged since certain variations were observed among the individual simulations. Nevertheless, these calculations allowed us to identify representative low-energy binding conformations of the peptides.”

    1. Author response:

      The following is the authors’ response to the original reviews.

      (1) Please provide more background about Rpgrip1l in the introduction, particularly the past studies of mammalian homolog of Rpgrip11, if any? Is there any human disease associated with Rpgrip1l? Do these patients have scoliosis phenotype? 

      • We have added more background on the human ciliopathies caused by RPGRIP1L mutations and on their occasional association with early onset scoliosis (lines 45-54 page 2 in the introduction, see cited references). 

      (2) The allele is a large deficiency of most of the coding region of rpgrip1l, can you give details in the Supplementary data of how you show this by genotyping? It would be good to explain that this mutation is most likely behaving as a null, if you have RNAseq data that supports this please note that. Otherwise, it may be incorrect to assume it is a null allele as your shorthand nomenclature states. If you do not have stronger evidence that the deficiency allele is behaving as a null allele, then please think about using an allele nomenclature as outlined at ZFIN:  

      • We now describe in the results section (Lines 72-76, page 3) the extent of the deletion of rpgrip1l ∆/∆ (22 exons out of 26) that creates an early stop at position 88 of 1256 aas. We have submitted to ZFIN our two novel mutant lines: rpgrip1l∆  is recorded as rpgrip1l bps1 and rpgrip1l ex4 as rpgrip1l bps2 , and we provide this information in the text. Transcriptomics data confirmed this allele is behaving as a null as the most down-regulated transcript found in the brain of rpgrip1l ∆/∆ is rpgrip1l transcript itself, (volcano plot in Fig 5A, described in the results, Line 270-71, page 9).

      • We also have provided in Supplementary Figure 1 A’ a picture of a typical genotyping gel for the rpgrip1l∆ allele. Sequences of both CRISPR guide RNAs and genotyping primers are provided in the Math & Meth section. 

      (3) Throughout the manuscript, the authors refer to zebrafish mutant phenotypes as "juvenile scoliosis". However, scoliosis may not appear until 11 weeks post-fertilization in some animals. After 6-8 weeks of age, it would be more appropriate to describe the phenotype as "late-onset or adult scoliosis" to differentiate between other reported scoliosis mutants (such as hypomorphic or dominant negative alleles of scospondin) that start body curvatures at 3-5 dpf .

      • We think we can really qualify rpgrip1l-/- scoliosis as being a “juvenile scoliosis” as shown by the time course displayed in Fig 1B: rpgrip1l-/- scoliosis develops asynchronously between 4 weeks and 9 weeks (from 0.8 cm/1 cm to 1.6 cm, corresponding to juvenile stages according to Parichy et al, 2009 PMID: 19891001), after which it reaches a plateau. Half of the mutants are already scoliotic by 5 weeks and no scoliosis develops at adult stage, ie from 10 weeks on. We have acknowledged the late onset scoliosis in page 3 line 93.

      (4) A more careful demonstration of the individual vertebrae, using magnified high-resolution pictures in Figures 1D-G, should be made to more clearly show no obvious vertebral malformations are present. 

      • We now provide a movie in Sup Data that presents 3D views of controls and mutant spines, which show the intervertebral spaces as well as vertebral shape and size. With these images we could exclude vertebral fusion and the presence of dysmorphic vertebrae.

      (5) On page 5: the authors comment on transgenic expression of RPGRIP1L in foxj1a-lineages as "rescuing" scoliosis. This terminology is confusing, as rescuing a condition could be interpreted as inducing it where it was once absent. "Suppressing" scoliosis may be a more appropriate term. 

      • We agree with the reviewers, the “rescue” term is confusing, we changed it for “suppress” in the title of the paragraph (line 95 page 3) and within the text (line 115 page 3).

      (6) On page 5, lines 155-156: the authors state that "Indeed, no tissue-specific rescue has been performed yet in zebrafish ciliary gene mutants". This is misleading, as ptk7a and katnb1 mutations both disrupt cilia, and transgenic reintroduction of both ptk7a and katnb1 in foxj1a- expressing lineages has previously been shown to suppress cilia defects as well as scoliosis in these models. The statement should be removed for accuracy. 

      • We agree that we were not precise enough in our sentence: when we mentioned “ciliary gene” mutants, we were referring to genes whose products are enriched within cilia and directly affecting ciliogenesis, cilia content and maintenance such as TZ or BBS genes, without encompassing genes like ptk7 and katnb1 whose products perform multiple functions on top of cilia maintenance such as Wnt signalling and remodelling of the whole microtubule network respectively. We have therefore modified our sentence by adding zebrafish ciliary “TZ and BBS” genes (line 104, page 4).

      (7) Figure 2: panels A-B: In the text (line 196) you state that cilia length was increased and that Arl13b content was severely reduced. However, Panel B shows no significant length difference between scoliotic mutants and controls. This statement and graph should be corrected for accuracy. Also, the Arl13b staining is difficult to see in panel A - can channels be split, and/or quantified? 

      • We have now split the Arl13b and glutamylated tubulin channels (Fig 2 A-C”). We think that the reduction of Arl13b staining intensity is now obvious in both straight and scoliotic mutants (Compare 2A” with 2B” and 2C”). We were not able to quantify Arl13b staining using ciliary masks from glutamylated tubulin staining since both staining only partially overlap along the length of the cilium, Arl13b being more distal than glutamylated tubulin (Fig 2A’). 

      • Ciliary length was significantly increased (from 3.4 to 5.3 µ) in straight rpgrip1l-/-, while the average mean values for scoliotic rpgrip1l-/- were heterogenous (mean 4.1µ) and therefore not significantly different when compared to controls. This heterogeneity stems from the combined presence of both shorter and longer cilia in scoliotic fish, a finding we interpreted by the potential breakage over time of extra-long and thin cilia observed in scoliotic fish (as in Sup figure 1 H’’’, Sup Fig 2M’ and 2O’). 

      • We changed the text to be more accurate: we now state that cilia length increased in straight mutants, and became more heterogenous than controls in scoliotic mutants (line 143-144, page 5). 

      (8) Figure 3: Page 7, line 206: authors state that SCO-spondin secreting cells varied in number along SCO length. What is the evidence that these cells secrete SCO-spondin? The staining shown in Figure 3L-O appears to demonstrate extracellular accumulation of sspo:GFP. What is the evidence that this staining originated from cells in proximity to it? 

      The claim of SCO-secreting cells in Figure 2E-J is confusing. I assume you are using anatomy to infer the SCO is captured in these sections. This should be done in sspo-GFP animals (as in Figure 3) and/or dual anti-body labeling can be done to show SCO-secreting cells and cilia. 

      • We now show in Supplementary Figure 2 A-D a double staining for Sco-spondin-GFP and cilia (Ac-tub, Glu-Tub). Analyzing GFP staining along SCO length on successive sections, we identified the SCO producing cells on the diencephalic dorsal midline by their position under the posterior commissure (PC), which forms an Acetylated Tubulin positive arch), and counted the nuclei surrounded by cytoplasmic GFP from the most anterior region ( 24 cells wide, Sup Fig 2A-A’) to the most posterior region (4-8 cells wide, Sup Fig 2 C).` 

      • Furthermore, the close-ups presented on Fig 2A’ and 2B’ allow to detect the cytoplasmic Sspo-GFP staining around SCO nuclei, above the region presenting primary cilia pointing towards the diencephalic ventricle, both in controls and mutants at scoliosis onset (tail-up mutants), showing that the extracellular staining in B’ very likely originates from these cells. In these tail-up mutants, extracellular Sspo aggregates have not yet filled the whole diencephalic ventricle as in Fig 3 N and Q. 

      (9) Figure 5: Is the transcriptome data and proteomic data consistent for any transcripts and encoded protein products? Please highlight those consistent targets in both analyses. 

      • We would like to emphasize that the transcriptomic study was performed at scoliosis onset, at 5 weeks, while the proteomics analysis was performed at adult stage (3 months) so they cannot be directly compared.

      Moreover, low abundance proteins (such as centrosomal proteins and transcription factors like Foxj1a ) are not detected by label-free proteomics, without prior subcellular fractionation procedure (Lindemann et al, 2017 PMID: 28282288). The extraction protocol also does not allow to purify short neuropeptides such as Urp1-2.

      Nevertheless, we found four targets in common, now highlighted in red in Fig 5, Panel E: Anxa2, complement proteins

      C4 and C7a, and Stat3, all related to immune response, a GO term enriched in both studies as explained in the text (Lines 308-311, page 10). 

      The absence of many inflammation markers or immune response proteins at adult stage in scoliotic mutants most probably indicates a transient inflammatory episode at scoliosis onset, while astrogliosis, as detected by GFAP staining, increases with scoliosis severity. Along the same lines, the two-fold increase of Lcp1 cells within the tectum is present before axis curvature (in straight mutants) and disappears in scoliotic fish (Graph G in Sup Figure S5) as explained in the text, Lines 378-381, page 12, 

      (10) Supplementary Figure 1 F-H: What stage/age samples were used for SEM? It is only stated that they were 'adults'. It is also stated that cilia tufts in straight rpgrip1l-/- fish were morphologically normal but 'less dense'- this was not obvious from the figure. Can density be quantified? (otherwise, data does not support the statement). Similarly, can the statement that "cilia of mono-ciliated ependymal cells showed abnormal irregular structures compared to controls, with either bulged or thinner parts" be supported with measurements/quantification? 

      • The SEM study was performed on 3 months old fish, 3 controls and 5 mutants. We added this information in the figure legend. We could not quantify the number of ciliary tufts in the brain ventricle of the sole straight mutant that was analyzed. We therefore removed the statement that cilia were less dense in the straight mutant. Along the same lines, we mentioned that we could find mutant cilia of irregular shape as shown in Supplementary Figure S1, F”,G’’, H’’ and H’’’) (page 4, lines 124-129). 

      (11) Supplementary Figure 1D-E is never mentioned in the text. The Supplemental Figure legend also refers to a graph of cilia length that is not in the figure itself. As a result, many of the subsequent panel references are out of register. 

      • We now provide the correct version of the legend and refer to Sup Fig 1D-E in the text (page 3, lines 79-81) and its legend, page 53, lines 1616-1620.

      (12) Supplementary Figure 2A-F: Of interest, in panels C and F, it looks as though sspo:GFP is accumulating on cilia within the ventricles of rpgrip1l mutants. Can this be explored? Is it possible that abnormal aggregation of SSPO on cilia is ultimately leading to cilia loss, as you report for multi-ciliated cells surrounding the subcommissural organ? This could be a very interesting finding and possible mechanism for cilia loss.

      • Our observation of all brain sections led us to conclude that the majority of Sspo-GFP aggregates were floating within the brain ventricles of rpgrip1l-/- fish while a portion of aggregates were stuck on ventricle walls, in close contact with cilia as now shown on Supplementary figure S2 B’, outlined in legend page 54, lines 1634-1637. We agree that the contact between Sspo aggregates and cilia might have damaging consequences, either on cilia maintenance or on immune reaction induction and we now mention these possibilities in the discussion page16, lines 524-526. These research lines will be explored in the near future.

      (13) Supplementary Figure 5A-F is not mentioned in the manuscript. Please clarify the role of Anxa2 in neuroinflammation. Is increased Anxa2 expression in rpgrip1l mutant zebrafish reduced after anti-inflammatory drug treatment? What is the expression level of anxa2 in cep290 mutant zebrafish? 

      • We have now added mention to Supplementary Figure 5A-F in the text page 10 lines 328-331. 

      • We unfortunately did not have enough histological material to test Anxa2 staining on NACET treated fish after performing GFAP and Lcp1 staining, neither for dilatation measurement or multiciliated cells quantification. We agree this would have helped to better define which defect might be an indirect consequence of an inflammatory environment.

      • We tested the expression level of Anxa2 in cep290-/- fish. No labelling above control level was detected on cep290-/- brain sections that were positive for GFAP (N = 5). As GFAP staining in 3-4 weeks cep290-/- was not as intense and widespread as in adult rpgrip1l-/- (50% of GFAP + cells compared to 100% in the SCO for example), we concluded that Anxa2 expression may be upregulated after widespread or long-term astrogliosis/inflammation. Alternatively, Anxa2 overexpression could be specific to rpgrip1l-/- fish. 

      (14) A summary diagram at the end would be helpful for understanding the main findings. 

      We added a Graphical Abstract summarizing the main conclusions and hypotheses of this study. It is mentioned and explained in the Discussion section, p. 16 lines 504-508 and 516-529. 

      (15) The sspo-GFP zebrafish line should be listed in the STAR methods section: 

      The sspo-GFP line is now listed in the STAR methods, Scospondin-GFPut24, (Troutwine et al., 2020 PMID: 32386529), p.43, last line.

    1. Author response:

      The following is the authors’ response to the original reviews.

      Reviewer 1:

      Comment 1) The CIRSPR screen designed to detect regulators of damage-induced transcriptional repression is based on EU incorporation following a 7-day selection of stable knockout cells. As the authors point out, cell cycle arrest reduces rDNA transcription on its own. The screen, which assesses changes in sgRNA distribution in EU high cells, is thus likely to be dominated by factors that affect cell cycle progression. This is exemplified in the analyses of top hits related to neddylation. The screen's limitations in terms of identifying DDR effectors of damage-induced silencing need to be clearly stated. 

      Notably, our screen did identify known DNA damage response effectors of damage-induced silencing, for example ATM was a top hit, as discussed in the paper and shown in Fig. 5B. We consider that our unbiased approach had advantages because in addition to finding known DDR effectors, we uncovered novel requirements, such as the need for cells to be cycling, for transcriptional silencing in response to DNA damage. We didn’t find the canonical key cell cycle regulators in our screen. One possibility might be that cell cycle arrest or cell death upon their knock down may lead to out-competition during the seven-day treatment with doxycycline resulting in depletion from, rather than enrichment in, the targeting gRNAs from cells that maintain transcription 7 days after DNA damage.

      Comment 2) The authors confirm previous findings of DNA damage-induced repression of rDNA and histone gene transcription. The authors propose that these highly transcribed genes are more susceptible to silencing than the bulk of protein-coding genes and propose a global damage-induced signaling event that is independent of DNA breaks in cis. While this is possible, it is not demonstrated in this manuscript, and the authors should acknowledge alternative explanations. For example, the loci found to be repressed by bulk IR are highly repetitive gene arrays that tend to form nuclear sub-compartments (nucleoli, histone bodies). As such, their likelihood of being in the vicinity of DNA damage is high, at least for a fraction of gene copies. The findings, therefore, remain consistent with cis-induced silencing. Moreover, silencing may spread through the relevant nuclear sub-compartments, consistent with the formation of DNA damage compartments described recently (PMID: 37853125). 

      The reason for us “suggest(ing) that the reduced bulk abundance of nascent transcripts after IR may occur in trans as a programmed event” was based on the gene length-independent and IR dose-independent nature of the gene silencing shown in Fig. 2D and Fig. 4C), not that rDNA and histone gene expression went down the most after IR. Indeed, we stated that “Those genes that were normally most highly transcribed were repressed after IR, while genes that were normally expressed at intermediate or low levels tended to be induced after IR (Fig. 4A). The mechanistic reason for this is unclear.” We thank the reviewer for the suggestion that this may be due to these genes existing in nuclear sub-compartments. We have now incorporated this possibility into the discussion.

      Other comments: 

      (1) The statement that silencing is due to transcription initiation rather than elongation is not sufficiently supported by the data. Could equivalent nascent transcript reduction not be the result of the suppression of elongating RNA PolII? To draw the proposed conclusion, the authors would need to demonstrate that RNA PolII initiation is altered, using RNA PollII ChIP and/or analysis of relevant RNA PolII phosphorylation patterns. 

      Figure 4F shows the distribution of nascent transcript reads throughout the open reading frame of the repressed genes. It shows that the transcript abundance throughout the ORF, including at the 5’ end, is reduced. This pattern is consistent with a defect in initiation. We have now clarified the description of these results to state that: “Our data is consistent with the possibility that the major mechanism for the repression of the ~1,000 protein coding genes after IR is at the transcriptional initiation stage. However, our data do not rule out that elongation may be additionally repressed after IR, as this would not be observed in our analyses due to concomitant repression of transcriptional initiation.” 

      (2) The lack of rDNA silencing in arrested cells is interesting, though the underlying mechanism remains unclear. To further corroborate the proposed defect in ATM-mediated signaling, the authors should look directly at ATM and Treacle phosphorylation upstream of TOPBP1. 

      We would love to have shown that ATM dependent phosphorylation does not occur upon IR. We had attempted this multiple times but unfortunately the available phospho Treacle antibodies were not suitable for rigorous analyses in our hands.

      (3) The "change in relative heights of the EU low (G1) and EU high (S/G2) peaks" in Figures 5D, 5E, and 6B is central to the proposed model of transcriptional changes being affected by cell cycle arrest. These differences should be visualized more clearly and quantified across independent experiments. Ideally, the cell cycle stage should be dissected as in Figure 2B. How do the authors envision cell cycle arrest triggers the defect in transcriptional silencing? 

      In the previous version, the last paragraph described one possibility for how rDNA may fail to be repressed in arrested cells after IR, based on the results shown in Fig. 7F and G.  We have now added a paragraph in the discussion section beginning “Why would cell cycle arrest in G1 or G2 phases of the cell cycle prevent transcriptional repression of rDNA and histone genes after IR?”

      Reviewer #2:

      (1) Define ERCC normalization. 

      We apologize for this omission. We now have explained ERCC normalization and have added a citation to a commentary that we wrote on spike-in controls 2015 for further explanation.

      (2) On page 8, the authors speculate that genes involved in immune response after IR was activated due to cytoplasmic DNA in pre-B cells. Where are these cytoplasmic DNAs from? Is there any literature indicating that 30 30-minute IR treatment can induce cytoplasmic DNA? 

      We have removed this speculation, as there is no evidence currently to support it.

      (3) Related to the points above, are ERVs or repetitive DNA elements up-regulated upon IR treatment, which in turn results in increased expression of genes involved in immune response? 

      The induction of cytokines as a rapid response to irradiation is a major part of the immediate early gene program induced in response to ROS (and now is explained in the manuscript).

      (4) Please explain in the result section how overlap levels of transcription determined by EU are reduced after IR, and yet the number of genes with increased expression upon IR treatment is much more than that of genes with reduced expression. 

      We have explained that while less genes have reduced expression after IR than the number of genes that increase expression after IR, those genes that have reduced expression are extremely highly expressed to start off with. As a result, the bulk amount of transcripts is reduced after IR.

      (5) Do cells treated with MLN4924 block the down-regulation of histone genes and ribosomal genes? 

      We have not addressed this directly. However, given that the reduction of gene expression that occurs after IR is largely due to repression of histone and rDNA genes, it is safe to speculate that these are the genes that are no longer repressed during cell cycle arrest.

      (6) Is IR-induced down-regulation of histone genes due to cell cycle changes? 

      We do not know for sure if this is the case. It is relevant to note that even without IR, histone expression per se is regulated by cell cycle changes, being lower outside of S phase – and the majority of  non-arrested cells in our study are in S phase (Fig. 2B). As such, arrest of cells per se outside of S phase would be sufficient to reduce histone expression level.

      We would like to thank the reviewers again for their insightful suggestions and comments.

    1. Author response:

      The following is the authors’ response to the original reviews.

      Public Reviews: 

      Reviewer #1 (Public Review): 

      Summary: 

      This manuscript dissects the contribution of the CaBP 1 and 2 on the calcium current in the cochlear inner hair cells. The authors measured the calcium current inactivation from the double knock-out CaBP1 and 2 and showed that both proteins contribute to voltage-dependent and calcium-dependent inactivation. Synaptic release was reduced in the double KO. As a consequence, the authors observed a depressed activity within the auditory nerve. Taken together, this study identifies a new player that regulates the stimulation-secretion coupling in the auditory sensory cells. 

      Strengths: 

      In this study, the authors bring compelling evidence that CaBP 1 and 2 are both involved in the inactivation of the calcium current, from cellular up to system level, and by taking care to probe different experimental conditions such as different holding potentials and by rescuing the phenotype with the re-expression of CaBP2. Indeed, while changing the holding potential worsens the secretion, it completely changes the kinetics of the inactivation recovery. It alerts the reader that probing different experimental conditions that may be closer to physiology is better suited to uncovering any deleterious phenotype. This gave pretty solid results. 

      Weaknesses: 

      Although this study clearly points out that CaBP1 is involved in the calcium current inactivation, it is not clear how CaBP1 and CaBP2 act together (but this is probably beyond the scope of the study). Another point is that the authors re-express CaBP2 to largely rescue the phenotype in the double KO but no data are available to know whether the re-expression of both CaBP1 and CaBP2 would achieve a full recovery and what would be the effect of the sole re-expression of CaBP1 in the double KO.

      We would like to thank the reviewer for the appreciation of our work. We agree that the effect of the sole re-expression of CaBP1 in the double KO remains elusive and have planned to address this question in a follow-up study. 

      Reviewer #2 (Public Review): 

      Summary: 

      In the manuscript by Oestreicher et al, the authors use patch-clamp electrophysiology, immunofluorescent imaging of the cochlea, auditory function tests, and single-unit recordings of auditory afferent neurons to probe the unique properties of calcium signaling in cochlear hair cells that allow rapid and sustained neurotransmitter release. The calcium-binding proteins (CaBPs) are thought to modify the inactivation of the Cav1.3 calcium channels in IHCs that initiate vesicle fusion, reducing the calcium-dependent inactivation (CDI) of the channels to allow sustained calcium influx to support neurotransmitter release. The authors use knockout mice of Cabp1 and Cabp2 in a double knockout (Cabp1/2 DKO) to show that these molecules are required for enabling sustained calcium currents by reducing CDI and enabling proper IHC neurotransmitter release. They further support their evidence by re-introducing Cabp2 using an injection of AAV containing the Cabp2 sequence into the cochlea, which restores some of the auditory function and reduces CDI in patch-clamp recordings. 

      Strengths: 

      Overall the data is convincing that Cabp1/2 is required for reducing CDI in cochlear hair cells, allowing their sustained neurotransmitter release and sound encoding. Figures are well-prepared, recordings are careful and stats are appropriate, and the manuscript is well-written. The discussion appropriately considers aspects of the data that are not yet explained and await further experimentation.

      Weaknesses: 

      There are some sections of the manuscript that pool data from different experiments with slightly different conditions (wt data from a previous paper, different calcium concentrations, different holding voltages, tones vs clicks, etc). This makes the work harder to follow and more complicated to explain. However, the major conclusion, that cabp1 and 2 work together to reduce calcium-dependent inactivation of L-type calcium channels in cochlear inner hair cells, still holds. 

      Another weakness is that the authors used injections of AAV-containing sequences for Cabp2, but do not present data from sham surgeries. In most cases, the improvement of hearing function with AAV injection is believable and should be attributed to the cabp2 function. However, in at least one instance (Figure 4B), the results of the AAV injection experiments may be overinterpreted - the authors show that upon AAV injection, the hair cells have a much longer calcium current recovery following a large, long depolarization to inactivate the calcium channels. Without comparison to sham surgery, it is not known if this result could be a subtle result of the surgery or indeed due to the Cabp2 expression.  It would be great to see the auditory nerve recordings in AAV-injected animals that have a recovery of ABRs. However, this is a challenging experiment that requires considerable time and resources, so is not required.

      We would like to thank the reviewer for the appreciation of our work. We agree with the reviewer that sham surgery may convey more information that might benefit the interpretation of our data. The recovery experiments were very tedious and these long patch-clamp paradigms required extremely stable recordings. Based on our observations, we plan to address the recovery kinetics into more detail in the follow-up study. However, we would consider off-side effects of the surgery (as it may mainly affect middle ear function) and of the empty AAV-vector on inner hair cell calcium current recovery rather unlikely, but we cannot exclude them. We thus added a sentence in the discussion to alert to that. Based on previously published data of the effect of PHP.eB-Cabp2eGFP in WT animals we expect some (mild) adverse effects on hearing from overexpression of CaBP2 and/or eGFP in the inner ear. In the future, we thus plan to further optimize the treatment. In terms of the in vivo recordings from the auditory nerve fibers of the rescued mice, we could not agree more. That is in plan for the follow-up study.

      Reviewer #3 (Public Review): 

      Summary: 

      The authors attempted to unravel the role of the Ca2+-binding proteins CaBP1 and CaBP2 for the hitherto enigmatic lack of Ca2+-dependent inactivation of Ca2+ currents in sensory inner hair cells (IHCs). As Ca2+ currents through Cav1.3 channels are crucial for exocytosis, the lack of inactivation of those Ca2+ currents is essential for the indefatigable sound encoding by IHCs. Using a deaf mouse model lacking both CaBP1 and CaBP2, the authors convincingly demonstrate that both CaBP1 and CaBP2 together confer a lack of inactivation, with CaBP2 being far more effective. This is surprising given the mild phenotype of the single knockouts, which has been published by the authors before. Readmission of CaBP2 through viral gene transfer into the inner ear of double-knockout mice largely restored hearing function, normal Ca2+ current properties, and exocytosis. 

      Strengths: 

      (1) In vitro electrophysiology: perforated patch-clamp recordings of Ca2+/Ba2+ currents of inner hair cells (IHCs) from 3-4 week-old mice - very difficult recordings - necessary to not interfere with intracellular Ca2+ buffers, including CaBP1 and CaBP2. 

      (2) Capacitance (exocytosis) recordings from IHCs in perforated patch mode. 

      (3) The insight that a negative holding potential might underestimate the impact of lack of CaBP1/2 on the inactivation of ICa in IHCs. As the physiological holding potential is much more positive than a preferred holding potential in patch clamp experiments it has a strong impact on inactivation in the pauses between depolarization mimicking receptor potentials. This truly advances our thinking about the stimulation of IHCs and accumulating inactivation of the Cav1.3 channels. 

      (4) Insight that the voltage sine method with usual voltage excursions (35 mV) to determine the membrane capacitance (for exocytosis measurements) also favors the inactivated state of Cav1.3 channels 

      (5) Use of double ko mice (for both CaBP1 and CaBP2, DKO) and use of DKO with virally injected CaBP2eGFP into the inner ear. 

      (6) Use of DKO animals/IHCs/SGNs after virus-mediated CaBP2 gene transfer shows a great amount of rescue of the normal ICa inactivation phenotype.

      (7) In vivo measurements of SGN AP responses to sound, which is highly demanding. 

      (8) In vivo measurements of hearing thresholds, DPOAE characteristics, and ABR wave I amplitudes/latencies of DKO mice and DKO+injected mice compared to WT mice. 

      Very thorough analysis and presentation of the data, excellent statistical analysis.

      The authors achieved their aims. Their results fully support their conclusions. The methods used by the authors are state-of-the-art. 

      The impacts on the field are the following:

      Regulation of inactivation of Cav1.3 currents is crucial for the persistent functioning of Cav1.3 channels in sensory transduction. 

      The findings of the authors better explain the phenotype of the human autosomal recessive DFNB93, which is based on the malfunction of CaBP2. 

      Future work - by the authors or others - should address the molecular mechanisms of the interaction of CaBP1 and 2 in regulating Cav1.3 inactivation. 

      Weaknesses: 

      I do not see weaknesses. 

      What is not explained (but was not the aim of the authors) is how the CaBPs 1 and 2 interact with the Cav1.3 channels and with each other to reduce CDI. Also, why DFNB93, which is based on mutation of the CaBP2 gene, lead to a severe phenotype in humans in contrast to the phenotype of the CaBP2 ko mouse.

      We would like to thank the reviewer for the appreciation of our work and the amount of effort that went into these experiments. These are the questions that we are posing ourselves as well and would like to address them in the future.   

      Recommendations for the authors:

      Reviewing editor: 

      In the Introduction, the authors may also mention that Ca2+-dependent and voltage-dependent inactivation of L-type Ca channels has been reported at ribbon synapses of retinal bipolar cells (see von Gersdorff & Mathtews, J Neurosci. 1996, 16(1):115-122). These are critical retinal interneurons involved in the continuous exocytosis of synaptic vesicles onto retinal ganglion cells. 

      We would like to thank the reviewing editor for pointing that out, we have added the reference in the revised version of the manuscript.

      Reviewer #1 (Recommendations For The Authors): 

      Conditions worsen with age but no numbers regarding the threshold shift are provided. 

      For better readability, we now included click threshold values for both genotypes and age groups in the MS text, results section.   

      Do the authors correlate the re-expression level of CaBP2 using GFP to the rescuing phenotype (for exocytosis or BK channels immunostaining)?

      The restoration of BK expression in the virus-treated IHC was a side observation of our study, which was not performed in sufficient replicates for proper quantification. In the future, we will address this question into greater detail, possibly with improved viral constructs. In a previous study, we attempted to correlate eGFP fluorescence intensity with residual depolarization-evoked calcium current in CaBP2-injected IHC of Cabp2 single KO animals. At that time, we were unable to establish a convincing correlation. This could be related to (i) large variability in the data, possibly requiring much larger datasets to observe potential correlation above the noise, (ii) variable imaging conditions from prep to prep, or (iii) additional parameters that could influence the outcome of the current rescue, e.g. uncontrolled expression of the transgene. However, we did analyse the correlation between ABR click thresholds and mean IHC eGFP fluorescence in another, preliminary set of data that included different viruses at different titres. There, we were able to observe a relatively good correlation. Interestingly, some of the highest expression levels resulted in poorer threshold recovery, which could indicate harmful overexpression. Moreover, the correlation was only detected when the difference of the mean eGFP expression levels per organ was large. Furthermore, significantly less efficient ABR threshold recovery was observed in the non-injected contralateral ears, which showed a significantly lower viral expression of the transgene. In our follow-up study, we will investigate the question of dose dependence of rescue in more detail.  

      Reviewer #2 (Recommendations For The Authors): 

      -  There are two paragraphs in the results text about supplemental figure #2, which suggests that it should be moved to the main figures. 

      We would like to thank the reviewer for this suggestion. Figure S2 has now been moved to the main figures (as current Figure 5) and has been modified to accommodate the BK cluster analysis panel. The histogram with the number of ribbon synapses was removed as the data was redundant with the numbers given in the MS text.  

      -  Overall it is hard to distinguish between dark blue and black in many figures, including the dual-color asterisks.

      To improve the readability and clarity of the figures, we exchanged dark blue with magenta.  Dual-color asterisks in Fig. 3 were changed to single-color asterisks and what they refer to is explain in the figure legend.  

      -  Figure 4 legend - there is a mis-spelling of cabp in the fourth line from the bottom. 

      -  Figure 4 legend - the last line does not make sense - describes recovery as being both 'much faster' and 'slowest'.

      -  Figure 6 title - consider removing 'nearly blocked' and replacing it with 'impaired'.

      We would like to thank the reviewer for noticing these mistakes that have been corrected in the revised version, as suggested.

      -  The calculations of VDI and CDI could be better explained, specifically detailing that VDI is calculated first from currents using barium as a divalent, followed by the calculation of CDI. 

      We included an explanatory sentence in the results section as suggested and are additionally referring the readers to the methods section for the mathematical formulas.

      -  Why were two different tests (one parametric and one non-parametric) used for the Figure 3B data? 

      We performed a point-by-point-comparison of data. The choice of test was made based on the distribution and the variance of the data points. We now opted for a unified test, t test with Welch correction, which assumes that samples come from populations with normal distribution, but does not make assumption about equal variances. The outcome of these tests were similar. 

      -  The much broader tuning of the auditory nerve fibers is interesting, consider including this in a figure. 

      For recording tuning curves, we use an automated algorithm which adapts the tone burst intensity and frequency depending on the preceding results. The threshold criterion is an increase of spiking by 20Hz above spontaneous rate. This routine works fairly well in wild-type animals. However, DKO SGNs typically had very high thresholds at >80 dB across all frequencies, which can partly be explained by the fact that they had very low spike rates and did not reach that criterion. Besides tuning curve runs, we also tried systematic frequency sweeps and manual frequency control to determine a best frequency, followed by a rate intensity function at that frequency to determine “best threshold”. 

      All this was difficult, because in the DKO SGNs, sound threshold detection was challenged by the strong dependence of spiking on the duration of the preceding silent interval. A preceding stimulus outside the frequency response area or below the activation threshold of the SGN would thus improve spiking by allowing for longer recovery, while a preceding efficient stimulus would reduce it. Thus, the sound threshold determined in a rate level sweep varied depending on the interstimulus interval and possibly even on the (randomized) order at which the intensities were played. 

      A meaningful threshold measure would require long silent interstimulus intervals, i.e. a long recording time. As tuning curves require multiple threshold measures, it seemed impossible to obtain a useful dataset at high quality. As we deemed the spike rate dependence on interstimulus intervals more important than the tuning we rather focused on tone burst responses acquired at frequency/intensity combinations at which the hair cells and their synapses were maximally activated. In wild-types, these would be tone bursts at characteristic frequency or noise bursts in the saturated part of the rate intensity function, which typically has a dynamic range of 10-25dB. As we assume (based on DPOAE) that cochlear micromechanics and amplification are mostly normal in the DKOs, we hypothesize that the sensitivity and dynamic range of basilar membrane motion and  inner hair cell transduction are normal and that the increase in single unit thresholds and loss of sharp tuning are another readout of synaptic dysfunction. 

      - Figure S2 - please show separate panels for each channel, it is very difficult to make out the changes by eye in the merged panels. 

      Done.  

      - Figure S2 G - the results text stated that the BK channel clusters 'appeared' smaller - why was this not measured? 

      We have performed additional experiments to enable proper analysis of the BK channel clusters. The analysed data shows that the BK clusters are considerably larger and more abundant in the WT as compared to CaBP1/2-deficient IHCs of approx. 4-week-old mice. The results of the analysis are included in the immunohistochemistry figure (now Fig. 5) and are further commented in the results section.  

      Reviewer #3 (Recommendations For The Authors): 

      I have only a few minor points on the MS: 

      (1) Some labels in Figure 1 are too small and hard to read, e.g. y-axis in B-F. Wherever you use subscripts on the axes, the labeling needs to be larger.

      (2) Fig. 1A: the colors for CaM and CaBP1.2 are too similar, at least on my printout. Please use more distant colors.

      (3) Reference 24 should be corrected (no longer in press).

      These points have been addressed in the revised version of the MS.

    1. Author response:

      The following is the authors’ response to the original reviews.

      eLife assessment

      This valuable study examines the role of a host in conditions that shift pathogenicity of opportunistic microbes. The use of single-cell microbial transcriptomics and metabolomics to demonstrate the host's effects on pathogen dynamics is interesting and convincing. However, the connection to host antimicrobial peptides driving these effects is incomplete and would benefit from additional evidence and improved explanation in the text. This paper has the potential to be of broad interest to those working in host-microbe (microbiome and pathogen) interactions.

      We appreciate the editors for organizing our manuscript and providing eLife assessment. We went through each comment and carried out some necessary experiments. According to the comments, we here provide additional evidence that further supports our findings in this revised manuscript.

      Public Reviews:

      Reviewer #1 (Public Review):

      Summary:

      In this work, Wang and colleagues used Drosophila-Serratia as a host-microbe model to investigate the impact of the host on gut bacteria. The authors showed that Drosophila larvae reduce S. marcescens abundance in the food likely due to a combination of mechanical force and secretion of antimicrobial peptides. S. marcescens exposed to Drosophila larvae lost virulence to flies and could promote larval growth similar to typical Drosophila gut commensals. These phenotypic changes were reflected in the transcriptome and metabolome of bacteria, suggesting that the host could drive the switch from pathogenicity to commensalism in bacteria. Further, the authors used single-cell bacterial RNA-seq to demonstrate the heterogeneity in gut bacterial populations.

      Strengths:

      This is a valuable work that addresses an important question of the effect of the host on its gut microbes. The authors could convincingly demonstrate that gut bacteria are strongly affected by the host with important consequences for both interacting partners. Moreover, the authors used state-of-the-art bacterial single-cell RNA-seq to reveal heterogeneity in host-associated commensal populations.

      Weaknesses:

      Some of the conclusions are not fully supported by the data.

      Specifically, in lines 142-143, the authors claim that larva antagonizes the pathogenicity of S. marcescens based on the survival data. I do not fully agree with this statement. An alternative possibility could be that, since there are fewer S. marcescens in larvae-processed food, flies receive a lower pathogen load and consequently survive. Can the authors rule this out?

      Also, the authors propose that Drosophila larvae induce a transition from pathogenicity to commensalism in S. marcescens and provide nice phenotypic and transcriptomic data supporting this claim. However, is it driven only by transcriptional changes? Considering high mutation rates in bacteria, it is possible that S. marcescens during growth in the presence of larvae acquired mutations causing all the observed phenotypic and transcriptional changes. To test this possibility, the authors could check how long S. marcescens maintains the traits it acquires during growth with Drosophila. If these traits persist after reculturing isolated bacteria, it is very likely they are caused by genome alterations, if not - likely it is a phenotypic switch driven by transcriptional changes.

      We thank the reviewer for providing a feasible method to distinguish the shift in transcriptional profile from genomic mutations. According to this valuable suggestion, we checked phenotypic and transcriptional changes after re-culturing the bacterium that had coexisted with larvae. We found that all phenotypes can be recovered after re-culturing. The new data supported our previous result that a phenotypic switch was driven by transcriptional changes rather than genome mutations. We now add these results to the text with figure supplement 3 (line 147-151, 192-194). Please see the following text.

      “To rule out the possibility that phenotypic alterations could stem from genomic mutations, we examined the prodigiosin yield and CFUs of re-culturing S. marcescens that had coexisted with larvae. Our results showed that neither prodigiosin yield nor CFUs of re-culturing S. marcescens differed from the original strain (Figure 2-figure supplement 3A-C), suggesting that a phenotypic switch was driven primarily by transcriptional reprogramming.” “Consistent with the previous result that this phenotypic switch was driven by transcriptional changes, the expression of virulent and growth genes was recovered after re-culturing (Figure 3-figure supplement 3D, E).”

      For the first question, we admit the possibility that the high morality of flies could result from the acquirement of a higher pathogen load, because of an increase in the bacterial load of single S. marcescens. However, host pathogenesis is normally determined by the virulence of pathogens rather than the number of bacteria. For example, hosts constantly harbor astonishing commensals in their guts, but remain healthy. This evidence suggests that it was the property (virulence) of a pathogen that is more important to affect the health status of the hosts. Moreover, an increase in virulence of single S. marcescens was verified by real-time PCR (Fig. 2F) and TE (Fig. 2G). Taken together, we could draw a conclusion that the impaired survival of flies challenged with single S. marcescens mainly arose from an increase in the virulence of S. marcescens. Thanks for your understanding!

      Reviewer #2 (Public Review):

      Summary:

      While many studies have explored the impacts of pathogens on hosts, the effect of hosts on pathogens has received less attention. In this manuscript, Wang et al. utilize Drosophila melanogaster and an opportunistic pathogen, Serratia marcescens, to explore how the host impacts pathogenicity. Beginning with an observation that larval presence and density impacted microbial growth in fly vials (which they assess qualitatively as the amount of 'slick' and quantitatively as microbial load/CFUs), the authors focus on the impact of axenic/germ-free larvae on an opportunistic pathogen S. marcescens. Similar to their observations with general microbial load, they find that larvae reduce the presence of a pinkish slick of Sm, indicative of its secondary metabolite prodigiosin. The presence of larvae alters prodigiosin production, pathogen load, pathogen cellular morphology, and virulence, and this effect is through transcriptional and metabolic changes in the pathogen. Overall, they observe a loss of virulence factors/pathways and an increase in pathways contributing to growth. Given the important role the host plays in this lifestyle shift, the authors then examined host features that might influence these effects, focusing on the role of antimicrobial peptides (Amps). The authors combine the use of synthetic Amps and an Amp-deficient fly line and conclude much of the larval inhibitory effect is due to their production of AMPs.

      Strengths:

      This is a very interesting question and the use of Drosophila-Serratia marcescens is a great model to explore these interactions and effects.

      The authors have an interesting and compelling phenotype and are asking a unique question on the impact of the host on the pathogen. The use of microbial transcriptomics and metabolomics is a strength, especially in order to assess these impacts on the pathogen level and at the single-cell level to capture heterogeneity.

      Weaknesses:

      Overall, the writing style in the manuscript makes it difficult to fully understand and appreciate the data and its interpretation.

      The data on the role of AMPs would benefit from strengthening. Some of the arguments in the text of that section are also counterintuitive. The authors show that △AMP larvae have a reduced impact on Sm as compared to wt larvae, but it seems less mild of an effect than that observed with wt excreta (assuming the same as secreta in Figures 7, should be corrected or harmonized). Higher doses of AMPs give a phenotype similar to wt larvae, but a lower dose (40 ng/ul) gives phenotypes more similar to controls. The authors argue that this data suggests AMPs are the factor responsible for much of the inhibition, but their data seems more to support that it's synergistic- you seem to still need larvae (or some not yet defined feature larvae make, although secreta/excreta was not sufficient) + AMPs to see similar effects as wt. Based on positioning and color scheme guessing that AMP 40ng/ul was used in Figures 7D-H, but could not find this detail in the text, methods, or figure legend and it should be indicated. This section does not seem to be well supported by the provided data, and this inconsistency greatly dampened this reviewer's enthusiasm for the paper.

      We thank the reviewer’s valuable comments and suggestions. We admitted that some photos of the pinkish slick (prodigiosin) are counterintuitive in Figure 7 as well as figure supplement 2B. Here comes the reason. Single S. marcescens produced prodigiosin that only stayed on the surface of fly agar medium. As we know, larvae can agitate food and form a stratification of prodigiosin, even making higher prodigiosin yield inside food lighter than the surface slick of prodigiosin. We mentioned it in the previous manuscript line 166-168. This is why some photos treated with excreta and a lower dose of AMP seemed more intense than those with WT larvae. However, we precisely quantified the prodigiosin yield inside food with the spectrophotometer, so we provided a prodigiosin yield following the photos of the slick. Therefore, we drew our conclusions mainly relying on the quantification of the prodigiosin yield. We actually used cecropin A for our experiments, so we added this information in the text. We hope that our replies can reignite your enthusiasm for our manuscript, and thanks for your great support!

      Reviewer #3 (Public Review):

      In this study, Wang and coworkers established a model of Drosophila-S. marcescens interactions and thoroughly examined host-microbe bidirectional interactions. They found that:

      (1) Drosophila larvae directly impact microbial aggregation and density;

      (2) Drosophila larvae affect microbial metabolism and cell wall morphology, as evidenced by reduced prodigiosin production and EPS production, respectively;

      (3) Drosophila larvae attenuate microbial virulence;

      (4) Drosophila larvae modulate the global transcription of microbes for adaptation to the host;

      (5) Microbial single-cell RNA sequencing (scRNA-seq) analysis revealed heterogeneity in microbial pathogenicity and growth;

      (6) AMPs are key factors controlling microbial virulence phenotypes.

      Taken together, they concluded that host immune factors such as AMPs are directly involved in the pathogen-to-commensal transition by altering microbial transcription.

      General comments:

      In general, this study is intriguing as it demonstrates that host immune effectors such as AMPs can serve as critical factors capable of modulating microbial transcription for host-microbe symbiosis. However, several important questions remain unanswered. One such question is: What is the mechanism by which AMPs modulate the pathogen-to-commensal transition? One hypothesis suggests that antimicrobial activity may influence microbial physiology, subsequently modulating transcription for the transition from pathogen to commensal. In this context, it is imperative to test various antibiotics with different modes of action (e.g., targeting the cell wall, transcription, or translation) at sub-lethal concentrations to determine whether sub-lethal doses of antimicrobial activity are sufficient to induce the pathogen-to-commensal transition.

      Thank you for the important comments on our manuscript. We checked the effect of antibiotics (5 μg/μl kanamycin and 10 μg/μl ampicillin) on the virulence switch of S. marcescens. We found that the two antibiotics with the sub-lethal doses similarly resulted in a decrease in prodigiosin yield and virulence expression of S. marcescens. Intriguingly, the two antibiotics also resulted in a dramatic decline in the bacterial load and the expression of genes involved in cell growth. These results suggest that antibiotics reduced the virulence primarily through suppressing most activities of bacteria.

      We found that larvae and AMPs at 40 μg/μl modestly resulted in a decrease in bacterial load and an increase in the relative level of genes involved in cellular proliferation, suggesting that AMPs could maintain the exponential phase of bacterial growth. This result is consistent that Drosophila larvae can support the long-term persistence of commensals in the shared habitat (DOI: 10.1016/j.cmet.2017.11.011). The inhibition could prevent bacteria from rapidly exhausting their nutritional resources, and consequently maintain symbiosis. It is likely that AMPs could maintain S. marcescens at the exponential phase of cell growth and prevent bacteria from rapidly exhausting their nutritional resources.

      Author response image 1.

      (A) Representative images of surface slick with S. marcescens alone, with kanamycin (5 μg/μl) and ampicillin (10 μg/μl). (B) The prodigiosin production of S. marcescens alone, with kanamycin (5 μg/μl) and ampicillin (10 μg/μl). n = 6 for each. (C) Bacterial loads of S. marcescens alone, with kanamycin (5 μg/μl) and ampicillin (10 μg/μl). n = 6 for each. (D, E) RT-qPCR analysis of the expression levels of downregulated and upregulated genes in the S. marcescens alone, with kanamycin (5 μg/μl) and ampicillin (10 μg/μl). n = 3 for each. Means ± SEMs. All variables have different letters, they are significantly different (p < 0.05). If two variables share a letter, they are not significantly different (p > 0.05). ns, no significance. Kruskal-Wallis test followed by Dunn’s multiple comparisons test.

      Recommendations for the authors:

      Reviewer #1 (Recommendations For The Authors):

      Here are some specific points that need to be addressed:

      (1) Lack of statistical analysis for many figures. The authors should perform and report the statistical analysis for all figures where it is currently lacking, specifically, Figures 2C, D, E, F, H; Figures 3E, F; Figures 7G, H; Figure S2E, Figures S3D, E.

      Thanks for your valuable suggestions. We re-checked the manuscript and performed the statistical analysis for these figures.

      (2) For graphs showing dots, it should be specified what exactly individual dots show and how many animals were used per replicate. Also, time points at which specific analysis was performed should be specified.

      We provided the important information in the legends in the revised manuscript.

      (3) Figure 2. No letters illustrating statistical significance are shown, although this is claimed in the legend (line 848).

      We added statistical significance in the updated Figure 2.

      (4) In Figure 7, the authors used AMPs of defined concentration, but it is not specified what exactly these AMPs are. Please provide the full composition of the AMP mix used.

      We used the antimicrobial peptide cecropin A produced by a silkworm. We added this information in the methods line 487-488 and Figure 7 legend.

      (5) Figure S2B. To me, it looks like that medium with larvae is redder than after mechanical force. I find it hard to believe the quantification in panel C that the medium with larvae has 3 times less pigment as compared to the mechanical force.

      Larvae could only agitate the surface of food (~0.4 cm), but sticks completely agitated the food up to 3 cm. Thus, the layer of food with pink pigment with agitation seemed much deeper than with larvae, which was responsible for the counterintuitively. We explained it in the previous manuscript (line 166-168). “Of note, the surface of the slick with agitation appeared lighter than that of larvae, mainly due to a stratification of prodigiosin following agitation.”

      (6) The authors need to proofread the manuscript as there are missing words, terms that need definition, and wrong terms. For example, L86 - naked eye?, L117 - what do the authors mean by co-culture?, L309 - not resist but rather combat, L347 - Species? or competition?, Figure 2A - 2nd?

      We have corrected these errors in the new manuscript. We added an "eye" in L86. Co-culture means “S. marcescens in co-culture”. Interspecies competition for nearly the same or similar nutrients and space occurs in the habitat.

      (7) The authors should reorganize either the text or the figures' order in a way that the figures are described in a consecutive order (Figure 1A, B ... and not Figure 1D first and then 1A).

      Thanks for your valuable advice. We reorganize the order of the text.

      (8) Do the authors have an idea which bacteria they quantified in Figures 1E to 1G? I didn't find the medium that was used for culturing. Also, in Figure 1F, Is the control group comprised of females or males?

      Mixed bacteria (bacteria in the living environment of Drosophila) were quantified in the NA medium that supports the growth of Drosophila microbiota (Jia Y, et al. Nat Commun. 2021) line 474-475. The control group comprised of both males and females with a 1:1 ratio. Similarly, the aged group contained 100 50-day-aged flies, male: female = 1:1. We provided details in Figure 1 legend line 849-850, 851-852.

      (9) L118-129. it is not possible to make all these statements without any statistical analysis. To me, at 96h both treatments have the same CFUs, while the authors claim they are different.

      We added statistical analysis in the current version. In fact, single S. marcescens became collapsed after 72 h post inoculation, and the CFU number of single S. marcescens declined step by step. The bacterial load of S. marcescens in co-culture was comparable (at 96 h post-inoculation, p>0.05) or higher (at 120 h post-inoculation, p<0.001) than S. marcescens alone, possibly explained by the possibility that bacteria rapidly exhausted the nutritional resources and collapsed through population suicide. We rewrote this sentence line 125-129 in the updated manuscript.

      (10) L136. term "symbionts" is not appropriate here.

      We change “symbionts” into “S. marcescens”.

      (11) In Figure 1, the authors used flies of different fitness: weak, strong, and infertile. They should be specific and describe exactly what these terms mean, are these mutants or treatments that affect the fitness?

      We apologize for this missing information and add them in the method and legend. Strong flies (wild-type fly CS), weak flies (yw; Sp/CyO; MKRS/TM6B), infertile flies (dfmr150M null mutant) Figure 1 legend line 849-850.

      (12) Figure S2. The title of this figure is misleading, please modify it. Mechanical force did affect S. marcescens but to a lesser degree as compared to larvae.

      Thank you for your suggestion. We admit that mechanical force affected S. marcescens but to a lesser degree as compared to larvae, so we changed the title to "Biological factors mainly determine S. marcescens lifestyle."

      Reviewer #2 (Recommendations For The Authors):

      General improvement to writing and presentation (see below):

      Describing confluent growth would make more sense than 'slick' and then using descriptions of broken, etc. "colour intensity of the surface slick".

      We used the slick to describe visible surface films of bacteria, which has been used in the previous study (DOI: 10.1038/s43705-023-00307-8). Slick is equal to confluent growth, but seems simple and easy than confluent growth. To make sense, we add this reference to the text.

      We reorganized the text of Figure 1.

      Suggest more specific language to describe observations. For example: Bacterial loading - S. marcescens growth (for example: the presence of dense fly populations reduced Sm growth).

      Thanks for the suggests. We replaced some of them.

      Symbiont, microbiota, microbiome, etc were all used interchangeably throughout the manuscript, but I am not sure I would call Sm part of the indigenous microbiome. Suggest to ensure proper usage and then harmonize throughout the ms.

      We used microbes and microbiome to replace symbiont and microbiota, respectively.

      Details missing from the message and Figure legends that would be helpful (including and especially Figure 7 - what AMP concentration?)

      Thanks for valuable comments. According to this comment, we provided concrete details in the Materials and methods and Figure 7 legend about AMPs, including the source and concentration of AMPs line 487-488, 954-955. Please see the response below.

      L73: define 'these issues" maybe or lead better with the prior sentence, it is not evident as currently written.

      Change "to address these issues" to " To investigate whether and/or how the host modulates bacterial lifestyles,” and merge two paragraphs.

      L74: repetitive sentence with the above.

      Thanks for pointing out this detail. We deleted it.

      L86: naked 'eye'.

      Added.

      L87: what is meant by 'weak flies'?

      Genotypes were added in the updated manuscript. Weak fly stocks display weaker activity and generate fewer eggs than WT flies.

      L96: bacterial load, not loading.

      Corrected.

      L128: no evidence to support, could be reflective of increased numbers in dying/dead larvae that impact total numbers in the vial.

      The number of CFUs of S. marcescens alone was gradually decreased at 96 h post-inoculation. In addition, we observed pale biofilm on the surface of the medium at the late stage. The numbers of CFUs of S. marcescens alone at the later stages were reduced (compared to the peak load at 48 h post-inoculation), so it was deterred that bacteria could undergo ecological suicide. Ecological suicide of the bacterial population was similarly examined by recording the number of CFUs in the medium over time (Ratzke C, et al. Nat Ecol Evol. 2018.). Taken together, we draw a conclusion that bacteria possibly underwent ecological suicide.

      L129: the prior sentence is in contradiction, reduced load only at early time points in the presence of larvae....

      Thanks for pointing out this detail. We added " before 72 h post-inoculation " in the sentence.

      L134: data is only focused on S marcescens, so inferring to 'symbionts' broadly is outside study.

      We change “symbionts” into “S. marcescens”.

      L139: sentence poorly written and confusing.

      We re-organized this sentence.

      To this end, we sought to examine the S. marcescens lifestyle switch from pathogenicity to commensalism by assessing the respective survival of flies on the fly medium that had been processed by single or coexisting S. marcescens.

      L189: evidence for long-term symbiosis is not well established in this paper, suggest editing this language throughout to more specifically reflect what the data supports and leave such interpretations to discussion points and future work.

      Thanks for your valuable advice. We deleted long-term and “thereby promoting the fitness of symbionts in the long maintenance.”.

      L192; used metabolomics to assess the impacts of larvae on bacterial metabolism, as currently written does not make sense.

      We rewrote this sentence. “Next, we investigated whether larvae could further elicit changes in the metabolism of S. marcescens using untargeted metabolomics.”

      L331: the use of monitored here is not correct/odd.

      We changed 'monitored' to 'reshaping’.

      L340: While the authors initially see a cost to Sm in reduced load (CFUs) at 120 h populations associated with larvae become higher - there is also a cost to producing virulence factors, which their RNASeq and metabolomics data support - trade-offs between growth and virulence.

      Thanks for your suggestion. We added “before 72 hours post inoculation” to define the early stage of the bacterial growth in the sentence.

      Reviewer #3 (Recommendations For The Authors):

      (1) Figures 1 A-D: What defines weak and strong flies, and what criteria determine the robustness of flies? How was the experiment conducted? The manuscript lacks details on this matter.

      We thank you for your comments. We lack a criterium, but the robustness of flies comes from daily experience. Weak fly stocks display weak activity and generate fewer eggs than WT flies. Genotypes with different robustness were added in the legend in the updated manuscript

      (2) The authors mentioned, "Noteworthily, the number of CFUs of S. marcescens alone was lower than S. marcescens in co-cultures at the late stage (at 96 h post inoculation), likely that bacteria rapidly exhausted their nutritional resources and underwent ecological suicide." How did they determine that the bacteria exhausted nutritional resources and underwent ecological suicide? One might speculate that larvae could have removed the bacteria simply by consuming them.

      Thanks for this comment. Virtually, there were no larvae inside the vials with single S. marcescens, so bacterial cells were not consumed. However, the numbers of CFUs of S. marcescens alone at the later stages were reduced (compared to the peak load at 48 h post-inoculation), so it was deterred that bacteria could undergo ecological suicide. Ecological suicide of the bacterial population was examined by recording the number of CFUs in the medium over time (Ratzke C, et al. Nat Ecol Evol. 2018.). A similar method was also applied to the number of CFUs of S. marcescens. Taken together, we draw a conclusion that bacteria possibly underwent ecological suicide.

      (3) Figure 2E: The experimental details should be provided in the text. What was the CFU of the bacteria used in this survival experiment?

      We provided further experimental details in the legend line 869-870. The same amount of inocula was used in both single and coculturing S. marcescens.

      (4) The experimental data in Figures 2G and 2H do not sufficiently prove the relationship between the width of the cell wall and virulence, as it lacks experimental validation.

      Previous studies (DOI: 10.1371/journal.ppat.1005946) reveal that glucosylating toxins on the surface are primary virulence determinants, so an increased surface-anchored polysaccharide and protein profile promotes the virulence of the pathogen. Alterations in cell surface (the width of the cell wall) can be examined by TE. Moreover, TE was used to observe changes in the virulence of S. marcescens (DOI: 10.1093/nar/gkab1186). We think that the width of the cell wall could be used to reflect virulence in S. marcescens.

      (5) While it's acknowledged that agitation decreases the color intensity of the bacteria, comparing mechanical agitation with larval crawling seems inappropriate, as the mechanical forces exerted by both methods are not of the same magnitude.

      Thanks for the suggestion. In fact, food was agitated more heavily by glass sticks than by larvae, because larvae merely agitated the surface of food (about 0.5 cm-depth). If the decrease in bacterial load and color was related to the magnitude of agitation, larvae would confer a less decrease (from the decrease in stick agitation) in bacterial load than the sticks. Consequently, it would further support our result that biofactors more importantly confer the inhibition of S. marcescens than force.

      (6) Figure 4D: with this metabolome data, they mentioned, "host suppresses differentiation of S. marcescens into the population with pathogenicity." What evidence supports the claim that downregulation of amino acid metabolism, phosphotransferase system, and ABC transporter directly correlates with decreased pathogenicity?

      Thanks for the comment. Earlier studies showed that amino acid-derived quorum sensing molecules are closely related to bacterial pathogenicity (Defoirdt T. PLoS Pathog. 2019; Wen J, et al. Microbiol Spectr. 2022). Moreover, the phosphotransferase system and ABC transporter can transport and/or produce virulence factors. Therefore, we claimed that downregulation of amino acid metabolism, phosphotransferase system, and ABC transporter directly were related to decreased pathogenicity. To support this claim, we add some references in the updated manuscript line 662-664, 827-830.

      (7) Serotonin: Does serotonin also reduce the virulence of S. marcescens?

      Our primary result showed that serotonin indeed could reduce the virulence of S. marcescens (figure supplement 4), because the survival rate of adult flies was increased and the expression levels of virulence-related genes of S. marcescens alone in the case of serotonin.

      (8) Figures 6D, E, H, I: The expression of key genes should be verified using quantitative real-time polymerase chain reaction (qRT-PCR), as scRNA-seq expression levels might not accurately reflect the true expression levels.

      Bacterial single-cell RNA-seq can evaluate alterations in gene expression in the single-cell resolution. The expression of key genes screened by scRNA-seq was changed only in subpopulations, so the average expression of these genes would be comparable when mixed with a large population. We are afraid that qRT-PCR could be illegible to verify the expression of genes in subpopulations.

      (9) Figure 7: The authors mentioned. "AMPs were supplemented to fly food". However, I could not find information regarding which AMPs and their respective concentrations (i.e., concentration of each AMP) were used in this study. This is a critical aspect of the research; therefore, details should be provided.

      Thanks for your important suggestions. We used the antimicrobial peptide cecropin A, which is produced by silkworms. We provided this information in the methods line 487-488. The concentrations of cecropin A were added in Figure 7 legend.

      (10) Figure 7: Delta AMP + AMP exhibited a stronger effect on the bacteria compared to AMP alone, indicating that immune effectors other than AMP may be involved. Since the IMD pathway is necessary for most immune effectors, including AMP, it would be interesting to test IMD pathway mutant animals and compare them with Delta AMP. Delta AMP + AMP exhibited a stronger effect on the bacteria compared to AMP alone. 

      We appreciate this important question. Indeed, Delta AMP + AMP exhibited a stronger effect on the bacteria compared to AMP alone. We admitted that immune effectors other than AMP may be involved. Alternatively, mechanical force, to a less extent, accounted for the stronger effect on the bacteria (Explained by larvae agitation in figure supplement 2). To rule out this possibility, we examined the effect of total immune effectors on the bacterial load and the prodigiosin yield of S. marcescens using the IMD pathway mutant (RelE20 larvae). Our result showed that the optical density and yield of prodigiosin in Delta AMP group did not significantly differ from the ones in RelE20 group. Moreover, the load of S. marcescens associated with Delta AMP mutant was comparable to that of S. marcescens associated with RelE20 mutant. These results suggested that AMPs play a major role in recapitulating the response of _S. marcescens t_o larvae.

      “To rule out the potential role of other immune effectors, we turned to the IMD pathway mutant RelE20 that is deficient in total immune effectors. Our result showed that the optical density and yield of prodigiosin in RelE20 group did not significantly differ from the ones in DAMP group (figure supplement 7A, B). Moreover, the load of S. marcescens associated with RelE20 mutant was comparable to that of S. marcescens associated with Delta AMP mutant (figure supplement 7C).”

      We now added these results in the text line 326-331.

    1. Author response:

      The following is the authors’ response to the original reviews.

      Response to Reviewer #1:

      Comment 1:

      Summary:

      The authors sought to investigate the associations of age at breast cancer onset with the incidence of myocardial infarction (MI) and heart failure (HF). They employed a secondary data analysis of the UK Biobank. They used descriptive and inferential analysis including Cox proportional hazards models to investigate the associations. Propensity score matching was also used. They found that Among participants with breast cancer, younger onset age was significantly associated with elevated risks of MI (HR=1.36, 95%CI: 1.19 to 1.56, P<0.001) and HF (HR=1.31, 95% CI: 1.18 to 1.46, P<0.001). the reported similar findings after propensity matching.

      Strengths:

      The use of a large dataset is a strength of the study as the study is well-powered to detect differences. Reporting both the unmatched and the propensity-matched estimates was also important for statistical inference.

      Weaknesses:

      Despite the merits of the paper, readers may get confused as to whether authors are referring to “age at breast cancer onset” or “age at breast cancer diagnosis”. I suppose the title refers to the latter, in which case it will be best to be consistent in using “age at breast cancer diagnosis” throughout the manuscripts. I would recommend a revision to the title to make it explicit that the authors are referring to “age at breast cancer diagnosis”.

      Thank you for your nice comments and suggestions. Yes, as you mentioned, in this study, we focused on age at breast cancer diagnosis, which was obtained from the cancer registry data in the UK Biobank and was used in all the analyses. We agree with you that it would be better to consistently use “age at diagnosis of breast cancer” throughout the manuscripts for a better understanding; therefore, we have replaced “age at breast cancer onset” with “age at diagnosis of breast cancer”.

      Change in the manuscript:

      “Age at breast cancer onset” was replaced with “age at diagnosis of breast cancer” in the title and throughout the manuscripts.

      Recommendations For The Authors:

      Kindly review the references for the location of the full stop. Putting the full stop at the end of the parenthesis makes reading smother than its current form as it is difficult to know when the new sentence begins.

      Thank you for your suggestion. We have made revisions to the location of the full stop next to a reference.

      Change in the manuscript:

      The full stop was put at the end of the parenthesis of a reference throughout the manuscripts.

      Response to Reviewer #2:

      Comment 1:

      This is a well-presented large analysis from the UK Biobank of nearly 250,000 female adults. The authors examined the associations of breast cancer diagnosis with incident myocardial infarction and heart failure by different onset age groups. Based on results from a series of statistical analyses, the authors concluded that younger onset age of breast cancer was associated with myocardial infarction and heart failure, highlighting the necessity of careful monitoring of cardiovascular status in women diagnosed with breast cancer, especially those younger ones.

      Comments to consider:

      It’s thoughtful for the authors to have included and adjusted for menopausal status, breast cancer surgery, and hormone replacement therapy in their sensitivity analysis. It would be informative if the authors presented the number and percentages of menopause and cancer treatments.

      Thank you for your comments. As suggested, we have provided more detailed information on the number and percentage of menopausal status and breast cancer treatments.

      Change in the manuscript:

      Page 11, Lines 208 to 211: added “Among participants with breast cancer, 11 460 (70.6%) participants were postmenopausal, 14 255 (87.6%) participants had undergone breast cancer surgery, and 6 784 (41.8%) participants had received hormone replacement therapy.”

      Change in the supplementary material:

      The number and percentage of menopausal status, breast cancer surgery, and hormone replacement therapy were added to Table S13.

      aAdjusted for age, ethnicity, education, current smoking, current drinking, obesity, exercise, low-density lipoprotein cholesterol, depressed mood, hypertension, diabetes, antihypertensive drug use, antidiabetic drug use, statin use, menopausal status, breast cancer surgery, and hormone replacement therapy.

      HR, hazard ratio; CI, confidence interval.

      Comment 2:

      The analytical baseline used for follow-up should be pointed out in the methods section. It’s confusing whether the analytic baseline was defined as the study baseline or the time at breast cancer diagnosis.

      We apologize for the confusion. In this study, the analytical baseline used for follow-up was defined as the baseline of UK Biobank (2006-2010) and we have pointed it out in the methods section as suggested.

      Change in the manuscript:

      Page 9, Lines 165 to 166: added: “The analytical baseline used for follow-up was defined as the baseline of UK Biobank (2006-2010).”

      Comment 3:

      Did the older onset age group have a longer follow-up duration? Could the authors provide information on the length of follow-up by age of onset in Supplementary Table S4? It would give the readers more information regarding different age groups.

      Thank you for your question. We compared the time of follow-up among the three diagnosis age groups and found that although the durations of follow-up among the three groups were quite similar (as shown in Table S4), statistical analysis revealed a significant difference with the older diagnosis age group demonstrating a longer follow-up duration (P for Kruskal-Wallis test <0.001). This is understandable as with large sample sizes, even a slight difference could lead to statistical significance. According to your suggestion, we have added information on the length of follow-up by age of diagnosis in Supplementary Table S4.

      Change in the supplementary material:

      Added the median and interquartile range of follow-up in Supplementary Table S4.

      The results are presented as the mean ± standard deviation, or No. (%).

      aThe effect sizes are standardized mean differences for continuous outcomes and the Phi coefficient for dichotomous outcomes.

      LDL-C, low-density lipoprotein cholesterol.

    1. Author response:

      The following is the authors’ response to the original reviews.

      Reviewer #1 (Public Review):

      This study addresses the temporal patterning of a specific Drosophila CNS neuroblast lineage, focusing on its larval development. They find that a temporal cascade, involving the Imp and Syb genes changes the fate of one daughter cell/branch, from glioblast (GB) to programmed cell death (PCD), as well as gates the decommissioning of the NB at the end of neurogenesis.

      I believe there are some inaccuracies in this summary. We address temporal patterning during larval and pupal stages until the adult stage. The Imp and Syp genes change the fate of one daughter cell/branch from survival to programmed cell death (PCD). The change from glioblast (GB) to PCD, which occurs at an early time point, is not addressed here. The main point of the paper is missing:

      • Last-born MNs undergo apoptosis due to their failure to express a functional TF code, and this code is post-transcriptionally regulated by the opposite expression of Imp and Syp in immature MNs.

      Reviewer #2 (Public Review):

      Summary:

      Guan and colleagues address the question of how a single neuroblast produces a defined number of progeny, and what influences its decommissioning. The focus of the experiments are two well-studied RNA-binding proteins: Imp and Syp. The Authors find that these factors play an important role in determining the number of neurons in their preferred model system of VNC motor neurons coming from a single lineage (LinA/15) by separate functions taking place at specific stages of development of this lineage: influencing the life-span of the LinA neuroblast to control its timely decommissioning and functioning in the Late-born post-mitotic neurons to influence cell death after the appropriate number of progeny is generated. The post-mitotic role of Imp/Syp in regulating programmed-cell death (PCD) is also correlated with a specific code of key transcription factors that are suspected to influence neuronal identity, linking the fate of neuronal survival with its specification. This paper addresses a wide scope of phenotypes related to the same factors, thus providing an intriguing demonstration of how the nervous system is constructed by context-specific changes in key developmental regulators.

      The bulk of conclusions drawn by the authors are supported by careful experimental evidence, and the findings are a useful addition to an important topic in developmental neuroscience.

      I cannot summarize better the paper.

      Strengths:

      A major strength is the use of a genetic labeling tool that allows the authors to specifically analyze and manipulate one neuronal lineage. This allows for simultaneous study of both the progenitors and post-mitotic progeny. As a result the paper conveys a lot of useful information for this particular neuronal lineage. Furthermore addressing the association of cell fate specification, taking advantage of this lab's extensive prior work in the system, with developmentally-regulated programmed celldeath is an important contribution to the field.

      Beyond Imp/Syp, additional characterization of this model system is provided in characterizing a previously unrecognized death of a hemilineage in early-born neurons.

      Thanks!

      Weaknesses:

      The main observations that distinguish this study from others that have investigated Imp/Syp in the fly nervous system is the role played in late-born post-mitotic neurons to regulate programmed cell death. This is an important and plausible (based on the presented findings) newly discovered role for these proteins. However the precision of experiments is not particularly strong, which limits the authors claims. The genetic strategy used to manipulate Imp/Syp or the TF code appears to be done throughout the entire lineage, or all neuronal progeny, and not restricted to only the late born cells. Can the authors rule out survival of the early born hemi-lineage normally fated to die? Therefore statements such as this: 

      To further investigate this possibility, we used the MARCM technique to change the TF code of lastborn MNs without affecting the expression of Imp and Syp should be qualified to specify that the result is obtained by misexpressing these factors throughout the entire lineage.

      We agree that our genetic manipulations affect the entire lineage or all neuronal progeny. We do not have genetic tools to gain such precision. We have changed our descriptions to specify the entire lineage or all neuronal progeny. As the reviewer raised, we were also concerned about the possibility that the overexpression of Imp or knockdown of Syp could induce the survival of the early-born hemilineage. We have two experiments that rule out this possibility:

      (1) In late LL3 larvae, Imp OE or syp MARCM clones do not change the number of cells in LL3 larvae (see Guan et al., 2022), indicating that the hemilineage that died by PCD is not affected. If Imp or Syp played a role in the survival of the hemilineage, we would see at least a 50% increase in the number of MNs at this stage.

      (2) The MARCM experiment using the VGlut driver to overexpress P35 or Imp allows us to manipulate only elav+ VGlut+ neurons. The hemilineage removed by PCD is elav- VGlut- and is not affected by this experiment. Consequently, the increase in MNs in adults with genetic manipulation can only be the result of the survival of the other hemilineage (elav+, VGlut+). Moreover, this experiment shows an increase in the number of neurons in the adult but not in LL3, demonstrating that the hemilineage (elav- VGlut-) is still removed by PCD with this genetic manipulation.

      The authors make an observation that differs from other systems in which Imp/Syp have been studied: that the expression of the two proteins appears to be independent and not influenced by cross-regulation. However there is a lack of investigation as to what effect this may have on how Imp/Syp regulate temporal identity. A key implication of the previously observed cross-regulation in the fly mushroom body is that the ratio of Imp/Syp could change over the life of the NB which would permit different neuronal identities. Without cross-regulation, do the authors still observe a gradient in the expression pattern of time? Because the data is presented with Imp and Syp stained in different brain samples, and without quantification across different stages, this is unclear. The authors use the term 'gradient' but changes in levels of these factors are not evident from the presented data.

      We have now quantified the transcriptional activity of Imp and Syp in the NB over time using smFISH. We have also quantified the relative expression of Imp and Syp protein in the NB over time by co-immunostaining. Additionally, we quantified the relative expression of Imp and Syp protein in postmitotic neurons as a function of their birth order in late LL3 larvae. All these data show an opposite temporal gradient of Imp and Syp in the NB and an opposite spatial gradient in immature neurons according to their birth order (Figure. 4). How these gradients are established in our system remains to be elucidated. 

      Reviewer #3 (Public Review):

      This study by Guan and co-workers focuses on a model neuronal lineage in the developing Drosophila nervous system, revealing interesting aspects about: a) the generation of supernumerary cells, later destined for apoptosis; and, b) new insights into the mechanisms that regulate this process. The two RNA-binding proteins, Imp and Syp, are shown to be expressed in temporally largely complementary patterns, their expression defining early vs later born neurons in this lineage, and thus also regulating the apoptotic elimination. Moreover, neuronal 'fate' transcription factors that are downstream of Imp and signatures of early-born neurons, can also be sufficient to convert later born cells to an earlier 'fate', including survival.

      The authors provide solid evidence for most of their statements, including the temporal windows during which the early and the later-born motoneurons are generated by this model lineage, how this relates to patterns of cell death by apoptosis and that mis-expression of early-born transcription factors in later-born cells can be sufficient to block apoptosis (part of, and perhaps indicative of the late-born identity).

      Other studies have previously outlined analogous, mutually antagonistic roles for Imp and Syp during nervous system development in Drosophila, in different parts and at different stages, with which the working model of this study aligns.

      Overall, this study adds to and extends current working models and evidence on the developmental mechanisms that underlie temporal cell fate decisions.

      I cannot summarize better the paper.

      Reviewer #1 (Recommendations For The Authors):

      While this is an interesting topic, I raised two issues in my original review.

      (1) Against the backdrop of numerous previous studies linking many developmental regulators, including tTFs, to programmed cell death in the developing CNS, which in several cases have involved identifying key PCD genes and decoding the molecular regulatory interplay between regulators and PCD genes, this study does not provide any new insight into the regulation of developmental PCD in the CNS.

      The authors have not added any new data to address this shortcoming.

      I agree with the reviewer that we did not attempt to link Imp/Syp with the temporal transcription factor (tTF) cascade or spatial selectors such as Hox genes. However, this decision was intentional as our primary focus was on studying immature MNs. It is worth noting that the decommissioning of NBs by autophagic cell death or terminal differentiation, which is mediated by Imp/Syp in other lineages, has not been correlated with tTFs or spatial selectors. Although we have not directly examined the involvement of the hb + sv > kr > pdm > cas > cas-svp > Grh cascade in the decommissioning of the Lin A neuroblast, our preliminary data indicate that Hb, Sv, Pdm, and Cas are not expressed in the Lin A NB, while Grh is consistently expressed in the NB (Wenyue et al., 2022). Thus, it is less likely that this particular tTF cascade is not implicated in Lin A neuroblast decommissioning. In contrast, spatial selectors, such as the Hox gene Antp, play an opposing role compared to HOX transcription factors in abdominal NBs. In the Lin A lineage, Antp promotes survival (Baek, Enriquez, & Mann, 2013). Here, to avoid repeating what has already been described in the literature, we focused on the role of Imp/Syp in postmitotic neurons and revealed that the precise elimination of MNs is linked to the control of TFs expressed in the MNs.

      (2) I raised the issue that it is unclear if Imp/Syp acts in the NB, and/or in IMC/GMC, and/or in the daughter cells generated from these.

      I agree with the reviewer's concern regarding the unclear function of Imp/Syp, i.e., whether it acts in the NB, IMC/GMC, or daughter cells. To address this, one possible approach would be to attempt rescuing Imp and Syp mutants by transgenic expression in specific cell types, such as NBs, IMC/GMC, or GB/daughter cells. However, we have not conducted such experiments as we were skeptical about the outcome. Previous published work has used drivers expressed in NBs, IMC/GMC, or postmitotic neurons to decipher the function of a gene in a specific cell type. But the results of these experiments must be taken with caution. Using NB/GMC drivers to study gene function can lead to effects not only in the NB but also in its progeny, including GMC or postmitotic neurons, due to the perdurance and stability of the Gal4 and UAS-gene expression system. For instance, dpn-Gal4 UASGFP not only labels the NB but also many of its progeny, even if Dpn is only expressed in NBs. And elav-Gal4 is expressed in the NB and GMCs.

      However, our overexpression of Imp in immature neurons using Vglut demonstrates that Imp promotes cell survival through an autonomous function in these neurons. This driver is only expressed in postmitotic neurons (elav+) and not in the NB, IMC/GMC, or in the hemilineage eliminated by cell death (elav-vglut-).

      Reviewer #2 (Recommendations For The Authors):

      Oddly knockdown of Imp in the neuroblast (Fig. 5D) only led to death at 8h APF, when Imp is no longer expressed. Do the authors have an explanation as to how the stem cell can survive until this point? A discussion would be helpful.

      The simple explanation is the efficiency of RNAi. The imp-/- MARCM clones (Guan et al., 2022) lead to a stronger reduction of MNs in LL3.

      A simple experiment I would recommend is to repeat the antibody stainings of staged larvae/pupae (Fig. 4) having the anti-Imp/Syp antibodies in the same brain sample, and perhaps a quantification of the ratio in the NB. Given the species in which the ABs were raised seem compatible, this should be feasible. As it stands now, there is no indication of whether the ratio of Imp vs Syp change over time.

      We have now quantified the transcriptional activity of Imp and Syp in the NB over time. We have also quantified the relative expression of Imp and Syp proteins in the NB over time and quantified the relative expression of Imp and Syp proteins in postmitotic neurons as a function of their birth in late LL3 larvae. How these gradients are established in our system still remains to be 

      Minor errors/suggestions:

      Fig 4. Time legend at the top goes A, B, C, E, F (no D). So it doesn't match the panels below

      Yes, we have made the corrections.

      Sentence repeated in Intro:

      The process of terminating NB neurogenesis through autophagic cell death or terminal differentiation is commonly referred to as decommissioning.

      Yes, corrections have been made.

      IN FIGURE 1 THEY SAY 'TYPE IB' AND IN FIGURE 2 THEY SAY 'TYPE 1B'

      We have changed it to type 1b.

      In Fig2A-It's hard to see lack of Elav and Fig2G-It's hard to see presence of Dcp1. Panels could be adjusted to emphasize these results

      We have increased the size of the panels and made two separate panels where only the elav and Dcp1 signals are present.

      Observations that the result is equivalent in all thoracic segments is expected, since all legs need the same number of neurons. This is nice to have but can be in the supplement.

      Overall the figure number seems excessive, especially considering much of the results included(particularly the NB results) are findings consistent with previous papers and some is characterization of the system that does not fit well with the main focus regarding Imp/Syp (i.e death of one hemi-lineage:

      Figure 5 and 6 can be joined as one.

      We have combined Figures 5 and 6, showing only the T1 segments.

      There is some discrepancy between graphs Fig7F and K: At LL3 the number of neurons is different for the control in 7F and the count in K

      Yes, because the genetic backgrounds are not the same and we are not counting the same type of cells. In 7F, we are counting the elav+ and VGlut+ cells, whereas in Figure 7K, we are counting all the elav+ in Lin A, including those elav+ VGlut-. VGlut expression arrives a bit later after elav+, which is why we have fewer elav+ cells in 7F. In other words, VGlut MARCM clones do not label all Lin A elav+ cells. I have clarified this in the figure.

      Reviewer #3 (Recommendations For The Authors):

      Main comment: on the notion of Imp and Syp gradients:

      p. 5, related to figure 4 - there are clearly distinct windows for predominantly (if not exclusively) Imp, and later, Syp expression in lineage 15, with a phase of co-expression.

      However, based on the data shown, it is unclear whether these windows represent gradients, as repeatedly stated. If the notion of gradients is derived from other studies, on other lineages, then this would be good to clarify. Alternatively, the idea of temporally opposing gradients of Imp and Syp would need to be demonstrated for this lineage.

      For example, a more accurate way to describe this study's data is given on p.7 "In conclusion, our findings demonstrate that the opposite expression pattern of Imp and Syp in postmitotic neurons precisely shapes the size of Lin A/15 lineage by controlling the pattern of PCD in immature MNs (Fig. 8)."

      We have now quantified the transcriptional activity of Imp and Syp in the NB over time. We have also quantified the relative expression of Imp and Syp proteins in the NB over time. We have also quantified the relative expression of Imp and Syp proteins in postmitotic neurons as a function of their birth in late LL3 larvae. How these gradients are established in our system still remains to be identified.

      Minor points:

      p.6, related to figure 7: Are numbers of EDU- early born and EDU+, late born, MNs expressed as means in the main text? As written, it suggests absence of any variability, which one would expect and which is shown in Fig.7 data.

      Yes, we have added averages in the text.

      Methods: the author name 'Lacin' has been mis-spelled

      Sorry about that, it's been corrected.

    1. Author response:

      The following is the authors’ response to the original reviews.

      eLife assessment

      This paper proposes a valuable new method for the assessment of the mean kurtosis for diffusional kurtosis imaging by utilizing a recently introduced sub-diffusion model. The evidence supporting the claims that this technique is robust and accurate in brain imaging is incomplete. The work could be of interest in the research and clinical arena.

      We thank the editors for their assessment and the reviewers for their careful reading and feedback that helped to improve the manuscript. We have addressed all the reviewers’ concerns and would like to request an update of the assessment to reflect the revisions we have made.

      Below, we address the reviewers’ comments.

      Public Reviews:

      Reviewer #1 (Public Review):

      Summary:

      This study introduces an innovative method for assessing the mean kurtosis, utilizing the mathematical foundation of the sub-diffusion framework. In particular, a new fitting technique that incorporates two different diffusion times is proposed to estimate the parameters of the sub-diffusion model. The evaluation of this technique, which generates kurtosis maps based on the sub-diffusion framework, is conducted through simulations and the examination of data obtained from human subjects.

      We thank Reviewer #1 for pointing out the novelty and innovation of our work.

      Strengths:

      The utilization of the sub-diffusion model for tissue characterization is a significant conceptual advancement for the field of diffusion MRI. This study adeptly harnesses this approach for an accurate estimation of the parameters of the widely employed diffusion model, DKI, leveraging their established analytical interconnection as evidenced in prior research. Notably, this approach not only proposes a robust, fast, and accurate technique for DKI parameter estimation but also underscores the viability of deploying the sub-diffusion model for tissue characterization, substantiated by both simulated and human subject analyses. The paper is very-well written; well-organized; and coherent. The simulation study included different aspects of water diffusion as captured by diffusion-weighted MRI such as varying diffusion times and different b-value subpopulations, resulting in a comprehensive and thorough discussion.

      We thank Reviewer #1 for highlighting the the strengths of our work.

      Weaknesses:

      The primary objective of this study is to demonstrate a robust approach for estimating DKI parameters by directly calculating them using the parameters of the sub-diffusion model. This premise, however, relies on the assumption that the sub-diffusion model effectively characterizes the diffusion MRI signal and that its parameters are both robust and accurate. Throughout the manuscript, the term "ground truth kurtosis K" is frequently used to denote the "true K" value in the context of the simulation study. Nonetheless, given that the data is simulated using the new sub-diffusion model - an approximation of the DKI-based signal expression- this value cannot truly be considered the "ground truth K". The simulation study highlights the robustness and accuracy of D* and K*, but it inherently operates under the assumption that the observed data is in the form of the sub-diffusion model.

      It is correct that our study operates under the assumption that the observed data is in the form of the sub-diffusion model, and indeed one of the key outcomes of this work is to demonstrate the effectiveness of that assumption and the new possibilities it brings. Naturally, using any mathematical model at all carries assumptions. Over the past two decades, many mathematical and biophysical models have been proposed to characterise diffusion MRI signals. However, model validation remains an open challenge in the field. In this, as well as in our previous work (Yang et al, NeuroImage, 2022), we have shown that our proposed sub-diffusion model not only provides a much better fitting compared to the traditional DKI method, overcoming the major limitation of the traditional DKI method on the maximum b-value, but also generates brain maps with superior tissue contrast and elucidates previously unseen structure.

      We have replaced the term “ground truth kurtosis K” with “true kurtosis K”.

      The comment “… using the new sub-diffusion model – an approximation of the DKI-based signal expression…” is a bit misleading. In fact we propose that the reverse interpretation is the more suitable way to view the relationship: the DKI model is a degree-2 approximation of the sub-diffusion model, as in eq. (7).

      Reviewer #2 (Public Review):

      Summary: The authors present a technique for fitting diffusion magnetic resonance images (dMRI) to a sub-diffusion model of the diffusion process within brain imaging. The authors suggest that their technique provides robust and accurate calculation of diffusional kurtosis imaging parameters from which high quality images can be calculated from short dMRI data acquisitions at two diffusion times.

      Strengths: If the authors can show that the dMRI signal in brain tissue follows a sub-diffusion model decay curve then their technique for accurately and robustly calculating diffusional kurtosis parameters from multiple diffusion times would be of benefit for tissue microstructural imaging in research and clinical arenas.

      In Figure 7, we showed that the diffusion MRI signals follow the sub-diffusion model decay curves.

      Weaknesses: The applied sub-diffusion model has two parameters that are invariant to diffusion time, D_β and β which are used to calculate the diffusional kurtosis measures of a diffusion time dependent D* and a diffusion time invariant K*. However, the authors do not demonstrate that the D_β, β and K* parameters are invariant to diffusion time in brain tissue.

      In our proposed sub-diffusion model, D_β and β are assumed to be time-independent parameters, which is a key strength of the approach. The goal is to characterise tissue-specific properties (D_β for diffusivity and β for the extent of tissue complexity) that do not rely on the diffusion time setting in diffusion MRI experiments. To extract such time-independent properties, we proposed a new sampling and fitting strategy – fitting at least two diffusion time data together.

      The authors' results visually show that there is time dependence of the K* measure (in Figure 6) that is more apparent in white matter with K* values being higher for diffusion times of ∆=49 ms than ∆ = 19 ms. The diffusion time dependence of K* indicates there is also diffusion time dependence of β.

      The discrepancies in the fitted K* for ∆ = 19 ms and ∆ = 49 ms separately do not necessarily imply that there is a true time dependence in these parameters. Rather, this can be explained by a deficiency of data when fitting a two-dimensional surface (S is a function of q and ∆) based on data along a single curve for a fixed value of ∆.  Without properly sampling the surface across two independent coordinates, one cannot expect a fully reliable fit.  Indeed, a great advantage of our proposed method is to allow fitting data with multiple values of ∆, and thereby getting a richer data set with which to fit the full signal surface S(q, ∆).  The results for fitting ∆ = 19 ms and ∆= 49 ms data together clearly show the benefits of this approach, with superior contrast achieved.

      Furthermore, Figure 7 shows that there is a tissue specific root mean squared error in model fitting over the two diffusion times which indicates greater deviation from the model fit in white matter than grey matter.

      Although the errors are not completely tissue-independent, please note the magnitude of the RMSE is very small. The quality of the fitting in both white and grey matter is shown in sub-figures (A)-(H) for several representative voxels.

      To show that the sub-diffusion model is robust and accurate (and consequently that K* is robust and accurate) the authors would have to demonstrate that there is no diffusion time-dependence in both D_β and β in application to brain imaging data for each diffusion time separately. Simulated data should not be used to demonstrate the robustness and accuracy of the sub-diffusion model or to determine optimization of dMRI acquisition parameters without first demonstrating that D_β and β are invariant to diffusion time. This is because simulated signals calculated by using the sub-diffusion characteristic equation of dMRI signal decay will necessarily have diffusion time invariant D_β and β parameters. Without further information demonstrating diffusion time invariance of D_β, β and K* it is not possible to determine whether the authors have achieved their aims or that their results support their conclusions.

      First, as explained above, the dMRI signal S is a function of q and ∆, i.e., a two-dimensional surface S(q, ∆), and hence fitting data sampled from single diffusion time (i.e., one curve on the surface) cannot provide reliable parameters, as seen in the discrepancies in K* in Figure 6 (bottom two rows). Our proposed new sampling and fitting strategy overcomes this issue. That is, to obtain a reliable fitting, one should fit data from at least two diffusion times together (i.e., sampling data from at least two curves on the signal surface).

      Second, to demonstrate that D_β and β are time invariant, one would require data at several diffusion times with high b values. Such data cannot be easily obtained. The data used in this current study is the MGH Connectome 1.0 human brain data, which only contains two diffusion times, ∆ = 19 ms and ∆ = 49 ms.

      Hence, we conducted numerical experiments to demonstrate our idea. In Figure 3, we showed that (i) the variability of the fitted parameters is significantly reduced when moving from fitting single diffusion time data to two diffusion time data, and (ii) the difference in fitting three diffusion times compared to two is very minor, indicating convergence towards the correct time-independent parameter values. The results from fitting human brain data (Figure 6 and Tables 2-4) agree with the expectations from our numerical experiments. Hence, we believe that we have provided sufficient evidence to support our proposed sub-diffusion model and its optimal fitting strategy.

      Recommendations for the authors:

      Reviewer #1 (Recommendations For The Authors):

      It is clear that the authors preferred generating the data by using sub-diffusion model's signal expression as it has many benefits, such as allowing different diffusion times to be incorporated, and hence investigation of the effect of the number of diffusion times on the accuracy of the parameter fitting. I recommend adding another simulation study by generating the data with the DKI model expression (as the goal of the study is to provide an accurate mapping of diffusional mean kurtosis), fitting the data to the sub-diffusion model's expression in Eq. (10), and then calculating K* and D* by Eqs. (8) and (9) only for a fixed diffusion time and one b-value subset.

      We appreciate the suggestion. However, unfortunately it is not appropriate to generate data with the DKI model, as the maximum b-value is limited to 2000~3000s/mm^2 and hence the DKI model cannot represent diffusion MRI signals from a full spectrum of b-values. A key strength of our proposed model is that it removes this limitation.

      There is a typo on Page 24, Line 581; "b<=2400" should be b>=2400.

      We have fixed this typo.

      Reviewer #2 (Recommendations For The Authors):

      As the authors state the sub-diffusion model has two parameters, D_β and β that are invariant to diffusion time, and give rise to a time-varying diffusion coefficient in mm^2s^-1 and a time invariant kurtosis. However, there is a need to be clearer and more specific about the implications of the sub-diffusion model. The manuscript would be improved by the authors:

      (a) Defining the time-varying diffusion coefficient that arises from the model, its functional form and properties.

      We refer Reviewer#2 to eq.(5) and eq.(8) for the definition of time-varying diffusion coefficients D* and D_SUB and their relationship.

      (b) Clearly discuss the implications of this with respect to other time-varying diffusion coefficient methods in the current literature.

      We refer Reviewer#2 to the section “Time-dependence of diffusivity and kurtosis” under “Discussions”.

      (c) Demonstrating that D_β and β do not vary with diffusion time when estimated from dMRI acquired on human participants.

      We have addressed this comment in the public review.

      The manuscript would benefit from increases in clarity in all sections and the authors identifying typographical errors.

      We have updated the relevant text in the revised manuscript to make it clearer, including fixing typos.

      Specific improvements to clarity in the methods and results section would include:

      Line 620: Why were parameter approximations for model fitting to simulated data restricted to the ranges D_β∈[10^(-4),10^(-3) ] and β∈[0.5,1] but in fitting to brain imaging data the ranges were D_β>0 and 0<β<=1.

      The parameter ranges for model fitting to both the simulated and human data were set to the same: D_β>0 and 0<β<=1. To generate simulated data, D_β and β ranges were restricted to reflect observations in human brain data. We have updated the text to make this clearer.

      Lines 622, 628 & 629: Which goodness of fit measure was used?

      The goodness of fit measure for all simulated results is the coefficient of determination, or R^2 value, as noted in the “Goodness-of-fit and region-based statistical analysis” section under Methods. We have updated the text to make this clearer.

      Line 666: The method for computation of R^2 within the coefficient of determination should be stated as there are several ways of calculating an R^2 value.

      The formula for computing R^2 has been added to the text.

      Line 685: A t-test is mentioned but it is not clear as to the inputs to this test, or where the results of this analysis are presented.

      We have updated the text to make this clearer. The results of this analysis are presented in Table 5. The entries identified in italic under the optimal b-value heading were found to be significantly different from the benchmark mean K* reported in Table 2.

      Line 696: It is not clear how the intra-class correlation coefficient histograms are computed from six subjects. This applies to results in Figure 10 that require greater clarity in the description.

      The formula for computing the intra-class correlation coefficient has been added to the sub-section “Scan-rescan analysis using intraclass correlation coefficient (ICC)” under “Methods”.

      It would be helpful if the authors primarily report results pertaining to the model parameters D_β and β. This is because D* and K* are calculated from D_β and β. Conditions for robust and accurate estimation of D_β and β will provide robust and accurate measures for D* and K*.

      Two new tables for the model parameters D_β and β have been added. Please see Tables 3 and 4 in the revised manuscript.

      The authors state that fitted model parameters are not affected by maximum b-value (paragraph beginning line 366). This statement is based on their model simulation results. Could the authors provide data to support this based on the application of their model to the human brain imaging data?

      We would like to clarify that our statement is indeed based on human brain imaging. As stated in the paragraph beginning line 366, both results in Table 2 (using full dataset) and Table 5 (using dataset with optimal b-value sampling) are generated from the Connectome human brain data. If maximum b-value dependence is present, benchmark (Table 2) versus optimal region-specific results (Table 5, or previously Table 3) should show some systematic difference.

    1. Author response:

      The following is the authors’ response to the previous reviews.

      Public Reviews:

      Reviewer #1 (Public Review):

      The authors investigate the role of chirping in a species of weakly electric fish. They subject the fish to various scenarios and correlate the production of chirps with many different factors. They find major correlations between the background beat signals (continuously present during any social interactions) or some aspects of social and environmental conditions with the propensity to produce different types of chirps. By analyzing more specifically different aspects of these correlations they conclude that chirping patterns are related to navigation purposes and the need to localize the source of the beat signal (i.e. the location of the conspecific).

      The study provides a wealth of interesting observations of behavior and much of this data constitutes a useful dataset to document the patterns of social interactions in these fish. Some data, in particular the high propensity to chirp in cluttered environments, raises interesting questions. Their main hypothesis is a useful addition to the debate on the function of these chirps and is worth considering and exploring further.

      After the initial reviewers' comments, the authors performed a welcome revision of the way the results are presented. Overall the study has been improved by the revision. However, one piece of new data is perplexing to me. The new Figure 7 presents the results of a model analysis of the strength of the EI caused by a second fish to localize when the focal fish is chirping. From my understanding of this type of model, EOD frequency is not a parameter in the model since it evaluates the strength of the field at a given point in time. Therefore the only thing that matters is the phase relationship and strength of the EOD. Assuming that the second fish's EOD is kept constant and the phases relationship is also the same, the only difference during a chirp that could affect the result of the calculation is the potential decrease in EOD amplitude during the chirp. It is indeed logical that if the focal fish decreased its EOD amplitude the target fish's EOD becomes relatively stronger. Where things are harder to understand is why the different types of chirps (e.g. type 1 vs type 2) lead to the same increase in signal even though they are typically associated with different levels of amplitude modulations. Also, it is hard to imagine that a type 2 chirps that is barely associated with any decrease in EOD amplitude (0-10% maybe), would cause doubling of the EI strength. There might be something I don't understand but the authors should provide a lot more details on how this result is obtained and convince us that it makes sense.

      We thank the author for the comments and we agree that the approach could have been better detailed. As anticipated by the Reviewer, the Boundary Element Method (BEM) model can be used simply to calculate the electric field and electric image at a specific point in time (instantaneously), regardless of EOD frequency. However, our model allows for the concatenation of consecutive instants and thus is able to render an entire sequence of electric fields - and resulting electric images - incorporating realistic EOD characteristics such as shape, duration, and frequencies (see Pedraja et al., 2014).

      Chirp-triggered EIs were modeled using real chirps produced by interacting fish. Each chirp was thus associated to its duration and peak parameters, as well as the fish positional information (distance and angle). 

      However, since we did not know the beat phase at which chirps were produced, we computed electric images for each fish position and chirp scenario by simulating various phases (here referred to the initial offset of the two EODs, set at 4 phases, equally spaced). These are intended as phases of the sender EOD and simply refer to the initial OFFSET between the two interacting EODs. However, since our simulations were run over a time window of 500 msec, all phases are likely to be covered, with a different temporal order relative to the chirp (always centered within the 500 msec).

      The simulation was run maintaining consistent timing for both chirp and non-chirp conditions, across approximately 800 body nodes. At each node, the current flow was calculated from the peak-to-peak of the EOD sum (i.e. the point-to-point of the difference between the beat positive and negative envelopes). Analyzing the EIs over this fixed time window enables us to assess the unitary changes of current flow induced by chirps over units of time (ΔI/Δt). From this, we can calculate a cumulative sum of current flow changes - expressed as delta(EI) and use it to show the effect of the chirps on the spatiotemporal EI (Figure 7C).

      One can express this cumulative change mapped onto the fish body (keeping the 800 points separated, as in Figure 7C) or further sum the current changes to obtain a single total (as shown in Figure 7D).

      One can check this by considering that a sum for example of a set of 500/800 points - judging from the size of the blue areas in C not all 800 points have a detectable change - each valued 0.1-to-0.3 mA/s, one could get circa 100 mA/s, which is what is shown in D. (is this what is happening ?)

      We do not know why chirps of different types triggered similar effects. It is possible that, since EI measurements are pooled over several chirps produced at different angles and distances, in case of a lower amount of chirps considered for a given type (as in the case of rises, very low) these measurements may not highlight more marked differences among types. In a publication we are currently working on, we are considering a larger dataset to better assess these results.

      The methods section has been edited to clarify the approach (not yet).

      Reviewer #2 (Public Review):

      Studying Apteronotus leptorhynchus (the weakly electric brown ghost knifefish), the authors provide evidence that 'chirps' (brief modulations in the frequency and amplitude of the ongoing electric signal) function in active sensing (specifically homeoactive sensing) rather than communication. Chirping is a behavior that has been well studied, including numerous studies on the sensory coding of chirps and the neural mechanisms for chirp generation.

      Chirps are largely thought to function in communication behavior, so this alternative function is a very exciting possibility that could have a great impact on the field.

      We thank the Reviewer for the extensive and constructive comments. We would like to add that, while it is true that many detailed studies have been published on the anatomy and physiology of the circuits implicated in the production and modulation of “electric chirps”, most of this  research assumed, and focused exclusively on, their possible role in communication.  In addition, most behavioral studies did the same and a meta-analysis of the existing literature on chirping allows to trace back the communication idea mainly to two studies: Hagedorn and Heiligenberg, 1985 (“Court and spark: electric signals in the courtship and mating of gymnotoid fish”) and Hopkins, 1974 (“Electric Communication: Functions in the Social Behavior of Eigenmannia Virescens”), among the main sources. Importantly, in these studies only contextual observations have been made (no playback experiment or other attempts to analyze more quantitatively the correlation of chirping with other behaviors).

      The authors do provide convincing evidence that chirps may function in homeoactive sensing. However, their evidence arguing against a role for chirps in communication is not as strong, and fails to sufficiently consider the evidence from a large body of existing research. Ultimately, the manuscript presents very interesting data that is sure to stimulate discussion and follow-up studies, but it suffers from dismissing evidence in support of, or consistent with, a communicative function for chirps.

      Although the tone of some statements present in our earlier draft may suggest otherwise, through our revisions, we have made an effort to clarify that we do not intend to dismiss a function of chirps in communication, we only intend to debate and discuss valid alternative hypothesis, advanced from reasonable considerations.

      Before writing this manuscript, we have attempted to survey  literally all the existing literature on chirps (including studies focused on behavior, peripheral sensory physiology as well as brain physiology). Although it is not unlikely that some studies have eluded our attention, an effort for a comprehensive review was made. Based on this survey we realized that none of the studies provided a clear  and  unambiguous piece of evidence to support the communication hypothesis (we refer here to the weak points highlighted in the discussion and mentioned in the previous comment). Which in fact does not come without its weak points and contradictions (see later comments).

      It follows a summary of the mentions made to the communication theory in the different section of the manuscript including several edits we have applied in response to the Reviewer’s concern:

      In the abstract we clearly state that we are considering an alternative that is only hypothetically complementary, not for sure.  Nonetheless, we have identified a couple of instances that could sound dismissive of the “communication hypothesis” in the following section.

      In the introduction we write in fact about the possibility of interference between communication signals and conspecific electrolocation cues, as they are both detected as beat perturbations. We did not mean to use “Interference” here as “reciprocal canceling”, rather we intended it as “partial or more or less conspicuous overlap” in the responses triggered in electroreceptors.

      Hoping to convey a clearer message, we have edited the related statement and changed it to “both types of information are likely to overlap and interact in highly variable ways”.

      We have also removed the statement: “According to this idea, beats and chirps are not only detected through the same input channel, but also used for the same purpose.” as at this point in the manuscript it may be too strong.

      In the results section we do not include statements that might be seen as dismissive of the communication hypothesis but only statements in support of the “probing with chirps” idea (which is the central hypothesis of the study).

      In the discussion paragraphs we elaborate on why the current functional view is either flawed or incomplete (first paragraph “existing functional hypotheses''). Namely: 1)  multiple triggering factors implied in chirp responses covary and need to be disentangled (example DF/ sex), 2) findings on brown ghosts and a few other gymnotiforms have been used to advance the hypothesis of “communication through chirps'' in all weakly electric fish (including pulse species). 3) social encounters - in which chirps are recorded - imply also other behaviors (such as probing) which have not been considered so far. This point is related to the first one on covariates. 4) most studies referring to big chirps as courtship chirps were not done in reproductive animals (added now)  and 5) no causal evidence has been provided so far to justify a role of chirps in social communication.

      We are discussing these points as challenges to the communication hypothesis, not to dismiss the hypothesis, but rather to motivate future studies addressing these challenges.

      We do not want to appear dismissive of the communication hypothesis and had therefore previously edited the manuscript to avoid the impression of exclusivity of the probing hypothesis. We have now gone over the manuscript once more and edited several sentences. Nevertheless, we want to point out again that - despite the large consensus - the communication hypothesis has, until now, never been investigated with the kind of rigor applied here.

      The authors do acknowledge that chirps could function as both a communication and homeactive sensing signal, but it seems clear they wish to argue against the former and for the latter, and the evidence is not yet there to support this.

      In both rounds of revision we have made an effort to convey a more inclusive interpretation of our findings. We tried our best to express our ideas as hypothetical, not as proof that communication through chirps does not exist. The aim of this study is to propose an alternative view, and this cannot be done without underlining the weak points of an existing hypothesis while providing and supporting reasonable arguments in favor of the alternative we advance. The actual evidence for a role of chirping in communication is much less strong than appears from the pure number of articles that have discussed chirps in this context.

      Regarding the weak evidence against communication, here we can list a few additional important points related to the proposed interpretations of chirp function (more specific than those made earlier):

      (1) A formally sound assessment of signal value/meaning - as typically done in animal communication studies should involve: 

      a) the isolation of a naturally occurring signal and determination of the context in which it is produced 

      b) the artificial replication of the signal

      c) the observation that such mimic is capable of triggering reliable and stereotyped responses in a group of individuals (identified by sex and/or species) under the same conditions (conditioned, unconditioned, state-dependent, etc.). As discussed for instance in Bradbury and Vehrencamp, 2011; Laidre and Johnstone, 2013; Wyatt, 2015; Rutz et al., 2023.

      This approach has so far not been applied to weakly electric fish. The initial purpose of the present study was in fact to conduct this type of validation.

      (2) The hypothesis of chirps used for DF-sign discrimination - for “social purposes” - although plausible in the face of theoretical considerations,  does not seem to be reasonable in practice, when one considers emission rates of 150 chirps per minute. We do find a strong correlation of chirp type with DF, which is often very abrupt and sudden (as if the fish were tracking beat frequency to guess its value) but the consideration made above on chirp rates seems to discourage this interpretation.

      (3) The hypothesis of chirp-patterning (i.e. chirping may have meaning based on the sequence of chirps of different types, a bit like syllables in birdsongs) - assessed by only one study conducted in our group - has not been enough substantiated by replication. We have surveyed all possible combinations of chirps produced by interacting pairs in different behavioral conditions using different value for chirp sequence size: 2, 3,... ,8 chirps (both considering the sender alone as well as sender+receiver together). In all cases we found no evidence for  a context dependent “modulation” of chirp types (i.e. no specific chirp type sequence in specific contexts).

      (4) The hypothesized role of “large chirps” as courtship signals could be easily criticized by noting the symmetrical distribution of these events around  a DF of 0 Hz . Although one could argue about a failure to discriminate DF-sign, to explain this well known pattern. However, we know from Walter Heiligenberg’s work and physiological considerations that such task can be solved easily through t-units and … in principle even just by motion (which would change the EOD phase in frequency dependent ways, thus potentially revealing the DF sign).

      Overall, these considerations made us think that certainly chirping occurs in a social context, but it is the meaning of this behavior that remains elusive.  We noticed that environmental factors are also strongly implied … we then formulate an alternative hypothesis to explain chirping but we do so  without dismissing the communication idea.

      All this seems to us just a careful way to critically discuss our results and those of other studies, without considering the issue resolved.

      In the introduction, the authors state, "Since both chirps and positional parameters (such as size, orientation or motion) can only be detected as perturbations of the beat, and via the same electroreceptors, the inputs relaying both types of information are inevitably interfering." I disagree with this statement, which seems to be a key assumption. Both of these features certainly modulate the activity of electroreceptors, but that does not mean those modulations are ambiguous as to their source. You do not know whether the two types of modulations can be unambiguously decoded from electroreceptor afferent population activity.

      We thank the Reviewer for noting this imprecision. We have addressed the Reviewer’s concern in another reply (see above).

      My biggest issue with this manuscript is that it is much too strong in dismissing evidence that chirping correlates with context. In your behavioral observations, you found sex differences in chirping as well as differences between freely interacting and physically separated fish. Chirps tended to occur in close proximity to another fish. Your model of chirp variability found that environmental experience, social experience, and beat frequency (DF) are the most important factors explaining chirp variability. Are these not all considered behavioral or social context? Beat frequency (DF) in particular is heavily downplayed as being a part of "context" but it is a crucial part of the context, as it provides information about the identity of the fish you're interacting with. The authors show quite convincingly that the types of chirps produced do not vary with these contexts, but chirp rates do.

      We believe the “perceived claim” may be an issue of unclear writing. We have now tried to better clarify that “context” affects chirp rates, but it does not affect chirp types as much (except when beat frequency is high).  

      We have edited two statements possibly susceptible to misinterpretation: 

      (1) In the results: “It also indicates that chirp parameters such as duration and FM do not seem to be associated with any particular context in a meaningful way, other than being affected by beat frequency.”

      (2) In the discussion: the statement

      “Recordings from interacting fish pairs confirmed the absence of any significant correlation between chirp type choice and behavioral context (Figure S2) although the variance of chirp parameters appears to be significantly affected by this factor (Figure 2). This may suggest that the effect of behavioral context is mainly detectable in the number of chirps produced (Figure S1), rather than the type (Figure S2).”

      has been changed to:

      “Recordings from interacting fish pairs confirmed the absence of any significant correlation between chirp type choice and behavioral context, except for those cases characterized by higher beat frequencies  (Figure S2). This suggests that the effect of behavioral context highlighted in our factor analysis (Figure 2) is mainly due to the number of chirps produced (Figure S1), rather than their type (Figure S2).”

      Eventually, in the results we emphasize the relatively higher impact of previously unexplored factors on chirp variance: “The plot of individual chirps (Figure 2C) shows the presence of clustering around different categorical variables and it reveals that experience levels or swimming conditions are important factors affecting chirp distribution (note for instance the large central “breeding” cluster in which fish are divided and the smaller ones in which fish are free). Sender or receiver identity does not individuate any clear clustering relative to either sex (see the overlap of male_s/male_r and female_s/female_r) or social status (dominant/subordinate). Chirps labeled based on tank experience (i.e. resident vs intruder) are instead clearly separated.”.

      Further, in your playback experiments, fish responded differently to small vs. large DFs, males chirped more than females, type 2 chirps became more frequent throughout a playback, and rises tended to occur at the end of a playback. These are all examples of context-dependent behavior.

      We do note that male brown ghosts chirp more than females. But we do also say - and show in figure 8 - that males move more in proximity to and around conspecifics. We do acknowledge that chirp time-course may be different during playbacks in a type-dependent manner. But how this can support the communication hypothesis - or other alternatives - is unclear. This result could equally imply the use of different chirp types for different probing needs. Since we cannot be sure about either, we do not want to put too much emphasis to it. Eventually, the fact that “context” (here meant broadly to define different experimental situations in which social but also physical and environmental parameters are altered) affects chirping is undeniable: cluttered and non-cluttered environments do represent different contexts which differently affect chirping in conspicuous ways.

      In the results, the authors state, "Overall, the majority of chirps were produced by male subjects, in comparable amounts regardless of environmental experience (resident, intruder or equal; Figure S1A,C), social status (dominant or subordinate; Figure S1B) or social experience (novel or experienced; Figure S1D)." This is not what is shown in Figure S1. S1A shows clear differences between resident vs. intruder males, S1B shows clear differences between dominant vs. subordinate males, and S1D shows clear differences between naïve and experienced males. The analysis shown in Figure 2 would seem to support this. Indeed, the authors state, "Overall, this analysis indicated that environmental and social experience, together with beat frequency (DF) are the most important factors explaining chirp variability."

      The Reviewer is right in pointing at this imprecise reference and we are grateful for spotting this incongruence. The writing refers probably to an earlier version of the figure in which data were grouped and analyzed differently. We now edited the text and changed it to: “Overall, the majority of chirps were produced by male subjects, at rates that seemed  affected by environmental experience (resident, intruder or equal; Figure S1A,C), social status (dominant or subordinate; Figure S1B) and social experience (novel or experienced; Figure S1D).”

      The choice of chirp type varied widely between individuals but was relatively consistent within individuals across trials of the same experiment. The authors interpret this to mean that chirping does not vary with internal state, but is it not likely that the internal states of individuals are stable under stable conditions, and that individuals may differ in these internal states across the same conditions? Stable differences in communication signals between individuals are frequently interpreted as reflecting differences between those individuals in certain characteristics, which are being communicated by these signals.

      It seems here we have been unclear in the writing: while it is true that behavioral states are stable and can imply stable chirp patterning (if the two are related), since chirp types vary abruptly and in a reliable DF-dependent manner, different types of chirps are unlikely to be matched to different internal states following the same temporal order in such a reliable way (similarly repeated through consecutive trials).

      This would imply the occurrence of different internal states in rapid sequence, reliably triggered by repeated EOD ramps, regardless of whether the playback is 20 sec long or 180 sec long.

      We have edited this paragraph to better explain this: “The reliability by which the chirping response adapts to both the rate and direction of beat frequency is variable across individuals but rather stable across trials (relative to a given subject), further suggesting that chirp type variations may not reflect changes in internal states or in the animal motivation to specific behavioral displays (which are presumably subject to less abrupt variations and stereotypical patterning based on DF).”

      I am not convinced of the conclusion drawn by the analysis of chirp transitions. The transition matrices show plenty of 1-2 and 2-1 transitions occurring.

      The only groups in which 1-2 and 2-1 transitions are as frequent as 1-1 and 2-2 (being 1 and 2 the numerical IDs of the two interacting fish) are F-F pairs. This is a result of the fact that in females chirp rates are so low that within-fish-correlations end up being as low as between-fish-correlations. We believe the impression of the Reviewer could be due to the fact that these are normalized maps (see legend of Figure 5A-B).

      Further, the cross-correlation analysis only shows that chirp timing between individuals is not phase-locked at these small timescales. It is entirely possible that chirp rates are correlated between interacting individuals, even if their precise timing is not.

      We agree with the Reviewer, this is a possibility. To address this point, we did edit the results section to acknowledge that what we see may be related to the time window chosen (i.e. 4 sec):

      “More importantly, they show that - at least in the social conditions analyzed here and within small-sized time windows - chirp time series produced by different fish during paired interactions are consistently independent of each other.”

      Further, it is not clear to me how "transitions" were defined. The methods do not make this clear, and it is not clear to me how you can have zero chirp transitions between two individuals when those two individuals are both generating chirps throughout an interaction.

      We thank the Reviewer for bringing up this unclear point. We have now clarified how transitions were calculated in the method section: “The number of chirp transitions present in each recording (dataset used for Figures 1, 2, 5) was measured by searching in a string array containing the 4 chirp types per fish pair, all their possible pairwise permutations (i.e. all possible permutations of 4+4=8 elements are: 1-1, 1-2, 1-3 … 7-6, 7-7, 7-8; considering the following legend 1 = fish1 type 1, 2 = fish 1 type 2, 3 = fish1 type 3 … 6 = fish2 type 2, 7 = fish2 type 3 and 8 = fish2 rise).”.

      Zero transitions are possible if two fish (or groups of fish) do not produce chirps of all types. Only transitions of produced types can be counted.

      In the results, "Although all chirp types were used during aggressive interactions, these seemed to be rather less frequent in the immediate surround of the chirps (Figure 6A)." A lack of precise temporal correlation on short timescales does not mean there is no association between the two behaviors. An increased rate of chirping during aggression is still a correlation between the two behaviors, even if chirps and specific aggressive behaviors are not tightly time-locked.

      The Reviewer is right in pointing out the limited temporal scaling of our observations/analysis. We have now edited the last paragraph of the results related to figure 6 to include the possibility mentioned by the Reviewer: “The significantly higher extent of chirping during swimming and locomotion, consistently confirmed by 4 different approaches (PSTH, TM, CN, MDS), suggests that - although chirp-behavior correlations may exist at time-scales larger than those here considered - chirping may be linked more strongly with scanning and environmental exploration than with a particular motivational state, thus confirming findings from our playback experiments.”

      The Reviewer here remarks an important point, yet, due to space limitations, we have considered only a sub-second scale. Most playback experiments in weakly electric fish implied the use of EOD mimics for a few tens of seconds - to avoid habituation in the fish behavioral responses -  while inter-chirp intervals usually range between a few hundreds of milliseconds to seconds (depending on how often a fish would chirp). This suggested to us that a 4 second time window may not be a bad choice to start with.

      In summary, it is simply too strong to say that chirping does not correlate with context, or to claim that there is convincing evidence arguing against a communication function of chirps. Importantly, however, this does not detract from your exciting and well-supported hypothesis that chirping functions in homeoactive sensing. A given EOD behavior could serve both communication and homeoactive sensing. I actually suspect this is quite common in electric fish (both gymnotiforms and mormyrids), and perhaps in other actively sensing species such as echolocating animals. The two are not mutually exclusive.

      We agree with the Reviewer that context - broadly speaking - does affect chirping (as we mentioned above). We hope we have improved the writing and clarified that we do not dismiss communication functions of chirping, but we do lean towards electrolocation based on the considerations above made and our results.

      We do conclude the manuscript remarking that communication and electrolocation are not mutually exclusive: ”probing cues could function simultaneously as proximity signals to signal presence, deter approaches, or coordinate behaviors like spawning, if properly timed (Henninger et al., 2018).” (see the conclusion paragraph of the discussion) .

      Therein, we further add “These findings aim to stir the pot and initiate a discussion on possible alternative functions of chirps beyond their presumed communication role.”.

      With this, we hope we’ve made it clear how we intend our manuscript to be read.

      Reviewer #3 (Public Review):

      Summary:

      This important paper provides the best-to-date characterization of chirping in weakly electric fish using a large number of variables. These include environment (free vs divided fish, with or without clutter), breeding state, gender, intruder vs resident, social status, locomotion state and social and environmental experience, without and with playback experiments. It applies state-of-the-art methods for reducing the dimensionality of the data and finding patterns of correlation between different kinds of variables (factor analysis, K-means). The strength of the evidence, collated from a large number of trials with many controls, leads to the conclusion that the traditionally assumed communication function of chirps may be secondary to its role in environmental assessment and exploration that takes social context into account. Based on their extensive analyses, the authors suggest that chirps are mainly used as probes that help detect beats caused by other fish and as well as objects.

      Strengths:

      The work is based on completely novel recordings using interaction chambers. The amount of new data and associated analyses is simply staggering, and yet, well organized in presentation. The study further evaluates the electric field strength around a fish (via modelling with the boundary element method) and how its decay parallels the chirp rate, thereby relating the above variables to electric field geometry.

      The main conclusions are that the lack of any significant behavioural correlates for chirping, and the lack of temporal patterning in chirp time series, cast doubt on a primary communication goal for most chirps. Rather, the key determinants of chirping are the difference frequency between two interacting conspecifics as well as individual subjects' environmental and social experience. The paper concludes that there is a lack of evidence for stereotyped temporal patterning of chirp time series, as well as of sender-receiver chirp transitions beyond the known increase in chirp frequency during an interaction.

      These conclusions by themselves will be very useful to the field. They will also allow scientists working on other "communication" systems to perhaps reconsider and expand the goals of the probes used in those senses. A lot of data are summarized in this paper, with thorough referencing to past work.

      The alternative hypotheses that arise from the work are that chirps are mainly used as environmental probes for better beat detection and processing and object localization, and in this sense are self-directed signals. This led to their prediction that environmental complexity ("clutter") should increase chirp rate, which is fact was revealed by their new experiments. The authors also argue that waveform EODs have less power across high spatial frequencies compared to pulse-type fish, with a resulting relatively impoverished power of resolution. Chirping in wave-type fish could temporarily compensate for the lower frequency resolution while still being able to resolve EOD perturbations with a good temporal definition (which pulse-type fish lack due to low pulse rates).

      The authors also advance the interesting idea that the sinusoidal frequency modulations caused by chirps are the electric fish's solution to the minute (and undetectable by neural wetware) echo-delays available to it, due to the propagation of electric fields at the speed of light in water. The paper provides a number of experimental avenues to pursue in order to validate the non-communication role of chirps.

      We thank the reviewer for the kind assessment.

      Weaknesses:

      My main criticism is that the alternative putative role for chirps as probe signals that optimize beat detection could be better developed. The paper could be clearer as to what that means precisely, especially since beating - and therefore detection of some aspects of beating due to the proximity of a conspecific - most often precedes chirping. One meaning the authors suggest, tentatively, is that the chirps could enhance electrosensory responses to the beat, for example by causing beat phase shifts that remediate blind spots in the electric field of view.

      We agree with the Reviewer that a better and more detailed explanation of how beat processing for conspecific electrolocation may be positively affected by chirps would be important to provide. We are currently working on a follow-up manuscript in which we intend to include these aspects. For space limitations and readability we had to discard from the current manuscript a lot of results that could further clarify these issues.

      A second criticism is that the study links the beat detection to underwater object localization. The paper does not significantly develop that line of thought given their data - the authors tread carefully here given the speculative aspect of this link. It is certainly possible that the image on the fish's body of an object in the environment will be slightly modified by introducing a chirp on the waveform, as this may enhance certain heterogeneities of the object in relation to its environment. The thrust of this argument derives mainly from the notion of Fourier analysis with pulse type fish EOD waveforms (see above, and radar theory more generally), where higher temporal frequencies in the beat waveform induced by the chirp will enable a better spatial resolution of objects. It remains to be seen whether experiments can show this to be significant.

      Perhaps the Reviewer refers to the last discussion paragraph before the conclusions in which we mention the performance of pulse or wave-type EODs in electrolocation (referring here to ideas illustrated in a recent review by Crampton, 2019). We added to this paragraph a statement which could better clarify that we do not propose that chirping could enhance object electrolocation. What we mean is that, in a context in which object electrolocation occurs through wave-type EODs - given the generally lower performance of such narrow-band signals in resolving the spatial features of any object, even a 3D electric field  - chirping could improve beat detection during social encounters by increasing the amount of information obtained by the fish.

      The edited paragraph now reads: “While broadband pulse signals may be useful to capture highly complex environments rich in foliage, roots and other structures common in vegetation featuring the more superficial habitats in which pulse-type fish live, wave-type EODs may be a better choice in the relatively simpler river-bed environments in which many wave-type fish live (e.g., the benthic zone of deep river channels; Crampton, 2019). In this case, achieving a good spatial resolution is critical during social encounters, especially considering the limited utility of visual cues in these low-light conditions. In such habitats, social encounters may “electrically” be less “abrupt”, but spatially less “conspicuous” or blurred (as a 3D electric field may be). In such a scenario, chirps could serve as a means to supplement the spatial information acquired via the beat, accentuating these cues during periods of reduced resolution.”

      Recommendations for the authors:

      Reviewer #3 (Recommendations For The Authors):

      None, my points in the original review have been properly addressed in this resubmission.

    1. Author response:

      The following is the authors’ response to the original reviews.

      Public Reviews: 

      Reviewer #1 (Public Review): 

      Summary: 

      This manuscript presented a useful toolkit designed for CyTOF data analysis, which integrates 5 key steps as an analytical framework. A semi-supervised clustering tool was developed, and its performance was tested in multiple independent datasets. The tool was compared to human experts as well as supervised and unsupervised methods. 

      Strengths: 

      The study employed multiple independent datasets to test the pipeline. A new semi-supervised clustering method was developed. 

      Weaknesses: 

      The examination of the whole pipeline is incomplete. Lack of descriptions or justifications for some analyses. 

      We thank the reviewer’s overall summary and comments of this manuscript. In the last part of the results, we showcased the functionalities of ImmCellTyper in covid dataset, including quality check, BinaryClust clustering, cell abundance quantification, state marker expression comparison within each identified cell types, cell population extraction, subpopulation discovery using unsupervised methods, and data visualization etc. We added more descriptions in the text based on the reviewer’s suggestions. 

      Reviewer #2 (Public Review): 

      Summary: 

      The authors have developed marker selection and k-means (k=2) based binary clustering algorithm for the first-level supervised clustering of the CyTOF dataset. They built a seamless pipeline that offers the multiple functionalities required for CyTOF data analysis. 

      Strengths: 

      The strength of the study is the potential use of the pipeline for the CyTOF community as a wrapper for multiple functions required for the analysis. The concept of the first line of binary clustering with known markers can be practically powerful. 

      Weaknesses: 

      The weakness of the study is that there's little conceptual novelty in the algorithms suggested from the study and the benchmarking is done in limited conditions. 

      We thank the reviewer’s overall summary and comments of this manuscript. While the concept of binary clustering by k-means is not novel, BinaryClust only uses it for individual markers to identify positive and negative cells, then combine it with the pre-defined matrix for cell type identification. This has not been introduced elsewhere. Furthermore, ImmCellTyper streamlines the entire analysis process and enhances data exploration on multiple levels. For instance, users can evaluate functional marker expression level/cellular abundance across both main cell types and subpopulations; Also, this computational framework leverages the advantages of both semi-supervised and unsupervised clustering methods to facilitate subpopulation discovery. We believe these contributions warrant consideration as advancements in the field.  

      As for the benchmarking, we limited the depth only to main cell types rather than subpopulations. The reason is because we only apply BinaryClust to identify main cell types; For the cell subsets discovery, unsupervised methods integrated in this pipeline has already been published and widely used by the research community. Therefore, it does not seem to be necessary for additional benchmarking.

      Reviewer #3 (Public Review): 

      Summary: 

      ImmCellTyper is a new toolkit for Cytometry by time-of-flight data analysis. It includes BinaryClust, a semi-supervised clustering tool (which takes into account prior biological knowledge), designed for automated classification and annotation of specific cell types and subpopulations. ImmCellTyper also integrates a variety of tools to perform data quality analysis, batch effect correction, dimension reduction, unsupervised clustering, and differential analysis. 

      Strengths: 

      The proposed algorithm takes into account the prior knowledge. 

      The results on different benchmarks indicate competitive or better performance (in terms of accuracy and speed) depending on the method. 

      Weaknesses: 

      The proposed algorithm considers only CyTOF markers with binary distribution. 

      We thank the reviewer’s overall summary and comments of this manuscript. Binary classification can be considered as an imitation of human gating strategy, as it is applied to each marker. For example, when characterizing the CD8 T cells, we aim for CD19-CD14-CD3+CD4- population, which is binary in nature (either positive and negative) and follows the same logic as the method (BinaryClust) we developed. Results indicated that it works very well for well-defined main cell lineages, particularly when the expression of the defining marker is not continuous. However, the limitation is for subpopulation identification, because a handful makers behave in a continuum manner, so we suggest unsupervised method after BinaryClust, which also brings another advantage of identifying unknown subsets beyond our current knowledge, and none of the semi-supervised tools can achieve that. To address the reviewer’s concern, we considered the limitation of binary distribution, but it does not profoundly affect the application of the pipeline.

      Recommendations for the authors:

      Reviewer #1 (Recommendations For The Authors): 

      Many thanks for the reviewers’ comments and suggestions, please see below the point-to-point response:

      (1) The style of in-text reference citation is not consistent. Many do not have published years.

      The style of the reference citation has been revised and improved.  

      (2) The font size in the table of Figure 1 is too small, so is Figure 2. 

      The font size has been increased.

      (3) Is flowSOM used as part of BinaryClust? How should the variable running speed of BinaryClust be interpreted, given that it is occasionally slower and sometimes faster than flowSOM in the datasets?

      To answer reviewer’s question, flowSOM is not a part of BinaryClust. They are separate clustering methods that have been incorporated into the ImmCellTyper pipeline. As described in Figure 1, BinaryClust, a semi-supervised method, is used to classify the main cell lineages; while flowSOM, an unsupervised method, is recommended here for further subpopulation discovery. So, they operate independently of each other. To avoid confusions, we slightly modified Figure 1 for clarification.

      Regarding the variability in running speed in Figure 4. The performance of algorithms can indeed be influenced by the characteristics of the datasets, such as size and complexity. The differences observed between the covid dataset and the MPN dataset, such as marker panel, experimental protocol, and data acquisition process etc., could account for this variation. Our explanation is that flowSOM suits better the data structure of covid dataset, which might be the reason why it is slightly faster to analyse compared to the MPN dataset. Moreover, for the covid dataset, the runtime for both BinaryClust and flowSOM is less than 100s, and the difference is not notable. 

      (4) In the Method section ImmCellTyper workflow overview, it is difficult to link the description of the pipeline to Figure 8. There are two sub-pipelines in the text and seven steps in the figure. What are their relations? Some steps are not introduced in the text, such as Data transformation and SCE object construction. What is co-factor 5?

      Figure 8 provides an overview of the entire workflow for CyTOF data analysis, starting from the raw fcs file data and proceeding until downstream analysis (seven steps). But the actual implementation of the pipeline was divided into two separate sections, as outlined in the vignettes of the ImmCellTyper GitHub page (https://github.com/JingAnyaSun/ImmCellTyper/tree/main/vignettes).

      Users will initially run ‘Intro_to_batch_exam_correct’ to perform data quality check and identify potential batch effects, followed by ‘Intro_to_data_analysis’ for data exploration. We agree with the reviewer that the method for this section is a bit confusing, so we’ve added more description for clarification.

      In processing mass cytometry data, arcsine transformation is commonly applied to handle zero values, skewed distributions, and to improve visualization as well as clustering performance. The co-factor here is used as a parameter to scale down the data to control the width of the linear region before arcsine transformation. We usually get the best results by using co-factor 5 for CyTOF data.   

      (5) For differential analysis, could the pipeline analyze paired/repeated samples?

      For the statistical step, ImmCellTyper supports both two-study group comparison using Mann-Whitney Wilcoxon test, and multiple study group comparison (n>2) using Kruskal Wallis test followed by post hoc analysis (pairwise Wilcoxon test or Dunn’s test) with multiple testing correction using Benjamini-Hochberg Procedure.

      Certainly, this pipeline allows flexibilities, users can also extract the raw data of cell frequencies and apply suitable statistical methods for testing.

      (6) In Figure 2A, the range of the two axes is different for Dendritic cells, which could be misleading. Why the agreement is bad for dendritic cells?

      The range for the axes is automatically adapted to the data structure, which explains why they may not necessarily be equal. The co-efficient factor for the correlation of DCs is 0.958, compared to other cell types (> 0.99), it is relatively worse but does not indicate poor agreement.

      Moreover, the abundance of DCs is much less than other cell types, comprising approximately 2-5% of whole cells. As a result, even small differences in abundance may appear to as significant variations. For example, a difference of 1% in DC abundance represents a 2-fold change, which can be perceived as substantial.

      Overall, while the agreement for DCs may appear comparatively lower, it is not necessarily indicative of poor performance, considering both the coefficient factor and the relative abundance of DCs compared to other cell types.

      (7) In the Results section BinaryClust achieves high accuracy, what method was used to get the p-value, such as lines 212, 213, etc.?

      The accuracy of BinaryClust was tested using F-measure and ARI against ground truth (manual gating), the detailed description/calculation can be found in methods. For line 212 and 213, the p-value was calculated using ANOVA for the interaction plot shown in Figure 3. We’ve now added the statistical information into the figure legend.   

      (8) The performance comparison between BinaryClust and LDA is close. The current comparison design looks unfair. Given LDA only trained using half data, LDA may outperform BinaryClust.

      It is true that LDA was trained using half data, which is because this method requires manual gating results as training dataset to build a model, then apply the model to the rest of the files to label cell types. Here we used 50% of the whole dataset as training set. We are of course very happy to implement any additional suggestions for a better partition ratio.

      (9) There are 5 key steps in the proposed workflow. However, not every step was presented in the Results.

      Thanks for the comments. The results primarily focused on demonstrating the precision and performance of BinaryClust in comparison with ground truth and existing tools. Additionally, a case study showcasing the application/functions of the entire pipeline in a dataset was also presented. Due to limitation in space, the implementation details of the pipeline were described in the method section and github documentations, which users/readers can easily access.

      Reviewer #2 (Recommendations For The Authors): 

      The tools suggested by the authors could be potentially useful to the community. However, it's difficult to understand the conceptual novelty of the algorithms suggested here. The concept of binary clustering has been described before (https://doi.org/10.1186/s12859-022-05085-zhttps://doi.org/10.1152/ajplung.00104.2022), and it mainly utilizes k-means clustering set to generate binary clusters based on selected markers. Other algorithms associated with the package are taken from other studies. 

      We acknowledge the reviewer’s comment regarding the novelty of our method. While the concept of binary clustering by k-means has been previously described to transcriptome data, our approach applies it to CyTOF data analysis, which has not been introduced elsewhere. Furthermore, ImmCellTyper streamlines the entire analysis process and enhances data exploration on multiple levels. For instance, users can evaluate functional marker expression level/cellular abundance across both main cell types and subpopulations; Also, as stated in the manuscript, this computational framework leverages the advantages of both semi-supervised and unsupervised clustering methods to facilitate subpopulation discovery. We believe these contributions warrant consideration as advancements in the field.  

      In addition, the benchmarking of clustering performance, especially to reproduce manual gating and comparison to tools such as flowSOM is not comprehensive enough. The result for the benchmarking test could significantly vary depending on how the authors set the ground truth (resolution of cell type annotations). The authors should compare the tool's performance by changing the depth of cell type annotations. Especially, the low abundance cell types such as gdT cells or DCs were not effectively captured by the suggested methods. 

      Thanks for the comment. We appreciate the reviewer’s concern. However, as illustrated in figure 1, our approach uses BinaryClust, a semi-supervised method, to identify main cell types rather than directly targeting subpopulations. The reason is because semi-supervised method relies on users’ prior definition thus is limited to discover novel subsets. In the ImmCellTyper framework, unsupervised method was subsequently applied for subset exploration following the BinaryClust step.

      Regarding benchmarking, we focused on testing the precision of BinaryClust for main cell type characterization, because it is what the method is used for in the pipeline, and we believe this is sufficient. As for the cell subsets discovery, the unsupervised methods we integrated has already been published and widely used by the research community. Therefore, it does not seem to be necessary for additional benchmarking.

      Moreover, as shown in Figure 3 and Table 1, our results indicated that the F-measure for DCs and gdT cells in BinaryClust is 0.80 and 0.92 respectively, which were very close to ground truth and outperformed flowSOM, demonstrating its effectiveness. 

      We hope these clarifications address the reviewer’s concern.

      Minor comments: 

      (1) In Figure 4, it's perplexing to note that BinaryClust shows the slowest runtime for the COVID dataset, compared to the MPN dataset, which features a similar number of cells. What causes this variation? Is it dependent on the number of markers utilized for the clustering? This should be clarified/tested. 

      Thanks for the comment, but we are not sure that we fully understand the question. As shown in figure 4 that BinaryClust has slightly higher runtime in MPN dataset than covid dataset, which is reasonable because and the cell number in MPN dataset is around 1.6 million more than covid dataset.

      (2) Some typos are noted: 

      - DeepCyTOF and LDA use a maker expression matrix extracted → "marker"?* 

      Corrected.

      - Datasets(Chevrier et al.)which → spacing* 

      Corrected.

      - This is due to the method's reliance → spacing*

      Corrected.

      Reviewer #3 (Recommendations For The Authors): 

      Is it possible to accommodate more than two levels within the clustering process, i.e., can the proposed semi-supervised clustering tool be extended to multi-levels instead of binary?

      Thanks for the comments. Binary classification can be considered as an imitation of human gating strategy, as it is applied to each marker. For example, when characterizing the CD8 T cells, we aim for CD19-CD14-CD3+CD4- population, which is binary in nature (either positive and negative) and follows the same logic as the method (BinaryClust) we developed. Results indicated that it works very well for well-defined main cell lineages. However, the limitation is for subpopulation identification, because a handful of makers behave in a continuum manner, so we would suggest unsupervised method after BinaryClust, which also brings another advantage of identifying unknown subsets beyond our current knowledge, and none of the semi-supervised tools can achieve that. To answer the reviewer’s question, it is possible to set the number to 3,4,5 rather than just 2, but considering the design and rationale of the entire framework (as describe in the manuscript and above), it doesn’t seem to be necessary.

      Could you please comment on why on the COVID dataset, BinaryClust was slower as compared to flowSOM?

      Thanks for the question. The performance of algorithms can indeed be affected by the characteristics of the datasets, such as their size and complexity. The covid and MPN datasets differ in various aspects including marker panel, experimental protocol, and data acquisition process, among others, which wound account for the observed variation in speed. So, our explanation is flowSOM suits better for the structure of covid dataset than MPN dataset.  Additionally, for covid dataset, both BinaryClust and flowSOM have runtimes of less than 100s, and the difference between the two isn’t particularly dramatic.

      Minor errors: 

      Line#215 "(ref) " reference is missing

      Added.

      Figure 3, increase the font of the text in order to improve readability. 

      Increased.

      Line#229 didn't --> did not. 

      Corrected

      Line#293 repetition of the reference. 

      The repetition is due to the format of the citation, which has been revised.

    1. Author response:

      The following is the authors’ response to the original reviews.

      Reviewer #1 (Public Review):  

      Summary: 

      In this study, Nandy and colleagues examine neural and behavioral correlates of perceptual variability in monkeys performing a visual change detection task. They used a laminar probe to record from area V4 while two macaque monkeys detected a small change in stimulus orientation that occurred at a random time in one of two locations, focusing their analysis on stimulus conditions where the animal was equally likely to detect (hit) or not-detect (miss) a briefly presented orientation change (target). They discovered two behavioral measures that are significantly different between hit and miss trials - pupil size tends to be slightly larger on hits vs. misses, and monkeys are more likely to miss the target on trials in which they made a microsaccade shortly before target onset. They also examined multiple measures of neural activity across the cortical layers and found some measures that are significantly different between hits and misses. 

      Strengths: 

      Overall the study is well executed and the analyses are appropriate (though multiple issues do need to be addressed). 

      We thank the reviewer for their enthusiasm and their constructive comments which we address below.

      Weaknesses: 

      My main concern with this study is that with the exception of the pre-target microsaccades, the physiological and behavioral correlates of perceptual variability (differences between hits and misses) appear to be very weak and disconnected. Some of these measures rely on complex analyses that are not hypothesis-driven and where statistical significance is difficult to assess. The more intuitive analysis of the predictive power of trial outcomes based on the behavioral and neural measures is only discussed at the end of the paper. This analysis shows that some of the significant measures have no predictive power, while others cannot be examined using the predictive power analysis because these measures cannot be estimated in single trials. Given these weak and disconnected effects, my overall sense is that the current results do not significantly advance our understanding of the neural basis of perceptual variability. 

      Reviewer #1 (Recommendations For The Authors): 

      (1) Most of the effects are very small. For example, the difference in pupil size between hits and misses is ~0.08 z-score units. The differences in firing rates between hits and misses are in the order of 1-2% of normalized firing rates. While these effects may be significant, their contribution to perceptual variability could be negligible, as suggested by the analysis of predictive power at the end of the result section. On a related note, it would be useful to mention the analysis of predictive power earlier in the paper. The finding that some of the measures do not have significant predictive power w/r to behavioral outcome raises questions regarding their importance. Finally, it would strengthen the paper if the authors could come up with methods to assess the predictive power of the PPC and interlaminar SSC. Without such analyses, it is difficult to assess the importance of these measures. 

      We expect that relatively small differences in early to intermediate sensory areas could cumulatively result in large differences in higher areas and contribute to the binary distinction between hits and misses. We certainly do not claim that these results completely explain state-dependent differences that determine the outcome of these trials. Instead, we have focused on neural signatures at the level of the V4 columnar microcircuit that might ultimately contribute to the variability in perception.

      We would like to emphasize that, based on the reviewer’s recommendation, we have now analyzed our results separately for each animal (see below). The consistency and significance of our findings across both animals give us confidence that what we have reported here are important neural signatures underlying perceptual variability at threshold.

      We would also like to note that SSC and PPC are now part of the standard toolkit of systems neuroscience and have been employed in numerous studies to our knowledge. While all measures come with their set of caveats and limitations, these two measures provide a frequency-resolved metric of the relationship between two temporal processes (point or continuous), which we believe provide insights into the interlaminar flow of information that we report here.

      Unfortunately, limitations in the GLM method and the reliability of these analyses with limited data make it impossible for these two measures to be included. The GLM requires all variables to be defined for each trial in the input. SSC and PPC can be undefined at low firing rates and require a substantial amount of data to be reliably calculated. While we did consider imputing data or estimating SSC and PPC using multiple trials, we ultimately did not pursue this idea as the purpose of the GLM was to use simultaneous measurements from single trials. 

      (2) What is the actual predictive power of the GLM model (i.e., what is the accuracy of predicting whether a given held-out trial will lead to a hit or a miss)? How much of this predictive power is accounted for by the effect of microsaccades? 

      As the GLM is not a decoder, it does not classify whether a given left out trial will be a hit or a miss. However, the GLM was highly predictive compared to a constant model. This information has been added to Table 3. The deviance of the GLM with and without microsaccades as a variable was not significantly different (p >0.9).  

      (3) The role of stimulus contrast is not explained clearly. Are all the analyses and figures restricted to a single contrast level? Was the contrast the same on both sides? If multiple contrasts are used, could contrast account for some of the observed neural-behavioral covariations? 

      All of the analyses include stimuli of all tested contrast levels. Stimulus contrasts were the same at both locations (attended and unattended). We have added a more detailed description of the contrast in hit and miss trials (Lines 289-296 and reproduced that here: 

      “Non-target stimulus contrasts were slightly different between hits and misses (mean:

      33.1% in hits, 34.0% in misses, permutation test, 𝑝 = 0.02), but the contrast of the target was higher in hits compared to misses (mean: 38.7% in hits, 27.7% in misses, permutation test, 𝑝 = 1.6 𝑒 − 31). Firing rates were normalized by contrast in Figure 3. In all other figures, we considered only non-target stimuli, which had very minor differences in contrast (<1%) across hits and misses. While we cannot completely rule out any other effects of stimulus contrast, the normalization in Figure 3 and minor differences for non-target stimuli should minimize them.”

      (4) Do the animals make false alarms (i.e., report seeing a target in non-target epochs)?

      If not, then it is not clear that the animals are performing near their perceptual threshold. If the false-alarm rate is non-zero, it should be reported and analyzed for neural/behavioral correlates. Does the logistic regression fit allow for a false alarm rate? More generally, it would be useful to see a summary of behavioral performance, such as distribution of thresholds, lower and upper asymptotes, and detection rates on foil trials vs. matched target trials. 

      The logistic regression does allow for a false alarm rate. We have reported additional behavioral parameters in Figure 1-figure supplement 3A-G.  

      (5) As far as I can tell, all the analyses in the paper are done on data combined across the two animals. Given that these effects are weak and that the analyses are complex, it is important to demonstrate for each analysis/figure that the results hold for each animal separately before combining the data across animals. This can be done in supplementary figures. 

      We have updated the paper to include all main results plotted separately for each animal as supplementary figures. 

      - Figure 2-figure supplement 2

      - Figure 3-figure supplement 1

      - Figure 3-figure supplement 2

      - Figure 4-figure supplement 1

      - Figure 5-figure supplement 2

      - Figure 7-figure supplement 1

      All the results except for the canonical correlation analysis were present, consistent, and significant when we analyzed them in each monkey independently.

      (6) The selection of the temporal interval used for the various analyses appears somewhat post hoc and is not explained clearly. Some analyses are restricted to the period immediately before or during target onset (e.g., 400 ms before target onset for analysis of the effect of microsaccade, 60 ms before stimulus onset for the analysis of the effect of neural variability). Other analyses are done on non-target rather than target stimuli. What is the justification for selecting these particular periods for these analyses? The differences in firing rates between hits and misses are restricted to the target epoch and are not present in the non-target epochs. Given these results, it seems important to compare the effects in target and non-target epochs in other analyses as well.

      Restricting the analysis of the Fano Factor to 60 ms before non-target onset seems odd. Given that the duration of the interval between stimulus presentations is random, how could this pre-stimulus effect be time-locked to target onset? 

      We selected a 200ms time window during the pre-stimulus or stimulus-evoked period for almost all our analyses. The results relating to microsaccade occurrence were robust to narrower time windows more consistent with the other pre-stimulus windows we used, but we chose to use the 400ms window to capture a larger fraction of trials with microsaccades. 

      Only the Fano factor time window was selected post-hoc based on the traces in Figure 4A, and the result is robust across animals (new Figure 4-figure supplement 1). The inter-stimulus intervals are random, and we do not believe the neural variability is timelocked to upcoming stimuli, but that lower variability in this pre-stimulus window is characteristic of hits. 

      We believe that the consistency of our results across both animals provides further evidence that our time window selection was appropriate. 

      We are interested in the extent to which these effects would remain consistent when applied only to target stimuli. However, restricting our analyses to only target stimuli substantially reduces the amount of neural data available for analysis. We plan to explore target stimulus representation more thoroughly in future studies.   

      (7) Can the measured neural response be used to discriminate between target and nontarget stimuli? If so, is the discriminability between target and non-target higher in hits vs. misses? 

      Thank you for raising this interesting point. We performed this analysis and find that target stimuli are more discriminable from non-targets in hits compared to misses. This has been added as a new Figure 3A.  

      (8) How many trials were performed per session? Did miss probability tend to increase over time over the session? If so, could this slow change in hit probability account for some of the observed neural and behavioral correlations with perceptual decisions? 

      Monkeys initiated a median of 905 trials (range of 651 to 1086). This has been added to the manuscript (Line 106). Approximately 1/8 of those trials were at perceptual threshold. Hit probability at threshold does not change substantially over the course of the session. We now report this in new Figure 1- figure Supplement 3I (error bars show standard deviation). 

      (9) Did miss probability depend on the time of the change within the trial? If so, do any of the behavioral/neural metrics share a similar within-trial time course? 

      Change times were not significantly different across hit and miss trials (p=0.15, Wilcoxon rank sum test). We now report this in new Figure 1-figure supplement 3H.

      (10) "Deep layer neurons exhibit reduced low-frequency phase-locking in hit trials than in misses (Figure 5B), suggesting an improvement in pooled signal-to-noise among this neural population." - why does this metric suggest improved SNR? Is there any evidence for improved SNR in the data? Why just in deep layers? 

      Thank you for raising this question. We agree this statement is not fully supported by the data and have removed it.  

      (11) I may have missed this but what were the sizes of the Gabor stimuli? 

      This has been added to the methods section (Line 454). The Gaussian halfwidth was 2 degrees.  

      Reviewer #2 (Public Review):  

      In this manuscript, the authors conducted a study in which they measured eye movements, pupil diameter, and neural activity in V4 in monkeys engaged in a visual attention task. The task required the monkeys to report changes in the orientation of Gabors' visual stimuli. The authors manipulated the difficulty of the trials by varying the degree of orientation change and focused their analysis on trials of intermediate difficulty where the monkeys' hit rate was approximately 50%. Their key findings include the following: 1) Hit trials were preceded by larger pupil diameter, reflecting higher arousal, and by more stable eye positions; 2) V4 neurons exhibit larger visual responses in hit trials; 3) Superficial and deep layers exhibited greater coherence in hit trials during both the pre-target stimulus period and the non-target stimulus presentation period. These findings have useful implications for the field, and the experiments and analyses presented in this manuscript validly support the authors' claims. 

      Strengths: 

      The experiments were well-designed and executed with meticulous control. The analyses of both behavioural and electrophysiological data align with the standards in the field. 

      We thank the reviewer for their enthusiasm about our study and their constructive comments which we address below.

      Weaknesses: 

      Many of the findings appear to be incremental compared to previous literature, including the authors' own work. While incremental findings are not necessarily a problem, the manuscript lacks clear statements about the extent to which the dataset, analysis, and findings overlap with the authors' prior research. For example, one of the main findings, which suggests that V4 neurons exhibit larger visual responses in hit trials (as shown in Fig. 3), appears to have been previously reported in their 2017 paper. Additionally, it seems that the entire Fig1-S1 may have been reused from the 2017 paper. These overlaps should have been explicitly acknowledged and correctly referenced. 

      While the raw data used in this paper overlaps entirely with Nandy et al. (2017), all the analyses and findings in this manuscript are new and have not been previously reported. Figure 1-figure supplement 1 is modified and reproduced from that paper only to allow readers to understand the recording methods used to collect the data without needing to go back to the previous paper. We have added an explicit acknowledgment of this to the figure caption.

      Previous studies have demonstrated that attention leads to decorrelation in V4 population activity. The authors should have discussed how and why the high coherence across layers observed in the current study can coexist with this decorrelation. 

      We have updated the discussion section (Lines 347-351) to further elaborate on this interpretation. 

      Furthermore, the manuscript does not explore potentially interesting aspects of the dataset. For instance, the authors could have investigated instances where monkeys made 'false' reports, such as executing saccades towards visual stimuli when no orientation change occurred. It would be valuable to provide the fraction of the monkeys' responses in a session, including false reports and correct rejections in catch trials, to allow for a broader analysis that considers the perceptual component of neural activity over pure sensory responses. 

      We appreciate this feedback. While we agree these are interesting directions, we decided to limit the scope of this study to only focus on trials at threshold with an orientation change, and are considering these directions for future studies. 

      Reviewer #2 (Recommendations For The Authors): 

      • Figure Design: Since eLife does not impose space limitations, it is advisable for the authors to avoid using very small font sizes. Consistency in font size throughout the figures is recommended. Some figures are challenging to discern, for example, the mean+-sem in Fig. 2B, and the alpha values of green and purple colours for superficial/deep layers are too high, making them too transparent or pale. 

      We have increased the size of some small fonts and improved font size consistency throughout the figures. We have changed the layer colors to improve legibility. 

      • Line 119: trail, 

      This has been fixed.

    1. Author response:

      The following is the authors’ response to the previous reviews.

      Public Reviews:

      Reviewer #1 (Public Review):

      The present study provides a phylogenetic analysis of the size prefrontal areas in primates, aiming to investigate whether relative size of the rostral prefrontal cortex (frontal pole) and dorsolateral prefrontal cortex volume vary according to known ecological or social variables.

      I am very much in favor of the general approach taken in this study. Neuroimaging now allows us to obtain more detailed anatomical data in a much larger range of species than ever before and this study shows the questions that can be asked using these types of data. In general, the study is conducted with care, focusing on anatomical precision in definition of the cortical areas and using appropriate statistical techniques, such as PGLS.

      I have read the revised version of the manuscript with interest. I agree with the authors that a focus on ecological vs laboratory variables is a good one, although it might have been useful to reflect that in the title.

      I am happy to see that the authors included additional analyses using different definitions of FP and DLPFC in the supplementary material. As I said in my earlier review, the precise delineation of the areas will always be an issue of debate in studies like this, so showing the effects of different decisions in vital.

      We thank the reviewer for these positive remarks and for these very useful suggestions on the previous version of this article.

      I am sorry the authors are so dismissive of the idea of looking the models where brain size and area size are directly compared in the model, rather preferring to run separate models on brain size and area size. This seems to me a sensible suggestion.

      We agree with the reviewer 1 and the response of reviewer 3 also made it clear to us of why it was an important issue. We have therefore addressed it more thoroughly this time.

      First, we have added a new analysis, with whole brain volume included as covariate in the model accounting for regional volumes, together with the socio-ecological variables of interest. As expected given the very strong correlation across all brain measures (>90%), the effects of all socio-ecological factors disappear for both FP and DLPFC volumes when ‘whole brain’ is included as covariate. This is coherent with our previous analysis showing that the same combination of socio-ecological variables could account for the volume of FP, DLPFC and the whole brain. Nevertheless, the interpretation of these results remains difficult, because of the hidden assumptions underlying the analysis (see below).

      Second, we have clarified the theoretical reasons that made us choose absolute vs relative measures of brain volumes. In short, we understand the notion of specificity associated with relative measures, but 1) the interpretation of relative measures is confusing and 2) we have alternative ways to evaluate the specificity of the effects (which are complementary to the idea of adding whole brain volume as covariate). 

      Our goal here was to evaluate the influence of socio-ecological factors on specific brain regions, based on their known cognitive functions in laboratory conditions (working memory for the DLPFC and metacognition for the frontal pole). Thus, the null hypothesis is that socio-ecological challenges supposed to mobilize working memory and metacognition do not affect the size of the brain regions associated with these functions (respectively DLPFC and FP). This is what our analysis is testing, and from that perspective, it seems to us that direct measures are better, because within regions (across species), volumes provide a good index of neural counts (since densities are conserved), which are indicative fo the amount of computational resources available for the region. It is not the case when using relative measures, or when using the whole brain as covariate, since densities are heterogenous across brain regions (e.g. Herculano-Houzel, 2011; 2017, but see below for further details on this).

      Quantitatively, the theoretical level of specificity of the relation between brain regions and socio-ecological factors is difficult to evaluate, given that our predictions are based on the cognitive functions associated with DLPFC and FP, namely working memory and metacognition, and that each of these cognitive functions also involved other brain regions. We would actually predict that other brain regions associated with the same cognitive functions as DLPFC or FP also show a positive influence of the same socioecological variables. Given that the functional mapping of cognitive functions in the brain remains debated, it is extremely difficult to evaluate quantitatively how specific the influence of the socio-ecological factors should be on DLPFC and FP compared to the rest of the brain, in the frame of our hypothesis.

      Critically, given that FP and DLPFC show a differential sensitivity to population density, a proxy for social complexity, and that this difference is in line with laboratory studies showing a stronger implication of the FP in social cognition, we believe that there is indeed some specificity in the relation between specific regions of the PFC and socioecological variables. Thus, our results as a whole seem to indicate that the relation between prefrontal cortex regions and socio-ecological variables shows a small but significant level of specificity. We hope that the addition of the new analysis and the corresponding modifications of the introduction and discussion section will clarify this point.

      Similarly, the debate about whether area volume and number of neurons can be equated across the regions is an important one, of which they are a bit dismissive.

      We are sorry that the reviewer found us a bit dismissive on this issue, and there may have been a misunderstanding.

      Based on the literature, it is clearly established that for a given brain region, area volume provides a good proxy for the number of neurons, and it is legitimate to generalize this relation across species if neuronal densities are conserved for the region of interest (see for example Herculano-Houzel 2011, 2017 for review). It seems to be the case across primates because cytoarchitectonic maps are conserved for FP and DLPFC, at least in humans and laboratory primates (Petrides et al, 2012; Sallet et al, 2013; Gabi et al, 2016; Amiez et al, 2019). But we make no claim about the difference in number of neurons between FP and DLPFC, and we never compared regional volumes across regions (we only compared the influence of socio-ecological factors on each regional volume), so their difference in cellular density is not relevant here. As long as the neuronal density is conserved across species but within a region (DLPFC or FP), the difference in volume for that region, across species, does provide a reliable proxy for the influence of the socioecological regressor of interest (across species) on the number of neurons in that region.

      Our claims are based on the strength of the relation between 1) cross-species variability in a set of socio-ecological variables and 2) cross-species variability in neural counts in each region of interest (FP or DLPFC). Since the effects of interest relate to inter-specific differences, within a region, our only assumption is that the neural densities are conserved across distinct species for a given brain region. Again (see previous paragraph), there is reasonable evidence for that in the literature. Given that assumption, regional volumes (across species, for a given brain region) provide a good proxy for the number of neurons. Thus, the influence of a given socio-ecological variable on the interspecific differences in the volume of a single brain region provides a reliable estimate of the influence of that socio-ecological variable on the number of neurons in that region (across species), and potentially of the importance of the cognitive function associated with that region in laboratory conditions. None of our conclusions are based on direct comparison of volumes across regions, and we only compared the influence of socioecological factors (beta weights, after normalization of the variables).

      Note that this is yet another reason for not using relative measures and not including whole brain as covariate in the regression model: Given that whole brain and any specific region have a clear difference in density, and that this difference is probably not conserved across species, relative measures (or covariate analysis) cannot be used as proxies for neuronal counts (e.g. Herculano-Houzel, 2011). In other words, using the whole brain to rescale individual brain regions relies upon the assumption that the ratios of volumes (specific region/whole brain) are equivalent to the ratios of neural counts, which is not valid given the differences in densities.

      Nevertheless, I think this is an important study. I am happy that we are using imaging data to answer more wider phylogenetic questions. Combining detailed anatomy, big data, and phylogenetic statistical frameworks is a important approach.

      We really thank the reviewer for these positive remarks, and we hope that this study will indeed stimulate others using a similar approach.

      Reviewer #2 (Public Review):

      In the manuscript entitled "Linking the evolution of two prefrontal brain regions to social and foraging challenges in primates" the authors measure the volume of the frontal pole (FP, related to metacognition) and the dorsolateral prefrontal cortex (DLPFC, related to working memory) in 16 primate species to evaluate the influence of socio-ecological factors on the size of these cortical regions. The authors select 11 socio-ecological variables and use a phylogenetic generalized least squares (PGLS) approach to evaluate the joint influence of these socio-ecological variables on the neuro-anatomical variability of FP and DLPFC across the 16 selected primate species; in this way, the authors take into account the phylogenetic relations across primate species in their attempt to discover the the influence of socio-ecological variables on FP and DLPF evolution.

      The authors run their studies on brains collected from 1920 to 1970 and preserved in formalin solution. Also, they obtained data from the Mussée National d´Histoire Naturelle in Paris and from the Allen Brain Institute in California. The main findings consist in showing that the volume of the FP, the DLPFC, and the Rest of the Brain (ROB) across the 16 selected primate species is related to three socio-ecological variables: body mass, daily traveled distance, and population density. The authors conclude that metacognition and working memory are critical for foraging in primates and that FP volume is more sensitive to social constraints than DLPFC volume.

      The topic addressed in the present manuscript is relevant for understanding human brain evolution from the point of view of primate research, which, unfortunately, is a shrinking field in neuroscience. But the experimental design has two major weak points: the absence of lissencephalic primates among the selected species and the delimitation of FP and DLPFC. Also, a general theoretical and experimental frame linking evolution (phylogeny) and development (ontogeny) is lacking.

      We are sorry that the reviewer still believes that these two points are major weaknesses.

      - We have added a point on lissencephalic species in the discussion. In short, we acknowledge that our work may not be applied to lissencephalic species because they cannot be studied with our method, but on the other hand, based on laboratory data there is no evidence showing that the functional organization of the DLPFC and FP in lissencephalic primates is radically different from that of other primates (Dias et al, 1996; Roberts et al, 2007; Dureux et al, 2023; Wong et al, 2023). Therefore, there is no a priori reason to believe that not including lissencephalic primates prevents us from drawing conclusions that are valid for primates in general. Moreover, as explained in the discussion, including lissencephalic primates would require using invasive functional studies, only possible in laboratory conditions, which would not be compatible with the number of species (>15) necessary for phylogenetic studies (in particular PGLS approaches). Finally, as pointed out by the reviewer, our study is also relevant for understanding human brain evolution, and as such, including lissencephalic species should not be critical to this understanding.

      - In response to the remarks of reviewer 1 on the first version of the manuscript, we had included a new analysis in the previous version of the manuscript, to evaluate the validity of our functional maps given another set of boundaries between FP and DLPFC. But one should keep in mind that our objective here is not to provide a definitive definition of what the regions usually referred to as DLPFC and FP should be from an anatomical point of view. Rather, as our study aims at taking into account the phylogenetic relations across primate species, we chose landmarks that enable a comparison of the volume of cortex involved in metacognition (FP) and working memory (DLPFC) across species. We have also updated the discussion accordingly.

      We agree that this is a difficult point and we have always acknowledged that this was a clear limitation in our study. In the light of the functional imaging literature in humans and non-human primates, as well as the neurophysiological data in macaques, defining the functional boundary between FP and DLPFC remains a challenging issue even in very well controlled laboratory conditions. As mentioned by reviewer 1, “the precise delineation of the areas will always be an issue of debate in studies like this, so showing the effects of different decisions in vital”. Again, an additional analyses using different boundaries for FP and DLPFC was included in the supplementary material to address that issue. Now, we are not aware of solid evidence showing that the boundaries that we chose for DLPFC vs FP were wrong, and we believe that the comparison between 2 sets of measures as well as the discussion on this topic should be sufficient for the reader to assess both the strength and the limits of our conclusion. That being said, if the reviewer has any reference in mind showing better ways to delineate the functional boundary between FP and DLPFC in primates, we would be happy to include it in our manuscript.

      - The question of development, which is an important question per se,  is neither part of the hypothesis nor central for the field of comparative cognition in primates. Indeed, major studies in the field do not mention development (e.g. Byrne, 2000; Kaas, 2012; Barton, 2012). De Casien et al (2022) even showed that developmental constraints are largely irrelevant (see Claim 4 of their article): [« The functional constraints hypothesis […] predicts more complex, ‘mosaic’ patterns of change at the network level, since brain structure should evolve adaptively and in response to changing environments. It also suggests that ‘concerted’ patterns of brain evolution do not represent conclusive evidence for developmental constraints, since allometric relationships between developmentally linked or unlinked brain areas may result from selection to maintain functional connectivity. This is supported by recent computational modeling work [81], which also suggests that the value of mosaic or concerted patterns may fluctuate through time in a variable environment and that developmental coupling may not be a strong evolutionary constraint. Hence, the concept of concerted evolution can be decoupled from that of developmental constraints »].

      Finally, when studies on brain evolution and cognition mention development, it is generally to discuss energetic constraints rather than developmental mechanisms per se (Heldstab et al 2022 ; Smaers et al, 2021;  Preuss & Wise, 2021; Dunbar & Schutz, 2017; MacLean et al, 2012. Mars et al, 2018; 2021). Therefore, development does not seem to be a critical issue, neither for our article nor for the field.

      Reviewer #3 (Public Review):

      This is an interesting manuscript that addresses a longstanding debate in evolutionary biology - whether social or ecological factors are primarily responsible for the evolution of the large human brain. To address this, the authors examine the relationship between the size of two prefrontal regions involved in metacognition and working memory (DLPFC and FP) and socioecological variables across 16 primate species. I recommend major revisions to this manuscript due to: 1) a lack of clarity surrounding model construction; and 2) an inappropriate treatment of the relative importance of different predictors (due to a lack of scaling/normalization of predictor variables prior to analysis).

      We thank the reviewer for his/her remarks, and for the clarification of his /her criticism regarding the use of relative measures. We are sorry to have missed the importance of this point in the first place. We also thank the reviewer for the cited references, which were very interesting and which we have included in the discussion. As the reviewer 1 also shared these concerns, we wrote a detailed response to explain how we addressed the issue above.

      First, we did run a supplementary analysis where whole brain volume was added as covariate, together with socio-ecological variables, to account for the volume of FP or DLPFC. As expected given the very high correlation across all 3 brain measures, none of the socio-ecological variables remained significant. We have added a long paragraph in the discussion to tackle that issue. In short, we agree with the reviewer that the specificity of the effects (on a given brain region vs the rest of the brain) is a critical issue, and we acknowledge that since this is a standard in the field, it was necessary to address the issue and run this extra-analysis. But we also believe that specificity could be assessed by other means: given the differential influence of ‘population density’ on FP and DLPFC, in line with laboratory data, we believe that some of the effects that we describe do show specificity. Also, we prefer absolute measures to relative measures because they provide a better estimate of the corresponding cognitive operation, because standard allometric rules (i.e., body size or whole brain scaling) may not apply to the scaling and evolution of FP and DLPFC in primates.. Indeed, given that we use these measures as proxies of functions (metacognition for FP and working memory for DLPFC), it is clear that other parts of the brain should show the same effect since these functions are supported by entire networks that include not only our regions of interest but also other cortical areas in the parietal lobe. Thus, the extent to which the relation with socio-ecological variables should be stronger in regions of interest vs the whole brain depends upon the extent to which other regions are involved in the same cognitive function as our regions of interest, and this is clearly beyond the scope of this study. More importantly, volumetric measures are taken as proxies for the number of neurons, but this is only valid when comparing data from the same brain region (across species), but not across brain regions, since neural densities are not conserved. Thus, using relative measures (scaling with the whole brain volume) would only work if densities were conserved across brain regions, but it is not the case. From that perspective, the interpretation of absolute measures seems more straightforward, and we hope that the specificity of the effects could be evaluated using the comparison between the 3 measures (FP, DLPFC and whole brain) as well as the analysis suggested by the reviewer. We hope that the additional analysis and the updated discussion will be sufficient to cover that question, and that the reader will have all the information necessary to evaluate the level of specificity and the extent to which our findings can be interpreted.

      Recommendations for the authors:

      Reviewer #2 (Recommendations For The Authors):

      In my previous review of the present manuscript, I pointed out the fact that defining parts, modules, or regions of the primate cerebral cortex based on macroscopic landmarks across primate species is problematic because it prevents comparisons between gyrencephalic and lissencephalic primate species. The authors have rephrased several paragraphs in their manuscript to acknowledge that their findings do apply to gyrencephalic primates.

      I also said that "Contemporary developmental biology has showed that the selection of morphological brain features happens within severe developmental constrains. Thus, the authors need a hypothesis linking the evolutionary expansion of FP and DLPFC during development. Otherwise, the claims form the mosaic brain and modularity lack fundamental support". I insisted that the author should clarify their concept of homology of cerebral cortex parts, modules, or regions cross species (in the present manuscript, the frontal pole and the dorsolateral prefrontal cortex). Those are not trivial questions because any phylogenetic explanation of brain region expansion in contemporary phylogenetic and evolutionary biology must be rooted in evolutionary developmental biology. In this regard, the authors could have discussed their findings in the frame of contemporary studies of cerebral cortex evolution and development, but, instead, they have rejected my criticism just saying that they are "not relevant here" or "clearly beyond the scope of this paper".

      The question of development, which is an important question per se, is neither part of the hypothesis nor central for the field of comparative cognition in primates. Indeed, the major studies in the field do not mention development and some even showed that developmental constraints were not relevant (see De Casien et al., 2022 and details in our response to the public review). When studies on brain evolution and cognition mention development, it is generally to discuss energetic constraints rather than developmental mechanisms per se (Heldstab et al 2022 ; Smaers et al, 2021;  Preuss & Wise, 2021; Dunbar & Schutz, 2017;  MacLean et al, 2012. Mars et al, 2018; 2021).

      If the other reviewers agree, the authors are free to publish in eLife their correlations in a vacuum of evolutionary developmental biology interpretation. I just disagree. Explanations of neural circuit evolution in primates and other mammalian species should tend to standards like the review in this link: https://royalsocietypublishing.org/doi/full/10.1098/ rstb.2020.0522

      In this article, Paul Cizek (a brilliant neurophysiologist) speculates on potential evolutionary mechanisms for some primate brain functions, but there is surprisingly very little reference to the existing literature on primate evolution and cognition. There is virtually no mention of studies that involve a large enough number of species to address evolutionary processes and/or a comparison with fossils and/or an evaluation of specific socio-ecological evolutionary constraints. Most of the cited literature refers to laboratory studies on brain anatomy of a handful of species, and their relevance for evolution remains to be evaluated. These ideas are very interesting and they could definitely provide an original perspective on evolution, but they are mostly based on speculations from laboratory studies, rather than from extensive comparative studies. This paper is interesting for understanding developmental mechanisms and their constraints on neurophysiological processes in laboratory conditions, but we do not think that it would fit it in the framework of our paper as it goes far beyond our main topic.

      Reviewer #3 (Recommendations For The Authors):

      Yes, I am suggesting that the authors also include analyses with brain size (rather than body size) as a covariate to evaluate the effects of other variables in the model over and above the effect on brain size. In a very simplified theoretical scenario: two species have the same body sizes, but species A has a larger brain and therefore a larger FP. In this case, species A has a larger FP because of brain allometric patterns, and models including body size as a covariate would link FP size and socioecological variables characteristic of species A (and others like it). However, perhaps the FP of species A is actually smaller than expected for its brain size, while the FP of species B is larger than expected for its brain size.

      As explained in our response to the public review, we did run this analysis and we agree with the reviewer’s point from a practical point of view: it is important to know the extent to which the relation with a set of socio-ecological variables is specific of the region of interest, vs less specific and present for other brain regions. Again, we are sorry to not have understood that earlier, and we acknowledge that since it is a standard in the field, it needs to be addressed thoroughly.

      We understand that the scaling intuition, and the need to get a reference point for volumetric measures, but here the volume of each brain region is taken as a proxy for the number of neurons and therefore for the region’s computational capacities. Since, for a given brain region (FP or DLPFC) the neural densities seem to be well conserved across species, comparing regional volumes across species provides a good proxy for the contrast (across species) in neural counts for that region. All we predicted was that for a given brain region, associated with a given cognitive operation, the volume (number of neurons) would be greater in species for which socio-ecological constraints potentially involving that specific cognitive operation were greater. We do not understand how or why the rest of the brain would change this interpretation (of course, as discussed just above, beyond the question of specificity). And using whole brain volume as a scaling measure is problematic because the whole brain density is very different from the density of these regions of the prefrontal cortex (see above for further details). Again, we acknowledge that allometric patterns exist, and we understand how they can be interpreted, but we do not understand how it could prove or disprove our hypothesis (brain regions involved in specific cognitive operations are influenced by a specific set of socio-ecological variables). When using volumes as a proxy for computational capacities, the theoretical implications of scaling  procedures might be problematic. For example, it implies that the computational capacities of a given brain region are scaled by the rest of the brain. All other things being equal, the computational capacities of a given brain region, taken as the number of neurons, should decrease when the size of the rest of the brain increases. But to our knowledge there is no evidence for that in the literature. Clearly these are very challenging issues, and our position was to take absolute measures because they do not rely upon hidden assumptions regarding allometric relations and their consequence on cognition.

      But since we definitely understand that scaling is a reference in the field, we have not only completed the corresponding analysis (including the whole brain as a covariate, together with socio-ecological variables) but also expended the discussion to address this issue in detail. We hope that between this new analysis and the comparison of effects between non-scaled measures of FP, DLPFC and the whole brain, the reader will be able to judge the specificity of the effect.

      Models including brain (instead of body) size would instead link FP size and socioecological variables characteristic of species B (and others like it). This approach is supported by a large body of literature linking comparative variation in the relative size of specific brain regions (i.e., relative to brain size) to behavioral variation across species - e.g., relative size of visual/olfactory brain areas and diurnality/nocturnality in primates (Barton et al. 1995), relative size of the hippocampus and food caching in birds (Krebs et al. 1989).

      Barton, R., Purvis, A., & Harvey, P. H. (1995). Evolutionary radiation of visual and olfactory brain systems in primates, bats and insectivores. Philosophical Transactions of the Royal Society of London. Series B: Biological Sciences, 348(1326), 381-392.

      Krebs, J. R., Sherry, D. F., Healy, S. D., Perry, V. H., & Vaccarino, A. L. (1989). Hippocampal specialization of food-storing birds. Proceedings of the National Academy of Sciences, 86(4), 1388-1392. 

      We are grateful to the reviewer for mentioning these very interesting articles, and more generally for helping us to understand this issue and clarify the related discussion. Again, we understand the scaling principle but the fact that these methods provide interesting results does not make other approaches (such as ours) wrong or irrelevant. Since we have used both our original approach and the standard version as requested by the reviewer, the reader should be able to get a clear picture of the measures and of their theoretical implications. We sincerely hope that the present version of the paper will be satisfactory, not only because it is clearer, but also because it might stimulate further discussion on this complex question.