If you
David Fasenfest, A Neoliberal Response to an Urban Crisis: Emergency Management in Flint, MI, Critical Sociology 45, no. 1 (2019): 34, https://doi.org/10.1177/0896920517718039.
If you
David Fasenfest, A Neoliberal Response to an Urban Crisis: Emergency Management in Flint, MI, Critical Sociology 45, no. 1 (2019): 34, https://doi.org/10.1177/0896920517718039.
We've basically
Smith, Mitch. “Lead-Tainted Water Flows in Another Michigan City: Benton Harbor Is Omen For Nation’s Aging Pipes.” National. New York Times (New York, N.Y., United States), October 17, 2021.
To be honest,
Smith, Mitch. “Lead-Tainted Water Flows in Another Michigan City: Benton Harbor Is Omen For Nation’s Aging Pipes.” National. New York Times (New York, N.Y., United States), October 17, 2021.
You know that promo slogan for Alien: “In space, no one can hear you scream.” In cyberspace, no one can hear you doubt.
I’d made the mistake of adopting the moniker “Redhead,” and the supposedly philosophical participants were all over me like a cheap suit the moment I logged on, assuming, it finally dawned on me, that I was a different gender of Redhead.)
Even in her lifetime, Mills was mythologized.
Very effective animated collage that rebuilds the mythology even as it immerses me in it.
Water
Fennell, Catherine. “Are We All Flint?” Limn, no. 7 (July 2016): 21–21.
"death worlds"
Davies, Thom. “Toxic Space and Time: Slow Violence, Necropolitics, and Petrochemical Pollution.” Annals of the American Association of Geographers 108, no. 6 (2018): 1537–53. https://doi.org/10.1080/24694452.2018.1470924.
“We Are All Flint”
Fennell, Catherine. “Are We All Flint?” Limn, no. 7 (July 2016): 21–21.
Flint Service Map
“Flint Map Shows Progress, Reveals Where Lead Likely Remains.” June 25, 2020. https://www.nrdc.org/bio/stacy-woods/flint-map-shows-progress-reveals-where-lead-likely-remains.
Black protestors
Morckel, Victoria, and Kathryn Terzano. “Legacy City Residents’ Lack of Trust in Their Governments: An Examination of Flint, Michigan Residents’ Trust at the Height of the Water Crisis.” Journal of Urban Affairs 41, no. 5 (2019): 585–601. https://doi.org/10.1080/07352166.2018.1499415.
The Whistleblowers
McKenna, Brian. “The Agony of Flint: Poisoned Water, Racism and the Specter of Neoliberal Fascism.” Anthropology Now 10, no. 3 (2018): 45–58. https://doi.org/10.1080/19428200.2018.1591053.
Ranging from:
Fennell, Catherine. “Are We All Flint?” Limn, no. 7 (July 2016): 21–21.
Feature RequestThis is an on-demand feature. Please fill out the form to get this feature activated on your account.
This section to be removed
ConclusionThrough the blending of both the flâneuse's internal thoughts as well as her perceptions of the external world, Mirrlees constructs a multi-sensory experience that invites readers into her interiority, allowing them to engage with the poem, as she does with Paris: in a meaningful and embodied way.
Though clear and coherent, this conclusion feels like a bit of a let down after such subtle, perceptive, and engaging analysis. I think you might say how, after (or as an extension of ) collapsing the distinction between flaneuse and writer, the poem animates the reader in their combined role, inviting us to experience an autonomous, subjective, mutlisensory interiority, in which the self is not objectified nor objectifies others, but experiences its own power and permeability. In this way, the poem reminds me a bit of Walt Whitman's Song of Myself, which concludes by hailing the reader, saying: if you want me, look under your boot soles. We become Whitman, walking the streets of the newly formed American nation in his shoes.
e visualization of the letters are being drawn by Mirrlees as the writer, rather than the wandering flâneuse, as they implicate the page
very intriguing and perceptive distinction.
While digital media cannot materially reproduce scent, Mirrlees’s language enables readers to use their imagination, as the flâneuse does throughout the poem, in order to vicariously experience the sensation, thereby “becoming-with” the poem itself.
Nicely done!
portrait of Paris.
Paris at a particular point in the 1920s, when there were still roosters! You'd be unlikely to hear that today!
flâneuse is observing both the space and the people in the space, noting their behavior.
and perhaps also reflecting on how painters have depicted the space. Or maybe she's seeing the space via the paintings she's seen of it.
This line mimics the sound of a train car in motion
The audio effect is brilliant! I can hear the berkekekek!!
The one line mention devoted to each of these posters suggests that the flâneuse, through whom the poem is focalized, is noting these posters as she passes them. She does not stop to analyze them, rather they become an observation, briefly entering her consciousness, thus indicating movement.
wonderfully clear presentation and analysis of the opening lines.
lacking a self-consciousness one might assume of a woman in the 1910s
Your insights are excellent, but here again check this tendency to attach dependent clauses that don't have a clear referent. This one attaches to "male gaze."
an interpretation shared by many scholars including, Kayleigh C. Quarterman, Tory Young, and Ruth Alison Clemens.
This clause dangles in this location, attaching itself to the "female flaneuse". Better to begin with the scholars, writing something like:
Scholars have noted that the poem posits the existence of a female... as an alternative to the male....
passively
freely? nonchalantly? Also, what makes him hegemonic? Could the male flaneur ever be a queer or subversive figure?
It employs Brigg's scholarly notes, as well as many of the same images included in the digital edition, however, coupled with this new technology, the hope is to create an affective landscape that emulates the sensorial experience Mirrlees captures within the poem.
This seems like a better, more diplomatic framing of your relationship to the digital edition than the one you provide above. Consider condensing to avoid the repetition.
'a sort of futurist trick,' designed 'to give an ensemble of the sensations offered to a pilgrim through Paris'" (1056
great quotation and recuperating of a criticism into a strength!
While the digital edition includes an option to view the contextualizing notes, as well as photos, it lacks a visual cohesive flow, thereby diminishing from the sensory experience so vividly rendered in the poem itself.
Here I think you can praise the digital edition a bit more, given our debt to it, and soften your criticism while still differentiating yourself, e.g.
The digital edition makes the poem accessible to the public, providing detailed annotations of the poem's many now obscure references, and even linking them to a set of related archival images. As rich as this context is, delving into it may distance readers from their immersion in the sensory experience of the poem. Building on the foundation their digital edition provides, this multimedia essay aims to recreate that sensory experience online.
xt. Since then, the poem has seen an increase in scholarly attention. Briggs’s notes on the poem have since becom
combine in one paragraph and provide a bit more information about the digital edition.
Despite the poem’s genius, the poem remained largely unread and unanalyzed for the better part of a century (1057).
here's where you might intro the digital edition, saying: neglected until recently, when....
Introduction Portrait photo of Hope Mirrlees and Jane Ellen Harrison, 1924 Helen Hope Mirrlees was a poet and writer born in England in 1887 ("Hope Mirrlees"). Though she publis
Clear, direct opening gets the necessary facts across.
Portrait photo of Hope Mirrlees and Jane Ellen Harrison, 1924
A link to a source doesn't substitute for a citation, and here you risk losing your readers to the digital edition. Why not introduce that edition explicitly, link to, acknowledge your debt to, and distinguish your project from it right up front?
Lauren Collee. The Great Offline. Real Life, December 2021. URL: https://reallifemag.com/the-great-offline/ (visited on 2023-12-08).
I picked this source because it pushes back against the simple idea that going “offline” is automatically the solution to problems caused by social media. I thought that was interesting because it makes the issue feel more complicated and more realistic. Instead of treating the internet as something that is just bad and needs to be escaped, this source suggests that we should think more about how online spaces are designed and how they could be improved.
Robinson Meyer. Everything We Know About Facebook’s Secret Mood-Manipulation Experiment. The Atlantic, June 2014. URL: https://www.theatlantic.com/technology/archive/2014/06/everything-we-know-about-facebooks-secret-mood-manipulation-experiment/373648/ (visited on 2023-12-08).
The Meyer Atlantic article about Facebook’s secret mood experiment seems truly disturbing from the perspective of this chapter. In 2012, the company modified the news feed of almost 700,000 users, exposing some to more positive stories while others to more negative stories. This study revealed that the exposure to either kind of news feed affected the extent to which individuals shared positive or negative sentiments. I think what makes this experiment even more disturbing is the paradox – the chapter explains how social media can contribute to the improvement of mental well-being; yet, in this case, the social networking site chose to make users feel bad without any user awareness and consent. When asked about the significance of the experiment's findings, the lead author mentioned the minimal effect in real-life contexts. However, as stated by one school of social work's dean, users who were emotionally vulnerable could become depressed or anxious due to the manipulation in news feed, and no one would ever know.
Digital detox. November 2023. Page Version ID: 1187412856. URL: https://en.wikipedia.org/w/index.php?title=Digital_detox&oldid=1187412856 (visited on 2023-12-08).
I've done a digital detox before and I always feel like I have much more time in life. I also tend to get a lot more sleep too. This is also reflected in the study talked about in this wiki page where 59% of users use phones before sleep and within 30 minutes of waking up. It's crazy how reliant people are on technology.
Sarah McQuate. 'I don't even remember what I read': People enter a 'dissociative state' when using social media. ScienceDaily, May 2022. URL: https://www.sciencedaily.com/releases/2022/05/220523135018.htm (visited on 2023-12-08).
In this text, Sarah McQuate overall explains that UW researchers in their study found that social media users experience a state of spacing out when using social media. This is very harmful as it causes them to lose track of time and lose their overall self-control. One detail McQuate mentions is that in the study, 42% of the participants mentioned that they have used social media at least once, while not even paying attention to what they were watching or doing there.
Anya Kamenetz. Selfies, Filters, and Snapchat Dysmorphia: How Photo-Editing Harms Body Image. Psychology Today, February 2020. URL: https://www.psychologytoday.com/us/articles/202002/selfies-filters-and-snapchat-dysmorphia-how-photo-editing-harms-body-image (visited on 2023-12-08).
This article talks about this girl named Maya's experience using Snapchat for an extended period of time. This led to the use of apps similar to facetune. Overtime she became more and more insecure of things she had originally never thought of. I think it is important to read articles and hear stories like this because it's happening to almost everyone online. You can have a lot of personal self confidence and still find yourself comparing to others.
Terry Gross. Director Bo Burnham On Growing Up With Anxiety — And An Audience. NPR, July 2018. URL: https://www.npr.org/2018/07/18/630069876/director-bo-burnham-on-growing-up-with-anxiety-and-an-audience (visited on 2023-12-08).
This interview highlights how Bo Burnham connects performance, anxiety, and constant audience awareness in the age of social media. It reinforces the idea that growing up online blurs the line between authentic self-expression and performing for others’ perception.
Digital detox. November 2023. Page Version ID: 1187412856. URL: https://en.wikipedia.org/w/index.php?title=Digital_detox&oldid=1187412856 (visited on 2023-12-08).
This article talks about breaking away from social media and the immediate or delayed benefits it gives. It's hard to see instant results when fighting through urges but delayed gratification is prevalent.
Lauren Collee. The Great Offline. Real Life, December 2021. URL: https://reallifemag.com/the-great-offline/ (visited on 2023-12-08).
I totally agree with her in this article. I think that the digital and real worlds are too interconnected now that it isn't possible to have a clean break between the two. She talks about how the real world and nature are overglamorized, by calling it pure and unihabited eden. This is a historical perspective that I honestly think is true. We live off the earth, and we rely on the ecosystems that it has in place to create a competitive advantage for humans. Now I believe we are fighting agaist our selves, and not survival. Which means we have turned into digital warfare.
So in this chapter, we will not consider internet-based social media as inherently toxic or beneficial for mental health. We will be looking for more nuance and where things go well, where they do not, and why.
I like this point because discussions about social media and mental health often become too simple too quickly. People sometimes talk as if social media is either obviously ruining people’s lives or obviously helping them stay connected, but this chapter points out that the reality is more mixed than that. I think that is important, because different platforms, different uses, and different people can have very different experiences. This also makes me think that the better question is not whether social media is “good” or “bad” overall, but what kinds of design and habits make it more harmful or more helpful.
13.1.1. Digital Detox?# Some people view internet-based social media (and other online activities) as inherently toxic and therefore encourage a digital detox [m6], where people take some form of a break from social media platforms and digital devices. While taking a break from parts or all of social media can be good for someone’s mental health (e.g., doomscrolling is making them feel more anxious, or they are currently getting harassed online), viewing internet-based social media as inherently toxic and trying to return to an idyllic time from before the Internet is not a realistic or honest view of the matter. In her essay “The Great Offline,” [m7] Lauren Collee argues that this is just a repeat of earlier views of city living and the “wilderness.” As white Americans were colonizing the American continent, they began idealizing “wilderness” as being uninhabited land (ignoring the Indigenous people who already lived there, or kicking them out or killing them). In the 19th century, as wilderness tourism was taking off as an industry, natural landscapes were figured as an antidote to the social pressures of urban living, offering truth in place of artifice, interiority in place of exteriority, solitude in place of small talk. Similarly, advocates for digital detox build an idealized “offline” separate from the complications of modern life: Sherry Turkle, author of Alone Together, characterizes the offline world as a physical place, a kind of Edenic paradise. “Not too long ago,” she writes, “people walked with their heads up, looking at the water, the sky, the sand” — now, “they often walk with their heads down, typing.” […] Gone are the happy days when families would gather around a weekly televised program like our ancestors around the campfire! But Lauren Collee argues that by placing the blame on the use of technology itself and making not using technology (a digital detox) the solution, we lose our ability to deal with the nuances of how we use technology and how it is designed: I’m no stranger to apps that help me curb my screen time, and I’ll admit I’ve often felt better for using them. But on a more communal level, I suspect that cultures of digital detox — in suggesting that the online world is inherently corrupting and cannot be improved — discourage us from seeking alternative models for what the internet could look like. I don’t want to be trapped in cycles of connection and disconnection, deleting my social media profiles for weeks at a time, feeling calmer but isolated, re-downloading them, feeling worse but connected again. For as long as we keep dumping our hopes into the conceptual pit of “the offline world,” those hopes will cease to exist as forces that might generate change in the worlds we actually live in together. So in this chapter, we will not consider internet-based social media as inherently toxic or beneficial for mental health. We will be looking for more nuance and where things go well, where they do not, and why.
Digital detox can be a great way to recover from past trauma and difficulties experienced through social media. I have personally tried this several times over the past few years, where I would take a 2 days break from using any and all social media platforms, including even YouTube. I have also been able to connect this feeling back to the idea of escaping modern life and going into the wilderness to mentally recover and take a break. I have personally experienced that though this may be a solution in the short term, this is not a permanent solution.
“If [social media] was just bad, I’d just tell all the kids to throw their phone in the ocean, and it’d be really easy. The problem is it - we are hyper-connected, and we’re lonely. We’re overstimulated, and we’re numb. We’re expressing our self, and we’re objectifying ourselves. So I think it just sort of widens and deepens the experiences of what kids are going through. But in regards to social anxiety, social anxiety - there’s a part of social anxiety I think that feels like you’re a little bit disassociated from yourself. And it’s sort of like you’re in a situation, but you’re also floating above yourself, watching yourself in that situation, judging it. And social media literally is that. You know, it forces kids to not just live their experience but be nostalgic for their experience while they’re living it, watch people watch them, watch people watch them watch them. My sort of impulse is like when the 13 year olds of today grow up to be social scientists, I’ll be very curious to hear what they have to say about it. But until then, it just feels like we just need to gather the data.”
This captures the paradox of social media about how it simultaneously connects and isolates users, amplifying emotional extremes. It’s especially compelling in linking social anxiety to self-surveillance.
“If [social media] was just bad, I’d just tell all the kids to throw their phone in the ocean, and it’d be really easy. The problem is it - we are hyper-connected, and we’re lonely. We’re overstimulated, and we’re numb. We’re expressing our self, and we’re objectifying ourselves. So I think it just sort of widens and deepens the experiences of what kids are going through. But in regards to social anxiety, social anxiety - there’s a part of social anxiety I think that feels like you’re a little bit disassociated from yourself. And it’s sort of like you’re in a situation, but you’re also floating above yourself, watching yourself in that situation, judging it. And social media literally is that. You know, it forces kids to not just live their experience but be nostalgic for their experience while they’re living it, watch people watch them, watch people watch them watch them. My sort of impulse is like when the 13 year olds of today grow up to be social scientists, I’ll be very curious to hear what they have to say about it. But until then, it just feels like we just need to gather the data.
I agree with this. I do believe that social media is making people more antisocial and causing more social anxiety to the people who are really on it. Like using it as their many source of friendship, I think is bad. I think you need to have friends in real life that you can interact with face to face. What he describes in the later part of the quote seems to me like depersonalization and not social anxiety, though. I haved dealt with some form of depersonalization, and it isn't fun at all.
Review nap schedules
This is not helpful enough, mention what the recommendation is (Nap length should not exceed x hours and wake windows can be healthily increased by x). This could be offered via a premium subscription but free users should be able to see what the premium version could offer.
WHO
Don’t cítate source here unless relevant for all regions, instead say “common” (Avoid terms like normal). If we have to cite, then use the source name entirely (world health organization)
Paris: A Poem
Since you can't use italics, put the work's title in quotation marks.
Beautiful use of paintings to set the scene. Where can I find the artists, titles, etc. for these paintings?
u Carrousel."
I love how you've found so many archival photos and postcards. The images pull me back in time, while the map locates me in specific locations.
Is this your typo or how "carrousel" is spelled in the poem?
holophrase NORD-SUDZIG-ZAG LION NOIR CACAO BLOOKER…RUE DU BAC (DUBONNET)"
Is the image above this quotation one of the slogans she cites? I can't tell!
Paris, May 1919, during the Paris Peace Conference and amidst the wake of World War 1.
Good way to evoke historical and geographic coordinates simultaneously.
It lives on now recovered and revitalized.
Are you referring to your own work? Or to the digital version of the poem that precedes it? This might be a good place to introduce the digital version and link to it, inviting readers to read the poem in full before returning to take the geographic journey with you.
I love the painting in the background, btw, which makes me feel like I'm about to zoom in and become one of those figures in the Paris park!
Scholarship has mostly
Can you include a parenthetical with the names of some of these scholars?
The Quiet Cult of the Olympia Report deLuxe Electric Typewriter<br /> by [[Wilson Rothman]] and [[Steven Levy]]<br /> accessed on 2026-05-11T13:13:15
slow violence is experienced not only through the damage of the rivers, but through the damage of communities as well
Rob Nixon, Slow Violence and the Environmentalism of the Poor (Cambridge, MA: Harvard University Press, 2011); Nick Estes, Our History Is the Future (London: Verso, 2019).
unequal treatment of communities
Rob Nixon, Slow Violence and the Environmentalism of the Poor (Cambridge, MA: Harvard University Press, 2011).
groups compete for access to a limited resource
Daniel Connell and R. Quentin Grafton, “Water Reform in the Murray–Darling Basin,” Water Resources Research 47, no. 12 (2011): W00G03, https://doi.org/10.1029/2010WR009820 .
physical deprivation, but also of dispossession
Nick Estes, Our History Is the Future (London: Verso, 2019).
Indigenous communities are marginalized within water governance systems
Murray–Darling Basin Authority, “First Nations Cultural Flows,” Murray–Darling Basin Authority (accessed May 8, 2026).
the struggle over water is a double-edged sword
Nick Estes, Our History Is the Future (London: Verso, 2019).
water is deeply connected to land and the sovereignty of said land
Nick Estes, Our History Is the Future (London: Verso, 2019).
limited access for specific populations
Australian National University Institute for Climate, Energy & Disaster Solutions, “$13 Billion, 30-Year Flop: Landmark Study Reveals Stark Failure to Halt Murray–Darling Basin Decline,” Australian National University (accessed May 8, 2026).
water insecurity can result in unsafe drinking water
Australian National University Institute for Climate, Energy & Disaster Solutions, “$13 Billion, 30-Year Flop: Landmark Study Reveals Stark Failure to Halt Murray–Darling Basin Decline,” Australian National University (accessed May 8, 2026).
policy implementation and uneven enforcement
Daniel Connell and R. Quentin Grafton, “Water Reform in the Murray–Darling Basin,” Water Resources Research 47, no. 12 (2011): W00G03, https://doi.org/10.1029/2010WR009820 .
manage ecological harm bureaucratically
Rob Nixon, Slow Violence and the Environmentalism of the Poor (Cambridge, MA: Harvard University Press, 2011).
ordinary systems of governance and regulation
Rob Nixon, Slow Violence and the Environmentalism of the Poor (Cambridge, MA: Harvard University Press, 2011).
systems that continue to permit ongoing damage
Daniel Connell and R. Quentin Grafton, “Water Reform in the Murray–Darling Basin,” Water Resources Research 47, no. 12 (2011): W00G03, https://doi.org/10.1029/2010WR009820 .
extraction levels have a direct effect on ecological outcomes
Murray–Darling Basin Authority, “Water Quality Threats,” Murray–Darling Basin Authority (accessed May 8, 2026).
water management systems play a role in the deterioration of river health
Murray–Darling Basin Authority, “Water Quality Threats,” Murray–Darling Basin Authority (accessed May 8, 2026).
communities suffer slowly and are destabilized over time
Rob Nixon, Slow Violence and the Environmentalism of the Poor (Cambridge, MA: Harvard University Press, 2011).
hardships are accumulated over time
Rob Nixon, Slow Violence and the Environmentalism of the Poor (Cambridge, MA: Harvard University Press, 2011).
uneven distribution of water scarcity
Rob Nixon, Slow Violence and the Environmentalism of the Poor (Cambridge, MA: Harvard University Press, 2011).
reduction of agricultural productivity
Commonwealth Scientific and Industrial Research Organisation, “Murray–Darling Basin Sustainable Yields Project,” CSIRO (accessed May 8, 2026).
declining river conditions
Commonwealth Scientific and Industrial Research Organisation, “Murray–Darling Basin Sustainable Yields Project,” CSIRO (accessed May 8, 2026).
gradual erosion of livelihoods and social stability
Rob Nixon, Slow Violence and the Environmentalism of the Poor (Cambridge, MA: Harvard University Press, 2011).
slow violence
Rob Nixon, Slow Violence and the Environmentalism of the Poor (Cambridge, MA: Harvard University Press, 2011).
water extraction in the Murray-Darling Basin
Daniel Connell and R. Quentin Grafton, “Water Reform in the Murray–Darling Basin,” Water Resources Research 47, no. 12 (2011): W00G03, https://doi.org/10.1029/2010WR009820 .
large-scale extraction persists
L. Holland et al., “Threats to Food Production and Water Quality in the Murray–Darling Basin,” Ecosystem Services 12 (2015), https://doi.org/10.1016/j.ecoser.2015.02.008 .
continued over-extraction due to weak enforcement
UNSW Newsroom, “Excessive Water Extraction—Not Climate Change—Most to Blame for Decline of Darling River Flows,” October 26, 2022, UNSW Newsroom .
Allocation systems are intended to promote efficiency and sustainability
Daniel Connell and R. Quentin Grafton, “Water Reform in the Murray–Darling Basin,” Water Resources Research 47, no. 12 (2011): W00G03, https://doi.org/10.1029/2010WR009820 .
government policies that determine under what conditions extraction is permitted
Daniel Connell and R. Quentin Grafton, “Water Reform in the Murray–Darling Basin,” Water Resources Research 47, no. 12 (2011): W00G03, https://doi.org/10.1029/2010WR009820 .
long-term intensive water use
L. Holland et al., “Threats to Food Production and Water Quality in the Murray–Darling Basin,” Ecosystem Services 12 (2015), https://doi.org/10.1016/j.ecoser.2015.02.008 .
highly organized system
Daniel Connell and R. Quentin Grafton, “Water Reform in the Murray–Darling Basin,” Water Resources Research 47, no. 12 (2011): W00G03, https://doi.org/10.1029/2010WR009820 .
transport and control large volumes of water
Mike Bowers, “Water Pumps to a Cotton Farm in the Murray-Darling Basin,” photograph, in Anne Davies, “Barwon-Darling River Ecosystem on Path to Collapse, Review Warns,” The Guardian, July 23, 2019, The Guardian .
industrial capacity for water extraction
Mike Bowers, “Water Pumps to a Cotton Farm in the Murray-Darling Basin,” photograph, in Anne Davies, “Barwon-Darling River Ecosystem on Path to Collapse, Review Warns,” The Guardian, July 23, 2019, The Guardian .
practical outcomes showed to be uneven
Daniel Connell and R. Quentin Grafton, “Water Reform in the Murray–Darling Basin,” Water Resources Research 47, no. 12 (2011): W00G03, https://doi.org/10.1029/2010WR009820 .
sustainable water diversion limits
Murray–Darling Basin Authority, “Water Act,” Murray–Darling Basin Authority (accessed May 8, 2026).
system-wide framework for coordinating water management
Murray–Darling Basin Authority, “Water Act,” Murray–Darling Basin Authority (accessed May 8, 2026).
established the Murray-Darling Basin Authority
Murray–Darling Basin Authority, “Water Act,” Murray–Darling Basin Authority (accessed May 8, 2026).
Water Act of 2007
Murray–Darling Basin Authority, “Water Act,” Murray–Darling Basin Authority (accessed May 8, 2026).
limit the effectiveness of policies
Daniel Connell and R. Quentin Grafton, “Water Reform in the Murray–Darling Basin,” Water Resources Research 47, no. 12 (2011): W00G03, https://doi.org/10.1029/2010WR009820 .
water governance in the Murray-Darling Basin is hindered by competing interests
Daniel Connell and R. Quentin Grafton, “Water Reform in the Murray–Darling Basin,” Water Resources Research 47, no. 12 (2011): W00G03, https://doi.org/10.1029/2010WR009820 .
coordination between a multitude of regulatory systems
Daniel Connell and R. Quentin Grafton, “Water Reform in the Murray–Darling Basin,” Water Resources Research 47, no. 12 (2011): W00G03, https://doi.org/10.1029/2010WR009820 .
New South Wales, Victoria, Queensland, and South Australia
Murray–Darling Basin Authority, “River Murray Operations,” Murray–Darling Basin Authority (accessed May 8, 2026).
operate across state lines
Murray–Darling Basin Authority, “River Murray Operations,” Murray–Darling Basin Authority (accessed May 8, 2026).
coordinate policies despite having different priorities and conditions
Daniel Connell and R. Quentin Grafton, “Water Reform in the Murray–Darling Basin,” Water Resources Research 47, no. 12 (2011): W00G03, https://doi.org/10.1029/2010WR009820 .
vast geographic extent across southeastern Australia
Murray–Darling Basin Authority, “River Murray Operations,” Murray–Darling Basin Authority (accessed May 8, 2026).
how water is accessed and distributed
Daniel Connell and R. Quentin Grafton, “Water Reform in the Murray–Darling Basin,” Water Resources Research 47, no. 12 (2011): W00G03, https://doi.org/10.1029/2010WR009820 .
environmental degradation in the Murray-Darling Basin
Daniel Connell and R. Quentin Grafton, “Water Reform in the Murray–Darling Basin,” Water Resources Research 47, no. 12 (2011): W00G03, https://doi.org/10.1029/2010WR009820 .
David Berman on Sustainable Design Thinking StrategyTap to unmute2xDavid Berman on Sustainable Design Thinking Strategydavidbermancom 973 views 11 years agoSearchCopy linkInfoShoppingIf playback doesn't begin shortly, try restarting your device.Pull up for precise seekingFull screen15:42•You're signed outVideos you watch may be added to the TV's watch history and influence TV recommendations. To avoid this, cancel and sign in to YouTube on your computer.CancelConfirmUp nextLiveUpcomingCancelPlay NowI have this medicine.ShareInclude playlistAn error occurred while retrieving sharing information. Please try again later.3:033:31 / 49:15Live•Watch full video••34:42Design Thinking workshop with Justin Ferrell of Stanford d. School at The Irish TimesJohnny Ryan372K views • 12 years agoLivePlaylist ()Mix (50+)47:20Current Work: Michael BierutThe Architectural League8.6K views • 9 years agoLivePlaylist ()Mix (50+)lofi hip hop radio 📚 beats to relax/study toLofi Girl26K watching • 3 years agoLivePlaylist ()Mix (50+)39:16Michael Bierut on how to think like a designerDesign Indaba379K views • 9 years agoLivePlaylist ()Mix (50+)25:215 steps to designing the life you want | Bill Burnett | TEDxStanfordTEDx Talks11M views • 8 years agoLivePlaylist ()Mix (50+)1:11:37Learn Copywriting in 76 Minutes – Harry DryDavid Perell831K views • 1 year agoLivePlaylist ()Mix (50+)37:35Clara Mattei: capitalism is not natural - it’s enforcedChannel 4 News977K views • 2 months agoLivePlaylist ()Mix (50+)22:17The Shadow Docket: Last Week Tonight with John Oliver (HBO)LastWeekTonight891K views • 13 hours agoLivePlaylist ()Mix (50+)32:32The Strange Math That Predicts (Almost) AnythingVeritasium11M views • 9 months agoLivePlaylist ()Mix (50+)20:50The Power of Vulnerability | Brené Brown | TEDTED24M views • 15 years agoLivePlaylist ()Mix (50+)42:56Seth Godin – Leadership vs. Management - What it means to make a differenceNordic Business Forum2M views • 4 years agoLivePlaylist ()Mix (50+)35:50Understand & Improve Memory Using Science-Based Tools | Huberman Lab EssentialsAndrew Huberman124K views • 3 weeks agoLivePlaylist ()Mix (50+)1x David Berman on Sustainable Design Thinking Strategy
We are all Designers because we need to find a way to communicate to others and solve our everyday problems. For example, at the beginning of the video we saw two humans who were sitting on the street and displaying their signs that they designed. One sign was asking for money, which was a solution to the problem of needing money.
Designer David Berman tells us how influential designers and advertisers really are. They design what we purchase, what we believe is important, even how we think! He discusses how persuasive advertisements have become and how they manipulate us into thinking we need something that we don’t. Berman suggests designers should be applying their talent toward creating ideas that will help our planet, not just help companies sell more product.
My favorite part of the video was when Berman discusses the “Ecofont”. This font is designed with tiny holes punched through each letter. To the human eye you can barely notice the holes, but it saves you ink! This was one of my favorite parts because it shows that even small changes can have a huge impact. Also the holes are so small you would never notice them when reading.
This entire video was interesting, it was a more holistic view on user experience rather than a focus on digital user design. while much of the video spoke on physical design it is interesting to think about how this could apply to the digital world, especially when thinking about accessibility. perhaps one of the most prominent examples i can think of regarding accessibility in the digital word, is the rule to minimize text in images in many digital applications. its somethings small but it may have large impacts for minorities with disabilities by ensuring things like screen readers are always available.
what are some example of accessibility in real life you can think of? what about some examples from the digital world?
any neglected accessibility you can think of? in other words are there any disabilities that are often overlooked by many modern designers?
1)Classic colors help people recognize actions because of how our brains connect meaning with them, red means stop/danger, while green signals go or accessibility. For those who are color blind, design details like shapes on these traffic lights lights help communicate the same message. Small subtle design detail, but make everyday much more accessible and beneficial to all.
2) Extreme events around the world make headlines. Events like one from September 2011 can lead to conspiracy theories because people struggle to understand the psychology a behind what happened, especially when they feel the full story is not clearly explained in the media. Example, a situation like the permanent evacuation of Carnet Island and designers and problem solvers to think deeply about how society can respond more effectively for the people.
the only interesting thing was the part about Kangaroos not producing methane. i remember nothing else.
In this video, David Berman talks about how designers have a responsibility for how their designs affect the world (good or bad). He explains the pillars of design (profit, planet, people) and why each of them are important. One part that I found interesting was how gas from cows affects the environment, and how people could reduce this issue greatly by eating kangaroos instead, yet this hasn't been done yet. I think this relates to how humans are biased and are more likely to do familiar things. I also think that people could be swayed to do something different when given a compelling reason to.
Around the 8 minute mark when he was talking about how to help the tigers is a moment that stood out to me. This moment during the video is a interesting way he talks about the sustainability of tigers and keeping them around longer. Another interesting thing that was brought up was the design strategy involved in attempting to create a habitat for the tigers by working with the monks to do it. similar to the design talked about earlier as it is a universal thing that applies to any problem that requires some form of solution, there will always be a design involved whether knowingly or not to help solve the problem at hand.
David Berman on Sustainable Design Thinking StrategyTap to unmute2xDavid Berman on Sustainable Design Thinking Strategydavidbermancom 973 views 11 years agoSearchCopy linkInfoShoppingIf playback doesn't begin shortly, try restarting your device.Pull up for precise seekingTheater mode33:07•Up nextLiveUpcomingCancelPlay NowYou're signed outVideos you watch may be added to the TV's watch history and influence TV recommendations. To avoid this, cancel and sign in to YouTube on your computer.CancelConfirmWe're both blessed with wood.ShareInclude playlistAn error occurred while retrieving sharing information. Please try again later.0:160:16 / 49:15Live•Watch full video••lofi hip hop radio 📚 beats to relax/study toLofi Girl26K watching • 3y agoLivePlaylist ()Mix (50+)Tranquil Jazz Lakeside Ambience For Deep Relaxing | Soft Jazz Music In Outdoor Coffee Shop To FocusQuiet Jazz Ambience596 watching • 5mo agoLivePlaylist ()Mix (50+)42:56Seth Godin – Leadership vs. Management - What it means to make a differenceNordic Business Forum2M • 4y agoLivePlaylist ()Mix (50+)15:25The surprising habits of original thinkers | Adam Grant | TEDTED11M • 10y agoLivePlaylist ()Mix (50+)1:22:49What is Branding? A deep dive with Marty NeumeierThe Futur704K • Streamed 6y agoLivePlaylist ()Mix (50+)1:44:41AP Psychology: Everything You Need To Know! (Units 0-5 Summarized)Mr. Sinn55K • 2d agoLivePlaylist ()Mix (50+)29:58Energy Policy | Lunch Money with Paul Krugman and Heather Cox RichardsonHeather Cox Richardson and Paul Krugman885K • Streamed 2mo agoLivePlaylist ()Mix (50+)21:13Will Australia's social media ban for under-16s work? - The Global Story podcast, BBC World ServiceBBC World Service1.2M • 1y agoLivePlaylist ()Mix (50+)37:35Clara Mattei: capitalism is not natural - it’s enforcedChannel 4 News977K • 2mo agoLivePlaylist ()Mix (50+)3:45:35NON-STOP - FULL EPISODES - +4 Hours - The Beginners BibleThe Beginners Bible19M • 7y agoLivePlaylist ()Mix (50+)23:02Truck drivers must take commercial driver's license test in English, Duffy announcesLiveNOW from FOX209K • 2mo agoLivePlaylist ()Mix (50+)1:00:13Gradient Liquid Red Shapes Background video | Footage | ScreensaverMG1010358K • 5y agoLivePlaylist ()Mix (50+)1x David Berman on Sustainable Design Thinking Strategy
David Berman explains how inclusive and accessible design can help people with disabilities feel more comfortable and included in everyday life. He shows that good design is not only about appearance, but also about making products and environments easier for everyone to use and understand.
David Berman's quadruple bottom line
I like the constant comparison of the older more "outdated" technology being used as examples for design. I can see many of these design issues still present today and have seen more and more attempts to tackle them. For example, as discussed, the sip and puff device used to navigate a computer having a more modern untested device in the neural link, is a testament on how design challenges are still somewhat unsolved or have multiple more solutions that have yet to be discovered.
Berman is basically telling us that we’ve been the "useful idiots" for big corporations for way too long. He’s calling out designers for being professional liars who spend all day making shiny "buy now" buttons for stuff that’s just going to end up in a landfill. It’s a bit of a slap in the face because he’s saying our talent is actually a weapon, and right now, we’re pointing it at the planet. His whole "Do Good" thing is really just a challenge to stop selling out and use that same psychological manipulation to actually fix something for once. It’s definitely more of a "stop being a jerk" manifesto than a boring business strategy.
David Berman is a very interesting speaker. There were several facts he mentioned that I did not know before watching this. This included the quadruple bottom line. There is more to designing than profit. It is important to think about environmental, social, and sustainability. My favorite fact was there are so many little things that can be redisgned to make it more effective, like the eco font ink. When designing, you have to think about everyone with disabilities. Like the traffic lights with different shapes, there are possible solutions to satisfy everybody.
David Berman on Sustainable Design Thinking Strategy
Two facts I learned from the video are that
1) there was an initiative proposed of eating kangaroos instead of cows in order to reduce methane gas emissions
2) 10% of Norwegians are colorblind.
Group B(2026 summer): 1. I was previously unaware of the 4 bottom line design pattern. Financial, Environmental, social and cultural make a lot of sense because those 4 factors already guide our everyday lives.
David Berman on Sustainable Design Thinking Strategy
Two facts from the video are that only about 30% of the world’s population had internet access at the time the speaker referenced, showing the scale of the digital divide, and that approximately 80% of the tiger population had disappeared within the speaker’s lifetime due largely to habitat loss. These points emphasized both global inequality and environmental sustainability.
n
What I liked about the video that talked was about how our designs can impact multiple groups of people. Namely such as the stop lights design and color can change traffic accidents. Initially what you designed for the major population can exclude the minority.
We should also think about how our design can be creative enough to relate to majority of problems that people are having. This allows us to aggregate the solution for most people.
reduction of river flows and the stress of ecosystems
L. Holland et al., “Threats to Food Production and Water Quality in the Murray–Darling Basin,” Ecosystem Services 12 (2015), https://doi.org/10.1016/j.ecoser.2015.02.008 .
high levels of extraction
UNSW Newsroom, “Excessive Water Extraction—Not Climate Change—Most to Blame for Decline of Darling River Flows,” October 26, 2022, UNSW Newsroom.
sustained use of water resources
“Big Irrigators Take 86% of Water from Barwon-Darling, Report Finds,” The Guardian, August 21, 2019, The Guardian .
rainfall records demonstrate the variability is a consistent feature of the region’s climate
Bureau of Meteorology, “Australian Climate Variability & Change: Time Series Graphs—Rainfall Trends in the Murray–Darling Basin,” graph, Bureau of Meteorology (accessed May 8, 2026).
water extraction exceeds sustainable limits
L. Holland et al., “Threats to Food Production and Water Quality in the Murray–Darling Basin,” Ecosystem Services 12 (2015), https://doi.org/10.1016/j.ecoser.2015.02.008 .
extraction practices are a central driver
L. Holland et al., “Threats to Food Production and Water Quality in the Murray–Darling Basin,” Ecosystem Services 12 (2015), https://doi.org/10.1016/j.ecoser.2015.02.008 .
long-term decline
UNSW Newsroom, “Excessive Water Extraction—Not Climate Change—Most to Blame for Decline of Darling River Flows,” October 26, 2022, UNSW Newsroom .
ongoing ecological consequences including increased vulnerability of river systems during drought conditions
UNSW Newsroom, “Excessive Water Extraction—Not Climate Change—Most to Blame for Decline of Darling River Flows,” October 26, 2022, UNSW Newsroom .
reduces the resilience of river systems
L. Holland et al., “Threats to Food Production and Water Quality in the Murray–Darling Basin,” Ecosystem Services 12 (2015), https://doi.org/10.1016/j.ecoser.2015.02.008 .
unsustainable water use
L. Holland et al., “Threats to Food Production and Water Quality in the Murray–Darling Basin,” Ecosystem Services 12 (2015), https://doi.org/10.1016/j.ecoser.2015.02.008 .
central driver of environmental degradation in the basin
L. Holland et al., “Threats to Food Production and Water Quality in the Murray–Darling Basin,” Ecosystem Services 12 (2015), https://doi.org/10.1016/j.ecoser.2015.02.008 .
intensity of irrigation practices
Daniel Connell and R. Quentin Grafton, “Water Reform in the Murray–Darling Basin,” Water Resources Research 47, no. 12 (2011): W00G03, https://doi.org/10.1029/2010WR009820 .
major irrigators as a substantial majority
“Big Irrigators Take 86% of Water from Barwon-Darling, Report Finds,” The Guardian, August 21, 2019, The Guardian .
Large-scale agricultural operations dominate water consumption
“Big Irrigators Take 86% of Water from Barwon-Darling, Report Finds,” The Guardian, August 21, 2019, The Guardian .
declining river flows and scarcity of water
Daniel Connell and R. Quentin Grafton, “Water Reform in the Murray–Darling Basin,” Water Resources Research 47, no. 12 (2011): W00G03, https://doi.org/10.1029/2010WR009820 .
the 2018 and 2019 years
Bureau of Meteorology, “Australian Climate Variability & Change: Time Series Graphs—Rainfall Trends in the Murray–Darling Basin,” graph, Bureau of Meteorology (accessed May 8, 2026).
continuous variability
Bureau of Meteorology, “Australian Climate Variability & Change: Time Series Graphs—Rainfall Trends in the Murray–Darling Basin,” graph, Bureau of Meteorology (accessed May 8, 2026).
Long-term climate data
Bureau of Meteorology, “Australian Climate Variability & Change: Time Series Graphs—Rainfall Trends in the Murray–Darling Basin,” graph, Bureau of Meteorology (accessed May 8, 2026).
climate variability and intensive water extraction
Daniel Connell and R. Quentin Grafton, “Water Reform in the Murray–Darling Basin,” Water Resources Research 47, no. 12 (2011): W00G03, https://doi.org/10.1029/2010WR009820 .
scientific and ecological research demonstrates that they are not capable of fully accounting for the severity
L. Holland et al., “Threats to Food Production and Water Quality in the Murray–Darling Basin,” Ecosystem Services 12 (2015), https://doi.org/10.1016/j.ecoser.2015.02.008 .
long-term fluctuations in rainfall conditions
Bureau of Meteorology, “Australian Climate Variability & Change: Time Series Graphs—Rainfall Trends in the Murray–Darling Basin,” graph, Bureau of Meteorology (accessed May 8, 2026).
natural variability in climate
Bureau of Meteorology, “Australian Climate Variability & Change: Time Series Graphs—Rainfall Trends in the Murray–Darling Basin,” graph, Bureau of Meteorology (accessed May 8, 2026).
Gallery
I love your interactive exhibits, and wonder what would happen if you intermixed them with your more formal essay writing? Also, Leah Duncan can show you a way to make the music play automatically with scroll, if that's something you would want.
While the angel in Love Pampered by the Beautiful Ladies also has a mysterious identity rooted in classical mythology, the autonomy a viewer has in their interpretation is far more extreme in Drift of Chaos II (Hermes).
Your analysis of Drift of Chaos II is so richly detailed that I quite long for the scrollyteller format so I can see the image side by side with your analysis!
In the end, both the poem and the painting suggest the variety of experiences had in city life.
Marvelous job linking the poems to the paintings. The inside/outside motif is rampant in her early poetry and tied to gender motifs in "Three Moments in Paris" and in "The Effectual Marriage," too.
It's a bit confusing when you cite "Three Moments" but then quote the poem "Parturition," which I don't think is part of the triptych, is it? Considering moving the passage from Parturition up to just after the paragraph where you discuss it. Or use Three Moments, instead of Parturtition to illustrate both the inside/outside motif and the multiple speakers approach.
The identity of Love as a mythical figure is clear based on the painting’s titles and Love’s wings–so then, does the ambiguity instead refer to the androgyny of Love?
Excellent question: I want to read your answer!
In all, the intersection of these styles in Loy’s painting reveals the nature of her education and engagement with broader art movements since early on, though a closer analysis of the painted subject matter best illuminates Loy’s individualized touch.
Here, you articulate a key point that seems essential to your original contribution to Loy studies. In some ways you're returning us to Conover's original insight about how she defies categorization by showing how she applies this individual touch to her paintings.
While these scholars make meaningful contributions to the discussion of Loy as a visual artist amongst broader movements, they risk the categorization of Loy's art that Conover argued she resisted.
For some reason, Hypothesis isn't allowing me to making line item comments.
Here are a few small suggestions for your lucid, perceptive, beautifully written essay.
Since you cite our website so often, it feels like it falsely gives me credit for work that is collaborative or by other authors. It might be better to use the parenthetical (mina-loy.com) and/or cite the author of the particular page or item you're citing on that project. For example, you might use (Rosenbaum) for her chapters on Surrealism, and treat the citation as a chapter in an edited collection, where the author of the chapter is cited, and the edition info is secondary.
"Regardless, more work needs to be done" seems like a sentence that could be applied to almost any artist, and certainly any woman artist. Can you point to some more specific issue that needs attention? Such a move would foreground your contribution and whet our appetites prior to the lit review that follows.
Excellent, concise, confident, and illuminating lit review. It may be a bit unfair to charge Rosenbaum with categorizing Loy's work as Surrealist, since she's specifically looking at work Loy created when actively participating as artist, writer, and agent in Surrealist artistic activities AND she argues that Loy was critiquing Surrealism as much as participating, adopting en dehors garde strategies of engagement and resistance.
Instead, I analyze the artwork produced during Loy’s Paris years with an art historical lens. This is a crucial scope, as Loy studied art in Paris early on in her practice, and then later returned for an extended period comparable to that of New York. In turn, one can understand her better as an independent modernist artist through the identification of consistent interests and a formal evolution in her practice, opening up the possibility of a more nuanced understanding of Loy’s relationship to art movements and her later assemblages.
Fine job summarizing how your method differs from those before you, but I think you can sharpenn the articulation of what insight(s) your method will provide: what key nuances will your method reveal?
Regardless, more work needs to be done.
seems like a sentence that could be applied to almost any artist, and certainly any woman artist. Can you point to some more specific issue that needs attention? Such a move would foreground your contribution and whet our appetites prior to the lit review that follows.
(Churchill 335).
In these annotations, I offer a few small suggestions for your lucid, perceptive, beautifully written essay.
Since you cite our website here and elsewhere so often, it feels like it falsely gives me credit for individual work that is collaborative or by other authors. It might be better to use the parenthetical (mina-loy.com) and/or cite the author of the particular page or item you're citing on that project. For example, you might use (Rosenbaum) for her chapters on Surrealism, and treat the citation as a chapter in an edited collection, where the author of the chapter is cited, and the edition info is secondary.
government systems play in shaping the utilization of water in this region
Daniel Connell and R. Quentin Grafton, “Water Reform in the Murray–Darling Basin,” Water Resources Research 47, no. 12 (2011): W00G03, https://doi.org/10.1029/2010WR009820 .
climate variability
Bureau of Meteorology, “Rainfall Trends in the Murray–Darling Basin.”
by water scarcity and environmental decline
Daniel Connell and R. Quentin Grafton, “Water Reform in the Murray–Darling Basin,” Water Resources Research 47, no. 12 (2011): W00G03, https://doi.org/10.1029/2010WR009820 .
unevenly distributed across populations
Nick Estes, Our History Is the Future (London: Verso, 2019).
settler colonialism and the dispossession of Indigenous communities
Nick Estes, Our History Is the Future (London: Verso, 2019).
slow violence
Rob Nixon, Slow Violence and the Environmentalism of the Poor (Cambridge, MA: Harvard University Press, 2011).
identifying it to be low levels of oxygen in the water, these being beyond the ability to support respiration of the fish
Australian Academy of Science, Investigation of the Causes of Mass Fish Kills in the Menindee Region NSW over the Summer of 2018–2019 (Canberra: Australian Academy of Science, 2019).
hundreds of thousands of additional fish turned up dead by early January, and just weeks later, millions
Australian Academy of Science, Investigation of the Causes of Mass Fish Kills in the Menindee Region NSW over the Summer of 2018–2019 (Canberra: Australian Academy of Science, 2019).
period of intense drought, when rainfall and reduced flow throughout the river system left sections of these rivers stagnant or moving noticeably less than usual
Bureau of Meteorology, “Australian Climate Variability & Change: Time Series Graphs,” accessed April 14, 2026, https://www.bom.gov.au/cgi-bin/climate/change/timeseries.cgi.
influenced by patterns of water extraction and basin management
Daniel Connell and R. Quentin Grafton, “Water Reform in the Murray–Darling Basin,” Water Resources Research 47, no. 12 (2011): W00G03, https://doi.org/10.1029/2010WR009820.
On December 15th, 2018, tens of thousands of fish were found dead along a 30 kilometer stretch of the river near Menindee, New South Wales
Australian Academy of Science, Investigation of the Causes of Mass Fish Kills in the Menindee Region NSW over the Summer of 2018–2019 (Canberra: Australian Academy of Science, 2019).
One of the ways social media can be beneficial to mental health is in finding community (at least if it is a healthy one, and not toxic like in the last section). For example, if you are bullied at school (and by classmates on some social media platform), you might find a different online community online that supports you. Or take the example of Professor Casey Fiesler finding a community that shared her interests (see also her article [m26]):
It certainly hits close to home for me – I believe the difference between seeking out community versus simply being discovered by an online community is often overlooked. The case provided by Fiesler is particularly relevant since it shows that she was not simply scrolling; instead, she went looking for her own community. This element of agency seems to be crucial for whether or not being in an online community positively impacts mental health. Is it possible that being forced into communities through popular platforms such as TikTok or Instagram Reels may be even less effective for this purpose than old-school forums or niche spaces?
Healthy Activities on Social Media
Something that this chapter doesn't mention is the fitness community. Some can view it as negative but in my opinion, fitness community is beneficial for people and it helps with lots of mental problems too. Some might feel discouraged when comparing with successful people online but this should only encourage them to do better.
So you might find a safe space online to explore part of yourself that isn’t safe in public
Yes, social media can be good for certain reasons like finding a community of people. However, I feel like solely relying on social media to fix an issue like community isn't good. I feel this way because it can make you codependent and addicted to the apps or websites.
One of the ways social media can be beneficial to mental health is in finding community (at least if it is a healthy one, and not toxic like in the last section).
This segment is something many people can relate to and often times, why social media is so addicting. It gives people a sense of community or shared feelings which individuals can be scared to share in person.
‘My feet are at Moorgate, and my heart Under my feet.
Moorgate is a major railway station and heart of London's district, This line specifically wanting to highlight that her feet is at the crowded place while his heart under her feet which means that her emotion had been ignored or cast away
Our values lead the way. <picture class="overview-values-icon-environment icon-card-icon"> <source srcset="/ca/iphone/shared/apple-values/images/icon_environment__cc798mm65eeu_large.png, /ca/iphone/shared/apple-values/images/icon_environment__cc798mm65eeu_large_2x.png 2x" media="(min-width:0px)" /> <img src="/ca/iphone/shared/apple-values/images/icon_environment__cc798mm65eeu_large.png" alt > </picture> A plan as innovative as our products. We’re committed to bringing net emissions to zero across our entire carbon footprint by 2030. Learn more about environment <picture class="overview-values-icon-privacy icon-card-icon"> <source srcset="/ca/iphone/shared/apple-values/images/icon_privacy__ew66fdre292e_large.png, /ca/iphone/shared/apple-values/images/icon_privacy__ew66fdre292e_large_2x.png 2x" media="(min-width:0px)" /> <img src="/ca/iphone/shared/apple-values/images/icon_privacy__ew66fdre292e_large.png" alt > </picture> Privacy. That’s Apple. Privacy is a fundamental human right. Every product and service is designed to help keep your data safe and secure. Learn more about privacy
Apple’s use of consistent card layouts and clear icons is a good practice for understandability because it creates a predictable pattern for users to follow. Grouping information into these visuals allows users to scan the page and find specific topics.
Compare with iPhone 17e
Apple uses straightforward terms like 2x faster and 9 more hours. This is a good practice as it lowers the cognitive load, making the data understandable for users with cognitive disabilities or those who are not as tech savvy.
Get the highlights.
This is an example of good practice. The use of high contrast black text on a clean white background meets WCAG contrast standards, making the content perceivable for users with low vision.
Explore Buy
The "explore" and "buy" buttons are both distinct and large, which is a great example of operable design. There is also a gap between the buttons which prevents a user with tremors from accidentally clicking the wrong one.
using the Hypothesis Chrome Extension.
This section explains the main idea clearly
Sita Sings the Blues
In Ramayana, Rama is always the hero. He is the embodiment of the perfect man. Paley's take on the story recenters this view as she dives deep into the character of Sita. This allows the viewer to dissect what a hero really is. Her bravery and strength makes her a hero, but she isn't celebrated for it. In fact, it seems that life punishes her for it. We see her heroic acts in her decision to follow him into exile, in her resilience during captivity under Ravana, and in the strength it takes to face suspicion from the man she loved to the very end of her life. There is an apparent contradiction in the original tale. Sita must bear the weight of the many hardships she faces without a word while Rama is never really critiqued for throwing her away, even when he knew for a fact that she was completely faultless.
Gender Politics and the Hero in Ancient Literature © 2026 by Elshaddai Tefera is licensed under CC BY-SA 4.0. To view a copy of this license, visit https://creativecommons.org/licenses/by-sa/4.0/
Tea cake hits Janie after he finds out she was to meet with another man.
In what ways have you found social media bad for your mental health and good for your mental health?
Social media has negativley affected my mental health because I often compare my life to other peoples. Even though it is not an sccurate representation and often shows onely good, its hard not to compare myself when seeing others posts. On the other hand, social media has been good for my mental health in terms of my relations with friends. It makes it easy to connect with mutual friends and even meet new people you might now have. For example, I met my UW roomate through instagram and we are friends.
When they moves to the Everglades, they both work with the migrants and have a happy life
Janie is happy in her new relationship, and is in love. They also move to the Everglades
Note: This response was posted by the corresponding author to Review Commons. The content has not been altered except for formatting.
Learn more at Review Commons
Reviewer #1
Major comments: 1) The study focused on regulatory activity in a lung-derived cellular setting and was well executed. However, the degree that non-coding variation in lung elements, particularly alveolar basal epithelial cells, modeled by A549 cells, contributes genetic risk for COVID19 severity is unclear. Especially as non-coding variants in other contexts such as immune cells have been shown to be enriched for disease risk. To strengthen the choice for the A549 cellular context, the authors can assess enrichment for COVID19 severity heritability using stratified LD-score regression (PMID: 26414678) using A549/lung epithelium chromatin data (ATAC-seq, CHIP-seq) to check for enrichment polygenic signal or if the lung associated-risk is focused on a restricted set of genome-wide significant signals.
The reviewer is correct that most analysis of non-coding variants to date has been in immune cells, as is the case for many GWAS studies. However, severe COVID-19 affects many systems, especially the lung alveolar epithelium, and so there is a pressing need for functional genomic studies that go beyond immune cells. We chose A549 due to its lung origin, experimental tractability, and availability of published datasets. While enrichment such as S-LDSC suggested by the reviewer would be a good indication to screen for cell types with enrichment in e.g. open chromatin, many of our STARR-seq hits were found in closed chromatin and so would have been missed by such an analysis. To further emphasize the importance of type II alveolar epithelial cells in severe COVID-19 progression, we added the following to the manuscript: * "Cell death and the innate immune response of type II alveolar epithelial cells, which also function as progenitors for type I epithelial cells, are the main driver of alveolar damage and acute respiratory distress syndrome in coronavirus infection (Bridges et al 2022 PMID 34404754; Qian et al 2013 PMID: 23418343)."*
2) It would strengthen the manuscript to compare the results to prior analyses where overlap exists (eg PMID:36763080). Particularly it would be informative to address if nominated variants for signals have different variants operating in different cell types. Also, one prominent variant, rs17713054, that had previously been nominated to operate in lung through in silico predictions and CRISPR perturbations (PMID:34737427) appears to be non-significant in this STARR-seq analysis. Was a different variant nominated at this locus? Could the authors expand on methodological differences that could explain this difference?
rs17713054 (chr3:45,818,159:G>A) was nominated by Downes et al (2021) based on in silico predictions. While the authors found rs17713054 resides in open chromatin and is a chromatin accessibility (ca)QTL, the variant did not validate in CRISPR perturbations. Deletion of the putative enhancer encompassing rs17713054 across 4 cell lines led to no detectible changes in expression of the predicted target gene LZFTL1. The lack of H3K27ac at the putative enhancer led the authors to conclude that this enhancer is not active in any of the lung epithelial cell lines tested, consistent with our STARR-seq results which suggest that rs17713054 is inactive in A549 cells.
We nominated 6 amVars at the LZFTL1 locus (Table 1) and propose there are multiple functional variants with small effect sizes operating at this locus which together significantly contribute to risk. We have included an additional supplemental figure panel (Fig. S2H) showing a genome browser view of these variants. As suggested by the reviewer, we also compared our results to Jagoda et al. That study only reported allele-specific change and not baseline activity, it is thus possible that very weak signal (below our thresholds) can show up as allele-specific. This appears to be the case for at least one variant (rs35454877) which we call as inactive but nevertheless has a significant allele-specific activity (mpralm padj
3) Given a subset of the prioritized variants originate from the credible set, were the amVars enriched in terms of posterior inclusion probability than the tested set? This technical information could be valuable for interpreting fine-mapping efforts.
We did not observe an enrichment of posterior inclusion probabilities (PIPs) for the amVars or active variants compared to inactive variants. One reason could be that we primarily find variants in weak enhancers with moderate effect sizes which may be too subtle to be attributed a high PIP by GWAS due to insufficient statistical power. It is also possible that variants with a high PIP are active in other cell types. Fine-mapped variant sets already contain variants likely to be functional, so observing no difference between already statistically likely functional variants is perhaps not surprising. Another study testing melanoma risk variants similarly observed no statistically significant differences in PIPs between MPRA functional and non-functional variants (Long et al 2022 PMID: 36423637). We have included a supplemental plot of the PIP scores (Fig. S2G) for inactive, active and amVars and added this analysis in the first results section (see revised manuscript lines 181-186).
4). Similarly, for the eQTL comparisons, what proportion of the amVar/eQTL pairs are directionally consistent (e.g. increased activity/increased expression)?
For the 29 amVars, there are a total of 4689 combined eQTLs across all GTEx tissues. When filtering for lung, there are 180 eQTLs across the 29 amVars, whereby only 17/29 amVars have eQTLs in lung. For 16 of these 17 amVars, there is at least 1 eQTL in lung that is directionally concordant - listed in Table 1. Notably, however, almost all variants which have lung eQTLs with concordant direction also have lung eQTLs with discordant direction, suggesting the effects may be more complicated. When considering all lung eQTLs in GTEx v11, amVars were surprisingly enriched for discordant direction of effect (see figure below, left). However, we noticed this signal was driven entirely by the variants in the H2 haplotype block (as proposed by the reviewer in question 5), which includes many genes with varying effects which may be unrelated to our amVars. When excluding chr17, no enrichment was seen (see figure below, right). There was also no significant correlation between the effect size magnitude of eQTL and STARR-seq. Therefore, globally comparing amVars and eQTLs was not informative per se. We emphasize that we have few amVars (29), which makes subtle correlations/enrichments less likely to be detectable. Siraj et al. (2026) (PMID: 41741648), testing a much larger variant set than ours and in multiple cell lines, observed weak correlation between MPRA allelic effects and eQTL normalized effect size (Spearman;s p = 0.35), although these libraries were selected to include only fine-mapped eQTLs in high PIP, in comparison to our libraries which also include a large number of additional variants in LD. Overall, this suggests eQTL effect size is not a strong predictor for variant effects observed by MPRAs. We have included a discussion about this (see revised manuscript lines 186-190).
5) Several of the variants implicated by STARR-seq, including several of the pairs with non-additive activity were associated with the MAPT locus. This locus has a common 900kb inversion in Europeans (PMID: 15654335), were these variants linked to the same H1/H2 haplotype?
Indeed, all five prioritised variant pairs, as well as 5 amVars and 2 further variant pairs showing STARR-seq activity at this locus (Table 1, Table 2), are linked to the same (H2) haplotype. More specifically, all variants show high LD with the H2 haplotype-tagging SNP rs8070723‐G in European ancestry (r2 > 0.73) and are not linked to one of the H1 haplotype-tagging SNPs (rs242557-A, r2
6) Were the variants with non-additive effects analyzed for transcription factor motifs?
We looked for both motifs (FIMO and motifbreakR) and predictions of contribution scores using Malinois and AlphaGenome in the non-additive combinations, without finding any evidence for synergistic binding/activity. For example, see below the non-additive example in Fig. 3C (rs77819001_rs76667867), where the total activity prediction by Malinois is low (0.10-0.14), and there is no evidence of non-additive contribution scores as expected from the STARR-seq results. Because of the few examples, we cannot determine whether this is due to a systematic inability of the models to predict non-additivity, and therefore we chose not to present them. For transparency, we added the following sentence to the results: "For prioritized, non-additive variants pairs neither model identified an impact on transcription factor motifs that could explain the observed non-additivity. However, the few examples preclude drawing any general conclusions regarding the ability of these models to detect non-additivity."
Minor comments: 1) The sentence in the methods, Variant selection and design section, "the 95% credible set from the second GenOMICC releases containing causal variants to 95% statistical probability," is somewhat unclear. Given that the next sentence describes the 99% credible set, the authors should use more consistent terminology.
For the 3rd release we used the 99% credible set of variants to increase comprehensiveness of our library, meaning the list of variants contains causal variants to 99% statistical probability. In contrast, for the first and second release we used the 95% credible set as is the standard for fine-mapped variants. We clarified the phrasing in the methods as follows: "Fine-mapped severe COVID-19 risk variants encompassing causal variants to 95% statistical probability (95% credible set) from the first and second GenOMICC release2 and a more comprehensive 99% credible set of variants from the third GenOMICC release2 were included in the STARR-seq library."
2) Some text in supplemental figures (Fig S6) is too small to be legible. Please either remove or adjust the figure size.
We removed the variant IDs from figure panels S6A and S6B to aid readability.
Reviewer #2
Major comments: 1). The major conclusion is well supported by the main data presented; but additional clarification and extension in the discussion part may be helpful to determine the potential impacts and application of such conclusions especially related splicing isoform changes regulated by potential functional variants. "OPTIONAL" CRISPR editing for a couple of selected genes/variants will be helpful to confirm effects of these novel pathways.
We thank the reviewer for the positive appraisal.
Regarding splicing isoform changes, rs2297480 lies within the promoter-proximal region of two alternative FDPS isoforms which lack the penultimate exon encoding part of the catalytic domain. Therefore, we propose the variant could increase expression of a non-enzymatically functional FDPS isoform, which may compete with the functional isoform for substrate binding, thereby decreasing overall FDPS enzymatic activity. There are other examples of such "promoter usage" QTLs. We have rephrased this section and included references to studies supporting such a situation at other loci *"While speculative, global analyses have found examples where enhancer/promoter variants are proposed to lead to isoform expression changes (so called promoter usage QTLs), which may have disease implications (PMID 36037215, 30618377)" *
While CRISPR editing could be interesting, it would require extensive additional resources and is outside of the scope of the current manuscript. As a significant proportion of our amVars are not within accessible chromatin nor overlapping active chromatin modifications, we expect these to be functional in a different cell type rather than A549. Identifying a suitable cell line for CRISPR editing would therefore be non-trivial. Furthermore, the small effect size of our hits suggests seeing clear effects of single variants on transcription may be hard, as genes can be controlled by multiple enhancers simultaneously.
Minor comments: 1, please be specific about the proportion here in the text "Similarly, the proportion of active candidate sequences overlapping predicted ENCODE CREs in A549 cells was increased compared to inactive sequences (Fig. S2F)."
We added the specific proportions to the text: "Similarly, the proportion of active candidate sequences (39.3%) overlapping predicted ENCODE CREs in A549 cells was increased compared to inactive sequences (23.2%) (Fig. S2E)."
2, Out of 29 variants showing allele-specific effects, how many of them are close to the known TSS of candidate genes. Is IFNA is the only gene nearby these 29 variants?
rs7041102/rs7040981 reside ~4.5-5.5kb from the TSSs of IFNA10 and IFNA16. More gene-proximal variants include rs2297490, residing within in the first intron of the reference FDPS isoform and in the promoter-proximal region of three further FDPS isoforms (discussed above). In addition, rs145951274 resides in the first intron of HCG27 and rs3130925 in the first intron of the reference MICB isoform and within the promoter region of an alternative MICB isoform. We have added information on the distance to the closest TSS for all 29 amVars in Table 1 and indicated whether the variant is intronic.
3, out of 166 variants, what are genes with TSS closer to the 166 variants. It will be helpful to have a table or list of these genes since their promoter close to the significant variants
Of 166 active variants, 20 are within 1kb of the nearest TSS. Of those, 16 occur in the 1kb upstream or 100bp downstream of the TSS, the other 4 variants are within 1kb downstream. We have added this information as a new column to Supplementary Table 3 now showing the distance to the nearest TSS for all single variants tested, and we have modified figure S2F (previously S2E) which now shows the comparison of TSS proximity for inactive, active, and amVars.
4, Do these 16 combinations of variants pairs have genetic interaction in the population levels, i.e. epistasis?
This is an intriguing point, but challenging to test and beyond the scope of this work. 12/16 variant pairs are in very high or perfect LD (Table 2) and therefore either both risk variants or neither will co-occur in the population. We therefore cannot test if two variants have epistatic (beyond additive) effects in the population, nor can we directly link individual variants to a biological phenotype and therefore test for epistatic effects on phenotypes. We are limited to testing for beyond additive, i.e. epistatic, regulatory effects in the context of the STARR-seq assay, which we show in Fig 3B.
5, It needs more clarification why the risk allele of rs2297480 at the FDPS locus is associated with increased enhancer activity and decreased levels or activity of FDPS?
We have addressed this point under major comment 1 in the context of enhancer/promoter-driven isoform switches as plausible disease mechanism.
To clarify, the rs2297480 risk allele showed increased enhancer activity by STARR-seq. The variant lies within the promoter-proximal region of two alternative FDPS isoforms which lack the penultimate exon encoding part of the catalytic domain. Therefore, we propose the variant could increase expression of a non-enzymatically functional FDPS isoform, thereby decreasing overall FDPS enzymatic activity as the enzymatically inert isoform may compete with the functional isoform for substrate binding. We emphasize that this possible mechanism at FDPS is speculative.
Note: This preprint has been reviewed by subject experts for Review Commons. Content has not been altered except for formatting.
Learn more at Review Commons
Summary
This Manuscript by Dr. Weykopf and Friman et al applied STARR-Seq method to screen and identify function variants that determine the severity of COVID-19 patients in lung epithelial cell lines followed by functional validation. Both additive and non additive effects of various regulatory variants were evaluated. Furthermore machine learning models were applied to interpret allele specific variant effects. This is a pioneering work to identify functional variants on GWAS loci associated with severe COVID-19 with solid methods and modeling. sufficient literatures were cited and discussed. The major limitations were well discussed.
Major comments
The major conclusion is well supported by the main data presented; but additional clarification and extension in the discussion part may be helpful to determine the potential impacts and application of such conclusions especially related splicing isoform changes regulated by potential functional variants. "OPTIONAL" CRISPR editing for a couple of selected genes/variants will be helpful to confirm effects of these novel pathways. .
Minor comments
Note: This preprint has been reviewed by subject experts for Review Commons. Content has not been altered except for formatting.
Learn more at Review Commons
Summary:
To investigate the contribution of non-coding GWAS variants linked to COVID19 severity across individuals, Weykopf and colleagues assayed allelic differences in reporter activity using STARR-seq in the A549 lung epithelial cancer cell line. The authors prioritize 4,894 COVID19 severity associated variants from several GWAS for functional screening. Of these, 166 of the variants designed elements displayed significant enhancer activity, and 29 of these also displayed allele-modulated activity. These results were further contextualized through comparisons with lung-cell relevant chromatin marks. Additionally, a subset of variants in close proximity were analyzed for non-additive effects in the reporter assay. In addition, results were compared results to predictions using deep modeling approaches such as AlphaGenome and Malinois. This approach allows for a systematic characterization of these variants and expands on previous work focused on narrower sets of variants. While well written and results are presented clearly, several additions could help with placing results in context.
Major comments:
Minor comments:
The authors performed a systematic evaluation of COVID19 risk variants in a lung relevant cell line. This study expands the number of variants tested as well as explores them in the lung cellular context. As this study did not filter tested variants allowing for comprehensive integration with chromatin annotations and computational predictions. This provides nominates a short list of lung relevant variants for further investigation. This paper will be of interest to genetics community interested in basic research in COVID19 severity.
conda create -n csi3210 python=3.10 jupyterlab nodejs -y conda activate csi3210
I had a hard time doing this because it did not work in my terminal. I instead had to manually install miniconda via the website in order to run these commands.
When joe dies Janie realizes she still wasn’t in love, she works on herself after the breakup
Janie is not allowed to speak to the townspeople and is very controllled,
She realizes that she isn’t in love and doesn’t like the marriage,
Oral history questions for Richard Polt on typewriter collecting:
Over the years Joe Van Cleave has done a handful of videos on selectivity and downsizing of one's typewriter collection including: <br /> - The Minimal Complete Typewriter Collection https://www.youtube.com/watch?v=0Ej6kd1FsnE <br /> - Culling the Herd https://www.youtube.com/watch?v=h_ueHE3Whjk <br /> - Downsizing Your Typewriter Collection https://www.youtube.com/watch?v=Eic4lNE0l3Y
And Sarah Everett has one "what's your deserted island typewriter?" (if I had to pick 5 typewriters....) https://www.youtube.com/watch?v=PFqJa9kD-v0
All this to ask Richard: what your downsizing experience has been? What were the criteria by which you chose what to keep? Did you more closely focus your collection into an area, era, style, other? Are you primarily keeping the things you tend to use more frequently? Things in better condition? You started out with how many to end up with how many? If you could start your collecting over from scratch what would you change? Are there things you wouldn't get the second time around? Things you would have spent more time focusing on? What will you continue to collect and at what rate? Naturally, collecting is a very personal thing with respect to individual's specific tastes and experiences (and frequently space!), but I suspect answers to some of these may help others, especially those who are just starting into collecting, or who have a dozen or two machines but who might find value on where and how to potentially focus their efforts. It may also help other collectors and their families who are dealing with appropriately disposing of significant collections, especially in cases where a deceased collector was very passionate and the family just wants to be rid of them quickly (i.e. ideas like Swedish death cleaning and related).
I'm sure reflections on these would be an interesting typecast, but if it's easier to do something like an oral history interview, I'm happy to collect these and a few dozen more questions into an interview format if you've got 30-60 minutes in the coming months to devote to a remote audio/video interviews/mini-podcast or YouTube episode or something similar?
“At a moment when public trust in institutions like the C.D.C. is fragile, we cannot afford to lower our standards,” Dr. Bhattacharya wrote in an editorial about news coverage of his decision.
YOU ARE THE REASON WHY PEOPLE DON'T TRUST THE CDC
canceled the publication of a report concluding that the Covid vaccine sharply cut the odds of hospitalizations and emergency room visits last winter, saying the study had limitations.
ALL STUDIES HAVE LIMITATIONS. YOU ADDRESS THEM IN THE FUCKING PAPER
For example, Facebook has a suicide detection algorithm, where they try to intervene if they think a user is suicidal (Inside Facebook’s suicide algorithm: Here’s how the company uses artificial intelligence to predict your mental state from your posts [m30])
This is very intriguing to me because while I knew that sites like Facebook gather a large amount of data, I didn't realize they gathered data on whether or not a user committed suicide. This leads me to believe that they have data on different message patterns that are predictors of whether or not a user would commit suicide. I also wonder how they would track if a user did.
eLife Assessment
This study shows that Znhit1, a regulator of chromatin and of the histone variant H2A.Z, is required for progression through meiotic prophase. It is an important observation that describes the role of epigenetics and gene expression during meiosis. The analysis is based on complementary approaches at the cytological, single-cell, and genomic levels that provide solid evidence for the role of Znhit1 in the control of gene expression and in the loading of H2A.Z in mouse spermatocytes.
Reviewer #1 (Public review):
Summary:
Sun et al. generated germline-specific cKO mice for the Znhit1 gene and examined its effect on male meiosis. The authors found that the loss of Znhit1 affects the transcriptional activation of pachytene. Znhit1 is a subunit of the SRCAP chromatin remodeling complex and a depositor of H2AZ, and in cKO spermatocytes, H2AZ is not deposited into the gene region. The authors claim that this is why the PGA was not activated. These findings provide important insights into the mechanisms of transcriptional regulation during the meiotic prophase.
Strengths:
The authors used samples from their original mouse model, analyzing both the epigenome and the transcriptome in detail using diverse NGS analyses to gain new insights into PGA. The quality of the results appeared excellent.
Comments on revisions:
Sun et al. have responded to each comment with great care and sincerity, and substantial improvements are evident.
In particular, the addition of scRNA-seq data from P35 samples appears to play an important role in supporting the authors' claims.
However, there is still room for improvement in the reanalysis of the data and in the Discussion section.
From the data perspective, for example, the authors state in line 347 of the revised manuscript that "We found that Znhit1-deficient spermatocytes phenocopied abnormal meiotic phenotypes observed in A-MYB mutants." However, the corresponding descriptions in the main text and figure legends are not sufficiently detailed, and therefore do not fully support or substantiate this interpretation. Incorporating a statistical comparison between DEGs in Znhit1-sKO and A-myb KO would likely strengthen this point.
Regarding the overall structure of the Discussion, the connections among delayed DSB repair, MSCI, and PGA regulation via H2A.Z remain somewhat descriptive and difficult to follow. This may reflect a lack of direct evidence linking these processes; however, a more logically structured and clearly articulated Discussion would improve clarity.
Reviewer #2 (Public review):
Summary:
The study demonstrates that Znhit1 regulates male meiosis, with deletion causing pachytene failure associated with defective expression of pachytene genes and subtle effects on X-Y pairing and DSB repair. The authors attribute this phenotype to the defective incorporation of the Znhit1 target H2A.Z into chromatin.
Strengths:
The paper and the figures are well presented and the narrative is clear. Evidence that the conditional deletion strategy removes Znhit1 is strong, with multiple orthogonal approaches used. Most of the meiotic phenotyping is well performed, and the omics analysis clearly identifies a dramatic effect on the meiotic gene expression program. The link to H2A.Z and A-MYB adds a mechanistic angle to the study.
Comments on revisions:
In the revision, the authors have addressed most of my comments. The only incomplete one is comment 1, where I asked them to define the stage of germ cell arrest by histology. I requested this because the stage of arrest they identified is so unique. They didn't do it, and instead used the scRNAseq to show a depletion at the late pachytene stage onwards. I guess it supports their main findings, but it's a bit disappointing.
Author response:
The following is the authors’ response to the original reviews.
Reviewer #1 (Public Review):
Summary:
Sun et al. generated germline-specific cKO mice for the Znhit1 gene and examined its effect on male meiosis. The authors found that the loss of Znhit1 affects the transcriptional activation of pachytene. Znhit1 is a subunit of the SRCAP chromatin remodeling complex and a depositor of H2AZ, and in cKO spermatocytes, H2AZ is not deposited into the gene region. The authors claim that this is why the PGA was not activated. These findings provide important insights into the mechanisms of transcriptional regulation during the meiotic prophase.
Strengths:
The authors used samples from their original mouse model, analyzing both the epigenome and the transcriptome in detail using diverse NGS analyses to gain new insights into PGA. The quality of the results appeared excellent.
Weaknesses:
Overall, the data is inconsistent with the authors' claims and does not support their final conclusions. In addition, the sample used may not be the most suitable for the analysis, but a more suitable sample would dramatically improve the overall quality of the paper.
Thank you for your comprehensive summary of our study and your thoughtful insights into its strengths and weaknesses. We greatly appreciate this valuable feedback, which helps us further improve our work. Below, we provide a detailed response addressing each of the points you raised.
Reviewer #1 (Recommendations For The Authors):
Major revisions:
Surprisingly, many genes were upregulated in the scRNA-seq results. How many XY genes are included? Discuss why many genes are up-regulated in Fig. 5E whereas bulk RNA-seq showed only 70 genes were down-regulated. Since apoptosis-related factors are up-regulated in Fig5E, could these up-regulated genes be due to the high content of the transcriptome of dead cells? As you know, cell death starts, but randomly and violently disrupts the transcriptome, so we think it is not desirable to analyze the transcriptome with dead cells in the mix. Describe this point appropriately in the text or generate new data without dead cells.
We sincerely appreciate the reviewer’s critical points. Below, we address each point sequentially:
(1) To address the question about XY-linked genes, we utilized scRNA-seq data to identify differentially expressed sex chromosome genes in spermatocytes at different stages. Our analysis revealed an aberrant activation of XY-linked genes relative to controls. Specifically, 120 XY-linked genes were aberrantly activated in zygotenestage spermatocytes, and 119 XY-linked genes showed aberrant activation in pachytene-stage spermatocytes (revised Fig. 4F). This observation directly indicates that Znhit1 knockout impairs Meiotic Sex Chromosome Inactivation (MSCI), a finding that aligns with our prior characterization of XY chromosome synapsis defects in Znhit1-deficient spermatocytes.
(2) Two key reasons explain the discrepancy between scRNA-seq and bulk RNA-seq results:
First, scRNA-seq employs a more permissive threshold for identifying DEGs (log2 fold change [log2FC] = 0.25), thereby enhancing sensitivity to subtle expression changes and enabling the detection of more upregulated genes. In contrast, bulk RNAseq uses a stricter threshold (log2FC = 1), which filters out these subtly upregulated transcripts, resulting in fewer DEGs overall.
Second, scRNA-seq can capture cell subset-specific differential expression. In contrast, bulk RNA-seq averages signals across mixed cells, masking such subsetspecific expression changes.
These clarifications have been included in the Data Analysis section of the revised manuscript.
(3) We fully agree with the reviewer’s concern that dead cells could confound transcriptomic analyses. Before downstream analysis, we excluded non-viable cells via stringent QC: cells with mitochondrial RNA (mtRNA) content exceeding 15% were removed, as high mtRNA content is a well-established marker of cell death or compromised viability. To further validate that upregulated genes were not driven by dead cell contamination, we analyzed the correlation between the expression of apoptosis-related genes and mtRNA fractions in our data. This analysis revealed no significant correlation (Pearson correlation coefficient, r = -0.02; please see Author response image 1). These results collectively rule out dead cell transcriptome contamination as the primary cause of the observed gene upregulation.
Author response image 1.
Scatter Chart showing the Pearson correlation between apoptosisrelated genes and mitochondrial RNA fractions in scRNA-seq data.
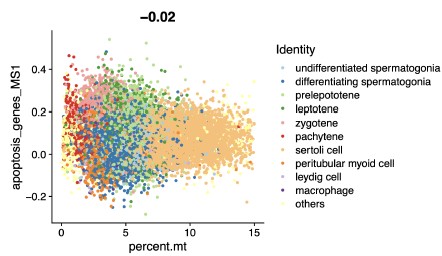
Line 280-286: The data in Figures 7I and J are confusing: as shown by KAS-seq, it is natural that ssDNA is not formed in the promoter region in Znhit1-cKO sample because transcription does not proceed, but why is ssDNA formed in the enhancer region in the first place in control and then lost in Znhit1-cKO sample? Generally, it is said that in the enhancer region, including the super-enhancer region, doublestranded DNA is not dissociated, thus not forming ssDNA. Discuss why the loss of ssDNA in the enhancer region affects transcription with appropriate citations. Also, show whether genes downstream of the missing ssDNA in the promoter region have abnormal transcriptional activity, along with the RNA-seq data. Furthermore, in the region shown in Figure 7I, why the chromatin is even more open, as shown by ATACseq in Znhit1-cKO. Discuss whether this is related to transcriptional progression or aberrant substitution with H2A. If the function of ZNHIT1 is to replace H2A with H2AZ for PGA, it is not necessary to show the H2A level in Znhit1-cKO.
We appreciate the reviewer’s constructive comments.
(1) ssDNA dynamics in enhancer regions: Emerging evidence demonstrates that active enhancers undergo transient DNA unwinding to form ssDNA, a process critical for transcriptional regulation by transcribing enhancer RNAs (eRNA). KAS‑seq is sufficiently sensitive to detect ssDNA in enhancer regions (Kim et al., 2010; Wu et al., 2020). It has been shown that H2A.Z (deposited by the ZNHIT1-SRCAP complex) is required for maintaining enhancer accessibility and dynamic unwinding (Sporrij et al., 2023). In this study, we found that Znhit1 deletion and defective H2A.Z incorporation impaired enhancer ssDNA formation, indicating that ZNHIT-H2A.Z plays an important role in the activity of both promoter and enhancer.
(2) Impact of ssDNA loss on transcription: To address how missing ssDNA affects transcriptional activity, we further analyzed changes in KAS‑seq signals following Znhit1 knockout. Overall, KAS‑seq signals were significantly reduced upon Znhit1 depletion, confirming that Znhit1 is essential for ssDNA formation. Further examination of KAS‑seq signals at promoters of downregulated genes also revealed reduced signals (revised manuscript, Fig. S8). In contrast, KAS-seq signals of upregulated genes remained relatively low and showed no changes in both the control and knockout groups, and their upregulation probably results from indirect regulation. These results underscore the importance of ZNHIT1-mediated chromatin states in regulating ssDNA formation and gene expression.
(3) Aberrant chromatin openness in Znhit1-cKO (ATAC-seq): The increased chromatin accessibility detected by ATAC-seq likely represents a disorganized, nonfunctional state rather than productive transcriptional openness. H2A.Z normally constrains chromatin dynamics to facilitate ordered transcriptional regulation (Cole et al., 2021); its absence in Znhit1-cKO leads to higher ATAC-seq signals, suggesting that this aberrant openness fails to support proper assembly of the transcriptional machinery.
Minor revisions:
Line 106. The text says that they looked for chromatin factors, but the legend says that they looked for epigenetic factors. The text must be consistent.
We have corrected it in the revised manuscript (line 801).
Line 107. Although it is stated that the transcriptional data published here were used, it appears from the cited references that they are scRNA-seq data. A clear explanation is required in the text or legend.
We have revised this data as scRNA-seq data (line 107).
Line 141-143: Using TUNEL analysis in Figure 4F, the authors show that Znhit1cKO testis cells contain many dead cells. Describe the type or stage of the apoptotic cells.
We appreciate the reviewer’s suggestion. Specifically, we performed TUNEL staining on testes isolated from P14 mice, a critical time point for pachytene development (revised Fig. 2D). We tested this by showing that apoptosis-related genes were significantly upregulated in pachytene-stage spermatocytes in scRNA-seq data (revised Fig. 4D). To further validate this observation, we performed scRNA-seq from P35 testis samples. The results revealed a significant reduction in late pachytene-stage spermatocytes in Znhit1-cKO samples (revised Fig. 2F), consistent with apoptotic loss of pachytene cells. Collectively, these data confirm that Znhit1 knockout impairs pachytene-stage spermatocyte development.
The authors claimed that the loss of Znhit1 lowers the transcription of a group of genes involved in homologous recombination, including Rnf212, causing a delay in homologous recombination; however, if the process of homologous recombination is delayed, homologous chromosome pairing and synapsis are affected unless DSB repair is completed. Provide a satisfactory explanation for the fact that DNA damage remains on autosomes despite complete synapsis, as shown in Figure 3C, which is likely not solely due to delayed homologous recombination.
Thank you for this insightful comment. We fully agree that persistent autosomal DNA damage cannot be explained solely by delayed homologous recombination. To resolve this question, we further analyzed autosomal synapsis through SYCP1 and SYCP3 staining. While autosomal synapsis appeared morphologically complete, we identified subtle but significant synapsis defects in autosomal terminal regions (revised Fig. 3A). This suggests that Znhit1 knockout also results in autosomal synapsis defects. We speculate that these synapsis defects are associated with the unresolved autosomal DNA damage we observed.
Lines 150-163. With regard to XY unpairing in Znhit1-cKO pachytene spermatocytes, there is insufficient discussion as to whether this is due to transcriptional aberrations.
Thank you for highlighting the need to link transcriptional aberrations to XY unpairing in Znhit1-cKO pachytene spermatocytes. To address this, we analyzed sex chromosome transcription using scRNA-seq data. Relative to controls, 120 XYlinked genes were aberrantly activated at zygotene, and 119 were upregulated at pachytene in Znhit1-cKO spermatocytes (revised Fig. 4F), directly demonstrating Znhit1 knockout disrupts Meiotic Sex Chromosome Inactivation (MSCI). Given that intact MSCI is required to stabilize XY synapsis in pachytene spermatocytes, we conclude that the observed XY unpairing is likely a direct consequence of these sex chromosome transcriptional abnormalities. We add this information to the revised manuscript (lines 221-226).
Line 187-194. Analysis of the scRNA-seq data is shown in Figure 4, but it lists several genes as stage-specific markers, some of which do not have well-understood meiotic functions. Please cite a reference paper that provides sufficient evidence to qualify this stage.
In response to this comment, we have refined the presentation of marker genes used for cell annotation (revised Fig. S4B). We have incorporated relevant references supporting their utility as stage-specific markers for the meiotic stages (line 187).
Line 225-233: If Znhit1 is important for H2AZ deposition and regulates PGA through it, how does it regulate HR-related genes that are expressed earlier through H2AZ deposition during the pachytene stage? For example, Rnf212 is not specifically expressed during the pachytene stage but is one of the targets of MEIOSIN, so it is expressed at an earlier stage.
Thank you for this insightful comment. We fully acknowledge the reviewer’s key observation that HR-related genes such as Rnf212 are MEIOSIN targets that initiate transcription at earlier meiotic stages, before the pachytene stage. Our stage-resolved scRNA-seq data further showed that the expression of Ccnb1ip1 and Rnf212 was significantly upregulated from zygotene to pachytene, following their initial transcriptional onset. We next showed that the loss of H2A.Z deposition induced by Znhit1 deletion specifically impaired this pachytene-specific secondary transcriptional activation, rather than the early MEIOSIN-driven expression onset (please see Author response image 2).
Author response image 2.
Plots showing the expression level of indicated genes in scRNAseq data.
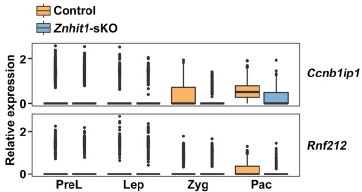
Line 245-251: As shown in Figure 6E, more than 14,000 genes have H2AZ peaks. In contrast, only approximately 60% of the genes downregulated by Znhit1-cKO appeared to be directly affected by H2AZ. Are the remaining 40% of genes regulated in a different way that is not mediated by H2AZ? Also, only a few percent of the genes with H2AZ peaks are affected, but why are only genes with A-MYB involvement affected, as shown in Figure 7?
Thank you for these insightful and constructive comments. For the ~40% of downregulated genes not directly linked to H2A.Z, they were likely regulated through indirect mechanisms. H2A.Z deposition mediated by ZNHIT1 may influence upstream transcriptional regulators (e.g., transcription factors or coactivators), whose dysregulation in turn affects these genes.
The selective effect of H2A.Z loss on A-MYB target genes is explained by the strict context-dependent function of H2A.Z, which requires stage-specific partner transcription factors to exert its regulatory activity. During the zygotene-to-pachytene transition, A-MYB acts as the master regulator of pachytene gene activation and forms a functional collaborative complex with H2A.Z to drive target gene transcription. Disrupted H2A.Z deposition upon Znhit1 deletion specifically impairs the activity of this A-MYB-H2A.Z complex, leading to selective downregulation of A-MYB targets. Other H2A.Z peak-associated genes may rely on alternative cofactors and compensatory mechanisms.
Line 245-256: Figures 6 and F show that the localization of H2AZ is reduced in Znhit1-cKO mice, which means that no substitution with H2A occurs. If so, show it in the data because the localization of H2A should be increased compared to that in the control.
To clarify the status of H2A, we have now detected immunofluorescent staining against H2A. While H2A.Z deposition was clearly impaired following Znhit1 deletion, the global level of H2A did not change significantly (Author response image 3). We speculate that this observed absence of a compensatory increase in H2A is likely due to the intrinsically low abundance of the histone variant H2A.Z relative to canonical histone H2A under physiological conditions.
Author response image 3.
Immunostaining of SYCP3 and H2A in spermatocyte testis sections of control and Znhit1-sKO mice, Scale bar, 40 μm.
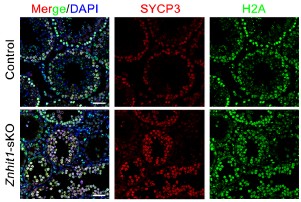
Reviewer #2 (Public Review):
Summary:
The study demonstrates that Znhit1 regulates male meiosis, with deletion causing pachytene failure associated with defective expression of pachytene genes and subtle effects on X-Y pairing and DSB repair. The authors attribute this phenotype to the defective incorporation of the Znhit1 target H2A.Z into chromatin.
Strengths:
The paper and the figures are well presented and the narrative is clear. Evidence that the conditional deletion strategy removes Znhit1 is strong, with multiple orthogonal approaches used. Most of the meiotic phenotyping is well performed, and the omics analysis clearly identifies a dramatic effect on the meiotic gene expression program. The link to H2A.Z and A-MYB adds a mechanistic angle to the study.
Weaknesses:
(1) Current literature demonstrates that meiotic mutants arrest at one of two stages: midpachytene (stage IV of the seminiferous cycle) or metaphase I (stage XII of the seminiferous cycle). This study documents that in the Znhit1 KO the midpachytene marker H1t appears normally, but that cells arrest before diplotene. If this is true, then arrest must occur during late pachytene, which based on my knowledge has never been documented for a meiotic KO. To resolve this, the authors should present stronger histological substaging evidence to support their claim.
Thank you for this insightful and constructive comment. To achieve highresolution tracking of cell lineage progression, we performed scRNA-seq analysis using P35 testes in this revised manuscript. scRNA-seq data showed that germ cells normally progressed through all meiotic stages and successfully gave rise to spermatids in control groups. By contrast, in the Znhit1 knockout group, late pachytene spermatocytes decreased significantly, and only very few subsequent germ cell types were observable (revised Fig. 2F, G). In scRNA-seq data, although very few diplotene spermatocytes and meiotic metaphase I cells were detectable, these cells still appeared abnormal, as evidenced by their extremely low Pou5f2 expression. We have revised our description of the meiotic arrest stage in the manuscript.
(2) The authors overlooked the possible effects of Znhit1 deletion on MSCI. Defective MSCI is a well-established cause of pachytene arrest. Actually, the fact that they see X-Y pairing failure should alert them even more strongly to this possibility because MSCI failure is often associated with defective X-Y pairing. This could be easily addressed by examination of their RNAseq data.
To address the concern that Znhit1 deletion may impact Meiotic Sex Chromosome Inactivation (MSCI), we analyzed XY-linked gene expression using scRNA-seq data from spermatocytes at distinct stages. Our analysis revealed aberrant activation of XY-linked genes in Znhit1-CKO spermatocytes relative to controls. Specifically, 120 XY-linked genes were activated at zygotene, and 119 XY-linked genes were upregulated at pachytene (revised Fig. 4F). This observation directly demonstrates that Znhit1-CKO impairs MSCI, which aligns with our prior characterization of defective X-Y chromosome synapsis in Znhit1-deficient spermatocytes. To explicitly resolve this concern, we have integrated these MSCIfocused RNA-seq analyses into the revised Results section (lines 221-226).
(3) The recombination assays need attention.
In the text the authors state that they studied RPA2 and DMC1, but the figures show RPA2 and RAD51.
The RPA counts are not quantitated.
The conclusion that crossover formation fails (based on MLH1 staining) is not justified. This marker does not appear in wt males until late pachytene, so if cells in this mutant are dying before that stage, MLH1 cannot be assessed.
The authors state that gH2AZ persists in the KO, but I'm not convinced that they are comparing equivalent stages in the wt and KO. In Figure 3C, the pachytene cell is late, whereas in the mutant the pachytene cell is early or mid (when residual gH2AX is expected, even in wt males).
Previous work (PMID: 23824539) has shown that antibodies reportedly detecting pATM in the sex body are non-specific. I therefore advise caution with the data shown in Figure 3D.
We appreciate the reviewer’s detailed feedback on our recombination assays and have addressed each concern as follows:
(1) Discrepancy between text and figures (RPA2/DMC1 vs. RPA2/RAD51): We have corrected this in the revised manuscript.
(2) Quantitation of RPA2 foci: We have supplemented quantitative analysis of RPA2 foci (revised Fig. S3).
(3) Conclusion on crossover failure: Single-cell RNA sequencing data from P35 testes definitively confirmed that Znhit1 knockout spermatocytes successfully progressed to the late pachytene stage, ruling out the possibility that our MLH1 staining results are confounded by cell death or arrest before this critical stage. In addition, analysis of transcriptome datasets revealed significant downregulation of important genes required for homologous recombination and crossover formation, including Ccnb1ip1 and Rnf212. Reduced expression of these essential factors may impair the assembly of MLH1 crossover foci. These data demonstrate that ZNHIT1 is essential for proper homologous recombination and crossover formation during male meiosis. We have revised the text to emphasize this context.
(4) γH2AX persistence and stage matching: We have replaced the images with more representative, stage‑matched pachytene spermatocytes from wild‑type and Znhit1‑KO mice (revised Fig. 2C). Furthermore, prompted by the insightful comment from Reviewer 1, we carefully re‑examined autosomal synapsis and identified abnormal synapsis specifically at the terminal regions of autosomes in Znhit1‑deficient spermatocytes (revised Fig. 3A). These data together confirm that ZNHIT1 is essential for DSB repair during male meiotic prophase I.
(5) pATM staining issue: Following the reviewer’s advice, we carefully reviewed the relevant literature (PMID: 23824539) and confirmed that the anti‑pATM antibody may exhibit non‑specific staining on the XY chromosomes. Accordingly, we have removed the pATM staining data presented in Figure 3D from the revised manuscript to ensure the accuracy and rigor of our results.
(4) RNAseq data. The authors show convincingly that Znhit1 activates genes that are normally upregulated at the zyg-pachytene transition. They should repeat the analysis for genes normally upregulated at the prelep- lep and lep-zyg transition to show that this effect is really pachytene-gene specific.
We appreciate this suggestion. To clarify the stage specificity of ZNHIT1’s regulatory role, we analyzed genes upregulated at the prelep-lep and lepzyg transitions. Our results showed that Znhit1 knockout had little impact on the overall expression levels of these genes (as shown in revised Fig. 4B). In contrast, as we previously reported, genes upregulated at the zygotene-pachytene transition were remarkably downregulated in Znhit1-cKO. These findings further confirm the specificity of ZNHIT1 in regulating pachytene gene expression.
(5) I am puzzled that the title and overall gist of the study focuses on H2A.Z, when it is Znhit1 that has been deleted.
We appreciate the reviewer’s observation and have revised the study title as suggested. Specifically, the title is now updated to “ZNHIT1-dependent H2A.Z deposition at meiotic prophase I underlies pachytene gene expression and meiotic progression during male meiosis.”
Reviewer #3 (Public Review):
Summary:
Sun et al. present a manuscript detailing the phenotypic characterization of loss of Znhit1 in male germ cells. Znhit1 is a subunit of the chromatin regulating complex SRCAP that functions to deposit the histone variant H2A.Z. Given that meiosis, and specifically meiotic recombination, occurs in the context of the dynamic condensing of chromosomes, the role of chromatin regulators in general, and histone variants specifically, in mammalian meiosis is an active area of research. Previous work has shown that H2A.Z is found at the locations of recombination in plants, although H2A.Z was previously not found at recombination sites in mammalian meiosis. Here the authors use a conditional approach to ablate Znhit1 in spermatocytes and characterize a block in meiosis in prophase I in the transition from pachytene to diplotene stage.
Strengths:
The authors combine current methods in immunohistochemistry and functional genomics to provide strong evidence of meiotic block upon the loss of Znhit1. They find that loss of Znhit1 leads to reduced incorporation of the histone variant H2A.Z, specifically at promoters and enhancers. Further, RNA sequencing found more genes are down-regulated upon loss of Znhit1 compared to upregulated, suggesting that incorporation of H2A.Z is critical for the expression of genes necessary for successful meiotic progression.
A strength of the manuscript is tying the locations of changes in H2A.Z deposition with binding of the transcription factor A-MYB, providing a mechanism that can potentially combine the changes in chromatin regulation with variable binding of a transcription factor in gene expression in pachytene stage spermatocytes.
Weaknesses:
A weakness in the single-cell RNA experiment using cells from 16-day-old male mice. The authors suggest that the rationale for the experiment was to determine where the Znhit1-sKO mutant showed an arrest in meiosis, and claim that this is the pachytene stage. However, in the 'first wave' of meiosis 16-day-old mice are just beginning to enter pachytene, so cells from later meiotic stages will be largely absent in these tubules. This is clear from the UMAP showing a similar pattern of cell distributions between wild-type and mutant mice. Using older mice would have better demonstrated where the mutant and wild-type mice differ in cell-type composition.
We appreciate the reviewer’s constructive comment. To resolve this issue, we have added new scRNA‑seq data from testes of P35 mice, which harbor a full spectrum of meiotic stages, including late pachytene, diplotene, metaphase I spermatocytes, and post-meiotic spermatids. Compared with wild-type controls, Znhit1-sKO testes exhibited a marked reduction in late pachytene spermatocytes and a near-complete loss of post-pachytene cell types, directly validating the pachytenestage meiotic arrest (revised Fig. 2F, G). All updated analyses have been integrated into the manuscript to strengthen our conclusions.
The authors use the term pachytene genome activation (PGS) in the manuscript to suggest a novel process by which genes are specifically increased in expression in the pachytene stage of meiotic prophase I, without reference to literature that establishes the term. If the authors are putting forward a new concept defined by this term, it would strengthen the manuscript to describe it further and delineate what the genes are that are activated and discuss potential mechanisms.
We appreciate the reviewer’s valuable feedback on our use of the term "pachytene genome activation (PGA)".
To address this, we have revised the text to explicitly frame PGA as a stage-specific transcriptional program observed in our data, defined by the coordinated upregulation of a distinct set of genes during the pachytene stage of meiotic prophase I.
(1) Definition and Gene Set: Using the scRNA-seq dataset, we formally defined PGA as the transcriptional wave characterized by genes with increased expression in pachytene vs. zygotene spermatocytes (n = 1,560 genes). Functional enrichment analysis shows these genes are primarily involved in DNA repair, cilium organization, and spermatid development (Table S3), consistent with the biological process of germ cell development.
(2) Relationship to existing literature: While PGA as a term is not widely established, our data align with prior observations of pachytene-specific transcriptional upregulation (Alexander et al., 2023; Ernst et al., 2019; Turner, 2015). Importantly, Alexander et al reveals that in late meiotic stages, starting from pachynema, chromatin has a ~3-fold increase in transcription. We have added these citations to clearly illustrate the relevant advances in the field (lines 68-71).
(3) Regulation of pachytene-stage gene expression: We further delineate that PGA is regulated by ZNHIT1-dependent H2A.Z deposition. Znhit1 deletion resulted in significant downregulation of 70.1% (1,094 out of 1,560) of these genes. This links PGA to chromatin-based regulation, where ZNHIT1-dependent H2A.Z deposition enables pachytene-specific transcription.
Generally speaking, the authors present solid evidence for a pachytene block in male germ cell development in mice lacking Znhit1 in spermatocytes. The evidence supporting a change in gene expression during pachytene, that more genes are downregulated in the mutant compared to increased expression, and changes in histone modification dynamics and placement of H2A.Z all support a role in alterations in meiotic gene regulation. However, the support that changes in H2A.Z impacting meiotic recombination (as suggested in the manuscript title) is less supported, rather than a general cell arrest in the pachytene stage leading to cell death. The conclusions around the role of Znhit1 influencing meiotic recombination directly could use further justification or mechanistic hypothesis.
We acknowledge the reviewer’s comments. Indeed, existing data support the presence of a pachytene block in spermatocytes of Znhit1-deficient mice, along with aberrant pachytene gene expression and impaired H2A.Z deposition.
In response, we made the following revisions: (1) we adjusted the manuscript title and conclusion to reduce emphasis on a direct H2A.Z-recombination link, and focus instead on ZNHIT1/H2A.Z in pachytene gene regulation and meiotic progression; (2) recombination defects may be indirect consequences of failed pachytene gene regulation, rather than a direct regulatory effect of ZNHIT1 on recombination machinery (lines 314-319).
Reviewer #3 (Recommendations For The Authors):
Quality of the images for meiotic spreads - images have low contrast and are tiny. It is difficult to see the SYCP3 results even when the images are magnified on the computer screen.
We have provided new images with high resolution to ensure a clear visualization of SYCP3 signals.
Line 165 - indicates the results for DMC1, although the figure suggests the results are for RAD51 foci.
We have corrected this mistake.
Line 306 - this manuscript 'confirms' that H2AZ is not found at mammalian recombination sites, a result already in the literature.
We have corrected this mistake (lines 309-312).
Reviewing Editor Comments:
Major points and revisions highlighted by the reviewers:
(1) Meiotic prophase in Znhit1KO: The main questions to clarify are the stage and status of progression, the analysis of apoptosis, and the consequences of gene expression on the X and Y. Additional analysis for DSB repair foci, gH2AX is also required. Those analysis are needed to answer to reviewer 2. Even if H2AZ was not detected at recombination hotspots, it may be possible that it plays a role in DSB repair but the level is too low for detection. This should be discussed as H2AZ was shown to be involved in DNA repair.
We sincerely appreciate the reviewing editor’s constructive comments.
(1) Stage and progression of meiotic prophase: We supplement P35 testes for scRNAseq. Results confirmed Znhit1-KO spermatocytes arrest at late pachytene, and postpachytene stages (diplotene, metaphase I) were nearly absent (revised Fig. 2F, G).
(2) Apoptosis analysis: We studied this by demonstrating that apoptosis-related genes were upregulated in pachytene spermatocytes at the single-cell level (revised Fig. 4D). To further validate this finding, we performed scRNA-seq analysis on P35 testis samples. Our results revealed a marked reduction in late pachytene spermatocytes in Znhit1-cKO testes (revised Fig. 2F, G), consistent with apoptotic depletion of pachytene-stage cells. Together, these data confirm that Znhit1 ablation impairs pachytene-stage spermatocyte development.
(3) X/Y gene expression consequences: To address this key point, we performed stage-resolved analysis of XY-linked gene expression using scRNA-seq data from different-stage spermatocytes. Compared with controls, we detected aberrant ectopic activation of XY-linked genes in Znhit1-KO spermatocytes: 120 XY-linked genes were inappropriately activated at zygotene, and 119 remained abnormally upregulated at pachytene (revised Fig. 4F). These results provide direct evidence that Znhit1 deletion impairs Meiotic Sex Chromosome Inactivation (MSCI).
(4) DSB repair issue: We have replaced the images with more representative, stage‑matched pachytene spermatocytes (revised Fig. 3C). The revised images show consistently increased γH2AX signals in Znhit1-KO spermatocytes. Prompted by Reviewer 1’s comment, we identified abnormal synapsis at autosomal terminal regions in mutant cells. Together, these results confirm that ZNHIT1 is essential for DSB repair during male meiotic prophase I.
(5) Potential role of H2A.Z in DSB repair: Though H2A.Z was nearly undetectable at recombination hotspots, we discuss two possibilities: (1) ZNHIT1-H2A.Z depletion dysregulated DSB repair-related genes; (2) Current ChIP-seq sensitivity may miss low-abundance H2A.Z at hotspots, which could support repair via chromatin remodeling. Future high-resolution assays (super-resolution imaging, DSB-targeted ChIP-seq) are proposed to validate this. We agree that recombination defects may be indirect consequences of failed pachytene gene regulation, rather than a direct regulatory effect of ZNHIT1 on recombination machinery.
(2) Gene expression analysis. The first consequence of H2AZ depletion is gene expression downregulation. However, it may be not surprising that some genes are down and others upregulated. There are likely secondary and indirect effects including the upregulation of some genes. The authors should explain and discuss this point such as to answer to questions raised by reviewer 1 and 2.
The primary consequence of H2A.Z depletion in pachytene spermatocytes is indeed widespread downregulation of genes. For the coexistence of upregulated genes, we explain this via three key points.
(1) Technical differences between scRNA-seq and bulk RNA-seq (addressing Reviewer 1): scRNA-seq captures cell-type-specific differentially expressed genes that bulk RNA-seq masks (bulk averages signals across mixed cells, hiding changes in rare subsets). Additionally, scRNA-seq uses a lower log2(fold change) threshold (0.25 vs. 1 in bulk RNA-seq), detecting subtle upregulations missed by bulk analysis.
(2) No dead cell contamination (addressing Reviewer 1): Stringent quality control excluded cells with >15% mitochondrial RNA. Apoptosis-related genes showed no significant correlation with mitochondrial RNA fractions (Pearson correlation coefficient, r = -0.02; please see Author response image 1), ruling out dead cell transcriptome interference.
(3) Secondary/indirect effects (addressing Reviewers 1 & 2): Upregulated genes likely result from indirect regulatory cascades. H2AZ depletion may disrupt upstream transcription factors, leading to compensatory upregulation of their downstream genes or cell stress responses to meiotic arrest. Notably, Znhit1 knockout specifically impacts genes upregulated at the zygotene-pachytene transition, while genes upregulated at preleptotene-leptotene or leptotene-zygotene transitions remain largely unaffected (revised Fig. 4B), confirming the specificity of H2A.Z’s direct regulatory role and framing upregulation as non-targeted indirect effects.
(3) The authors should also test the effect of Znhit1KO on the 1196 genes (up PreL/L) and 1325 (up L/Z) as shown in Figure 5D for the PGA. Also in Figure 5B, there is no evaluation of the statistical significance of the variation, this should be revised. X and Y genes should be analysed. KAS-Seq should be correlated with gene expression analysis, and several points as mentioned in the reviews below should be better explained and discussed.
(1) Effect of Znhit1-KO on PreL/L- and L/Z-upregulated genes: we analyzed the 1196 genes upregulated at the PreL/L transition and 1325 genes upregulated at the L/Z transition. Znhit1 knockout had minimal effect on the expression of these early meiotic gene sets (revised Fig. 4B), whereas genes activated at the zygotene‑pachytene transition were strongly downregulated in Znhit1-KO spermatocytes. These results confirm the specific role of ZNHIT1 in regulating pachytene‑stage gene expression. We have also added a statistical evaluation for the variation shown in Fig. 4B.
(2) X/Y-linked gene analysis: Analysis of stage‑resolved scRNA‑seq revealed aberrant ectopic activation of 120 XY‑linked genes at zygotene and 119 at pachytene in Znhit1-KO spermatocytes (revised Fig. 4F), demonstrating impaired Meiotic Sex Chromosome Inactivation (MSCI).
(3) KAS-seq correlation with gene expression: We analyzed the link between KAS‑seq signals and gene expression, and we found that Znhit1 depletion caused a global reduction in KAS‑seq signals, especially at promoters of downregulated genes (revised Fig. S8). Genes with increased expression showed low KAS‑seq signals in both control and mutant groups, likely reflecting indirect regulation. These results highlight the essential role of ZNHIT1 in transcriptional regulation.
(4) The title should refer to Znhit1, and the effect on meiotic recombination activities may be an indirect consequence of prophase progression arrest, even if some recombination genes are downregulated. This point is important as noted by reviewer 3.
We fully acknowledge Reviewer 3’s key point and have revised the manuscript title to “ZNHIT1-dependent H2A.Z deposition at meiotic prophase I underlies pachytene gene expression and meiotic progression during male meiosis” to reduce emphasis on a direct H2A.Z-recombination link.
Regarding meiotic recombination activities: The downregulation of recombinationrelated genes (e.g., Ccnb1ip1, Rnf212) stems from impaired pachytene-stage transcriptional programs caused by ZNHIT1-dependent H2A.Z deposition defects, which in turn leads to prophase progression arrest. Thus, the observed recombination abnormalities may be a secondary consequence of the meiotic prophase arrest, rather than a direct regulatory effect of ZNHIT1 on recombination machinery. This clarification has been integrated into the Discussion section (lines 314-318).
(5) The recent structural analysis of SRCAP should be cited: Yu et al. Cell Discovery (2024) 10:15 https://doi.org/10.1038/s41421-023-00640-1.
We have cited this reference in this revised manuscript (lines 234-236).
(6) The authors should read and answer the specific revisions asked for by the reviewers.
We have thoroughly read and systematically addressed all specific revisions requested by Reviewers 1, 2, and 3, as detailed in the revised manuscript and supplementary data.
References
Alexander, A.K., Rice, E.J., Lujic, J., Simon, L.E., Tanis, S., Barshad, G., Zhu, L., Lama, J., Cohen, P.E., and Danko, C.G. (2023). A-MYB and BRDT-dependent RNA Polymerase II pause release orchestrates transcriptional regulation in mammalian meiosis. Nature communications 14.
Cole, L., Kurscheid, S., Nekrasov, M., Domaschenz, R., Vera, D.L., Dennis, J.H., and Tremethick, D.J. (2021). Multiple roles of H2A.Z in regulating promoter chromatin architecture in human cells. Nature communications 12, 2524.
Ernst, C., Eling, N., Martinez-Jimenez, C.P., Marioni, J.C., and Odom, D.T. (2019). Staged developmental mapping and X chromosome transcriptional dynamics during mouse spermatogenesis. Nature communications 10, 1251.
Kim, T.K., Hemberg, M., Gray, J.M., Costa, A.M., Bear, D.M., Wu, J., Harmin, D.A., Laptewicz, M., Barbara-Haley, K., Kuersten, S., et al. (2010). Widespread transcription at neuronal activity-regulated enhancers. Nature 465, 182-187.
Sporrij, A., Choudhuri, A., Prasad, M., Muhire, B., Fast, E.M., Manning, M.E., Weiss, J.D., Koh, M., Yang, S., Kingston, R.E., et al. (2023). PGE(2) alters chromatin through H2A.Z-variant enhancer nucleosome modification to promote hematopoietic stem cell fate. Proceedings of the National Academy of Sciences of the United States of America 120, e2220613120.
Turner, J.M. (2015). Meiotic Silencing in Mammals. Annu Rev Genet 49, 395-412. Wu, T., Lyu, R., You, Q., and He, C. (2020). Kethoxal-assisted single-stranded DNA sequencing captures global transcription dynamics and enhancer activity in situ.
Nature methods 17, 515-523.
How can the art object help us to better understand time? How does time help us understand our own selves?
These questions seem more general than your focus, which seems to be: How can Bennett's short story help us understand how Black time shapes conceptions of Black selfhood.
Bennett refuses resolution because the temporal condition she is rendering does not resolve; it accumulates and persists. The reader is left with precarity, itself a condition of Black subjecthood. Jenks may have found closure,
How does Bennett refuse resolution, yet Jenks finds closure. Again, including textual evidence would help make this distinction.
“But the Seine goes on, and Seraigne continues to be happy, and the pain in one's chest grows no easier.”
Good use of quotation. Please insert a page reference.
emory in the story functions not as nostalgia but as a mode of self-assembly —that same mode of self-production mentioned earlier— a process by which Jenks gathers the dispersed elements of his experience into something coherent enough to transmit.
This is a fascinating insight that requires textual evidence to be persuasive.
enks never leaves his room, yet he traverses considerable interior terrain, moving through the lives of those he has loved and the landscapes he has carried within him.
Perhaps a quotation showing how he traverses interior terrain could help illustrate this claim.
Jenks’ trajectory enacts precisely this negotiation: a reckoning with what it has meant to have been thrown into the world as this particular person, in this particular body, approaching this particular death. His becoming is inseparable from the historical c
This is very impressive reasoning and sophisticated language. It would be more persuasive if you found evidence from the text to show that Jenks is Black and that racial awareness is evident in the narrative.
That accumulation is, moreover, the very condition of Jenks’ becoming.
Accumulation of what?
Jenks’ temporal disorientation, his resistance to the consolations of either life or death as stable endpoints, marks him as a figure whose experience exceeds the categories available to represent it.
A bit hard to follow. By the time I get to "it," I've lost track of the referent. Can you simplify this sentence?
1920s Paris map overlayed on a satellite image of the city from May 7, 2026.
This is a cool effect, but how does it relate to the argument you're making? Frame your media the way you would quotations, explaining where they come from and how they support your argument.
eLife Assessment
This valuable study provides quantitative data and analysis to reveal that variations in Dorsal (Dl ) nuclear dynamics along the Dorso-ventral axis in the early Drosophila embryo are governed by Dl-Cactus nuclear interactions. The solid evidence partially supports a mechanism where nuclear localized Cactus contributes to the fraction of Dl that binds to DNA, but additional work will be necessary to confirm the claims and the biological significance of these findings.
Reviewer #1 (Public review):
Summary:
Al Asafen and colleagues here apply a set of scanning fluorescence correlation spectroscopic approaches (Raster Image Correlation Spectroscopy (RICS), cross-correlation RICS, and pair correlation function spectroscopy) to address the nucleo-cytoplasmic kinetics of the Dorsal (Dl) transcription factor in early Drosophila embryos. The Toll/Dl system has long been appreciated to establish dorsal-ventral polarity of the embryo through Toll-dependent control of Dl nuclear localization, and represents one of a handful of model morphogen gradients produced with high enough precision to yield robust biophysical measurements of general transcription factor activity and function. By measurement of GFP-tagged Dl protein, either in wild-type embryos, or in mutant embryos with low/medium/high levels of Toll signaling, the authors report diffusivity of Dl in nuclear and cytoplasmic compartments, as well as the fraction of mobile and immobile Dl, which can be correlated with DNA binding through cross-correlation RICS. A model is presented where Cactus/IkB is implicated in preventing Dl from binding to DNA.
Strengths:
The study uses raster image correlation spectroscopy approaches to measure biophysical components of the Dl gradient in Drosophila embryos. It convincingly demonstrates a positive correlation between Toll pathway activity and the fraction of bound Dl in the nucleus. RICS methodology has widespread potential applications in cell and developmental biology, and this study will contribute to its adoption.
Weaknesses:
The study seeks to test a hypothesis for how the Toll pathway may limit Dl DNA binding in the nucleus. This experiment, while producing initial support for a role of nuclear Cactus, is confounded by co-expression of wild-type Dl, thus limiting the interpretation of the experimental results.
Reviewer #2 (Public review):
Summary:
In this manuscript, Al Asafen, Clark et al. use fluorescence correlation spectroscopy (FCS) to quantitatively analyze the mobility of Dl along the DV axis of the early Drosophila embryo. Dl is essential for dorsal-ventral (DV) patterning and its gradient initiates the activation of several genes and thereby orchestrates the formation of the Drosophila body plan. While the mechanisms underlying Dl gradient formation have been extensively studied, there are some observations for which there is not yet a mechanistic explanation. For example, the peak of the Dl gradient grows continuously during nuclear cycles 10-14. This is likely due to Cact-dependent Dl diffusion and Dl binding to DNA. But the biophysical parameters governing Dl nuclear dynamics that would support these claims have not been previously measured. In this work, the authors separated GFP-tagged Dl into a mobile and an immobile pools. Interestingly, the fraction of immobile Dl is position-dependent, revealing more binding to DNA in ventral than in dorsal nuclei. This is either due to higher binding affinity in ventral locations (due to Toll-dependent Dl phosphorylation) or to higher Dl-Cact binding in dorsal nuclei that would prevent Dl to bind DNA. Using specific dl alleles, authors support the latter hypothesis.
Strengths:
The manuscript is well written and their conclusions are convincingly supported by their methodology and analysis. As a quantitative study, the biophysical analysis seems rigorous, in general.
Although this is not the first study that employs FSC to investigate the dynamics of a morphogen, it further exemplifies how these quantitative tools can be used to uncover mechanistic aspects of morphogen dynamics during development. In particular, the manuscript reports novel biophysical parameters of Dl dynamics that will be helpful in future hypotheses-driven modeling studies.
Weaknesses:
The main weakness of the manuscript is that the main biological implication of the study, namely that the asymmetry in the fraction of immobile Dl is a result of nuclear Dl-Cact binding which prevents Dl to bind DNA (Figure 5), occurs in a region of the embryo where there is very little Dl anyways (Figure 1A). While it is interesting that a small fraction of immobile Dl significantly increases in dorsal nuclei in mutants expressing a form of Dl with reduced Cact binding it is unclear what is the biological impact of this effect in a location where Dl is nearly absent.
Another weakness of the study, is that experiments are performed in the presence of a wild-type GFP-tagged Dl (unfortunately, the Dl gradient does not form without it; Supplemental Figure 4). This is an unfortunate technical limitation, because it cannot allow to test how important Cact binding is for determining the amount of Dl that could bind DNA in more biologically-relevant locations of the embryo (e.g., in lateral regions).
Overall, I feel that the manuscript exemplify how FSC methods and analysis can be used for the estimation of biophysical parameters and test biological hypothesis, even under very low concentrations (such as Dl in dorsal-most nuclei). However, due to technical limitations, it falls short in offering a real quantitative understanding of their proposed mechanisms. The authors did not report in Figure 5, what happens to the fraction of Dl bound to DNA in lateral regions in the reduced Cact binding and reduced Toll phosphorylation mutants.
Author response:
The following is the authors’ response to the original reviews.
Public Reviews:
Reviewer #1 (Public review):
Summary:
Al Asafen and colleagues apply a set of scanning fluorescence correlation spectroscopic approaches (Raster Image Correlation Spectroscopy (RICS), cross-correlation RICS, and pair-correlation function spectroscopy) to address the nuclear-cytoplasmic kinetics of the Dorsal (Dl) transcription factor in early Drosophila embryos. The Toll/Dl system has long been appreciated to establish dorsal-ventral polarity of the embryo through Tolldependent control of Dl nuclear localization, and provides an example of a morphogen gradient produced with high enough precision to yield robust biophysical measurements of general transcription factor activity and function. By measuring GFP-tagged Dl protein, either in wild-type embryos or in mutant embryos with low/medium/high levels of Toll signaling, the authors report diffusivity of Dl in nuclear and cytoplasmic compartments of the embryo, as well as the fraction of mobile and immobile Dl, which can be correlated with DNA binding through cross-correlation RICS. A model is presented where Cactus/IkB is implicated in preventing Dl from binding to DNA.
Strengths:
The experiments on wild-type GFP-tagged Dorsal are performed well, are mostly reported well, and are interpreted fairly.
Weaknesses:
The discrepancy between experiment and theory as pertains to Michaelis-Menten kinetics is not fully motivated in the text, and could benefit from a more clear presentation. The experiments performed to distinguish between the contribution of Toll-dependent phosphorylation and Cactus interaction models for limiting Dorsal DNA binding are possibly confounded by the presence of wild-type, GFP-tagged Dorsal protein.
Thank you for your thoughtful feedback. Regarding the discrepancy between experiment and theory in relation to Michaelis-Menten kinetics, we recognize that our initial explanation may not have been explicit enough. Our intent was to illustrate that if DNA binding is a saturable process, then while the absolute concentration of Dl bound to DNA will increase with total Dl levels, the fraction of Dl bound to DNA will decrease. We used Michaelis-Menten kinetics only as a familiar example to convey this concept but did not intend to suggest that the system strictly follows Michaelis-Menten behavior. To clarify this point, we removed mention of Michaelis-Menten as an illustrative analogy and stuck specifically with discussing the system as “saturating.” This primarily affected text in the paragraph starting on Line 204, but also Lines 323-325.
Regarding the concern about potential confounding effects due to the presence of wildtype GFP-tagged Dorsal (Dl[wt]-GFP): we understand the importance of addressing this point more directly. Therefore, we have imaged the Dorsal-GFP gradient in embryos expressing the UAS-dl[S280P]-GFP or the UAS-dl[S317A]-GFP constructs in the absence of the BAC-recombineered Dl-GFP construct. In both cases, the dl mutants by themselves were not able to recapitulate enough of the Dl gradient to test our hypotheses. We have added this analysis to Supplemental Figure 4 and mentioned this figure on Lines 333-336 and 354-358. Furthermore, we explicitly mention that it is possible the reason why we failed to reject the null hypothesis in the Toll phosphorylation mutant case may be due to the additional copy of Dl[wt]-GFP (the BAC recombineered construct), with text added to Lines 343-345, 365-369 (Results) and 408-418 (Discussion).
Reviewer #2 (Public review):
Summary:
In this manuscript, Al Asafen, Clark et al., use fluorescence correlation spectroscopy (FCS) to quantitatively analyze the mobility of Dl along the DV axis of the early Drosophila embryo. Dl is essential for dorsal-ventral (DV) patterning and its gradient initiates the activation of several genes and thereby orchestrates the formation of the Drosophila body plan. While the mechanisms underlying the formation of the Dl gradient have been extensively studied by this group and others, there are some observations for which there is not yet a mechanistic explanation. For example, the peak of the Dl gradient grows continuously during nuclear cycles 10-14. This is likely due to Cact-dependent Dl diffusion and Dl binding to DNA. However, the biophysical parameters governing Dl nuclear dynamics that would support these claims have not been previously measured. In this work, the authors provide evidence that GFP-tagged Dl may be separated into a mobile pool and an immobile pool. Interestingly, the fraction of immobile Dl is position-dependent along the DV axis, revealing more binding to DNA in the ventral than in the dorsal nuclei. This is either due to higher binding affinity in ventral locations (due to Toll-dependent Dl phosphorylation) or to higher Dl-Cact binding in dorsal nuclei that would prevent Dl from binding to DNA. Using dl-mutant alleles, the authors support the latter hypothesis.
Strengths:
The manuscript is well written and their conclusions are convincingly supported by their methodology and analysis. As a quantitative study, the biophysical analysis seems rigorous, in general.
Although this is not the first study that employs FSC to investigate the dynamics of a morphogen, it further exemplifies how these quantitative tools can be used to uncover mechanistic aspects of morphogen dynamics during development. In particular, the manuscript reports novel biophysical parameters of Dl dynamics that will be helpful in future hypotheses-driven modeling studies.
Weaknesses:
In my opinion, the main weakness of the manuscript is that the main biological implication of the study, namely that the asymmetry in the fraction of immobile Dl is a result of nuclear Dl-Cact binding which prevents Dl from binding DNA (Figure 5), occurs in a region of the embryo where there is very little Dl anyways (Figure 1A, 5A). While it is interesting that the fraction of immobile Dl increases (just a little, but significantly) in dorsal nuclei in mutants expressing a form of Dl with reduced Cact binding it is unclear what is the biological impact of this effect in a location where Dl is nearly absent. As can be seen in Figure 3F, the fraction of immobile is unaffected in Dl-mutant forms with reduced DNA binding, because it is already very low. It is unlikely that Dl binding to Cact in dorsal nuclei would affect shuttling as well since the fraction is very low anyway.
We thank the reviewer for pointing out the places where we could strengthen our explanations. Here we first address the criticism, also raised by the other reviewer, that the fraction of immobile Dl increases only a small amount (Fig. 5A). [In our reply to the next comment, we address the question of biological implications.] We attempted to explain this small effect size in the manuscript; however, we understand that we could clarify further and, given the fact that eLife has no restraints on space, we added more explanation in the main text.
In essence, even though the effect was statistically significant, the effect size was small because the mutation was “diluted” by the presence of a wildtype Dl protein tagged with GFP. We were willing to deal with this dilution because the alternative was that, according to previous literature, without any wildtype Dl, no Dl gradient would be present in the reduced Toll phosphorylation mutants, and only a very weak Dl gradient (weakened on both ends) would be present in mutants that reduced Cact binding. We were confident that, with our quantitative approaches, we would be able to detect the diluted effect.
However, because both reviewers have criticized this diluted effect, in this resubmission, we have included analysis of GFP-tagged mutants without the presence of wildtype Dl protein. Unfortunately, these embryos lack a discernible Dl gradient and cannot be analyzed in such a way as to test the hypotheses that the mutants were generated for.
Even so, the effect of the Cact-binding mutant was strong enough that we were able to statistically distinguish it from embryos expressing only wildtype Dl-GFP, even with the dilution effect. On the other hand we have also included a caveat that our failure to statistically distinguish Toll phosphorylation mutants from wildtype may be due to the dilution effect. We now also explicitly state the concerns about a lack of a discernible Dl gradient and have included figures of full mutants in the supplement. See also our discussion of Reviewer 1’s similar comment.
While the authors have a very clear understanding of the biology of the Dl gradient, I feel that the manuscript is more written as a 'tools' paper (i.e., to exemplify how FSC methods and analysis can be used for biological discovery). This is ok, but I think that the authors should discuss further what are the biological implications of these findings other than the contribution to uncovering the biophysical parameters.
Here we underscore the biological implications of our discovery that Cact is present in the nucleus on the dorsal side. The reviewer mentioned that Cact in the nucleus on the dorsal side appears to have little overall effect, because this is the location of the embryo where there is very little Dl in the first place, which raises the question of whether this discovery is impactful.
While we previously used the final paragraph of the discussion to touch on the implications of this discovery, we acknowledge that we could have spent more time on the explanation. As such, we have expanded this final paragraph into two paragraphs. In the first of the two, we discuss in more detail the implications specifically of the Dl/Cact interactions in the dorsal-most nuclei, as understood by the results of this paper. In brief, knowing that Dl in the dorsal-most nuclei is bound by Cact results in an updated understanding of the Dl gradient, with increased dynamic range, robustness, and precision (but unknown shape).
In the second of the two paragraphs, we discuss this result in light of our recent work on imaging Cact in live embryos, in which we have shown that Cact is present in all nuclei at roughly uniform levels. Taken together, we suggest that it is possible that Cact is bound to Dl in all nuclei (not just the dorsal-most), which would allow us to estimate the shape of the overall Dl gradient by subtracting off the fluorescence that stems from Dl/Cact complex.
For example, I think that the implications of the rejected hypothesis (i.e., that Tolldependent Dl phosphorylation does not seem to have an impact on Dl binding affinities to DNA) are important and should be further discussed (even if no additional experiments are performed). What is then the role of Dl phosphorylation? Perhaps it could have an impact on patterning robustness in lateral regions. The authors should report in Figure 5 also what happens to the fraction of Dl bound to DNA in lateral regions in the reduced Cact binding and reduced Toll phosphorylation mutants.
We appreciate the reviewer’s suggestion that the rejection of the hypothesis that phosphorylation of Dl by Toll impacts Dl/DNA binding could be expanded upon further. For the role of Dl phosphorylation by Toll: we previously mentioned that this phosphorylation is known to enhance the nuclear import or retention of Dl, and that mutation of serine 317 to an alanine abolishes Toll-mediated phosphorylation of Dl, which results in embryos with no Dl gradient. We had also mentioned that phosphorylation of Dl is not known to affect its DNA binding, which is the hypothesis we sought to test by creating the dl[S317A]-GFP mutants. We did not image any mutants, or the UAS-dl[wt]-GFP control, in the lateral regions, for two reasons. First, this region is easily the smallest of the three regions, in terms of the percentage of the DV axis (see Fig. 1A). Second, because of the dilution effect, we knew the effect size would be small, and as such, we imaged only on the extreme ends of the gradient so that the most clear conclusion could be drawn about the effect that Toll phosphorylation might have on DNA binding of Dl.
The way that position along the DV axis is reported using the nuclear-cytoplasmic-ratio (NCR) in Figures 1-3 is not incorrect, but I wonder if it is the best way of doing it. The reason is that it spreads out a relatively small region of the embryo (the ventral-most locations) and shrinks a relatively large region of the embryo (lateral and dorsal regions), see Figure 1A. Perhaps reporting the NCR in log_2 units would be more appropriate.
We agree that there is some distortion of the relative spatial extents of the Dorsal gradient when NCR is used as an independent variable on a plot. However, we prefer the NCR on the horizontal axis because it is closer the functional variable (Dl concentration, rather than spatial location) for the properties we studied.
Recommendations for the authors:
Reviewer #1 (Recommendations for the authors):
I really enjoyed the first part of this paper and have only minor suggestions for improvement of the presentation. I am confused about the experimental approach for the final figure, distinguishing phosphorylation and cactus-dependent effects. I'll divide my comments between "First Part/General Suggestions", "Last Part", and finish with some minor typo observations.
The gist of the issues with the last part of the paper could boil down to insufficient detail/explanation of the section. The discrepancy with expectation with Michaelis-Menten kinetics is presented in a total of three sentences and is not necessarily obvious to the general readership of eLife. The mutants chosen to distinguish the phosphorylation and cactus mechanisms could be described more (why these? aren't other residues phosphorylated?) and possibly why also having wild-type GFP-Dl in the measurements isn't confounding. Since there is unlimited space in this journal, it may be advisable to use this space to fill out these rationales and ideas.
First part/General Suggestions:
(1) For the RICS data, (Figures 1 and 2) there is a nice correlation between WT NC ratio and the selected low/med/hi Dl activity mutants. More-or-less the median values in, say, Figure 1E-G are reflected in Figure 1H. However, with the ccRICS data (Figure 3), it looks like there is less correspondence between the range of fraction bound estimates in, for instance, "ventral" in Figure 3D and '10b' in Figure 3E. Can the authors comment on this? Should the reader be able to make this kind of comparison, or does something about data collection for the wt/NCR measurements preclude direct comparison of magnitudes with the panel of mutants? (imaging setup, laser power, etc)?
The reviewer is correct that there seems to be a discrepancy in the values of ψ between the wt embryos (ventral side) and the Toll10B embryos. It should be noted that the Toll10B embryos are not “ventral-like” in every way, in part because they have unknown activated Toll levels that might be above or below what is seen at the ventral midline in wildtype embryos, and in part because there is no DV gradient, and thus no shuttling in these embryos that would accumulate total Dorsal on the ventral midline. As such, comparisons between Toll10B embryos and the ventral side of wildtype embryos are not exactly one-toone, and we are more confident in comparing among the mutants in an allelic series. To address this question, we have added a sentence to the end of the second paragraph of the “Dorsal/DNA binding exhibits a spatial gradient” subsection of the Results (Lines 233235).
(2) Materials and methods: Mounting and imaging of Drosophila embryos: the authors cite the "488 nm laser intensity ranged from 0.5% to 3.0%..." The values presented here are not useful for the general reader or an individual looking to replicate these conditions, as emission power produced from such values will vary from instrument to instrument. It is standard in these cases to report an estimated laser power (measured in watts) for each laser line, and a clear description of how such measurements were made (stationary beam, under scanning conditions, with what detector, etc). These measurements are valuable and the authors are strongly encouraged to report such measurements for their setup.
We appreciate the reviewer’s suggestion and understand the importance of providing absolute laser power values for reproducibility. We have now included the laser power (in watts) for the laser lines on both microscopes used in this study. The revised text can be found in the Materials and Methods section, in the Lines 535-536 and 540.
(3) The presentation of the data in Figure 4 is difficult to understand. Are the kymographs (A lower) representing the entire length of the big white arrow in A upper? Or do the dashed lines indicate the x-axis limits of the kymograph? It is difficult to tell from the figure legend, where the dashed lines are described as "areas where Dl-GFP movement is measured out of the nucleus." I believe that the authors can make these measurements and that Figure 4B reflects properties of "movement" of Dl out of the nucleus, but how they get there from these data is not clear to this reader. Perhaps a cartoon explaining the green lines and the orange lines in the kymograph or tightening the legend would help.
We thank the reviewer for their feedback and understand the need for greater clarity in the text of the pCF section and in Figure 4. The widths of the kymographs in the lower panels correspond to the full widths of the images in the upper panels. The pCF measurements were taken at the y-coordinates at the level of the white arrows. The dashed vertical lines connecting the upper and lower panels illustrate two cases of locations along the x-axis of the image where Dl is crossing from inside a nucleus to outside. In the two illustrated cases, these crossings are accompanied by either zero Dl molecules being observed to cross the nuclear barrier (ventral image/kymograph on left) or delayed crossing of Dl molecules (dorsal image/kymograph on right). To address this concern, we have added more detail to the Fig. 4 legend and greatly expanded on a discussion of what pCF does in the text (the second and third paragraph of the section). We have also updated Fig. 4 to align with new explanations from the text: namely, describing the y-axis of the kymographs as Δt (instead of log(time)) and explicitly showing that the pair correlation is for pairs of pixels that are Δx = 6 pixels apart. Further details were also added to the relevant Methods section.
(4) DV position in the wild-type imaging experiments is operationally determined through measurement of the Dorsal NC ratio. This makes sense, but the strategy is buried in the first paragraph of the results, and not discussed in the M & M. For readers unfamiliar with imaging the fly embryo or the nuances of the Dl gradient, perhaps a sentence or two explaining that embryos were oriented randomly along the DV axis, and DV positions of the imaging region were estimated by measuring the Dl NC ratio.
We thank the reviewer for this helpful suggestion. To improve clarity, we have added a description of how DV position was determined to the Materials & Methods section (paragraph starting on Line 520). Specifically, we now state that embryos were randomly oriented along the DV axis and that we used the Dorsal NC ratio of intensity as a proxy for measuring the DV position in imaging experiments. Additionally, we have added a statement to the Results section to ensure that this strategy is more clearly introduced (Lines 143-144). We appreciate this recommendation, as it will help readers unfamiliar with fly embryo imaging better understand our approach.
(5) It would be nice to report the corresponding NC-ratio values for Dl in each of the mutant conditions, perhaps as a supplement to Figure 1. Currently, Figure 1H relies on the (admittedly well-established) properties of the three mutants, but it feels that an additional nice quantitative link in the data can be drawn out here. Do the authors see the strict correlation between the wt and mutant diffusivity measurements at specific NC-ratios?
We are hesitant to try to draw direct comparisons between the mutants and the behavior of the wildtype embryo at the corresponding NCR. This is because, in the context of these uniform mutants, the NCR is determined by a combination of at least three factors that we cannot measure or control for: the unknown strength of Toll signaling, the unknown capacity of Toll signaling (ie, the potential saturation of the cytoplasmic enzymes controlled by Toll signaling), and, most importantly, the lack of a shuttling mechanism that concentrates Dl on the ventral side of the embryo. As such, the NCR does not represent a continuous variable that transforms the behavior of one mutant into another (or from mutants into wt DV coordinates), as it does along the DV axis in wildtype embryo. This is why the mutant studies are presented as boxplots. At best, we were comfortable only in using the uniform mutants as an allelic series to produce gross trends. We have added a brief statement describing the shuttling caveat to the Results section (Lines 173-177).
(6) In the section related to Dl nuclear export, the language used to describe Dl kinetics is ambiguous. The term "movement" is used seemingly as a catch-all for nuclear-importexport as distinguished from diffusion. However, diffusion is also a form of movement. Could this section be reworked to explicitly distinguish nuclear import-export and diffusive movements?
We appreciate the reviewer’s suggestion and agree that the language used to describe Dl kinetics could be more precise. By way of explanation, the pCF analysis calculates the time scale on which Dl can exit the nucleus. pCF only gives a signal if it sees the same Dl molecule twice, at two different locations after some Δt amount of time has passed. Because of this, if a given Dl molecule in a ventral nucleus is being tracked, then that molecule has some probability that it is bound to DNA initially, which means it will take, on average, longer to exit the nucleus than a Dl molecule not initially bound to DNA. Therefore, on the ventral side, the time scale on which Dl exits the nucleus is longer than on the dorsal side (where DNA binding is not happening). This can be true even if the nuclear export rate constants are the same on the ventral side vs the dorsal side. As such, we were careful to choose language that did not imply that we were talking about a nuclear export rate constant. We have added this discussion to the end of the relevant Results section (Lines 308-315).
We have also revised this section to explicitly distinguish between the mobility associated with exiting the nucleus and diffusive movement, while still trying to distinguish between the time scale of exiting the nucleus vs the nuclear export rate. Specifically, we now refer to ‘time scale of nuclear export’ when discussing transport across the nuclear envelope and reserve the term ‘diffusion’ for passive intracellular movement. Furthermore, we have edited a sentence in this section (Lines 291-293) to describe the distinction we are making between the time scale measured by pCF and the time scale commonly associated with nuclear export (that is, the reciprocal of the rate constant). We hope this clarification improves readability and conceptual clarity.
Last Part:
(1) There is an undersold argument centered on Michaelis-Menten kinetics that needs to be explicitly presented, especially since it motivates the final experiments of the paper, which are challenging. In the two sections describing how the data do not adhere to expectations based on Michaelis-Menten Kinetics, the assertion that "the fraction of immoble Dl is expected to decrease with increasing nuclear total Dl concentration" is only intuitively true if the system is saturated. Is the system demonstrably saturated? Another interpretation of this would be that these results demonstrate that the system is likely not saturated. In any case, the authors need to devote some space in the introduction and/or results and/or discussion to fully motivate this point.
We agree that the reviewer has raised an important point: if the system is very far from saturation, then the fraction of immobile Dl is not expected to decrease with increasing nuclear total Dl concentration. But neither would it increase; it would instead stay flat. To correct this mistake, we have edited the sentences in question to acknowledge the farfrom-saturation scenario, saying “at best, [the fraction bound] remain[s] constant” (Line 209). As such, our original point, which is that in no case would the fraction immobile increase [unless something else is going on besides affinity-based binding to DNA], it still valid.
(2) Wouldn't any argument on the basis of Michaelis-Menten need to rely on the assumption that the system is at steady-state? Reeves 2012 concludes that during the times measured here, Dl does not reach a steady state. It would be good, in the context of the point above, for the authors to clarify how this impacts the expectations of saturation and the application of M/M kinetics.
We thank the reviewer for raising this important point. We apologize for not being clear on our points about M/M kinetics and would like to stress again that we are not claiming the system is has M/M kinetics. We appealed to M/M kinetics only as a simple, intuitive example of a saturating system to point out the difference between bound concentration vs bound fraction as functions of total concentration. We did this because previous feedback on our manuscript suggested that the difference between these two variables needed to be made clearer. Because this point seemed controversial with both reviewers, we removed all mention of M/M kinetics and simply refer to the system as “saturating.” For further explanation, see the first paragraph of our response to Reviewer 1’s “weaknesses” in the public review.
(3) It is not clear to me how the inclusion of wild-type, GFP-tagged dorsal in the experimental setup for Figure 5 is not confounding. For the S317 (phospho-) mutant, GFPtagged alleles of both phospho- and wild-type Dl are expressed. The reasoning is that not enough phospho-mutant Dl gets into the nucleus, and this makes it difficult to distinguish the dorsal from the ventral side of the embryo, so in a dl mutant background, there is expression of wt GFP-dl from a BAC, and nos>Gal4 driven expression of a GFP-tagged S317A mutant dl. The measurements show that on the ventral side of the embryo, there is no difference in the fraction of bound Dl. Couldn't this be predominantly binding of wildtype GFP-Dl? How is this interpretable? Wouldn't it be easier to perform these measurements in a Tl 10b background (or to cross in UAS>Tl[10b]) and for the only GFPtagged dl to be S317A? The same goes for the S234 mutant (could be done in the pelle mutant background).
We thank the reviewer for raising the point that the confounding effect of wildtype Dl makes it difficult to interpret the results from the 317A mutant. Under the circumstances of the experimental design, we can best conclude that, if the null hypothesis is incorrect, the effect size was too small to detect with our sample size. As such, we have modified our discussion of the results of this experiment to carefully explain this caveat (rather than confidently saying that Toll phosphorylation has no effect). For further explanation, see the second paragraph of our response to Reviewer 1’s “weaknesses” in the public review, as well as our response to the related question raised by Reviewer 2 in the public review.
Minor issues/typo stuff:
(1) This reviewer notes that the submitted materials contain neither line numbers nor page numbers.
We appreciate the reviewer’s feedback. We have now included line numbers and page numbers in the revised manuscript for easier reference.
(2) First paragraph of results: "We imaged small regions of the embryo..." The parenthetical statement only cites pixel size and directs the reader to the methods. Without the total number of pixels, the pixel size value does not clarify how "small" the imaged region is. Consider including the xy area, pixel dimensions, and pixel size here to assert the smallness of the imaged area.
We have added the requested information.
(3) Second paragraph, Introduction: "Dorsal, one of three (Drosophila) homologs to mammalian NF-kB" (Add Drosophila). Also, aren't these orthologs?
We have made these changes.
(4) Last sentence of last paragraph in the introduction: Kind of a throw-away sentence. Consider revising.
We thank the reviewer for making this point; the sentence was originally constructed to state that our quantitative measurements resulted in a biologically significant discovery. However, because Reviewer 2 also mentioned the question of biological significance, we have changed this final sentence to explicitly mention of what the biological significance is: namely, an understanding of the Dl gradient that has superior dynamic range, spatial range, robustness, and precision.
(5) Where is the median line in the S317A boxplot in Fig 5C?
The median line is at ψ = 0. We have added an explanation of this to the Figure legend.
(6) Materials & Methods: Fly transformation, typo: Drosophila embryos were injected with 0.5 µl of each pUAST construct..." The volume of an entire Drosophila embryo is less than 0.5 µl, please revise the units to reflect the value injected. Most likely an absolute volume unit was stated when rather a concentration of an injection solution, delivered at significantly smaller volumes was intended.
We thank the reviewer for catching this typo. It was intended to indicate a concentration of 0.5 ng/μL, and we have made the appropriate changes.
Reviewer #2 (Recommendations for the authors):
(1) Perhaps this has been described in a prior publication (if this is the case, please simply state this somewhere in the Methods section where Dl-GFP embryos are described), but since Dl-GFP embryos have one copy of endogenous dl and one copy of Dl-GFP, how do potential differences in tagged vs. non-tagged Dl interactions with DNA or Cact affect their findings?
The reviewer brings up a good point, and we acknowledge that any time a protein is tagged with GFP, the behavior of the protein may be affected. We have now explicitly added this caveat to our discussion in a new paragraph on Lines 420-429.
(2) In the Discussion section, the authors argue that a major implication of their findings is the possibility that Cact binds Dl in the nuclei would imply that the true (active) Dl gradient may be unknown unless the unbounded Dl is separated from the Dl/Cact (inactive form). While this is an interesting point, this idea is not supported by the findings of Figure 5B where there is no effect in the fraction of Dl bound to DNA in the reduced Cactus binding mutants. The authors should report what happens in lateral regions in Figure 5 because perhaps there is an effect there (see comment on this in the Public Review).
We thank the reviewer for the insight, as we did not directly discuss the implications of the middle column of Fig. 5B on our hypothesis. Indeed, our hypothesis is not supported by Fig. 5B; it is instead inconclusive (failure to reject H0). This is why we designed the second experiment (Fig. 5C) to test the Cactus hypothesis, because the effect size would be greater on the dorsal side.
Furthermore, as pointed out by both reviewers, the presence of wildtype Dl-GFP in these experiments is confounding. We have discussed this elsewhere in our rebuttal, but briefly, this problem resulted in needing larger effect sizes to detect a statistically significant difference between wt and the mutant populations. This was a necessary evil that we were willing to deal with in order to ensure the Dl gradient could be established so that the dorsal vs ventral sides would be distinguishable. We have added a fuller discussion of these issues to the relevant Results section (Lines 333-336, 343-345, 354-359, 365-369) and also the Discussion section (Lines 412-418), including underscoring the fact that, from a falsification standpoint, the results in Fig. 5B do not allow us to reject either null hypothesis, possibly due to the confounding effect of wildtype Dl. We appreciate the reviewer’s point about this, and believe the changes suggested by the reviewer have improved the manuscript.
On the other hand, we respectfully disagree with the reviewer that investigating either mutant in the lateral regions of the embryo would bear fruit. To the first approximation, it would be the average between the behaviors on the ventral vs. dorsal sides. For the S317A mutant, neither the ventral nor the dorsal side was conclusive in regards to our hypotheses. (Although we admit here that further investigation into why the S317A column in Fig. 5C was statistically different from wildtype, in the opposite direction from the S234P mutant, may be interesting in future work.) For the S234P mutant, the data were more conclusive on the side of the embryo where the effect size was expected to be large enough to detect a difference. In the lateral regions, the expectation would be that the effect size would be intermediate, which would make the interpretation of the results more difficult (i.e., more likely to be inconclusive). In contrast, as Fig. 5C is already conclusive, we are not confident there would be more information gained by imaging the lateral regions.
(3) Is Figure 5A a wild-type embryo? If so, I think that the labels are misleading or unclear. Also, is it the same image as in Figure 1A? If so, I suggest replacing this with a schematic since it does not add any new data.
We have eliminated the labels for the mutants and have added the following comment to the figure 5 legend “Same embryo as in Fig. 1A”.
(4) Also in Figure 5, I suggest using labels to indicate the schematics instead of simply using their location. You could use 5A', 5A' and 5A', for example.
We have made the suggested changes.
(5) The use of some technical labels makes some figures difficult to read. I suggest using more simple labels for mutants in Figure 3F (replace R063C) or Figure 5B, C (replace S234P and S317A).
We have made changes to Fig. 3F, Fig. 5B,C, and the corresponding places in the figure legends. We have labeled R063C as ↓DNA, S317A as ↓Toll, and S234P as ↓Cact.
(6) I suggest reporting p-values consistently. For example, in Figure 4B, they use one or two asterisks to denote p-values less than 0.07 and 0.05, respectively, which is somehow arbitrary and unconventional. Why not report the actual values as in Figure 5C, for example? (By the way, I would report in Figure 5B the actual p-values as well, since a nonsignificant value is also reported in Figure 5C. Also in Figure 5C, report values in the same notation (decimal or scientific), i.e., either put 0.005 as 5x10^-3 or 10^-3 as 0.001).
We have made the suggested changes.