5,388 Matching Annotations
  1. Mar 2025
    1. Author response:

      The following is the authors’ response to the original reviews.

      Recommendations for the authors:

      Reviewer #1 (Recommendations for the authors):

      This paper provides a compelling analysis of chiton genomes, revealing extensive genomic rearrangements despite the group's apparent morphological stasis. By examining five reference-quality genomes, the study identifies 20 conserved molluscan linkage groups that are subject to significant rearrangements, fusions, and duplications in chitons, particularly in the basal Lepidopleurida clade. The high heterozygosity observed adds complexity to genome assembly but also highlights notable genetic diversity.

      We also note the comment from this reviewer that “more information is needed to clarify how this affects genome assembly and evolutionary outcomes.” We strongly agree; although it is outside the scope of this study, this may help develop future work on that topic.

      The research challenges the assumption that morphological stability implies genomic conservatism, suggesting that dynamic genome structures may play a role in species diversification. Although limited by the small number of molluscan genomes available for comparison, this study offers valuable insights into evolutionary processes and calls for further genomic exploration across molluscan clades. Some minor comments need to be tackled:

      (1) Line 39: 'major changes'. Please, better explain what you mean here?

      Clarified as major morphological change

      (2) Lines 70-73: refer to 'extant' cephalopods.

      Corrected

      (3) There is an inconsistency in the use of "Callochitonida" (lines 76, 85, 140, 145, Table S3, Figure S3) and "Chitonida s.l." (Figures 2, 3, and 4) throughout the text, figures, and supplementary material. To maintain clarity and avoid confusion, I recommend choosing one taxon and using it consistently across all sections of the manuscript. This will ensure coherence and help readers follow the discussion without ambiguity.

      An explanation has been added to the introduction and other instances in the text changed to Chitonida s.l. for consistency

      (4) Overall, the conclusions introduce several important topics and additional information that were not addressed earlier in the paper. It would enhance the coherence and impact of the study to introduce these points in the introduction, as they highlight the broader significance and relevance of the research. Integrating these key aspects earlier on would better frame the study's objectives and provide readers with a clearer understanding of its importance from the outset.

      The paragraph about chiton natural history and some additional lines have been moved to the introduction

      (5) Lines 242-245 and 254-256: While I agree with the authors on the remarkable results found in molluscs, particularly in polyplacophorans, I suggest toning down the comparisons with lepidopterans. The current framing may come across as dismissive towards butterflies, which does not seem necessary. It's true that biases exist in studying taxa that are more charismatic due to factors like diversity or aesthetic appeal, but the goal should be to emphasize the value of polyplacophorans without downplaying the significance of butterfly research. Instead, the focus should be on highlighting chitons as an exciting new model for understanding key evolutionary processes like synteny, polyploidy, and genome evolution. This shift would underscore the importance of polyplacophorans in a positive light without diminishing the value of lepidopteran studies.

      This sentence has been rephrased to adjust the tone of this paragraph

      (6) Figure 3: should be read 'Polyplacophora'.

      Corrected

      Reviewer #2 (Recommendations for the authors):

      I hope these comments by line number are helpful, despite my lack of experience with comparative genomics:

      We note the general comment from this reviewer that “most chiton genomes seem to be relatively conserved” may be  a misunderstanding from our presentation; we have added some additional notes in the first part of the discussion to ensure that this is clear to all readers.

      The reviewer also pointed out that “geologically recent events that do not especially represent the general pattern of genome evolution across this ancient molluscan taxon”. To clarify, the (limited) phylogenetic evidence suggests these changes are a longer term pattern throughout chiton evolution, since chromosomal rearrangements are found when comparing congeneric species (Acanthochitona spp., Fig 4C) and also across orders (Fig 4B). This has been added to the conclusions, as this is clearly an important point that was not adequately explained in the original text.

      (1) Line 72: It is true that adaptive radiations occur and are an interesting general model for how diversification can lead to species-rich taxa. However, there are other "non-adaptive" processes that can lead to geographically isolated species that are not much differentiated in their ecological or morphological diversity. The sentence here implies that such adaptive radiation is a necessary correlation of species richness. I agree that chitons have hardly frozen in time since the Paleozoic.

      This is clarified by moving some additional natural history aspects of chitons to the introduction, also as suggested by the first reviewer

      (2) L113: I am curious about how this character optimization was accomplished to allow the authors to reconstruct the HAM (hypothetical ancestral mollusc) chromosome number as 20 when the range of variation in Polyplacophora is 6 to 16 (mode 11), and chitons are part of the sister taxon to conchiferans. Is this dependent on the chromosome numbers found in the outgroup?

      We inferred ancestral linkage groups (“chromosomes”) based on comparison with other gastropods and bivalves noted in the methods; the other study cited (Simakov et al. 2022) used a broader selection of metazoans and also predicted an ancestral Mollusca karyotype of 1N=20.

      (3) L116: "Using five chromosome-level genome assemblies for chitons, we reconstructed the ancestral karyotype for Polyplacophora (more strictly the taxonomic order Neoloricata), and all intermediate phylogenetic nodes to demonstrate the stepwise fusion and rearrangement of gene linkage groups during chiton evolution (Fig. 3)."

      This is probably fine, but I had to struggle to understand what genome events happened between the Acanthochitona species. Are the chromosomes merely ordered and numbered by chromosome size and the switch in position between chromosomes 1 and 3 just has to do with the chromosomes 4+5, so they become the largest chromosome, and the former 1 is now 3? Confusing! The way it is drawn it seems like this implies more genome rearrangement than occurred, whereas if the order was maintained it would be more obvious that there were simply two chromosome fusions.

      The linkage groups are numbered in order of size, which is the typical way they would each be presented if the taxon was illustrated alone. Here this allows the reader to understand how the fusions or rearrangements have shifted the volume of genetic information between groups especially in comparison to the molluscan or polyplacophoran ancestor. In Fig 4 we instead decided to present the linkage groups in a revised form, so that each transition from the nearest ancestor is visible in more detail. We have added these points in the figure caption for Fig 3 which should make it easier for new readers to understand the presentation.

      (4) L481: Typo: A. rubrolineatain should be A. rubrolineata.

      Corrected

      (5) Figure 4: I am a little confused with what is meant by an "Ancestor" in these diagrams. For example, for comparing the two species of Acanthochitona with a hypothetical ancestor, it seems that the ancestor should be like one of the two, not different from both.

      I am looking at Ancestor "3" compared with the Acanthochitona rubrolineata "3" and A. discrepans "4". Again, I assume that the latter is "4" because it is slightly smaller than a new "3" and now the new "3" corresponds to "1" in the other Acanthochitona. This figure does help interpret Figure 3.

      To the point about reconstructing ancestral types; the two species both descended from a common ancestor. In morphology it is sometimes clear that one lineage retains more plesiomorphic character states; but in this case we must assume equal probability of change in any direction. The ancestor is a compromise that estimates the shortest distance to both descendants.

      We understand how the numbers were unclear and potentially distracting. This has been added to the figure caption, we are grateful for the feedback that will certainly help future readers.

    1. Author response:

      The following is the authors’ response to the original reviews.

      Public Reviews:

      Reviewer #1 (Public review):

      Summary:

      The study investigates protein-protein interactions (PPIs) within the nuage, a germline-specific organelle essential for piRNA biogenesis in Drosophila melanogaster, using AlphaFold2 to predict interactions among 20 nuage-localizing proteins. The authors identify five novel interaction candidates and experimentally validate three of them, including Spindle-E and Squash, through co-immunoprecipitation assays. They confirm the functional significance of these interactions by disrupting salt bridges at the Spn-E_Squ interface. The study further expands its scope to analyze approximately 430 oogenesis-related proteins, validating three additional interaction pairs. A comprehensive screen of around 12,000 Drosophila proteins for interactions with the key piRNA pathway player, Piwi, identifies 164 potential binding partners. Overall, the research demonstrates that in silico approaches using AlphaFold2 can link bioinformatics predictions with experimental validation, streamlining the identification of novel protein interactions and reducing the reliance on extensive experimental efforts. The manuscript is commendably clear and easy to follow; however, areas for improvement should be addressed to enhance its clarity and rigor.

      Major Concerns:

      (1) While AlphaFold2 was developed and trained primarily for predicting protein structures and their interactions, applying it to predict protein-protein interactions is an extrapolation of its intended use. This introduces several important considerations and risks. First, it assumes that AlphaFold's accuracy in structure prediction extends to interactions, despite not being explicitly trained for this task. Additionally, the assumption that high-scoring models with structural complementarity imply biologically relevant interactions is not always valid. Experimental validation is essential to address these uncertainties, as over-reliance on computational predictions without such validation can lead to false positives and inaccurate conclusions. The authors should expand on the assumptions, limitations, and risks associated with using AlphaFold2 for predicting protein-protein interactions.

      We appreciate the reviewer's point. The prediction of protein-protein interactions using AlphaFold2 relies on the number of conserved homologous sequences and previous conformational data(8) (Jumper, J. et al. Highly accurate protein structure prediction with AlphaFold. Nature 596, 583–589 (2021)). We added sentences explaining the limitations and risks of the AlphaFold2 prediction method in Introduction and the end of Result and Discussion of the revised manuscript, respectively.

      Page 5, Line 67;

      “AlphaFold2 requires sequence homology information to predict protein-protein interactions and the complex structure model. The reliability of these predictions is basically dependent on the strength of co-evolutionary signals(9).”

      Page 6, Line 84;

      “AlphaFold2 was initially trained to predict the structure of individual proteins(8). Its application to complex prediction is an extrapolative use beyond its original intended scope, and its accuracy remains unverified. Even high-confidence predictions may not correspond to actual interactions, necessitating experimental validation to confirm whether predicted protein dimers truly bind.”

      Page 21, Line 361;

      “This study identifies several potential protein interactions, but AlphaFold2 predictions require caution. Protein-protein interactions involve conformational changes and dependencies on ligands, ions, and cofactors, which AlphaFold2 does not consider, potentially reducing prediction accuracy. Notably, the presence of a high-scoring model in terms of structural complementarity does not guarantee that the interaction is biologically significant.”

      (2) The authors experimentally validated three interactions, out of five predicted interactions, using co-immunoprecipitation (co-IP). They attributed the lack of validation for the other two predictions to the limitations of the co-IP method. However, further clarification on the potential limitations of the co-immunoprecipitation behind the negative results would strengthen the conclusions. While co-IP is a widely used technique, it may not detect weak or transient interactions, which could explain the failure to validate some predictions. Suggesting alternative validation methods such as FRET or mass spectrometry could further substantiate the results. On the other hand, AlphaFold2 predictions are not infallible and may generate false positives, particularly when dealing with structurally plausible but biologically irrelevant interactions. By acknowledging both the potential limitations of co-IP and the possibility of false positives from AlphaFold2, the authors can provide a more balanced interpretation of their findings.

      We appreciate the reviewer's point of view. We have used the co-IP method to detect interactions in this study. However, as the reviewer pointed out, it is likely that weak and transient interactions may not be detected. We added a note on the detection limits of the co-IP method and the possibility that AlphaFold2 method produces false positives in the revised manuscript.

      Page 12, Line 197;

      “While co-immunoprecipitation is a widely used method, it may not always detect weak or transient interactions. Other validation methods, such as FRET or co-localization assay in culture cells, could offer further insights to support the results. It is also important to note that AlphaFold2's predictions are not definitive and may lead to false positives, particularly when analyzing a large number of interactions.”

      (3) In line 143, the authors state that "This approach identified 13 pairs; seven of these were already known to form complexes, confirming the effectiveness of AlphaFold2 in predicting complex formations (Table 2). The highest pcScore pair was the Zuc homodimer, possibly because AlphaFold2 had learned from Zuc homodimer's crystal structure registered in the database." While the authors mentioned the presence of the Zuc homodimer's crystal structure, they do not provide a systematic bioinformatics analysis to evaluate pairwise sequence identity or check for the presence of existing structures for all the proteins or protein pairs (or their homologs) in databases such as the Protein Data Bank (PDB) or Swiss-Model. Conducting such an analysis is critical, as it significantly impacts the novelty and reliability of AlphaFold2 predictions. For instance, high sequence identity between the query proteins could lead to high-scoring models for biologically irrelevant interactions. Including this information would strengthen the conclusions regarding the accuracy and utility of the predictions.

      We appreciate the reviewer's critical point. The AlphaFold2 method generates a high confidence score when the 3D structure of the protein of interest, or of proteins with very similar sequences, is solved. We investigated whether the proteins used in this study are included in the 3D structure database (PDB) and added the information as a supplemental table S2. The following sentences were added to explain the structural references that AlphaFold2 has learned in the revised manuscript.

      Page 9, Line 150;

      The structures of the 20 proteins used in this study have been analyzed to varying extents in previous studies (Supplementary Table S2). A complex of Vas and the Lotus domain of Osk has been reported(20), and based on this complex structure, the interaction between Vas and Tej Lotus domain was predicted with a high score. Although the conformational analyses of the RNA helicase domain and the eTud domain have been reported previously, many of those cover only a subset of the regions and unlikely to affect our predictions in this study.

      The predicted 3D structures and the Predicted Aligned Error (PAE) plots for the 12 pairs, are shown in Fig. 1C.

      (4) While the manuscript successfully identifies novel protein interactions, the broader biological significance of these interactions remains underexplored. The manuscript could benefit from elaborating on how these findings may contribute to understanding the piRNA pathway and its implications on germline development, transposon repression, and oogenesis.

      We added to the revise manuscript the potential biological significance of the novel protein-protein interactions presented in this manuscript as follows;

      Page 16, Line 268;

      “In this study, three novel protein-protein interactions were predicted and experimentally confirmed. AlphaFold2 also predicted the 3D structure of these complexes, providing insight into the important regions involved in complex formation. These predictions will provide fundamental information to elucidate nuage assembly. Nuage is thought to form by liquid-phase separation; however, direct protein-protein interactions likely occur within protein-dense nuage, facilitating RNA processing. Although the precise roles of individual interactions require further study, characterization of protein-protein interactions within nuage will help clarify the mechanism of piRNA production.”

      Reviewer #1 (Recommendations for the authors):

      Minor Concerns:

      (1) In the Materials and Methods section, the authors thoroughly describe the computational infrastructure (SQUID at Osaka University) and the use of AlphaFold2. However, it would greatly benefit the readers to include a detailed breakdown of the computational cost. Understanding the computational cost (in terms of time, CPU/GPU hours, or other relevant metrics) for predicting 3D structures, especially for 400 protein pairs, would provide valuable insight into the efficiency and scalability of the approach. This would enhance the practical relevance of the methodology section and offer a better understanding of the resources required, beyond just the infrastructure description.

      Thank you for your valuable suggestion. The following descriptions were added in the revised manuscript.

      Page 24, Line 403;

      “The calculation of the MSA took on average 2-4 hours per protein, with the more homologs of the protein in query, the longer it took.”

      Page 24, Line 409;

      “Prediction of dimer structure took approximately 1-2 hours per pair on average, depending on protein size. Each user can compute 100~200 pairs of calculations per day, but since the supercomputer is shared, job availability varies with overall demand.”

      (2) The manuscript will benefit from a review for grammatical accuracy and clarity, especially in complex explanations. For example, in Line 160: "The predicted dimer structures of Me31B_Tral and Cup_Me31B showed the score of 0.74 and 0.68, respectively (Table 2)." could be revised to "The predicted dimer structures of Me31B_Tral and Cup_Me31B showed scores of 0.74 and 0.68, respectively.

      Thank you very much for pointing it out. Correction has been made to the text pointed out (Page 10, Line 170).

      (3) For alphafold3 webserver, please use (https://alphafoldserver.com/) instead of (https://golgi.sandbox.google.com/about).

      Thank you very much for pointing it out. The URL has been changed in the revised manuscript (Page 25, Line 422).

      Reviewer #2 (Public review):

      Summary:

      In this paper, the authors use AlphaFold2 to identify potential binding partners of nuage localizing proteins.

      Strengths:

      The main strength of the paper is that the authors experimentally verify a subset of the predicted interactions.

      Many studies have been performed to predict protein-protein interactions in various subsets of proteins. The interesting story here is that the authors (i) focus on an organelle that contains quite some intrinsically disordered proteins and (ii) experimentally verify some (but not all) predictions.

      Weaknesses:

      Identification of pairwise interactions is only a first step towards understanding complex interactions. It is pretty clear from the predictions that some (but certainly not all) of the pairs could be used to build larger complexes. AlphaFold easily handles proteins up to 4-5000 residues, so this should be possible. I suggest that the authors do this to provide more biological insights.

      We thank the reviewer for his kind suggestions. In this study, protein dimers were screened on the assumption that the two proteins bind 1:1; in some cases, multiple binding partners were predicted for a single protein. For example, Spn-E was predicted to bind Tej and Squ, respectively. Therefore, for Spn-E_Squ_Tej, we used the latest AlphaFold3 to predict the trimeric structure, which has already been described in the first manuscript. In addition, as suggested by the reviewer, other possible trimer results were also added in the revised manuscript as follows;

      Page 15, Line 249;

      “In addition to the Spn-E_Squ_Tej complex, 1:1 dimer prediction described above further suggested potential trimers (Fig. 1; Supplemental Fig. S4). For example, Tej protein is predicted to bind both Vas and Spn-E, and AlfaFold3 indeed further predicted a Vas_Tej_Spn-E trimer, where Tej’s Lotus and eTud domains interact with Vas and Spn-E, respectively. However, Lin et al. reported that Tej binds exclusively either with Vas or Spn-E, but not simultaneously(17), in Drosophila ovary, suggesting that the predicted trimers may be weak or transient. Similarly, the BoYb_Vret_Shu and the Me31B_Cup_Tral trimers remain hypothetical and require experimental verification (Supplemental Fig. S4).”

      Another weakness is the use of a non-standard name for "ranking confidence" - the author calls it the pcScore - while the name used in AlphaFold (and many other publications) is ranking confidence.

      “pcScore” has been changed to “ranking confidence”

      Reviewer #2 (Recommendations for the authors):

      (1) The pcScore is actually what is called RankingConfidence. Also, many other measures have been developed by other groups (based on PAE for instance) - these could be compared.

      Thank you for your valuable suggestions. While other indicators are being developed, we have computed the affinity of the complex based on the predicted three-dimensional structure by using PRODIGY web server. The description was added in the revised manuscript as follows;

      Page 18, Line 300;

      “The ranking confidence score reflects the reliability of AlphaFold2's predicted structure but does not always ensure accuracy. Therefore, we assessed complex affinity based on the predicted three-dimensional structures (Supplemental Table S6). Most dimers with high ranking confidence scores exhibited low Kd values indicative of high affinity, while some showed high Kd values indicating weak interactions (Supplemental Table S6). For example, the Baf_Vas complex had a high AlphaFold2 ranking confidence score (0.85) but a relatively high Kd value (1.1E-4 M), indicating low affinity. Consistently, Baf_Vas binding was not detected in Co-IP experiments (Fig. S5C). Although accurate Kd prediction may be limited due to insufficient structural optimization, it could serve as a valuable secondary screening tool following AlphaFold2 predictions.”

      (2) A statistical estimate of FDR for binding to the PIWI protein needs to be estimated. It is possible that 1.6% of random proteins (from another species for instance) also obtain ranking confidence over 0.6, i.e. how trustful are the predictions?

      Thank you for the insightful comments. Unfortunately, it is difficult to infer the FDR from the value of ranking confidence. Presumably, the accuracy will vary depending on the target protein, since the number of homologs and known conformational information will differ. In the case of Piwi, the FDR is expected to be relatively low since the conformation of the protein on its own has been experimentally determined. However, even for Piwi complexes with high values of ranking confidence, the estimated affinity varied from high to low (Supplemental Table S6). Therefore, it may be useful to conduct further secondary evaluation for AlphaFold2 predictions with high ranking confidence.

      (3) Identification of pairwise interactions is only a first step towards understanding complex interactions. It is pretty clear from the predictions that some (but certainly not all) of the pairs could be used to build larger complexes. AlphaFold easily handles proteins up to 4-5000 residues, so this should be possible. I suggest that the authors do this to provide more biological insights.

      Already mentioned above.

      (4) The comparisons of ranking confidence vs ipTM/pTM are less interesting (by definition ranking confidence is virtually identical to ipTM).

      Thank you for the thoughtful comment. As the reviewer pointed out, there is not much difference between ranking confidence and ipTM shown in Fig. 1A. A high value of pTM (firmly folding) tends to increase ranking confidence, while a low value of pTM (many disorder regions) tends to decrease ranking confidence. Therefore, it may be useful to change the threshold for confidence for each protein pair.

    1. Author response:

      We thank the reviewers for the detailed evaluations and thoughtful comments, which have improved the clarity and readability of this manuscript. We have responded to all reviewer comments and incorporated their suggested changes into the text and figures. We have also included new experimental results suggested by reviewer 2, which further strengthen our main conclusion.

      Point-by-point description of the revisions

      Reviewer #1:

      (1) Introduction, page 3: The statement "Single dimeric kinesin moves processively along microtubules in a hand-over-hand manner by alternately moving the two heads in an 8-nm step toward the plus-end of the microtubule" is inaccurate. The kinesin heads take ~16 nm steps, while the center of mass advances in ~8 nm increments. Please adjust the wording accordingly.

      (2) Introduction, page 5: In the sentence "These results are consistent with the closed and open conformations of the nucleotide-binding pocket in the rear and front heads of microtubule-bound kinesin dimers observed in cryo-electron microscopy (cryo-EM) studies," I recommend changing the order to align with the previous sentence. The correct order would be "These results are consistent with the open and closed conformations of the nucleotide-binding pocket in the front and rear heads."

      We thank the reviewer for pointing out our misunderstandings. We have corrected these sentences accordingly (lines 45-47 and lines 111-112).

      Reviewer #2:

      MAJOR CONCERNS

      Limitations of this study: The authors need to discuss the limitations of their work. 1) They used a cys-lite kinesins mutant and introduced new surface-exposed cysteines. These mutants have lower kcat values than WT. 2) They used fluorescently labeled ATP molecules, which are hydrolyzed 10 times slower than unlabeled nucleotides. 3) They still observe crosslinking under reducing conditions and partial (but almost complete) crosslinking under oxidized conditions. 4)They assumed that cysteine crosslinked orientation mimics the orientation of the neck-linker in the front and rear conditions. The authors clearly pointed to these issues in the Results section. While these assumptions are also supported by several control experiments, the authors need to acknowledge some of these limitations in the Discussion as well.

      We have now reiterated some of the key caveats in the Discussion, and newly described in the Results section those points not mentioned in the original manuscript that do not affect the conclusion. We also added a summary of the limitations and caveats into the first paragraph of the Discussion section (lines 425-431).

      (1) We added a sentence in the Results section to describe that the ATP-binding kinetics of the Cys-light mutant remained consistent with previous studies as follows: “First, we demonstrated that k<sub>+1</sub> and k<sub>-1</sub> of the wild-type head without Cys-modification were unchanged after oxidization (Table 1) and were comparable to those previously reported (Cross, 2004)” (lines 163-166). The reduced kcat values of cysteine pair-added mutants before crosslinking were primarily due to reduced microtubule association rate (data not included in this manuscript). We have added a sentence in the Results section describing the kcat results as follows: “The reduced ATPase activity primarily results from a decreased microtubule association rate (data to be presented elsewhere) with little change in ATP binding or microtubule dissociation rates (Table 1).” (lines 144-146).

      (2) Fluorescently-labeled ATP was used to determine the ATP off-rates of the E236A mutant monomer and E236A rear head of the E236A/WT heterodimer. Two caveats in these measurements could lead to underestimating the ATP off-rate: 1) The off rate of Alexa-ATP from the head may be reduced compared to unmodified ATP, as Alexa-ATP driven motility showed a 10-fold reduce velocity. 2) The ATP off-rate of the E236A mutant may differ from that of the rear head in the wild-type dimer, since the E236A mutant likely stabilizes the neck linker-docked state more strongly than in the rear head of the wild-type dimer. These points are crucial for evaluating the results of ATP off-rate and the affinity for ATP, so we have added sentences in the Discussion section as follows: “We note, however, that this K<sub>d</sub> of ATP may somewhat underestimate the true value in wild-type kinesin for two reasons: first, the E236A mutation likely stabilizes the neck linker-docked, closed state more than in the rear head of the wild-type dimer (Rice et al., 1999), and second, the Alexa-ATP used to measure the ATP off-rate of E236A head showed ~10-fold smaller velocity compared to unmodified ATP, partly due to a slower ATP off-rate (Figure 2-figure supplement 3).” (lines 449-454).

      (3) Under reducing condition, the rear head crosslink contained 30% crosslinked species, while under oxidized condition, the front head crosslink contained 11% un-crosslinked species (Figure 1-figure supplement 1). These heterogeneities likely affect the rate constants of K<sub>-1</sub> for rear head crosslink and K<sub>2</sub> for front head crosslink, as crosslinked and un-crosslinked species showed significantly different rate constants. However, we did not use the rear head crosslink result to determine K<sub>-1</sub>, since ATP hydrolysis likely occurred before reversible ATP dissociation. Instead, we used E236A monomer to estimate the K<sub>-1</sub> of the rear head. In addition, the result for K<sub>2</sub> of the front head crosslink was further validated using the E236A/WT heterodimer, which will be described in the next section.

      (4) This is an important point, and therefore, we conducted experiments using the E236A/WT heterodimer (including new experimental results of ATP binding kinetics of the front head) and obtained consistent results. To address this point, we have revised the following sentences in the Discussion: “In the front head, backward orientation of the neck linker has little effect on ATP binding and dissociation rates, both when measured for a monomer crosslink (Figure 2A, B) and for the front head of a E236A-WT heterodimer (Figure 4B, C, F).” (lines 432-433); “However, we found that the ATP-induced detachment rates from microtubule (K<sub>2</sub>) were similarly reduced for both the front head crosslink (7.0 s<sup>-1</sup>; Figure 3A) and the front WT head of the E236A/WT heterodimer (6.3 s<sup>-1</sup>; Figures 6D), suggesting that a step subsequent to ATP binding is gated in the front head.” (lines 437-441).

      Line 238, the authors wrote that "forward constraint on the neck linker in the rear head does not significantly accelerate the detachment from the microtubule." Can the authors comment on why the read-head-like construct has a low affinity for microtubules even in the absence of ATP (Line 220)? I believe that the low affinity of the head in this conformation is more striking (and potentially more important) than the changes they observe in detachment rates. The authors should also consider that they might not be able to reliably measure the changes in the dissociation rate in single molecule assays of this construct (especially if the release rate of the rear head in the oxidized condition increases a lot higher than that of WT). The kymographs show infrequent and brief events, which raises doubts about how reliably they can measure the release rates under those imaging conditions. Higher motor concentrations and faster imaging rates may address this concern.

      The low microtubule affinity of the rear-head-like crosslink stems from an extremely slow ADP release rate upon microtubule binding, not from a fast microtubule-detachment rate. Using stopped-flow measurements of microtubule-binding kinetics (microtubule-stimulated mant-ADP release and microtubule association rates), we found that the rear-head-crosslink resulted in a 2,000-fold decrease in the microtubule-stimulated ADP-release rate. This finding also explains the reduced ATPase of the rear-head-crosslink (Figure 1E). Since this low microtubule-affinity state occurs in the ADP-bound state rather than the ATP-bound state, we hypothesized that the neck-linker docked ADP-bound state cannot effectively bind to microtubules, requiring neck-linker undocking for microtubule binding (Mattson-Hoss et al., Proc. Natl. Acad. Sci., 111, 7000-7005 (2014)). While we acknowledge that understanding slow microtubule binding in the neck linker docked state is important for elucidating the mechanism and regulation of microtubule-binding of the head, this paper focuses specifically on the mechanism and regulation of “microtubule-detachment”. We plan to present these microtubule-binding kinetics data in a separate manuscript currently in preparation.

      To explain the low microtubule affinity of the rear-head-crosslink, we added this explanation to the text; “because this constraint on the neck linker dramatically reduces the microtubule-activated ADP release rate (data to be presented elsewhere), creating a weak microtubule binding state” (lines 226-228).

      Although the rear head crosslinking construct under oxidative condition showed fewer fluorescent spots per kymographs (images) due to its low microtubule binding rate, we collected more than one hundred spots by recording additional microscope movies (N=140; Figure 3-figure supplement 2B), ensuring sufficient data for statistical analysis.

      Figure 2: How do the rates shown in Figure 2A-B compare to the previous kinetics studies in the field? The authors compare the dissociation rate of WT measured in rapid mixing experiments to that of E236A in smFRET assays. It is not clear whether these comparisons can be made reliably using different assays. Can the authors perform rapid mixing of E236A or try to determine the rate for the WT from smFRET trajectories?

      The results of ATP on/off rates are comparable to the previous stopped flow measurements of ATP binding to monomeric kinesin-1 on microtubule, which are 2-5 µM<sup>-1</sup>s<sup>-1</sup> and ~150 s<sup>-1</sup>, respectively (summarized in the review by Cross (2004)). We added a sentence as follows: “First, we demonstrated that K<sub>+1</sub> and K<sub>-1</sub> of the wild-type head without Cys-modification were unchanged after oxidization (Table 1) and were comparable to those previously reported (Cross, 2004).” (lines 163-166).

      As the reviewer pointed out, the rapid mixing and smFRET data cannot be directly compared due to the differences in temporal resolution and fluorescent probe used. In Figure 2E (2F in the revised version), we measured ATP dissociation rate for both WT and E236A using smFRET. Due to the lower temporal resolution, we could not accurately determine ATP binding rate using smFRET. Therefore, to compare the ATP binding rate between WT and E236A heads, we now have added stopped-flow measurements of mant-ATP binding to the E236A monomer, as shown in Fig. 2C and Figure 2-supplement 2, and described in the text (lines 182-185).

      Line 396: One of the most significant conclusions of this work is that the backward orientation of the neck linker has little effect on ATP binding to the front head. This is only supported by the results shown in Fig. 2A-B. Can the authors perform/analyze smFRET assays on the E236A/WT heterodimer to directly show whether the ATP binding rate to the WT head is affected or not affected by the orientation of the neck linker of the WT head?

      We agree with the reviewer that our finding about ATP binding to the front head is potentially significant in the kinesin field, as it has been widely believed that ATP-binding is suppressed in the front head. In our original manuscript, this conclusion was supported only by the measurement of ATP on-rate of the front-head-crosslink, which may differ from the front head of a dimer in which the backward orientation of the neck linker is maintained by the backward strain. Although the reviewer suggested performing smFRET experiments using E236A/WT heterodimer, smFRET have relatively low temporal resolution (50-100 fps) and cannot accurately measure the frequency of ATP binding, so we used this technique only to determine ATP off rates. In this revised manuscript, we now have added stopped-flow experiments to separately measure the ATP binding to the front and rear heads of the E236A/WT heterodimer. By labeling the rear E236A head with a fluorophore to quench the mant-ATP signal bound to the rear head, we successfully measured mant-ATP binding rate to the front head. We found that the ATP-binding rate to the front head was comparable to that of an unconstrained monomer head, providing direct evidence for our conclusion. The revised version includes Fig. 4 A-C (with Figure 4-supplement 2; Figs. 4 and 5 are swapped in order) showing the kinetics of ATP binding to the front and rear heads of the E236A/WT heterodimer, with corresponding text in the result section (lines 315-324).

      MINOR CONCERNS

      Lines 31 and 32: I recommend replacing "ATP affinity" with "ATP binding rate" or "the dissociation of ATP" to be more specific. This is because they do not directly measure the affinity (Kd), but instead measure the on or off rates.

      Line 41: Replace "cellar" with "cellular".

      Line 83: The authors should cite Andreasson et al. here.

      We have corrected these sentences accordingly (lines 31, 40, 85).

      Lines 83-86: It seems this sentence belongs to the next paragraph. It also needs a citation(s).

      This statement lacks experimental evidence and may confuse readers, so we have removed it for clarity.

      Line 151: It would be helpful to add a conclusion sentence at the end of this paragraph to explain what these results mean to the reader.

      A conclusion sentence of this paragraph has been added: “These results demonstrate that neck linker constraints in both forward and rearward orientations inhibit specific steps in the mechanochemical cycle of the head (lines 151-153)”.

      Lines 175-180: I recommend combining and shortening these sentences, as follows, to avoid confusing the reader: "To detect the ATP dissociation event of the rear head, we employed a mutant kinesin with a point mutation of E236A in the switch II loop, which almost abolishes ATPase hydrolysis and traps in the microtubule-bound, neck-linker docked state,"

      We have corrected these sentences accordingly (line 179-181).

      Line 314: "which was rarely observed ...". This is out of place and confusing as is. I recommend moving this sentence after the sentence that ends in Line 295.

      This sentence explains how the dark-field microscopy data was analyzed to determine whether the labeled head was in the leading or trailing position before detaching from the microtubule, but the explanation needs clarification. We removed the phrase “which was rarely observed for E236A-WT heterodimer” and simplified this sentence as follows: “Moreover, these observations allow us to distinguish whether the gold-labeled WT head was in the leading or trailing position just before microtubule detachment; the backward displacement of the detached head indicates that the labeled WT head occupied the leading position prior to detachment (Figure 5-figure supplement 1).” (lines 347-351).

      Line 300: Can the authors comment on why E236A/WT has a substantially lower ATPase rate than WT homodimer? Is it possible to determine which step in the catalytic cycle is inhibited?

      We demonstrated that the k<sub>2</sub> (microtubule-detachment rate) of the front head matched the ATP turnover rate of the E236A/WT heterodimer (Figure 6 B and E), suggesting that the inhibited step occurs after ATP binding in the front head. In contrast, the rear E236A head showed virtually no ATP hydrolysis activity, since in high-speed dark field microscopy, we observed forward step caused by rear E236A head detachment from microtubule only rarely, approximately once every few seconds (Figure 5-figure supplement 1). We added a sentence in the text as follows: “As described later, the reduced ATPase rate results from suppressed microtubule detachment of the front WT head, while the rear E236A head is virtually unable to detach from microtubules” (lines 311-313).

      Line 323: Is the unbound dwell time unchanged?

      The unbound dwell time exhibited a weak ATP-dependence, which we described only in Figure 5-supplement 2 (Figure 4-supplement 2 in the old version). We observed three distinct phases in the unbound dwell time based on mobility differences, with ATP dependence appearing only in the third phase. This finding suggests that ATP binding to the microtubule-bound E236A head is sometimes necessary for the detached WT head to rebind to the forward-tubulin binding site, indicating that the microtubule-bound E236A head occasionally releases ATP during the one-head-bound state (without the forward neck linker strain). To describe the ATP-dependence of the unbound dwell time, we added a sentence in the main text as follows: “In contrast, the dwell time of the unbound state of the gold-labeled WT head showed weak ATP dependence (Figure 5-figure supplement 2), indicating that the rear E236A head occasionally releases ATP when the front head detaches from the microtubule and the neck linker of E236A head becomes unconstrainted. This finding further supports the idea that forward neck linker strain plays a crucial role in reducing the reversible ATP release rate.” (lines 372-377).

      Line 331: I recommend replacing "ATP-induced detachment" with "nucleotide-induced detachment" for clarity.

      We have revised the phrase accordingly (line 371).

      Line 344: I recommend replacing "affinity" with "forward strain prevents the release of the nucleotide" or similar to avoid confusion. Forward strain reduces the off-rate of the bound nucleotide, rather than allowing ATP to bind more efficiently to the rear head.

      We agree to the reviewer’s comment and have corrected this sentence accordingly (line 338).

      Lines 376-385: G7-12 constructs are introduced in Figure 6, but the results in this paragraph are shown in Figure 5. They should be moved to Figure 6 to avoid confusion.

      To improve the readability, we have reorganized Figures 4-6, such that all the figure panels related to the neck linker extended mutants are shown in Figure 6; Figure 5D has been moved to Figure 6F.

      Line 421: delete "not" before "does not".

      We have corrected this typo.

      Lines 433-441: Unless I am mistaken, more recent work in the kinesin field showed that backward trajectories of kinesin 1 reported by Carter and Cross are due to slips from the microtubule rather than backward processive runs of the motor.

      The slip motion demonstrated by Sudhakar et al. (2021) differs from the backstep motion reported by Carter and Cross (and many other laboratories). Slip motion occurs after kinesin detaches from the microtubule and continues until the bead returns to the trap center. In contrast, backstep motion occurs during processive movement when the trap force either exceeds or approaches the stall force. The kinetics of these motions also differ significantly: slip steps occur with a dwell time of 71 µs and are independent of ATP concentration, while backsteps take ~0.3 s (at 1 mM ATP) and depend on ATP concentration. These differences indicate that slip motion is phenomenologically distinct from backsteps occurring under supra-stall or near-stall force.

      Line 474: Replace "suppresses" with "suppressed".

      We have corrected this typo.

      Figure 4E: I would plot these results with increasing ATP concentration on the x-axis.

      We formatted Figure 4E to match Figure 4b from Isojima et al. (Nature Chem. Biol. 2015), to emphasize the difference in ATP dependence of the front and rear head.

      Figure 4B: The authors should explain how they distinguish between bound and unbound states in the main text or figure legends. For example, it is not clear how the authors score when the motor rebinds to the microtubule in the first unbinding event shown in Figure 4B (displacement plot).

      The method was described in the Materials and Methods section, but we have now described how to distinguish between bound and unbound states in the main text as follows: “Unlike the unbound trailing head of wild-type dimer that showed continuous mobility (Isojima et al., 2016), the unbound WT head of E236A-WT heterodimer exhibited a low-fluctuation state in the middle (Figure 5B, s.d. trace). This low-fluctuation unbound state was distinguishable from the typical microtubule-bound state, having a shorter dwell time of ~5 ms compared to the bound state and positioning backward, closer to the E236A head, relative to the bound state (Figure 5-figure supplement 2).” (lines 351-356).

      Reviewer #3:

      Minor Issues:

      - Line 22, Abstract - The phrase "move in a hand-over-hand manner" could be clearer if phrased as "move in a hand-over-hand fashion" to improve readability.

      We changed the word “manner” to “process” (line 23).

      - Abstract - Neck linker conformation in the leading head: The sentence "We demonstrate that the neck linker conformation in the leading kinesin head increases microtubule affinity without altering ATP affinity" would benefit from defining this conformation as "backward" for clarity.

      - Abstract - Neck linker conformation in the trailing head: The sentence "The neck linker conformation in the trailing kinesin head increases ATP affinity by several thousand-fold compared to the leading head, with minimal impact on microtubule affinity" should also clarify that this conformation is "forward."

      We have corrected these sentences accordingly (line 30, 32).

      - Abstract - Conformation-specific effects: The authors mention conformation-specific effects in the neck linker structure but do not define the neck linker's conformation or the motor domain's (MD) conformation. Clarifying these conformational changes would improve the explanation of how they promote ATP hydrolysis and dissociation of the trailing head before the leading head detaches from the microtubule, thereby providing a kinetic basis for kinesin's coordinated walking mechanism.

      We have revised the last sentence of the abstract accordingly by specifying the neck linker’s conformation as follows: “In combination, these conformation-specific effects of the neck linker favor ATP hydrolysis and dissociation of the rear head prior to microtubule detachment of the front head, thereby providing a kinetic explanation for the coordinated walking mechanism of dimeric kinesin.” (lines 34-37).

      - Line 306 - Use of ATP in the E236A-WT heterodimer: In discussing the "ATP-induced detachment rate of the WT head in the E236A-WT heterodimer," the authors should consider justifying their choice of ATP over ADP for inducing microtubule (MT) dissociation. Since ATP typically promotes tighter MT binding and ATP turnover is reduced in forward-positioned WT heads, it may be unclear to some readers why ATP was chosen.

      We measured the ATP-induced detachment rate k<sub>2</sub> of the front head of the E236A-WT heterodimer to validate our findings from the front-head-crosslinked monomer experiments, which demonstrated reduced k<sub>2</sub> after oxidation. To clarify this point, we have now included ATP binding kinetics measurements for both front and rear heads of the E236A-WT heterodimer, as suggested by reviewer 2. These additional data demonstrate consistency between the results from the crosslinked monomer and E236A-WT heterodimer experiments.

      - Discussion - Backward-oriented neck linker in the front head: The discussion mentions that the backward-oriented neck linker in the front head reduces its ATP-induced detachment rate, suggesting that a step after ATP binding (e.g., isomerization, ATP hydrolysis, or phosphate release) is gated in the front head. However, the authors do not clarify that the backward neck linker orientation would imply the nucleotide pocket should be open or at least not fully closed, thus inhibiting ATP turnover. This is important because, as demonstrated in other studies, full closure of the nucleotide pocket is linked to neck linker docking. This point should be addressed earlier in the discussion.

      We have addressed this point by revising this sentence as follows: “These results are consistent with an inability of the front head to fully close its nucleotide pocket to promote ATP hydrolysis and Pi release (Benoit et al., 2023), as will be discussed later.” (lines 441-443)

    1. Author response:

      The following is the authors’ response to the previous reviews

      Reviewer #1 (Public Review):

      Summary:

      Cell metabolism exhibits a well-known behavior in fast-growing cells, which employ seemingly wasteful fermentation to generate energy even in the presence of sufficient environmental oxygen. This phenomenon is known as Overflow Metabolism or the Warburg effect in cancer. It is present in a wide range of organisms, from bacteria and fungi to mammalian cells.

      In this work, starting with a metabolic network for Escherichia coli based on sets of carbon sources, and using a corresponding coarse-grained model, the author applies some well-based approximations from the literature and algebraic manipulations. These are used to successfully explain the origins of Overflow Metabolism, both qualitatively and quantitatively, by comparing the results with E. coli experimental data.

      By modeling the proteome energy efficiencies for respiration and fermentation, the study shows that these parameters are dependent on the carbon source quality constants K_i (p.115 and 116). It is demonstrated that as the environment becomes richer, the optimal solution for proteome energy efficiency shifts from respiration to fermentation. This shift occurs at a critical parameter value K_A(C).

      This counter intuitive results qualitatively explains Overflow Metabolism.

      Quantitative agreement is achieved through the analysis of the heterogeneity of the metabolic status within a cell population. By introducing heterogeneity, the critical growth rate is assumed to follow a Gaussian distribution over the cell population, resulting in accordance with experimental data for E. coli. Overflow metabolism is explained by considering optimal protein allocation and cell heterogeneity.

      The obtained model is extensively tested through perturbations: 1) Introduction of overexpression of useless proteins; 2) Studying energy dissipation; 3) Analysis of the impact of translation inhibition with different sub-lethal doses of chloramphenicol on Escherichia coli; 4) Alteration of nutrient categories of carbon sources using pyruvate. All model perturbations results are corroborated by E. coli experimental results.

      Strengths:

      In this work, the author effectively uses modeling techniques typical of Physics to address complex problems in Biology, demonstrating the potential of interdisciplinary approaches to yield novel insights. The use of Escherichia coli as a model organism ensures that the assumptions and approximations are well-supported in existing literature. The model is convincingly constructed and aligns well with experimental data, lending credibility to the findings. In this version, the extension of results from bacteria to yeast and cancer is substantiated by a literature base, suggesting that these findings may have broad implications for understanding diverse biological systems.

      We appreciate the reviewer’s exceptionally positive comments. The manuscript has been significantly improved thanks to the reviewer’s insightful suggestions.

      Weaknesses:

      The author explores the generalization of their results from bacteria to cancer cells and yeast, adapting the metabolic network and coarse-grained model accordingly. In previous version this generalization was not completely supported by references and data from the literature. This drawback, however, has been treated in this current version, where the authors discuss in much more detail and give references supporting this generalization.

      We appreciate the reviewer’s recognition of our revisions and the insightful suggestions provided in the previous round, which have greatly strengthened our manuscript.

      Reviewer #2 (Public Review):

      In this version of manuscript, the author clarified many details and rewrote some sections. This substantially improved the readability of the paper. I also recognized that the author spent substantial efforts in the Appendix to answer the potential questions.

      We thank the reviewer for the positive comments and the suggestions to improve our manuscript.

      Unfortunately, I am not currently convinced by the theory proposed in this paper. In the next section, I will first recap the logic of the author and explain why I am not convinced. Although the theory fits many experimental results, other theories on overflow metabolism are also supported by experiments. Hence, I do not think based on experimental data we could rule in or rule out different theories.

      We thank the reviewer for both the critical and constructive comments. 

      Regarding the comments on the comparison between theoretical and experimental results, we would like to first emphasize that no prior theory has resolved the conflict arising from the proteome efficiencies measured in E. coli and eukaryotic cells. Specifically, prevalent explanations (Basan et al., Nature 528, 99–104 (2015); Chen and Nielsen, PNAS 116, 17592–17597 (2019)) hold that overflow metabolism results from proteome efficiency in fermentation consistently being higher than that in respiration. While it was observed in E. coli that proteome efficiency in fermentation exceeds that in respiration when cells were cultured in lactose at saturated concentrations (Basan et al., Nature 528, 99-104 (2015)), more recent findings (Shen et al., Nature Chemical Biology 20, 1123–1132 (2024)) show that the measured proteome efficiency in respiration is actually higher than in fermentation for many yeast and cancer cells, despite the presence of aerobic glycolytic fermentation flux. To the best of our knowledge, no prior theory has explained these contradictory experimental results. Notably, our theory resolves this conflict and quantitatively explains both sets of experimental observations (Basan et al., Nature 528, 99-104 (2015); Shen et al., Nature Chemical Biology 20, 1123–1132 (2024)) by incorporating cell heterogeneity and optimizing cell growth rate through protein allocation. 

      Furthermore, rather than merely fitting the experimental results, as explained in Appendices 6.2, 8.1-8.2 and summarized in Appendix-tables 1-3, nearly all model parameters important for our theoretical predictions for E. coli were derived from in vivo and in vitro biochemical data reported in the experimental literature. For comparisons between model predictions and experimental results for yeast and cancer cells (Shen et al., Nature Chemical Biology 20, 1123–1132 (2024)), we intentionally derived Eq. 6 to ensure an unbiased comparison.

      Finally, in response to the reviewer’s suggestion, we have revised the expressions in our manuscript to present the differences between our theory and previous theories in a more modest style. 

      Recap: To explain the origin of overflow metabolism, the author uses the following logic:

      (1) There is a substantial variability of single-cell growth rate

      (2) The flux (J_r^E) and (J_f^E) are coupled with growth rate by Eq. 3

      (3) Since growth rate varies from cells to cells, flux (J_r^E) and (J_f^E) also varies (4) The variabilities of above fluxes in above create threshold-analog relation, and hence overflow metabolism.

      We thank the reviewer for the clear summary. We apologize for not explaining some points clearly enough in the previous version of our manuscript, which may have led to misunderstandings. We have now revised the relevant content in the manuscript to clarify our reasoning. Specifically, we have applied the following logic in our explanation:

      (a) The solution for the optimal growth strategy of a cell under a given nutrient condition is a binary choice between respiration and fermentation, driven by comparing their proteome efficiencies (ε<sub>r</sub> and ε<sub>f</sub> ).

      (b) Under nutrient-poor conditions, the nutrient quality (κ<sub>A</sub>) is low, resulting in the proteome efficiency of respiration being higher than that of fermentation (i.e., ε<sub>r</sub> > ε<sub>f</sub>), so the cell exclusively uses respiration.  

      (c) In rich media (with high κ<sub>A</sub>), the proteome efficiency of fermentation increases more rapidly and surpasses that of respiration (i.e., ε<sub>f</sub> > ε<sub>r</sub> ), hence the cell switches to fermentation.  

      (d) Heterogeneity is introduced: variability in the κ<sub>cat</sub> of catalytic enzymes from cell to cell. This leads to heterogeneity (variability) in ε<sub>r</sub> and ε<sub>f</sub> within a population of cells under the same nutrient condition.  

      (e) The critical value of nutrient quality for the switching point (, where ε<sub>r</sub>= ε<sub>f</sub> ) changes from a single point to a distribution due to cell heterogeneity. This results in a distribution of the critical growth rate λ<sub>C</sub> (defined as ) within the cell population.

      (f) The change in culturing conditions (with a highly diverse range of κ<sub>A</sub>) and heterogeneity in the critical growth rate λ<sub>C</sub> (a distribution of values) result in the threshold-analog relation of overflow metabolism at the cell population level.

      Steps (a)-(c) were applied to qualitatively explain the origin of overflow metabolism, while steps (d)-(f) were further used to quantitatively explain the threshold-analog relation observed in the data on overflow metabolism.

      Regarding the reviewer’s recap, which seems to have involved some misunderstandings, we first emphasize that the major change in cell growth rate for the threshold-analog relation of overflow metabolism—particularly as it pertains to logic steps (1), (3) and (4)—is driven by the highly varied range of nutrient quality (κ<sub>A</sub>) in the culturing conditions, rather than by heterogeneity between cells. For the batch culture data, the nutrient type of the carbon source differs significantly (e.g., Fig.1 in Basan et al., Nature 528, 99-104 (2015), wild-type strains). In contrast, for the chemostat data, the concentration of the carbon source varies greatly due to the highly varied dilution rate (e.g., Table 7 in Holms, FEMS Microbiology Reviews 19, 85-116 (1996)). Both of these factors related to nutrient conditions are the major causes of the changes in cell growth rate in the threshold-analog relation. 

      Second, Eq. 3, as mentioned in logic step (2), represents a constraint between the fluxes ( and ) and the growth rate (λ) for a single nutrient condition (with a given value of κ<sub>A</sub> ideally) rather than for varied nutrient conditions. For a single cell in each nutrient condition, the optimal growth strategy is binary, between respiration and fermentation. 

      Finally, for the threshold-analog relation of overflow metabolism, the switch from respiration to fermentation is caused by the increased nutrient quality in the culturing conditions, rather than by cell heterogeneity as indicated in logic step (4). Upon nutrient upshifts, the proteome efficiency of fermentation surpasses that of respiration, causing the optimal growth strategy for the cell to switch from respiration to fermentation. The role of cell heterogeneity is to transform the growth rate-dependent fermentation flux in overflow metabolism from a digital response to a threshold-analog relation under varying nutrient conditions.

      My opinion:

      The logic step (2) and (3) have caveats. The variability of growth rate has large components of cellular noise and external noise. Therefore, variability of growth rate is far from 100% correlated with variability of flux (J_r^E) and (J_f^E) at the single-cell level. Single-cell growth rate is a complex, multivariate functional, including (Jr^E) and (J_f^E) but also many other variables. My feeling is the correlation could be too low to support the logic here.

      One example: ribosomal concentration is known to be an important factor of growth rate in bulk culture. However, the "growth law" from bulk culture cannot directly translate into the growth law at single-cell level [Ref1,2]. This is likely due to other factors (such as cell aging, other muti-stability of cellular states) are involved.

      Therefore, I think using Eq.3 to invert the distribution of growth rate into the distribution of (Jr^E) and (J_f^E) is inapplicable, due to the potentially low correlation at single-cell level. It may show partial correlations, but may not be strong enough to support the claim and create fermentation at macroscopic scale.

      Overall, if we track the logic flow, this theory implies overflow metabolism is originated from variability of k_cat of catalytic enzymes from cells to cells. That is, the author proposed that overflow metabolism happens macroscopically as if it is some "aberrant activation of fermentation pathway" at the single-cell level, due to some unknown partially correlation from growth rate variability.

      We thank the reviewer for raising these questions and for the insights. We apologize for any lack of clarity in the previous version of our manuscript that may have caused misunderstandings. We have revised the manuscript to address all points, and below are our responses to the questions, some of which seem to involve misunderstandings. 

      First, in our theory, the qualitative behavior of overflow metabolism—where cells use respiration under nutrient-poor conditions (low growth rate) and fermentation in rich media (high growth rate)—does not arise from variability between cells, as the reviewer seems to have interpreted. Instead, it originates from growth optimization through optimal protein allocation under significantly different nutrient conditions. Specifically, the proteome efficiency of fermentation is lower than that of respiration (i.e. ε<sub>f</sub> < ε<sub>r</sub>) under nutrient-poor conditions, making respiration the optimal strategy in this case. However, in rich media, the proteome efficiency of fermentation surpasses that of respiration (i.e. ε<sub>f</sub> < ε<sub>r</sub>), leading the cell to switch to fermentation for growth optimization. To implement the optimal strategy, as clarified in the revised manuscript and discussed in Appendix 2.4, a cell should sense and compare the proteome efficiencies between respiration and fermentation, choosing the pathway with the higher efficiency, rather than sensing the growth rate, which can fluctuate due to stochasticity. Regarding the role of cell heterogeneity in overflow metabolism, as discussed in our previous response, it is twofold: first, it quantitatively illustrates the threshold-analog response of growth rate-dependent fermentation flux, which would otherwise be a digital response without heterogeneity during growth optimization; second, it enables us to resolve the paradox in proteome efficiencies observed in E. coli and eukaryotic cells, as raised by Shen et al. (Shen et al., Nature Chemical Biology 20, 1123–1132 (2024)). 

      Second, regarding logic step (2) in the recap, the reviewer thought we had coupled the growth rate (λ) with the respiration and fermentation fluxes ( and ) through Eq. 3, and used Eq. 3 to invert the distribution of growth rate into the distribution of respiration and fermentation fluxes. We need to clarify that Eq. 3 represents the constraint between the fluxes and the growth rate under a single nutrient condition, rather than describing the relation between growth rate and the fluxes ( and ) under varied nutrient conditions. In a given nutrient condition (with a fixed value of κ<sub>A</sub>), without considering optimal protein allocation, the cell growth rate varies with the fluxes according to Eq.3 by adjusting the proteome allocation between respiration and fermentation (ϕ<sub>r</sub> and ϕ<sub>f</sub>). However, once growth optimization is applied, the optimal protein allocation strategy for a cell is limited to either pure respiration (with ϕ<sub>f</sub> =0 and ) or pure fermentation (with ϕ<sub>r</sub> =0 and ), depending on the nutrient condition (or the value of κ<sub>A</sub>). Furthermore, under varying nutrient conditions (with different values of κ<sub>A</sub>), both proteome efficiencies of respiration and fermentation (ε<sub>r</sub> and (ε<sub>f</sub>) change with nutrient quality κ<sub>A</sub> (see Eq. 4). Thus, Eq. 3 does not describe the relation between growth rate (λ) and the fluxes ( and ) under nutrient variations.

      Thirdly, regarding reviewer’s concerns on logic step (3) in the recap, as well as the example where ribosome concentration does not correlate well with cell growth rate at the single-cell level, we fully agree with reviewer that, due to factors such as stochasticity and cell cycle status, the growth rate fluctuates constantly for each cell. Consequently, it would not be fully correlated with cell parameters such as ribosome concentration or respiration/fermentation flux. We apologize for our oversight in not discussing suboptimal growth conditions in the previous version of the manuscript. In response, we have added a paragraph to the discussion section and a new Appendix 2.4, titled “Dependence of the model on optimization principles,” to address these issues in detail. Specifically, recent experimental studies (Dai et al., Nature microbiology 2, 16231 (2017); Li et al., Nature microbiology 3, 939–947 (2018)) show that the inactive portion of ribosomes (i.e., ribosomes not bound to mRNAs) can vary under different culturing conditions. The reviewer also pointed out that ribosome concentration does not correlate well with cell growth rate at single-cell level. In this regard, we have cited Pavlou et al. (Pavlou et al., Nature Communications 16, 285 (2025)) instead of the references provided by the reviewer (Ref1 and Ref2), with our rationale outlined in the final section of the author response. These findings (Dai et al, (2017); Li et al., (2018); Pavlou et al., (2025)) suggest that ribosome allocation may be suboptimal under many culturing conditions, likely as cells prepare for potential environmental changes (Li et al., Nature microbiology 3, 939–947 (2018)). However, since our model's predictions regarding the binary choice between respiration and fermentation are based solely on comparing proteome efficiency between these two pathways, the optimal growth principle in our model can be relaxed. Specifically, efficient protein allocation is required only for enzymes rather than ribosomes, allowing our model to remain applicable under suboptimal growth conditions. Furthermore, protein allocation via the ribosome occurs at the single-cell level rather than at the population level. The strong linear correlation between ribosomal concentration and growth rate at the population level under nutrient variations suggests that each cell optimizes its protein allocation individually. Therefore, the principle of growth optimization still applies to individual cells, although factors like stochasticity, nutrient variation preparations, and differences in cell cycle stages may complicate this relationship, resulting in only a rough linear correlation between ribosome concentration and growth rate at the single-cell level (with with R<sup>2</sup> = 0.64 reported in Pavlou et al., (2025)). 

      Lastly, regarding the reviewer concerns about the heterogeneity of fermentation and respiration at macroscopic scale, we first clarify in the second paragraph of this response that the primary driving force for cells to switch from respiration to fermentation in the context of overflow metabolism is the increased nutrient quality under varying culturing conditions, which causes the proteome efficiency of fermentation to surpass that of respiration. Under nutrient-poor conditions, our model predicts that all cells use respiration, and therefore no heterogeneity for the phenotype of respiration and fermentation arises in these conditions. However, in a richer medium, particularly one that does not provide optimal conditions but allows for an intermediate growth rate, our model predicts that some cells opt for fermentation while others continue with respiration due to cell heterogeneity (with ε<sub>f</sub> > ε<sub>r</sub> for some cells engaging in fermentation and ε<sub>r</sub> > ε<sub>f</sub> for the other cells engaging in respiration within the same medium). Both of these predictions have been validated in isogenic singlecell experiments with E. coli (Nikolic et al., BMC Microbiology 13, 258 (2013)) and S. cerevisiae (Bagamery et al., Current Biology 30, 4563–4578 (2020)). The single-cell experiments by Nikolic et al. with E. coli in a rich medium of intermediate growth rate clearly show a bimodal distribution in the expression of genes related to overflow metabolism (see Fig. 5 in Nikolic et al., BMC Microbiology 13, 258 (2013)), where one subpopulation suggests purely fermentation, while the other suggests purely respiration. In contrast, in a medium with lower nutrient concentration (and consequently lower nutrient quality), only the respirative population exists (see Fig. 5 in Nikolic et al., BMC Microbiology 13, 258 (2013)). These experimental results from E. coli (Nikolic et al., BMC Microbiology 13, 258 (2013)) are fully consistent with our model predictions. Similarly, the single-cell experiments with S. cerevisiae by Bagamery et al. clearly identified two subpopulations of cells with respect to fermentation and respiration in a rich medium, which also align well with our model predictions regarding heterogeneity in fermentation and respiration within a cell population in the same medium.

      Compared with other theories, this theory does not involve any regulatory mechanism and can be regarded as a "neutral theory". I am looking forward to seeing single cell experiments in the future to provide evidences about this theory.

      We thank the reviewer for raising these questions and for the valuable insights. Regarding the regulatory mechanism, we have now added a paragraph in the discussion section of our manuscript and Appendix 2.4 to address this point. Specifically, our model predicts that a cell can implement the optimal strategy by directly sensing and comparing the proteome efficiencies of respiration and fermentation, choosing the pathway with the higher efficiency. At the gene regulatory level, a growing body of evidence suggests that the cAMP-CRP system plays an important role in sensing and executing the optimal strategy between respiration and fermentation (Basan et al., Nature 528, 99-104 (2015); Towbin et al., Nature Communications 8, 14123 (2017); Valgepea et al., BMC Systems Biology 4, 166 (2010); Wehrens et al., Cell Reports 42, 113284 (2023)). However, it has also been suggested that the cAMP-CRP system alone is insufficient, and additional regulators may need to be identified to fully elucidate this mechanism (Basan et al., Nature 528, 99-104 (2015); Valgepea et al., BMC Systems Biology 4, 166 (2010)). 

      Regarding the single-cell experiments that provide evidence for this theory, we have shown in the previous paragraphs of this response that the heterogeneity between respiration and fermentation, as predicted by our model for isogenic cells within the same culturing condition, has been fully validated by single-cell experiments with E. coli (Fig. 5 from Nikolic et al., BMC Microbiology 13, 258 (2013)) and S. cerevisiae (Fig. 1 and the graphical abstract from Bagamery et al., Current Biology 30, 4563–4578 (2020)). We have now revised the discussion section of our manuscript to make this point clearer.

      [Ref1] https://www.biorxiv.org/content/10.1101/2024.04.19.590370v2

      [Ref2] https://www.biorxiv.org/content/10.1101/2024.10.08.617237v2

      We thank the reviewer for providing insightful references. Regarding the two specific references, Ref1 directly addresses the deviation in the linear relationship between growth rate and ribosome concentration (“growth law”) at the single-cell level. However, since the authors of Ref1 determined the rRNA abundance in each cell by aligning sequencing reads to the genome, this method inevitably introduces a substantial amount of measurement noise. As a result, we chose not to cite or discuss this preprint in our manuscript. Ref2 appears to pertain to a different topic, which we suspect may be a copy/paste error. Based on the reviewer’s description and the references in Ref1, we believe the correct Ref2 should be Pavlou et al., Nature Communications 16, 285 (2025) (with the biorxiv preprint link: https://www.biorxiv.org/content/10.1101/2024.04.26.591328v1). In this reference, it is stated that the relationship between ribosome concentration and growth rate only roughly aligns with the “growth law” at the single-cell level (with R<sup>2</sup> = 0.64), exhibiting a certain degree of deviation. We have now cited and incorporated the findings of Pavlou et al. (Pavlou et al., Nature Communications 16, 285 (2025)) in both the discussion section of our manuscript and Appendix 2.4. Overall, we agree with Pavlou et al.’s experimental results, which suggest that ribosome concentration does not exhibit a strong linear correlation with cell growth rate at the single-cell level. However, we remain somewhat uncertain about the extent of this deviation, as Pavlou et al.’s experimental setup involved alternating nutrients between acetate and glucose, and the lapse of five generations may not have been long enough for the growth to be considered balanced. Furthermore, as observed in Supplementary Movie 1 of Pavlou et al., some of the experimental cells appeared to experience growth limitations due to squeezing pressure from the pipe wall of the mother machine, which could further increase the deviation from the “growth law” at the single-cell level.  

      Recommendations for the authors:

      Reviewer #1 (Recommendations for the authors):

      I have no specific comments for the authors related to this last version of the paper. I believe the authors have properly improved the previous version of the manuscript.

      Response: We thank the reviewer for the highly positive comments and for recognizing the improvements made in the revised version of our manuscript.

    1. Author response:

      We thank the reviewers for their thorough review of our manuscript and their constructive feedback. We will address their comments and concerns in a point-by-point response at a later stage but would like to clarify some minor misunderstanding to not confuse any readers in the meantime.

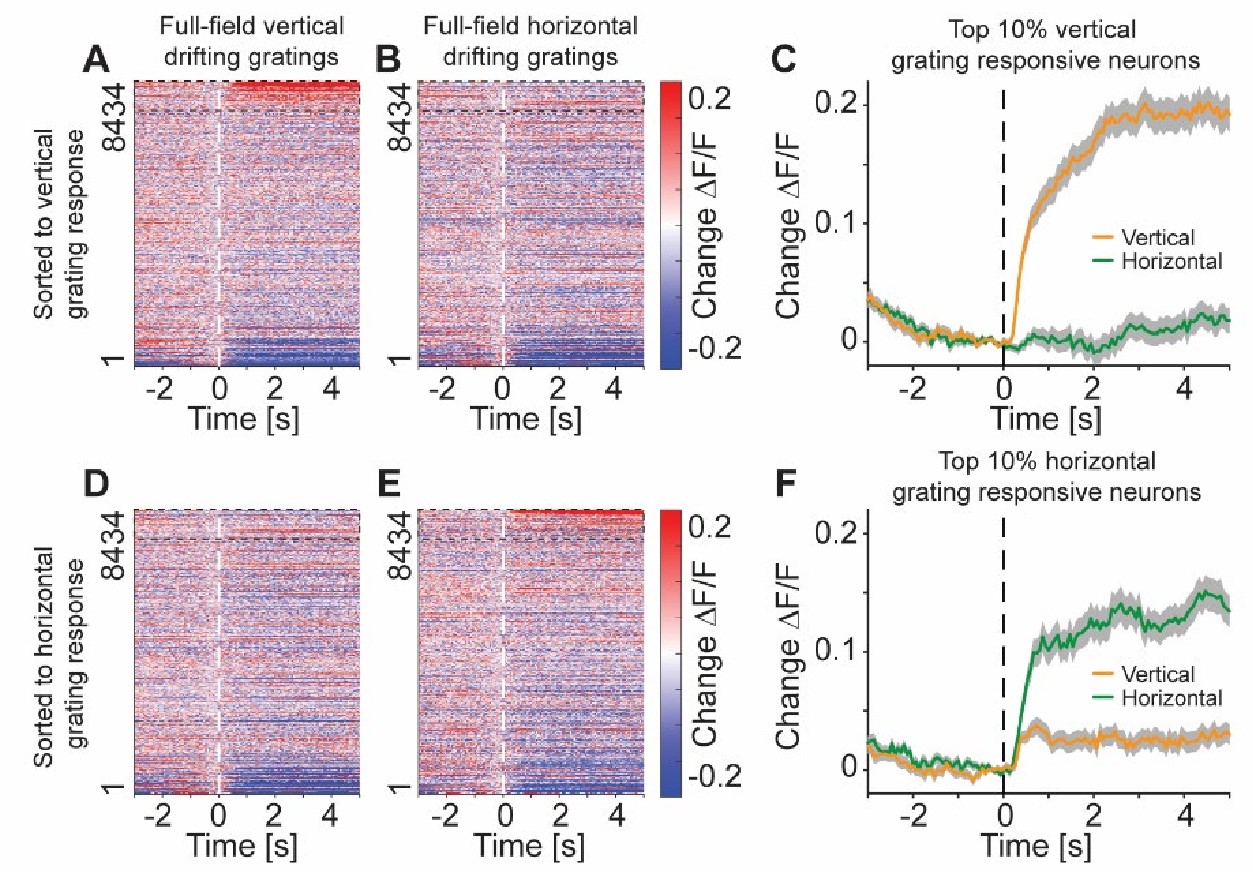
      - In regard to population ablation: When investigating the contribution of population size to reconstruction quality, we used 12.5, 25, 50 or 100% of the recorded neuronal population, which corresponds to ~1000/2000/4000/8000 neurons per animal. We did not produce reconstructions from only 1 neuron.

      - In regard to the training of the transparency masks: The transparency masks were not produced using the same movies we reconstructed. We apologize for the lack of clarity on this point in the manuscript. We calculated the masks using an original model instance rather than a retrained instances used in the rest of the paper. Specifically, the masks were calculated using the original model instance ‘fold 1’ and data fold 1, which is it’s validation fold. In contrast, the model instances used in the paper for movie reconstruction were retrained while omitting the same validation fold across all instances (fold 0) and all the reconstructed movies in the paper are from data fold 0.

      - In regard to reconstruction based on predicted activity: We always reconstructed the videos based on the true neural responses not the predicted neural response, with the exception of the Gaussian noise and drifting grating stimuli in Figure 4 and Supplementary Figure S2 where no recorded neural activity was available).

    1. Author response:

      We thank both reviewers for their suggestions on improving our manuscript, which is focused on demonstrating that the C3a-C3aR axis modulates trained immune responses in alveolar macrophages. The Short Report format precludes separating the Results and Discussion sections. However, we will work towards a clearer presentation of findings and providing a more comprehensive interpretation of the data in the Revision, by addressing the points brought up by both Reviewers.

      We agree with the suggestions from Reviewer 1 that (1) other cell types such as dendritic cells, neutrophils, and endothelial cells can also be involved in immune training, and (2) macrophages have other activities beyond releasing inflammatory cytokines, and will clarify both these points in the Revision. The mechanism of C3 being cleaved intracellularly and binding to lysosomal C3aR involves cathepsin-dependent cleavage of C3 to C3a and has been experimentally proven (Liszewski et al. Immunity 2013). However, we will clarify this mechanism in the revision. We also acknowledge that the observations need to be validated in human-based models. Currently, we do not have access to an adequate representation of human alveolar macrophages for our ex vivo testing to account for individual-level variation in immune responses. However, we anticipate this work will form the basis of these future studies.

      We also appreciate Reviewer 2’s suggestions regarding demonstrating the resolution of acute inflammation after the initial exposure to heat-killed Pseudomonas. We will address this critique by performing additional experiments, which will be included in the Revision. We also agree that the responses of trained C3-deficient cells should be compared to untrained C3-deficient controls after the LPS challenge. We will include this data in the Revision, in addition to the requested data for Figures 3 and 4. We would like to clarify that we do not observe baseline differences between untrained C3-sufficient (wildtype) and C3-deficient alveolar macrophages, even in their glycolytic capacity, and thus, anticipate that our revised data will strengthen the conclusions from the original manuscript.

    1. Author response:

      Reviewer #1 (Public review):

      Summary:

      The authors aimed to characterize neurocomputational signals underlying interpersonal guilt and responsibility. Across two studies, one behavioral and one fMRI, participants made risky economic decisions for themselves or for themselves and a partner; they also experienced a condition in which the partners made decisions for themselves and the participant. The authors also assessed momentary happiness intermittently between choices in the task. Briefly, results demonstrated that participants' self-reported happiness decreased after disadvantageous outcomes for themselves and when both they and their partner were affected; this effect was exacerbated when participants were responsible for their partner's low outcome, rather than the opposite, reflecting experienced guilt. Consistent with previous work, BOLD signals in the insula correlated with experienced guilt, and insula-right IFG connectivity was enhanced when participants made risky choices for themselves and safe choices for themselves and a partner.

      Strengths:

      This study implements an interesting approach to investigating guilt and responsibility; the paradigm in particular is well-suited to approach this question, offering participants the chance to make risky v. safe choices that affect both themselves and others. I appreciate the assessment of happiness as a metric for assessing guilt across the different task/outcome conditions, as well as the implementation of both computational models and fMRI.

      We thank Reviewer 1 for their positive assessment of our manuscript.

      Weaknesses:

      In spite of the overall strengths of the study, I think there are a few areas in which the paper fell a bit short and could be improved.

      We are looking forward to improving our manuscript based on the Reviewers’ comments. According to eLife’s policy, here are our provisional replies as well as plans for changes.

      (1) While the framing and goal of this study was to investigate guilt and felt responsibility, the task implemented - a risky choice task with social conditions - has been conducted in similar ways in past research that were not addressed here. The novelty of this study would appear to be the additional happiness assessments, but it would be helpful to consider the changes noted in risk-taking behavior in the context of additional studies that have investigated changes in risky economic choice in social contexts (e.g., Arioli et al., 2023 Cerebral Cortex; Fareri et al., 2022 Scientific Reports).

      We certainly agree that several previously published studies have relied on risky choice tasks with social conditions. We will happily refer to the studies mentioned when discussing changes in risk-taking behaviour in our revised manuscript.

      (2) The authors note they assessed changes in risk preferences between social and solo conditions in two ways - by calculating a 'risk premium' and then by estimating rho from an expected utility model. I am curious why the authors took both approaches (this did not seem clearly justified, though I apologize if I missed it). Relatedly, in the expected utility approach, the authors report that since 'the number of these types of trials varied across participants', they 'only obtained reliable estimates for [gain and loss] trials in some participants' - in study 1, 22 participants had unreliable estimates and in study 2, 28 participants had unreliable estimates. Because of this, and because the task itself only had 20 gains, 20 losses, and 20 mixed gambles per condition, I wonder if the authors can comment on how interpretable these findings are in the Discussion. Other work investigating loss aversion has implemented larger numbers of trials to mitigate the potential for unreliable estimates (e.g., Sokol-Hessner et al., 2009).

      We agree that we have not clearly justified why we have taken two approaches to assess risk preferences. In short, both approaches have advantages and inconveniences when applied to our experiment. We will happily detail our reasons in the revised manuscript. Regarding the second point of this comment: the small number of reliable estimates is one of the reasons that we have used another approach to assess risk preferences. We would certainly have obtained more reliable estimates if we had implemented more trials. We will discuss the interpretability of all the risk preference estimates we used in the revised Discussion.

      (3) One thing seemingly not addressed in the Discussion is the fact that the behavioral effect did not replicate significantly in study 2.

      We agree that we could have discussed more the fact that there were (slight but significant) differences in risk preferences between the Solo and Social conditions in Study 1 but not in Study 2. While the absence of a significant difference in Study 2 is helpful to compare the neural mechanisms involved in making decisions for oneself vs. for oneself and another person (because any differences could not be explained by differences in risk preferences), we certainly should expand our discussion of the differences in findings between the two studies, which we will do in the revised manuscript.

      (4) Regarding the computational models, the authors suggest that the Reponsibility and Responsibility Redux models provided the best fit, but they are claiming this based on separate metrics (e.g., in study 1, the redux model had the lowest AIC, but the responsibility only model had the highest R^2; additionally, the basic model had the lowest BIC). I am wondering if the authors considered conducting a direct model comparison to statistically compare model fits.

      We agree that we should run formal, direct model comparison tests using for example chi-square or log-likelihood-ratio tests. We will do so in the revised manuscript.

      (5) In the reporting of imaging results, the authors report in a univariate analysis that a small cluster in the left anterior insula showed a stronger response to low outcomes for the partner as a result of participant choice rather than from partner choice. It then seems as though the authors performed small volume correction on this cluster to see whether it survived. If that is accurate, then I would suggest that this result be removed because it is not recommended to perform SVC where the volume is defined based on a result from the same whole-brain analysis (i.e., it should be done a priori).

      As indicated in the manuscript, the small insula cluster centered at [-28 24 -4] and shown in Figure 4F survived corrections for multiple tests within the anatomically-defined anterior insula (based on the anatomical maximum probability map described in Faillenot et al., 2017), which is independent of the result of our analysis. We agree that one should not (and we did not) perform multiple corrections based on the results one is correcting – that would indeed be circular and misleading “double-dipping”. The anterior insula is one of the regions most frequently associated with guilt (see the explanations in our Introduction, which refers for example to Bastin et al., 2016; Lamm & Singer, 2010; Piretti et al., 2023). Thus we feel that performing small-volume correction within the anatomically-defined anterior insula is an acceptable approach to correct for multiple tests in this case. We fully acknowledge that, independently of any correction, the effect and the cluster are small. We will clarify these explanations in the revised manuscript.

      Reviewer #2 (Public review):

      Summary

      This manuscript focuses on the role of social responsibility and guilt in social decision-making by integrating neuroimaging and computational modeling methods. Across two studies, participants completed a lottery task in which they made decisions for themselves or for a social partner. By measuring momentary happiness throughout the task, the authors show that being responsible for a partner's bad lottery outcome leads to decreased happiness compared to trials in which the participant was not responsible for their partner's bad outcome. At the neural level, this guilt effect was reflected in increased neural activity in the anterior insula, and altered functional connectivity between the insula and the inferior frontal gyrus. Using computational modeling, the authors show that trial-by-trial fluctuations in happiness were successfully captured by a model including participant and partner rewards and prediction errors (a 'responsibility' model), and model-based neuroimaging analyses suggested that prediction errors for the partner were tracked by the superior temporal sulcus. Taken together, these findings suggest that responsibility and interpersonal guilt influence social decision-making.

      Strengths

      This manuscript investigates the concept of guilt in social decision-making through both statistical and computational modeling. It integrates behavioral and neural data, providing a more comprehensive understanding of the psychological mechanisms. For the behavioral results, data from two different studies is included, and although minor differences are found between the two studies, the main findings remain consistent. The authors share all their code and materials, leading to transparency and reproducibility of their methods.

      The manuscript is well-grounded in prior work. The task design is inspired by a large body of previous work on social decision-making and includes the necessary conditions to support their claims (i.e., Solo, Social, and Partner conditions). The computational models used in this study are inspired by previous work and build on well-established economic theories of decision-making. The research question and hypotheses clearly extend previous findings, and the more traditional univariate results align with prior work.

      The authors conducted extensive analyses, as supported by the inclusion of different linear models and computational models described in the supplemental materials. Psychological concepts like risk preferences are defined and tested in different ways, and different types of analyses (e.g., univariate and multivariate neuroimaging analyses) are used to try to answer the research questions. The inclusion and comparison of different computational models provide compelling support for the claim that partner prediction errors indeed influence task behavior, as illustrated by the multiple model comparison metrics and the good model recovery.

      We thank Reviewer 2 very much for their comprehensive description of our study and the positive assessment of our study and approach.

      Weaknesses

      As the authors already note, they did not directly ask participants to report their feelings of guilt. The decrease in happiness reported after a bad choice for a partner might thus be something else than guilt, for example, empathy or feelings of failure (not necessarily related to guilt towards the other person). Although the patterns of neural activity evoked during the task match with previously found patterns of guilt, there is no direct measure of guilt included in the task. This warrants caution in the interpretation of these findings as guilt per se.

      We fully agree that not directly asking participants about feelings of guilt is a clear limitation of our study. While we already mention this in our Discussion, we will happily expand our discussion of the consequences on interpretation of our results along the lines described by the reviewer in the revised manuscript. We would like to thank Reviewer 2 for proposing these lines of thought.

      As most comparisons contrast the social condition (making the decision for your partner) against either the partner condition (watching your partner make their decision) or the solo condition (making your own decision), an open question remains of how agency influences momentary happiness, independent of potential guilt. Other open questions relate to individual differences in interpersonal guilt, and how those might influence behavior.

      We fully agree that the way agency influences happiness has not been much discussed in our manuscript so far, and we would happily do so in the revised manuscript. The same goes for individual differences in interpersonal guilt which we have not investigated due to our relatively small sample sizes but would certainly be worth investigation in subsequent work.

      This manuscript is an impressive combination of multiple approaches, but how these different approaches relate to each other and how they can aid in answering slightly different questions is not very clearly described. The authors could improve this by more clearly describing the different methods and their added value in the introduction, and/or by including a paragraph on implications, open questions, and future work in the discussion.

      We again thank the reviewer for their praise of our approach and fully agree that we can improve the description of the benefit of combining methods in the Introduction, which we will do in the revised manuscript. We will also include a paragraph on implications, open questions, and future work in the Discussion of the revised manuscript.

      However, taken together, this study provides useful insights into the neural and behavioral mechanisms of responsibility and guilt in social decision-making, and how they influence behavior.

      We again thank Reviewer 2 for their attentive reading and thoughtful comments and look forward to submitting our revised and improved manuscript.

    1. Author response:

      Reviewer 1:

      (1) We appreciate the reviewer’s suggestion to test a multi-attribute attentional drift-diffusion model (maaDDM) that does not constrain the taste and health weights to the range of 0 and 1 and will test such a model.

      (2) Similarly, we will follow the reviewer’s suggestion to address potential demand effects. First, we will add “order” (binary: hungry-sated or sated hungry) as a predictor to our GLMM, to test for potential systematic effects of order on choices and response times. Second, we will split the participants by “order” and examine whether we see group differences of tasty and healthy decisions within the first testing session. Note that we already anticipate that looking at only 50% of the data and testing for a between-subject rather than within-subject effect is likely to reduce effect size and statistical sensitivity.

      (3) We thank the reviewer for their observant remark about faster tasty choices and potential markers in the drift rate. While our starting point models show that there might be a small starting point bias towards the taste boundary which result in faster decisions, we will take a closer look at the simulated value differences as obtained in our posterior predictive checks to see if the drift rate is systematically more extreme for tasty choices.

      (4) Regarding the mtDDM, we will verify that the relative starting time (rst) effects are minuscule. While we will follow the recommendation of correlating first fixations with rst, we would like to point out that a majority of fixations (see Figure 3b) and first fixations (see Figure S6b) are on food images. We will also provide a parameter recovery of the mtDDM.

      Reviewer 2:

      (1) We would like to verify the reviewer’s interpretation that hungry people in negative calorie balance simply prefer more calories and would like to point to our supplementary analyses, in which we show that hunger state also increases the probability of higher wanted and higher caloric decisions (see SOM4, SOM5, Figure S4). Moreover, we agree that high caloric items might not be unhealthy and are happy to demonstrate the correlations between health ratings and objective caloric content, to demonstrate the strong negative correlation in our dataset, which our principal component analyses hints at, too.

      Reviewer 3:

      (1) We agree that choosing tasty over healthy options under hunger may be evolutionarily adaptive. We will address the adaptiveness of this hunger driven mechanism in our discussion, reiterating the differentiation made in the introduction that this system no longer be adaptive in our obesogenic environment, leading to suboptimal decisions.

      (2) We will address alternative explanations of the observed effects in our discussion with respect to the macro-nutritional content of the Shake and potential placebo effects arising from the shake vs no shake manipulation.

    1. Author response:

      Public Reviews:

      Reviewer #1 (Public review):

      Summary:

      This work shows that a specific adenosine deaminase protein in Dictyostelium generates the ammonia that is required for tip formation during Dictyostelium development. Cells with an insertion in the ADGF gene aggregate but do not form tips. A remarkable result, shown in several different ways, is that the ADGF mutant can be rescued by exposing the mutant to ammonia gas. The authors also describe other phenotypes of the ADGF mutant such as increased mound size, altered cAMP signalling, and abnormal cell type differentiation. It appears that the ADGF mutant has defects in the expression of a large number of genes, resulting in not only the tip defect but also the mound size, cAMP signalling, and differentiation phenotypes.

      Strengths:

      The data and statistics are excellent.

      Weaknesses:

      (1) The key weakness is understanding why the cells bother to use a diffusible gas like ammonia as a signal to form a tip and continue development.

      Diffusion of a gas can affect the signalling process of the entire colony of cells and will be quicker than other signaling mechanisms. A number of findings suggest that ammonia acts as both a local and long-range regulatory signal, integrating environmental and cellular cues to coordinate multicellular development. Ammonia serves as a crucial signalling molecule, influencing both multicellular organization and differentiation in Dictyostelium (Francis, 1964; Bonner et al., 1989; Bradbury and Gross, 1989). By raising the pH of the intracellular acidic vesicles of prestalk cells (Poole and Ohkuma, 1981; Gross et al, 1983), and the cytoplasm, ammonia is known to increase the speed of chemotaxing amoebae (Siegert and Weijer 1989; Van Duijn and Inouye, 1991), triggering multicellular movement (Bonner et al., 1988, 1989) to favor tipped mound development. The slug tip is known to release ammonia while the slime sheath at the back of the slug prevents diffusion thus maintaining high ammonia levels to (Bonner et al., 1989) promote pre-spore differentiation (Newell et al., 1969). Ammonia has been found to favor slug migration rather than fruiting (Schindler and Sussman, 1977) and thus, tip-derived ammonia may stimulate synchronized development of the entire colony. The tip exerts negative chemotaxis towards ammonia, potentially directing the slugs away from each other to ensure equal spacing of fruiting bodies (Feit and Sollitto, 1987).  

      Ammonia released in pulses acts as a long-distance signalling molecule between colonies of yeast cells indicating depletion of nutrient resources and promoting synchronous development (Palkova et al., 1997; Palkova and Forstova, 2000). A similar mechanism may be at play to influence neighbouring Dictyostelium colonies. Furthermore, ammonia produced in millimolar concentrations (Schindler and Sussman, 1977) may also ward off predators in soil as observed in Streptomyces symbionts of leaf-cutting ants to inhibit fungal pathogens (Dhodary and Spiteller, 2021). Additionally, ammonia may be recycled into amino acids, within starving Dictyostelium cells to supporting survival and differentiation as observed in breast cancer cells (Spinelli et al., 2017). Therefore, using a diffusible gas like ammonia as a signalling molecule is likely to have bioenergetic advantages. Ammonia is a natural metabolic byproduct of amino acid catabolism and other cellular processes, making it readily available without requiring additional energy for synthesis. Instead of producing a dedicated signalling molecule, cells can exploit an existing by-product for developmental regulation.

      (2) The rescue of the mutant by adding ammonia gas to the entire culture indicates that ammonia conveys no positional information within the mound.

      Ammonia is known to influence rapid patterning of Dictyostelium cells confined in a restricted environment (Sawai et al., 2002). Both neutral red staining (a marker for prestalk and ALCs) (Fig. S2) and the prestalk marker ecmA/ ecmB expression (Fig. 8C) in the adgf mutants suggest that the mounds have differentiated prestalk cells but are blocked in development. The mound arrest phenotype can be reversed by exposing the adgf mutant mounds to ammonia.  

      Based on cell cycle phases, there exists a dichotomy of cell types, that biases cell fate to prestalk or prespore (Weeks and Weijer, 1994; Jang and Gomer, 2011). Prestalk cells are enriched in acidic vesicles, and ammonia, by raising the pH of these vesicles and the cytoplasm (Davies et al 1993; Van Duijn and Inouye 1991), plays an active role in collective cell movement (Bonner et al., 1989). Thus, ammonia reinforces or maintains the positional information by elevating cAMP levels, favouring prespore differentiation (Bradbury and Gross, 1989; Riley and Barclay, 1990; Hopper et al., 1993). 

      (3) By the time the cells have formed a mound, the cells have been starving for several hours, and desperately need to form a fruiting body to disperse some of themselves as spores, and thus need to form a tip no matter what.

      When the adgf mutants were exposed to ammonia just after tight mound formation, tips developed within 4 h (Fig. 6). In contrast, adgf mounds not exposed to ammonia remained at the mound stage for at least 30 h. This demonstrates that starvation alone is not sufficient to drive tip development and ammonia serves as a cue that promotes the transition from mound to tipped mound formation. 

      Many mound arrest mutants are blocked in development and do not proceed to form fruiting bodies (Carrin et al., 1994). Furthermore, not all the mound arrest mutants tested in this study were rescued by ADA enzyme (Fig. S3 A), and they continue to stay as mounds without dispersing as spores, suggesting that mound arrest in Dictyostelium can result from multiple underlying defects, whereas ammonia is an important factor controlling transition from mound to tip formation.

      (4) One can envision that the local ammonia concentration is possibly informing the mound that some minimal number of cells are present (assuming that the ammonia concentration is proportional to the number of cells), but probably even a minuscule fruiting body would be preferable to the cells compared to a mound. This latter idea could be easily explored by examining the fate of the ADGF cells in the mound - do they all form spores? Do some form spores?

      Or perhaps the ADGF is secreted by only one cell type, and the resulting ammonia tells the mound that for some reason that cell type is not present in the mound, allowing some of the cells to transdifferentiate into the needed cell type. Thus, elucidating if all or some cells produce ADGF would greatly strengthen this puzzling story.

      A fraction of adgf mounds form bulkier spore heads by the end of 36 h as shown in Fig. 3. This late recovery may be due to the expression of other ADA isoforms. Mixing WT and adgf mutant cell lines results in a slug with the mutants occupying the prestalk region (Fig. 9) suggesting that WT ADGF favours prespore differentiation. However, it is not clear if ADGF is secreted by a particular cell type, as adenosine can be produced by both cell types, and the activity of three other intracellular ADAs may vary between the cell types. To address whether adgf expression is cell type-specific, we will isolate prestalk and prespore cells, and thereafter examine adgf expression in each population.

      ADGF activity is likely to be higher in the tip to remove excess adenosine, the tip-inhibiting molecule (Wang and Schaap, 1985). Moreover, our results show that adgf<sup>-</sup> cells with high adenosine preferentially migrate to the prestalk rather than the prespore region when mixed with WT cells. Ammonia generated from adenosine deamination could thus drive tip development and prespore differentiation.

      Reviewer #2 (Public review):

      Summary:

      The paper describes new insights into the role of adenosine deaminase-related growth factor (ADGF), an enzyme that catalyses the breakdown of adenosine into ammonia and inosine, in tip formation during Dictyostelium development. The ADGF null mutant has a pre-tip mound arrest phenotype, which can be rescued by the external addition of ammonia. Analysis suggests that the phenotype involves changes in cAMP signalling possibly involving a histidine kinase dhkD, but details remain to be resolved.

      Strengths:

      The generation of an ADGF mutant showed a strong mound arrest phenotype and successful rescue by external ammonia. Characterization of significant changes in cAMP signalling components, suggesting low cAMP signalling in the mutant and identification of the histidine kinase dhkD as a possible component of the transduction pathway. Identification of a change in cell type differentiation towards prestalk fate

      Weaknesses:

      (1) Lack of details on the developmental time course of ADGF activity and cell type type-specific differences in ADGF expression.

      ADGF expression was examined at 0, 8, 12, and 16 h (Fig. 1), and the total ADA activity was assayed at 12 and 16 h (Fig. 4). As per the reviewer’s suggestion, we have now included the 12 h data (Fig. 4A) to provide additional insights into the kinetics of ADGF activity. The adgf expression was found to be highest at 16 h and hence, the ADA assay was carried out at that time point. However, the ADA assay will not exclusively reflect ADGF activity since it reports the activity of the three other isoforms as well.

      A fraction of adgf<sup>-</sup> mounds form bulkier spore heads by the end of 36 h as shown in Fig. 3. This late recovery may be due to the expression of the other ADA isoforms. Mixing WT and adgf mutant cell lines results in a slug with the mutants occupying the prestalk region (Fig. 9), suggesting that WT adgf favours prespore differentiation.

      However, it’s not clear if ADGF is secreted by a particular cell type, as adenosine can be produced by both cell types, and the activity of the other three intracellular ADAs may vary between the cell types. To address whether adgf expression is cell typespecific, we will isolate prestalk and prespore cells, and thereafter examine adgf expression in each population.

      ADGF activity is likely to be higher in the tip to remove excess adenosine, the tipinhibiting molecule (Wang and Schaap, 1985). Moreover, our results show that adgf<sup>-</sup> cells with high adenosine preferentially migrate to the prestalk rather than the prespore region when mixed with WT cells.

      (2) The absence of measurements to show that ammonia addition to the null mutant can rescue the proposed defects in cAMP signalling.

      The cAMP levels were measured at two time points 8 h and 12 h in the mutant. The adgf mutant has lower ammonia levels (Fig. 6), diminished acaA expression (Fig. 7) and reduced cAMP levels (Fig. 7) in comparison to WT at both 12 and 16 h of development. Since ammonia is known to increase cAMP levels (Riley and Barclay, 1990; Feit et al., 2001), addition of ammonia addition to the mutant is likely to increase acaA expression, thereby rescuing the defects in cAMP signalling.

      (3) No direct measurements in the dhkD mutant to show that it acts upstream of adgf in the control of changes in cAMP signalling and tip formation.

      The histidine kinases dhkD and dhkC are reported to modulate phosphodiesterase RegA activity, thereby maintaining cAMP levels (Singleton et al., 1998; Singleton and Xiong, 2013). By activating RegA, dhkD ensures proper cAMP distribution within the mound, which is essential for the patterning of prestalk and prespore cells, as well as for tip formation (Singleton and Xiong, 2013). Therefore, ammonia exposure to dhkD mutants is likely to regulate cAMP signalling and thereby tip formation. We will address this issue by measuring cAMP levels in the dhkD mutant.

    1. Author response:

      The following is the authors’ response to the original reviews.

      Overview:

      We appreciate all the constructive comments from the reviewer and the reviewing editor, as their suggestions have significantly improved our manuscript. In response to their comments, we have made several key revisions: First, we have performed new colocalization analyses between the active zone marker UNC-10::GFP and all UNC-13L variants (UNC13L, UNC-13L<sup>HK</sup>, UNC-13L<sup>D1-5N</sup>, and UNC-13L<sup>HK+D1-5N</sup>, all tagged with mApple). These results confirm that the mutations do not affect synaptic localization. Second, we have provided a clearer explanation of the “gain-of-function” term used in this study, emphasizing that it reflects an increased SV release due to C1-C2B module dysfunction rather than a single mechanistic state. Third, we have expanded the discussion on the physiological implications of the C1-C2B model, particularly its role in regulating synaptic transmission under varying neuronal activity conditions. Finally, to improve clarity and focus, we have removed unnecessary speculative discussions, ensuring that the revised manuscript centers on the most relevant findings.

      We have reorganized the manuscript to incorporate these new results into the figures and text. Full responses to all reviewer comments are provided below. We hope that the reviewer and the editor find these revisions satisfactory and that our manuscript is now suitable for publication in eLife.

      Joint Public Review:

      Summary:

      In this manuscript, the authors investigate how different domains of the presynaptic protein UNC-13 regulate synaptic vesicle release in the nematode C. elegans. By generating numerous point mutations and domain deletions, they propose that two membrane-binding domains (C1 and C2B) can exhibit "mutual inhibition," enabling either domain to enhance or restrain transmission depending on its conformation. The authors also explore additional Nterminal regions, suggesting that these domains may modulate both miniature and evoked synaptic responses. From their electrophysiological data, they present a "functional switch" model in which UNC-13 potentially toggles between a basal state and a gain-of-function state, though the physiological basis for this switch remains partly speculative.

      Strengths:

      (1) The authors conduct a thorough exploration of how mutations in the C1, C2B, and other regulatory domains affect synaptic transmission. This includes single, double, and triple mutations, as well as domain truncations, yielding a large, informative dataset.

      (2) The study includes systematically measuring both spontaneous and evoked synaptic currents at neuromuscular junctions, under various experimental conditions (e.g., different Ca²⁺ levels), which strengthens the reliability of their functional conclusions.

      (3) Findings that different domain disruptions produce distinct effects on mEPSCs, mIPSCs, and evoked EPSCs suggest UNC-13 may adopt an elevated functional state to regulate synaptic transmission.

      Weaknesses:

      It remains unclear whether the various domain alterations truly converge on a single "gain-offunction" state or instead represent multiple pathways for enhancing UNC-13 activity. Different mutations selectively affect spontaneous or evoked release, suggesting that each variant may not share the same underlying mechanism. Moreover, many conclusions rely on combining domain deletions or point mutations, yet the electrophysiological data show distinct outcomes across EPSCs, IPSCs, mini, and evoked responses. This raises questions about whether these manipulations all act on the same pathway and whether their observed additivity or suppression genuinely reflects a single mechanistic process. A unifying model-or at least a clearer explanation of why the authors infer one mechanistic state across different domain manipulations would strengthen the paper's conclusions.

      We appreciate the comment and understand the potential confusion regarding the use of the term "gain-of-function" in the manuscript. To clarify, the gain-of-function state described in this study does not refer to a single specific mechanistic change in UNC-13 but rather to a high synaptic vesicle (SV) release state achieved by disrupting the C1-C2B module - either through dysfunction of the C1 domain or the C2B domain (as seen with the HK and DN mutations).

      Our findings support a "seesaw" model in which the C1 and C2B domains maintain a dynamic balance in their interaction with the plasma membrane, binding to DAG and PIP2. This balance may increase the energy barrier for SV release, preventing excessive neurotransmitter release under basal conditions. However, the C1-C2B toggle may be disrupted by high neuronal activity and act in an unbalanced state, thereby enhancing synaptic transmission (i.e., the gain-of-function state). To address these concerns, we have provided a clearer explanation of this functional switch in the revised version of the manuscript (page 27).

      Regarding the differences between spontaneous and evoked neurotransmitter release, our previous studies have revealed that these two forms of release do not always respond similarly to various unc-13 mutations. This is a common phenomenon observed in other synaptic protein mutants, including synaptotagmin, tomosyn, and complexin, which indicates distinct yet partially overlapping regulatory mechanisms. Our model is well supported by most of the electrophysiological results from HK, DN, and HK+DN mutations across different unc-13 isoforms (UNC-13L, UNC-13S, UNC-13R, UNC-13ΔC2A, UNC-13ΔX). The main exception is that in UNC-13ΔX<sup>HK+DN</sup> mutants, the changes in mEPSCs and mIPSCs differ from those observed in evoked EPSCs. This suggests that the mechanisms regulating the functional switch of unc-13 may differ slightly between spontaneous and evoked release. Since the X region of unc-13 and Munc13 remains largely uncharacterized, our findings provide intriguing insights into its potential functional role.

      The manuscript proposes that UNC-13 toggles from a basal to a "gain-of-function" state under normal synaptic activity. However, it does not address when or how this switch might occur in vivo, since it is demonstrated principally via artificial mutations. Providing direct evidence or additional discussion of such switching under physiological conditions would be particularly informative.

      What is the physiological significance of the proposed gain-of-function state? The data suggest that certain mutants (e.g., HK+D1-5N) lacking the gain-of-function state can still support synaptic transmission at wild-type levels. How do the authors reconcile this with the idea that the gain-of-function state plays a critical role at the synapse?

      We appreciate these comments. While our model is mainly based on the dysfunction of the C1-C2B module (through HK and DN mutations), it provides a potential physiological framework for understanding how the structural balance of C1-C2B relates to the variability of synaptic transmission in the nervous system. In the CNS, synaptic transmission is highly variable, and the temporal pattern of the presynaptic activity may require dynamic switching of the fusion machinery, including UNC-13, between different functional modes, thereby triggering synaptic transmission at various levels. Our model suggests that under conditions of high neuronal activity, the C1-C2B module may transition from a balanced to an unbalanced state (gain-of-function state), thereby enhancing synaptic transmission.

      Regarding the physiological significance of the gain-of-function state, we acknowledge that certain mutants (e.g., HK+D1-5N) lacking this state can still support wild-type levels of synaptic transmission. This observation suggests that the gain-of-function state may not be strictly required for baseline synaptic function but rather plays a modulatory role under specific conditions, such as heightened neuronal activity or synaptic plasticity. Further investigations will be needed to determine the precise in vivo triggers and functional consequences of this switch under physiological conditions. Moreover, we will focus on several linker regions (between C1 and C2B, C2B and MUN) to investigate their potential roles in regulating synaptic transmission and their broader functional significance in UNC-13 dynamics.

      The authors determined the fluorescence intensity of mApple-tagged UNC-13 variants (Figure 1J-K and Figure 7J-K), finding no significant changes compared to the wild-type. However, a more detailed analysis of the density or distribution of fluorescent puncta in axons could clarify whether certain mutations alter the localization of UNC-13 at synapses. Demonstrating colocalization with wild-type UNC-13 (or another presynaptic marker) would help rule out mislocalization effects.

      We appreciate the comment. In response, we have included a more detailed analysis of the synaptic localization of both wild-type and mutated UNC-13L in the revised manuscript. Our data show that in all scenarios, UNC-13 proteins exhibit strong colocalization with the active zone marker UNC-10::GFP (Figure 1L). Along with the fluorescence intensity data in Figure 1J, our findings indicate that the C1 and C2B mutations do not affect the expression level or the localization of UNC-13 at synapses. These results have been incorporated into the revised manuscript (page 8) and in Figure 1L.

      The study mainly relies on extrachromosomal transgenes, which can show variable copy numbers and expression levels among individual worm strains. This variability might complicate interpretation, as differences in expression could mask or exaggerate certain phenotypes.

      We agree that the expression levels of synaptic proteins can influence synaptic transmission levels. However, given the large number of mutations and truncations employed in this study, generating single-copy rescue lines for all transgenic strains would be a significant undertaking. On average, we need to microinject 50-100 worms to obtain one single-copy line, whereas injecting only 5-10 worms allows us to generate at least three independent extrachromosomal arrays. Based on our previous work, we found that the synaptic transmission levels are comparable between various extrachromosomal rescue arrays of unc13 and their single-copy rescue lines (e.g., UNC-13L, UNC-13S, UNC-13R, UNC-13ΔC2A, UNC-13ΔC2B, etc.). In future studies, we aim to use single-copy expression or CRISPRbased methods to induce deletions or mutations in various synaptic proteins.

      Finally, the discussion is somewhat diffused. Streamlining the text to focus on the most direct connections would help readers pinpoint the key conclusions and open questions.

      We appreciate the comment. As suggested, we have refined the discussion section. Specifically, we have removed the last part of the discussion (Functional roles of the linkers in UNC-13).  

      Recommendations for the authors:

      Reviewer #1 (Recommendations for the authors):

      (1) Clarify the "Gain-of-Function" State. Provide stronger justification or explicit discussion of whether all manipulations that enhance SV release truly correspond to the same mechanistic state or if multiple conformational states might be at play.

      The “gain-of-function” state in this manuscript refers to a specific conformational status of UNC-13 that enhances synaptic vesicle (SV) release probability (both spontaneous and evoked) as a result of mutations (HK and DN) in the C1 and C2B domains. This effect is observed across multiple UNC-13 isoforms, including UNC-13L, UNC-13S, and UNC-13R. Prior studies from our group and others have demonstrated that C1 and C2B exhibit conserved functions in regulating synaptic transmission (Li et al., 2019, Cell Reports; Liu et al., 2021, Cell Reports; Michelassi et al., 2017, Neuron), supporting the idea that these domains share a common mechanism for modulating SV release. Given that C1 and C2B act as a functional unit (Michelassi et al., 2017, Neuron; and this study), we define all synaptic states induced by the dysfunction of these two domains as the "gain-of-function" mode.

      However, it is important to note that this classification does not apply to high-release probability states induced by mutations in other domains.

      The concept of a gain-of-function state due to C1 and C2B dysfunction has been previously proposed in studies of Munc13. Basu et al. (2007, Journal of Neuroscience) demonstrated that the H567K mutation in Munc13-1 C1 increases both spontaneous and evoked release probability, leading to a gain-of-function mode. Similarly, work from the Südhof group showed that KW and DN mutations in Munc13-1 C2B also enhance release probability, thereby inducing a gain-of-function state (Shin et al., 2010, Nature Structural & Molecular Biology). Our recent findings further support this idea, showing that UNC-13 C2B D3,4N (Li et al., 2019, Cell Reports; Liu et al., 2021, Cell Reports; Michelassi et al., 2017, Neuron) and the newly identified D1-5N mutation (this study) significantly elevate SV release, consistent with the D1,2N mutations reported by Shin et al.

      Overall, our study integrates and extends previous findings, providing strong evidence that the C1 and C2B domains function as a regulatory switch between a basal physiological mode, a gain-of-function mode (enhanced release), and a loss-of-function mode (impaired release). This framework advances our understanding of how C1 and C2B dysfunction affects synaptic transmission and plasticity.

      (2) Add comparisons to wild-type UNC-13L: When presenting data for deletions/mutants as "controls," include a visual reference (e.g., dashed line in figures) showing wild-type UNC13L levels. This will help readers see whether each construct is above or below the normal activity baseline.

      As suggested, a dashed line showing the level of UNC-13L has been added to the bar graphs of all evoked EPSCs. The functional switch model is well supported by the results of the evoked EPSCs.

      (3) Mutant and wild-type UNC-13 colocalization analysis: Demonstrating whether each mutant localizes robustly to synapses, in comparison to wild-type UNC-13, would bolster the interpretation of electrophysiological changes. If the authors have these data, adding them would address the possibility of mislocalization.

      We agree with the reviewer that there would be value to address the possibility of mislocalization. However, in our experience working with UNC-13 mutant colocalization, we have found that neither deleting the X, C1 and C2B domains in UNC-13L  nor deleting C1 and C2B domain in UNC-13MR or UNC-13R altered the synaptic colocalization with the active zone protein UNC-10/RIM (Li 2019, Liu 2021), suggesting that C1 and C2B domains in UNC-13 are not involved in the regulation of protein localization. Thus, the mutations in the C1 and C2B domains are unlikely leading to protein mislocalization in the synaptic region.

      (4) If possible, adding analysis using single-copy transgenes to confirm that extrachromosomal array expression variability does not qualitatively change the conclusions.

      We strongly agree with the reviewer that single-copy transgenes would provide more stable protein expression levels and further consolidate our conclusions. However, several factors give us confidence that the extrachromosomal array rescue approach does not introduce significant variability in our results: First, our prior research has shown that SV release levels are generally comparable between extrachromosomal arrays carrying various unc13 transgenes and their corresponding single-copy rescue lines (e.g., UNC-13L, UNC-13S, UNC-13R, UNC-13ΔC2A, and UNC-13ΔC2B). Second, the major conclusions in this study are drawn from highly consistent and robust changes in SV release between different rescue lines (e.g., UNC-13L<sup>HK+DN</sup> vs UNC-13L<sup>DN</sup>; UNC-13S<sup>HK+DN</sup> vs UNC-13S<sup>HK</sup> or UNC-13S<sup>DN</sup> ). Third, our imaging data indicate that the protein levels are indistinguishable between different unc-13 rescue arrays carrying C1 and C2B mutations, further supporting the validity of our findings.

      Additionally, due to our recent relocation to a new institute, we are still in the process of setting up our microinjection system. Generating single-copy transgenes for all the extrachromosomal arrays used in this study would require significant time. We appreciate the reviewer’s understanding of our current situation. For our future studies regarding unc-13 and other synaptic proteins, we will prefer to use single-copy expression rather than extrachromosomal arrays.

      (5) Reduce the length and speculation in the Discussion. A concise discussion that focuses on the most direct implications of the present findings will help improve the readability of this paper.

      We appreciate the comment. As suggested, we have refined the discussion section.

      Specifically, the last part of the discussion (Functional roles of the linkers in UNC-13) was removed.

      (6) Minor formatting detail: In Figure 5C (left panel), adjust the y-axis label to ensure it aligns properly and improves clarity.

      We appreciate the reviewer’s suggestion and have adjusted the y-axis label accordingly in the revised version (see revised Figure 5).

    1. Author response:

      The following is the authors’ response to the original reviews.

      We would like to thank the reviewer and the editor for carefully reading our manuscript, and acknowledging the strength of combining quantitative analysis with semi-naturalistic experiments on mice social behavior. Please find below our response to both the public review and the recommendation to the authors. As a summary, we have included additional figures and texts such as 

      - a new Results subsection “Choosing timescales for analysis ” (page 6)

      - a new Materials and Methods subsection “Maximum entropy model with triplet interactions” (page 17)

      - new supplementary figures, which have current labels of:

      - Figure 2 - figure supplement 5

      - Figure 2 - figure supplement 6

      - Figure 2 - figure supplement 7

      - Figure 4 - figure supplement 1

      - Figure 4 - figure supplement 2    

      Public Reviews: 

      Reviewer #1 (Public Review): 

      Summary: 

      In this manuscript, Chen et al. investigate the statistical structure of social interactions among mice living together in the ECO-Hab. They use maximum entropy models (MEM) from statistical physics that include individual preferences and pair-wise interactions among mice to describe their collective behavior. They also use this model to track the evolution of these preferences and interactions across time and in one group of mice injected with TIMP-1, an enzyme regulating synaptic plasticity. The main result is that they can explain group behavior (the probability of being together in one compartment) by a MEM that only includes pair-wise interactions. Moreover, the impact of TIMP-1 is to increase the variance of the couplings J_ij, the preference for the compartment containing food, as well as the dissatisfaction triplet index (DTI). 

      Strengths: 

      The ECO-Hab is a really nice system to ask questions about the sociability of mice and to tease apart sociability from individual preference. Moreover, combining the ECO-Hab with the use of MEM is a powerful and elegant approach that can help statistically characterize complex interactions between groups of mice -- an important question that requires fine quantitative analysis. 

      Weaknesses: 

      However, there is a risk in interpreting these models. In my view, several of the comparisons established in the current study would require finer and more in-depth analysis to be able to establish firmer conclusions (see below). Also, the current study, which closely resembles previous work by Shemesh et al., finds a different result but does not provide the same quantitative model comparison included there, nor a conclusive explanation of why their results are different. In total, I felt that some of the results required more solid statistical testing and that some of the conclusions of the paper were not entirely justified. In particular, the results from TIMP-1 require proper interaction tests (group x drug) which I couldn't find. This is particularly important when the control group has a smaller N than the drug groups.  

      We would like to thank the reviewer and the editor for carefully reading our manuscript, and acknowledging the strength of combining quantitative analysis with semi-naturalistic experiments on mice social behavior. Thanks to the reviewer’s suggestion, we have improved our manuscript by 

      (1) A proper comparison with Shemesh et al., especially to include maximum entropy models with triplet interactions. We show that triplet models overfit even given the entire 10 day dataset, which limits our study to look at pairwise interactions.

      (2) Results on cross-validation for both triplet interaction models and pairwise interaction models, completed on aggregates of various length of days. This analysis showed that pairwise models overfit for single-day data, and led us to learn pairwise models only on 5day aggregation of data. We have updated the manuscript (both the text and the figures) to present these results.

      (3) New results that subsample the drug groups to the same size as the control group. The conclusions about TIMP-1 treated mice hordes hold when we compare groups of the same size. 

      Recommendations for the authors:  

      Reviewer #1 (Recommendations For The Authors): 

      (1) COMPARISON WITH PREVIOUS WORK. The comparison with the cited previous work of Shemesh et al. 2013 rests novelty to the use of ME models in characterizing social interactions between groups of mice as well as sheds doubts on the main claim of the manuscript, namely that second-order correlations are sufficient to describe the joint distribution of occupancies of all mice (in particular triplets; there is no quantification of the variance explained by model in panel Fig. 2D). In my view, to make the claim "These results show that pairwise interaction among mice are sufficient to assess the observed collective behavior", the authors should compare models with 2nd and 3rd order interactions and quantify how much of the total correlation can be explained by pair-wise interactions, triplet interactions, and so on. Without a proper model comparison, it is unclear how the authors can make such a claim. One thing observed by Shemesh et al. is that, on average, J_ij are negative. This does not seem to be the case in the current study and the authors should discuss why. 

      Finally, the explanation provided in the Discussion about this discrepancy (spatial resolution and different group size) are not completely satisfactory. With more animals, one would imagine that the impact of higher order correlations would increase (and not decrease) as the number of terms of 3rd, 4th, ... order will be very big. I would also think that the same could be true for the spatial scale: assessing interactions with a coarser spatial grid (whole cages in the case of the ECO-Hab) would allow for simultaneous interactions among more mice to happen compared with a situation in which the spatial grid is so small that only a few animals can fit in each subdivision. 

      We thank the reviewer for the recommendation. In the updated version of the manuscript, we explicitly learn the triplet interaction model. We show that because the number of mice in our experiment is much larger than Shemesh et al., a triplet model runs into the problem of overfitting.

      In particular, we found that the test set likelihood increases monotonically when the L2 regularization strength increases, which corresponds to a suppression of the triplet interaction strength (see additional supplementary figure, now Figure 2 - figure supplement 5). More specifically, for the range of regularization strength (β<sub>G</sub>) we tested (10<sup>-1</sup> < β<sub>G</sub> < 10<sup>1</sup>), the maximum test set likelihood is achieved at β<sub>G</sub> = 10<sup>1</sup>, which corresponds to . Notice that those learned triplet interactions are very close to zero. This means we should select a model with pairwise interactions over a model with triplet interactions.

      We have added the above reasoning in page 5, line 166-169 of the Results section with the sentence “Moreover, models with triplet interactions show signs of overfitting under crossvalidation, which is mitigated when the triplet interactions are suppressed close to zero using L2 regularization”,  a new subsection “Maximum entropy model with triplet interactions” in Materials and Methods (page 16-17, line 548 - 563) to describe the protocols of learning and crossvalidation for these triplet interaction models. 

      Furthermore, we extended the discussion about the difference between Shemesh et al. and our results in the Discussion section. In addition to the difference of spatial scales (chamber vs. location in the chamber), and the difference of group size and its impact on data analysis (N = 15 in our largest cohort and N = 4 in theirs), we added a discussion about the difference of experimental arena, which in Eco-HAB contains connected chambers that mimic the naturalistic environment, and in Shemesh et al. contains a single chamber. The change in the text is on page 12, between line 390 and line 394.

      We thank the reviewers for pointing out that the mean 2nd order interaction in Shemesh et al. is negative. One possibility is that the labeled areas in Shemesh et al. are much smaller than in our Eco-HAB setup, which could suggest that mice do have the space to stay in the same area, which will lead to a negative mean 2nd order interaction.

      (2) ASSESSMENT OF THE TEMPORAL EVOLUTION OF THE INTERACTIONS. The analysis of the stability of the social structure is not conclusive. First, I don't think the authors can conclude that "These results suggest that the structure of social interactions in a cohort as a whole is consistent across all days." If anything is preserved, they would be the statistics of that structure but not the structure itself (i.e., there is no evidence for that). The comparison of the stability of the mean <h\_i> and the mean <J\_ik> would also require a statistical test to be able to state that "Delta h_i changed more strongly from day to day (Fig. 3D, top panel) relative to the interaction measured as the Jij's." The same is true for the assessment of the TIMP: the differences found in the variability in J_ij and in the mean and variance of the h_i's, look noisy and would require a proper statistical test. The traces look quite variable across days in the control condition, so assessing differences may be difficult. Finally, it would be good to know if the variability in individual J_ij is because they truly vary from day to day or because estimating them within one day is difficult (statistical error). If the reason is the latter, one could decrease the temporal resolution to 2-3 days and see whether the estimated J_ijs are more stable. Perhaps, also for that reason, the summed interaction strength J_i is also more stable, simply because it aggregates more data and has a smaller statistical error. 

      We thank the reviewer for pointing out the necessity of assessing the temporal evolution of the interactions. The problem of shorter data duration leads to more noise in the estimation, together with the reviewer’s Comment 4 about the risk of overfitting, led us to add a new Results subsection “Choosing timescales for analysis” (page 6, line 171 to line 189). Specifically, we assess whether the pairwise maximum entropy model overfits using data from _K-_day aggregates, by computing the log-likelihood of both the training sets and the test sets,which is chosen to be 1 hour from the 6 hour data window of each day. We found that for single day data, the pairwise maximum entropy model overfits. In contrast, for data with aggregates of more or equal to 4 days of data, the pairwise model does not overfit. This new result is supported by an additional supplementary figure, now Figure 2 - figure supplement 6.

      To be consistent with later approaches in the manuscript where we consider the effects of TIMP1, we choose the analysis windows to be data aggregates from 5 days. This means for the experiment that collects a total of 10 days of data, there are only two time points, thus a study of the temporal evolution is limited to comparison between the first 5 days and the last 5 days of the experiment. We describe these results in the Results subsection “Stability of sociability over time” (page 6, line 190 - 220). An additional supplementary figure, now Figure 2 - figure supplement 7, shows in details the comparison of the inferred interaction strength J and the chamber preference between the first 5 days and the last 5 days for the 4 cohorts of male C57BL6/J mice, which shows the inferred interactions have a consistent variability across first and last 5 days, and across all cohorts. The small value of Pearsons’ correlation coefficient shows that the exact structure (pairspecific J<sub>ij</sub>) is not stable. At the end of the Results subsection “Stability of sociability over time”, we explicitly say that “This implies that the maximum entropy model does not infer a social structure that is stable over time.”

      (3) EFFECT OF TIMP-1. The reported effects of TIMP-1 on the variance of the J_ij seem very small and possibly caused by a few outlier J_ijs (perhaps from one or two animals) which

      are not present in the control group which seems to have fewer animals (N = 9 minus two mice that died after the surgery vs. N = 14 in the drug group), so the lack of a significant difference in the sigma[J_ij] could simply be due to a smaller N (a test for the interaction group x drug was not done). 

      The clearest effect of TIMP-1 seems to be a change in place preference (h_i) and not the interaction terms (J_ij) (Fig. 3F bottom). But this could be explained by a number of factors that have nothing to do with sociability such as that recovery from surgery makes them eat more/less. The fact that it seems to be present, as recognized by the authors, in the control group with no TIMP-1 and that this effect was not observed in the female group F1, puts into question the specificity and reproducibility of the result. 

      Finally, the effect of TIMP-1 in the DTI would require more statistics (testing the interaction group x drug). The fact that the control group has fewer animals (N = 9 vs. 15 and 13 in the drug groups), and that there is a weaker trend in the DTI of the control group to start high and then decrease, makes this test necessary.  

      Now, after we select a proper timescale to learn the pairwise maximum entropy model, we update the manuscript to present results only on 5-day aggregation of data (see updated Figure 3, updated supplementary figures, Figure 3 - figure supplement 1 and 2). For the variance of the J<sub>ij</sub>, the F-test between different 5-day aggregates before and after TIMP for the male drug group now shows a nonsignificant p-value after applying the Bonferroni correction. For the female drug group, the difference of the J<sub>ij</sub> variance is still significant. 

      To test the effect of different group size on DTI, we subsampled the drug groups by 1) subsampling the inferred interactions learned from the original N = 15 or N = 13 data, or 2) subsampling the mice colocalization data and then inferring the pairwise interactions.  In both cases, the resulting DTI for the subsampled drug group still exhibits the same global pattern as before, i.e. after TIMP-1 injection, DTI significantly increases, which after 5 days falls back to the baseline level. The results are supported by two additional supplementary figures, Figure 4 - figure supplement 1 and 2. This result is referred to in the text in the Results subsection “Impaired neuronal plasticity in the PL affects the structure of social interactions” (page 10, line 333 - 336): “Notably, the difference of the DTI is not due to the control group M4 has less mice, as subsampling both on the level of the inferred interactions (Figure 4 - figure supplement 1) and on the level of the mice locations (Figure 4 - figure supplement 2) give the same DTI for cohorts M1 and F1.”

      (4) MODEL COMPARISON. Any quantitative measure of "goodness" of the model , (i.e., comparison of the predictions of the model with triplet frequency as well as the distribution of p(K)) should be cross-validated. In particular, Fig. S2 needs to be cross-validated for the goodness of fit to be properly quantified. Is the analysis shown in Fig. 3F crossvalidated? Because otherwise, there is an expected increase in the likelihood simply explained by an increase in the number of parameters of the model (i.e., adding the J_ij's). 

      As discussed in our responses to Comment 1 and 2, we have added results about cross-validation in the new supplementary figures, Figure 2 – figure supplement 5 and 6 , for which we computed the test-set and training-set likelihood for maximum entropy models with pairwise interactions and also for models with triplet interactions. Figure 2 - figure supplement 6 shows the pairwise model does not overfit when we consider the aggregated data from more or equal to 4 days. 

      (5) EFFECT OF SLEEP. The comparison of p(K) between the data and the model requires a bit more investigation: the model underestimates instances in which almost all mice were in the same compartment (i.e., for K >= 13. p(K)_data >> p(K)_MEM; btw where is the pairwise point p(15) in Fig. 2E and Fig. S4?). Could this be because there were still short periods during the dark cycle in which all mice were asleep in one of the cages? As explained by the authors, sleep introduces very strong higher order correlations between animals as they like sleeping altogether. Knowing whether removing light periods was enough to remove this "sleep contamination" or not, would be important in order to interpret discrepancies between the pairwise model and the data. 

      Figure 2E shows that the pairwise maximum entropy model (in black) overestimates the data (in blue circles) for P(K) at large K (and not underestimates). In the data, we never observe all 15 mice being in the same box; hence P<sub>data</sub>(15) = 0, and does not show up in the log-scaled figure (same for Figure 2 - figure supplement 3). A possible explanation for the pairwise model overestimating P(K) at large K is that the finite-sized box limits the total number of mice that are comfortably staying in the same box. It can also be due to the fact that the number of time points at which K >= 13 is small and hence causes an underestimation due to finite data. We have added this interpretation of the discrepancy of P(K) to Section “Pairwise interaction model explains the statistics of social behavior” in page 6, line 160. 

      We thank the Reviewer for raising the point of “sleep contamination”. Indeed, Eco-HAB data, as do data from other 24h-testing behavioral systems, demonstrate distinct differences in activity levels during the light and dark phases of the light-dark cycle (Rydzanicz et al., EMBO Mol. Med., 2024). During the light phases, mice primarily sleep and, as noted, they huddle, so many individuals within the cohort tend to remain in close proximity for extended periods. We acknowledge that including such periods in the analysis could potentially introduce confounding effects to the model due to limited movement and interactions, and this is why we decided not to use this data. However, during the dark phases, mice are highly active, with individuals rarely staying in the same compartment for long periods. Specifically, in the dark phases, while there are occasional instances where a few mice may remain in the same compartment for over 1 hour, the majority exhibit considerable mobility, actively exploring and transitioning between compartments. We see no compelling reason to exclude these periods from our analysis, as such activity aligns with the natural behavioral repertoire of the mice and provides robust data for our model. Furthermore, it is well-established that mammals, including nocturnal species such as mice, are most active shortly after waking, typically at the onset of their active phase (i.e., the beginning of the dark phase). To ensure a conservative approach, we specifically analyzed the first 6 hours of the dark phase when the cumulative number of box visits is at its peak, indicating heightened activity levels. In our view, this period offers an optimal window for studying natural behaviors, including social interactions.

      Additionally, prior studies using the Eco-HAB system have consistently demonstrated that mice engage in social interactions both within the compartments and in the connecting tubes during the dark phase (Puścian et al., eLife, 2016, Winiarski et al. in press). Given this evidence and the observed behavioral dynamics in our data, the likelihood of mice being asleep during the analyzed periods of the dark phase is very low.

      We hope this clarification addresses the reviewer’s concerns and highlights the rationale underpinning our analysis choices. Thank you for raising this important point, which allowed us to provide additional context for our approach.

      (6) COMPARTMENT PREFERENCES. The differences between p(K) across compartments also would require a bit more attention: of a MEM with non-spatially dependent pair-wise interactions shows differences across compartments, it must be because of the terms h_{i,r} terms which contain a compartment index, right? Wouldn't this imply that the independence model, which always underrepresents data events with large K, already contains the difference in goodness of fit between compartments (1, 3) and (2, 4)? In the plots, it does not look like the goodness of the independent model depends on the compartment (the authors could compare directly the models' predictions between compartments). Moreover, when looking at Fig. 2C, it does not look like the value of h_{i,r} in compartments (1,3) is higher than in (2,4) (if anything, it would be the other way around). How can this be explained? It would be good to know if the difference across compartments comes from differences in the empirical p(K) or in the models' prediction? If the difference is in the data p(K), could it be that the compartments 2-4 showing higher p(K=15) (i.e., larger difference with the pairwise MEM prediction) are those chosen by mice to sleep during the light cycle? If not, what could explain these differences across compartments? Could the presence of food and water explain this difference? 

      The reviewer is correct, in the pairwise MEM, the difference across compartments enter in the box preference h<sub>ir</sub>. Greater h<sub>ir</sub> means compartment r is more attractive to mouse i. Because box 2 and 4 contain food and water, we expect that mice are more attracted to box 2 and 4, and this is what we see in Figure 2C, bottom subpanels. To reduce the number of parameters to look at, we introduce an index Δh<sub>i</sub> = h<sub>i2</sub> + h<sub>i4</sub> - h<sub>i1</sub> - h<sub>i3</sub>. This index Δh<sub>i</sub> is found to be mostly positive (see updated Figure 3C), which makes sense because mice are attracted to food and water. 

      Next we analyze the difference of P(K) across compartments (Figure 2 - figure supplement 3). There is already a difference in the P(K) calculated from empirical data. For example, P(K) in compartment 2 has a maximum at K = 5 while P(K) in compartment 1 has a maximum at K = 3

      One interesting observation is that it seems from Figure 2 - figure supplement 3 that the pairwise model explains P(K) in compartment 1 and compartment 3 better than in compartment 2 and in compartment 4. In compartment 2 and 4, the pairwise MEM overestimates P(K) for large K. An alternative MEM could include compartment-specific interaction strength, but it will also introduce 315 new parameters for a mice cohort with size N = 15.

      MINOR

      (1) A more quantitative comparison between in-cohort sociability and couplings J_ij as œwell as mean rates and parameters h_i is required. The matrices in Fig. 2C do look similar. So it is not clear how the comparison between these values is contributing to characterizing the correlation structure of the data. 

      The comparison between in-cohort sociability and coupling J<sub>ij</sub> is given by supplementary Figure 2 - figure supplement 2.  The key point for the model with the learned J<sub>ij</sub> reproducing the in-cohort sociability is given by Figure 2 - figure supplement 1.

      (2) Analysis of "in-state" probability is not explained. To me, it wasn't obvious what Fig. S5 is showing. I was assuming that this analysis was comparing the prediction of the MEM about the position of each animal at each time point, given its preference (h), pairwise interactions (J_ij), and the position of all other animals and the true position of the animal. But it seems like it is comparing the shape of the distribution of this prob across time between the data and the model (I guess the data had to be temporally binned in coarser temporal periods to yield prob values other than 0s and 1s). Also, not clear whether this analysis was done for each compartment separately and then averaged. This needs explanation. 

      The in-state probability is comparing the prediction of the MEM about the position of each animal at each time point, given its preference (h), pairwise interactions (J<sub>ij</sub>), and the position of all other animals and the true position of the animal. To achieve values between 0s and 1s, we bin the data temporally according to the model-predicted in-state probability. 

      We have added the explanation of in-state probability on page 6, line 163-166. We have also improved the description of in-state probability in Materials and Methods (subsection “Comparing in-state probability between model prediction and data”, line 493 - 503, page 15), and added a pointer from the main text to it. 

      (3) Looks like Fig. S3 is not cited in the text. 

      We added a pointer to Fig. S3 (now Figure 2 - figure supplement 2) in line 154. 

      (4) The authors say that "TIMP-1 release from the TIMP-1-loaded nanoparticles diminishes after 5 days." Does that mean from the day of the injection (4-5 days before the "After Day 1") or five days after reintroduced in the ECO-Hab? 

      It means five days after the mice were re-introduced in the ECO-Hab. We have updated the text in Results/Effects of impairing neuronal plasticity in the PL on subterritory preferences and sociability (the end of the first paragraph of this subsection) to 

      “The choice of five-day aggregated data for analysis is in line both with the proper timescales needed for the pairwise maximum entropy model to not overfit, and with the literature that TIMP-1 release from the TIMP-1-loaded nanoparticles is stable for 7-10 days after injection (Chaturvedi et al., 2014)  (i.e. 2-5 days after the mice are reintroduced to Eco-HAB).” (line 272 - 276, page 9)

      (5) In Methods, the authors should report the final N of each of the three groups. 

      The number of final N is reported in Table 1 (page 13). In the updated version, we have added a pointer to Table 1 in Materials and Methods/Animals, and in Materials and Methods/Exclude inactive and dead mice from analysis. We have also expanded the caption of Table 1 to clarify the difference between final N and initial N, and added a pointer to Materials and Methods/Exclude inactive and dead mice from analysis.

    1. Author response:

      The following is the authors’ response to the original reviews.

      eLife Assessment

      This study introduces a useful deep learning-based algorithm that tracks animal postures with reduced drift by incorporating transformers for more robust keypoint detection. The efficacy of this new algorithm for single-animal pose estimation was demonstrated through comparisons with two popular algorithms. However, the analysis is incomplete and would benefit from comparisons with other state-of-the-art methods and consideration of multi-animal tracking.

      First, we would like to express our gratitude to the eLife editors and reviewers for their thorough evaluation of our manuscript. ADPT aims to improve the accuracy of body point detection and tracking in animal behavior, facilitating more refined behavioral analyses. The insights provided by the reviewers have greatly enhanced the quality of our work, and we have addressed their comments point-by-point.

      In this revision, we have included additional quantitative comparisons of multi-animal tracking capabilities between ADPT and other state-of-the-art methods. Specifically, we have added evaluations involving homecage social mice and marmosets to comprehensively showcase ADPT’s advantages from various perspectives. This additional analysis will help readers better understand how ADPT effectively overcomes point drift and expands its applicability in the field.

      Reviewer #1:

      In this paper, the authors introduce a new deep learning-based algorithm for tracking animal poses, especially in minimizing drift effects. The algorithm's performance was validated by comparing it with two other popular algorithms, DeepLabCut and LEAP.The accessibility of this tool for biological research is not clearly addressed, despite its potential usefulness. Researchers in biology often have limited expertise in deep learning training, deployment, and prediction. A detailed, step-by-step user guide is crucial, especially for applications in biological studies.

      We appreciate the reviewers' acknowledgment of our work. While ADPT demonstrates superior performance compared to DeepLabCut and SLEAP, we recognize that the absence of a user-friendly interface may hinder its broader application, particularly for users with a background solely in biology. In this revision, we have enhanced the command-line version of the user tutorial to provide a clear, step-by-step guide. Additionally, we have developed a simple graphical user interface (GUI) to further support users who may not have expertise in deep learning, thereby making ADPT more accessible for biological research.

      The proposed algorithm focuses on tracking and is compared with DLC and LEAP, which are more adept at detection rather than tracking.

      In the field of animal pose estimation, the distinction between detection and tracking is often blurred. For instance, the title of the paper "SLEAP: A deep learning system for multi-animal pose tracking" refers to "tracking," while "detection" is characterized as "pose estimation" in the body text. Similarly, "Multi-animal pose estimation, identification, and tracking with DeepLabCut" uses "tracking" in the title, yet "detection" is also mentioned in the pose estimation section. We acknowledge that referencing these articles may have contributed to potential confusion.

      To address this, we have clarified the distinction between "tracking" and "detection" Results section under " Anti-drift pose tracker." (see lines 118-119). In this paper, we now explicitly use “track” to refer to the tracking of all body points or poses of an individual, and “detect” for specific keypoints.

      Reviewer #1 recommendations:

      (1) DLC and LEAP are mainly good in detection, not tracking. The authors should compare their ADPT algorithm with idtracker.ai, ByteTrack, and other advanced tracking algorithms, including recent track-anything algorithms.

      (2) DeepPoseKit is outdated and no longer maintained; a comparison with the T-REX algorithm would be more appropriate.

      We appreciate the reviewer's suggestion for a more comprehensive comparison and acknowledge the importance of including these advanced tracking algorithms. However, we have not yet found suitable publicly available datasets for such comparative testing. We appreciate this insight and will consider incorporating T-REX into future comparisons.

      (3) The authors primarily compared their performance using custom data. A systematic comparison with published data, such as the dataset reported in the paper "Multi-animal pose estimation, identification, and tracking with DeepLabCut," is necessary. A detailed comparison of the performances between ADPT and DLC is required.

      In the previous version of our manuscript, we included the SLEAP single-fly public dataset and the OMS_dataset from OpenMonkeyStudio for performance comparisons. We recognize that these datasets were not comprehensive. In this revision, we have added the marmoset dataset from "Multi-animal pose estimation, identification, and tracking with DeepLabCut" and a customized homecage social mice dataset to enhance our comparative analysis of multi-animal pose estimation performance. Our comprehensive comparison reveals that ADPT outperforms both DLC and SLEAP, as discussed in the Results section under "ADPT can be adapted for end-to-end pose estimation and identification of freely social animals.". (Figure 1, see lines 303-332)

      (4) Given the focus on biological studies, an easy-to-use interface and introduction are essential.

      In this revision, we have not only developed a GUI for ADPT but also included a more detailed tutorial. This can be accessed at https://github.com/tangguoling/ADPT-TOOLBOX

      Reviewer #2:

      The authors present a new model for animal pose estimation. The core feature they highlight is the model's stability compared to existing models in terms of keypoint drift. The authors test this model across a range of new and existing datasets. The authors also test the model with two mice in the same arena. For the single animal datasets the authors show a decrease in sudden jumps in keypoint detection and the number of undetected keypoints compared with DeepLabCut and SLEAP. Overall average accuracy, as measured by root mean squared error, generally shows similar but sometimes superior performance to DeepLabCut and better performance compared to SLEAP. The authors confusingly don't quantify the performance of pose estimation in the multi (two) animal case instead focusing on detecting individual identity. This multi-animal model is not compared with the model performance of the multi-animal mode of DeepLabCut or SLEAP.

      We appreciate the reviewer's thoughtful assessment of our manuscript. Our study focuses on addressing the issue of keypoint drift prevalent in animal pose estimation methods like DeepLabCut and SLEAP. During the model design process, we discovered that the structure of our model also enhances performance in identifying multiple animals. Consequently, we included some results related to multi-animal identity recognition in our manuscript.

      In recent developments, we are working to broaden the applicability of ADPT for multi-animal pose estimation and identity recognition. Given that our manuscript emphasizes pose estimation, we have added a comparison of anti-drift performance in multi-animal scenarios in this revision. This quantifies ADPT's capability to mitigate drift in multi-animal pose estimation.

      Using our custom Homecage social mice dataset, we compared ADPT with DeepLabCut and SLEAP. The results indicate that ADPT achieves more accurate anti-drift pose estimation for two mice, with superior keypoint detection accuracy. Furthermore, we also evaluated pose estimation accuracy on the publicly available marmoset dataset, where ADPT outperformed both DeepLabCut and SLEAP. These findings are discussed in the Results section under "ADPT can be adapted for end-to-end pose estimation and identification of freely social animals."

      The first is a tendency to make unsubstantiated claims that suggest either model performance that is untested or misrepresents the presented data, or suggest excessively large gaps in current SOTA capabilities. One obvious example is in the abstract when the authors state ADPT "significantly outperforms the existing deep-learning methods, such as DeepLabCut, SLEAP, and DeepPoseKit." All tests in the rest of the paper, however, only discuss performance with DeepLabCut and SLEAP, not DeepPoseKit. At this point, there are many animal pose estimation models so it's fine they didn't compare against DeepPoseKit, but they shouldn't act like they did.

      We appreciate the reviewer's feedback regarding unsubstantiated claims in our manuscript. Upon careful review, we acknowledge that our previous revisions inadvertently included statements that may misrepresent our model's performance. In particular, we have revised the abstract to eliminate the mention of DeepPoseKit, as our comparisons focused exclusively on DeepLabCut and SLEAP.

      In addition to this correction, we have thoroughly reviewed the entire manuscript to address other instances of ambiguity and ensure that our claims are well-supported by the data presented. Thank you for bringing this to our attention; we are committed to maintaining the integrity of our claims throughout the paper.

      In terms of making claims that seem to stretch the gaps in the current state of the field, the paper makes some seemingly odd and uncited statements like "Concerns about the safety of deep learning have largely limited the application of deep learning-based tools in behavioral analysis and slowed down the development of ethology" and "So far, deep learning pose estimation has not achieved the reliability of classical kinematic gait analysis" without specifying which classical gait analysis is being referred to. Certainly, existing tools like DeepLabCut and SLEAP are already widely cited and used for research.

      In this revision, we have carefully reviewed the entire manuscript and addressed the instances of seemingly odd and unsubstantiated claims. Specifically, we have revised the statements "largely limited" to "limited" to ensure accuracy and clarity. Additionally, we thoroughly reviewed the citation list to ensure proper attribution, incorporating references such as "A deep learning-based toolbox for Automated Limb Motion Analysis (ALMA) in murine models of neurological disorders" to better substantiate our claims and provide a clearer context.

      We have also added an additional section to comprehensively discuss the applications of widely-used tools like DeepLabCut and SLEAP in behavioral research. This new section elaborates on the challenges and limitations researchers encounter when applying these methods, highlighting both their significant contributions and the areas where improvements are still needed.

      The other main weakness in the paper is the validation of the multi-animal pose estimation. The core point of the paper is pose estimation and anti-drift performance and yet there is no validation of either of these things relating to multi-animal video. All that is quantified is the ability to track individual identity with a relatively limited dataset of 10 mice IDs with only two in the same arena (and see note about train and validation splits below). While individual tracking is an important task, that literature is not engaged with (i.e. papers like Walter and Couzin, eLife, 2021: https://doi.org/10.7554/eLife.64000) and the results in this paper aren't novel compared to that field's state of the art. On the other hand, while multi-animal pose estimation is also an important problem the paper doesn't engage with those results either. The two methods already used for comparison in the paper, SLEAP and DeepPoseKit, already have multi-animal models and multi-animal annotated datasets but none of that is tested or engaged with in the paper. The paper notes many existing approaches are two-step methods, but, for practitioners, the difference is not enough to warrant a lack of comparison.

      We appreciate the reviewer's insights regarding the validation of multi-animal pose estimation in our paper. While our primary focus has been on pose estimation and anti-drift performance, we recognize the importance of validating these aspects within the context of multi-animal videos.

      In this revision, we have included a comparison of ADPT's anti-drift performance in multi-animal pose estimation, utilizing our custom Homecage social mouse dataset (Figure 1A). Our findings indicate that ADPT achieves more accurate pose estimation for two mice while significantly reducing keypoint drift, outperforming both DeepLabCut and SLEAP. (see lines 311-322). We trained each model three times, and this figure presents the results from one of those training sessions. We calculated the average RMSE between predictions and manual labels, demonstrating that ADPT achieved an average RMSE of 15.8 ± 0.59 pixels, while DeepLabCut (DLC) and SLEAP recorded RMSEs of 113.19 ± 42.75 pixels and 94.76 ± 1.95 pixels, respectively (Figure 1C). ADPT achieved an accuracy of 6.35 ± 0.14 pixels based on the DLC evaluation metric across all body parts of the mice, while DLC reached 7.49 ± 0.2 pixels (Figure 1D). ADPT achieved 8.33 ± 0.19 pixels using the SLEAP evaluation Metric across all body parts of the mice, compared to SLEAP’s 9.82 ± 0.57 pixels (Figure 1E).

      Furthermore, we have conducted pose estimation accuracy evaluations on the publicly available marmoset dataset from DeepLabCut, where ADPT also demonstrated superior performance compared to DeepLabCut and SLEAP. These results can be found in the "ADPT can be adapted for end-to-end pose estimation and identification of freely social animals" section of the Results. (see lines 323-329)

      We acknowledge the existing literature on multi-animal tracking, such as the work by Walter and Couzin (2021). While individual tracking is crucial, our primary focus lies in the effective tracking of animal poses and minimizing drift during this process. This dual emphasis on pose tracking and anti-drift performance distinguishes our work and aligns with ongoing advancements in the field. Engaging with relevant literature, highlights the importance of contextualizing our results within the broader tracking literature, demonstrating that while our findings may overlap with existing methods, the unique focus on improving tracking stability and reducing drift presents valuable contributions to the field. Thank you for your valuable feedback, which has helped us improve the robustness of our manuscript.

      The authors state that "The evaluation of our social tracking capability was performed by visualizing the predicted video data (see supplement Videos 3 and 4)." While the authors report success maintaining mouse ID, when one actually watches the key points in the video of the two mice (only a single minute was used for validation) the pose estimation is relatively poor with tails rarely being detected and many pose issues when the mice get close to each other.

      We acknowledge that there are indeed challenges in pose estimation, particularly when the two mice get close to each other, leading to tracking failures and infrequent detection of tails in the predicted videos. The reasons for these issues can be summarized as follows:

      Lack of Training Data from Real Social Scenarios: The training data used for the social tracking assessment were primarily derived from the Mix-up Social Animal Dataset, which does not fully capture the complexities of real social interactions. In future work, we plan to incorporate a blend of real social data and the Mix-up data for model training. Specifically, we aim to annotate images where two animals are in close proximity or interacting to enhance the model's understanding of genuine social behaviors.

      Challenges in Tail Tracking in Social Contexts: Tracking the tails of mice in social situations remains a significant challenge. To validate this, we have added an assessment of tracking performance in real social settings using homecage data. Our findings indicate that using annotated data from real environments significantly improves tail tracking accuracy, as demonstrated in the supplementary video.

      We appreciate your feedback, which highlights critical areas for improvement in our model.

      Finally, particularly in the methods section, there were a number of places where what was actually done wasn't clear.

      We have carefully reviewed and revised the corresponding parts to clarify the previously incomprehensible statements. Thank you for your valuable feedback, which has helped enhance the clarity of our methods.

      For example in describing the network architecture, the authors say "Subsequently, network separately process these features in three branches, compute features at scale of one-fourth, one-eight and one-sixteenth, and generate one-eight scale features using convolution layer or deconvolution layer." Does only the one-eight branch have deconvolution or do the other branches also?

      We apologize for the confusion this has caused. Upon reviewing our manuscript, we identified an error in the diagram. In the revised version, we have clarified that the model samples feature maps at multiple resolutions and ultimately integrates them at the 1/8 resolution for feature fusion. Specifically, the 1/4 feature map from ResNet50's stack 2 is processed through max-pooling and convolution to generate a 1/8 feature map. Additionally, the 1/4 feature map from ResNet50's stack 2 is also transformed into a 1/8 feature map using a convolution operation with a stride of 2. Finally, both the input and output of the transformer are at the 1/16 resolution, which can be trained on a 2080Ti GPU. The 1/16 feature map is then upsampled to produce the final 1/8 feature map. We have updated the manuscript to reflect these changes, and we also modified the model architecture diagram for better clarity.

      Similarly, for the speed test, the authors say "Here we evaluate the inference speed of ADPT. We compared it with DeepLabCut and SLEAP on mouse videos at 1288 x 964 resolution", but in the methods section they say "The image inputs of ADPT were resized to a size that can be trained on the computer. For mouse images, it was reduced to half of the original size." Were different image sizes used for training and validation? Or Did ADPT not use 1288 x 964 resolution images as input which would obviously have major implications for the speed comparison?

      For our inference speed evaluation, all models, including ADPT, used images with a resolution of 1288 x 964. In ADPT's processing pipeline, the first layer is a resizing layer designed to compress the images to a scale determined by the global scale parameter. For the mouse images, we set the global scale to 0.5, allowing our GPU to handle the data at that resolution during transformer training.

      We recorded the time taken by ADPT to process the entire 15-minute mouse video, which included the time taken for the resizing operation, and subsequently calculated the frames per second (FPS). We have clarified this process in the manuscript, particularly in the "Network Architecture" section, where we specify: "Initially, ADPT will resize the images to a390 scale (a hyperparameter, consistent with the global scale in the DLC configuration)."

      Similarly, for the individual ID experiments, the authors say "In this experiment, we used videos featuring different identified mice, allocating 80% of the data for model training and the remaining 20% for accuracy validation." Were frames from each video randomly assigned to the training or validation sets? Frames from the same video are very correlated (two frames could be just 1/30th of a second different from each other), and so if training and validation frames are interspersed with each other validation performance doesn't indicate much about performance on more realistic use cases (i.e. using models trained during the first part of an experiment to maintain ids throughout the rest of it.)

      In our study, we actually utilized the first 80% of frames from each video for model training and the remaining 20% for testing the model's ID tracking accuracy. We have revised the relevant description in the manuscript to clarify this process. The updated description can be found in the "Datasets" section under "Mouse Videos of Different Individuals."

    1. Author response:

      The following is the authors’ response to the original reviews.

      Public Reviews:

      Reviewer #1 (Public review):

      Summary:

      This study aims to uncover molecular and structural details underlying the broad substrate specificity of glycosaminoglycan lyases belonging to a specific family (PL35). They determined the crystal structures of two such enzymes, conducted in vitro enzyme activity assays, and a thorough structure-guided mutagenesis campaign to interrogate the role of specific residues. They made progress towards achieving their aims but I see significant holes in data that need to be determined and in the authors' analyses.

      Impact on the field:

      I expect this work will have a limited impact on the field, although, with additional experimental work and better analysis, this paper will be able to stand on its own as a solid piece of structure-function analysis.

      Strengths:

      The major strengths of the study were the combination of structure and enzyme activity assays, comprehensive structural analysis, as well as a thorough structure-guided mutagenesis campaign.

      Weaknesses:

      There were several weaknesses, particularly:

      (1) The authors claim to have done an ICP-MS experiment to show Mn2+ binds to their enzyme but did not present the data. The authors could have used the anomalous scattering properties of Mn2+ at the synchrotron to determine the presence and location of this cation (i.e. fluorescence spectra, and/or anomalous data collection at the Mn2+ absorption peak).

      Thank you for your kind comment and suggestion. Many studies utilized ICP-MS for the detection of metal ions within proteins (doi: 10.1016/j.jbc.2023.103047; doi: 10.1074/jbc.RA119.011790), so we utilized this method to determine the type of atoms within GAGases. In the revised manuscript, the data of ICP-MS experiment has been presented in “Supplemental Table S1”

      (2) The authors have an over-reliance on molecular docking for understanding the position of substrates bound to the enzyme. The docking analysis performed was cursory at best; Autodock Vina is a fine program but more rigorous software could have been chosen, as well we molecular dynamics simulations. As well the authors do not use any substrate/product-bound structures from the broader PL enzyme family to guide the placement of the substrates in the GAGases, and interpret the molecular docking models.

      Thank you for your kind comments. The interaction between the enzyme and ligand should be confirmed by resolving the structure of enzyme-ligand complex. Unfortunately, we tried to prepare the co-crystals of GAGases with various oligosaccharide substrates but ultimately failed. Thus, we tried to use docking to explain the catalytic mechanism of polysaccharide lyases using Autodock Vina although this method may be questionable. In the revised manuscript, we predicted the substrate binding site of GAGase II using Caver Web 1.2 and performed molecular docking near the substrate binding site simultaneously using Molecular Operating Environment (MOE) to verify the accuracy of the docking results (Figure 6, Supplemental Figure S4). In addition, a series of enzyme-substrate complex structures of identified PL family enzymes with structural similarities to the GAGases are showed in Supplemental Figure S2, and the positions of the catalytic cavities and the substrate binding modes are similar to those of the molecular docking results, which may also corroborate the referability of our molecular docking results in another aspect.

      (3) The conclusion that the structures of GAGase II and VII are most similar to the structures of alginate lyases (Table 2 data), and the authors' reliance on DALI, are both questioned. DALI uses a global alignment algorithm, which when used for multi-domain enzymes such as these tends to result in sub-optimal alignment of active site residues, particularly if the active site is formed between the two domains as is the case here. The authors should evaluate local alignment methods focused on the optimization of the superposition of a single domain; these methods may result in a more appropriate alignment of the active site residues and different alignment statistics. This may influence the overall conclusion of the evolutionary history of these PL35 enzymes.

      Thank you for your kind question. As your suggestion, multiple structural alignment assays were carried out for the (α/α)<sub>n</sub> toroid and the antiparallel β-sheet domain, respectively, based on the structures of GAGs/alginate lyases from PL5, PL8, PL12, PL15, PL17, PL21, PL23, PL36, PL38 and PL39 families. The results showed that the overall structure of GAGases is more similarity to that of PL15, PL17 and PL39 family alginate lyases, which have an (α/α)<sub>6</sub> toroid and an antiparallel β-sheet domain (Table 3). In terms of the toroid and antiparallel β-sheet domains, most of them have an (α/α)<sub>6</sub> toroid and an antiparallel β-sheet as shown in Table 3. We also noticed that GAGases possess such a (α/α)<sub>6</sub> toroid structure rather than a (α/α)<sub>7</sub> toroid structure, and revised the relevant statement in the manuscript.

      (4) The data on the GAGase III residue His188 is not well interpreted; substitution of this residue clearly impacts HA and HS hydrolysis as well. The data on the impact on alginate hydrolysis is weak, which could be due to the fact that the WT enzyme has poor activity against alginate to start with.

      Thank you very much for your helpful comments and questions. To verify your suggestion that the weak impact of alginate hydrolysis could be due to poor activity of wild type GAGase III, we degraded alginate using different enzyme concentrations (3 to 30 μg) and analyzed the degradation products. The results showed that the alginate-degrading activity of GAGase III-H188A and GAGase III-H188N was abolished, even at a quite high ratio of the mutated enzyme to substrate such as 30 μg enzyme to 30 μg substrate (Supplemental Figure S3A), while their GAG-degrading activity was only partially affected, indicating that this residue plays a more important role for the digestion of alginate than other substrates. Unfortunately, we were unable to confer the ability to GAGase III through the mutation of N191H in GAGase II. Therefore, we suggest that His<sup>188</sup> play a key role in the specificity of alginate degradation by GAGase III, but that other determinants also contribute to this process. We will try more methods to obtain the structure of enzyme-substrate co-crystals and explain its substrate-selective mechanism in future studies.

      (5) The authors did not use the words "homology", "homologous", or "homolog" correctly (these terms mean the subjects have a known evolutionary relationship, which may or may not be known in the contexts the authors used these targets); the words "similarity" and "similar" are recommended to be used instead.

      Thank you for your helpful suggestions. We have revised the relevant part of the description in the manuscript.

      (6) The authors discuss a "shorter" cavity in GAGases, which does not make sense and is not supported by any figure or analysis. I recommend a figure with a surface representation of the various enzymes of interest, with dimensions of the cavity labeled (as a supplemental figure). The authors also do not specifically define what subsites are in the context of this family of enzymes, nor do they specifically label or indicate the location of the subsites on the figures of the GAGase II and IV enzyme structures.

      Thank you for your helpful suggestions. Figures (Supplemental Figure S2) with surface representations of the GAGase II and some structurally similar GAGs/alginate lyases with the dimensions of the cavity labeled, were added to the supplementary data as you suggested. Considering the correlation between enzyme specificity and substrate binding sites, we speculated that a shorter substrate binding cavity might allow the enzyme to accommodate a wider variety of substrates, resulting in a smaller restriction of the catalytic cavity to substrate binding, although this speculation needs to be verified by the resolution of the crystal structure of the enzyme-substrate complexes.

      Reviewer #2 (Public review):

      Summary:

      Wei et al. present the X-ray crystallographic structures of two PL35 family glycosaminoglycan (GAG) lyases that display a broad substrate specificity. The structural data show that there is a high degree of structural homology between these enzymes and GAGases that have previously been structurally characterized. Central to this are the N-terminal (α/α)7 toroid domain and the C-terminal two-layered β-sheet domain. Structural alignment of these novel PL35 lyases with previously deposited structures shows a highly conserved triplet of residues at the heart of the active sites. Docking studies identified potentially important residues for substrate binding and turnover, and subsequent site-directed mutagenesis paired with enzymatic assays confirmed the importance of many of these residues. A third PL35 GAGase that is able to turn over alginate was not crystallized, but a predicted model showed a conserved active site Asn was mutated to a His, which could potentially explain its ability to act on alginate. Mutation of the His into either Ala or Asn abrogated its activity on alginate, providing supporting evidence for the importance of the His. Finally, a catalytic mechanism is proposed for the activity of the PL35 lyases. Overall, the authors used an appropriate set of methods to investigate their claims, and the data largely support their conclusions. These results will likely provide a platform for further studies into the broad substrate specificity of PL35 lyases, as well as for studies into the evolutionary origins of these unique enzymes

      Strengths:

      The crystallographic data are of very high quality, and the use of modern structural prediction tools to allow for comparison of GAGase III to GAGase II/GAGase VII was nice to see. The authors were comprehensive in their comparison of the PL35 lyases to those in other families. The use of molecular docking to identify key residues and the use of site-directed mutagenesis to investigate substrate specificity was good, especially going the extra distance to mutate the conserved Asn to His in GAGase II and GAGase VII.

      Weaknesses:

      The structural models simply are not complete. A cursory look at the electron density and the models show that there are many positive density peaks that have not had anything modelled into them. The electron density also does not support the placement of a Mn2+ in the model. The authors indicate that ICP-MS was done to identify the metal, but no ICP-MS data is presented in the main text or supplementary. I believe the authors put too much emphasis on the possibility of GAGase III representing an evolutionary intermediate between GAG lyases and alginate lyases based on a single Asn to His mutation in the active site, and I don't believe that enough time was spent discussing how this "more open and shorter" catalytic cavity would necessarily mean that the enzyme could accommodate a broader set of substrates. Finally, the proposed mechanism does not bring the enzyme back to its starting state.

      Recommendations for the authors:

      Reviewer #1 (Recommendations for the authors):

      Minor points:

      (1) The number of significant digits used in Table 1 and Figure 3 legend are not justified. The authors should use a maximum of 2 significant digits.

      Thank you for your kind suggestion. We have verified the relevant data and retained two significant digits.

      (2) The authors should use the words "mutant" or "mutation" only when discussing DNA, but when discussing protein, the words "variant" and "substitution" should be used instead as these are more appropriate.

      Thank you for your helpful suggestions. We have revised the relevant description in the manuscript as you suggested.

      (3) Lines 102-110 are a long, run-on sentence that should be split into shorter sentences. Similarly, lines 367-378 should be split into shorter sentences.

      Thank you for your suggestions. In the revised manuscript, the long sentences in lines 102-110 and 367-378 have been rewritten into shorter ones.

      (4) Lines 174-175: His, Tyr, Glu, and Trp are not positively charged residues and this wording should be changed.

      Thank you for your suggestions. We have revised the relevant description in the manuscript as you suggested.

      (5) Lines 423-426 require a reference.

      Thank you for your suggestion. We have provided the reference at the right position and revised the relevant description in the manuscript as you suggested.

      (6) Grammar/language:

      -line 90 - change "should emerge" to "likely emerged"

      -line 145 - delete "Finally"

      -line 264 - delete "their"

      -line 265 - delete "active sites"

      -line 265-266 - change to "To confirm this hypothesis, site-directed mutagenesis followed by enzyme activity assay was performed"

      -line 311 - change "residue in the catalytic cavity of GAGase III, which.." to "residue in its catalytic cavity, which..."

      -line 318 - change "affect" to "affected"

      -line 323 - change to "degrading activity of GAGase II remains to be determined outside of the His188 residue"

      -line 345 - delete "assays"

      -line 359 - change to "evidence"

      -line 397 - change "folds" to "3D fold"

      -line 420 - change to "share similar catalytic sites"

      -lines 411, 433 - change "conversed" to "conserved"

      -line 441 - change to "Mutational analysis showed that the His188.."

      -line 450 - delete "which"

      Thank you for your suggestions. Grammatical errors in the revised manuscript have been corrected in the revised manuscript.

      Reviewer #2 (Recommendations for the authors):

      Major Concerns

      The electron density in your model clearly does not support the placement of a Mn ion. In the GAGase II structure, the placement of the Mn and the placement of waters around it still results in two density peaks of > 12 rmsd. The manuscript suggests that ICP-MS was done but the results of this are not shown anywhere. Please include your ICP-MS data. I see the structures have already been deposited, and if they have been deposited unchanged, please see if you can modify them to actually finish building the models. I don't find your data in Figure 2B particularly convincing that Mn is necessarily important for activity.

      Thank you for your kind comments. As we known, ICP-MS is a common method used for the detection of metal ions within proteins (doi: 10.1016/j.jbc.2023.103047; doi: 10.1074/jbc.RA119.011790), and thus we utilized it to determine the type of atoms within GAGases in this study. In the revised manuscript, the data of ICP-MS experiment has been presented in “Supplemental Table S1”, and the data clearly showed that the content of Mn<sup>2+</sup> rather than others in test sample is much higher than that in the negative control, suggesting the involvement of Mn<sup>2+</sup> in the protein. We agree that the addition of Mn<sup>2+</sup> does not show very strong promotion to the activity of GAGase II just like other tested metal ions, but the addition of EDTA significantly inhibited the enzyme activity (Figure 2), indicating that metal ion such as Mn<sup>2+</sup> is necessary for the function of GAGases. Regarding the role of metal ion, whether it participates in the catalytic reaction or only stabilize the structure of enzyme remains to be further explored in our further study.

      Minor Concerns

      (1) Please include CC1/2 in your Table 1.

      Thank you for your kind suggestions. CC1/2 parameters have been added in the revised manuscript (Table 1).

      (2) If possible please include SDS-PAGE gel images of your purified proteins. Particularly for the point mutations. Ideally, you would have done SEC on your mutants to show that the reduction in activity is not due to aggregation/misfolding, but at the very least I would to see that you have similar levels of purity.

      Thank you for your kind suggestions. As your suggestion, we have added SDS-PAGE gel images of purified GAGase II, GAGase III, GAGase VII, and their mutant enzymes to the supplementary data. As shown in Figure S5, site-directed mutagenesis did not affect the soluble expression levels of GAGase II, GAGase III or GAGase VII, indicating that the reduction in activity is not due to aggregation or misfolding. Due to the large number of variants, we used crude enzyme for the activity assay of substrate binding sites, while for some catalytic key residues, we purified the corresponding mutant enzymes and then verified their activities by HPLC.

      (3) When referring to your structural predictions, it is not appropriate to say that you used Robetta. Your reference is correct though - you should say that the structures were predicted using RoseTTAfold.

      Thank you for your helpful suggestions. We have revised the relevant description in the manuscript.

      (4) If possible expand on how the shorter/more open active site cavity would result in broader substrate specificity.

      Thank you for your kind comment. In the revised manuscript, figures (Supplemental Figure S2) with surface representations of the GAGase II and some representatively structurally similar GAGs/alginate lyases, with the dimensions of the cavity labeled, were added to the supplementary data. Considering the correlation between enzyme specificity and substrate binding sites, we speculated that a shorter substrate binding cavity might allow the enzyme to accommodate a wider variety of substrates, resulting in a smaller restriction of the catalytic cavity to substrate binding. However, unfortunately, we did not succeed in obtaining co-crystals of GAGases with any of the substrates. We will try to explain the mechanism of substrate selectivity in future studies by culturing and resolving crystals of its enzyme substrate complex or otherwise.

      (5) I would put less emphasis on His188 in GAGase III being a strong indicator that this protein represents an evolutionary intermediate between alginate lyases and GAGases.

      Thank you for your comment. The His<sup>188</sup> residue, which is unique compared to other GAGases, is essential for the alginate-degrading activity of GAGase III. Regarding why GAGases are thought to represent a possible evolutionary intermediate between alginate lyases and GAG lyases, phylogenetic analysis demonstrated that GAGases show considerable homology with some identified GAG lyases and alginate lyases (DOI: 10.1016/j.jbc.2024.107466). The similarity in primary structure between some GAG lyases, alginate lyases, and GAGases suggests structural similarities, which are further supported by this study. As structure determines function, structural similarity is often used as a key criterion when studying the evolution of proteins, the GAGase III, which shows significant GAGs and alginate-degrading activity, support for this speculation. Of course, in this study, our analysis of the evolutionary relationship between GAGases and identified GAG lyases and alginate lyases, based on structural comparison, is an attempt using existing methods. The conclusions we have drawn remain a hypothesis that still requires further evidence to support and validate.

    1. Author response:

      The following is the authors’ response to the original reviews.

      Public Reviews:

      Reviewer #1 (Public review):

      The manuscript under review investigates the role of periosteal stem cells (P-SSC) in bone marrow regeneration using a whole-bone subcutaneous transplantation model. While the model is somewhat artificial, the findings were interesting, suggesting the migration of periosteal stem cells into the bone marrow and their potential to become bone marrow stromal cells. This indicates a significant plasticity of P-SSC consistent with previous reports using fracture models (Cell Stem Cell 29:1547, Dev Cell 59:1192).

      Major Concerns

      (1) The authors assert that the periosteal layer was completely removed in their model, which is crucial for their conclusions. To substantiate this claim, it is recommended that the authors provide evidence of the successful removal of the entire periosteal stem cell (P-SSC) population. A colony-forming assay, with and without periosteal removal, could serve as a suitable method to demonstrate this.

      We are grateful to the reviewer for this valuable suggestion. The objective of this experiment was to demonstrate that periosteal ablation impairs bone marrow regeneration, a finding that is supported by our results. We expect that ablation of the periosteum would be associated with only a partial decrease in CFU-F activity, given the presence of MSCs in the bone and in the endosteal region of the bone marrow. Therefore, CFU-F assays would be difficult to interpret in this setting. In view of the phenotype obtained, providing proof of concept of the importance of the periosteum, we do not believe that further experiments would strengthen the level of proof of this experiment.

      (2) The observation that P-SSCs do not express Kitl or Cxcl12, while their bone marrow stromal cell (BM-MSC) derivatives do, is a key finding. To strengthen this conclusion, the authors are encouraged to repeat the experiment using Cxcl12 or Scf reporter alleles. Immunofluorescence staining that confirms the migration of periosteal cells and their transformation into Cxcl12- or Scf-reporter-positive cells would significantly enhance the paper's key conclusion.

      Transplantation of periosteum isolated from Cxcl12 or Scf into WT bones is an excellent suggestion. Indeed, this experiment would confirm (1) the migration of periosteal SSC and (2) the expression of Cxcl12 and Scf by BM-MSCs derived from the periosteum .However, it should be noted that the current limitations in terms of available resources preclude the execution of these experiments. Moreover, the use of the PostnCre<sup>ER</sup>;Tmt mice represent the optimal approach for tracking and specifically isolating BM-MSCs derived from the periosteum. The expression of Cxcl12 and Scf by BM-MSCs derived from the periosteum has been demonstrated in 2 distinct experimental models (Figures 5 and 6).

      (3) On page 8, line 20, the authors' statement regarding the detection of Periostin+ cells outside the periosteum layer could be misinterpreted due to the use of the periostin antibody. Given that periostin is an extracellular matrix protein, the staining may not accurately represent Periostin-expressing cells but rather the presence of periostin in the extracellular matrix. The authors should revise this section for greater precision.

      We acknowledge and appreciate the reviewer's attention to detail. This is, in fact, an error. Nestin-GFP positive periosteal SSC are seen within the periosteum marked by an anti-periostin antibody labeling the extracellular matrix of the periosteum. The manuscript has been revised to address this inaccuracy on page 9, lines 8-9.

      Reviewer #2 (Public review):

      Summary:

      The authors have established a femur graft model that allows the study of hematopoietic regeneration following transplantation. They have extensively characterized this model, demonstrating the loss of hematopoietic cells from the donor femur following transplantation, with recovery of hematopoiesis from recipient cells. They also show evidence that BM MSCs present in the graft following transplantation are graft-derived. They have utilized this model to show that following transplantation, periosteal cells respond by first expanding, then giving rise to more periosteal SSCs, and then migrating into the marrow to give rise to BM MSCs.

      Strengths:

      These studies are notable in several ways:

      (1) Establishment of a novel femur graft model for the study of hematopoiesis;

      (2) Use of lineage tracing and surgery models to demonstrate that periosteal cells can give rise to BM MSCs.

      We thank the reviewer for noting the novelty of our manuscript.

      Weaknesses:

      There are a few weaknesses. First, the authors do not definitively demonstrate the requirement of periosteal SSC movement into the BM cavity for hematopoietic recovery. Hematopoiesis recovers significantly before 5 months, even before significant P-SSC movement has been shown, and hematopoiesis recovers significantly even when periosteum has been stripped.

      This is an important point. Notably, we can see expansion of P-SSCs by day 8 after femur transplantation and evidence of periosteum-derived SSCs in the bone marrow by day 15, before we can detect any significant hematopoietic recovery (see Figure 3A-C).

      Second, it is not clear how the periosteum is changing in the grafts. Which cells are expanding is unclear, and it is not clear if these cells have already adopted a more MSC-like phenotype prior to entering the marrow space.

      This is an interesting question. To examine early changes in gene expression in periosteal SSCs in grafted femurs, we performed additional RNA sequencing on host periosteal SSCs vs periosteal SSCs from grafted femurs at an earlier time point - at 3 days after femur transplantation and on host bone marrow MSCs (see new Supplementary Figure S5 A-C). At this time point the three cell populations are already distinct on the PCA plot (Figure S5A), and there is downregulation of some periosteal genes in the graft P-SSCs (Figure S5B). However, we do not yet see upregulation of Kitl or Cxcl12 or most other BM MSC genes in graft P-SSCs at this time point (Figure S5B). Furthermore, gene set enrichment analysis (GSEA) revealed upregulation of cell cycle, DNA replication and mismatch repair gene signatures, and downregulation of multiple gene signatures compared to host P-SSCs (Figure S5C). Therefore, we conclude that P-SSCs already adopt some gene expression changes early after femur transplantation, but have not yet fully differentiated into BM MSCs at this early time point. This experiment is now discussed on p.10 of the revised manuscript.

      Indeed, given the presence of host-derived endothelial cells in the BM, these studies are reminiscent of prior studies from this group and others that re-endothelialization of the marrow may be much more important for determining hematopoietic regeneration, rather than the P-SSC migration.

      Indeed, as previously shown by our group and others, we agree that endothelial regeneration and re-endothelialization may also play an important role in this bone marrow regeneration model. It is noteworthy that this model has the potential to serve as a valuable tool for analyzing the origin of BM endothelial cells during regeneration processes. To further illustrate the endothelial regeneration, additional images of bone sections from VE-cadherin-cre;TdTomato grafted femurs at 15 days, one month, and five months post-transplantation have been included in the new Figure S3. These images reveal extensive vascularization of the graft and proximity of UBC-GFP+ donor-derived vessels to VE-cadherin+ host-derived blood vessels in the bone marrow within one month (see Figure S2C). This observation is consistent with the timing of both BM MSC recovery and HSC recovery in the grafts, thereby suggesting the importance of endothelial recovery (see Fig. 1B). A new discussion of these findings has been included on page 6 of the revised manuscript and on page 16 in the discussion section.

      Third, the studies exploring the preferential depletion of BM MSCs vs P-SSCs are difficult to interpret. The single metabolic stress condition chosen was not well-justified, and the use of purified cell populations to study response to stress ex vivo may have introduced artifacts into the system.

      We chose to focus on hypoxia as the main condition in which to analyze the stress response of P-SSCs vs BM MSCs because we reasoned that due to the location of P-SSCs on the outside of the bone, these cells would be exposed to a higher oxygen tension than BM-MSCs, which are located within the bone marrow. Therefore, we wanted to determine whether this exposure to a different oxygen tension would be sufficient to explain the different properties of P-SSCs and BM MSCs. We modified the text on p.11 of the manuscript to explain the rationale for this experiment better.

      Reviewer #3 (Public review):

      Summary:

      Marchand, Akinnola, et al. describe the use of the novel model to study BM regeneration. Here, they harvest intact femurs and subcutaneously graft them into recipient mice. Similar to standard BM regeneration models, there is a rapid decrease in cellularity followed by a gradual recovery over 5 months within the grafts. At 5 months, these grafts have robust HSC activity, similar to HSCs isolated from the host femur. They find that periosteum skeletal stem cells (p-SSCs) are the primary source of BM-MSCs within the grafted femur and that these cells are more resistant to the acute stress of grafting the femur.

      Strengths:

      This is an interesting manuscript that describes a novel model to study BM regeneration. The model has tremendous promise.

      We thank the reviewer for highlighting the novelty and potential of our work.

      Weaknesses:

      The authors claim that grafting intact femurs subcutaneously is a model of BM regeneration and can be used as a replacement for gold standard BM regeneration assays such as sublethal chemo/irradiation. However, there isn't enough explanation as to how this model is equivalent or superior to the traditional models. For instance, the authors claim that this model allows for the study of "BM regeneration in vivo in response to acute injury using genetic tools." This can and has been done numerous times with established, physiologically relevant BM regeneration models. The onus is on the authors to discuss or perform the necessary experiments to justify the use of this model. For example, standard BM regeneration models involve systemic damage that is akin to therapies that require BM regeneration. How is studying the current model that provides only an acute injury more relevant and useful than other models? As it stands, it seems as if the authors could have done all the experiments demonstrating the importance of these p-SSCs in the traditional myelosuppressive BM regeneration models to be more physiologically relevant. Along these lines, the use of a standard BM regeneration model (e.g., sublethal chemo/irradiation) as a critical control is missing and should be included. Even if the control doesn't demonstrate that p-SSCs can contribute to the BM-MSC during regeneration, it will still be important because it could be the justification for using the described model to specifically study p-SSCs' regulation of BM regeneration.

      We appreciate the reviewer raising this important point. We never intended this femur transplantation model of bone marrow injury to replace more established models, such as chemotherapy or irradiation. In fact, we compared the effects of femur transplantation to localized bone irradiation on P-SSCs using our Periostin-Cre;Td-Tomato lineage tracing model. We found that irradiation does not induce the same migration of Tomato+ P-SSCs from the periosteum to the bone marrow cavity the way that femur transplantation, and cannot be used to demonstrate the plasticity of P-SSCs in the same way (see new Supplementary Figure S7D-E). Therefore, this appears to be a more severe form of bone marrow injury, and is not similar to other more established assays of bone marrow injury. We also added this discussion to the revised manuscript on p.14 and in the discussion section on p.17.

      The authors perform some analysis that suggests that grafting a whole femur mimics BM regeneration, but there are many experiments missing from the manuscript that will be necessary to support the use of this model. To demonstrate that this new model mimics current BM regeneration models, the authors need to perform a careful examination of the early kinetics of hematopoietic recovery post-transplant. Complete blood counts should be performed on the grafts, focusing on white blood cells (particularly neutrophils), red blood cells, platelets, all critical indicators of BM regeneration. This analysis should be done at early time points that include weekly analysis for a minimum of 28 days following the graft. Additionally, understanding how and when the vasculature recovers is critical. This is particularly important because it is well-established that if there is a delay in vascular recovery, there is a delay in hematopoietic recovery. As mentioned above, a standard BM regeneration model should be used as a control.

      We concur with the reviewer that hematopoietic recovery is a pivotal aspect of this model. We conducted a time-course analysis of bone marrow and HSC cellularity from day 0 to month 5 post-transplantation (Figure 1B). Furthermore, we evaluated the HSC capacities through bone marrow transplantation from grafted or host femurs (Figures 1D and 1E) and quantified the various hematopoietic cells in the graft after five months (Supplemental Figure 1). Furthermore, hematopoiesis occurring in the transplanted bone was comprehensively evaluated in another article, currently in revision and available in BioRxiv (Takeishi, S., Marchand, T., Koba, W. R., Borger, D. K., Xu, C., Guha, C., Bergman, A., Frenette, P. S., Gritsman, K., & Steidl, U. (2023). Haematopoietic stem cell numbers are not solely determined by niche availability. bioRxiv: the preprint server for biology, 2023.10.28.564559. https://doi.org/10.1101/2023.10.28.564559). We did not use another assay of bone marrow regeneration as a “control”, since we do not expect to see similar plasticity of periosteal SSCs in these models, such as with the localized irradiation model described in the new Figure S7D-E.

      We agree with the reviewer that endothelial recovery is also likely to be very important for hematopoietic recovery in this model, but this was not the focus of this manuscript. The process of endothelial recovery  is likely to be more complex than that of MSC recovery, as our findings indicate that the graft endothelium can arise from both the host and the graft femur (see Fig.2D). Consequently, further investigation into the mechanisms of endothelial recovery and its contribution to hematopoiesis in this experimental system will be an interesting focus of future work. We believe that this bone transplantation model represents a valuable tool for addressing questions regarding the origin and regeneration mechanisms of bone marrow endothelial cells.

      The contribution of donor and host cells to the BM regeneration of the graft is interesting. Particularly, the chimerism of the vasculature. One can assume that for the graft to undergo BM regeneration, there needs to be the delivery of nutrients into the graft via the vasculature. The chimerism of the vascular network suggests that host endothelial cells anastomose with the graft. Host mice should have their vascular system labeled with a dye such as dextran to determine if anastomosis has occurred. If not, the authors need to explain how this graft survives up to 5 months. If anastomosis does occur, then it is very surprising that the hematopoietic system of the graft is not a chimera because this would essentially be a parabiosis model. This needs to be explained.

      We have included additional images of bone sections from VE-cadherin-cre;tdTomato grafted femurs at 15 days, one month, and five months post transplantation in the new Figure S3. These images show extensive vascularization of the graft and proximity of UBC-GFP+ donor-derived vessels to VE-cadherin+ host-derived blood vessels in the bone marrow within one month, suggesting a potential anastomosis (Figure S2C). However, it is not surprising that hematopoiesis arises exclusively from the host, as we observed complete death of the hematopoietic cells and BM MSCs in the graft femur within the first 3 days of femur transplantation (see Figure S1A), and we do not see any significant hematopoietic recovery in the grafts until at least 2 months (see Fig.1B). Therefore, this is not similar to a parabiosis model, as confirmed by our chimerism studies shown in Figure 2D. In addition, these data are consistent with the results reported with the use of ossicles (doi:10.1038/nature09262; DOI 10.1016/j.cell.2007.08.025; doi:10.1038/nature07547).

      Most of the data presented for the resistance of p-SSCs to stress suggests DNA damage response. Do p-SSCs demonstrate a higher ability to resolve DNA damage? Do they accumulate less DNA damage? Staining for DNA damage foci or performing comet assays could be done to further define the mechanism of stress resistance properties of p-SSCs.

      This is an interesting question. In our RNA sequencing analysis of graft P-SSCs compared with host P-SSCs we did observe an upregulation of mismatch repair gene signatures by gene set enrichment analysis (GSEA) (new Figure S5C). Therefore, it is possible that P-SSCs do have an altered DNA damage response. However, we are unable to investigate this further at this time.

      Given the importance of BM-MSCs in hematopoiesis and that the majority of the emerging BM-MSCs appear to be derived from p-SSCs, the authors should perform experiments to determine if p-SSC-derived BM-MSCs are critical regulators of BM regeneration. For example, the authors could test this by crossing the Postn-creER mice with iDTR mice to ablate these cells and see if recovery is inhibited or delayed. This should be done with the described periosteum-wrapped femur graft model as well as a control BM regeneration model. Demonstrating that the deletion of these cells affects BM regeneration in both models would further justify the physiological relevance and utility of the femur graft model.

      We thank the reviewer for this excellent suggestion, and we agree that this is an important experiment. However, our attempts to ablate Postn+ cells using the iDTA system were limited by technical difficulties, which we are unable to address at this time.

      Recommendations for the authors:

      Reviewer #1 (Recommendations for the authors):

      (1) In Figure 2C, the vascular network staining appears to be duplicated, suggesting a possible error in image capture. The authors should replace this image with a different field or an alternative picture to avoid confusion.

      We thank the reviewer for noting this accidental duplication due to an image stitching problem. Figure 2C was replaced by a different image from the same experiment.

      (2) For consistency and clarity, a scale bar should be included in Figure S3E to indicate that the magnification factors of the respective visual fields are identical.

      We thank the reviewer for highlighting this point. The magnification used has been added in the revised Figure.

      (3) In Figure S5B, the difference in normalized Opn mRNA expression relative to Gapdh between steady-state BM-MSCs and P-SSCs seems substantial, which contradicts the "ns" (not significant) label. The authors should verify the accuracy of this labeling.

      We agree with the reviewer that this difference in what is now Figure S6B looks substantial. However, we confirmed that this difference is not statistically significant, likely due to the high variability between replicates in Opn expression in the steady state BM MSCs.

      Reviewer #2 (Recommendations for the authors):

      In order to strengthen the argument that P-SSCs are necessary for hematopoietic recovery, the authors should consider providing the following data:

      (1) In the periosteal stripping experiments, the authors should show if periosteum-derived MSCs are present in the BM throughout the process of hematopoietic recovery (not just at the end of the experiment). If none are present at the end, that would mean that periosteum is not required for hematopoietic recovery, but would still suggest that it is required for optimal hematopoietic recovery. At early time points, it would also be very helpful to demonstrate the composition and amount of endothelium present in the marrow to determine if P-SSC migration and differentiation into MSCs depends on endothelial reconstitution.

      To further examine the vascularization of the transplanted femur at an earlier time point, we have added additional images of grafted femur from VE-cadherin-cre;tdTomato at 15 days and one month post transplantation in the new Figure S3A and S3B. These images already show extensive vascularization of the graft periosteum stained with an anti-periostin antibody. In addition, we observed anastomoses of host VE-cadherin;Tmt+ blood vessels with graft ubc-GFP+ blood vessels in the grafted periosteum within one month (Figure S3C).

      (2) Studies of the surgical periosteum grafts could benefit from histologic analysis of the BM and its MSC components at earlier time points following grafting since the data provided are only at 5 months. Such studies would allow a better appreciation of the relationship between P-SSC migration into the marrow and hematopoietic recovery.

      We have performed histologic analysis of grafted femurs at multiple early time points, which shows expansion of P-SSCs and their migration into the bone marrow cavity (Figure 3C).

      (3) Studies of stress responses preferably should be performed using intact bone and should characterize P-SSC and BM MSC apoptosis, cell cycle status, differentiation, etc, immediately following shifts to the stress conditions. These studies would be more compelling if performed using additional "stress" conditions likely to represent the graft environment.

      This is an interesting suggestion. However, these types of studies would not be possible in intact bones ex vivo, as P-SSCs are known to migrate out of the bone in culture.

    1. Author response:

      The following is the authors’ response to the original reviews.

      Reviewer #1 (Public review):

      Major comments:

      (1) In Figure 1 the authors could reference and use NSP8 (PMID: 38275298) and Nucleocapsid (PMID: 37185839) in their experiments as positive controls.

      Thank you for your suggestion! In Figure 1A, during our screening of SARS-CoV-2 nsp proteins regulated by MG132, we confirmed that nsp8 can also be restored by MG132. This finding indicates that nsp8 is degraded via the proteasome pathway and can therefore serve as a positive control for the experiment. It has been reported that nsp8 undergoes degradation via the ubiquitin-proteasome pathway following its ubiquitination mediated by TRIM22. We have added the description at line 115 in the manuscript.

      (2) The data indicating that NSP16 is ubiquitinated come from overexpression systems, and it is possible that NSP16 ubiquitination only occurs in expression contexts, not during coronavirus infection. If NSP16 ubiquitination can't be measured in the context of infection, it is unclear how we can make any conclusions. The authors need to demonstrate the ubiquitination of NSP16 in the context of viral infection.

      We greatly appreciate the reviewer's suggestion and have incorporated the corresponding experimental results. As shown in Figure 5A, co-IP experiments using an endogenous nsp16 antibody were conducted following infection with the SARS-CoV-2 Wuhan strain. These experiments confirmed that the nsp16 protein encoded by the virus undergoes ubiquitination in infected cells. This finding highlights the ubiquitination of nsp16 within a biological context, thereby supporting our conclusions in expression contexts.

      (3) In Figure 4, adding controls will strengthen the authors' conclusion.

      a) Is it possible to observe ubiquitination of NSP16 by transfecting in NSP16-FLAG tagged, immunoprecipitate NSP16, run a western blot, and probe for endogenous ubiquitin?

      b) Can the authors please include an empty vector control as well as WT ubiquitin in these panels for comparison?

      c) In addition, why are the Ubiquitination patterns different in the IP panels of D and E vs B?? Without an empty vector control, it is challenging to conclude what the background is.

      Thank you for your valuable suggestions! We have made the following changes and additions in response to your comments:

      a) We have conducted the experiments as per the reviewer's suggestion. Figure 3B shows the result. Co-IP experiments were performed, and endogenous ubiquitination of nsp16 was observed using the endogenous ubiquitin antibody.

      b) We apologize for previously focusing solely on presenting multiple ubiquitin mutants on a single panel of nsp16 IP without considering the inclusion of an empty vector control and WT ubiquitin. The experiment has been redesigned and conducted, and the results are now presented in Figures 3E and 3F.

      c) The differences in the ubiquitination patterns observed between the IP panels in Figures 3E and 3F compared to 3C may be due to varying plasmids, differences in antibody and depth of exposure. To address this, we have standardized the plasmids in the figure and included an empty vector control as a negative control to clarify the background signal.

      (4) Overexpression of the ubiquitin mutants may have an indirect effect on protein homeostasis. The authors can also utilize linkage-specific antibodies in their studies to elucidate the ubiquitin linkage associated with NSP16 ubiquitination. K63-linkage Specific Polyubiquitin (D7A11) Rabbit mAb, 5621S, and K48-linkage Specific Polyubiquitin (D9D5) Rabbit mAb, 8081S from Cell Signaling Technologies?

      We greatly appreciate the reviewer's excellent suggestion! Using linkage-specific antibodies to elucidate the ubiquitin linkage associated with nsp16 ubiquitination would indeed provide more direct evidence. However, due to the long lead time for obtaining these antibodies, we plan to conduct further verification in future experiments.

      (5) The authors discussed the subcellular localization of overexpressed NSP16- showing the localization of NSP16 in the context of viral infection would strengthen the study. If this is challenging, can the authors express NSP16 along with the co-factor NSP10 and examine its subcellular localization?

      Thank you for your suggestion! During viral infection, we observed the ubiquitination of the nsp16 protein through co-IP experiments, indicating that the presence of nsp10 does not influence the regulation of nsp16 ubiquitination by MARCHF7 or UBR5 (Figure 5A). Therefore, we believe that investigating the co-localization of nsp10 and nsp16 would not provide additional value to our results. Additionally, through a literature review, we found studies that have already examined the localization of nsp10 and nsp16 following viral infection. These studies revealed that nsp10 was located in the cytoplasm, while nsp16 can be detected in both the nucleus and cytoplasm (PMID: 33080218; PMID: 34452352). This observation is consistent with the localization of nsp16 that we observed in our overexpression experiments.

      (6) a) In Figure 3A, the authors should note that the interaction of NPS16 appears weak with UBR5. The authors should confirm that the interaction of NSP16 and the E3 ligases is relevant in the context of viral infection.

      b) In Figure 3B, the scale bars should be labeled in at least one panel, as well as in the legend.

      c) The authors discussed nuclear localization of MARCHF7, UBR5, and NSP16, therefore a control with a nuclear stain should be included in this figure to enhance the study.

      d) Some panels look overexposed while others are blurry which decreases the robustness of the interaction as the authors stated in line 191. To strengthen the results of Figure 3, consider GST purification and in vitro, cell-free binding assays to confirm a direct interaction between nsp16 and the E3 ligases

      Thank you for the reviewer’s thoughtful suggestions! We have made the following changes and adjustments based on your recommendations:

      a) On the interaction between nsp16 and UBR5:

      The interaction between nsp16 and UBR5 appears to be weak, possibly due to the large size of the UBR5 protein (300 kDa). As a result, there are challenges in presenting the experimental results, including difficulties in both expression and protein level detection. To further confirm the relevance of the interaction between nsp16 and the E3 ligases in the context of viral infection, we have performed experiments, and the results are presented in Figure 5A.

      b) On scale bars:

      The issue regarding the scale bars in Figure 4 has been addressed, and we have now included them in the figure legend for clarity (Line 885).

      c) On nuclear localization control:

      For the localization of MARCHF7, UBR5, and nsp16 in Figure 4C, given that both MARCHF7 and UBR5 are tagged with CFP, DAPI staining would result in spectral overlap. However, we conducted co-localization experiments for MARCHF7 or UBR5 with nsp16 in Figure 4—figure supplements 1E and 1F, where DAPI staining was included to illustrate the localization of these three proteins. Our experiments showed that while these proteins are present in both the nucleus and cytoplasm, they are predominantly localized in the cytoplasm.

      d) On validation of direct interaction:

      We attempted GST purification and in vitro cell-free binding assays to verify the direct interaction between nsp16 and the E3 ligases. However, UBR5 and MARCHF7 are both large proteins, with UBR5 being particularly large, which significantly increased the difficulty of purification. Additionally, we faced challenges in purifying nsp16, as the purified nsp16 protein tended to aggregate. We will continue to optimize purification techniques and conditions in future experiments.

      We appreciate your valuable comments, which have greatly contributed to improving our experiments and conclusions.

      .

      (7) To confirm the knockdown of the E3 ligases by siRNA, the authors should use western blotting to show the presence/absence/decrease of the protein levels in addition to mRNA levels by RT-PCR. The authors have the lysates, and they have shown that the antibodies for MARCHF7 and UBR5 work therefore including this throughout the manuscript to help substantiate the authors' conclusions.

      Thank you for the reviewer’s valuable suggestion! We have validated the knockdown efficiency at the protein level for the experiments involving siRNA knockdown. Corresponding Western blot images are now included in the relevant experiments to substantiate our conclusions, in addition to the RT-PCR data, including Figures 2, 4 and 5.

      (8) In the overexpression studies of the E3 ligases with viral infection in Figure 5, the authors should include the catalytic mutants for the E3 ligases with the nsp16 gradient experiment. This would strengthen the conclusion of the studies.

      Thank you for the reviewer’s suggestion! We have conducted the relevant experiments based on your recommendation, and the corresponding data are presented in the Figure 6—figure supplements 2A-H. These results strengthen the conclusions of our study.

      (9) Figure 5: For C and F, for a better comparison of the efficacy against the 2 strains, the authors should use the same scale. This could benefit from a kinetics experiment.

      Thank you for the reviewer’s suggestion! We have made revisions in Figures 5E and 5H in responses to your recommendation.

      (10) Is there a synergistic effect of double E3 knockdown on viral replication?

      Thank you for the reviewer’s question! In Figures 5—figure supplement 1A-B, we conducted experiments by individually and simultaneously knocking down MARCHF7 or UBR5, followed by infection with viral SARS-CoV-2 transmissible virus-like particles. The results revealed that simultaneous knockdown further enhances viral replication, demonstrating a synergistic effect.

      (11) In lines 98-100 the authors state "This dual targeting by MARCHF7 and UBR5 impairs the 2'-O-MTase activity of nsp16, blocking the conversion of cap-0 to cap-1 at the 5 'end of viral RNA, ultimately exhibiting potent antiviral activity against SARS-CoV-2". The authors did not examine the 2'-O-MTase activity of nsp16. The authors should rephrase this or provide the data if this experiment was done.

      Thank you for the reviewer’s valuable suggestion! Based on your comment, we have revised the ambiguous wording located in lines 100-104.

      (12) In the discussion, the authors reported that elucidating a specific lysine residue (s) that is ubiquitinated was challenging and stated that they generated multiple mutants including truncated mutants, and wrote "data not shown". The authors need to include this data as supplementary.

      Thank you for the reviewer’s suggestion! Based on your comment, we have included the data regarding the specific lysine residue(s) that is ubiquitinated, along with the truncated mutants, as supplementary data (Appendix-figure S2).

      (13) In Figure 7, the authors showed a copy number of SARS CoV-2 E in lung tissue. The authors should show viral titers using either the plaque assay or the TCID50 assay.

      Thank you for the reviewer’s suggestion! Based on your comment, we measured the TCID50 of the virus in the lung tissue homogenates, and the results are presented in Figure 7D.

      Minor comments:

      (1) Line 76: while many E3 ubiquitin ligases directly recognize and bind to their target substrates, cullin-RING ligases directly bind an adaptor, which binds a substrate receptor and/or the substrate directly, while the RING-box protein binds a different surface of the cullin and is also not directly interacting with substrate.

      Thank you for the reviewer’s valuable suggestion! Based on your comment, we have revised the ambiguous wording in line 76.

      (2) Line 161: having introduced the suggestion that NSP16 is ubiquitinated by these ligases, consider moving Figure 4 to the Figure 3 spot.

      Based on your comment, we have rearranged the order of the figures and moved Figure 4 to the Figure 3 spot.

      (3) Figure 2: Can the authors please do +/- MG132 for each siRNA? It is possible that the lanes where we don't see NSP16 were because there was no NSP16 expressed, OR it was degraded, MG132 would confirm one or the other.

      Thank you for the reviewer’s suggestion! Based on your comment, we have redesigned the experiment and included the MG132 treatment for each siRNA. The results are presented in Figure 2A.

      (4) Line 165: The authors write "As confirmed by MS, both Myc-tagged MARCHF7 and endogenous UBR5 interact with nsp16, as seen in the Co-IP experiment" should be the reverse, MS suggests NSP16-E3 interaction, the co-ip confirms this.

      Based on your comment, we have revised the wording in line 183 to ensure accuracy. MS suggests the interaction between nsp16 and the E3 ligases, while the Co-IP experiment confirms this interaction.

      (5) Line 178: the cited paper doesn't clearly show NSP16 nuclear localization, nor do the authors of said paper claim that they found it there. It is cytoplasmic. Additionally, said paper used overexpression, and it is unclear if NSP16 is nuclear in the context of viral infection.

      Thank you for the reviewer’s suggestion! The referenced paper states, "As can be seen in the Supplementary Fig. S2, the viral proteins are either cytoplasmic (NSP2, NSP3C, NSP4, NSP8, Spike, M, N, ORF3a, ORF3b, ORF6, ORF7a, ORF7b, ORF8, ORF9b, and ORF10) or both nuclear and cytoplasmic (NSP1, NSP3N, NSP5, NSP6, NSP7, NSP9, NSP10, NSP12, NSP13, NSP14, NSP15, NSP16, E, and ORF9a)," indicating that nsp16 is localized in both the nucleus and cytoplasm. Upon reviewing the literature, we found that the paper (PMID: 33080218) reports the distribution of nsp16 protein following viral infection. The results indicate that nsp16 is present in both the nucleus and cytoplasm, although the authors of the referenced paper claim that ns16 was located in the nucleus.

      (6) Line 197: in addition to the 7 lysine residues, ubiquitin can also form linear N-terminal linkages.

      Thank you for the reviewer’s suggestion! Linear N-terminal ubiquitination, with its distinct linkage and substrate recognition mechanism, is typically mediated by a complex consisting of the E3 ubiquitin ligases HOIL-1 and HOIP, and differs from classical ubiquitination. Therefore, this type of ubiquitin chain was not investigated in our experiments.

      (7) Line 202: Authors state "Interestingly, all single-lysine Ub mutants promoted nsp16 ubiquitylation to varying degrees, indicating a complex polyubiquitin chain structure on nsp16 potentially regulated by multiple E3 ligases". However, not all the mutants. K33 isn't supported by the blot.

      Thank you for pointing that out! Indeed, we made an error in our description. The K33 mutant did not promote nsp16 ubiquitylation, and we have corrected this in the manuscript accordingly in line 173.

      (8) Line 204: consider including "E2-E3 ligase pairs" for RING ligases the E2 determines the linkage type see: Cell Research (2016) 26:423-440.

      Thank you for your suggestion! We have included the term "E2-E3 ligase pairs" in the article in line 176.

      (9) Line 235: The authors used the real virus, the inclusion of the BLS2 virus here is extraneous, it doesn't add anything. The authors can consider removing it.

      Thank you for your suggestion! In our experiments, we performed simultaneous knockdown of two E3 ligases, so we believe this data is relevant and should not be removed.

      (10) Line 238: Authors state: "led to a significant increase in SARS-CoV-2 levels compared to the control group". What is meant by "levels?"

      Thank you for your careful reading. We have updated "levels" to "replication" as suggested to clarify the meaning in line 237.

      (11) Line 245: increased titers. This could be improved for specificity by saying, 1-log increase for example.

      Thank you for the reviewer's valuable suggestions. We have made the necessary changes and specified "increased titers" as a "1-log increase" in lines 249 and 261.

      (12) Line 249: in Figure 5H again, the authors are showing relative mRNA levels. Ideally should show protein levels by western blot.

      Thank you for the reviewer's suggestion! We have performed protein-level detection of the knockdown efficiency for the samples, and the bands have been placed in the corresponding positions in Figure 5I.

      (13) Line 259: "strongly linked to their ability to modulate..." This appears to be an overextension of the data. The data show nsp16 levels can compensate for E3 overexpression, but not that the E3 ligases are modulating this activity. We can infer this from previous experiments. Perhaps increasing the NSP12 levels would also have the same effect as they don't show that this is specific to NSP16. What about a catalytically dead E3?

      Thank you for the reviewer's thoughtful suggestion. We have revised the wording accordingly and designed the viral-related experiments with E3 enzyme activity mutants in Figure 6 supplement 2.

      (14) Figure 6: In panel H the MW for UBR5 is incorrect, should be around 300kDa.

      Thank you for the reviewer's detailed suggestions. We have made the necessary revisions in Figure 6H.

      (15) Line 267: "suggesting a more conserved sequence". What are the authors referring to? More conserved than what? This section would benefit from a discussion of which residues are mutated. Are they potential Ub sites, which could point to differential degradation by the E3s as due to more ubiquitination? Or rather to more efficient interaction with the E3? Is this conserved in related CoVs: original SARS and MERS, for instance?

      Thank you for the reviewer’s detailed suggestions. In this context, by “conservation,” we refer to the relative conservation of nsp16 proteins across different subtypes of the Omicron variant. We found that most of the mutation sites contained only 1 to 2 mutations. Additionally, we have constructed and validated multiple-mutant nsp16 proteins, which are still degraded by MARCHF7 or UBR5. Given the ongoing prevalence of the Omicron variant, we aim to explore the broad-spectrum degradation and antiviral effects of these two E3 ligases. While it would be ideal if these experiments could aid in identifying the ubiquitination sites, we have not yet identified any mutant forms that escape degradation. We also compared the nsp16 proteins of several other coronaviruses (such as human coronaviruses 229E, HKU1, MERS-CoV, NL63, OC43, and SARS-CoV-1), and found that these viruses' nsp16 proteins are not highly conserved. As a result, we have not further investigated whether MARCHF7 or UBR5 regulate the nsp16 proteins of these viruses.

      (16) Line 347: 2C of what virus?

      Thank you for the reviewer’s careful reading. We have made the necessary additions to address this point in line 357.

      (17) Line 890: "Scale bars, 25 mm". Should it be 25nm?

      Thank you for your feedback! I realized there was an error in the unit labeling, and I have corrected the relevant sections in line 904. I appreciate your careful reading.

      Reviewer #2 (Recommendations for the authors):

      (1) In Figure 6, the authors found that increasing amounts of nsp16 restored the replication of SARS-CoV-2 in the presence of MARCHF7 or UBR5. The authors better discuss the possibility that nsp16 may stimulate viral replication regardless of these E3 ligases, or provide evidence to further clarify this.

      Thank you for your thoughtful suggestion! Given the strong functionality of nsp16 itself, your consideration is very comprehensive. In Figure 6—figure supplement 2A–H, we conducted transfection experiments with E3 activity-deficient proteins and reintroduced nsp16. The results showed that, in the absence of active MARCHF7 or UBR5 antiviral function, overexpression of nsp16 did not promote viral replication, although the RNA levels of the M protein slightly increased. Therefore, in our experiments, excess nsp16 did not significantly stimulate viral replication.

      (2) In Figure 7, the in vivo data supports the function of both E3 ligases to reduce viral infectivity. Is it possible that tail vein injection of naked plasmid DNA may stimulate the innate immune system, e.g., induce IFN as a DNA vaccine, which may contribute to the inhibitory effect? The authors are suggested to discuss or address it.

      Upon reviewing the relevant literature, we found that the hydrodynamic gene delivery (HGD) method using naked DNA is both highly efficient and associated with a low risk of triggering immune responses or oncogenesis. Studies have shown that HGD only weakly activates host immunity (reference: 37111597), which is less of a concern compared to other gene delivery methods. Although some studies have reported strong immune responses following the injection of naked DNA (e.g., Otc cDNA) in human trials, it is noteworthy that no such responses were observed in 17 other participants. This suggests that the immune reactions observed in some cases may be due to individual variability or limitations in animal models, which may not fully translate to human trials.

      Based on these findings, we believe that the antiviral effects observed in our study are primarily attributable to the intrinsic properties and functions of the E3 ligases.  Furthermore, it has been reported that mice and non-human primates exhibit significantly greater resistance to innate immune activation compared to humans. This highlights the challenges in translating these findings into effective antiviral therapeutics and underscores the need for further research in this area. We have incorporated the requested discussion into the manuscript in lines 393-410.

      (3) The authors shall include some of the key data in supplementary figures in the main text, such as the study on UBR5 and MARCHF7 mediate broad-spectrum degradation of nsp16 variants and SARS-CoV-2 infection decreases UBR5 and MARCHF7 expression, which make it easier for readers to follow.

      Thank you for your valuable suggestion regarding the organization of our manuscript. In response to your feedback, we have moved the study on nsp16 variants to the Figure 6—figure supplement 3. Additionally, the data showing changes in UBR5 and MARCHF7 levels following viral infection have been added as supplementary data in Figure 6—figure supplement 4.

      (4) The diagrammatic sketches in Figures 1E, S1A and B, 7A, and 8 had low resolutions. Please change them to higher resolutions. Moreover, please state the licensing rights of these diagrammatic sketches.

      Thank you for your detailed review! In response to your comment, we have improved the resolution of Figures 1E, S1A and B, 7A, and 8. Additionally, we have specified the drawing tools and source websites in the figure legends (lines 794, 813, 999, and 1013). And we have obtained the necessary licenses for each diagram.

      Figure 1E: Created in BioRender. Li, Z. (2025) https://BioRender.com/h43f612

      Figure S1B: Created in BioRender. Li, Z. (2025) https://BioRender.com/b98t559

      Figure 7A: Created in BioRender. Li, Z. (2025) https://BioRender.com/e76g512

      Figure 8: Created in BioRender. Li, Z. (2025) https://BioRender.com/o84p897

      (5) The authors suggested that both UBR5 and MARCHF7 had a function in triggering the degradation of NSP16, however, the expression of UBR5 but not MARCHF7 was shown to be associated with the severity of clinical symptoms. Further, why did the host evolve 2 kinds of E3 ligases to adjust only 1 viral target? Please discuss them.

      Thank you for your insightful comments. We acknowledge that the limited number of patients with varying degrees of illness in our study could potentially mask some of the observed phenomena. Additionally, individual variability may also play a significant role, which highlights the challenges in translating findings from animal models to human trials.

      Regarding the presence of two E3 ligases targeting the same substrate, we view this as part of an evolutionary arms race between the host and the virus. Viruses evolve mechanisms to counteract the host’s antiviral responses, while the host, in turn, develops multiple pathways and strategies to combat viral infection. This dynamic may explain why multiple E3 ligases regulate the levels of the same factor, reflecting the host’s complex and redundant antiviral defense mechanisms. We have incorporated the requested discussion into the manuscript in lines 359-362.

      (6) Please standardize the symbol size of the bar charts in the same figure, just like in Figures 1D and 5.

      Thank you for your constructive suggestion. We have standardized the symbol sizes of the bar charts in the figure as per your recommendation, ensuring consistency across all panels.

      (7) The use of English could be improved.

      Thank you for your feedback regarding the language. We have carefully reviewed the manuscript and made revisions to improve the clarity and fluency of the English.

      Reviewer #3 (Recommendations for the authors):

      Major points:

      (1) In Figure 1: The expression level of NSP6, 10, 11, and 12 is weak. Include a higher exposure blot (right next to these blots marking as higher exposure) to show the expression of these plasmids. Here, the NSP12 plasmid has no expression, so it is difficult to conclude the effect of MG132 from this blot. It will be appropriate to show the molecular weight of each gene fragment since some of the plasmids have multiple bands. Verify the densitometric analysis, the NSP4 (+/- MG132) blot, and the densitometric analysis do not correlate. Figure 1B: It is recommended to include appropriate control (media only) for NH4Cl. The DMSO control serves well for the drugs, not for Ammonium Chloride. In Figure 1C, how did the authors arrive at the 15-hour time point? The correlation does not appear as the authors claim. Where is the 15-hour sampling time point for MG132 or CHX chase? The experimental approach to screen the E2/E3 Ub ligase is appreciated.

      Thank you for your valuable feedback! Regarding your questions, we have made the following revisions:

      On the expression of nsp6, nsp10, nsp11, and nsp12 in Figure 1:

      We have replaced the blots for nsp10, nsp11, and nsp12 with higher exposure blots. However, due to the strong expression of NSP14, we were unable to generate a higher exposure blot for nsp6. Based on the current exposure, it is clear that nsp6 is not regulated by the proteasome. Additionally, in the high-exposure blot for nsp12, we were able to observe its expression and found that this protein is weakly regulated by MG132. Following your suggestion, we have labeled the molecular weights of the proteins in the figure.

      On the densitometric analysis of nsp4 protein:

      We recalculated the densitometric analysis for nsp4 and found no issues. Although the band intensities do not show large changes, the relative fold changes appear more pronounced because we normalized the data using GAPDH as an internal control. We have added detailed description in the figure legend.

      On the NH4Cl control:

      In this experiment, ammonium chloride was dissolved in DMSO. We reviewed the solubility data and found that ammonium chloride has a solubility of 50 mg/ml in DMSO, which is sufficient to reach the concentrations used in our experiment. While the solubility is higher in water, we believe that DMSO is an appropriate solvent for this compound in our context.

      On the 15-hour time point in Figure 1C:

      Regarding the 15-hour time point mentioned in Figure 1C, we did not collect samples at that time. We performed semi-quantitative analysis of protein levels at different time points using ImageJ and estimated the half-life time point based on the half-life calculation formula. Thank you for your suggestion; we will clarify this in the figure legend.

      Once again, thank you for your thoughtful review and constructive suggestions. We have made the necessary revisions and improvements to the figures based on your feedback.

      (2) In Figure 2: I do not find a reason to include DMSO control in the siRNAs for E2/E3 Ub. Please justify why it is necessary. It is requested to include WB for the siRNA-treated samples. It is strongly recommended to show the WB data for siRNA-treated samples because you are showing siRNA treatment of MARCHF7 in shUBR5 cells and vice versa. However, if antibodies for corresponding targets are not available, qPCR can be shown in graphical representation in supplementary data indicating the siRNA target region and qPCR target. Show a graphical representation of domains/ deleted regions of MARCHF7 and UBR5.

      Thank you for your valuable feedback! We have addressed your concerns as follows:

      On the inclusion of the DMSO control group:

      The DMSO group was initially included as a control for the MG132-treated group. By comparing with the MG132 group, we aimed to observe whether nsp16 levels were restored by MG132 treatment. Additionally, in siRNA knockdown experiments, the DMSO group was included to compare nsp16 protein levels after knockdown with those in the NC group, as well as to assess differences in nsp16 restoration between MG132 treatment and factor knockdown. However, we acknowledge some issues in the control design. To address this, we have redesigned and conducted the experiments with improved controls (Figure 2A).

      On validating knockdown efficiency:

      We have included Western blot data for UBR5 and MARCHF7 knockdown efficiencies. For other factors where specific antibodies were unavailable, we followed your suggestion and provided graphical representations in the Appendix-figure S1, illustrating the siRNA target regions and qPCR target sites to confirm knockdown specificity and efficiency.

      (3) In Figure 4 A: Write details on how this IP was done. What was the transfection time of this plasmid? Is the transfection time different from that of NSP16 in Figure 1A which shows a significant degradation of NSP16? Please discuss this in detail. It is recommended that this IP be done in +/- MG132. Since you have used siRNA and performed an IP, It is recommended to repeat the IP (with +/- MG132) using the MARCHF7 and UBR5 plasmids

      Thank you for your detailed review and suggestions! We have addressed your concerns as follows:

      On the specific protocol for the co-IP in Figure 3A:

      The detailed protocol for the immunoprecipitation (IP) experiment is as follows: on day 1, cells were plated, and on day 2, we co-transfected nsp16 and Ub expression plasmids. After 32 hours of transfection, we treated the cells with MG132 for 16 hours, then harvested the cells for IP. We included MG132 treatment in all ubiquitination IP experiments because, without MG132, nsp16 would be degraded, preventing us from observing changes in ubiquitination levels. We apologize for not clearly labeling this in the figure, and we have made the necessary modifications.

      On the use of MG132 and NSP16 degradation:

      Following your suggestion, we have clarified the use of MG132 in the IP experiments, which differs from the degradation of nsp16 shown in Figure 1A. In Figure 1A, we show the degradation of nsp16 in the absence of MG132 treatment.

      On the overexpression of UBR5 and MARCHF7:

      The effect of overexpressing UBR5 or MARCHF7 on ubiquitination has been validated in Figure 4 supplement 2. In these experiments, we explored the effect of UBR5 activity domain inactivation on nsp16 ubiquitination, as well as the effect of MARCHF7 truncation on nsp16 ubiquitination modification. In these experiments, overexpression of the wild-type E3 ligases was also included, and the results yielded the same conclusions as those from the E3 knockdown experiments, thereby validating the robustness of our findings.

      (4) In Figure 4C: Appropriate controls are missing. The authors claim NSP16 is ubiquitinated and degraded by UBR5 and MARCHF7 via K27 and K48 chains. There is no NSP16 Only control. We cannot compare the NSP16 without an NSP16 transfection. I will suggest the authors repeat these individual controls in both the presence and absence of MG132.

      Thank you for your careful review and valuable suggestion! In response to your comment, we have redesigned the experiment and added a control group without nsp16 transfection. We have repeated the validation in the presence of MG132. Without MG132 treatment, nsp16 is degraded, leading to very low protein levels, making it difficult to observe the phenomenon. We have updated the figure accordingly and made the necessary adjustments based on your suggestion (Figure 3E-F).

      (5) In my opinion, the Figure 8 needs modification. It is requested to show the levels of strand-specific viral mRNA under UBR5 and MARCHF7 knock-down in +/- of MG312. This figure should also be supported by WB indicating the level of NSP16 (capping activity) and any of the viral proteins. This may validate that if the capping activity is lost, viral translation is affected and hence there is a reduction in virus titre. Alternatively, the figure can be modified by putting a sub-heading box over 7mGppA-RNA section and marking it as a future direction/ hypothesis.

      Thank you for your thorough and thoughtful review! Regarding the modification of Figure 8, we completely agree with your suggestion. Currently, examining the impact of viral RNA cap modification is technically challenging for us. Therefore, we have followed your advice and marked the investigation of how nsp16 degradation affects viral RNA cap structures as a future direction/hypothesis in the schematic of Figure 8. This revision helps provide direction for future experiments and enhances the clarity of the figure. Thank you for your thoughtful consideration and valuable suggestion!

      Minor points:

      (1) Figure 2A: Align NSP16 Blot to actin.

      Thank you for your constructive feedback! We have redesigned the experiment and included an MG132 treatment group in Figure 2A. Consequently, the figure has been revised comprehensively, and the nsp16 blot has been aligned with tubulin.

      (2) Figure 2C: It is recommended to properly align the lanes where the pLKO and shRNA labelling are overlapping.

      Thank you for your thoughtful suggestion! We have revised Figure 2C based on your recommendation to ensure that the pLKO and shRNA labeling no longer overlap. We sincerely apologize for any confusion this may have caused and appreciate your understanding and support.

      (3) Just a curious question, what happens if we silence both UBR5 and MARCHF7 and check for virus titre? This is an additional work, but if the authors do not agree, it is ok.

      Thank you for your valuable suggestion! Regarding your question about silencing both UBR5 and MARCHF7, we indeed attempted to generate knockout cell lines, but unfortunately, we were not successful at this stage. We plan to explore alternative methods to establish stable knockout cell lines in our future experiments. Meanwhile, as shown in Figure 5 supplement 1, we have performed experiments where both UBR5 and MARCHF7 were knocked down simultaneously, followed by infection with virus-like particles. The results indicate that dual knockdown further enhances viral replication. These findings may partially address your question. Thank you again for your insightful suggestion!

    1. Author response:

      The following is the authors’ response to the original reviews.

      Reviewer #1 (Public Review):

      Summary: 

      The authors investigated causal inference in the visual domain through a set of carefully designed experiments, and sound statistical analysis. They suggest the early visual system has a crucial contribution to computations supporting causal inference. 

      Strengths: 

      I believe the authors target an important problem (causal inference) with carefully chosen tools and methods. Their analysis rightly implies the specialization of visual routines for causal inference and the crucial contribution of early visual systems to perform this computation. I believe this is a novel contribution and their data and analysis are in the right direction. 

      Weaknesses: 

      In my humble opinion, a few aspects deserve more attention: 

      (1) Causal inference (or causal detection) in the brain should be quite fundamental and quite important for human cognition/perception. Thus, the underlying computation and neural substrate might not be limited to the visual system (I don't mean the authors did claim that). In fact, to the best of my knowledge, multisensory integration is one of the best-studied perceptual phenomena that has been conceptualized as a causal inference problem.

      Assuming the causal inference in those studies (Shams 2012; Shams and Beierholm 2022;

      Kording et al. 2007; Aller and Noppeney 2018; Cao et al. 2019) (and many more e.g., by Shams and colleagues), and the current study might share some attributes, one expects some findings in those domains are transferable (at least to some degree) here as well. Most importantly, underlying neural correlates that have been suggested based on animal studies and invasive recording that has been already studied, might be relevant here as well.

      Perhaps the most relevant one is the recent work from the Harris group on mice (Coen et al. 2021). I should emphasize, that I don't claim they are necessarily relevant, but they can be relevant given their common roots in the problem of causal inference in the brain. This is a critical topic that the authors may want to discuss in their manuscript. 

      We thank the reviewer. We addressed this point of the public review in our reply to the reviewer’s suggestions (and add it here again for convenience). The literature on the role of occipital, parietal and frontal brain areas in causal inference is also addressed in the response to point 3 of the public review.

      “We used visual adaptation to carve out a bottom-up visual routine for detecting causal interactions in form of launching events. However, we know that more complex behaviors of perceiving causal relations can result from integrating information across space (e.g., in causal capture; Scholl & Nakayama, 2002), across time (postdictive influence; Choi & Scholl, 2006), and across sensory modalities (Sekuler, Sekuler, & Lau, 1997). Bayesian causal inference has been particularly successful as a normative framework to account for multisensory integration (Körding et al., 2007; Shams & Beierholm, 2022). In that framework, the evidence for a common-cause hypothesis is competing with the evidence for an independent-causes hypothesis (Shams & Beierholm, 2022). The task in our experiments could be similarly formulated as two competing hypotheses for the second disc’s movement (i.e., the movement was caused by the first disc vs. the movement occurred autonomously). This framework also emphasizes the distributed nature of the neural implementation for solving such inferences, showing the contributions of parietal and frontal areas in addition to sensory processing (for review see Shams & Beierholm, 2022). Moreover, even visual adaptation to contrast in mouse primary visual cortex is influenced by top-down factors such as behavioral relevance— suggesting a complex implementation of the observed adaptation results (Keller et al. 2017). The present experiments, however, presented purely visual events that do not require an integration across processing domains. Thus, the outcome of our suggested visual routine can provide initial evidence from within the visual system for a causal relation in the environment that may then be integrated with signals from other domains (e.g., auditory signals). Determining exactly how the perception of causality relates to mechanisms of causal inference and the neural implementation thereof is an exciting avenue for future research. Note, however, that perceived causality can be distinguished from judged causality: Even when participants are aware that a third variable (e.g., a color change) is the best predictor of the movement of the second disc in launching events, they still perceive the first disc as causing the movement of the second disc (Schlottmann & Shanks, 1992).”

      (2) If I understood correctly, the authors are arguing pro a mere bottom-up contribution of early sensory areas for causal inference (for instance, when they wrote "the specialization of visual routines for the perception of causality at the level of individual motion directions raises the possibility that this function is located surprisingly early in the visual system *as opposed to a higher-level visual computation*."). Certainly, as the authors suggested, early sensory areas have a crucial contribution, however, it may not be limited to that. Recent studies progressively suggest perception as an active process that also weighs in strongly, the topdown cognitive contributions. For instance, the most simple cases of perception have been conceptualized along this line (Martin, Solms, and Sterzer 2021) and even some visual illusion (Safavi and Dayan 2022), and other extensions (Kay et al. 2023). Thus, I believe it would be helpful to extend the discussion on the top-down and cognitive contributions of causal inference (of course that can also be hinted at, based on recent developments). Even adaptation, which is central in this study can be influenced by top-down factors (Keller et al. 2017). I believe, based on other work of Rolfs and colleagues, this is also aligned with their overall perspective on vision.  

      Indeed, we assessed bottom-up contributions to the perception of a causal relation. We agree with the reviewer that in more complex situations, for instance, in the presence of contextual influences or additional auditory signals, the perception of a causal relation may not be limited to bottom-up vision. While we had acknowledged this in the original manuscript (see excerpts below), we now make it even more explicit:

      “[…] we know that more complex behaviors of perceiving causal relations can result from integrating information across space (e.g., in causal capture; Scholl & Nakayama, 2002), across time (postdictive influence; Choi & Scholl, 2006), and across sensory modalities (Sekuler, Sekuler, & Lau, 1997).”

      “[…] Neurophysiological studies support the view of distributed neural processing underlying sensory causal interactions with the visual system playing a major role.”

      “[…] Interestingly, single cell recordings in area F5 of the primate brain revealed that motor areas are contributing to the perception of causality (Caggiano et al., 2016; Rolfs, 2016), emphasizing the distributed nature of the computations underlying causal interactions. This finding also stresses that the detection, and the prediction, of causality is essential for processes outside sensory systems (e.g., for understanding other’s actions, for navigating, and for avoiding collisions). The neurophysiology subserving causal inference further extend the candidate cortical areas that might contibute to the detection of causal relations, emphasizing the role of the frontal cortex for the flexible integration of multisensory representations (Cao et al., 2019; Coen et al., 2023).”

      However, there is also ample evidence that the perception of a simple causal relation—as we studied it in our experiments—escapes top-down cognitive influences. The perception of causality in launching events is described as automatic and irresistible, meaning that participants have the spontaneous impression of a causal relation, and participants typically do not voluntarily switch between a causal and a noncausal percept. This irresistibility has led several authors to discuss a modular organization underlying the detection of such events (Michotte, 1963; Scholl & Tremoulet, 2000). This view is further supported by a study that experimentally manipulated the contingencies between the movement of the two discs (Schlottmann & Shanks, 1992). In one condition the authors created a launching event where the second disc’s movement was perfectly correlated with a color change, but only sometimes coincided with the first disc’s movement offset. Nevertheless, participants reported seeing that the first disc caused the movement of second disc (regardless of the stronger statistical relationship with the color change). However, when asked to make conscious causal judgments, participants were aware of the color change as the true cause of the second disc’s motion—therefore recognizing its more reliable correlation. This study strongly suggests that perceived and judged causality (i.e., cognitive causal inference) can be dissociated (Schlottmann & Shanks, 1992). We have added this reference in the revised manuscript. Overall, we argue that our study focused on a visual routine that could be implemented in a simple bottom-up fashion, but we acknowledge throughout the manuscript, that in a more complex situation (e.g., integrating information from other sensory domains) the implementation could be realized in a more distributed fashion including top-down influences as in multisensory integration. However, it is important to stress that these potential top-down influences would be automatic and should not be confused with voluntary cognitive influences.

      “Note, however, that perceived causality can be distinguished from judged causality (Schlottmann & Shanks, 1992). Even when participants are aware that a third variable (e.g., a color change) is the best predictor of the movement of the second disc in launching events, they still perceive the first disc as causing the movement of the second disc (Schlottmann & Shanks, 1992).”

      (3) The authors rightly implicate the neural substrate of causal inference in the early sensory system. Given their study is pure psychophysics, a more elaborate discussion based on other studies that used brain measurements is needed (in my opinion) to put into perspective this conclusion. In particular, as I mentioned in the first point, the authors mainly discuss the potential neural substrate of early vision, however much has been done about the role of higher-tier cortical areas in causal inference e.g., see (Cao et al. 2019; Coen et al. 2021). 

      In the revised manuscript, we addressed the limitations of a purely psychophysical approach and acknowledged alternative implementations in the Discussion section.

      “Note that, while the present findings demonstrate direction-selectivity, it remains unclear where exactly that visual routine is located. As pointed out, it is also possible that the visual routine is located higher up in the visual system (or distributed across multiple levels) and is only using a directional-selective population response as input.”

      Moreover, we cite also the two suggested papers when referring to the role of cortical areas in causal inference (Cao et al, 2019; Coen et al., 2023):

      “Neurophysiological studies support the view of distributed neural processing underlying sensory causal interactions with the visual system playing a major role. Imaging studies in particular revealed a network for the perception of causality that is also involved in action observation (Blakemore et al., 2003; Fonlupt, 2003; Fugelsang et al., 2005; Roser et al., 2005). The fact that visual adaptation of causality occurs in a retinotopic reference frame emphazises the role of retinotopically organized areas within that network (e.g., V5 and the superior temporal sulcus). Interestingly, single cell recordings in area F5 of the primate brain revealed that motor areas are contributing to the perception of causality (Caggiano et al., 2016; Rolfs, 2016), emphasizing the distributed nature of the computations underlying causal interactions, and also stressing that the detection, and the prediction, of causality is essential for processes outside purely sensory systems (e.g., for understanding other’s actions, for navigating, and for avoiding collisions). The neurophysiological underpinnings in causal inference further extend the candidate cortical areas that might contibute to the detection of causal relations, emphasizing the role of the frontal cortex for the flexible integration of multisensory representations (Cao et al., 2019; Coen et al., 2023).”

      There were many areas in this manuscript that I liked: clever questions, experimental design, and statistical analysis.

      Thank you so much.

      Reviewer #1 (Recommendations for the authors):

      I congratulate the authors again on their manuscript and hope they will find my review helpful. Most of my notes are suggestions to the authors, and I hope will help them to improve the manuscript. None are intended to devalue their (interesting) work. 

      We would like to thank the reviewer for their thoughtful and encouraging comments.

      In the following, I use pX-lY template to refer to a particular page number, say page number X (pX), and line number, say line number Y (lY). 

      Major concerns and suggestions 

      - I would suggest simplifying the abstract and significance statement or putting more background in it. It's hard (at least for me) to understand if one is not familiar with the task used in this study. 

      We followed the reviewer’s suggestion and added more background in the beginning of the abstract. 

      We made the following changes:

      “Detecting causal relations structures our perception of events in the world. Here, we determined for visual interactions whether generalized (i.e., feature-invariant) or specialized (i.e., feature-selective) visual routines underlie the perception of causality. To this end, we applied a visual adaptation protocol to assess the adaptability of specific features in classical launching events of simple geometric shapes. We asked observers to report whether they observed a launch or a pass in ambiguous test events (i.e., the overlap between two discs varied from trial to trial). After prolonged exposure to causal launch events (the adaptor) defined by a particular set of features (i.e., a particular motion direction, motion speed, or feature conjunction), observers were less likely to see causal launches in subsequent ambiguous test events than before adaptation. Crucially, adaptation was contingent on the causal impression in launches as demonstrated by a lack of adaptation in non-causal control events. We assessed whether this negative aftereffect transfers to test events with a new set of feature values that were not presented during adaptation. Processing in specialized (as opposed to generalized) visual routines predicts that the transfer of visual adaptation depends on the feature-similarity of the adaptor and the test event. We show that negative aftereffects do not transfer to unadapted launch directions but do transfer to launch events of different speed. Finally, we used colored discs to assign distinct feature-based identities to the launching and the launched stimulus. We found that the adaptation transferred across colors if the test event had the same motion direction as the adaptor. In summary, visual adaptation allowed us to carve out a visual feature space underlying the perception of causality and revealed specialized visual routines that are tuned to a launch’s motion direction.”

      - The authors highlight the importance of studying causal inference and understanding the underlying mechanisms by probing adaptation, however, their introduction justifying that is, in my humble opinion, quite short. Perhaps in the cited paper, this is discussed extensively, but I'd suggest providing some elaboration in the manuscript. Otherwise, the study would be very specific to certain visual phenomena, rather than general mechanisms.  

      We have carefully considered the reviewer’s set of comments and concerns (e.g., the role of top-down influences, the contributions of the frontal cortex, and illustration of the computational level). They all appear to share the theme that the reviewer looks at our study from the perspective of Bayesian inference. We conducted the current study in the tradition of classical phenomena in the field of the perception of causality (in the tradition of Michotte, 1963 and as reviewed in Scholl & Tremoulet, 2000) which aims to uncover the relevant visual parameters and rules for detecting causal relations in the visual domain. Indeed, we think that a causal inference perspective promises a lot of new insights into the mechanisms underlying the classical phenomena described for the perception of causality. In the revised manuscript, we discuss therefore causal inference and how it relates to the current study. We now emphasize that in our study, a) we used visual adaptation to reveal the bottom-up processes that allow for the detection of a causal interaction in the visual domain, b) that the perception of causality also integrates signals from other domains (which we do not study here), and c) that the neural substrates underlying the perception of causality might be best described by a distributed network. By discussing Bayesian causal inference, we point out promising avenues for future research that may bridge the fields of the perception of causality and Bayesian causal inference. However, we also emphasize that perceived causality and judged causality can be dissociated (Schlottmann & Shanks, 1992).

      We added the following discussion:

      “We used visual adaptation to carve out a bottom-up visual routine for detecting causal interactions in form of launching events. However, we know that more complex behaviors of perceiving causal relations can result from integrating information across space (e.g., in causal capture; Scholl & Nakayama, 2002), across time (postdictive influence; Choi & Scholl, 2006), and across sensory modalities (Sekuler, Sekuler, & Lau, 1997). Bayesian causal inference has been particularly successful as a normative framework to account for multisensory integration (Körding et al., 2007; Shams & Beierholm, 2022). In that framework, the evidence for a common-cause hypothesis is competing with the evidence for an independent-causes hypothesis (Shams & Beierholm, 2022). The task in our experiments could be similarly formulated as two competing hypotheses for the second disc’s movement (i.e., the movement was caused by the first disc vs. the second disc did not move). This framework also emphasizes the distributed nature of the neural implementation for solving such inferences, showing the contributions of parietal and frontal areas in addition to sensory processing (for review see Shams & Beierholm, 2022). Moreover, even visual adaptation to contrast in mouse primary visual cortex is influenced by top-down factors such as behavioral relevance— suggesting a complex implementation of the observed adaptation results (Keller et al. 2017). The present experiments, however, presented purely visual events that do not require an integration across processing domains. Thus, the outcome of our suggested visual routine can provide initial evidence from within the visual system for a causal relation in the environment that may then be integrated with signals from other domains (e.g., auditory signals). Determining exactly how the perception of causality relates to mechanisms of causal inference and the neural implementation thereof is an exciting avenue for future research. Note, however, that perceived causality can be distinguished from judged causality: Even when participants are aware that a third variable (e.g., a color change) is the best predictor of the movement of the second disc in launching events, they still perceive the first disc as causing the movement of the second disc (Schlottmann & Shanks, 1992).”

      - I'd suggest, at the outset, already set the context, that your study of causal inference in the brain is specifically targeting the visual domain, if you like, in the discussion connect it  better to general ideas about causal inference in the brain (like the works by Ladan Shams and colleagues). 

      We would like to thank the reviewer for this comment. We followed the reviewer’s suggestion and made clear from the beginning that this paper is about the detection of causal relations in the visual domain. In the revised manuscript we write:

      “Here, we will study the mechanisms underlying the computations of causal interactions in the visual domain by capitalizing on visual adaptation of causality (Kominsky & Scholl, 2020; Rolfs et al., 2013). Adaptation is a powerful behavioral tool for discovering and dissecting a visual mechanism (Kohn, 2007; Webster, 2015) that provides an intriguing testing ground for the perceptual roots of causality.”

      As described in our reply to the previous comment, we now also discussed the ideas about causal inference.

      - To better illustrate the implication of your study on the computational level, I'd suggest putting it in the context of recent approaches to perception (point 2 of my public review). I think this is also aligned with the comment of Reviewer#3 on your line 32 (recommendation for authors).  

      In the revised manuscript, we now discuss the role of top-down influences in causal inference when addressing point 2 of the reviewer’s public review.

      Minor concerns and suggestions 

      - On p2-l3, I'd suggest providing a few examples for generalized and or specialized visual routines (given the importance of the abstract). I only got it halfway through the introduction. 

      We thank the reviewer for highlighting the need to better introduce the concept of a visual routine. We have chosen the term visual routine to emphasize that we locate the part of the mechanism that is affected by the adaptation in our experiments in the visual system. At the same time, the concept leaves space with respect to the extent to which the mechanism further involves mid- and higher-level processes. In the revised manuscript, we now refer to Ullman (1987) who introduced the concept of a visual routine—the idea of a modular operation that sequentially processes spatial and feature information. Moreover, we refer to the concept of attentional sprites (Cavanagh, Labianca, & Thornton, 2001)—attention-based visual routines that allow the visual system to semi-independently handle complex visual tasks (e.g., identifying biological motion).

      We add the following footnote to the introduction:

      “We use the term visual routine here to highlight that our adaptation experiments can reveal a causality detection mechanism that resides in the visual system. At the same time, calling it a routine emphasizes similarities with a local, semi-independent operation (e.g., the recognition of familiar motion patterns; see also Ullman, 1987; Cavanagh, Labianca, & Thornton, 2001) that can engage mid- and higher-level processes (e.g., during causal capture, Scholl & Nakayama, 2002; or multisensory integration, Körding et al., 2007).”

      In the abstract we now write:

      “Here, we determined for visual interactions whether generalized (i.e., feature-invariant) or specialized (i.e., feature-selective) visual routines underlie the perception of causality.”

      - On p4-l31, I'd suggest mentioning the Matlab version. I have experienced differences across different versions of Matlab (minor but still ...). 

      We added the Matlab Version.

      - On p6-l46 OSF-link is missing (that contains data and code). 

      Thank you. We made the OSF repository public and added the link to the revised manuscript.

      We added the following information to the revised manuscript.

      “The data analysis code has been deposited at the Open Science Framework and is publicly available https://osf.io/x947m/.”

      Reviewer #2 (Public Review):

      This paper seeks to determine whether the human visual system's sensitivity to causal interactions is tuned to specific parameters of a causal launching event, using visual adaptation methods. The three parameters the authors investigate in this paper are the direction of motion in the event, the speed of the objects in the event, and the surface features or identity of the objects in the event (in particular, having two objects of different colors). The key method, visual adaptation to causal launching, has now been demonstrated by at least three separate groups and seems to be a robust phenomenon. Adaptation is a strong indicator of a visual process that is tuned to a specific feature of the environment, in this case launching interactions. Whereas other studies have focused on retinotopically specific adaptation (i.e., whether the adaptation effect is restricted to the same test location on the retina as the adaptation stream was presented to), this one focuses on feature specificity. 

      The first experiment replicates the adaptation effect for launching events as well as the lack of adaptation event for a minimally different non-causal 'slip' event. However, it also finds that the adaptation effect does not work for launching events that do not have a direction of motion more than 30 degrees from the direction of the test event. The interpretation is that the system that is being adapted is sensitive to the direction of this event, which is an interesting and somewhat puzzling result given the methods used in previous studies, which have used random directions of motion for both adaptation and test events. 

      The obvious interpretation would be that past studies have simply adapted to launching in every direction, but that in itself says something about the nature of this direction-specificity: it is not working through opposed detectors. For example, in something like the waterfall illusion adaptation effect, where extended exposure to downward motion leads to illusory upward motion on neutral-motion stimuli, the effect simply doesn't work if motion in two opposed directions is shown (i.e., you don't see illusory motion in both directions, you just see nothing). The fact that adaptation to launching in multiple directions doesn't seem to cancel out the adaptation effect in past work raises interesting questions about how directionality is being coded in the underlying process. 

      We would like to thank the reviewer for that thoughtful comment. We added the described implication to the manuscript:

      “While the present study demonstrates direction-selectivity for the detection of launches, previous adaptation protocols demonstrated successful adaptation using adaptors with random motion direction (Rolfs et al., 2013; Kominsky & Scholl, 2020). These results therefore suggest independent direction-specific routines, in which adaptation to launches in one direction does not counteract an adaptation to launches in the opposite direction (as for example in opponent color coding).”

      In addition, one limitation of the current method is that it's not clear whether the motion direction-specificity is also itself retinotopically-specific, that is, if one retinotopic location were adapted to launching in one direction and a different retinotopic location adapted to launching in the opposite direction, would each test location show the adaptation effect only for events in the direction presented at that location? 

      This is an interesting idea! Because previous adaptation studies consistently showed retinotopic adaptation of causality, we would not expect to find transfer of directional tuning for launches to other locations. We agree that the suggested experiment on testing the reference frame of directional specificity constitutes an interesting future test of our findings.

      The second experiment tests whether the adaptation effect is similarly sensitive to differences in speed. The short answer is no; adaptation events at one speed affect test events at another. Furthermore, this is not surprising given that Kominsky & Scholl (2020) showed adaptation transfer between events with differences in speeds of the individual objects in the event (whereas all events in this experiment used symmetrical speeds). This experiment is still novel and it establishes that the speed-insensitivity of these adaptation effects is fairly general, but I would certainly have been surprised if it had turned out any other way. 

      We thank the reviewer for highlighting the link to an experiment reported in Kominsky & Scholl (2020). We report the finding of that experiment now in the revised manuscript.

      We added the following paragraph in the discussion:

      “For instance, we demonstrated a transfer of adaptation across speed for symmetrical speed ratios. This result complements a previous finding that reported that the adaptation to triggering events (with an asymmetric speed ratio of 1:3) resulted in significant retinotopic adaptation of ambiguous (launching) test events of different speed ratios (i.e., test events with a speed ratio of 1:1 and of 1:3; Kominsky & Scholl, 2020).”

      The third experiment tests color (as a marker of object identity), and pits it against motion direction. The results demonstrate that adaptation to red-launching-green generates an adaptation effect for green-launching-red, provided they are moving in roughly the same direction, which provides a nice internal replication of Experiment 1 in addition to showing that the adaptation effect is not sensitive to object identity. This result forms an interesting contrast with the infant causal perception literature. Multiple papers (starting with Leslie & Keeble, 1987) have found that 6-8-month-old infants are sensitive to reversals in causal roles exactly like the ones used in this experiment. The success of adaptation transfer suggests, very clearly, that this sensitivity is not based only on perceptual processing, or at least not on the same processing that we access with this adaptation procedure. It implies that infants may be going beyond the underlying perceptual processes and inferring genuine causal content. This is also not the first time the adaptation paradigm has diverged from infant findings: Kominsky & Scholl (2020) found a divergence with the object speed differences as well, as infants categorize these events based on whether the speed ratio (agent:patient) is physically plausible (Kominsky et al., 2017), while the adaptation effect transfers from physically implausible events to physically plausible ones. This only goes to show that these adaptation effects don't exhaustively capture the mechanisms of early-emerging causal event representation. 

      We would like to thank the reviewer for highlighting the similarities (and differences) to the seminal study by Leslie and Keeble (1987). We included a discussion with respect to that paper in the revised manuscript. Indeed, that study showed a recovery from habituation to launches after reversal of the launching events. In their study, the reversal condition resulted in a change of two aspects, 1) motion direction and 2) a change of what color is linked to either cause (i.e., agent) or effect (i.e, patient). Our study, based on visual adaptation in adults, suggests that switching the two colors is not necessary for a recovery from the habituation, provided the motion direction is reversed. Importantly, the reversal of the motion direction only affected the perception of causality after adapting to launches (but not to slip events), which is consistent with Leslie and Keeble’s (1987) finding that the effect of a reversal is contingent on habituation/adaptation to a causal relationship (and is not observed for non-causal delayed launches). Based on our findings, we predict that switching colors without changing the event’s motion direction would not result in a recovery from habituation. Obviously, for infants, color may play a more important role for establishing an object identity than it does for adults, which could explain potential differences. We also agree with the reviewer’s point that the adaptation protocol might tap into different mechanisms than revealed by habituation studies in infants (e.g, Kominsky et al., 2017 vs. Kominsky & Scholl, 2020). 

      We revised the manuscript accordingly when discussing the role of direction selectivity in our study:

      “Habituation studies in six-months-old infants also demonstrated that the reversal of a launch resulted in a recovery from habituation to launches (while a non-causal control condition of delayed-launches did not; Leslie & Keeble, 1987). In their study, the reversal of motion direction was accompanied by a reversal of the color assignment to the cause-effectrelationship. In contrast, our findings suggest, that in adults color does not play a major role in the detection of a launch. Future studies should further delineate similarities and differences obtained from adaptation studies in adults and habituation studies in children (e.g., Kominsky et al., 2017; Kominsky & Scholl, 2020).”

      One overarching point about the analyses to take into consideration: The authors use a Bayesian psychometric curve-fitting approach to estimate a point of subjective equality (PSE) in different blocks for each individual participant based on a model with strong priors about the shape of the function and its asymptotic endpoints, and this PSE is the primary DV across all of the studies. As discussed in Kominsky & Scholl (2020), this approach has certain limitations, notably that it can generate nonsensical PSEs when confronted with relatively extreme response patterns. The authors mentioned that this happened once in Experiment 3 and that a participant had to be replaced. An alternate approach is simply to measure the proportion of 'pass' reports overall to determine if there is an adaptation effect. I don't think this alternate analysis strategy would greatly change the results of this particular experiment, but it is robust against this kind of self-selection for effects that fit in the bounds specified by the model, and may therefore be worth including in a supplemental section or as part of the repository to better capture the individual variability in this effect. 

      We largely agree with these points. Indeed, we adopted the non-parametric analysis for a recent series of experiments in which the psychometric curves were more variable (Ohl & Rolfs, Vision Sciences Society Meeting 2024). In the present study, however, the model fits were very convincing. In Figures S1, S2 and S3 we show the model fits for each individual observer and condition on top of the mean proportion of launch reports. The inferential statistics based on the points of subjective equality, therefore, allowed us to report our findings very concisely.

      In general, this paper adds further evidence for something like a 'launching' detector in the visual system, but beyond that, it specifies some interesting questions for future work about how exactly such a detector might function. 

      We thank the reviewer for this positive overall assessment.

      Reviewer #2 (Recommendations for the authors):

      Generally, the paper is great. The questions I raised in the public review don't need to be answered at this time, but they're exciting directions for future work. 

      We would like to thank the reviewer for the encouraging comments and thoughtful ideas on how to improve the manuscript.

      I would have liked to see a little more description of the model parameters in the text of the paper itself just so readers know what assumptions are going into the PSE estimation. 

      We followed the reviewer’s suggestion and added more information regarding the parameter space (i.e., ranges of possible parameters of the logistic model) that we used for obtaining the model fits. 

      Specifically, we added the following information in the manuscript:

      “For model fitting, we constrained the range of possible estimates for each parameter of the logistic model. The lower asymptote for the proportion of reported launches was constrained to be in the range 0–0.75, and the upper asymptote in the range 0.25–1. The intercept of the logistic model was constrained to be in the range 1–15, and the slope was constrained to be in the range –20 to –1.”

      The models provided very good fits as can be appreciated by the fits per individual and experimental condition which we provide in response to the public comments. Please note, that all data and analysis scripts are available at the Open Science Framework (https://osf.io/x947m/).

      I also have a recommendation about Figure 1b: Color-code "Feature A", "Feature B", and "Feature C" and match those colors with the object identity/speed/direction text. I get what the figure is trying to convey but to a naive reader there's a lot going on and it's hard to interpret. 

      We followed the reviewer’s suggestion and revised the visualization accordingly.

      If you have space, figures showing the adaptation and corresponding test events for each experimental manipulation would also be great, particularly since the naming scheme of the conditions is (necessarily) not entirely consistent across experiments. It would be a lot of little figures, I know, but to people who haven't spent as long staring at these displays as we have, they're hard to envision based on description alone. 

      We followed the reviewer’s recommendation and added a visualization of the adaptor and the test events for the different experiments in Figure 2.

      Reviewer #3 (Public Review):

      We thank the reviewer for their thoughtful comments, which we carefully addressed to improve the revised manuscript. 

      Summary: 

      This paper presents evidence from three behavioral experiments that causal impressions of "launching events", in which one object is perceived to cause another object to move, depending on motion direction-selective processing. Specifically, the work uses an adaptation paradigm (Rolfs et al., 2013), presenting repetitive patterns of events matching certain features to a single retinal location, then measuring subsequent perceptual reports of a test display in which the degree of overlap between two discs was varied, and participants could respond "launch" or "pass". The three experiments report results of adapting to motion direction, motion speed, and "object identity", and examine how the psychometric curves for causal reports shift in these conditions depending on the similarity of the adapter and test. While causality reports in the test display were selective for motion direction (Experiment 1), they were not selective for adapter-test speed differences (Experiment 2) nor for changes in object identity induced via color swap (Experiment 3). These results support the notion that causal perception is computed (in part) at relatively early stages of sensory processing, possibly even independently of or prior to computations of object identity. 

      Strengths: 

      The setup of the research question and hypotheses is exceptional. The experiments are carefully performed (appropriate equipment, and careful control of eye movements). The slip adaptor is a really nice control condition and effectively mitigates the need to control motion direction with a drifting grating or similar. Participants were measured with sufficient precision, and a power curve analysis was conducted to determine the sample size. Data analysis and statistical quantification are appropriate. Data and analysis code are shared on publication, in keeping with open science principles. The paper is concise and well-written. 

      Weaknesses: 

      The biggest uncertainty I have in interpreting the results is the relationship between the task and the assumption that the results tell us about causality impressions. The experimental logic assumes that "pass" reports are always non-causal impressions and "launch" reports are always causal impressions. This logic is inherited from Rolfs et al (2013) and Kominsky & Scholl (2020), who assert rather than measure this. However, other evidence suggests that this assumption might not be solid (Bechlivanidis et al., 2019). Specifically, "[our experiments] reveal strong causal impressions upon first encounter with collision-like sequences that the literature typically labels "non-causal"" (Bechlivanidis et al., 2019) -- including a condition that is similar to the current "pass". It is therefore possible that participants' "pass" reports could also involve causal experiences. 

      We agree with the reviewer that our study assumes that the launch-pass dichotomy can be mapped onto a dimension of causal to non-causal impressions. Please note that the choice for this launch-pass task format was intentional. We consider it an advantage that subjects do not have to report causal vs non-causal impressions directly, as it allows us to avoid the oftencriticized decision biases that come with asking participants about their causal impression (Joynson, 1971; for a discussion see Choi & Scholl, 2006). This comes obviously at the cost that participants did not directly report their causal impression in our experiments. There is however evidence that increasing overlap between the discs monotonically decreases the causal impression when directly asking participants to report their causal impression (Scholl & Nakayama, 2004). We believe, therefore, that the assumption of mapping between launchesto-passes and causal-to-noncausal is well-justified. At the same time, the expressed concern emphasizes the need to develop further, possibly implicit measure for causal impressions (see Völter & Huber, 2021).

      However, as pointed out by the reviewer, a recent paper demonstrated that on first encounter participants can have impressions in response to a pass event that are different from clearly non-causal impressions (Bechlivanidis et al., 2019). As demonstrated in the same paper, displaying a canonical launch decreased the impression of causality when seeing pass events in subsequent trials. In our study, participants completed an entire training session before running the main experiments. It is therefore reasonable to expect that participants observed passes as non-causal events given the presence of clear causal references. Nevertheless, we now acknowledge this concern directly in the revised manuscript.

      We added the following paragraph to the discussion:

      “In our study, we assessed causal perception by asking observers to report whether they observed a launch or a pass in events of varying ambiguity. This method assumes that launches and passes can be mapped onto a dimension that ranges from causal to non-causal impressions. It has been questioned whether pass events are a natural representative of noncausal events: Observers often report high impressions of causality upon first exposure to pass events, which then decreased after seeing a canonical launch (Bechlivanidis, Schlottmann, & Lagnado, 2019). In our study, therefore, participants completed a separate session that included canonical launches before starting the main experiment.”

      Furthermore, since the only report options are "launch" or "pass", it is also possible that "launch" reports are not indications of "I experienced a causal event" but rather "I did not experience a pass event". It seems possible to me that different adaptation transfer effects (e.g. selectivity to motion direction, speed, or color-swapping) change the way that participants interpret the task, or the uncertainty of their impression. For example, it could be that adaptation increases the likelihood of experiencing a "pass" event in a direction-selective manner, without changing causal impressions. Increases of "pass" impressions (or at least, uncertainty around what was experienced) would produce a leftward shift in the PSE as reported in Experiment 1, but this does not necessarily mean that experiences of causal events changed. Thus, changes in the PSEs between the conditions in the different experiments may not directly reflect changes in causal impressions. I would like the authors to clarify the extent to which these concerns call their conclusions into question. 

      Indeed, PSE shifts are subject to cognitive influences and can even be voluntarily shifted (Morgan et al., 2012). We believe that decision biases (e.g., reporting the presence of launch before adaptation vs. reporting the absence of a pass after the adaptation) are unlikely to explain the high specificity of aftereffects observed in the current study. While such aftereffects are very typical of visual processing (Webster, 2015), it is unclear how a mechanism that increase the likelihood of perceiving a pass could account for the retinotopy of adaptation to launches (Rolfs et al., 2013) or the recently reported selective transfer of adaptation for only some causal categories (Kominsky et al., 2020). The latter authors revealed a transfer of adaptation from triggering to launching, but not from entraining events to launching. Based on these arguments, we decided to not include this point in the revised manuscript.

      Leaving these concerns aside, I am also left wondering about the functional significance of these specialised mechanisms. Why would direction matter but speed and object identity not? Surely object identity, in particular, should be relevant to real-world interpretations and inputs of these visual routines? Is color simply too weak an identity? 

      We agree that it would be beneficial to have mechanisms in place that are specific for certain object identities. Overall, our results fit very well to established claims that only spatiotemporal parameters mediate the perception of causality (Michotte, 1963; Leslie, 1984; Scholl & Tremoulet, 2000). We have now explicitly listed these references again in the revised manuscript. It is important to note, that an understanding of a causal relation could suffice to track identity information based purely on spatiotemporal contingencies, neglecting distinguishing surface features.

      We revised the manuscript and state:

      “Our findings therefore provide additional support for the claim that an event’s spatiotemporal parameters mediate the perception of causality (Michotte, 1963; Leslie, 1984; Scholl & Tremoulet, 2000).”

      Moreover, we think our findings of directional selectivity have functional relevance. First, direction-selective detection of collisions allows for an adaptation that occurs separately for each direction. That means that the visual system can calibrate these visual routines for detecting causal interactions in response to real-world statistics that reflect differences in directions. For instance, due to gravity, objects will simply fall to the ground. Causal relation such as launches are likely to be more frequent in horizontal directions, along a stable ground. Second, we think that causal visual events are action-relevant, that is, acting on (potentially) causal events promises an advantage (e.g., avoiding a collision, or quickly catching an object that has been pushed away). The faster we can detect such causal interactions, the faster we can react to them. Direction-selective motion signals are available in the first stages of visual processing. Visual routines that are based on these direction-selective motion signals promise to enable such fast computations. Please note, however, that while our present findings demonstrate direction-selectivity, they do not pinpoint where exactly that visual routine is located. It is quite possible that the visual routine is located higher up in the visual system, relying on a direction-selective population response as input.

      We added these points to the discussion of the functional relevance: 

      “We suggest that at least two functional benefits result from a specialized visual routine for detecting causality. First, a direction-selective detection of launches allows adaptation to occur separately for each direction. That means that the visual system can automatically calibrate the sensitivity of these visual routines in response to real-world statistics. For instance, while falling objects drop vertically towards the ground, causal relations such as launches are common in horizontal directions moving along a stable ground. Second, we think that causal visual events are action-relevant, and the faster we can detect such causal interactions, the faster we can react to them. Direction-selective motion signals are available very early on in the visual system. Visual routines that are based on these direction-selective motion signals may enable faster detection. While our present findings demonstrate direction-selectivity, they do not pinpoint where exactly that visual routine is located. It is possible that the visual routine is located higher up in the visual system (or distributed across multiple levels), relying on a direction-selective population response as input.”

      Reviewer #3 (Recommendations for the authors):

      - The concept of "visual routines" is used without introduction; for a general-interest audience it might be good to include a definition and reference(s) (e.g. Ullman.). 

      Thank you very much for highlighting that point. We have chosen the term visual routine to emphasize that we locate the part of the mechanism that is affected by the adaptation in our experiments in the visual system, but at the same time it leaves space regarding the extent to which the mechanism further involves mid- and higher-level processes. The term thus has a clear reference to a visual routine by Ullman (1987). We have now addressed what we mean by visual routine, and we also included the reference in the revised manuscript.

      We add the following footnote to the introduction:

      “We use the term visual routine here to highlight that our adaptation experiments can reveal a causality detection mechanism that resides in the visual system. At the same time, calling it a routine emphasizes similarities with a local, semi-independent operation (e.g., the recognition of familiar motion patterns; see also Ullman, 1987; Cavanagh, Labianca, & Thornton, 2001) that can engage mid- and higher-level processes (e.g., during causal capture, Scholl & Nakayama, 2002; or multisensory integration, Körding et al., 2007).”

      - I would appreciate slightly more description of the phenomenology of the WW adaptors: is this Michotte's "entraining" event? Does it look like one disc shunts the other?  

      The stimulus differs from Michotte's entrainment event in both spatiotemporal parameters and phenomenology. We added videos for the launch, pass and slip events as Supplementary Material.

      Moreover, we described the slip event in the methods section:

      “In two additional sessions, we presented slip events as adaptors to control that the adaptation was specific for the impression of causality in the launching events. Slip events are designed to match the launching events in as many physical properties as possible while producing a very different, non-causal phenomenology. In slip events, the first peripheral disc also moves towards a stationary disc. In contrast to launching events, however, the first disc passes the stationary disc and stops only when it is adjacent to the opposite edge of the stationary disc. While slip events do not elicit a causal impression, they have the same number of objects and motion onsets, the same motion direction and speed, as well as the same spatial area of the event as launches.”

      In the revised manuscript, we added also more information on the slip event in the beginning of the results section. Importantly, the stimulus typically produces the impression of two independent movements and thus serves as a non-causal control condition in our study. Only anecdotally, some observers (not involved in this study) who saw the stimulus spontaneously described their phenomenology of seeing a slip event as a double step or a discus throw.

      We added the following description to the results section:

      “Moreover, we compared the visual adaptation to launches to a (non-causal) control condition in which we presented slip events as adaptor. In a slip event, the initially moving disc passes completely over the stationary disc, stops immediately on the other side, and then the initially stationary disc begins to move in the same direction without delay. Thus, the two movements are presented consecutively without a temporal gap. This stimulus typically produces the impression of two independent (non-causal) movements.”

      - In general more illustrations of the different conditions (similar to Figure 1c but for the different experimental conditions and adaptors) might be helpful for skim readers.  

      We followed the reviewer’s recommendation and added a visualization of the adaptor and the test events for the different experiments in Figure 2.

      - Were the luminances of the red and green balls in experiment 3 matched? Were participants checked for color anomalous vision?  

      Yes, we checked for color anomalous vision using the color test Tafeln zur Prüfung des Farbensinnes/Farbensehens (Kuchenbecker & Broschmann, 2016). We added that information to the manuscript. The red and green discs were not matched for luminance. We measured the luminance after the experiment (21 cd/m<sup>2</sup> for the green disc and 6 cd/m<sup>2</sup> for the red disc). Please note, that the differences in luminance should not pose a problem for the interpretation of the results, as we see a transfer of the adaptation across the two different colors.

      We added the following information to the manuscript:

      “The red and green discs were not matched for luminance. Measurements obtained after the experiments yielded a luminance of 21 cd/m<sup>2</sup> for the green disc and 6 cd/m<sup>2</sup> for the red disc.”

      “All observers had normal or corrected-to-normal vision and color vision as assessed using the color test Tafeln zur Prüfung des Farbensinnes/Farbensehens (Kuchenbecker & Broschmann, 2016).”

      - Relationship of this work to the paper by Arnold et al., (2015). That paper suggested that some effects of adaptation of launching events could be explained by an adaptation of object shape, not by causality per se. It is superficially difficult to see how one could explain the present results from the perspective of object "squishiness" -- why would this be direction selective? In other words, the present results taken at face value call the "squishiness" explanation into question. The authors could consider an explanation to reconcile these findings in their discussion. 

      Indeed, the paper by Arnold and colleagues (2014) suggested that a contact-launch adaptor could lead to a squishiness aftereffect—arguing that the object elasticity changed in response to the adaptation.  Importantly, the same study found an object-centered adaptation effect rather than a retinotopic adaptation effect. However, the retinotopic nature of the negative aftereffect as used in our study has been repeatedly replicated (for instance Kominsky & Scholl, 2020). Thus, the divergent results of Arnold and colleagues may have resulted from differences in the task (i.e., observers had to judge whether they perceived a soft vs. hard bounce), or the stimuli (i.e., bounces of a disc and a wedge, and the discs moving on a circular trajectory). It would be important to replicate these results first and then determine whether their squishiness effect would be direction-selective as well. We now acknowledge the study by Arnold and colleagues in the discussion:

      “The adaptation of causality is spatially specific to the retinotopic coordinates of the adapting stimulus (Kominsky & Scholl, 2020; Rolfs et al., 2013; for an object-centered elasiticity aftereffect using a related stimulus on a circular motion path, see Arnold et al., 2015), suggesting that the detection of causal interactions is implemented locally in visual space.”

      - Line 32: "showing that a specialized visual routine for launching events exists even within separate motion direction channels". This doesn't necessarily mean the routine is within each separate direction channel, only that the output of the mechanism depends on the population response over motion direction. The critical motion computation could be quite high level -- e.g. global pattern motion in MST. Please clarify the claim. 

      We agree with the reviewer, that it is also possible that critical parts of the visual routine could simply use the aggregated population response over motion direction at higher-levels of processing. We acknowledge this possibility in the discussion of the functional relevance of the proposed mechanism and when suggesting that a distributed brain network may contribute to the perception of causality.

      We would like to highlight the following two revised paragraphs.

      “[…] Second, we think that causal visual events are action-relevant, and the faster we can detect such causal interactions, the faster we can react to them. Direction-selective motion signals are available very early on in the visual system. Visual routines that are based on these direction-selective motion signals may enable faster detection. While our present findings demonstrate direction-selectivity, they do not pinpoint where exactly that visual routine is located. It is possible that the visual routine is located higher up in the visual system (or distributed across multiple levels), relying on a direction-selective population response as input.”

      Moreover, when discussing the neurophysiological literature we write:

      “Interestingly, single cell recordings in area F5 of the primate brain revealed that motor areas are contributing to the perception of causality (Caggiano et al., 2016; Rolfs, 2016), emphasizing the distributed nature of the computations underlying causal interactions. This finding also stresses that the detection, and the prediction, of causality is essential for processes outside purely sensory systems (e.g., for understanding other’s actions, for navigating, and for avoiding collisions).”

      -  p. 10 line 30: typo "particual".  

      Done.

      -  p. 10 line 37: "This findings rules out (...)" should be singular "This finding rules out (...)". 

      Done.

      -  Spelling error throughout: "underly" should be "underlie". 

      Done.

      -  p.11 line 29: "emerges fast and automatic" should be "automatically". 

      Done.

    1. Author response:

      The following is the authors’ response to the original reviews.

      Public Reviews:

      Reviewer 1:

      Weaknesses:

      The authors do not discuss based on genomic information; the genomes of the cichlids from the three lakes have been decoded and are therefore available. However, indeed, the species in Lake Tanganyika and Lake Malawi/Victoria are genetically distant from each other, so a comparative genome analysis would not have yielded the results presented here. I recommend adding such a discussion to the Discussion.

      We appreciate your comment. We added the discussion regarding the genomic aspect of parallel evolution.

      Line 386-393: “From a genomic perspective, several studies have investigated the genetic basis of hypertrophied lip cichlids (Masonick et al., 2023; Nakamura et al., 2021). Importantly, some Wnt pathway-related genes (tcf4 and daam2) and ECM-related genes (postna, col12a1a, and col12a1b) have been found to be under positive selection in cichlids with hypertrophied lips of Lake Victoria (see Nakamura et al., 2021 Table S3). For future research, examining whether these genes are under selection in other lakes is crucial to understand the genetic mechanisms underlying the parallel evolution of hypertrophied lips.”

      Minor comments:

      Line 30, the Wnt --> the genes in Wnt

      We appreciate your comment. According to the comment, we corrected the sentence.

      Line 30: “the Wnt signaling pathway” -> “the genes in Wnt signaling pathway”

      Line 42-44, "It is considered that the same direction of natural selection drives phenotypic changes among species since it is unlikely that these complex phenotypes have been acquired repeatedly just by neutral evolution". How about "Since it is unlikely that such a complex phenotype was acquired repeatedly by neutral evolution alone, the same direction of natural selection among species is likely to drive the parallel phenotypic change."?

      We agree with your suggestion and correct the sentence of our manuscript.

      Line 42-44: “It is considered that the same direction of natural selection drives phenotypic changes among species since it is unlikely that these complex phenotypes have been acquired repeatedly just by neutral evolution”

      “Since it is unlikely that such a complex phenotype was acquired repeatedly by neutral evolution alone, the same direction of natural selection among species is likely to drive the parallel phenotypic change”

      Line 60, polygenic --> likely to be polygenic

      We appreciate your comment. Indeed, it is better to weaken the wording.

      Line 60: “most traits are polygenic” -> “most traits are likely to be polygenic”

      Line 91, the Wnt --> the genes in Wnt

      We appreciate your correction. Last paragraph of introduction has been corrected according to the suggestion of Reviewer 2 (Q1).

      Line 230, NovaSeq --> Illumina NovaSeq

      We appreciate your correction.

      Line 222: “NovaSeq 6000” -> “Illumina NovaSeq 6000”

      Line 231 "mRNA Library Prep Kit". Please add a company name.

      We appreciate your correction. We added company’s information.

      Line 223: “a TruSeq stranded mRNA Library Prep Kit.” -> “a TruSeq stranded mRNA Library Prep Kit (Illumina)”

      Line 267, as for the tip of hypertrophied lips, could you add and point out which part is the tip?

      We dissected hypertrophied lips in two half anterior and half posterior. We added the sentence in the materials and methods section.

      Line 156-158: “The lips of H. chilotes were analyzed separately for the base and tip.” -> “The lips of H. chilotes were dissected in two half anterior (tip) and half posterior (base), which are analyzed separately.”

      Line 272, "133 proteins upregulated and 5 proteins downregulated" in hypertrophied lip or normal lip?

      We appreciate your correction. We added the sentence as follows.

      Line 264: “133 proteins upregulated and 5 proteins downregulated”

      “133 proteins upregulated and 5 proteins downregulated in the hypertrophied lip”

      Line 274, "hypertrophied lips" means tip of hypertrophied lips?

      We appreciate your correction. We corrected the sentence as follows.

      Line 266: “hypertrophied lips are abundant” -> “tip of hypertrophied lips is abundant”

      Line 277, Did you perform multiple testing correction for statistical significance?

      We appreciate your comment about multiple testing corrections. We did not apply multiple testing corrections in our “exploratory” analysis of proteomics not to miss biologically important candidates in a limited sample size (n=3). We calculated the multiple corrected p-value in the Benjamini Hochberg method (Author response image 1, right). The result suggested that almost the same proteoglycans and its related proteins as we focused on are highly accumulated in the hypertrophied lips in milder conditions (significance level of 0.1).

      Author response image 1.

      Thus, our main conclusions remain unchanged even with correction applied, however, the overall balance of the volcano plot is not visually appealing (Author response image 1, right).

      It is important to note that we selected the Top 20 proteins based on fold change rather than statistical significance. In addition, our proteomic findings show consistency with our histological and transcriptome data, providing the biological validation from various aspects. While we understand the potential benefits of multiple testing correction, our current approach without multiple testing still offers valuable and fair data to propose hypothesis on the molecular mechanisms of lip hypertrophy in cichlids. Therefore, we want to use original figure without multiple testing. We greatly appreciate the understanding of the reviewer.

      Line 349-351, "The results of the enrichment analysis suggested that the genes that were categorized into both canonical and non-canonical Wnt signaling pathways, were highly expressed in the hypertrophied lips of juvenile and adult cichlids."

      The wnt category was enriched by analyzing the highly expressed genes, so isn't it natural that the wnt category is highly expressed?

      Did you mean to say as in the following sentence?

      "Enrichment of genes categorized in the canonical and noncanonical Wnt signaling pathways suggested that high expression of genes in the Wnt signaling pathway is likely to be involved in the hypertrophied lips of juvenile and adult fish."

      Thank you for your comments. We corrected our manuscript as follows.

      Line 341-344: “The results of the enrichment analysis suggested that the genes that were categorized into both canonical and non-canonical Wnt signaling pathways, were highly expressed in the hypertrophied lips of juvenile and adult cichlids.”

      “As a result of enrichment analysis, DEGs were categorized in the canonical and noncanonical Wnt signaling pathways, suggesting that high expression of genes in the Wnt signaling pathway is likely to be involved in the hypertrophied lips of juvenile and adult fish.”

      Line 403-404, "several other pathways may be involved in the development of hypertrophied lips". Do you have any evidence?

      We appreciate your comment regarding possible evidence for the involvement of multiple pathways in hypertrophied lip development. Our statement was based on two main points:

      (1) While we highlighted the Wnt pathway because this pathway is known to increase proteoglycan expression, we cannot exclude the possibility of the involvement of other pathways. For instance, our enrichment analysis in adult cichlids identified VEGF-related pathways, which could contribute to lip hypertrophy by increasing vascularization and nutrient supply to the lip tissue.

      (2) Previous quantitative trait locus (QTL) analysis by Henning et al. (2017) concluded that lip hypertrophy is likely influenced by numerous loci with small additive effects. This indicates that lip hypertrophy is a complex phenotype consisted of multiple genetic factors, some which probably correspond to different molecular pathways.

      Given these points, we draw a conclusion that emphasize the importance of Wnt pathway while also recognizing the potential cooperative interaction of multiple pathways in developing lip hypertrophy. Without confusing the two statements, we corrected our manuscript as follows.

      Line 398-412: “We uncovered the apparent relationships between hypertrophied lips and the expression profiles of ECM proteins, in particularly proteoglycans. The trends for the overall expression of ECM-related genes were similar across hypertrophied lip species, but we rarely observed a specific gene that was commonly expressed at high or low levels in all three examples of hypertrophied lips across all East African Great Lakes. Furthermore, although we focused primarily on the relationship between the Wnt signaling pathway and lip hypertrophy, several other pathways may be involved in the development of hypertrophied lips. These findings imply that although enlargement of proteoglycan-rich loose connective tissue is common in hypertrophied lips, the developmental pathways to accomplish this are diverse in each lake.”

      “We uncovered the apparent relationships between hypertrophied lips and the expression profiles of ECM proteins, in particularly proteoglycans. The trends for the overall expression of ECM-related genes were similar across hypertrophied lip species, but we rarely observed a specific gene that was commonly expressed at high or low levels in all three examples of hypertrophied lips across all East African Great Lakes. Furthermore, although we focused primarily on the relationship between the Wnt signaling pathway and lip hypertrophy, several other pathways may be involved in the development of hypertrophied lips. For example, our enrichment analysis in adult cichlids identified VEGF-related pathways, which could contribute to lip hypertrophy by increasing vascularization and nutrient supply to the lip tissue. In addition, previous quantitative trait locus (QTL) analysis by Henning et al. (2017) concluded that lip hypertrophy is likely influenced by numerous loci with small additive effects. These lines of data imply that although enlargement of proteoglycan-rich loose connective tissue is common in hypertrophied lips, the developmental pathways to accomplish this are diverse in each lake.”

      Reviewer 2:

      Minor comments:

      Last paragraph of Introduction: Remove the results of this study.

      We appreciate your suggestion. We remove the specialized results from the last paragraph.

      “In this study, we comprehensively compared the hypertrophied lips of cichlids across all East African Great Lakes using histology, proteomics, and transcriptomics. Histological and proteomic analyses revealed a distinct microstructure of hypertrophied lips compared to normal lips, and primary candidate proteins were identified. Transcriptome analysis at different developmental stages showed that the genes in Wnt signaling pathway was highly expressed in cichlids with hypertrophied lips at both the juvenile and adult stages. It is noteworthy that the distinct expression profiles observed in the proteome and transcriptome analyses of hypertrophied lips were similar among cichlids from each of the East African Great Lakes. The present study, which integrates comprehensive analyses for cichlids from all East African Great Lakes, provides insight for a better understanding of the molecular basis of a typical example of parallel evolution.”

      Line 87-91: “In this study, we comprehensively compared the hypertrophied and normal lips of cichlids across all East African Great Lakes at various biological levels using histology, proteomics, and transcriptomics. As a result, we showed that a novel key pathway commonly involved in the formation of hypertrophied lips, providing insight into a better understanding of the molecular basis of a typical example of parallel evolution.”

      Line 156: Italicize the scientific names.

      We appreciate your correction.

      Line 148: “M. zebra and O. niloticus” -> “M. zebra and O. niloticus

      Line 261: Remove the period after "Victoria."

      We appreciate your correction.

      Line 253: “Lake Victoria. (Figure 1; Figure S2).” -> “Lake Victoria (Figure 1; Figure S2).”

      Line 416: Remove the period after "tissue."

      We appreciate your correction.

      Line 420: “tissue. (A,B)” -> “tissue (A,B)”

      Line 646: Probably "the anterior side to the left."

      We apologize for our mistake. As you commented, the anterior side is left. We corrected our manuscript as follows.

      Line 648: “the anterior side to the right” -> “the anterior side to the left”

      Fig. S2: Based on Fig. 1, the VG stained area appears larger in the Hypertrophied lip species; however, it is the opposite in Fig. S2.

      We appreciate your comments. This is because we calculated the ratio of the VG-stained area to the whole lip area. While the absolute VG-stained area is larger in hypertrophied lips, the proportion of the VG-stained area relative to the total lip area is smaller. This correction using entire area allows us to simply compare the degree of lip hypertrophy among species.

    1. Author response:

      Public Reviews:

      Reviewer #1 (Public review):

      Summary:

      The manuscript focuses on the olfactory system of Pieris brassicae larvae and the importance of olfactory information in their interactions with the host plant Brassica oleracea and the major parasitic wasp Cotesia glomerata. The authors used CRISPR/Cas9 to knockout odorant receptor co-receptors (Orco), and conducted a comparative study on the behavior and olfactory system of the mutant and wild-type larvae. The study found that Orco-expressing olfactory sensory neurons in antennae and maxillary palps of Orco knockout (KO) larvae disappeared, and the number of glomeruli in the brain decreased, which impairs the olfactory detection and primary processing in the brain. Orco KO caterpillars show weight loss and loss of preference for optimal food plants; KO larvae also lost weight when attacked by parasitoids with the ovipositor removed, and mortality increased when attacked by untreated parasitoids. On this basis, the authors further studied the responses of caterpillars to volatiles from plants attacked by the larvae of the same species and volatiles from plants on which the caterpillars were themselves attacked by parasitic wasps. Lack of OR-mediated olfactory inputs prevents caterpillars from finding suitable food sources and from choosing spaces free of enemies.

      Strengths:

      The findings help to understand the important role of olfaction in caterpillar feeding and predator avoidance, highlighting the importance of odorant receptor genes in shaping ecological interactions.

      Weaknesses:

      There are the following major concerns:

      (1) Possible non-targeted effects of Orco knockout using CRISPR/Cas9 should be analyzed and evaluated in Materials and Methods and Results.

      Thank you for your suggestion. In the Materials and Methods, we mention how we selected the target region and evaluated potential off-target sites by Exonerate and CHOPCHOP. Neither of these methods found potential off-target sites with a more-than-17-nt alignment identity. Therefore, we assumed no off-target effect in our Orco KO. Furthermore, we did not find any developmental differences between WT and KO caterpillars when these were reared on leaf discs in Petri dishes (Fig S4). We will further highlight this information on the off-target evaluation in the Results section of our revised manuscript.

      (2) Figure 1E: Only one olfactory receptor neuron was marked in WT. There are at least three olfactory sensilla at the top of the maxillary palp. Therefore, to explain the loss of Orco-expressing neurons in the mutant (Figure 1F), a more rigorous explanation of the photo is required.

      Thank you for pointing this out. The figure shows only a qualitative comparison between WT and KO and we did not aim to determine the total number of Orco positive neurons in the maxillary palps or antennae of WT and KO caterpillars, but please see our previous work for the neuron numbers in the caterpillar antennae (Wang et al., 2023). We did indeed find more than one neuron in the maxillary palps, but as these were in very different image planes it was not possible to visualize them together. However, we will add a few sentences in the Results and Discussion section to explain the results of the maxillary palp Orco staining.

      (3) In Figure 1G, H, the four glomeruli are circled by dotted lines: their corresponding relationship between the two figures needs to be further clarified.

      Thank you for pointing this out. The four glomeruli in Figure 1G and 1H are not strictly corresponding. We circled these glomeruli to highlight them, as they are the best visualized and clearly shown in this view. In this study, we only counted the number of glomeruli in both WT and KO, however, we did not clarify which glomeruli are missing in the KO caterpillar brain. We will further explain this in the figure legend.

      (4) Line 130: Since the main topic in this study is the olfactory system of larvae, the experimental results of this part are all about antennal electrophysiological responses, mating frequency, and egg production of female and male adults of wild type and Orco KO mutant, it may be considered to include this part in the supplementary files. It is better to include some data about the olfactory responses of larvae.

      Thank you for your suggestion. We do agree with your suggestion, and we will consider moving this part to the supplementary information. Regarding larval olfactory response, we unfortunately failed to record any spikes using single sensillum recordings due to the difficult nature of the preparation; however, we do believe that this would be an interesting avenue for further research.

      (5) Line 166: The sentences in the text are about the choice test between " healthy plant vs. infested plant", while in Fig 3C, it is "infested plant vs. no plant". The content in the text does not match the figure.

      Thank you for pointing this out. The sentence is “We compared the behaviors of both WT and Orco KO caterpillars in response to clean air, a healthy plant and a caterpillar-infested plant”. We tested these three stimuli in two comparisons: healthy plant vs no plant, infested plant vs no plant. The two comparisons are shown in Figure 3C separately. We will aim to describe this more clearly in the revised version of the manuscript.

      (6) Lines 174-178: Figure 3A showed that the body weight of Orco KO larvae in the absence of parasitic wasps also decreased compared with that of WT. Therefore, in the experiments of Figure 3A and E, the difference in the body weight of Orco KO larvae in the presence or absence of parasitic wasps without ovipositors should also be compared. The current data cannot determine the reduced weight of KO mutant is due to the Orco knockout or the presence of parasitic wasps.

      Thank you for pointing this out. We did not make a comparison between the data of Figures 3A and 3E since the two experiments were not conducted at the same time due to the limited space in our BioSafety Ⅲ greenhouse. We do agree that the weight decrease in Figure 3E is partly due to the reduced caterpillar growth shown in Figure 3A. However, we are confident that the additional decrease in caterpillar weight shown in Figure 3E is mainly driven by the presence of disarmed parasitoids. To be specific, the average weight in Figure 3A is 0.4544 g for WT and 0.4230 g for KO, KO weight is 93.1% of WT caterpillars. While in Figure 3E, the average weight is 0.4273 g for WT and 0.3637 g for KO, KO weight is 85.1% of WT caterpillars. We will discuss this interaction between caterpillar growth and the effect of the parasitoid attacks more extensively in the revised version of the manuscript.

      (7) Lines 179-181: Figure 3F shows that the survival rate of larvae of Orco KO mutant decreased in the presence of parasitic wasps, and the difference in survival rate of larvae of WT and Orco KO mutant in the absence of parasitic wasps should also be compared. The current data cannot determine whether the reduced survival of the KO mutant is due to the Orco knockout or the presence of parasitic wasps.

      We are happy that you highlight this point. When conducting these experiments, we selected groups of caterpillars and carefully placed them on a leaf with minimal disturbance of the caterpillars, which minimized hurting and mortality. We did test the survival of caterpillars in the absence of parasitoid wasps from the experiment presented in Figure 3A, although this was missing from the manuscript. There is no significant difference in the survival rate of caterpillars between the two genotypes in the absence of wasps (average mortality WT = 8.8 %, average mortality KO = 2.9 %; P = 0.088, Wilcoxon test), so the decreased survival rate is most likely due to the attack of the wasps. We will add this information to the revised version of the manuscript.

      (8) In Figure 4B, why do the compounds tested have no volatiles derived from plants? Cruciferous plants have the well-known mustard bomb. In the behavioral experiments, the larvae responses to ITC compounds were not included, which is suggested to be explained in the discussion section.

      Thank you for the suggestion. We assume you mean Figure 4D/4E instead of Figure 4B. In Figure 4B, many of the identified chemical compounds are essentially plant volatiles, especially those from caterpillar frass and caterpillar spit. In Figure 4D/4E, most of the tested chemicals are derived from plants. We did include several ITCs in the butterfly EAG tests shown in figure 2A/B, however because the butterfly antennae did not respond strongly to ITCs, we did not include ITCs in the subsequent larval behavioural tests. Instead, the tested chemicals in Figure 4D/4E either elicit high EAG responses of butterflies or have been identified as significant by VIP scores in the chemical analyses. We will add this explanation to the revised version of our manuscript.

      (9) The custom-made setup and the relevant behavioral experiments in Figure 4C need to be described in detail (Line 545).

      We will add more detailed descriptions for the setup and method in the Materials and Methods.

      (10) Materials and Methods Line 448: 10 μL paraffin oil should be used for negative control.

      Thank you for pointing this out. We used both clean filter paper and clean filter paper with 10 μL paraffin oil as negative controls, but we did not find a significant difference between the two controls. Therefore, in the EAG results of Figure 2A/2B, we presented paraffin oil as one of the tested chemicals. We will re-run our statistical tests with paraffin oil as negative control, although we do not expect any major differences to the previous tests.

      Reviewer #2 (Public review):

      Summary:

      This manuscript investigated the effect of olfactory cues on caterpillar performance and parasitoid avoidance in Pieris brassicae. The authors knocked out Orco to produce caterpillars with significantly reduced olfactory perception. These caterpillars showed reduced performance and increased susceptibility to a parasitoid wasp.

      Strengths:

      This is an impressive piece of work and a well-written manuscript. The authors have used multiple techniques to investigate not only the effect of the loss of olfactory cues on host-parasitoid interactions, but also the mechanisms underlying this.

      Weaknesses:

      (1) I do have one major query regarding this manuscript - I agree that the results of the caterpillar choice tests in a y-maze give weight to the idea that olfactory cues may help them avoid areas with higher numbers of parasitoids. However, the experiments with parasitoids were carried out on a single plant. Given that caterpillars in these experiments were very limited in their potential movement and source of food - how likely is it that avoidance played a role in the results seen from these experiments, as opposed to simply the slower growth of the KO caterpillars extending their period of susceptibility? While the two mechanisms may well both take place in nature - only one suggests a direct role of olfaction in enemy avoidance at this life stage, while the other is an indirect effect, hence the distinction is important.

      We do agree with your comment that both mechanisms may be at work in nature, and we do address this in the Discussion section. In our study, we did find that wildtype caterpillars were more efficient in locating their food source and did grow faster on full plants than knockout caterpillars. This faster growth will enable wildtype caterpillars to more quickly outgrow the life-stages most vulnerable to the parasitoids (L1 and L2). The olfactory system therefore supports the escape from parasitoids indirectly by enhancing feeding efficiency directly.

      In addition, we show in our Y-tube experiments that WT caterpillars were able to avoid plant where conspecifics are under the attack by parasitiods (Figure 3D). Therefore, we speculate that WT caterpillars make use of volatiles from the plant or from conspecifics via their spit or faeces to avoid plants or leaves potentially attracting natural enemies. Knockout caterpillars are unable to use these volatile danger cues and therefore do not avoid plants or leaves that are most attractive to their natural enemies, making KO caterpillars more susceptible and leading to more natural enemy harassment. Through this, olfaction also directly impacts the ability of a caterpillar to find an enemy-free feeding site.

      We think that olfaction supports the enemy avoidance of caterpillars via both these mechanisms, although at different time scales. Unfortunately, our analysis was not detailed enough to discern the relative importance of the two mechanisms we found. However, we feel that this would be an interesting avenue for further research. Moreover, we will sharpen our discussion on the potential importance of the two different mechanisms in the revised version of this manuscript.

      (2) My other issue was determining sample sizes used from the text was sometimes a bit confusing. (This was much clearer from the figures).

      We will revise the sample size in the text to make it clearer.

      (3) I also couldn't find the test statistics for any of the statistical methods in the main text, or in the supplementary materials.

      Thank you for pointing this out. We will provide more detailed test statistics in the main text and in the supplementary materials of the revised version of the manuscript.

    1. Author response:

      The following is the authors’ response to the original reviews.

      Reviewer 1:

      Summary:

      This paper describes molecular dynamics simulations (MDS) of the dynamics of two T-cell receptors (TCRs) bound to the same major histocompatibility complex molecule loaded with the same peptide (pMHC). The two TCRs (A6 and B7) bind to the pMHC with similar affinity and kinetics, but employ different residue contacts. The main purpose of the study is to quantify via MDS the differences in the inter- and intra-molecular motions of these complexes, with a specific focus on what the authors describe as catch-bond behavior between the TCRs and pMHC, which could explain how T-cells can discriminate between different peptides in the presence of weak separating force.

      Strengths:

      The authors present extensive simulation data that indicates that, in both complexes, the number of high-occupancy interdomain contacts initially increases with applied load, which is generally consistent with the authors’ conclusion that both complexes exhibit catch-bond behavior, although to different extents. In this way, the paper somewhat expands our understanding of peptide discrimination by T-cells.

      a. The reviewer makes thoughtful assessment of our manuscript. While our manuscript is meant to be a “short” contribution, our significant new finding is that even for TCRs targeting the same pMHC, having similar structures, and leading to similar functional outcomes in conventional assays, their response to applied load can be different. This supports out recent experimental work where TCRs targeting the same pMHC differed in their catch bond characteristics, and importantly, in their response to limiting copy numbers of pMHCs on the antigen-presenting cell (Akitsu et al., Sci. Adv., 2024).

      Weaknesses:

      While generally well supported by data, the conclusions would nevertheless benefit from a more concise presentation of information in the figures, as well as from suggesting experimentally testable predictions.

      b. We have updated all figures for clear and streamlined presentation. We have also created four figure supplements to cover more details.

      Regarding testable predictions, an important prediction is that B7 TCR would exhibit a weaker catch bond behavior than A6 (line 297–298). This is a nontrivial prediction because the two TCRs targeting the same pMHC have similar structures and are functionally similar in conventional assays. This prediction can be tested by singlemolecule optical tweezers experiments. Based on our recent experiments Akitsu et al., Sci. Adv. (2024), we also predict that A6 and B7 TCRs will differ in their ability to respond to cases when the number of pMHC molecules presented are limited. Details of how they would differ require further investigation, which is beyond the scope of the present work (line 314-319).

      Another testable prediction for the conservation of the basic allostery mechanism is to test the Cβ FG-loop deletion mutant located at the hinge region of the β chain, where the deletion severely impairs the catch bond formation (line 261–264).

      Reviewer 2:

      In this work, Chang-Gonzalez and coworkers follow up on an earlier study on the force-dependence of peptide recognition by a T-cell receptor using all-atom molecular dynamics simulations. In this study, they compare the results of pulling on a TCR-pMHC complex between two different TCRs with the same peptide. A goal of the paper is to determine whether the newly studied B7 TCR has the same load-dependent behavior mechanism shown in the earlier study for A6 TCR. The primary result is that while the unloaded interaction strength is similar, A6 exhibits more force stabilization.

      This is a detailed study, and establishing the difference between these two systems with and without applied force may establish them as a good reference setup for others who want to study mechanobiological processes if the data were made available, and could give additional molecular details for T-Cell-specialists. As written, the paper contains an overwhelming amount of details and it is difficult (for me) to ascertain which parts to focus on and which results point to the overall take-away messages they wish to convey.

      R2-a. As mentioned above and as the reviewer correctly pointed out, the condensed appearance of this manuscript arose largely because we intended it to be a Research Advances article as a short follow up study of our previous paper on A6 TCR published in eLife. Most of the analysis scripts for the A6 TCR study are already available on Github. For the present manuscript, we have created a separate Github repository containing sample simulation systems and scripts for the B7 TCR.

      Regarding the focus issue, it is in part due to the complex nature of the problem, which required simulations under different conditions and multi-faceted analyses. We believe the extensive updates to the figures and texts make clearer and improved presentation. But we note that even in the earlier version, the reviewer pointed out the main take-away message well: “The primary result is that while the unloaded interaction strength is similar, A6 exhibits more force stabilization.

      Detailed comments:

      (1) In Table 1 - are the values of the extension column the deviation from the average length at zero force (that is what I would term extension) or is it the distance between anchor points (which is what I would assume based on the large values. If the latter, I suggest changing the heading, and then also reporting the average extension with an asterisk indicating no extensional restraints were applied for B7-0, or just listing 0 load in the load column. Standard deviation in this value can also be reported. If it is an extension as I would define it, then I think B7-0 should indicate extension = 0+/- something. The distance between anchor points could also be labeled in Figure 1A.

      R2-b. “Extension” is the distance between anchor points that the reviewer is referring to (blue spheres at the ends of the added strands in Figure 1A). While its meaning should be clear in the section “Laddered extensions” in “MD simulation protocol” (line 357–390), in a strict sense, we agree that using it for the end-to-end distance can be confusing. However, since we have already used it in our previous two papers (Hwang et al., PNAS 2020 and Chang-Gonzalez et al., eLife, 2024), we prefer to keep it for consistency. Instead, in the caption of Table 1, we explained its meaning, and also explicitly labeled it in Figure 1A, as the reviewer suggested.

      Please also note that the no-load case B7<sup>0</sup> was performed by separately building a TCR-pMHC complex without added linkers (line 352), and holding the distal part of pMHC (the α3 domain) with weak harmonic restraints (line 406–408). Thus, no extension can be assigned to B7<sup>0</sup>. We added a brief explanation about holding the MHC α3 domain for B7<sup>0</sup> in line 83–85.

      (2) As in the previous paper, the authors apply ”constant force” by scanning to find a particular bond distance at which a desired force is selected, rather than simply applying a constant force. I find this approach less desirable unless there is experimental evidence suggesting the pMHC and TCR were forced to be a particular distance apart when forces are applied. It is relatively trivial to apply constant forces, so in general, I would suggest this would have been a reasonable comparison. Line 243-245 speculates that there is a difference in catch bonding behavior that could be inferred because lower force occurs at larger extensions, but I do not believe this hypothesis can be fully justified and could be due to other differences in the complex.

      R2-c. There is indeed experimental evidence that the TCR-pMHC complex operates under constant separation. The spacing between a T-cell and an antigen-presenting cell is maintained by adhesion molecules such as the CD2CD58 pair, as explained in our paper on the A6 TCR Chang-Gonzalez et al., eLife, 2024 and also in our previous review paper Reinherz et al., PNAS, 2023. In in vitro single-molecule experiments, pulling to a fixed separation and holding is also commonly done. We added an explanation about this in line 79–83 of the manuscript. On the other hand, force between a T cell and and antigen-presenting cell is also controlled by the actin cytoskeleton, which make the applied load not a simple function of the separation between the two cells. An explanation about this was added in line 300–303. Detailed comparison between constant extension vs. constant force simulations is definitely a subject of our future study.

      Regarding line 243–245 of the original submission (line 297–298 of the revised manuscript), we agree with the reviewer that without further tests, lower forces at larger extensions per se cannot be an indicator that B7 forms a weaker catch bond. But with additional information, one can see it does have relevance to the catch bond strength. In addition to fewer TCR-pMHC contacts (Figure 1C of our manuscript), the intra-TCR contacts are also reduced compared to those of A6 (bottom panel of Figure 1D vs. Chang-Gonzalez et al., eLife, 2024, Figure 8A,B, first column). Based on these data, we calculated the average total intra-TCR contact occupancies in the 500–1000-ns interval, which was 30.4±0.49 (average±std) for B7 and 38.7±0.87 for A6. This result shows that the B7 TCR forms a looser complex with pMHC compared to A6. Also, B7<sup>low</sup> and B7<sup>high</sup> differ in extension by 16.3 ˚A while A6<sup>low</sup> and A6<sup>high</sup> differ by 5.1 ˚A, for similar ∼5-pN difference between low- and high-load cases. With the higher compliance of B7, it would be more difficult to achieve load-induced stabilization of the TCR-pMHC interface, hence a weaker catch bond. We explained this in line 129–132 and line 292–297.

      (3) On a related note, the authors do not refer to or consider other works using MD to study force-stabilized interactions (e.g. for catch bonding systems), e.g. these cases where constant force is applied and enhanced sampling techniques are used to assess the impact of that applied force: https://www.cell.com/biophysj/fulltext/S0006-3495(23)00341-7, https://www.biorxiv.org/content/10.1101/2024.10.10.617580v1. I was also surprised not to see this paper on catch bonding in pMHC-TCR referred to, which also includes some MD simulations: https://www.nature.com/articles/s41467-023-38267-1

      R2-d. We thank the reviewer for bringing the three papers to our attention, which are:

      (1) Languin-Catto¨en, Sterpone, and Stirnemann, Biophys. J. 122:2744 (2023): About bacterial adhesion protein FimH.

      (2) Pen˜a Ccoa, et al., bioRxiv (2024): About actin binding protein vinculin.

      (3) Choi et al., Nat. Comm. 14:2616 (2023): About a mathematical model of the TCR catch bond.

      Catch bond mechanisms of FimH and vinculin are different from that of TCR in that FimH and vinculin have relatively well-defined weak- and strong-binding states where there are corresponding crystal structures. Availability of the end-state structures permits simulation approaches such as enhanced sampling of individual states and studying the transition between the two states. In contrast, TCR does not have any structurally well-defined weak- or strong-binding states, which requires a different approach. As demonstrated in our current manuscript as well as in our previous two papers (Hwang et al., PNAS 2020 and Chang-Gonzalez et al., eLife, 2024), our microsecond-long simulations of the complex under realistic pN-level loads and a combination of analysis methods are effective for elucidating the catch bond mechanism of TCR. These are explained in line 227–238 of the manuscript.

      The third paper (Choi, et al., 2023) proposes a mathematical model to analyze extensive sets of data, and also perform new experiments and additional simulations. Of note, their model assumptions are based mainly on the steered MD (SMD) simulation in their previous paper (Wu, et al., Mol. Cell. 73:1015, 2019). In their model, formation of a catch bond (called catch-slip bond in Choi’s paper) requires partial unfolding of MHC and tilting of the TCR-pMHC interface. Our mechanism does not conflict with their assumptions since the complex in the fully folded state should first bear load in a ligand-dependent manner in order to allow any larger-scale changes. This is explained in line 239–243.

      For the revised text mentioned above (line 227–243), in addition to the 3 papers that the reviewer pointed out, we cited the following papers:

      • Thomas, et al., Annu. Rev. Biophys. 2008: Catch bond mechanisms in general.

      • Bakolitsa et al., Cell 1999, Le Trong et al., Cell 2010, Sauer et al., Nat. Comm. 2016, Mei et al., eLife 2020:

      Crystal structures of FimH and vinculin in different states.

      • Wu, et al., Mol. Cell. 73:1015, 2019: The SMD simulation paper mentioned above.

      (4) The authors should make at least the input files for their system available in a public place (github, zenodo) so that the systems are a more useful reference system as mentioned above. The authors do not have a data availability statement, which I believe is required.

      R2-d. As mentioned in R2-a above, we have added a Github repository containing sample simulation systems and scripts for the B7 TCR.

      Reviewer 3:

      Summary:

      The paper by Chang-Gonzalez et al. is a molecular dynamics (MD) simulation study of the dynamic recognition (load-induced catch bond) by the T cell receptor (TCR) of the complex of peptide antigen (p) and the major histocompatibility complex (pMHC) protein. The methods and simulation protocols are essentially identical to those employed in a previous study by the same group (Chang-Gonzalez et al., eLife 2024). In the current manuscript, the authors compare the binding of the same pMHC to two different TCRs, B7 and A6 which was investigated in the previous paper. While the binding is more stable for both TCRs under load (of about 10-15 pN) than in the absence of load, the main difference is that, with the current MD sampling, B7 shows a smaller amount of stable contacts with the pMHC than A6.

      Strengths:

      The topic is interesting because of the (potential) relevance of mechanosensing in biological processes including cellular immunology.

      Weaknesses:

      The study is incomplete because the claims are based on a single 1000-ns simulation at each value of the load and thus some of the results might be marred by insufficient sampling, i.e., statistical error. After the first 600 ns, the higher load of B7<sup>high</sup> than B7<sup>low</sup> is due mainly to the simulation segment from about 900 ns to 1000 ns (Figure 1D). Thus, the difference in the average value of the load is within their standard deviation (9 +/- 4 pN for B7<sup>low</sup> and 14.5 +/- 7.2 for B7<sup>high</sup>, Table 1). Even more strikingly, Figure 3E shows a lack of convergence in the time series of the distance between the V-module and pMHC, particularly for B7<sup>0</sup> (left panel, yellow) and B7<sup>low</sup> (right panel, orange). More and longer simulations are required to obtain a statistically relevant sampling of the relative position and orientation of the V-module and pMHC.

      R3-a. The reviewer uses data points during the last 100 ns to raise an issue with sampling. But since we are using realistic pN range forces, force fluctuates more slowly. In fact, in our simulation of B7<sup>high</sup>, while the force peaks near 35 pN at 500 ns (Figure 1D of our manuscript), the interfacial contacts show no noticeable changes around 500 ns (Figure 2B and Figure 2–figure supplement 1C of our manuscript). Similarly slow fluctuation of force was also observed for A6 TCR (Figure 8 of Chang-Gonzalez et al., eLife (2024)). Thus, a wider time window must be considered rather than focusing on forces in the last 100-ns interval.

      To compare fluctuation in forces, we added Figure 1–figure supplement 2, which is based on Appendix 3–Figure 1 of our A6 paper. It shows the standard deviation in force versus the average force during 500–1000 ns interval for various simulations in both A6 (open black circles) and B7 (red squares) systems. Except for Y8A<sup>low</sup> and dFG<sup>low</sup> of A6 (explained below), the data points lie on nearly a straight line.

      Thermodynamically, the force and position of the restraint (blue spheres in Figure 1A of our manuscript) form a pair of generalized force and the corresponding spatial variable in equilibrium at temperature 300 K, which is akin to the pressure P and volume V of an ideal gas. If V is fixed, P fluctuates. Denoting the average and std of pressure as ⟨P⟩ and ∆P, respectively, Burgess showed that ∆P/P⟩ is a constant (Eq. 5 of Burgess, Phys. Lett. A, 44:37; 1973). In the case of the TCRαβ-pMHC system, although individual atoms are not ideal gases, since their motion leads to the fluctuation in force on the restraints, the situation is analogous to the case where pressure arises from individual ideal gas molecules hitting the confining wall as the restraint. Thus, the near-linear behavior in the figure above is a consequence of the system being many-bodied and at constant temperature. The linearity is also an indicator that sampling of force was reasonable in the 500–1000-ns interval. The fact that A6 and B7 data show a common linear profile further demonstrates the consistency in our force measurement. About the two outliers of A6, Y8A<sup>low</sup> is for an antagonist peptide and dFG<sup>low</sup> is the Cβ FG-loop deletion mutant. Both cases had reduced numbers of contacts with pMHC, which likely caused a wider conformational motion, hence greater fluctuation in force.

      Upon suggestion by the reviewer, we extended the simulations of B7<sup>0</sup>, B7<sup>low</sup> and B7<sup>high</sup> to about 1500 ns (Table 1). While B7<sup>0</sup> and B7<sup>low</sup> behaved similarly, B7<sup>high</sup> started to lose contacts at around 1300 ns (top panel of Figure 1D and Figure 2B). A closer inspection revealed that destabilization occurred when the complex reached low-force states. Even before 1300 ns, at about 750 ns, the force on B7<sup>high</sup> drops below 5 pN, and another drop in force occurred at around 1250 ns, though to a lesser extent (Figure 1D). These changes are followed by increase in the Hamming distance (Figure 2B). Thus, in B7<sup>high</sup>, destabilization is caused not by a high force, but by a lack of force, which is consistent with the overarching theme of our work, the load-induced stabilization of the TCRαβ-pMHC complex.

      The destabilization of B7<sup>high</sup> during our simulation is a combined effect of its overall weaker interface compared to A6 (despite having comparable number of contacts in crystal structures; line 265–269), and its high compliance (explained in the second paragraph of our response R2-c above). Under a fixed extension, the higher compliance of the complex can reach a low-force state where breakage of contacts can happen. In reality, with an approximately constant spacing between a T cell and an antigen-presenting cell, force is also regulated by the actin cytoskeleton (explained in the first paragraph of R2-c above). While detailed comparison between constant-extension and constant-force simulation is the subject of a future study, for this manuscript, we used the 500–1000-ns interval for calculating time-averaged quantities, for consistency across different simulations. For time-dependent behaviors, we showed the full simulation trajectories, which are Figure 1D, Figure 2B, Figure 2–figure supplement 1 (except for panel E), and Figure 4–figure supplement 1B.

      Thus, rather than performing replicate simulations, we perform multiple simulations under different conditions and analyze them from different angles to obtain a consistent picture. If one were interested in quantitative details under a given condition, e.g., dynamics of contacts for a given extension or the time when destabilization occurs at a given force, replicate simulations would be necessary. However, our main conclusions such as load-induced stabilization of the interface through the asymmetric motion, and B7 forming a weaker complex compared to A6, can be drawn from our extensive analysis across multiple simulations. Please also note that reviewer 1 mentioned that our conclusions are “generally well supported by data.”

      A similar argument applies to Figure 2–figure supplement 1F (old Figure 3B that the reviewer pointed out). If precise values of the V-module to pMHC distance were needed, replicate simulations would be necessary, however, the figure demonstrates that B7<sup>high</sup> maintains more stable interface before the disruption at 1300 ns compared to B7<sup>low</sup>, which is consistent with all other measures of interfacial stability we used. The above points are explained throughout our updated manuscript, including

      • Line 106–110, 125–132, 156–158, 298–303.

      • Figures showing time-dependent behaviors have been updated and Figure 1–figure supplement 2 has been added, as explained above.

      It is not clear why ”a 10 A distance restraint between alphaT218 and betaA259 was applied” (section MD simulation protocol, page 9).

      R3-b. αT218 and β_A259 are the residues attached to a leucine-zipper handle in _in vitro optical trap experiments (Das, et al., PNAS 2015). In T cells, those residues also connect to transmembrane helices. Our newly added Figure 1–figure supplement 1 shows a model of N15 TCR used in experiments in Das’ paper, constructed based on PDB 1NFD. Blue spheres represent C<sub>α</sub> atoms corresponding to αT218 and βA259 of B7 TCR. Their distance is 6.7 ˚A. The 10-˚A distance restraint in simulation was applied to mimic the presence of the leucine zipper that prevents excessive separation of the added strands. The distance restraint is a flatbottom harmonic potential which is activated only when the distance between the two atoms exceeds 10 ˚A, which we did not clarify in our original manuscript. It is now explained in line 371–373. The same restraint was used in our previous studies on JM22 and A6 TCRs.

      Recommendations for the authors:

      Reviewer #1 (Recommendations for the authors):

      (1) Clarify the reason for including arguably non-physiological simulations, in which the C domain is missing. Is the overall point that it is essential for proper peptide discrimination?

      R1-c. This is somewhat a philosophical question. Rather than recapitulating experiment, we believe the goal of simulation is to gain insight. Hence, a model should be justified by its utility rather than its direct physiological relevance. The system lacking the C-module is useful since it informs about the allosteric role of the C-module by comparing its behavior with that of the full TCRαβ-pMHC complex. The increased interfacial stability of Vαβ-pMHC is also consistent with our discovery that the C-module likely undergoes a partial unfolding to an extended state, where the bond lifetime increases (Das, et al., PNAS 2015; Akitsu et al., Sci. Adv., 2024). In this sense, Vαβ-pMHC has a more direct physiological relevance. Furthermore, considering single-chain versions of an antibody lacking the C-module (scFv) are in widespread use (Ahmad et al., J. Immunol. Res., 2012) including CAR T cells, a better understanding of a TCR lacking the C-module may help with developing a novel TCR-based immunotherapy. These explanations have been added in line 253–261.

      (2) Suggest changing Vαβ-pMHC to B7<sup>0</sup>∆C to emphasize that the constant domain is deleted.

      R1-d. While we appreciate the reviewer’s suggestion, the notation Vαβ-pMHC was used in our previous two papers (Hwang, PNAS 2020, Chang-Gonzalez, eLife 2024). We thus prefer to keep the existing notation.

      (3) Suggest adding A6 data to table 1 for comparison, making it clear if it is from a previous paper.

      R1-e. Table 1 of the present manuscript and Table 1 of the A6 paper differ in items displayed. Instead of merging, we added the extension and force for A6 corresponding to B7<sup>low</sup> and B7<sup>high</sup> in the caption of Table 1.

      (4) Suggest discussing the catch-bond behavior in terms of departure from equilibrium, e.g. is it possible to distinguish between different (catch vs slip) bond behaviors on the basis of work of separation histograms? If the difference does not show up in equilibrium work, the exponential work averages would be similar, but work histograms could be very different.

      R1-f. Although energetics of the catch versus slip bond will provide additional insight, it is beyond the scope of the present simulations that do not involve dissociation events nor simulations of slip-bond receptors. We instead briefly mention the energetic aspect in terms of T-cell activation in line 316–319.

      (5) Have the simulations in Figure 1 reached steady state? The force and occupancy increase almost linearly up until 500ns, then seem to decrease rather dramatically by 750ns. It might be worthwhile to extend one simulation to check.

      R1-g. We did extend the simulation to about 1500 ns. The large and slow fluctuation in force is an inherent property of the system, as explained in R3-a above.

      (6) Is the loss of contacts for B7<sup>0</sup> due to thermalization and relaxation away from the X-ray structure?

      R1-h. The initial thermalization at 300 K is not responsible for the loss of contacts for B7<sup>0</sup> since we applied distance restraints to the initial contacts to keep them from breaking during the preparatory runs (line 358–370). While ‘relaxation away from the X-ray structure’ gives an impression that the complex approaches an equilibrium conformation in the absence of the crystallographic confinement, our simulation indicates that the stability of the complex depends on the applied load. We made the distinction between relaxation and the load-dependent stability clearer in line 233–238.

      (7) Figure 4 contains a very large amount of data. Could it be simplified and partly moved to SI? For example, panel G is somewhat hard to read at this scale, and seems non-essential to the general reader.

      R1-i. Upon the reviewer’s suggestion, we simplified Figure 4 by moving some of the panels to Figure 4–figure supplement 1. Panels have also been made larger for better readability.

      (8) If the coupling between C and V domains is necessary for catch-bond behavior, can one propose mutations that would disrupt the interface to test by experiment? This would be interesting in light of the authors’ own comment on p. 8 that ’a logical evolutionary pressure would be for the C domains to maximize discriminatory power by adding instability to the TCR chassis,’ which might lead to a verifiable hypothesis.

      R1-j. This has already been computationally and experimentally tested for other TCRs by the Cβ FG-loop deletion mutants that diminish the catch bond (Das, et al., PNAS 2015; Hwang et al., PNAS 2020; ChangGonzalez et al., eLife, 2024). Furthermore, the Vγδ-Cαβ chimera where the C-module of TCRγδ is replaced by that of TCR_αβ_ that strengthens the V-C coupling achieved a gain-of-function catch bond character while the wild-type TCRγδ is a slip-bond receptor (Mallis, et al., PNAS 2021; Bettencourt et al., Biophys. J. 2024). We added our prediction that the FG-loop deletion mutants of B7 TCR will behave similarly in line 261–264.

      (9) Regarding extending TCR and MHC termini using native sequences, as described in the methods, what would be the disadvantage of using the same sequence, which could be made much more rigid, e.g. a poly-Pro sequence? After all, the point seems to be applying a roughly constant force, but flexible/disordered linkers seem likely to increase force fluctuation.

      R1-k. The purpose of adding linkers was to allow a certain degree of longitudinal and transverse motion as would occur in vivo. While it will be worthwhile to explore the effects of linker flexibility on the conformational dynamics of the complex, for the present study, we used the actual sequence for the linkers for those proteins (line 341–344).

      Reviewer #2 (Recommendations for the authors):

      (1) Figure 2 is almost illegible, especially Figure 2A-D. I do not think that these contacts vs time would be useful to anyone except for someone interested in this particular pMHC interaction, so I would suggest moving it to a supporting figure and making it much larger.

      R2-e. Thanks for the suggestion. We created Figure 2–figure supplement 1 and made panels larger for clearer presentation.

      (2) Figure 4 is overwhelming, and does not convey any particular message.

      R2-f. This is the same comment as reviewer 1’s comment (7) above. Please see our response R1-i.

      Reviewer #3 (Recommendations for the authors):

      (1) The label ”beta2m” in Figure 1A should be moved closer to the beta2 microglobulin domain. A label TCR should be added to Figure 1A.

      R3-c. Thanks for pointing out about β2m. We have corrected it. About putting the label ‘TCR,’ to avoid cluttering, we explained that Vα, Vβ, Cα, and Cβ are the 4 subdomains of TCR in the caption of Figure 1A.

      (2) Hydrogen atoms should be removed from the peptide in Figure 1B.

      R3-d. We have removed the hydrogen atoms.

      (3) The authors should consider moving Figures 1 A-D to the SI and show a simpler description of the contact occupancy than the heat maps. The legend of Figure 2A-D is too small.

      R3-e. By ‘Figures 1 A-D’ we believe the reviewer meant Figure 2A–D. This is the same comment as reviewer 2’s comment (1). Please see our response R2-e above.

      (4) Vertical (dashed) lines should be added to Figure 3E at 500 ns to emphasize the segment of the time series used for the histograms.

      R3-f. We added vertical lines in figures showing time-dependent behaviors, which are Figure 1D, Figure 2B, Figure 2–figure supplement 1F, and Figure 4–figure supplement 1B.

    1. Author response:

      The following is the authors’ response to the original reviews.

      Public Reviews:

      Summary:

      The authors examine the eigenvalue spectrum of the covariance matrix of neural recordings in the whole-brain larval zebrafish during hunting and spontaneous behavior. They find that the spectrum is approximately power law, and, more importantly, exhibits scale-invariance under random subsampling of neurons. This property is not exhibited by conventional models of covariance spectra, motivating the introduction of the Euclidean random matrix model. The authors show that this tractable model captures the scale invariance they observe. They also examine the effects of subsampling based on anatomical location or functional relationships. Finally, they briefly discuss the benefit of neural codes which can be subsampled without significant loss of information.

      Strengths:

      With large-scale neural recordings becoming increasingly common, neuroscientists are faced with the question: how should we analyze them? To address that question, this paper proposes the Euclidean random matrix model, which embeds neurons randomly in an abstract feature space. This model is analytically tractable and matches two nontrivial features of the covariance matrix: approximate power law scaling, and invariance under subsampling. It thus introduces an important conceptual and technical advance for understanding large-scale simultaneously recorded neural activity.

      Weaknesses:

      The downside of using summary statistics is that they can be hard to interpret. Often the finding of scale invariance, and approximate power law behavior, points to something interesting. But here caution is in order: for instance, most critical phenomena in neural activity have been explained by relatively simple models that have very little to do with computation (Aitchison et al., PLoS CB 12:e1005110, 2016; Morrell et al., eLife 12, RP89337, 2024). Whether the same holds for the properties found here remains an open question.

      We are grateful for the thorough and constructive feedback provided on our manuscript. We have addressed each point raised by you.

      Regarding the main concern about power law behavior and scale invariance, we would like to clarify that our study does not aim to establish criticality. Instead, we focus on describing and understanding a specific scale-invariant property in terms of collapsed eigenspectra in neural activity. We tested Morrell et al.’s latent-variable model (eLife 12, RP89337, 2024, [1]), where a slowly varying latent factor drives population activity. Although it produces a seemingly power-law-like spectrum, random sampling does not replicate the strict spectral collapse observed in our data (second row in Fig. S23). This highlights that simply adding latent factors does not fully recapitulate the scale invariance we measure, suggesting richer or more intricate processes may be involved in real neural recordings.

      Specifically, we have incorporated five key revisions.

      • As mentioned, we evaluated the latent variable model proposed by Morrell et al., and found that they fail to reproduce the scale-invariant eigenspectra observed in our data; these results are now presented in the Discussion section and supported by a new Supplementary Figure (Fig. S23).

      • We included a comparison with the findings of Manley et al. (2024 [2]) regarding the issue of saturating dimension in the Discussion section, highlighting the methodological differences and their implications.

      • We added a new mathematical derivation in the Methods section, elucidating the bounded dimensionality using the spectral properties of our model. • We have added a sentence in the Discussion section to further emphasize the robustness of our findings by demonstrating their consistency across diverse datasets and experimental techniques.

      • We have incorporated a brief discussion on the implications for neural coding (lines 330-332). In particular, Fisher information can become unbounded when the slope of the power-law rank plot is less than one, as highlighted in the recent work by Moosavi et al. (bioRxiv 2024.08.23.608710, Aug, 2024 [3]).

      We believe these revisions address the concerns raised during the review process and collectively strengthen our manuscript to provides a more comprehensive and robust understanding of the geometry and dimensionality of brain-wide activity. We appreciate your consideration of our revised manuscript and look forward to your feedback.

      Recommendations for the authors:

      In particular, in our experience replies to the reviewers are getting longer than the paper, and we (and I’m sure you!) want to avoid that. Maybe just reply explicitly to the ones you disagree with? We’re pretty flexible on our end.

      (1) The main weakness, from our point of view, is whether the finding of scale invariance means something interesting, or should be expected from a null model. We can suggest such model; if it is inconsistent with the data, that would make the results far more interesting.

      Morrell et al. (eLife 12, RP89337,2024 [1]) suggest a very simple model in which the whole population is driven by a slowly time-varying quantity. It would be nice to determine whether it matched this data. If it couldn’t, that would add some evidence that there is something interesting going on.

      We appreciate your insightful suggestion to consider the model proposed by Morrell et al. (eLife 12, RP89337, 2024 [1]), where a slowly time-varying quantity drives the entire neural population. We conducted simulations using parameters from Morrell et al. [4, 1], as detailed below.

      Our simulations show that Morrell’s model can replicate a degree of scaleinvariance when using functional sampling or RG as referred to in Morrell et al, 2021, PRL [4] (FSap, Fig.S23A-D, Author response image 1). However, it fails to fully capture the scale-invariance of collapsing spectra we observed in data under random sampling (RSap, Fig.S23E-H). This discrepancy suggests that additional dynamics or structures in the neural activity are not captured by this simple model, indicating the presence of potentially novel and interesting features in the data that merit further investigation.

      Unlike random sampling, the collapse of eigenspectra under functional sampling does not require a stringent condition on the kernel function f(x) in our ERM theory (see Discussion line 269-275), potentially explaining the differing results between Fig.S23A-D and Fig.S23E-H.

      We have incorporated these findings into the Result section 2.1 (lines 100-101) and Discussion section (lines 277-282, quoted below):

      “Morrell et al. [4, 1] suggested a simple model in which a slow time-varying factor influences the entire neural population. To explore the effects of latent variables, we assessed if this model explains the scale invariance in our data. The model posits that neural activity is primarily driven by a few shared latent factors. Simulations showed that the resulting eigenspectra differed considerably from our findings (Fig. S23). Although the Morrell model demonstrated a degree of scale invariance under functional sampling, it did not align with the scale-invariant features under random sampling observed in our data, suggesting that this simple model might not capture all crucial features in our observations.”

      Author response image 1:

      Morrell’s latent model. A: We reproduce the results as presented in Morrell et al., PRL 126(11), 118302 (2021) [4]. Parameters are same as Fig. S23A. Sampled 16 to 256 neurons. Unlike in our study, the mean eigenvalues are not normalized to one. Dashed line: eigenvalues fitted to a power law. See also Morrell et al. [4] Fig.1C. Parameters are same as Author response image 1. µ is the power law exponent (black) of the fit, which is different from the µ parameter used to characterize the slow decay of the spatial correlation function, but corresponds to the parameter α in our study.

      (2) The quantification of the degree of scale invariance is done using a ”collapse index” (CI), which could be better explained/motivated. The fact that the measure is computed only for the non-leading eigenvalues makes sense but it is not clear when originally introduced. How does this measure compare to other measures of the distance between distributions?

      We thank you for raising this important point regarding the explanation and motivation for our Collapse Index (CI). We defined the Collapse Index (CI) instead of other measures of distance between distributions for two main reasons. First, the CI provides an intuitive quantification of the shift of the eigenspectrum motivated by our high-density theory for the ERM model (Eq. 3, Fig. 4A). This high-density theory is only valid for large eigenvalues excluding the leading ones, and hence we compute the CI measure with a similar restriction of the range of area integration. Second, when using distribution to assess the collapse (e.g., we can use kernel density method to estimate the distribution of eigenvalues and then calculate the KL divergence between the two distributions), it is necessary to first estimate the distributions. This estimation step introduces errors, such as inaccuracies in estimating the probability of large eigenvalues.

      We agree that a clearer explanation would enhance the manuscript and thus have made modifications accordingly. The CI is now introduced more clearly in the Results section (lines 145-148) and further detailed in the Methods section (lines 630-636). We have also revised the CI diagram in Fig. 4A to better illustrate the shift concept using a more intuitive cartoon representation.

      (3) The paper focuses on the case in which the dimensionality saturates to a finite value as the number of recorded neurons is increased. It would be useful to contrast with a case in which this does not occur. The paper would be strengthened by a comparison with Manley et al. 2024, which argued that, unlike this study, dimensionality of activity in spontaneously behaving head-fixed mice did not saturate.

      Thank you for highlighting this comparison. We have included a discussion (lines 303-309) comparing our approach with Manley et al. (2024) [2]. While Manley et al. [2] primarily used shared variance component analysis (SVCA) to estimate neural dimensionality, they observed that using PCA led to dimensionality saturation (see Figure S4D, Manley et al. [2]), consistent with our findings (Fig. 2D). We acknowledge the value of SVCA as an alternative approach and agree that it is an interesting avenue for future research. In our study, we chose to use PCA for several reasons. PCA is a well-established and widely trusted method in the neuroscience community, with a proven track record of revealing meaningful patterns in neural data. Its mathematical properties are well understood, making it particularly suitable for our theoretical analysis. While we appreciate the insights that newer methods like SVCA can provide, we believe PCA remains the most appropriate tool for addressing our specific research questions.

      (4) More importantly, we don’t understand why dimensionality saturates. For the rank plot given in Eq. 3,

      where k is rank. Using this, one can estimate sums over eigenvalues by integrals. Focusing on the N-dependence, we have

      This gives

      We don’t think you ever told us what mu/d was (see point 13 below), but in the discussion you implied that it was around 1/2 (line 249). In that case, D<sub>PR</sub> should be approximately linear in N. Could you explain why it isn’t?

      Thank you for your careful derivation. Along this line of calculations you suggested, we have now added derivations on using the ERM spectrum to estimate the upper bound of the dimension in the Methods (section 4.14.4). To deduce D<sub>PR</sub> from the spectrum, we focus on the high-density region, where an analytical expression for large eigenvalues λ is given by:

      Here, d is dimension of functional space, L is the linear size of functional space, ρ is the neuron density and γ is the coefficient in Eq. (3), which only depends on d, µ and E(σ<sup>2</sup>). The primary difference between your derivation and ours is that the eigenvalue λ<sub>r</sub> decays rapidly after the threshold r \= β(N), which significantly affects the summations and . Since we did not discuss the small eigenvalues in the article, we represent them here as an unknown function η(r,N,L).

      The sum is the trace of the covariance matrix C. As emphasized in the Methods section, without changing the properties the covariance spectrum, we always consider a normalized covariance matrix such that the mean neural activity variance E(σ<sup>2</sup>) = 1. Thus

      rather than

      The issue stems from overlooking that Eq. (3) is valid only for large eigenvalues (λ > 1).

      Using the Cauchy–Schwarz inequality, we have a upper bound of

      Conversely, provides a lower bound of :

      As a result, we must have

      In random sampling (RSap), L is fixed. We thus must have a bounded dimensionality that is independent of N for our ERM model. In functional sampling (FSap), L varies while the neuronal density ρ is fixed, leading to a different scaling relationship of the upper bound, see Methods (section 4.14.4) for further discussion.

      (5) The authors work directly with ROIs rather than attempting to separate the signals from each neuron in an ROI. It would be worth discussing whether this has a significant effect on the results.

      We appreciate your thoughtful question on the potential impact of using ROIs. The use of ROIs likely does not impact our key findings since they are validated across multiple datasets with various recording techniques and animal models, from zebrafish calcium imaging to mouse brain multi-electrode recordings (see Figure S2, S24). The consistency of the scale-invariant covariance spectrum in diverse datasets suggests that ROIs in zebrafish data do not significantly alter the conclusions, and they together enhance the generalizability of our results. We highlight this in the Discussion section (lines 319-323).

      (6) Does the Euclidean random matrix model allow the authors to infer the value of D or µ? Since the measured observables only depend on µ/D it seems that one cannot infer the latent dimension where distances between neurons are computed. Are there any experiments that one could, in principle, perform to measure D or mu? Currently the conclusion from the model and data is that D/µ is a large number so that the spectrum is independent of neuron density rho. What about the heterogeneity of the scales σ<sub>i</sub>, can this be constrained by data?

      Measuring d and µ in the ERM Model

      We agree with you that the individual values of d and µ cannot be determined separately from our analysis. In our analysis using the Euclidean Random Matrix (ERM) model, we fit the ratio µ/d, rather than the individual values of d (dimension of the functional space) or µ (exponent of the distance-dependent kernel function). This limitation is inherent because the model’s predictions for observable quantities, such as the distribution of pairwise correlation, are dependent solely on this ratio.

      Currently there are no directly targeted experiments to measure d. The dimensions of the functional space is largely a theoretical construct: it could serve to represent latent variables encoding cognitive factors that are distributed throughout the brain or specific sensory or motor feature maps within a particular brain region. It may also be viewed as the embedding space to describe functional connectivity between neurons. Thus, a direct experimental measurement of the dimensions of the functional space could be challenging. Although there are variations in the biological interpretation of the functional space, the consistent scale invariance observed across various brain regions indicates that the neuronal relationships within the functional space can be described by a uniform slowly decaying kernel function.

      Regarding the Heterogeneity of σ<sub>i</sub>

      The heterogeneity of neuronal activity variances ( σ<sub>i</sub>) is a critical factor in our analysis. Our findings indicate that this heterogeneity:

      (1) Enhances scale invariance: The covariance matrix spectrum, which incorporates the heterogeneity of , exhibits stronger scale invariance compared to the correlation matrix spectrum, which imposes for all neurons. This observation is supported by both experimental data and theoretical predictions from the ERM model, particularly in the intermediate density regime.

      (2) Can be constrained by data: We fit a log-normal distribution to the experimentally observed σ<sup>2</sup> values to capture the heterogeneity in our model which leads to excellent agreement with data (section 4.8.1). Figure S10 provides evidence for this by directly comparing the eigenspectra obtained from experimental data (Fig S10A-F) with those generated by the fitted ERM model (Fig S10M-R). These results suggest that the data provides valuable information about the distribution of neuronal activity variances.

      In conclusion, the ERM model and our analysis cannot separately determine d and µ. We also highlight that the neuronal activity variance heterogeneity, constrained by experimental data, plays a crucial role in improving the scale invariance.

      (7) Does the fitting procedure for the positions x in the latent space recover a ground truth in your statistical regime (for the number of recorded neurons)? Suppose you sampled some neurons from a Euclidean random matrix theory. Does the MDS technique the authors use recover the correct distances?

      While sampling neurons from a Euclidean random matrix model, we demonstrated numerically that the MDS technique can accurately recover the true distances, provided that the true parameter f(x) is known. To quantify the precision of recovery, we applied the CCA analysis (Section 4.9) and compared the true coordinates from the original Euclidean random matrix with the fitted coordinates obtained through our MDS procedure. The CCA correlation between the true and fitted coordinates in each spatial dimension is nearly 1 (the difference from 1 is less than 10<sup>−7</sup>). When fitting with experimental data, one source of error arises from parameter estimation. To evaluate this, we assess the estimation error of the fitted parameters. When we choose µ \= 0_.5 in our ERM model and then fit the distribution of the pairwise correlation (Eq. 21), the estimated parameter is = 0.503 ± 0._007 (standard deviation). Then, we use the MDS-recovered distances to fit the coordinates with the fitted kernel function , which is determined by the fitted parameter . The CCA correlation between the true and fitted coordinates in each direction remains nearly 1 (the difference from 1 is less than 10<sup>−5</sup>).

      (8) l. 49: ”... both the dimensionality and covariance spectrum remain invariant ...”. Just to be clear, if the spectrum is invariant, then the dimensionality automatically is too. Correct?

      Thanks for the question. In fact, there is no direct causal relationship between eigenvalue spectrum invariance and dimensionality invariance as we elaborate below and added discussions in lines 311-317. For eigenvalue spectrum invariance, we focus on the large eigenvalues, whereas dimensionality invariance considers the second order statistics of all eigenvalues. Consequently, the invariance results for these two concepts may differ. And dimensional and spectral invariance have different requirements:

      (1) The condition for dimensional saturation is finite mean square covariance

      The participation ratio D<sub>PR</sub> for random sampling (RSap) is given by Eq. 5:

      This expression becomes invariant as N → ∞ if the mean square covariance is finite. In contrast, neural dynamics models, such as the balanced excitatory-inhibitory (E-I) neural network [5], exhibit a different behavior, where , leading to unbounded dimensionality (see discussion lines 291-295, section 6.9 in SI).

      (2) The requirements for spectral invariance involving the kernel function

      In our Euclidean Random Matrix (ERM) model, the eigenvalue distribution follows:

      For spectral invariance to emerge: (1) The eigenvalue distribution must remain unchanged after sampling. (2) Since sampling reduces the neuronal density ρ. (3) The ratio µ/d must approach 0 to maintain invariance.

      We can also demonstrate that D<sub>PR</sub> is independent of density ρ in the large N limit (see the answer of question 4).

      In conclusion, there is no causal relationship between spectral invariance and dimensionality invariance. This is also the reason why we need to consider both properties separately in our analysis.

      (9) In Eq. 1, the exact expression, which includes i=j, isn’t a lot harder than the one with i=j excluded. So why i≠j?

      The choice is for illustration purposes. In Eq. 1, we wanted to demonstrate that the dimension saturates to a value independent of N. When dividing the numerator and denominator of this expression by N<sup>2</sup>, the term is independent of the neuron number N, but the term associated with the diagonal entries is of order O(1_/N_) and can be ignored for large N.

      (10) Fig. 2D: Could you explain where the theory line comes from?

      We first estimate ] from all neurons, and then compute D<sub>PR</sub> for different neuron numbers N using Eq.5 (). This is further clarified in lines 511-512.

      (11) l 94-5: ”It [scale invariance] is also absent when replacing the neural covariance matrix eigenvectors with random ones, keeping the eigenvalues identical (Fig. 2H).” If eigenvalues are identical, why does the spectrum change?

      The eigenspectra of the covariance matrices in full size are the same by construction, but the eigenspectra of the sampled covariance matrices are different because the eigenvectors affect the sampling results. Please also refer to the construction process described in section 4.3 where this is also discussed: “The composite covariance matrix with substituted eigenvectors in (Fig. 2H) was created as described in the following steps. First, we generated a random orthogonal matrix U<sub>r<.sup> (based on the Haar measure) for the new eigenvectors. This was achieved by QR decomposition A=U<sub>r</sub>R of a random matrix A with i.i.d. entries A<sub>ij</sub> ∼ N(0_,1/N_). The composite covariance matrix C<sub>r</sub> was then defined as, where Λ is a diagonal matrix that contains the eigenvalues of C. Note that since all the eigenvalues are real and U<sub>r</sub> is orthogonal, the resulting C<sub>r</sub> is a real and symmetric matrix. By construction, C<sub>r</sub> and C have the same eigenvalues, but their sampled eigenspectra can differ.”

      (12) Eq 3: There’s no dependence on the distribution of sigma. Is that correct?

      Indeed, this is true in the high-density regime when the neuron density ρ is large. The p(λ) depends only on E(σ<sup>2</sup>) rather than the distribution of σ (see Eq. 8). However, in the intermediate density regime, p(λ) depends on the distribution of σ (see Eq.9 and Eq.10). In our analysis, we consider E(σ<sup>4</sup>) as a measure of heterogeneity.

      (13) Please tell us the best fit values of µ/d.

      This information now is added in the figure caption of Fig S10: µ/d \= [0_.456,0.258,0.205,0.262,0.302,0._308] in fish 1-6.

      (14) l 133: ”The eigenspectrum is rho-independent whenever µ/d ≈ 0.”

      It looks to me like rho sets the scale but not the shape. Correct? If so, why do we care about the overall scale – isn’t it the shape that’s important?

      Yes, our study focuses on the overall scale not only the shape, because many models, such as the ERM with other kernel functions, random RNNs, Morrell’s latent model [4, 1], can exhibit a power-law spectrum. However, these models do not exhibit scale-invariance in terms of spectrum curve collapsing. Therefore, considering the overall scale reveal additional non-trivial phenomenon.

      (15) Figs. 3 and 4: Are the grey dots the same as in previous figures? Either way, please specify what they are in the figure caption.

      Yes, they are the same, and thank you for pointing it out. It has been specified in the figure caption now.

      (16) Fig. 4B: Top is correlation matrix, bottom is covariance matrix, correct? If so, that should be explicit. If not, it should be clear what the plots are.

      That is correct. Both matrices (correlation - top, covariance - bottom) are labeled in the figure caption and plot (text in the lower left corner).

      (17) l 158: ”First, the shape of the kernel function f(x) over a small distance ...”. What does ”over a small distance” mean?

      We thank you for seeking clarification on this point. We understand that the phrase ”over a small distance” could be made clearer. We made a revised explanation in lines 164-165 Here, “over a small distance” refers to modifications of the particular kernel function f(x) we use Eq. 11 near x \= 0 in the functional space, while preserving the overall power-law decay at larger distances. The t-distribution based f(x) (Eq. 11) has a natural parameter ϵ that describes the transition to near 0. So we modified f(x) in different ways, all within this interval of |x| ≤ ϵ, and considered different values of ϵ. Table S3 and Figure S7 provide a summary of these modifications. Figure S7 visually compares these modifications to the standard power-law kernel function, highlighting the differences in shape near x \= 0.

      Our findings indicate that these alterations to the kernel function at small distances do not significantly affect the distribution of large eigenvalues in the covariance spectrum. This supports our conclusion that the large eigenvalues are primarily determined by the slow decay of the kernel function at larger distances in the functional space, as this characteristic governs the overall correlations in neural activity.

      (18) l390 . This x<sub>i</sub> is, we believe, different from the x<sub>i</sub> which is position in feature space. Given the difficulty of this paper, it doesn’t help to use the same symbol to mean two different things. But maybe we’re wrong?

      Thank you for your careful reading and suggestion. Indeed here x<sub>i</sub> was representing activity rather than feature space position. We have thus revised the notation (Line 390 has been updated to line 439 as well.):

      In this revised notation: a<sub>i</sub>(t) represents the neural activity of neuron i at time t (typically the firing rate we infer from calcium imaging). is simply the mean activity of neuron i across time. Meanwhile, we’ll keep x<sub>i</sub> exclusively for denoting positions in the functional space.

      This change should make it much easier to distinguish between neural activity measurements and spatial coordinates in the functional space.

      (19) Eq. 19: is it correct that g(u) is not normalized to 1? If so, does that matter?

      It is correct that the approximation of g(u) is not normalized to 1, as Eq. 19 provides an approximation suitable only for small pairwise distances (i.e., large correlation). Therefore, we believe this does not pose an issue. We have newly added this note in lines 691-693.

      (20) I get a different answer in Eq. 20:

      Whereas in Eq. 20,

      µ

      Which is correct?

      Thank you for your careful derivation. We believe the difference arises in the calculation of g(u).In our calculations:

      ,

      (Your first equation seems to missed an 1_/µ_ in R’s exponent.)

      ,

      That is, Eq. 20 is correct. From these, we obtain

      rather than

      We hope this clarifies the question.

      (21) I’m not sure we fully understand the CCA analysis. First, our guess as to what you did: After sampling (either Asap or Fsap), you used ERM to embed the neurons in a 2-D space, and then applied canonical correlation analysis (CCA). Is that correct? If so, it would be nice if that were more clear.

      We first used ERM to embed all the neurons in a 2-D functional space, before any sampling. Once we have the embedding, we can quantify how similar the functional coordinates are with the anatomical coordinates using R<sub>CCA</sub> (section 2.4). We can then use the anatomical and functional coordinates to perform ASap and FSap, respectively. Our theory in section 2.4 predicts the effect on dimension under these samplings given the value of R<sub>CCA</sub> estimated earlier (Fig. 5D). The detailed description of the CCA analysis is in section 4.9, where we explain how CCA is used to find the axes in both anatomical and functional spaces that maximize the correlation between projections of neuron coordinates.

      As to how you sampled under Fsap, I could not figure that out – even after reading supplementary information. A clearer explanation would be very helpful.

      Thank you for your feedback. Functional sampling (FSap) entails the expansion of regions of interest (ROIs) within the functional space, as illustrated in Figure 5A, concurrently with the calculation of the covariance matrix for all neurons contained within the ROI. Technically, we implemented the sampling using the RG approach [6], which is further elaborated in Section 4.12 (lines 852-899), quoted below.

      Stage (i): Iterative Clustering We begin with N</sub>0</sub> neurons, where N</sub>0</sub> is assumed to be a power of 2. In the first iteration, we compute Pearson’s correlation coefficients for all neuron pairs. We then search greedily for the most correlated pairs and group the half pairs with the highest correlation into the first cluster; the remaining neurons form the second cluster. For each pair (a,b), we define a coarse-grained variable according to:

      ,

      Where normalizes the average to ensure unit nonzero activity. This process reduces the number of neurons to N<sub>1</sub> = N<sub>0</sub>/2. In subsequent iterations, we continue grouping the most correlated pairs of the coarse-grained neurons, iteratively reducing the number of neurons by half at each step. This process continues until the desired level of coarse-graining is achieved.

      When applying the RG approach to ERM, instead of combining neural activity, we merge correlation matrices to traverse different scales. During the _k_th iteration, we compute the coarse-grained covariance as:

      and the variance as:

      Following these calculations, we normalize the coarse-grained covariance matrix to ensure that all variances are equal to one. Note that these coarse-grained covariances are only used in stage (i) and not used to calculate the spectrum.

      Stage (ii): Eigenspectrum Calculation The calculation of eigenspectra at different scales proceeds through three sequential steps. First, for each cluster identified in Stage (i), we compute the covariance matrix using the original firing rates of neurons within that cluster (not the coarse-grained activities). Second, we calculate the eigenspectrum for each cluster. Finally, we average these eigenspectra across all clusters at a given iteration level to obtain the representative eigenspectrum for that scale.

      In stage (ii), we calculate the eigenspectra of the sub-covariance matrices across different cluster sizes as described in [6]. Let N<sub>0</sub> = 2<sup>n</sub> be the original number of neurons. To reduce it to size N \= N<sub>0</sub>/2<sup>k</sup> = 2<sup>n-k</sup>, where k is the kth reduction step, consider the coarse-grained neurons in step nk in stage (i). Each coarse-grained neuron is a cluster of 2<sup>n-k</sup> neurons. We then calculate spectrum of the block of the original covariance matrix corresponding to neurons of each cluster (there are 2<sup>k</sup> such blocks). Lastly, an average of these 2<sup>k</sup> spectra is computed.

      For example, when reducing from N<sub>0</sub> = 2<sup>3</sup> = 8 to N \= 2<sup>3−1</sup> = 4 neurons (k \= 1), we would have two clusters of 4 neurons each. We calculate the eigenspectrum for each 4x4 block of the original covariance matrix, then average these two spectra together. To better understand this process through a concrete example, consider a hypothetical scenario where a set of eight neurons, labeled 1,2,3,...,7,8, are subjected to a two-step clustering procedure. In the first step, neurons are grouped based on their maximum correlation pairs, for example, resulting in the formation of four pairs: {1,2},{3,4},{5,6}, and {7,8} (see Fig. S22). Subsequently, the neurons are further grouped into two clusters based on the results of the RG step mentioned above. Specifically, if the correlation between the coarse-grained variables of the pair {1,2} and the pair {3,4} is found to be the largest among all other pairs of coarse-grained variables, the first group consists of neurons {1,2,3,4}, while the second group contains neurons {5,6,7,8}. Next, take the size of the cluster N = 4 for example. The eigenspectra of the covariance matrices of the four neurons within each cluster are computed. This results in two eigenspectra, one for each cluster. The correlation matrices used to compute the eigenspectra of different sizes do not involve coarse-grained neurons. It is the real neurons 1,2,3,...,7,8, but with expanding cluster sizes. Finally, the average of the eigenspectra of the two clusters is calculated.

      (22) Line 37: ”even if two cell assemblies have the same D<sub>PR</sub>, they can have different shapes.” What is meant by shape here isn’t clear.

      Thank you for pointing out this potential ambiguity. The “shape” here refers to the geometric configuration of the neural activity space characterized as a highdimensional ellipsoid by the covariance. Specifically, if we denote the eigenvalues of the covariance matrix as λ<sub>1</sub>,λ<sub>2</sub>,...,λ<sub>N</sub>, then corresponds to the length of the i-th semi-axis of this ellipsoid (Figure 1B). As shown in Figure 1C, two neural populations with the same dimensionality (D<sub>PR</sub> = 25/11 ≈ 2.27) exhibit different eigenvalue spectra, leading to differently shaped ellipsoids. This clarification is now included in lines 39-40.

      (23) Please discuss if any information about the latent dimension or kernel function can be inferred from the measurements.

      Same as comment(6): we would like to clarify that in our analysis using the Euclidean Random Matrix (ERM) model, we fit the ratio µ/d, rather than the individual values of d (dimension of the functional space) or µ (exponent of the distancedependent kernel function). This limitation is inherent because the model’s predictions for observable quantities, such as the eigenvalue spectrum of the covariance matrix, are dependent solely on this ratio.

      For the kernel function, once the d is chosen, we can infer the general shape of the kernel function from data (Figs S12 and S13), up to a certain extent (see also lines 164-166). In particular, we can compare the eigenspectrum of the simulation results for different kernel functions with the eigenspectrum of our data. This allows us to qualitatively exclude certain kernel functions, such as the exponential and Gaussian kernels (Fig. S4), which show clear differences from our data.

      References

      (1) M. C. Morrell, I. Nemenman, A. Sederberg, Neural criticality from effective latent variables. eLife 12, RP89337 (2024).

      (2) J. Manley, S. Lu, K. Barber, J. Demas, H. Kim, D. Meyer, F. M. Traub, A. Vaziri, Simultaneous, cortex-wide dynamics of up to 1 million neurons reveal unbounded scaling of dimensionality with neuron number. Neuron (2024).

      (3) S. A. Moosavi, S. S. R. Hindupur, H. Shimazaki, Population coding under the scale-invariance of high-dimensional noise (2024).

      (4) M. C. Morrell, A. J. Sederberg, I. Nemenman, Latent dynamical variables produce signatures of spatiotemporal criticality in large biological systems. Physical Review Letters 126, 118302 (2021).

      (5) A. Renart, J. De La Rocha, P. Bartho, L. Hollender, N. Parga, A. Reyes, K. D. Harris, The asynchronous state in cortical circuits. science 327, 587–590 (2010).

      (6) L. Meshulam, J. L. Gauthier, C. D. Brody, D. W. Tank, W. Bialek, Coarse graining, fixed points, and scaling in a large population of neurons. Physical Review Letters 123, 178103 (2019).

    1. Author response:

      The following is the authors’ response to the previous reviews

      Reviewer #1 (Public Review):

      Summary:

      This paper explores how diverse forms of inhibition impact firing rates in models for cortical circuits. In particular, the paper studies how the network operating point affects the balance of direct inhibition from SOM inhibitory neurons to pyramidal cells, and disinhibition from SOM inhibitory input to PV inhibitory neurons. This is an important issue as these two inhibitory pathways have largely been studies in isolation. Support for the main conclusions is generally solid, but could be strengthened by additional analyses.

      Strengths

      The paper has improved in revision, and the new intuitive summary statements added to the end of each results section are quite helpful. Weaknesses

      The concern about whether the results hold outside of the range in which neural responses are linear remains. This is particularly true given the discontinuity observed in the stability measure. I appreciate the concern (provided in the response to the first round of reviews) that studying nonlinear networks requires a lot of work. A more limited undertaking would be to test the behavior of a spiking network at a few key points identified by your linearization approach. Such tests could use relatively simple (and perhaps imperfect) measures of gain and stability. This could substantially enhance the paper, regardless of the outcome.

      We appreciate the reviewer’s concern and in our resubmission we explore if networks dynamics that operate outside of the case where linearization is possible would continue to show our main result on the (dis)entanglement of stability and gain; the short answer is yes. To this end we have added a new section and Figure to our main text.

      “Gain and stability in stochastically forced E – PV – SOM circuits

      To confirm that our results do not depend on our approach of a linearization around a fixed point, we numerically simulate similar networks as shown above (Figure 2) in which the E and PV population receive slow varying, large amplitude noise (Figure 6A). This leads to noisy rate dynamics sampling a large subspace of the full firing rate grid (r<sub>E</sub>,r<sub>P</sub>) and thus any linearization would fail to describe the network response. In this stochastically forced network we explore how adding an SOM modulation or a stimulus affects this subspace (Figure 6B). To quantify stability without linearization, we assume that a network is more stable the lower the mean and variance of E rates. This is because very stable networks can better quench input fluctuations [Kanashiro et al., 2017; Hennequin et al., 2018]. To quantify gain, we calculate the change in E rates when adding the stimulus, yet having identical noise realizations for stimulated and non-stimulated networks (Methods).

      For the disinhibitory network without feedback a positive SOM modulation decreases stability due to increases of the mean and variance of E rates (Figure 6Ci) while the network gain increases (Figure 6Cii). As seen before (Figure 2A,B), stability and gain change in opposite directions in a disinhibitory circuit without feedback. Adding feedback PV → SOM and applying a negative SOM modulation increases both, stability and gain and therefore disentangles the inverse relation also in a noisy circuit (Figure 6D-F). This gives numerical support that our results do not depend on the assumption of linearization.

      “Methods: Noisy input and numerical measurement of stability and gain

      We consider a temporally smoothed input process ξ<sub>X</sub> with white noise ζ (zero mean, standard deviation one): for populations X ∈{E,P} with timescale τ<sub>ξ</sub> = 50ms, σ<sub>X</sub> \= 6 and fixed mean input IX. To quantify the stability of the network without linearization, we assume that a network is more stable if the mean and variance of excitatory rates are low. To quantify network gain, we freeze the white noise process ζ for the case of with and without stimulus presentation and calculate the difference of E rates at each time point, leading to a distribution of network gains (Figure 6Cii,Fii). Total simulation time is 1000 seconds.”

      We decided against using a spiking network because sufficiently asynchronous spiking network dynamics can still obey a linearized mean field theory (if the fluctuations in population firing rates are small). In our new analysis the firing rate deviations from the time averaged firing rate are sizable, making a linearization ineffective.

      In summary, based on our additional analysis of recurrent circuits with noisy inputs we conclude that our results also hold in fluctuating networks, without the need of assuming realization aroud a stable fixed point.

      Reviewer #2 (Public Review):

      Summary:

      Bos and colleagues address the important question of how two major inhibitory interneuron classes in the neocortex differentially affect cortical dynamics. They address this question by studying Wilson-Cowan-type mathematical models. Using a linearized fixed point approach, they provide convincing evidence that the existence of multiple interneuron classes can explain the counterintuitive finding that inhibitory modulation can increase the gain of the excitatory cell population while also increasing the stability of the circuit’s state to minor perturbations. This effect depends on the connection strengths within their circuit model, providing valuable guidance as to when and why it arises.

      Overall, I find this study to have substantial merit. I have some suggestions on how to improve the clarity and completeness of the paper.

      Strengths:

      (1) The thorough investigation of how changes in the connectivity structure affect the gain-stability relationship is a major strength of this work. It provides an opportunity to understand when and why gain and stability will or will not both increase together. It also provides a nice bridge to the experimental literature, where different gain-stability relationships are reported from different studies.

      (2) The simplified and abstracted mathematical model has the benefit of facilitating our understanding of this puzzling phenomenon. (I have some suggestions for how the authors could push this understanding further.) It is not easy to find the right balance between biologically-detailed models vs simple but mathematically tractable ones, and I think the authors struck an excellent balance in this study.

      We thank the reviewer for their support of our work.

      Weaknesses:

      (1) The fixed-point analysis has potentially substantial limitations for understanding cortical computations away from the steady-state. I think the authors should have emphasized this limitation more strongly and possibly included some additional analyses to show that their conclusions extend to the chaotic dynamical regimes in which cortical circuits often live.

      In the response to reviewer 1 we have included model analyses that addresses the limitations of linearization. Rather than use a chaotic model, which would require significant effort, we opted for a stochastically forced network, where the sizable fluctuations in rate dynamics preclude linearization.

      (2) The authors could have discussed – even somewhat speculatively – how VIP interneurons fit into this picture. Their absence from this modelling framework stands out as a missed opportunity.

      We agree that including VIP neurons into the framework would be an obvious and potentially interesting next step. At this point we only include them as potential modulators of SOM neurons. Modeling their dynamics without them receiving inputs from E, PV, or SOM neurons would be uninteresting. However, including them properly into the circuit would be outside the scope of the paper.

      (3) The analysis is limited to paths within this simple E, PV, SOM circuit. This misses more extended paths (like thalamocortical loops) that involve interactions between multiple brain areas. Including those paths in the expansion in Eqs. 11-14 (Fig. 1C) may be an important consideration.

      We agree that our pathway expansion can be used to study more than just the E – PV – SOM circuit. However, properly investigating full thalamocortcial loops should be done in a subsequent study.

      Comments on revisions:

      I think the authors have done a reasonable job of responding to my critiques, and the paper is in pretty good shape. (Also, thanks for correctly inferring that I meant VIP interneurons when I had written SST in my review! I have updated the public review accordingly.)

      I still think this line of research would benefit substantially from considering dynamic regimes including chaotic ones. I strongly encourage the authors to consider such an extension in future work.

      Please see our response above to Reviewer 1.

      Reviewer #3 (Public Review):

      Summary:

      Bos et al study a computational model of cortical circuits with excitatory (E) and two subtypes of inhibition parvalbumin (PV) and somatostatin (SOM) expressing interneurons. They perform stability and gain analysis of simplified models with nonlinear transfer functions when SOM neurons are perturbed. Their analysis suggests that in a specific setup of connectivity, instability and gain can be untangled, such that SOM modulation leads to both increases in stability and gain, in contrast to the typical direction in neuronal networks where increased gain results in decreased stability.

      Strengths:

      - Analysis of the canonical circuit in response to SOM perturbations. Through numerical simulations and mathematical analysis, the authors have provided a rather comprehensive picture of how SOM modulation may affect response changes.

      - Shedding light on two opposing circuit motifs involved in the canonical E-PV-SOM circuitry - namely, direct inhibition (SOM -¿ E) vs disinhibition (SOM -¿ PV -¿ E). These two pathways can lead to opposing effects, and it is often difficult to predict which one results from modulating SOM neurons. In simplified circuits, the authors show how these two motifs can emerge and depend on parameters like connection weights.

      - Suggesting potentially interesting consequences for cortical computation. The authors suggest that certain regimes of connectivity may lead to untangling of stability and gain, such that increases in network gain are not compromised by decreasing stability. They also link SOM modulation in different connectivity regimes to versatile computations in visual processing in simple models.

      We thank the reviewer for their support of our work.

      Weaknesses

      Computationally, the analysis is solid, but it’s very similar to previous studies (del Molino et al, 2017). Many studies in the past few years have done the perturbation analysis of a similar circuitry with or without nonlinear transfer functions (some of them listed in the references). This study applies the same framework to SOM perturbations, which is a useful computational analysis, in view of the complexity of the high-dimensional parameter space.

      Link to biology: the most interesting result of the paper with regard to biology is the suggestion of a regime in which gain and stability can be modulated in an unconventional way - however, it is difficult to link the results to biological networks:

      - A general weakness of the paper is a lack of direct comparison to biological parameters or experiments. How different experiments can be reconciled by the results obtained here, and what new circuit mechanisms can be revealed? In its current form, the paper reads as a general suggestion that different combinations of gain modulation and stability can be achieved in a circuit model equipped with many parameters (12 parameters). This is potentially interesting but not surprising, given the high dimensional space of possible dynamical properties. A more interesting result would have been to relate this to biology, by providing reasoning why it might be relevant to certain circuits (and not others), or to provide some predictions or postdictions, which are currently missing in the manuscript.

      - For instance, a nice motivation for the paper at the beginning of the Results section is the different results of SOM modulation in different experiments - especially between L23 (inhibition) and L4 (disinhibition). But no further explanation is provided for why such a difference should exist, in view of their results and the insights obtained from their suggested circuit mechanisms. How the parameters identified for the two regimes correspond to different properties of different layers?

      Please see our answer to the previous round of revision.

      - One of the key assumptions of the model is nonlinear transfer functions for all neuron types. In terms of modelling and computational analysis, a thorough analysis of how and when this is necessary is missing (an analysis similar to what has been attempted in Figure 6 for synaptic weights, but for cellular gains). A discussion of this, along with the former analysis to know which nonlinearities would be necessary for the results, is needed, but currently missing from the study. The nonlinearity is assumed for all subtypes because it seems to be needed to obtain the results, but it’s not clear how the model would behave in the presence or absence of them, and whether they are relevant to biological networks with inhibitory transfer functions.

      Please see our answer to the previous round of revision.

      - Tuning curves are simulated for an individual orientation (same for all), not considering the heterogeneity of neuronal networks with multiple orientation selectivity (and other visual features) - making the model too simplistic.

      Please see our answer to the previous round of revision.

      Reviewer #1 (Recommendations For The Authors):

      Introduction, first paragraph, last sentence: suggest ”sense,” -¿ ”sense” (no comma)

      Introduction, second paragraph, first sentence: suggest ”is been” -¿ ”has been”

      Introduction, very end of next to last paragraph: clarify ”modulate the circuit”

      Figure 1 legend: can you make the ”Change ...” in the legend for 1D clearer - e.g. ”strenghen SOM → E connections and eliminate SOM → P connections”.

      Paragraph immediately below Figure 1: In sentence starting ”Specifically ...” can you relate the cases described here back to the equation in Figure 1C?

      Sentence right below equation 2: This sentence does not separate the network gain from the cellular gain as clearly as it could.

      Page 7, second full paragraph: sentence starting ”Therefore, with ...” could be split into two or otherwise made clearer.

      Sentence starting ”Furthermore” right below Figure 5 has an extra comma

      We thank the reviewer for their additional comments, we made the respective changes in the manuscript.

      Reviewer #3 (Recommendations For The Authors):

      There is a long part in the reply letter discussing the link to biology - but the revised manuscript doesn’t seem to reflect that.

      The information in the reply letter discussing the link to biology has been added at multiple points in the discussion. In the section ‘decision of labor between PV and SOM neurons’ we mention Ferguson and Carding 2020, in the section ‘impact of SOM neuron modulation on tuning curves’ we discuss Phillups and Hasenstaub 2016, and in the section ‘limitations and future directions’ we mention Tobin et al., 2023.

      The writing can be improved - for example, see below instances:

      P. 7: Intuitively, the inverse relationship follows for inhibitory and disinhibitory pathways (and their mixture) because the firing rate grid (heatmap) does not depend on how the SOM neurons inhibit the E - PV circuit.

      P.8: We first remark that by adding feedback E connections onto SOM neurons, changes in SOM rates can now affect the underlying heatmaps in the (rE, rP) grid.

      Not clear how ”rates can affect the heatmaps”. It’s too colloquial and not scientifically rigorous or sound.

      We added further explanations at the respective places in the manuscript to improve the writing.

    1. Author response:

      The following is the authors’ response to the original reviews.

      We thank the editors and the reviewers for their time and constructive comments, which helped us to improve our manuscript “The Hungry Lens: Hunger Shifts Attention and Attribute Weighting in Dietary Choice” substantially. In the following we address the comments in depth:

      R1.1: First, in examining some of the model fits in the supplements, e.g. Figures S9, S10, S12, S13, it looks like the "taste weight" parameter is being constrained below 1. Theoretically, I understand why the authors imposed this constraint, but it might be unfairly penalizing these models. In theory, the taste weight could go above 1 if participants had a negative weight on health. This might occur if there is a negative correlation between attractiveness and health and the taste ratings do not completely account for attractiveness. I would recommend eliminating this constraint on the taste weight.

      We appreciate the reviewer’s suggestion to test a multi-attribute attentional drift-diffusion model (maaDDM) that does not constrain the taste and health weights to the range of 0 and 1. We tested two versions of such a model. First, we removed the phi-transformation, allowing the weight to take on any value (see Author response image 1). The results closely matched those found in the original model. Partially consistent with the reviewer’s comment, the health weight became slightly negative in some individuals in the hungry condition. However, this model had convergence issues with a maximal Rhat of 4.302. Therefore, we decided to run a second model in which we constrained the weights to be between -1 and 2. Again, we obtained effects that matched the ones found in the original model (see Author response image 2), but again we had convergence issues. These convergence issues could arise from the fact that the models become almost unidentifiable, when both attention parameters (theta and phi) as well as the weight parameters are unconstrained.

      Author response image 1.

      Author response image 2.

      R1.2: Second, I'm not sure about the mediation model. Why should hunger change the dwell time on the chosen item? Shouldn't this model instead focus on the dwell time on the tasty option?

      We thank the reviewer for spotting this inconsistency. In our GLMMs and the mediation model, we indeed used the proportion of dwell time on the tasty option as predictors and mediator, respectively. The naming and description of this variable was inconsistent in our manuscript and the supplements. We have now rephrased both consistently.

      R1.3: Third, while I do appreciate the within-participant design, it does raise a small concern about potential demand effects. I think the authors' results would be more compelling if they replicated when only analyzing the first session from each participant. Along similar lines, it would be useful to know whether there was any effect of order.

      R3.2: On the interpretation side, previous work has shown that beliefs about the nourishing and hunger-killing effectiveness of drinks or substances influence subjective and objective markers of hunger, including value-based dietary decision-making, and attentional mechanisms approximated by computational models and the activation of cognitive control regions in the brain. The present study shows differences between the protein shake and a natural history condition (fasted, state). This experimental design, however, cannot rule between alternative interpretations of observed effects. Notably, effects could be due to (a) the drink's active, nourishing ingredients, (b) consuming a drink versus nothing, or (c) both. […]

      R3 Recommendation 1:

      Therefore, I recommend discussing potential confounds due to expectancy or placebo effects on hunger ratings, dietary decision-making, and attention. […] What were verbatim instructions given to the participants about the protein shake and the fasted, hungry condition? Did participants have full knowledge about the study goals (e.g. testing hunger versus satiation)? Adding the instructions to the supplement is insightful for fully harnessing the experimental design and frame.

      Both reviewer 1 and reviewer 3 raise potential demand/ expectancy effects, which we addressed in several ways. First, we have translated and added participants’ instructions to the supplements SOM 6, in which we transparently communicate the two conditions to the participants. Second, we have added a paragraph in the discussion section addressing potential expectancy/demand effects in our design:

      “The present results and supplementary analyses clearly support the two-fold effect of hunger state on the cognitive mechanisms underlying choice. However, we acknowledge potential demand effects arising from the within-subject Protein-shake manipulation. A recent study (Khalid et al., 2024) showed that labeling water to decrease or increase hunger affected participants subsequent hunger ratings and food valuations. For instance, participants expecting the water to decrease hunger showed less wanting for food items. DDM modeling suggested that this placebo manipulation affected both drift rate and starting point. The absence of a starting point effect in our data speaks against any prior bias in participants due to any demand effects. Yet, we cannot rule out that such effects affected the decision-making process, for example by increasing the taste weight (and thus the drift rate) in the hungry condition.”

      Third, we followed Reviewer 1’s suggestion and tested, whether the order of testing affected the results. We did so by adding “order” to the main choice and response time (RT) GLMM. We neither found an effect of order on choice (β<sub>order</sub>=-0.001, SE\=0.163, p<.995), nor on RT (β<sub>order</sub>=0.106, SE\=0.205, p<.603) and the original effects remain stable (see Author response table 1a and Author response table 1 2a below). Further, we used two ANOVAs to compare models with and without the predictor “order”. The ANOVAs indicated that GLMMs without “order” better explained choice and RT (see Author response table 1b and Author response table 2b). Taken together, these results suggest that demand effects played a negligible role in our study.

      Author response table 1.

      a) GLMM: Results of Tasty vs Healthy Choice Given Condition, Attention and Order

      Note. p-values were calculated using Satterthwaites approximations. Model equation: choice ~ condition + scale(_rel_taste_DT) + order + (1+condition|subject);_ rel_taste_DT refers to the relative dwell time on the tasty option; order with hungry/sated as the reference

      b) Model Comparison

      Author response table 2.

      a) GLMM: Response Time Given Condition, Choice, Attention and Order

      Note. p-values were calculated using Satterthwaites approximations. Model equation: RT ~ choice + condition + scale(_rel_taste_DT) + order + choice * scale(rel_taste_DT) (1+condition|subject);_ rel_taste_DT refers to the relative dwell time on the tasty option; order with hungry/sated as the reference

      b) Model Comparison

      R1.4: Fourth, the authors report that tasty choices are faster. Is this a systematic effect, or simply due to the fact that tasty options were generally more attractive? To put this in the context of the DDM, was there a constant in the drift rate, and did this constant favor the tasty option?

      We thank the reviewer for their observant remark about faster tasty choices and potential links to the drift rate. While our starting point models show that there might be a small starting point bias towards the taste boundary, which would result in faster tasty decisions, we took a closer look at the simulated value differences as obtained in our posterior predictive checks to see if the drift rate was systematically more extreme for tasty choices (Author response image 3). In line with the reviewer’s suggestion that tasty options were generally more attractive, tasty decisions were associated with higher value differences (i.e., further away from 0) and consequently with faster decisions. This indicates that the main reason for faster tasty choices was a higher drift rate in those trials (as a consequence of the combination of attribute weights and attribute values rather than “a constant in the drift rate”), whereas a strong starting point bias played only a minor role.

      Author response image 3.

      Note. Value Difference as obtained from Posterior Predictive Checks of the maaDDM2𝜙 in hungry and sated condition for healthy (green) and tasty (orange) choices.

      R1.5: Fifth, I wonder about the mtDDM. What are the units on the "starting time" parameters? Seconds? These seem like minuscule effects. Do they align with the eye-tracking data? In other words, which attributes did participants look at first? Was there a correlation between the first fixations and the relative starting times? If not, does that cast doubt on the mtDDM fits? Did the authors do any parameter recovery exercises on the mtDDM?

      We thank Reviewer 1 for their observant remarks about the mtDDM. In line with their suggestion, we have performed a parameter recovery which led to a good recovery of all parameters except relative starting time (rst). In addition, we had convergence issues of rst as revealed by parameter Rhats around 20. Together these results indicate potential limitations of the mtDDM when applied to tasks with substantially different visual representations of attributes leading to differences in dwell time for each attribute (see Figure 3b and Figure S6b). We have therefore decided not to report the mtDDM in the main paper, only leaving a remark about convergence and recovery issues.

      R2: My main criticism, which doesn't affect the underlying results, is that the labeling of food choices as being taste- or health-driven is misleading. Participants were not cued to select health vs taste. Studies in which people were cued to select for taste vs health exist (and are cited here). Also, the label "healthy" is misleading, as here it seems to be strongly related to caloric density. A high-calorie food is not intrinsically unhealthy (even if people rate it as such). The suggestion that hunger impairs making healthy decisions is not quite the correct interpretation of the results here (even though everyone knows it to be true). Another interpretation is that hungry people in negative calorie balance simply prefer more calories.

      First, we agree with the reviewer that it should be tested to what extent participants’ choice behavior can be reduced to contrasting taste vs. health aspects of their dietary decisions (but note that prior to making decisions, they were asked to rate these aspects and thus likely primed to consider them in the choice task). Having this question in mind, we performed several analyses to demonstrate the suitability of framing decisions as contrasting taste vs. health aspects (including the PCA reported in the Supplemental Material).

      Second, we agree with the reviewer in that despite a negative correlation (Author response image 4) between caloric density and health, high-caloric items are not intrinsically unhealthy. This may apply only to two stimuli in our study (nuts and dried fruit), which are also by our participants recognized as such.

      Finally, Reviewer 2’s alternative explanation, that hungry individuals prefer more calories is tested in SOM5. In line with the reviewer’s interpretation, we show that hungry individuals indeed are more likely to select higher caloric options. This effect is even stronger than the effect of hunger state on tasty vs healthy choice. However, in this paper we were interested in the effect of hunger state on tasty vs healthy decisions, a contrast that is often used in modeling studies (e.g., Barakchian et al., 2021; Maier et al., 2020; Rramani et al., 2020; Sullivan & Huettel, 2021). In sum, we agree with Reviewer 2 in all aspects and have tested and provided evidence for their interpretation, which we do not see to stand in conflict with ours.

      Author response image 4.

      Note. strong negative correlation between health ratings and objective caloric content in both hungry (r\=-.732, t(64)=-8.589, p<.001) and sated condition (r\=-.731, t(64)=-8.569, p<.001).

      R3.1: On the positioning side, it does not seem like a 'bad' decision to replenish energy states when hungry by preferring tastier, more often caloric options. In this sense, it is unclear whether the observed behavior in the fasted state is a fallacy or a response to signals from the body. The introduction does mention these two aspects of preferring more caloric food when hungry. However, some ambiguity remains about whether the study results indeed reflect suboptimal choice behavior or a healthy adaptive behavior to restore energy stores.

      We thank Reviewer 3 for this remark, which encouraged us to interpret the results also form a slightly different perspective. We agree that choosing tasty over healthy options under hunger may be evolutionarily adaptive. We have now extended a paragraph in our discussion linking the cognitive mechanisms to neurobiological mechanisms:

      “From a neurobiological perspective, both homeostatic and hedonic mechanisms drive eating behaviour. While homeostatic mechanisms regulate eating behaviour based on energy needs, hedonic mechanisms operate independent of caloric deficit (Alonso-Alonso et al., 2015; Lowe & Butryn, 2007; Saper et al., 2002). Participants’ preference for tasty high caloric food options in the hungry condition aligns with a drive for energy restoration and could thus be taken as an adaptive response to signals from the body. On the other hand, our data shows that participants preferred less healthy options also in the sated condition. Here, hedonic drivers could predominate indicating potentially maladaptive decision-making that could lead to adverse health outcomes if sustained. Notably, our modeling analyses indicated that participants in the sated condition showed reduced attentional discounting of health information, which poses potential for attention-based intervention strategies to counter hedonic hunger. This has been investigated for example in behavioral (Barakchian et al., 2021; Bucher et al., 2016; Cheung et al., 2017; Sullivan & Huettel, 2021), eye-tracking (Schomaker et al., 2022; Vriens et al., 2020) and neuroimaging studies (Hare et al., 2011; Hutcherson & Tusche, 2022) showing that focusing attention on health aspects increased healthy choice. For example, Hutcherson and Tusche (2022) compellingly demonstrated that the mechanism through which health cues enhance healthy choice is shaped by increased value computations in the dorsolateral prefrontal cortex (dlPFC) when cue and choice are conflicting (i.e., health cue, tasty choice). In the context of hunger, these findings together with our analyses suggest that drawing people’s attention towards health information will promote healthy choice by mitigating the increased attentional discounting of such information in the presence of tempting food stimuli.”

      Recommendations for the authors:

      R1: The Results section needs to start with a brief description of the task. Otherwise, the subsequent text is difficult to understand.

      We included a paragraph at the beginning of the results section briefly describing the experimental design.

      R1/R2: In Figure 1a it might help the reader to have a translation of the rating scales in the figure legend.

      We have implemented an English rating scale in Figure 1a.

      R2: Were the ratings redone at each session? E.g. were all tastiness ratings for the sated session made while sated? This is relevant as one would expect the ratings of tastiness and wanting to be affected by the current fed state.

      The ratings were done at the respective sessions. As shown in S3a there is a high correlation of taste ratings across conditions. We decided to take the ratings of the respective sessions (rather than mean ratings across sessions) to define choice and taste/health value in the modeling analyses, for several reasons. First, by using mean ratings we might underestimate the impact of particularly high or low ratings that drove choice in the specific session (regression to the mean). Second, for the modeling analysis in particular, we want to model a decision-making process at a particular moment in time. Consequently, the subjective preferences in that moment are more accurate than mean preferences.

      R2: It would be helpful to have a diagram of the DDM showing the drifting information to the boundary, and the key parameters of the model (i.e. showing the nDT, drift rate, boundary, and other parameters). (Although it might be tricky to depict all 9 models).

      We thank the reviewer for their recommendation and have created Figure 6, which illustrates the decision-making process as depicted by the maaDDM2phi.

      R3.1: Past work has shown that prior preferences can bias/determine choices. This effect might have played a role during the choice task, which followed wanting, taste, health, and calorie ratings during which participants might have already formed their preferences. What are the authors' positions on such potential confound? How were the food images paired for the choice task in more detail?

      The data reported here, were part of a larger experiment. Next to the food rating and choice task, participants also completed a social preference rating and choice task, as well as rating and choice tasks for intertemporal discounting. These tasks were counterbalanced such that first the three rating tasks were completed in counterbalanced order and second the three choice tasks were completed in the same order (e.g. food rating, social rating, intertemporal rating; food choice, social choice, intertemporal choice). This means that there were always two other tasks between the food rating and food choice task. In addition, to the temporal delay between rating and choice tasks, our modeling analyses revealed that models including a starting point bias performed worse than those without the bias. Although we cannot rule out that participants might occasionally have tried to make their decision before the actual task (e.g., by keeping their most/least preferred option in mind and then automatically choosing/rejecting it in the choice task), we think that both our design as well as our modeling analyses speak against any systematic bias of preference in our choice task. The options were paired such that approximately half of the trials were random, while for the other half one option was rated healthier and the other option was rated tastier (e.g., Sullivan & Huettel, 2021)

      R3.2: In line with this thought, theoretically, the DDMs could also be fitted to reaction times and wanting ratings (binarized). This could be an excellent addition to corroborate the findings for choice behavior.

      We have implemented several alternative modeling analyses, including taste vs health as defined by Nutri-Score (Table S12 and Figures S22-S30) and higher wanted choice vs healthy choice (Table S13; Figure S30-34). Indeed, these models corroborate those reported in the main text demonstrating the robustness of our findings.

      R3.3: The principal component analysis was a good strategy for reducing the attribute space (taste, health, wanting, calories, Nutriscore, objective calories) into two components. Still, somehow, this part of the results added confusion to harnessing in which of the analyses the health attribute corresponded only to the healthiness ratings and taste to the tastiness ratings and if and when the components were used as attributes. This source of confusion could be mitigated by more clearly stating what health and taste corresponded to in each of the analyses.

      We thank the reviewer for this recommendation and have now reported the PCA before reporting the behavioural results to clarify that choices are binarized based on participants’ taste and health ratings, rather than the composite scores. We have chosen this approach, as it is closer to our hypotheses and improves interpretability.

      R3.4: From the methods, it seems that 66 food images were used, and 39 fell into A, B, C, and D Nutriscores. How were the remaining 27 images selected, and how healthy and tasty were the food stimuli overall?

      The selection of food stimuli was done in three steps: First, from Charbonnier and collegues (2016) standardized food image database (available at osf.io/cx7tp/) we excluded food items that were not familiar in Germany/unavailable in regular German supermarkets. Second, we excluded products that we would not be able to incentivize easily (i.e., fastfood, pastries and items that required cooking/baking/other types of preparation). Third, we added the Nutri Scores to the remaining products aiming to have an equal number of items for each Nutri-Score, of which approximately half of the items were sweet and the other half savory. This resulted in a final stimuli-set of 66 food images (13 items =A; 13 items=B; 12 items=C; 14 items =D; 14 items = E). The experiment with including the set of food stimuli used in our study is also uploaded here: osf.io/pef9t/.With respect to the second question, we would like to point out that preference of food stimuli is very individual, therefore we obtained the ratings (taste, health, wanting and estimated caloric density) of each participant individually. However, we also added the objective total calories, which is positively correlated subjective caloric density and negatively correlated with Nutri-Score (coded as A=5; B=4; C=3; D=2; E=1) and health ratings (see Figure S7).

      R3.5: It seems that the degrees of freedom for the paired t-test comparing the effects of the condition hungry versus satiated on hunger ratings were 63, although the participant sample counted 70. Please verify.

      This is correct and explained in the methods section under data analysis: “Due to missing values for one timepoint in six participants (these participants did not fill in the VAS and PANAS before the administration of the Protein Shake in the sated condition) the analyses of the hunger state manipulation had a sample size of 64.”

      R3.5: Please add the range of BMI and age of participants. Did all participants fall within a healthy BMI range

      The BMI ranged from 17.306 to 48.684 (see Author response image 5), with the majority of participants falling within a normal BMI (i.e., between 18.5 and 24.9. In our sample, 3 participants had a BMI lager than 30. By using subject as a random intercept in our GLMMs we accounted for potential deviations in their response.

      Author response image 5.

      R3.5: Defining the inference criterion used for the significance of the posterior parameter chains in more detail can be pedagogical for those new to or unfamiliar with inferences drawn from hierarchical Bayesian model estimations and Bayesian statistics.

      We have added an explanation of the highest density intervals and what they mean with respect to our data in the respective result section.

    1. Author response:

      Reviewer #1 (Public Review):

      We are grateful to this reviewer for her/his constructive comments, which have greatly improved our work. Individual responses are provided below.

      The authors recorded from multiple mossy cells (MCs) of the dentate gyrus in slices or in vivo using anesthesia. They recorded MC spontaneous activity during spontaneous sharp waves (SWs) detected in area CA3 (in vitro) or in CA1 ( in vivo). They find variability of the depolarization of MCs in response to a SW. They then used deep learning to parse out more information. They conclude that CA3 sends different "information" to different MCs. However, this is not surprising because different CA3 neurons project to different MCs and it was not determined if every SW reflected the same or different subsets of CA3 activity.

      Thank you for your valuable comments. We agree that our finding that different MCs receive different information is unsurprising. These data are, in fact, to be expected from the anatomical knowledge of the circuit structure. However, as a physiological finding, there is a certain value in proving this fact; please note that it was not clear whether the neural activity of individual MCs received heterogeneous/variable information at the physiological level. It was therefore necessary to investigate this by recording neural activity. We believe this study is important because it quantitatively demonstrates this fact.

      The strengths include recording up to 5 MCs at a time. The major concerns are in the finding that there is variability. This seems logical, not surprising. Also it is not clear how deep learning could lead to the conclusion that CA3 sends different "information" to different MCs. It seems already known from the anatomy because CA3 neurons have diverse axons so they do not converge on only one or a few MCs. Instead they project to different MCs. Even if they would, there are different numbers of boutons and different placement of boutons on the MC dendrites, leading to different effects on MCs. There also is a complex circuitry that is not taken into account in the discussion or in the model used for deep learning. CA3 does not only project to MCs. It also projects to hilar and other dentate gyrus GABAergic neurons which have complex connections to each other, MCs, and CA3. Furthermore, MCs project to MCs, the GABAergic neurons, and CA3. Therefore at any one time that a SW occurs, a very complex circuitry is affected and this could have very different effects on MCs so they would vary in response to the SW. This is further complicated by use of slices where different parts of the circuit are transected from slice to slice.

      The first half of this paragraph is closely related to the previous paragraph. We propose that the variation in membrane potential of the simultaneously recorded MCs allows for the expression of diverse information. We also believe that this is highly novel in that no previous work has described the extent to which SWR is encoded in MCs. Our study proposes a new quantitative method that relates two variables (LFP and membrane potential) that are inherently incomparable. Specifically, we used machine learning (please note that it is a neural network, but not "deep learning") to achieve this quantification, and we believe this innovation is noteworthy.

      In the latter part of this article, you raise another important point. First, we would like to point out that this comment contains a slight misunderstanding. Our goal is not to reproduce the circuit structure of the hippocampus in silico but to propose a "function (or mapping/transformation)" that connects the two different modalities, i.e., LFP and Vm. This function should be as simple as possible, which is desirable from an explanatory point of view. In this respect, our machine learning model is a 'perceptron'-like 3-layer neural network. One of the simplest classical neural network models can predict the LFP waveform from Vm, which is quite surprising and an achievement we did not even imagine before. The fact that our model does not consider dendrites or inhibitory neurons is not a drawback but an important advantage. On the other hand, the fact that the data we used for our predictions were primarily obtained using slice experiments may be a drawback of this study, and we agree with your comments. However, we can argue that the new quantitative method we propose here is versatile since we showed that the same machine learning can be used to predict in vivo single-cell data.

      It is also not discussed if SWs have a uniform frequency during the recording session. If they cluster, or if MC action potentials occur just before a SW, or other neurons discharge before, it will affect the response of the MC to the SW. If MC membrane potential varies, this will also effect the depolarization in response to the SW.

      Thank you for raising an important point. We have done some additional analyses in response to your comment. First, we plotted how the SWR parameter fluctuated during our recording time (especially for data recorded for long periods of more than 5 minutes). As shown in the new Figure 1 - figure supplement 4, we can see that the frequency of SWRs was kept uniform during the recording time. These data ensure the rationale for pooling data over time.

      We also calculated the average membrane potentials of MCs before and after SWRs and found that MCs did not show depolarization or hyperpolarization before SWs, unlike Vm of CA1 neurons. These data indicate that the surrounding circuitry was not particularly active before SW, eliminating any concern that such unexpected preceding activity might affect our analysis. These data are shown in Figure 1 - figure supplement 2.

      In vivo, the SWs may be quite different than in vivo but this is not discussed. The circuitry is quite different from in vitro. The effects of urethane could have many confounding influences. Furthermore, how much the in vitro and in vivo SWs tell us about SWs in awake behaving mice is unclear.

      We agree with this point. Ideally, recording in vitro and in vivo under conditions as similar as possible would be optimal. However, as you know, patch-clamp recording from mossy cells in vivo is technically challenging, and currently, there is no alternative to conducting experiments under anesthesia. We believe that science advances not merely through theoretical discourse, but by contributing empirical data collected under existing conditions. However, as we mentioned in the paper, we believe that in vivo and in vitro SWR share some properties and a common principle of occurrence. We also observed that there are similar characteristics in the membrane potential response of MC to SWR. However, as you have pointed out, data derived from these limitations require careful interpretation, and we have explicitly stated in the paper that not only are there such problems, but that there are also common properties in the data obtained in vivo and in vitro (Page 12, Line 357).

      Also, methods and figures are hard to understand as described below.

      Thank you for all your comments. We have carefully considered the reviewers' comments and improved the text and legend. We hope you will take the time to review them.

      Reviewer #2 (Public Review):

      Thank you for the positive evaluations, which have encouraged us to resubmit this manuscript. We have revised our manuscript in accordance with your comments. Our point-by-point responses are as follows:

      • A summary of what the authors were trying to achieve

      Drawing from theoretical insights on the pivotal role of mossy cells (MCs) in pattern separation - a key process in distinguishing between similar memories or inputs - the authors investigated how MCs in the dentate gyrus of the hippocampus encode and process complex neural information. By recording from up to five MCs simultaneously, they focused on membrane potential dynamics linked to sharp wave-ripple complexes (SWRs) originating from the CA3 area. Indeed, using a machine learning approach, they were able to demonstrate that even a single MC's synaptic input can predict a significant portion (approximately 9%) of SWRs, and extrapolation suggested that synaptic input obtained from 27 MCs could account for 90% of the SWR patterns observed. The study further illuminates how individual MCs contribute to a distributed but highly specific encoding system. It demonstrates that SWR clusters associated with one MC seldom overlap with those of another, illustrating a precise and distributed encoding strategy across the MC network.

      We appreciate that this reviewer found scientific value in our manuscript. Thanks to the comments, we were pleased to be able to revise and improve the manuscript. Individual responses are listed below:

      • An account of the major strengths and weaknesses of the methods and results

      Strengths:

      (1) This study is remarkable because it establishes a critical link between the subthreshold activities of individual neurons and the collective dynamics of neuronal populations.

      (2) The authors utilize machine learning to bridge these levels of neuronal activity. They skillfully demonstrate the predictive power of membrane potential fluctuations for neuronal events at the population level and offer new insights into neuronal information processing.

      (3) To investigate sharp wave/ripple-related synaptic activity in mossy cells (MCs), the authors performed challenging experiments using whole-cell current-clamp recordings. These recordings were obtained from up to five neurons in vitro and from single mossy cells in live mice. The latter recordings are particularly valuable as they add to the limited published data on synaptic input to MCs during in vivo ripples.

      We appreciate the reviewer’s critical evaluations, which have encouraged us to revise and resubmit this manuscript. We have revised our manuscript in line with the reviewer’s comments. Our point-by-point responses are provided below:

      Weaknesses:

      (1) The model description could significantly benefit from additional details regarding its architecture, training, and evaluation processes. Providing these details would enhance the paper's transparency, facilitate replication, and strengthen the overall scientific contribution. For further details, please see below.

      Thank you for the suggestions. We have responded with model details based on the following comments.

      (2) The study recognizes the concept of pattern separation, a central process in hippocampal physiology for discriminating between similar inputs to form distinct memories. The authors refer to a theoretical paper by Myers and Scharfman (2011) that links pattern separation with activity backpropagating from CA3 to mossy cells. Despite this initial citation, the concept is not discussed again in the context of the new findings. Given the significant role of MCs in the dentate gyrus, where pattern separation is thought to occur, it would be valuable to understand the authors' perspective on how their findings might relate to or contribute to existing theories of pattern separation. Could the observed functions of MCs elucidated in this study provide new insights into their contribution to processes underlying pattern separation?

      Thank you for your valuable comment. The role of MCs in pattern separation is described in the discussion as follows:

      “It has been shown through theoretical models that MCs are a contributor to pattern separation (Myers and Scharfman, 2011). In general, the pathway of neural information is diverged from the entorhinal cortex through the larger granule cell layer and then compressed into the smaller CA3 cell layer. In this case, there is a high possibility of information loss during the transmission process. Thus, a backprojection mechanism via MCs has been proposed as a device to prevent information loss. Indeed, in theoretical models, such backprojection improves pattern separation and memory capacity, and the results are closer to experimental data than models without built-in backprojection. However, it was unclear what information individual MCs receive during backprojection. Our results show that CA3 SWR is distributed and encoded in the MC population, and that even though the number of MCs is smaller than in other regions, it is possible to reproduce about 30% of the SWR in CA3 from the membrane potential of only five MCs. Based on these results, it is believed that MCs not only play a role in preventing information loss, but also play a role in receiving some kind of newly encoded memory information in the CA3 region, and it is highly likely that the information contained in the backprojections is different from the neural information transmitted through conventional transmission pathways. Indeed, the fact that the information replayed in CA3 is reflected as SWR and propagated to each brain region suggests that the newly encoded memory information in CA3 is propagated to MC. If  backprojection simply returned the information transmitted from DG to CA3, and to MC, this would be unrealistic and extremely inefficient. However, it is still unclear what kind of memory information is actually backprojected and distributed to the MC, and how it differs from the memory information transmitted in the forward direction. These are open questions that need to be addressed in future experiments in awake animals.” (Page 11, Line 333)

      (3) Previous work concluded that sharp waves are associated with mossy cell inhibition, as evidenced by a consistent ripple function-related hyperpolarization of the membrane potential in these neurons when recorded at resting membrane potential (Henze & Buzsáki, 2007). In contrast, the present study reveals an SWR-induced depolarization of the membrane potential. Can the authors explain the observed modulation of the membrane potential during CA1 ripples in more detail? What was the proportion of cases of depolarization or hyperpolarization? What were the respective amplitude distributions? Were there cases of activation of the MCs, i.e., spiking associated with the ripple? This more comprehensive information would add significance to the study as it is not currently available in the literature.

      Sorry for confusing the conclusion. First, we did not mention in the paper that in vivo MC depolarized during SWR. The following sentences have added to result:

      “Previous research has shown that the hyperpolarization of MC membrane potential associated with SWR indicates that SWR is related to the inhibition of mossy cells (Henze and Buzsáki, 2007). However, our data showed that the proportion of cases of depolarization or hyperpolarization was about the same, with a slight excess of depolarization. However, it should be noted that MCs are highly active and fluctuating cells, and the determination of whether they are depolarized or hyperpolarized is highly dependent on the method of analysis. Moreover, the firing rate of MCs that we recorded was 1.07 ± 0.93 Hz (mean ± SD from 6 cells, 6 mice), and 6.68 ± 4.79% (mean ± SD from 6 cells, 6 mice, n = 757 SWR events) of all SWRs recruited MC firing (calculated as firing within 50 ms after the SWR peak). ” (Page 5, Line 143)

      (4) In the study, the observation that mossy cells (MCs) in the lower (infrapyramidal) blade of the dentate gyrus (DG) show higher predictability in SWR patterns is both intriguing and notable. This finding, however, appears to be mentioned without subsequent in-depth exploration or discussion. One wonders if this observed predictability might be influenced by potential disruptions or severed connections inherent to the brain slice preparation method used. Furthermore, it prompts the question of whether similar observations or trends have been noted in MCs recorded in vivo, which could either corroborate or challenge this intriguing in vitro finding.

      As you pointed out, one cannot rule out the possibility that this predictability may be influenced by potential disruptions or disconnections inherent in the methods used to prepare the acute slices. And the number of cells is limited to six with respect to the anatomical location of the MC recorded in vivo, making SWR and MC patch clamp recording very difficult even under anesthesia. Therefore, it is difficult to find statistical significance in the current data. We have added following text in Discussion:

      “In addition, the finding that SWR is more predictive when the recorded location of the MC is near the lower blade of the DG is unexpected, so the possibility that this result is influenced by potential disruptions or severed connections during the preparation of the acute slice cannot be ruled out.” (Page 14, Line 405)

      (5) The study's comparison of SWR predictability by mossy cells (MCs) is complicated by using different recording sites: CA3 for in vitro and CA1 for in vivo experiments, as shown in Fig. 2. Since CA1-SWRs can also arise from regions other than CA3 (see e.g. Oliva et al., 2016, Yamamoto and Tonegawa, 2017), it is difficult to reconcile in vitro and in vivo results. Addressing this difference and its implications for MC predictability in the results discussion would strengthen the study.

      Thank you for your comment. We have added the following discussion to your comment:

      “In this study, we performed MC patch-clamp recording both in vivo and in vitro, and clarified that SWR can be predicted from V_m of MC in both cases. However, there are three caveats to the interpretation of these data. First, the _in vivo SWR cannot be said to be exactly the same as the in vitro SWR: note that in vitro SWR has some similarities to in vivo SWR, such as spatial and spectral profiles and neural activity patterns (Maier et al., 2009; Hájos et al., 2013; Pangalos et al., 2013). The same concern applies to MC synaptic inputs. The in vivo V_m data may contain more information compared to the _in vitro single MC data, because the entire projections that target MCs are intact, resulting in a complete set of synaptic inputs related to SWR activity, as opposed to slices where connections are severed. While we recognize these differences, it is also very likely that there are common ways of expressing information. Second, since the in vivo LFP recordings were obtained from the CA1 region, it is possible that the CA1-SWR receives input from the CA2 region (Oliva et al., 2016) and the entorhinal cortex (Yamamoto and Tonegawa, 2017). In addition, urethane anesthesia has been observed to reduce subthreshold activity, spike synchronization, and SWR (Yagishita et al., 2020), making it difficult to achieve complete agreement with in vitro SWR recorded from the CA3 region. Finally, although we were able to record MC V_m during _in vivo SWR in this study, the in vivo data set consisted of recordings from a single MC, in contrast to the in vitro dataset. To perform the same analysis as in the in vitro experiment, it would be desirable to record LFPs from the CA3 region and collect data from multiple MCs simultaneously, but this is technically very difficult. In this study, it was difficult to directly clarify the consistency between CA3 network activity and in vivo MC synaptic input, but the fact that the SWR waveform can be predicted from in vivo MC V_m in CA1-SWR may be the result of some CA3 network activity being reflected in CA1-SWR. It is undeniable that more accurate predictions would have been possible if it had been possible to record LFP from the CA3 regions _in vivo. ” (Page 12, Line 357)

      • An appraisal of whether the authors achieved their aims, and whether the results support their conclusions

      As outlined in the abstract and introduction, the primary aim is to investigate the role of MCs in encoding neuronal information during sharp wave ripple complexes, a crucial neuronal process involved in memory consolidation and information transmission in the hippocampus. It is clear from the comprehensive details in this study that the authors have meticulously pursued their goals by providing extensive experimental evidence and utilizing innovative machine learning techniques to investigate the encoding of information in the hippocampus by mossy cells (MCs). Together, this study provides a compelling account supported by rigorous experimental and analytical methods. Linking subthreshold membrane potentials and population activity by machine learning provides a comprehensive new analytic approach and sheds new light on the role of MCs in information processing in the hippocampus. The study not only achieves the stated goals, but also provides novel methodology, and valuable insights into the dynamics of neural coding and information flow in the hippocampus.

      We appreciate the reviewer’s critical evaluations, which have encouraged us to revise and resubmit this manuscript. We have revised our manuscript in line with the reviewer’s comments.

      • A discussion of the likely impact of the work on the field, and the utility of the methods and data to the community

      Impact: Both the novel methodology and the provided biological insights will be of great interest to the community.

      Utility of methods/data: The applied deep learning approach will be of particular interest if the authors provide more details to improve its reproducibility (see related suggestions below).

      We appreciate that this reviewer found scientific value in our manuscript. Thanks to the comments.

      Reviewer #3 (Public Review):

      We appreciate that this reviewer raised several important issues. We are pleased to have been able to revise the paper into a better manuscript based on these comments. Individual responses are listed below:

      Compared to the pyramidal cells of the CA1 and CA3 regions of the hippocampus, and the granule cells of the dentate gyrus (DG), the computational role(s) of mossy cells of the DG have received much less attention over the years and are consequently not well understood. Mossy cells receive feedforward input from granule cells and feedback from CA3 cells. One significant factor is the compression of the large number of CA3 cells that input onto a much smaller population of mossy cells, which then send feedback connections to the granule cell layer. The present paper seeks to understand this compression in terms of neural coding, and asks whether the subthreshold activity of a small number of mossy cells can predict above chance levels the shapes of individual SWs produced by the CA3 cells. Using elegant multielectrode intracellular recordings of mossy cells, the authors use deep learning networks to show that they can train the network to "predict" the shape of a SW that preceded the intracellular activity of the mossy cells. Putatively, a single mossy cell can predict the shape of SWs above chance. These results are interesting, but there are some conceptual issues and questions about the statistical tests that must be addressed before the results can be considered convincing.

      We appreciate that this reviewer found scientific value in our manuscript. Thanks to the comments, we were pleased to be able to revise and improve the manuscript. Individual responses are listed below:

      Strengths

      (1) The paper uses technically challenging techniques to record from multiple mossy cells at the same time, while also recording SWs from the LFP of the CA3 layer. The data appear to be collected carefully and analyzed thoughtfully.

      (2) The question of how mossy cells process feedback input from CA3 is important to understand the role of this feedback pathway in hippocampal processing.

      3) Given the concerns expressed below about proper statistical testing are resolved, the data appear supportive of the main conclusions of the authors and suggest that, to some degree, the much smaller population of mossy cells can conserve the information present in the larger population of CA3 cells, presumably by using a more compressed, dense population code.

      We appreciate the reviewer’s critical evaluations, which have encouraged us to revise and resubmit this manuscript. We have revised our manuscript in line with the reviewer’s comments. Our point-by-point responses are provided below:

      Weaknesses

      4) Some of the statistical tests appear inappropriate because they treat each CA3 SW and associated Vm from a mossy cell as independent samples. This violates the assumptions of statistical tests such as the Kolmogorov-Smirnov tests of Figure 3C and Fig 3E. Although there is large variability among the SWs recorded and among the Vm's, they cannot be considered independent measurements if they derive from the same cell and same recording site of an individual animal. This becomes especially problematic when the number of dependent samples adds up to the tens of thousands, providing highly inflated numbers of samples that artificially reduce the p values. Techniques such as mixed-effects models are being increasingly used to factor out the effects of within cell and within animal correlations in the data. The authors need to do something similar to factor out these contributions in order to perform statistical tests, throughout the manuscript when this problem occurs.

      Thank you for the insightful comment. As for the correlation between the animals, since they were brought in at the same age and kept in the same environment, we do not think it is necessary to account for the differences due to environmental factors. As the reviewer pointed out, we cannot completely rule out the possibility that within cell or within animal correlation might influence the results, so we plotted the differences in prediction accuracy between cells, slices, and animals (Figure 3 - figure supplement 7). The results showed that prediction accuracy of the real data was better than that of the shuffled data in 66 of the 87 MCs (75.9%). In response to the comment that measurements from the same animal do not constitute independent samples, we have indicated that the average ΔRMSE for each mouse were calculated and these values were significantly different from 0 (n = 14, *p = 0.0041, Student’s t-test). In other words, even if each animal is considered an independent sample, it is possible to obtain statistically significant differences.

      5) A separate statistical problem occurs when comparing real data against a shuffled, surrogate data set. From the methods, I gather that Figure 3C combined data from 100 surrogate shuffles to compare to the real data. It is inappropriate to do a classic statistical test of data against such shuffles, because the number of points in the pooled surrogate data sets are not true samples from a population. It is a mathematical certainty that one can eventually drive a p value to < 0.05 just by increasing the number of shuffles sufficiently. Thus, the p value is determined by the number of computer shuffles allowed by the time and processing power of a computer, rather than by sampling real data from the population. Figures such as 4C and 5A are examples that test data against shuffle appropriately, as a single value is determined to be within or outside the 95% confidence interval of the shuffle, and this determination is not directly affected by the number of shuffles performed.

      Thank you for raising a very good point. We understand the reviewer's comments, but we cannot fully agree with the part that says "It is mathematical certainty that one can eventually drive a p value to < 0.05 just by increasing the number of shuffles sufficiently". This is because when comparing data with no difference at all, no amount of shuffling will produce a significant difference. In this regard, we agree that increasing the number of shuffles will lower the p-value when comparing data with even a small difference. Based on the reviewer's comments, we used a paired t-test to test whether the difference between RMSEreal and RMSEsurrogate was significantly different from 0, and showed it was significantly different (Figure 3 - figure supplement 5). Even when a paired t-test was used for the test, as in Figure 3E, a significant difference in the prediction error of the real and shuffled data was observed for all MC number inputs and also for the in vivo data.

      6) The last line of the Discussion states that this study provides "important insights into the information processing of neural circuits at the bottleneck layer," but it is not clear what these insights are. If the statistical problems are addressed appropriately, then the results do demonstrate that the information that is reflected in SWs can be reconstructed by cells in the MC bottleneck, but it is not certain what conceptual insights the authors have in mind. They should discuss more how these results further our understanding of the function of the feedback connection from CA3 to the mossy cells, discuss any limitations on their interpretation from recording LFPs rather than the single-unit ensemble activity (where the information is really encoded).

      Thank you for your insightful comment. We have added the following text to the discussion:

      “Given that different SWRs may encode information that correlates with different experiences, it is also possible that the activity of individual MCs may play a role in encoding different experiences via SWRs. Indeed, several in vivo studies have confirmed that MC activity is involved in the space encoding (Bui et al., 2018; Huang et al., 2024). However, the relationship with SWRs has not been investigated. The significance of the fact that the SWR recorded from CA3 is reflected in the MC as synaptic input is that it not only shows the transmission pathway from CA3 to MC, but also reveals the information below the threshold that leads to firing, and in a broad sense, it approaches the mechanism by which information processing by neuronal firing. And the expression of synaptic input to the MC is not uniform, but varies in a variety of ways according to the pattern of SWR. Based on previous research showing that diversity is important for information representation (Padmanabhan and Urban, 2010; Tripathy et al., 2013), it is possible that this heterogeneity in membrane potential levels, rather than the all-or-none output of neuronal firing activity, is the key to encoding more precise information. In this respect, our research, which focuses on information encoding at the subthreshold level, may be able to extract even more information than information encoded by firing activity. ” (Page 14, Line 419)

      7) In Figure 1C, the maximum of the MC response on the first inset precedes the SW, and the onset of the Vm response may be simultaneous with SW. This would suggest that the SW did not drive the mossy cell, but this was a coincident event. How many SW-mossy cell recordings are like this? Do the authors have a technical reason to believe that these are events in which the mossy cell is driven by the CA3 cells active during the SW?

      Thank you for your insightful comment. Based on your comment, we have aligned all the MC EPSPs for each SWR onset and found that the EPSPs rise after the SWR onset (Figure 1 - figure supplement 2). This leads us to believe that the EPSP of the MC is most likely driven by the SWR.

    1. Author response:

      Public Reviews:

      Reviewer #1 (Public review):

      Summary:

      This manuscript described a structure-guided approach to graft important antigenic loops of the neuraminidase to a homotypic but heterologous NA. This approach allows the generation of well-expressed and thermostable recombinant proteins with antigenic epitopes of choice to some extent. The loop-grafted NA was designated hybrid.

      Strengths:

      The hybrid NA appeared to be more structurally stable than the loop-donor protein while acquiring its antigenicity. This approach is of value when developing a subunit NA vaccine which is difficult to express. So that antigenic loops could be potentially grafted to a stable NA scaffold to transfer strain-specific antigenicity.

      Weaknesses:

      However, major revisions to better organize the text, and figure and make clarifications on a number of points, are needed. There are a few cases in which a later figure was described first, data in the figures were not sufficiently described, or where there were mismatched references to figures.

      More importantly, the hybrid proteins did not show any of the advantages over the loop-donor protein in the format of VLP vaccine in mouse studies, so it's not clear why such an approach is needed to begin with if the original protein is doing fine.

      We thank the reviewer for their helpful comments. We have incorporated feedback from the authors to improve the manuscript. Please see our point-by-point response.

      The purpose of loop-grafting between H5N1/2021 (a high-expressor) and the PR8 virus was not to improve the expression of PR8, which is already a good expressing NA. Instead, the loop-grafting and the in vivo experiments were done to show the loop-specific protection following a lethal PR8 virus challenge.

      Reviewer #2 (Public review):

      In their manuscript, Rijal and colleagues describe a 'loop grafting' strategy to enhance expression levels and stability of recombinant neuraminidase. The work is interesting and important, but there are several points that need the author's attention.

      Major points

      (1) The authors overstress the importance of the epitopes covered by the loops they use and play down the importance of antibodies binding to the side, the edges, or the underside of the NA. A number of papers describing those mAbs are also not included.

      We have discussed the distribution of epitopes on NA molecule in the Discussion section "The distribution of epitopes in neuraminidase" (new line number 350). In Supplementary Figures 1 and 2, we have compiled the epitopes reported by polyclonal sera and mAbs via escape virus selection or crystal structural studies. There are 45 residues examples of escape virus selection, and we found that approximately 90% of the epitopes are located within the top loops (Loops 01 and Loops 23, which include the lateral sides and edges of NA). We have also included the epitopes of underside mAbs NDS.1 and NDS.3 in Supplementary Figure 2. Some of the interactions formed by these mAbs are also within the L01 and L23 loops. All relevant references are cited in Supplementary Figures 1 and 2.

      A new figure has been added [Figure 1b (ii)] to illustrate the surface mapping of epitopes on NA.

      (2) The rationale regarding the PR8 hybrid is not well described and should be described better.

      We described the rationale for the PR8 hybrid (new lines 247-250). For clarity, we have added the following sentence within the section "Loop transfer between two distant N1 NAs:...."

      (new lines 255-258):

      "mSN1 showed sufficient cross-reactivity to N1/09 to protect mice against virus challenge. Therefore, we performed loop transfer between mSN1 and PR8N1, which differ by 18 residues within the L01 and L23 loops and show no or minimal cross-reactivity, to assess the loop-specific protection."

      (3) Figure 3B and 6C: This should be given as numbers (quantified), not as '+'.

      We have included the numerical data in Supplementary Figure 6. The data is presented in semi-quantitative manner for simplification. To improve clarity, we have now added the following sentence to the Figure 3c legend: "Refer to Supplementary Figure 6 for binding titration data".

      (4) Figure 5A and 7A: Negative controls are missing.

      A pool of Empty VLP sera was included as a negative control, showing no inhibition at 1:40 dilution. In the figure legends, we have stated "Pooled sera to unconjugated mi3 VLP was negative control and showed no inhibition at 1:40 dilution (not included in the graphs)"

      (5) The authors claim that they generate stable tetramers. Judging from SDS-PAGE provided in Supplementary Figure 3B (BS3-crosslinked), many different species are present including monomers, dimers, tetramers, and degradation products of tetramers. In line 7 for example there are at least 5 bands.

      Tetrameric conformation of soluble proteins is evidenced by the size-exclusion chromatographs shown in Figures 3a and 6b. The BS3 crosslinked SDS-PAGE are only suggestive data, indicating that the protein is a tetramer if a band appears at ~250 kDa. However, depending on the reaction conditions, lower molecular weight bands may also be observed if crosslinking is incomplete.

    1. Author response:

      The following is the authors’ response to the original reviews.

      Public Reviews:

      Reviewer #1 (Public Review):

      Summary:

      In this manuscript, Wu et al. introduce a novel approach to reactivate the Muller glia cell cycle in the mouse retina by simultaneously reducing p27Kip1 and increasing cyclin D1 using a single AAV vector. The approach effectively promotes Muller glia proliferation and reprograming without disrupting retinal structure or function. Interestingly, reactivation of the Muller glia cell cycle downregulates IFN pathway, which may contribute to the induced retinal regeneration. The results presented in this manuscript may offer a promising approach for developing Müller glia cell-mediated regenerative therapies for retinal diseases.

      Strengths:

      The data are convincing and supported by appropriate, validated methodology. These results are both technically and scientifically exciting and are likely to appeal to retinal specialists and neuroscientists in general.

      Weaknesses:

      There are some data gaps that need to be addressed.

      (1) Please label the time points of AAV injection, EdU labeling, and harvest in Figure 1B.

      We thank the reviewer for highlighting the lack of clarity in our experimental design. We have labeled all experiment timelines in the figures where appropriate in the revised version.

      (2) What fraction of Müller cells were transduced by AAV under the experimental conditions?

      We apologize for not clearly explaining the AAV transduction effeciency. AAV transduction efficiency was not uniform across the retinas. The retinal region adjacent to the optic nerve exhibits a transduction efficiency of nearly 100%. In contrast, the peripheral retina shows a lower transduction efficiency compared to the central region. The representative retinal sections with typical infection pattern are shown in Supplementary figure 4. The quantification of Edu+ MG or other markers was conducted in a 250 µm region with the highest efficiency. For scRNA-seq experiment, retinal regions with high AAV transduction efficiency were dissected with the aid of a control GFP virus.   

      (3) It seems unusually rapid for MG proliferation to begin as early as the third day after CCA injection. Can the authors provide evidence for cyclin D1 overexpression and p27 Kip1 knockdown three days after CCA injection?

      We included the data that GFP expression is evident at 3 days post AAV-GFP-GFP injection (Supplementary Fig. 1B). Additionally, we performed immunostaining and confirmed cyclin D1 overexpression at 3 days post CCA injection (Fig. 2E) as well as qPCR analysis to confirm cyclin D1 overexpression and p27kip1 knockdown at the same time point (Supplementary Fig. 5).

      (4) The authors reported that MG proliferation largely ceased two weeks after CCA treatment. While this is an interesting finding, the explanation that it might be due to the dilution of AAV episomal genome copies in the dividing cells seems far-fetched.

      We agree with the reviewer that dilution of AAV episomal genomes is unlikely to be the sole reason for the stop of MG proliferation. By staining cyclin D1 at various days post CCA injection, we found that cyclin D1 is immediately downregulated in the mitotic MG undergoing interkinetic nuclear migration to the outer nuclear layer (Fig. 2G-I). In contrast, the effect of p27<sup>kip1</sup> knockdown by CCA lasted longer (Supplementary Figure 9-10). It is possible that other anti-proliferative genes are involved in the immediate downregulation of Cyclin D1.

      Reviewer #2 (Public Review):

      This manuscript by Wu, Liao et al. reports that simultaneous knockdown of P27Kip1 with overexpression of Cyclin D can stimulate Muller glia to re-enter the cell cycle in the mouse retina. There is intense interest in reprogramming mammalian muller glia into a source for neurogenic progenitors, in the hopes that these cells could be a source for neuronal replacement in neurodegenerative diseases. Previous work in the field has shown ways in which mouse Muller glia can be neurogenically reprogrammed and these studies have shown cell cycle re-entry prior to neurogenesis. In other works, typically, the extent of glial proliferation is limited, and the authors of this study highlight the importance of stimulating large numbers of Muller glia to re-enter the cell cycle with the hopes they will differentiate into neurons. While the evidence for stimulating proliferation in this study is convincing, the evidence for neurogenesis in this study is not convincing or robust, suggesting that stimulating cell cycle-reentry may not be associated with increasing regeneration without another proneural stimulus.

      Below are concerns and suggestions.

      Intro:

      (1) The authors cite past studies showing "direct conversion" of MG into neurons. However, these studies (PMID: 34686336; 36417510) show EdU+ MG-derived neurons suggesting cell cycle re-entry does occur in these strategies of proneural TF overexpression.

      We thank the reviewer for pointing this out. We have revised the statement to "MG reprogramming".

      (2) Multiple citations are incorrectly listed, using the authors first name only (i.e. Yumi, et al; Levi, et al;). Studies are also incompletely referenced in the references.

      We apologize for the mistakes in reference. We have corrected the reference mistakes in the revised version.

      Figure 1:

      (3) When are these experiments ending? On Figure 1B it says "analysis" on the end of the paradigm without an actual day associated with this. This is the case for many later figures too. The authors should update the paradigms to accurately reflect experimental end points.

      We thank the reviewer for highlighting the lack of clarity in our experimental design. We have labeled all experiment timelines in the figures where appropriate in the revised version.

      (4) Are there better representative pictures between P27kd and CyclinD OE, the EdU+ counts say there is a 3 fold increase between Figure 1D&E, however the pictures do not reflect this. In fact, most of the Edu+ cells in Figure 1E don't seem to be Sox9+ MG but rather horizontally oriented nuclei in the OPL that are likely microglia.

      Thanks to the reviewer for pointing this out. We have replaced the image of cyclin D1 OE retina which a more representative image.

      (5) Is the infection efficacy of these viruses different between different combinations (i.e. CyclinD OE vs. P27kd vs. control vs. CCA combo)? As the counts are shown in Figure 1G only Sox9+/Edu+ cells are shown not divided by virus efficacy. If these are absolute counts blind to where the virus is and how many cells the virus hits, if the virus efficacy varies in efficiency this could drive absolute differences that aren't actually biological.

      Rule out the possibility that the differences in MG proliferation across groups are due to variations in viral efficacy, we have examined the p27<sup>kip1</sup> knockdown and cyclin D1 overexpression efficiencies for all four groups by qPCR analysis. The result showed that cyclin D1 overexpression efficiency by AAV-GFAP-Cyclin D1 virus alone or P27 knockdown efficiency by AAV-GFAP-mCherry-p27kip1 shRNA1 is comparable to, if not even higher than, those by CCA virus (Supplementary Fig 5). Therefore, the virus efficacy cannot explain the drastic increase in MG proliferation by CCA. 

      As the central retina usually had 100% infection efficacy (Supplementary Fig. 4), we quantified the Edu+Sox9+ cell number in the 250µm regions next to the optic nerve.

      (6) According to the Jax laboratories, mice aren't considered aged until they are over 18months old. While it is interesting that CCA treatment does not seem to lose efficacy over maturation I would rephrase the findings as the experiment does not test this virus in aged retinas.

      Thank you to the reviewer for bringing this to our attention. We have changed to “older adult mice” in our revised manuscript.

      (7) Supplemental Figure 2c-d. These viruses do not hit 100% of MG, however 100% of the P27Kip staining is gone in the P27sh1 treatment, even the P27+ cell in the GCL that is likely an astrocyte has no staining in the shRNA 1 picture. Why is this?

      We have replaced the images in Supplementary Fig. 2B-D.

      Figure 2

      (8) Would you expect cells to go through two rounds of cell cycle in such a short time? The treatment of giving Edu then BrdU 24 hours later would have to catch a cell going through two rounds of division in a very short amount of time. Again the end point should be added graphically to this figure.

      We thank the reviewer for the comment. We repeated the Edu/BrdU colabelling experiment with extended periods of Edu/BrdU injections. Based on the result of the MG proliferation time course study (Fig. 2A), we injected 5 times of Edu from D1 to D5 and 5 times of BrdU from D6 to D10 post-CCA injection, which covered the major phase of MG proliferation (Fig. 2B-C). Consistent with the previous findings, we did not observe any BrdU&EdU double positive MG cells.

      Additionally, we showed that cyclin D1 overexpression immediately ceased in migrating mitotic MG (Fig. 2G-I), which may explain why CCA-treated MG do not progress to the second round of cell division.

      Figure 3

      (9) I am confused by the mixing of ratios of viruses to indicate infection success. I know mixtures of viruses containing CCA or control GFP or a control LacZ was injected. Was the idea to probe for GFP or LacZ in the single cell data to see which cells were infected but not treated? This is not shown anywhere?

      The virus infection was not uniform across the entire retina (Supplementary Fig. 4). To mark the infection hotspots, we added 10% GFP virus to the mixture. Regions of the retina with low infection efficiency were removed by dissection and excluded from the scRNA-seq analysis. Therefore, we assumed that the vast majority of MG were infected by CCA. We apologize for not clearly explaining this methodological detail in the original text. We have added the experimental design to Fig. 3A and revised the result part (line 191-196) accordingly.

      (10) The majority of glia sorted from TdTomato are probably not infected with virus. Can you subset cells that were infected only for analysis? Otherwise it makes it very hard to make population judgements like Figure 3E-H if a large portion are basically WT glia.

      This question is related to the last one. Since the regions with high virus infection efficiency were selectively dissected and isolated for analysis, the CCA-infected MG should constitute the vast majority of MG in the scRNA-seq data.

      (11) Figure 3C you can see Rho is expressed everywhere which is common in studies like this because the ambient RNA is so high. This makes it very hard to talk about "Rod-like" MG as this is probably an artifact from the technique. Most all scRNA-seq studies from MG-reprogramming have shown clusters of "rods" with MG hybrid gene expression and these had in the past just been considered an artifact.

      We agree with the reviewer that the high rod gene expression in the rod-MG cluster is an artifact. We have performed multiple rounds of RNA in situ hybridization on isolated MG nuclei. The counts of Gnat1 and Rho mRNA signal are largely overlapped between the two samples with and without CCA treatment (Supplementary Fig 14). Some MG in the control retinas without CCA treatment had up to 7 or 8 dots per cell, suggesting contamination of attached rod cell debris during retina dissociation (Supplementary Fig 14). Therefore, the result did not support that rod-MG is a reprogrammed MG population with rod gene upregulation.

      (12) It is mentioned the "glial" signature is downregulated in response to CCA treatment. Where is this shown convincingly? Figure H has a feature plot of Glul, which is not clear it is changed between treatments. Otherwise MG genes are shown as a function of cluster not treatment.

      We have added box plots of several MG-specific genes to illustrate the downregulation of the glial signature in the relevant cell cluster in the revised manuscript (Supplementary Fig. 15).

      Figure 4

      (13) The authors should be commended for being very careful in their interpretations. They employ the proper controls (Er-Cre lineage tracing/EdU-pulse chasing/scRNA-seq omics) and were very careful to attempt to see MG-derived rods. This makes the conclusion from the FISH perplexing. The few puncta dots of Rho and GNAT in MG are not convincing to this reviewer, Rho and GNAT dots are dense everywhere throughout the ONL and if you drew any random circle in the ONL it would be full of dots. The rigor of these counts also comes into question because some dots are picked up in MG in the INL even in the control case. This is confusing because baseline healthy MG do not express RNA-transcripts of these Rod genes so what is this picking up? Taken together, the conclusion that there are Rod-like MG are based off scRNA-seq data (which is likely ambient contamination) and these FISH images. I don't think this data warrants the conclusion that MG upregulate Rod genes in response to CCA.

      Given the results of RNA in situ hybridization on isolated MG, we revisited the result of the RNA in situ hybridization on retinal sections as well. We performed RNA in situ in the retinal section at 1 week post CCA treatment, expecting to see lower Gnat1 and Rho signals in the ONL-localizing MG compared to 3 weeks and 4 months post CCA treatment. However, we observed similar levels across all three time points (data not shown). The lack of dynamic changes in rod gene expression levels also suggests contamination from tightly surrounding neighboring rods. Consequently, we have reinterpreted the scRNA-seq and RNA FISH data and withdrawn the conclusion that MG upregulated rod genes after CCA treatment. We thank the reviewer for pointing out this potential issue and helping us avoid an incorrect conclusion.

      Figure 5

      (14) Similar point to above but this Glul probe seems odd, why is it throughout the ONL but completely dark through the IPL, this should also be in astrocytes can you see it in the GCL? These retinas look cropped at the INL where below is completely black. The whole retinal section should be shown. Antibodies exist to GS that work in mouse along with many other MG genes, IHC or western blots could be done to better serve this point.

      We have replaced the images in Figure 4 in the revised manuscript. Additionally, we have performed the Sox9 antibody staining to demonstrate partial MG dedifferentiation following CCA treatment (Figure 5).

      Figure 6

      (15) Figure 6D is not a co-labeled OTX2+/ TdTomato+ cell, Otx2 will fill out the whole nucleus as can be seen with examples from other MG-reprogramming papers in the field (Hoang, et al. 2020; Todd, et al. 2020; Palazzo, et al. 2022). You can clearly see in the example in Figure 6D the nucleus extending way beyond Otx2 expression as it is probably overlapping in space. Other examples should be shown, however, considering less than 1% of cells were putatively Otx2+, the safer interpretation is that these cells are not differentiating into neurons. At least 99.5% are not.

      We have replaced the image of Otx2+ Tdt+ Edu+ cell, which shows the whole nucleus filled with strong Otx2 staining.  

      (16) Same as above Figure 6I is not convincingly co-labeled HuC/D is an RNA-binding protein and unfortunately is not always the clearest stain but this looks like background haze in the INL overlapping. Other amacrine markers could be tested, but again due to the very low numbers, I think no neurogenesis is occurring.

      Since we didn’t find HuC/D+Tdt+EdU+ cells at 3 weeks post CCA treatment, we believe that the weak HuC/D+ staining in the MG daughter cells at 4 months is not background, but rather reflects an incomplete neurogenic switch. This suggests that the process of neurogenesis may be ongoing but not fully realized within the observed timeframe without additional stimuli.

      (17) In the text the authors are accidently referring to Figure 6 as Figure 7.

      We thank the reviewer for pointing out the mistake. We will correct the mistake in the revised manuscript.

      Figure 7

      (18) I like this figure and the concept that you can have additional MG proliferating without destroying the retina or compromising vision. This is reminiscent of the chick MG reprogramming studies in which MG proliferate in large numbers and often do not differentiate into neurons yet still persist de-laminated for long time points.

      General:

      (19) The title should be changed, as I don't believe there is any convincing evidence of regeneration of neurons. Understanding the barriers to MG cell-cycle re-entry are important and I believe the authors did a good job in that respect, however it is an oversell to report regeneration of neurons from this data.

      We thank the reviewer for the suggestion. We have changed the title to “Simultaneous cyclin D1 overexpression and p27kip1 knockdown enable robust Müller glia cell cycle reactivation in uninjured mouse retina” in the revised manuscript.

      (20) This paper uses multiple mouse lines and it is often confusing when the text and figures switch between models. I think it would be helpful to readers if the mouse strain was added to graphical paradigms in each figure when a different mouse line is employed.

      We have labeled the mouse lines used in each experiment in the figures where appropriate.

    1. Author response:

      The following is the authors’ response to the original reviews.

      Public Reviews:

      Reviewer #1 (Public review):

      Summary:

      Mehmet Mahsum Kaplan et al. demonstrate that Meis2 expression in neural crest-derived mesenchymal cells is crucial for whisker follicle (WF) development, as WF fails to develop in wnt1-Cre;Meis2 cKO mice. Advanced imaging techniques effectively support the idea that Meis2 is essential for proper WF development and that nerves, while affected in Meis2 cKO, are dispensable for WF development and not the primary cause of WF developmental failure. The study also reveals that although Meis2 significantly downregulates Foxd1 in the mesenchyme, this is not the main reason for WF development failure. The paper presents valuable data on the role of mesenchymal Meis2 in WF development. However, further quantification and analysis of the WF developmental phenotype would be beneficial in strengthening the claim that Meis2 controls early WF development rather than causing a delay or arrest in development. A deeper sequencing data analysis could also help link Meis2 to its downstream targets that directly impact the epithelial compartment.

      Strengths:

      (1) The authors describe a novel molecular mechanism involving Mesenchymal Meis2 expression, which plays a crucial role in early WF development.

      (2) They employ multiple advanced imaging techniques to illustrate their findings beautifully.

      (3) The study clearly shows that nerves are not essential for WF development.

      We thank the reviewer for valuable comments that will help improve our study.

      Weaknesses:

      (1) The authors claim that Meis2 acts very early during development, as evidenced by a significant reduction in EDAR expression, one of the earliest markers of placode development. While EDAR is indeed absent from the lower panel in Figure 3C of the Meis2 cKO, multiple placodes still express EDAR in the upper two panels of the Meis2 cKO. The authors also present subsequent analysis at E13.3, showing one escaped follicle positive for SHH and Sox9 in Figures 1 and 3. Does this suggest that follicles are specified but fail to develop? Alternatively, could there be a delay in follicle formation? The increase in Foxd1 expression between E12.5 and E13.5 might also indicate delayed follicle development, or as the authors suggest, follicles that have escaped the phenotype. The paper would significantly benefit from robust quantification to accompany their visual data, specifically quantifying EDAR, Sox9, and Foxd1 at different developmental stages. Additionally, analyzing later developmental stages could help distinguish between a delay or arrest in WF development and a complete failure to specify placodes.

      The earliest DC (FOXD1) and placodal (EDAR, LEF1) markers tested in this study were observed only in the escaped WFs whereas these markers were missing in expected WF sites in mutants. This was also reflected in the loss of typical placodal morphology in the mutant’s epithelium. On the other hand, escaped WFs developed normally as shown by the analysis in Supp Fig 1A-B showing their normal size. These data suggest that development of escaped WFs is not delayed because they would appear smaller in size. To strengthen this conclusion, we assessed whisker development at E18.5 in Meis2 cKO mice by EDAR staining and results are shown in newly added Supplementary Figure 2. This experiment revealed that whisker phenotype persisted until E18.5 therefore this phenotype cannot be explained by a developmental delay.

      As far as quantification is concerned, we have already quantified the number of whiskers in controls and mutants at E12.5 and E13.5 in all whole mount experiments we did, i.e. Shh ISH and SOX9 or EDAR whole mount IFC. We pooled all these numbers together and calculated the whisker number reduction to 5.7+/-2.0% at E12.5 and 17.1+/-5.9 at E13.5. Line:132-134.

      (2) The authors show that single-cell sequencing reveals a reduction in the pre-DC population, reduced proliferation, and changes in cell adhesion and ECM. However, these changes appear to affect most mesenchymal cells, not just pre-DCs. Moreover, since E12.5 already contains WFs at different stages of development, as well as pre-DCs and DCs, it becomes challenging to connect these mesenchymal changes directly to WF development. Did the authors attempt to re-cluster only Cluster 2 to determine if a specific subpopulation is missing in Meis2 cKO? Alternatively, focusing on additional secreted molecules whose expression is disrupted across different clusters in Meis2 cKO could provide insights, especially since mesenchymal-epithelial communication is often mediated through secreted molecules. Did the authors include epithelial cells in the single-cell sequencing, can they look for changes in mesenchyme-epithelial cell interactions (Cell Chat) to indicate a possible mechanism?

      We agree with the reviewer that the effect of Meis2 on cell proliferation and expression of cell adhesion and ECM markers are more general because they take place in the whole underlying mesenchyme. Our genetic tools did not allow specific targeting of DC or pre-DCs. Nonetheless, we trust that our data show that mesenchymal Meis2 is required for the initial steps of WF development including Pc formation. As far as bioinformatics data are concerned, this data set was taken from the large dataset GSE262468 covering the whole craniofacial region which led to very limited cell numbers in the cluster 2 (DC): WT_E12_5 --> 28, WT_E13_5 --> 131, MUT_E12_5 --> 19, MUT_E13_5 --> 28. Unfortunately, such small cell numbers did not allow further sub-clustering, efficient normalization, integration and conclusions from their transcriptional profiles. Although a number of interesting differentially expressed genes were identified (see supplementary datasets), none of them convincingly pointed at reasonable secreted molecule candidate. 

      We agree with the reviewer that cellchat analysis could provide robust indication of the mesenchymal-epithelial communication, however our datasets included only mesenchymal cell population (Wnt1-Cre2progeny) and epithelial cells were excluded by FACS prior to sc RNA-seq. (Hudacova et al. https://doi.org/10.1016/j.bone.2024.117297)

      (3) The authors aim to link Meis2 expression in the mesenchyme with epithelial Wnt signaling by analyzing Lef1, bat-gal, Axin1, and Wnt10b expression. However, the changes described in the figures are unclear, and the phenotype appears highly variable, making it difficult to establish a connection between Meis2 and Wnt signaling. For instance, some follicles and pre-condensates are Lef1 positive in Meis2 cKO. Including quantification or providing a clearer explanation could help clarify the relationship between mesenchymal Meis2 and Wnt signaling in both epidermal and mesenchymal cells. Did the authors include epithelial cells in the sequencing? Could they use single-cell analysis to demonstrate changes in Wnt signaling?

      We have now analyzed changes in LEF1 staining intensity in the epithelium and in the upper dermis. According to these quantifications, we observed a considerable decline in the number of LEF1+ placodes in the epithelium which corresponds to the lower number of placodes. On the other hand, LEF1 intensity in the ‘escaped’ placodes were similar between controls and mutants. LEF1 signal in the upper dermis is very strong overall and its quantification did not reveal any changes in the DC and non-DC region of the upper dermis. These data corroborate with our conclusion that Meis2 in the mesenchyme is not crucial for the dermal WNT signaling but is required for induction of LEF1 expression in the epithelium. However, once ‘escaper’ placodes appear, they display normal wnt signaling in Pc, DC and subsequent development. These quantitative data have been added to the revised manuscript. Line247-260.

      (4) Existing literature, including studies on Neurog KO and NGF KO, as well as the references cited by the authors, suggest that nerves are unlikely to mediate WF development. While the authors conduct a thorough analysis of WF development in Neurog KO, further supporting this notion, this point may not be central to the current work. Additionally, the claim that Meis2 influences trigeminal nerve patterning requires further analysis and quantification for validation.

      We agree with the reviewer that analysis of the Neurogenin1 knockout mice should not be central to this report. Nonetheless, a thorough analysis of WF development in Neurog1 KO was needed to distinguish between two possible mechanisms: whisker phenotype in Meis2 cKO results from 1. impaired nerve branching 2. Function of Meis2 in the mesenchyme. We will modify the text accordingly to make this clearer to readers. We also agree that nerve branching was not extensively analyzed in the current study but two samples from mutant mice were provided (Fig1 and Supp Videos), reflecting the consistency of the phenotype (see also Machon et al. 2015). This section was not central to this report either but led us to focus fully on the mesenchyme. We think that Meis2 function in cranial nerve development is very interesting and deserves a separate study.

      We have edited the introduction to reflect the literature better. Line70-79.

      (5) Meis2 expression seems reduced but has not entirely disappeared from the mesenchyme. Can the authors provide quantification?

      We have attempted to quantify MEIS2 staining in the snout dermis. However, the background fluorescence made it challenging to reliable quantify. Additionally, since at the point, dermal region where MEIS2 expression is relevant to induce WF formation is not known, we were unable to determine the regions to analyze. Instead, we now added three additional images from multiple regions of the snout sections stained with MEIS2 antibody in Supplementary Figure 1C. We believe newly added images will make our conclusion that MEIS2 is efficiently deleted in the mutants more convincing.

      Reviewer #2 (Public review):

      Summary:

      In this manuscript, Kaplan et al. study mesenchymal Meis2 in whisker formation and the links between whisker formation and sensory innervation. To this end, they used conditional deletion of Meis2 using the Wnt1 driver. Whisker development was arrested at the placode induction stage in Meis2 conditional knockouts leading to the absence of expression of placodal genes such as Edar, Lef1, and Shh. The authors also show that branching of trigeminal nerves innervating whisker follicles was severely affected but that whiskers did form in the complete absence of trigeminal nerves.

      Strengths:

      The analysis of Meis2 conditional knockouts convincingly shows a lack of whisker formation and all epithelial whisker/hair placode markers were analyzed. Using Neurog1 knockout mice, the authors show equally convincingly that whiskers and teeth develop in the complete absence of trigeminal nerves.

      We thank the reviewer for valuable comments that will help improve our study.

      Weaknesses:

      The manuscript does not provide much mechanistic insight as to why mesenchymal Meis2 leads to the absence of whisker placodes. Using a previously generated scRNA-seq dataset they show that two early markers of dermal condensates, Foxd1 and Sox2, are downregulated in Meis2 mutants. However, given that placodes and dermal condensates do not form in the mutants, this is not surprising and their absence in the mutants does not provide any direct link between Meis2 and Foxd1 or Sox2. (The absence of a structure evidently leads to the absence of its markers.)

      We apologize for unclear explanation of our data. We meant that Meis2 is functionally upstream of Foxd1 because Foxd1 is reduced upon Meis2 deletion. This means that during WF formation, Meis2 operates before Foxd1 induction and does not mean necessarily that Meis2 directly controls expression of Foxd1. Yes, we agree with reviewer’s note that Foxd1 and Sox2, as known DC markers, decline because the number of WF declines. We wanted to convince readers that Meis2 operates very early in the GRN hierarchy during WF development. We also admit that we provide poor mechanistic insights into Meis2 function as a transcription factor. We think that this weak point does not lower the value of the report showing indispensable role of Meis2 in WFs.

      Recommendations for the authors:

      Reviewer #1 (Recommendations for the authors):

      The text could benefit from editing.

      We have proofread the text.

      Some information is missing from the materials and methods section - a description of sequenced cells, the ISH protocol used, etc.

      Methodological section has been updated and single-cell experiments were performed and described in detail by Hudacova et al. 2025  (https://doi.org/10.1016/j.bone.2024.117297). We have utilized these datasets for scRNA analysis which has been described sufficiently in the referred paper. Reference for standard in site protocol has been added.

      Reviewer #2 (Recommendations for the authors):

      In the Introduction of the paper, the authors raise the question on the role of innervation in whisker follicle induction "It has been speculated that early innervation plays a role in initiating WF formation (ref. 1)"...and..."this revives the previous speculations that axonal network may be involved in WF positioning". However, the authors forget to mention that Wrenn & Wessless, 1984 (reference 1 in the manuscript) made exactly the opposite conclusion and stated e.g. "Nerve trunks and branches are present in the maxillary process well before any sign of vibrissa formation. Because innervation is so widespread there appears to be no immediate temporal correlation between the outgrowth of a nerve branch to a site and the generation of a vibrissa there. Furthermore, at the time just prior to the formation of the first follicle rudiment, there is little or no nerve branching to the presumptive site of that first follicle while branches are found more dorsally where vibrissae will not form until later." Therefore, I find that referring to the paper by Wrenn & Wessells is somewhat misleading. Given that the whisker follicles develop in ex vivo cultured whisker pads further hints that innervation is unlikely to play a role in whisker follicle induction.

      The Introduction also hints at the role of innervation in tooth induction but forgets to refer to the literature that shows exactly the opposite. Based on the evidence it rather appears that the developing tooth regulates the establishment of its own nerve supply, not that the nerves would regulate induction of tooth development.

      in my opinion, the Introduction should be partially rewritten to better reflect the literature.

      The introduction has been revised to better reflect the literature on the role of innervation on WF and tooth development. Line70-87.

      The authors conclude that Meis2 is upstream of Foxd1, but the evidence is based on the lack of Foxd1 expression in Meis2 mutants. However, as whiskers do not form, evidently all markers are also absent. More direct evidence of Meis2 being upstream of Foxd1 (or Sox2) should be presented to consolidate the conclusions.

      We have already reacted to this point above in the section Weaknesses. The text is now modified so that the interpretation is correct. Line: 407-409.

      Other comments:

      Author contributions state that XX performed experiments but the author list does not include anyone with such initials.

      This error has been corrected in revision.

    1. Author response:

      The following is the authors’ response to the original reviews.

      We thank the editor and reviewers for their supportive comments about our modeling approach and conclusions, and for raising several valid concerns; we address them briefly below. In addition, a detailed, point-by-point response to the reviewers’ comments are below, along with additions and edits we have made to the revised manuscript. 

      Concerns about model’s biological realism and impact on interpretations

      The goal of this paper was to use an interpretable and modular model to investigate the impact of varying sensorimotor delays. Aspects of the model (e.g. layered architecture, modularity) are inspired by biology; at the same time, necessary abstractions and simplifications (e.g. using an optimal controller) are made for interpretability and generalizability, and they reflect common approaches from past work. The hypothesized effects of certain simplifying assumptions are discussed in detail in Section 3.5. Furthermore, the modularity of our model allows us to readily incorporate additional biological realism (e.g. biomechanics, connectomics, and neural dynamics) in future work. In the revision, we have added citations and edits to the text to clarify these points.

      Concerns that the model is overly complex

      To investigate the impact of sensorimotor delays on locomotion, we built a closed-loop model that recapitulates the complex joint trajectories of fly walking. We agree that locomotion models face a tradeoff between simplicity/interpretability and realism — therefore, we developed a model that was as simple and interpretable as possible, while still reasonably recapitulating joint trajectories and generalizing to novel simulation scenarios. Along these lines, we also did not select a model that primarily recreates empirical data, as this would hinder generalizability and add unnecessary complexity to the model. We do not think these design choices are significant weaknesses of this model; in fact, few comparable models account for all joints involved in locomotion, and fewer explicitly compare model kinematics with kinematics from data. We have add citations and edits to the text to clarify these points in the revision. 

      Concerns about the validity of the Kinematic Similarity (KS) metric to evaluate walking

      We chose to incorporate only the first two PCA modes dimensions in the KS metric because the kernel density estimator performs poorly for high dimensional data. Our primary use of this metric was to indicate whether the simulated fly continues walking in the presence of perturbations. For technical reasons, it is not feasible to perform equivalent experiments on real walking flies, which is one of the reasons we explore this phenomenon with the model. We note the dramatic shift from walking to nonwalking as delay increases (Figure 5). To be thorough, in the revision, we have investigated the effect of incorporating additional PCA modes, and whether this affects the interpretation of our results. We have additionally added to the discussion and presentation of the KS metric to clarify its purpose in this study. We agree with the reviewers that the KS metric is too coarse to reflect fine details of joint kinematics; indeed, in the unperturbed case, we evaluate our model’s performance using other metrics based on comparisons with empirical data (Figures 2, 7, 8). 

      Public Reviews:

      Reviewer #1 (Public Review):

      Summary:

      In this work, the authors present a novel, multi-layer computational model of motor control to produce realistic walking behaviour of a Drosophila model in the presence of external perturbations and under sensory and motor delays. The novelty of their model of motor control is that it is modular, with divisions inspired by the fly nervous system, with one component based on deep learning while the rest are based on control theory. They show that their model can produce realistic walking trajectories. Given the mostly reasonable assumptions of their model, they convincingly show that the sensory and motor delays present in the fly nervous system are the maximum allowable for robustness to unexpected perturbations.

      Their fly model outputs torque at each joint in the leg, and their dynamics model translates these into movements, resulting in time-series trajectories of joint angles. Inspired by the anatomy of the fly nervous system, their fly model is a modular architecture that separates motor control at three levels of abstraction:

      (1) oscillator-based model of coupling of phase angles between legs,

      (2) generation of future joint-angle trajectories based on the current state and inputs for each leg (the trajectory generator), and

      (3) closed-loop control of the joint-angles using torques applied at every joint in the model (control and dynamics).

      These three levels of abstraction ensure coordination between the legs, future predictions of desired joint angles, and corrections to deviations from desired joint-angle trajectories. The parameters of the model are tuned in the absence of external perturbations using experimental data of joint angles of a tethered fly. A notable disconnect from reality is that the dynamics model used does not model the movement of the body and ground contacts as is the case in natural walking, nor the movement of a ball for a tethered fly, but instead something like legs moving in the air for a tethered fly.

      n order to validate the realism of the generated simulated walking trajectories, the authors compare various attributes of simulated to real tethered fly trajectories and show qualitative and quantitative similarities, including using a novel metric coined as Kinematic Similarity (KS). The KS score of a trajectory is a measure of the likelihood that the trajectory belongs to the distribution of real trajectories estimated from the experimental data. While such a metric is a useful tool to validate the quality of simulated data, there is some room for improvement in the actual computation of this score. For instance, the KS score is computed for any given time-window of walking simulation using a fraction of information from the joint-angle trajectories. It is unclear if the remaining information in joint-angle trajectories that are not used in the computation of the KS score can be ignored in the context of validating the realism of simulated walking trajectories.

      The authors validate simulated walking trajectories generated by the trained model under a range of sensorimotor delays and external perturbations. The trained model is shown to generate realistic jointangle trajectories in the presence of external perturbations as long as the sensorimotor delays are constrained within a certain range. This range of sensorimotor delays is shown to be comparable to experimental measurements of sensorimotor delays, leading to the conclusion that the fly nervous system is just fast enough to be robust to perturbations.

      Strengths:

      This work presents a novel framework to simulate Drosophila walking in the presence of external perturbations and sensorimotor delay. Although the model makes some simplifying assumptions, it has sufficient complexity to generate new, testable hypotheses regarding motor control in Drosophila. The authors provide evidence for realistic simulated walking trajectories by comparing simulated trajectories generated by their trained model with experimental data using a novel metric proposed by the authors. The model proposes a crucial role in future predictions to ensure robust walking trajectories against external perturbations and motor delay. Realistic simulations under a range of prediction intervals, perturbations, and motor delays generating realistic walking trajectories support this claim. The modular architecture of the framework provides opportunities to make testable predictions regarding motor control in Drosophila. The work can be of interest to the Drosophila community interested in digitally simulating realistic models of Drosophila locomotion behaviors, as well as to experimentalists in generating testable hypotheses for novel discoveries regarding neural control of locomotion in Drosophila. Moreover, the work can be of broad interest to neuroethologists, serving as a benchmark in modelling animal locomotion in general.

      We thank the reviewer for their positive comments.

      Weaknesses:

      As the authors acknowledge in their work, the control and dynamics model makes some simplifying assumptions about Drosophila physics/physiology in the context of walking. For instance, the model does not incorporate ground contact forces and inertial effects of the fly's body. It is not clear how these simplifying assumptions would affect some of the quantitative results derived by the authors. The range of tolerable values of sensorimotor delays that generate realistic walking trajectories is shown to be comparable with sensorimotor delays inferred from physiological measurements. It is unclear if this comparison is meaningful in the context of the model's simplifying assumptions.

      We now discuss how some of these assumptions affect the quantitative results in the section “Towards biomechanical and neural realism”. We reproduce the relevant sentences below:

      “The inclusion of explicit leg-ground contact interactions would also make it harder for the model to recover when perturbed, because perturbations during walking often occur upon contact with the ground (e.g. the ground is slippery or bumpy).”

      “We anticipate that the increased sensory resolution from more detailed proprioceptor models and the stability from mechanical compliance of limbs in a more detailed biomechanical model would make the system easier to control and increase the allowable range of delay parameters. Conversely, we expect that modeling the nonlinearity and noise inherent to biological sensors and actuators may decrease the allowable range of delay parameters.”

      The authors propose a novel metric coined as Kinematic Similarity (KS) to distinguish realistic walking trajectories from unrealistic walking trajectories. Defining such an objective metric to evaluate the model's predictions is a useful exercise, and could potentially be applied to benchmark other computational animal models that are proposed in the future. However, the KS score proposed in this work is calculated using only the first two PCA modes that cumulatively account for less than 50% of the variance in the joint angles. It is not obvious that the information in the remaining PCA modes may not change the log-likelihood that occurs in the real walking data.

      The primary reason we designed the KS metric was to determine whether the simulated fly continues walking in the presence of perturbations. We initially limited the analysis of the KS to the first 2 principal components. For completeness, we now investigate the additional principal components in Appendix 9 and the effect of evaluating KS with different numbers of components in Appendix 10. 

      Overall, the results look similar when including additional components for impulse perturbations. For stochastic perturbations, the range of similar walking decreases as we increase the number of components used to evaluate walking kinematics. Comparing this with Appendix 9, which shows that higher components represent higher frequencies of the walking cycle, we conclude that at the edge of stability for delays (where sum of sensory and actuation delays are about 40ms), flies can continue walking but with impaired higher frequencies (relative to no perturbations) during and after perturbation. 

      We added the following text in the methods:

      “We chose 2 dimensions for PCA for two key reasons. First, these 2 dimensions alone accounted for a large portion of the variance in the data (52.7% total, with 42.1% for first component and 10.6% for second component). There was a big drop in variance explained from the first to the second component, but no sudden drop in the next 10 components (see Appendix 9). Second, the KDE procedure only works effectively in low-dimensional spaces, and the minimal number of dimensions needed to obtain circular dynamics for walking is 2. We investigate the effect of varying the number of dimensions of PCA in Appendix 10.”

      (Note that we have corrected the percentage of variance accounted for by the principal components, as these numbers were from an older analysis prior to the first draft.)

      We also reference Appendix 10 in the results:

      “We observed that robust walking was not contingent on the specific values of motor and sensory delay, but rather the sum of these two values (Fig. 5E). Furthermore, as delay increases, higher frequencies of walking are impacted first before walking collapses entirely (Appendix 10).”

      Reviewer #2 (Public Review):

      Summary:

      In this study, Karashchuk et al. develop a hierarchical control system to control the legs of a dynamic model of the fly. They intend to demonstrate that temporal delays in sensorimotor processing can destabilize walking and that the fly's nervous system may be operating with as long of delays as could possibly be corrected for.

      Strengths:

      Overall, the approach the authors take is impressive. Their model is trained using a huge dataset of animal data, which is a strength. Their model was not trained to reproduce animal responses to perturbations, but it successfully rejects small perturbations and continues to operate stably. Their results are consistent with the literature, that sensorimotor delays destabilize movements.

      Weaknesses:

      The model is sophisticated and interesting, but the reviewer has great concerns regarding this manuscript's contributions, as laid out in the abstract:

      (1) Much simpler models can be used to show that delays in sensorimotor systems destabilize behavior (e.g., Bingham, Choi, and Ting 2011; Ashtiani, Sarvestani, and Badri-Sproewitz 2021), so why create this extremely complex system to test this idea? The complexity of the system obscures the results and leaves the reviewer wondering if the instability is due to the many, many moving parts within the model. The reviewer understands (and appreciates) that the authors tested the impact of the delay in a controlled way, which supports their conclusion. However, the reviewer thinks the authors did not use the most parsimonious model possible, and as such, leave many possible sources for other causes of instability.

      We thank the reviewer for this observation — we agree that we did not make the goal of the work quite clear. The goal of this paper was to build an interpretable and generalizable model of fly walking, which was then used to investigate varying sensorimotor delays in the context of locomotion. To this end, we used a modular model to recreate walking kinematics, and then investigated the effect of delays on locomotion. Locomotion in itself is a complex phenomenon — thus, we have chosen a model that is complex enough to reasonably recapitulate joint trajectories, while remaining interpretable.

      We have clarified this in the text near the end of the introduction:

      “Here, we develop a new, interpretable, and generalizable model of fly walking, which we use to investigate the impact of varying sensorimotor delays in Drosophila locomotion.”

      We also emphasize the investigation of sensorimotor delays in the context of locomotion in the beginning of the “Effect of sensory and motor delays on walking” section:

      “... we used our model to investigate how changing sensory and motor delays affects locomotor robustness.”

      We also remark that while they are very relevant papers for our work, neither of the prior papers focus on locomotion: the first involves a 2D balance model of a biped, and the second involves drop landings of quadrupeds.

      Lastly, we note that the investigation of delay is not the only use for this model —  in the future, this model can also be used to study other aspects of locomotion such as the role of proprioceptive feedback (see “Role of proprioceptive feedback in fly walking” section). The layered framework of the model can also be extended to other animals and locomotor strategies (see “Layered model produces robust walking and facilitates local control” section”).

      (2) In a related way, the reviewer is not sure that the elements the authors introduced reflect the structure or function of the fly's nervous system. For example, optimal control is an active field of research and is behind the success of many-legged robots, but the reviewer is not sure what evidence exists that suggests the fly ventral nerve cord functions as an optimal controller. If this were bolstered with additional references, the reviewer would be less concerned.

      We thank the reviewer for the comment — we have now further clarified how our model elements reflect the fly’s nervous system. The elements we introduce are plausible but only loosely analogous to the fly’s nervous system. While we draw parallels from these elements to anatomy (e.g. in Fig 1A-B, and in the first paragraph of the Results section), we do not mean to suggest that these functional elements directly correspond to specific structures in the fly’s nervous system. A substantial portion of the suggested future work (see “Towards biomechanical and neural realism”) aims to bridge the gap between these functional elements and fly physiology, which is beyond the scope of this work. 

      We have added clarifying text to the Results section:

      “While the model is inspired by neuroanatomy, its components do not strictly correspond to components of the nervous system --- the construction of a neuroanatomically accurate model is deferred to future work (see Discussion).”

      In the specific case of optimal control — optimal control is a theoretical model that predicts various aspects of motor control in humans, there is evidence that optimal control is implemented by the human nervous system (Todorov and Jordan, 2002; Scott, 2004; Berret et al., 2011). Based on this, we make the assumption that optimal control is a reasonable model for motor control in flies implemented by the fly nervous system as well. Fly movement makes use of proprioceptive feedback signals (Mendes et al., 2013; Pratt et al., 2024; Berendes et al., 2016), and optimal control is a plausible mechanism that incorporates feedback signals into movement.

      We have added the following clarifying text in the Results section: 

      “The optimal controller layer maintains walking kinematics in the presence of sensori motor delays and helps compensate for external perturbations. This design was inspired by optimal control-based models of movements in humans (Todorov and Jordan, 2002; Scott, 2004; Berret et al., 2011)”

      (3) "The model generates realistic simulated walking that matches real fly walking kinematics...". The reviewer appreciates the difficulty in conducting this type of work, but the reviewer cannot conclude that the kinematics "match real fly walking kinematics". The range of motion of several joints is 30% too small compared to the animal (Figure 2B) and the reviewer finds the video comparisons unpersuasive. The reviewer would understand if there were additional constraints, e.g., the authors had designed a robot that physically could not complete the prescribed motions. However the reviewer cannot think of a reason why this simulation could not replicate the animal kinematics with arbitrary precision, if that is the goal.

      We agree with the reviewer that the model-generated kinematics are not perfectly indistinguishable from real walking kinematics, and now clarify this in the text. We also agree with the reviewer that one could build a model that precisely replicates real kinematics, but as they intuit, that was not our goal. Our goal was to build a model that both replicates animal kinematics, and is interpretable and generalizable (which allows us to investigate what happens when perturbations and varying sensorimotor delays are introduced). There is a trade-off between realism and generalizability — a simulation that fully recreates empirical data would require a model that is completely fit to data, which is likely to be more complex (in terms of parameters required) and less generalizable to novel scenarios. We have made design choices that result in a model that balances these trade-offs. We do not consider this to be a weakness of the model; in fact, few comparable models account for all joints involved in locomotion, and fewer explicitly compare model kinematics with kinematics from data.

      We have tempered the language in the abstract:

      “The model generates realistic simulated walking that resembles real fly walking kinematics”

      The tempered statement, we believe, is a fair characterization of the walking — it resembles but does not perfectly match real kinematics.

      We have also introduced clarifying text in the introduction:

      “Overall, existing walking models focus on either kinematic or physiological accuracy, but few achieve both, and none consider the effect of varying sensorimotor delays. Here, we develop a new, interpretable, and generalizable model of fly walking, which we use to investigate the impact of varying sensorimotor delays in Drosophila locomotion.”

      Recommendations for the authors:

      Reviewer #1 (Recommendations For The Authors):

      Potential typo on page 5:

      2.1.2 Joint kinematics trajectory generator

      Paragraph 4, last line: Original text - ".....it also estimates the current phase". Suggested correction - "...it also estimates the current phase velocity"

      Done

      Potential typo on page 8:

      2.3 Model maintains walking under unpredictable external perturbations.

      Paragraph 3, line 2: Original text - "...brief, unexpected force (e.g. legs slipping on an unstable surface)".

      Consider replacing force with motion, or providing an example of a force as opposed to displacement (slipping).

      Done

      Potential typo on page 8:

      2.3 Model maintains walking under unpredictable external perturbations.

      Paragraph 3, line 4: Original text - "The magnitude of this velocity is drawn from a normal distribution...".

      Is this really magnitude? If so, please discuss how the sign (+/-) is assigned to velocity, and how the normal distribution is centred so as to sample only positive values representing magnitude.

      Indeed the magnitude of the velocity is drawn from a normal distribution. A positive or negative sign is then assigned with equal odds. We have added text to clarify this:

      “The sign of the velocity was drawn separately so that there is equal likelihood for negative or positive perturbation velocities.”

      Page 8:

      2.3 Model maintains walking under unpredictable external perturbations.

      In Paragraph 5: Why is the data reduced to only 2 dimensions? Could higher order PCA modes (cumulatively accounting for more than 50% variance in the data) not have distinguishing information between realistic and unrealistic walking trajectories?

      We provide a longer response for this in the public review above.

      Page 11:

      Why wouldn't a system trained in the presence of external perturbations perform better? What is the motivation to remove external perturbations during training?

      We agree that a system trained in the presence of external perturbations would probably perform better — however, we do not have data that contains walking with external perturbations. Nothing was removed — all the data used in this study involve a fly walking without perturbations.

      We have added a clarification:

      “our model maintains realistic walking in the presence of external dynamic perturbations, despite being trained only on data of walking without perturbations (no perturbation data was available).”

      Page 16:

      4.1 Tracking joint angles of D. melanogaster walking in 3D.

      Paragraph 1: Readers who wish to collect similar data might benefit from specifying the exposure time, animal size in pixels (or camera sensor format and field of view), in addition to the frame rate. Alternatively, consider mentioning the camera and lens part numbers provided by the manufacturer.

      This is a good point. We have updated the text to include these specifications:

      “We obtained fruit fly D. melanogaster walking kinematics data following the procedure previously described in (Karashchuk et al, 2021). Briefly, a fly was tethered to a tungsten wire and positioned on a frictionless spherical treadmill ball suspended on compressed air. Six cameras (Basler acA800-510um with Computar zoom lens MLM3X-MP) captured the movement of all of the fly's legs at 300 Hz. The fly size in pixels ranges from about 300x300 up to 700x500 pixels across the 6 cameras. Using Anipose, we tracked 30 keypoints on the fly, which are the following 5 points on each of the 6 legs: body-coxa, coxa-femur, femur-tibia, and tibia-tarsus joints, as well as the tip of the tarsus.”

      Potential typos on page 18:

      4.3.3 Training procedure

      Paragraph 2, line 1: Original text - "..(, p)"

      Do the authors mean "...(, )"

      Paragraph 2, line 2: Original text - "... (,, v, p)" Do the authors mean "... (,, v, )"?

      Paragraph 3, line 3: Original text - "... (,, v, p)" Do the authors mean "... (,, v, )"?

      Thank you for pointing out this issue. We have now fixed the phase p to be \phi to be consistent with the rest of the text.

      Paragraph 3, line 3: Original text - "...()"

      Do the authors mean "(d)"? If not, please discuss the difference between and d.

      Thank you for pointing this out. \hat \theta and \theta_d were used interchangeably which is confusing. We have standardized our reference to the desired trajectory as \theta_d throughout the text.

      Page 19:

      Typo after eqn. (6):

      Original text: "where x := q - q, ... A and B are Jacobians with respect to...."

      Correction: "where x := q - q, ... Ac and Bc are Jacobians with respect to...."

      Similar corrections in eqn. 7 and eqn. 8: A and B should be replaced with Ac and Bc. Done

      Page 19, eqn. (10b):

      Should the last term be qd(t+T) as opposed to qd(t+1)?

      No: in fact (10a) contains the typo: it should be y(t+1) as opposed to y(t+T). This has been fixed.

      Page 19

      The authors' detailed description of the initial steps leading up to the dynamics model, involving the construction of the ODE, linearizing the system about the fixed point makes the text broadly accessible to the general reader. Similarly, adding some more description of the predictive model (eqn. 11 - 15) could improve the text's accessibility and the reader's appreciation for the model. This is especially relevant since the effects of sensorimotor delay and external perturbations, which are incorporated in the control and dynamics model, form a major contribution to this work. What do the matrices F, G, L, H, and K look like for the Drosophila model? Are there any differences between the model in Stenberg et al. (referenced in the paper) and the authors' model for predictive control? Are there any differences in the assumptions made in Stenberg et al. compared to the model presented in this work? The readers would likely also benefit from a figure showing the information flow in the model, and describing all the variables used in the predictive control model in eqn. 11 through eqn. 15 (analogous to Figure 1 in Stenberg et al. (2022)). Such a detailed description of the control and dynamics model would help the reader easily appreciate the assumptions made in modelling the effects of sensorimotor delay and external perturbations.

      Done

      Page 20:

      Eqn. 12: Should z(t+1) be z(t+T) instead?

      Similar comment for eqn. 14

      No: we made a mistake in (10a); there should be no (t+T) terms; all terms should be (t+1) terms to reflect a standard discrete-time difference equation.

      Eqn. 13: r(t) can be defined explicitly

      Done

      4.5 Generate joint trajectories of the complete model with perturbations Paragraph 2, line 2: Please read the previous comment

      \hat \theta and \theta_d were previously used interchangeably which is confusing. We have standardized our reference to the desired trajectory as \theta_d throughout the text.

      Original text - "Every 8 timesteps, we set :=...."

      Does this mean dis set to? If so, the motivation for this is not clear.

      We mean that \theta_d is set to be equal to \theta. We have replaced “:=” with “=” for clarity.

      General comments for the authors:

      Could the authors discuss the assumptions regarding Drosophila physiology implied in the control model?

      The control model is primarily included as a plausible functional element of the fly’s nervous system, and as such implies minimal assumptions on physiology itself. The main assumption, which is evident from the description of the model components, is that the fly uses proprioceptive feedback information to inform future movements.

      We have added clarifying text to the Results section:

      “While the model is inspired by neuroanatomy, its components do not strictly correspond to components of the nervous system --- the construction of a neuroanatomically accurate model is deferred to future work (see Discussion).”

      The authors acknowledge the absence of ground contact forces in the model. It is probably worth discussing how this simplification may affect inferences regarding the acceptable range of sensorimotor delay in generating realistic walking trajectories.

      We agree, and discuss how some of these assumptions affect the quantitative results in the section “Towards biomechanical and neural realism”. We replicate the relevant sentences below:

      “The inclusion of explicit leg-ground contact interactions would also make it harder for the model to recover when perturbed, because perturbations during walking often occur upon contact with the ground (e.g. the ground is slippery or bumpy).”

      The effects of other simplifications are also mentioned in the same section.

      Can the authors provide an insight into why the use of a second derivative of joint angles as the output of the trajectory generator () leads to more realistic trajectories (4.3.1 Model formulation, paragraph 1)?

      Does the use of a second-order derivative of joint angles lead to drift error because of integration?

      Could the distribution of θd produced be out of the domain due to drift errors? Could this affect the performance of the neural network model approximating the trajectory generator?

      We are not sure why the second derivative works better than the first derivative. It is possible that modeling the system as a second order differential equation gives the network more ability to produce complex dynamics. 

      As can be seen in the example time series in Figures 2 and 3 and supplemental videos, there is no drift error from integration, so it is unlikely to affect the performance of the neural network.

      What does the model's failure (quantified by a low KS score) look like in the context of fly dynamics? What do the joint angles look like for low values of KS score? Does the fly fall down, for example?

      Since the model primarily considers kinematics, a low KS score means that kinematics are unrealistic, e.g. the legs attain unnatural angles or configurations. Examples of this can be seen in videos 4-7 (linked from Appendix 1 of the paper), as well as in the bottom row of Fig. 5, panel A. Here, at 40ms of motor delay, L2 femur rotation is seen to attain values that far exceed the normal ranges. 

      We have added a small clarification in the caption of Fig.5 panel A:

      “low KS indicates that the perturbed walking deviates from data and results in unnatural angles

      (as seen at 40ms motor delay)” 

      We remark that since our simulations do not incorporate contact forces (as the reviewer remarks above, we simulate something like legs moving in the air for a tethered fly), the fly cannot “fall down” per se. However, if forces were incorporated then yes, these unrealistic kinematics would correspond to a fly that falls down or is no longer walking.

      Reviewer #2 (Recommendations For The Authors):

      L49: "Computational models of locomotion do not typically include delay as a tunable parameter, and most existing models of walking cannot sustain locomotion in the presence of delays and external perturbations". This remark confuses the reviewer.

      (1) If models do not "typically" include delay as a tunable parameter, this suggests that atypical models do. Which models do? Please provide references.

      Our initial phrasing was confusing. We meant to say that most models do not include delay, and some models do include delay as a fixed value (rather than a tunable value). We clarify in the updated text, which is replicated below:

      “Computational models of locomotion typically have not included delays as a tunable parameter, although some models have included them as fixed values (Geyer and Herr, 2010; Geijtenbeek et al., 2013).”

      (2) Has the statement that most existing models cannot sustain locomotion with delays been tested? If so, provide references. If not, please remove this statement or temper the language.

      Since most models don’t include delays, they cannot be run in scenarios with delays. We clarify in the updated text, which is replicated below:

      “Computational models of locomotion have not typically included delays. Some have included delay as a fixed value rather than a tunable parameter (Geyer and Herr, 2010; Geijtenbeek et al., 2013). However, in general, the impact of sensorimotor delays on locomotor control and robustness remains an underexplored topic in computational neuroscience.”

      L57: "two of six legs lift off the ground at a time" - Two legs are off the ground at any time, but they do not "lift off" simultaneously in the fruit fly. To lift off simultaneously, contralateral leg pairs would need to be 33% out of phase with one another, but they are almost always 50% out of phase.

      Thank you for pointing out this oversight. We have updated the text accordingly:

      “Flies walk rhythmically with a continuum of stepping patterns that range from tetrapod (where two of six legs are off the ground at a time) to tripod (where three of six legs are off the ground at a time)"

      L88: "a new model of fly walking" - The intention of the authors is to produce a model from which to learn about walking in the fly, is that correct? The reviewer has read the paper several times now and wants to be sure that this is the authors' goal, not to engineer a control system for an animation or a robot.

      Indeed, this is our goal. We were previously unclear about this, and have made text edits to clarify this — we provide a longer response for this in the public review above (see (1)).

      L126: "These desired phases are synchronized across pairs of legs to maintain a tripod coordination pattern, even when subject to unpredictable perturbations." - Does the animal maintain tripod coordination even when perturbed? In the reviewer's experience, flies vary their interleg coordination all the time. The reviewer would also expect that if perturbed strongly (as the supplemental videos show), the animal would adapt its interleg coordination in response. The author finds this assumption to be a weak point in the paper for the use of this disturbance exploring animal locomotion.

      We do not know exactly how flies may react to our mechanical perturbations. However, we may hypothesize based on past papers. 

      Couzin-Fuchs et al (2015) apply a mechanical perturbation to walking cockroaches. They find that that tripod is temporarily broken immediately after the perturbation but the cockroach recovers to a full tripod within one step cycle. 

      DeAngelis et al (2019) apply optogenetic perturbations to fly moonwalker neurons that drive backward walking. Flies slow down following perturbation, but then recover after 200ms (about 2-3 steps) to their original speed (on average). 

      Thus, we think it is reasonable to model a fly’s internal phase coupling to maintain tripod and for its intended speed to remain the same even after a perturbation. 

      We do agree with the reviewer that it is plausible a fly might also slow down or even stop after a perturbation and we do not model such cases. We have added some text to the discussion on future work:

      “Future work may also model how higher-level planning of fly behavior interacts with the lowerlevel coordination of joint angles and legs. Walking flies continuously change their direction and speed as they navigate the environment (Katsov et al, 2017; Iwasaki et al 2024). Past work shows that flies tend to recover and walk at similar speeds following perturbations (DeAngelis et al, 2019), but individual flies might still change walking speed, phase coupling, or even transition to other behaviors, such as grooming. Modeling these higher-level changes in behavior would involve combining our sensorimotor model with models for navigation (Fisher 2022) or behavioral transitions (Berman et al, 2016).”

      L136: "...to output joint torques to the physical model of each leg" - Is this the ultimate output of the nervous system? Muscles are certainly not idealized torque generators. There are dynamics related to activation and mechanics. The reviewer is skeptical that this is a model of neural control in the animal, because the computation of the nervous system would be tuned to account for all these additional dynamics.

      We agree with the reviewer that joint torques are not the ultimate output of the nervous system. We use a torque controller because it is parsimonious, and serves our purpose of creating an interpretable and modular locomotion model.

      We also agree that muscles are an important consideration — we make mention of them later on in the paper under the section “Toward biomechanical and neural realism”, where we state “Another step toward biological realism is the incorporation of explicit dynamical models of proprioceptors, muscles, tendons, and other biomechanical aspects of the exoskeleton.”

      Our goal is not to directly model neural control of the animal. We have introduced text clarifications to emphasize this — we provide a longer response for this in the public review above (see (2)).

      L143: "To train the network from data, we used joint kinematics of flies walking on a spherical treadmill..." This is an impressive approach, but then the reviewer is confused about why the kinematics of the model are so different from those of the animal. The animal takes longer strides at a lower frequency than the model. If the model were trained with data, why aren't they identical? This kind of mismatch makes the reviewer think the approach in this paper is too complicated to address the main problem.

      The design of our trajectory generator model is one of the simplest for reproducing the output of a dynamical system. It consists of a multilayer perceptron model that models the phase velocity and joint angle accelerations at each timestep. All of its inputs are observable and interpretable: the current joint angles, joint angle derivatives, desired walking speed, and phase angle. 

      We chose this model for ease of interpretability, integration with the optimal controller, and to allow for generalization across perturbations. Given all of these constraints, this is the best model of desired kinematics we could obtain. We note that the simulated kinematics do match real fly kinematics qualitatively (Figure 2A and supplemental videos) and are close quantitatively (Figure 2B and C). We speculate that matching the animals’ strides at all walking frequencies may require explicitly modeling differences across individual flies. We leave the design and training of more accurate (but more complex) walking models for future work.

      We add some further discussion about fitting kinematics in the discussion:

      “Although we believe our model matches the fly walking sufficiently for this investigation, we do note that our model still underfits the joint angle oscillations in the walking cycle of the fly (see Figure 2 and Appendix 3). More precise fitting of the joint angle kinematics may come from increasing the complexity of the neural network architecture, improving the training procedure based on advances in imitation learning (Hussein et al., 2018), or explicitly accounting for individual differences in kinematics across flies (Deangelis et al., 2019; Pratt et al., 2024).”

      Figure 2: The reviewer thinks the violin plots in Figure 2C are misleading. Joint angles could be greater or less than 0, correct? If so, why not keep the sign (pos/neg) in the data? Taking the absolute value of the errors and "folding over" the distribution results in some strange statistics. Furthermore, the absolute value would shroud any systematic bias in the model, e.g., joint angles are always too small. The reviewer suggests the authors plot the un-rectified data and simply include 2 dashed lines, one at 5.56 degrees and one at -5.56 degrees.

      These violin plots are averages of errors over all phases within each speed. We chose to do this to summarize the errors across all phase angle plots, which are shown in detail in Appendix 3 and 4.

      For the reviewer, we have added a plot of the raw errors across all phase angle plots in Appendix 5, E.

      L156: Should "\phi\dot" be "\phi"?

      We originally had a typo: we said “phase” when we meant “phase velocity”. This has been fixed. \phi\dot is correct.

      L160: "This control is possible because the controller operates at a higher temporal frequency than the trajectory generator...". This statement concerns the reviewer. To the reviewer, this sounds like the higher-level control system communicates with the "muscles" at a higher frequency than the low-level control system, which conflicts with the hierarchical timescales at which the nervous system operates. Or do the authors mean that the optimal controller can perform many iterations in between updates from the trajectory generator level? If so, please clarify.

      We mean that the optimal controller can perform many iterations in between updates from the trajectory generator level. The text has been clarified:

      “This control is possible because the controller operates at a higher temporal frequency than the trajectory generator in the model. The controller can perform many iterations (and reject disturbances) in between updates to and from the trajectory generator.”

      L225: "We considered two types of perturbations: impulse and persistent stochastic". Are these realistic perturbations? Realistic perturbations such as a single leg slipping, or the body movement being altered would produce highly correlated joint velocities.

      These perturbations are not quite realistic — nonetheless, we illustrate their analogousness to real perturbations in the subsequent text in the paper, and restrict our simulations to ranges that would be biologically plausible (see Appendix 7). We agree that realistic perturbations would produce highly correlated joint accelerations and velocities, whereas our perturbations produce random joint accelerations. 

      L265: "...but they are difficult to manipulate experimentally..." This is true, but it can and has been done. The authors should cite:

      Bässler, U. (1993). The femur-tibia control system of stick insects-A model system for the study of the neural basis of joint control. Brain Research Reviews, 18(2), 207-226. 

      Thank you for the suggestion, we have incorporated it into the text at the end of the referenced sentence.

      L274: "...since the controller can effectively compensate for large delays by using predictions of joint angles in the future". But can the nervous system do this? Or, is there a reason to think that the nervous system can? The reviewer thinks the authors need stronger justification from the literature for their optimal control layer.

      To clarify, this sentence describes a feature of the model’s behavior when no external perturbations are present. This is not directly relevant to the nervous system, since organisms do not typically exist in an environment free of perturbations — we are not suggesting that the nervous system does this.

      In response to the question of whether the nervous system can compensate for delays using predictions: we know that delays are present in the nervous system, perturbations exist in the environment, and that flies manage to walk in spite of them. Thus, some type of compensation must exist to offset the effects of delays (the reviewer themself has provided some excellent citations that study the effects of delays). In our model, we use prediction as the compensation mechanism — this is one of our central hypotheses. We further discuss this in the section “Predictive control is critical for responding to perturbations due to motor delay”.

      L319: "The formulation of a modular, multi-layered model for locomotor control makes new experimentally-testable hypotheses about fly motor control...". What testable hypotheses are these? The authors should explicitly state them. They are not clear to the reviewer, especially given the nonphysiological nature of the control system and the mechanics.

      A number of testable hypotheses are mentioned throughout the Discussion section:

      “Our model predicts that at the same perturbation magnitude, walking robustness decreases as delays increase. This could be experimentally tested by altering conduction velocities in the fly, for example by increasing or decreasing the ambient temperature (Banerjee et al, 2021).  If a warmer ambient temperature decreases delays in the fly, but fly walking robustness remains the same in response to a fixed perturbation, this would indicate a stronger role for central control in walking than our modeling results suggest.”

      “In our model, robust locomotion was constrained by the cumulative sensorimotor delay. This result could be experimentally validated by comparing how animals with different ratios of sensory to motor delays respond to perturbations. Alternatively, it may be possible to manipulate sensory vs. motor delays in a single animal, perhaps by altering the development of specific neurons or ensheathing glia (Kottmeier et al., 2020). If sensory and motor delays have significantly different effects on walking quality, then additional compensatory mechanisms for delays could play a larger role than we expect, such as prediction through sensory integration, mechanical feedback, or compensation through central control.”

      “we hypothesize that removing proprioceptive feedback would impair an insect's ability to sustain locomotion following external perturbations.”

      “We propose that fly motor circuits may encode predictions of future joint positions, so the fly may generate motor commands that account for motor neuron and muscle delays.”

      L323: "...and biomechanical interactions between the limb and the environment". In the reviewer's experience, the primary determinant of delay tolerance is the mechanical parameters of the limb: inertia, damping, and parallel elasticity. For example, in Ashtiani et al. 2021, equation 5 shows exactly how this comes about: the delay changes the roots and poles of the control system. This is why the reviewer is confused by the complexity of the model in this submission; a simpler model would explain why delays cannot be tolerated in certain circumstances.

      We were previously unclear about the goal of the model, and have made text edits to clarify this — we provide a longer response for this in the public review above (see (1)).

      L362: Another highly relevant reference here would be Sutton et al. 2023.

      Done

      L366: Szczecinski et al. 2018 is hardly a "model"; it is mostly a description of experimental data. How about Goldsmith, Szczecinski, and Quinn 2020 in B&B? Their model of fly walking has patterngenerating elements that are coordinated through sensory feedback. In their model, motor activation is also altered by sensory feedback. The reviewer thinks the statement "Models of fly walking have ignored the role of feedback" is inaccurate and their description of these references should be refined.

      Thank you for the suggestion; we have tempered the language and revised this section to include more references, including the suggested one — text is replicated below. 

      “Many models of fly walking ignore the role of feedback, relying instead on central pattern generators (Lobato-Rios et al., 2022; Szczecinski et al., 2018; Aminzare et al., 2018) or metachondral waves (Deangelis et al., 2019) to model kinematics. Some models incorporate proprioceptive feedback, primarily as a mechanism that alters timing of movements in inter-leg coordination (Goldsmith et al., 2020; Wang-Chen et al., 2023).”

      We remark that Szczecinski et al does include a model that replicates data without using sensory feedback, so we think it is fair to include.  

      L371: "...highly dependent on proprioceptive feedback for leg coordination during walking." What about Berendes et al. 2016, which showed that eliminating CS feedback from one leg greatly diminished its ability to coordinate with the other legs? This suggests that even flies depend on sensory feedback for proper coordination, at least in some sense.

      Interesting suggestion – we have integrated it into the text a little further down, where it better fits:

      “Silencing mechanosensory chordotonal neurons alters step kinematics in walking Drosophila (Mendes et al., 2013; Pratt et al., 2024). Additionally, removing proprioceptive signals via amputation interferes with inter-leg coordination in flies at low walking speeds (Berendes et al., 2016)”

      L426: "The layered model approach also has potential applications for bio-mimetic robotic locomotion.". How fast can this model be computed? Can it run faster than real-time? This would be an important prerequisite for use as a robot control system.

      The model should be able to be run quite fast, as it involves only

      (1) Addition, subtraction, matrix multiplication, and sinusoidal computation on scalars (for the phase coordinator and optimal controller)

      (2) Neural network inference with a relatively small network (for the trajectory generator) Whether this can run in real-time depends on the hardware capabilities of the specific robot and the frequency requirements — it is possible to run this on a desktop or smaller embedded device.

      We do note that the model needs to first be set up and trained before it can be run, which takes some time (see panel D of Figure 1).

      L432: "...which is a popular technique in robotics.". Please cite references supporting this statement.

      We have added citations: the text and relevant citations are reproduced below:

      “... which is a popular technique in robotics (Hua et al., 2021; Johns, 2021)

      Hua J, Zeng L, Li G, Ju Z. Learning for a robot: Deep reinforcement learning, imitation learning, transfer learning. Sensors. 2021; 21(4):1278

      Johns E. Coarse-to-fine imitation learning: Robot manipulation from a single demonstration. In:

      2021 IEEE international conference on robotics and automation (ICRA) IEEE; 2021. p. 4613–4619

      L509: "We find that the phase offset across legs is not modulated across walking speeds in our dataset". This is a surprising result to the reviewer. Looking at Figure 6C, the reviewer understands that there are no drastic changes in coordinate with speed, but there are certainly some changes, e.g., L1-R3, L3-R1. In the reviewer's experience, even very small changes in interleg phasing can change the visual classification of walking from "tripod" to "tetrapod" or "metachronal". Furthermore, several leg pairs do not reside exactly at 0 or \pi radians apart, e.g., L1-L3, L2-L3, R1-R3, R2-R3. In conclusion, the reviewer thinks that setting the interleg coordination to tripod in all cases is a large assumption that requires stronger justification (or, should be eliminated altogether).

      We made a simplifying assumption of a tripod coordination across all speeds. The change in relative phase coordination across speeds is indeed relatively small and additionally we see little change in our results across forward speeds (see Figures 4B, 5C and 5D). 

      We have added text to clarify this assumption and what could be changed for future studies in the methods:

      “We estimate $\bar \phi_{ij}$ from the walking data by taking the circular mean over phase differences of pairs the legs during walking bouts. We find that the phase offset across legs is not strongly modulated across walking speeds in our dataset (see Appendix 2) so we model $\bar \phi_{ij}$ as a single constant independent of speed. In future studies, this could be a function of forward and rotation speeds to account for fine phase modulation differences.”

      L581: "of dimension...". Should the asterisk be replaced by \times? The asterisk makes the reviewer think of convolution. This change should be made throughout this paragraph.

      Good point, done.

      Figure 6: Rotational velocities in all 3 sections are reported in mm/s, but these units do not make sense. Rotational velocities must be reported in rad/s or deg/s.

      The rotation velocity of mm/s corresponded to the tangential velocity of the ball the fly walked on. We agree that this does not easily generalize across setups, so we have updated the figure rotation velocities in rad/s. 

      L619: The reviewer is unconvinced by using only 2 principal components of the data to compare the model and animal kinematics. The authors state on line 626 that the 2 principal components do not capture 56.9% of the variation in the data, which seems like a lot to the reviewer. This is even more extreme considering that the model has 20 joints, and the authors are reducing this to 2 variables; the reviewer can't see how any of the original waveforms, aside from the most fundamental frequencies, could possibly be represented in the PCA dataset. If the walking fly models looked similar to each other, the reviewer could accept that this method works. But the fact that this method says the kinematics are similar, but the motion is clearly different, leads the reviewer to suspect this method was used so the authors could state that the data was a good match.

      Our primary use of the KS metric was to indicate whether the simulated fly continues walking in the presence of perturbations, hence we limited the analysis of the KS to the first 2 principal components. 

      For completeness, we investigate the principal components in Appendix 9 and the effect of evaluating KS with different numbers of components in Appendix 10. 

      The results look similar across components for impulse perturbations. For stochastic perturbations, the range of similar walking decreases as we increase the number of components used to evaluate walking kinematics. Comparing this with Appendix 9 showing that higher components represent higher frequencies of the walking cycle, we conclude that at the edge of stability for delays (where sum of sensory and actuation delays are about 40ms), flies can continue walking but with impaired higher frequencies (relative to no perturbations) during and after perturbation. 

      We add text in the methods:

      “We chose 2 dimensions for PCA for two key reasons. First, these 2 dimensions alone accounted for a large portion of the variance in the data (52.7% total, with 42.1% for first component and 10.6% for second component)). There was a big drop in variance explained from the first to the second component, but no sudden drop in the next 10 components (see Appendix 9). Second, the KDE procedure only works effectively in low-dimensional spaces, and the minimal number of dimensions needed to obtain circular dynamics for walking is 2. We investigate the effect of varying the number of dimensions of PCA in Appendix 10.”

      (Note that we have corrected the percentage of variance accounted for by the principal components, as these numbers were from an older analysis prior to the first draft.)

      We also reference Appendix 10 in the results:

      “We observed that robust walking was not contingent on the specific values of motor and sensory delay, but rather the sum of these two values (Fig. 5E). Furthermore, as delay increases, higher frequencies of walking are impacted first before walking collapses entirely (Appendix 10).”

    1. Author response:

      The following is the authors’ response to the original reviews.

      Reviewer #1 (Public Review):

      The authors introduce DIPx, a deep learning framework for predicting synergistic drug combinations for cancer treatment using the AstraZeneca-Sanger (AZS) DREAM Challenge dataset. While the approach is innovative, I have the following concerns and comments which hopefully will improve the study's rigor and applicability, making it a more powerful tool in the real clinical world.

      We thank to the reviewer for recognizing the innovative aspects of DIPx and for sharing their valuable comments to further refine and strengthen our study. Those comments are carefully addressed in the following point-by-point response.

      (1) Test Set 1 comprises combinations already present in the training set, likely leading overfitting issue. The model might show inflated performance metrics on this test set due to prior exposure to these combinations, not accurately reflecting its true predictive power on unknown data, which is crucial for discovering new drug synergies. The testing approach reduces the generalizability of the model's findings to new, untested scenarios.

      From a clinical perspective, it is useful to test whether a known (previously tested) combination can work for a new patient, which is the purpose of Test Set 1. There is no danger overfitting here, because the test set is completely independent of the discovery set, so had we only discovered a false positive the test set would not have more than power than expected under the null. Predicting the effectiveness of unknown drug combinations (Test Set 2) is indeed an important and more challenging goal of synergy prediction, but it is statistically a distinct problem. The two test sets were previously designed by the AZS DREAM Challenge [PMID: 31209238].

      We have performed cross-validation on the dataset and demonstrated that the result of DIPx for Test Set 1 is not overfitting. Indeed, Figure 2—figure supplement 1 shows the 10-fold cross validation results for the training set. The median Spearman correlation between the predicted and observed Loewe scores across the 10 folds of cross-validation is 0.48, which is close to the correlation of 0.50 in Test Set 1 (red star).  We have added the cross-validation results to the “Validation and Comparisons in the AZS Dataset” section (page 4). 

      (2) The model struggles with predicting synergies for drug combinations not included in its training data (showing only a Spearman correlation of 0.26 in Test Set 2). This limits its potential for discovering new therapeutic strategies. Utilizing techniques such as transfer learning or expanding the training dataset to encompass a wider range of drug pairs could help to address this issue.

      We agree that this is an important limitation for the discovery of new therapeutic strategies. While transfer learning or expanding the training dataset could indeed help address this issue, implementing these approaches would require access to more comprehensive data, which is currently limited due to the scarcity of drug combination datasets. As more drug combination data become available in future, we plan to expand the training set to better cover a wider range of drug combinations and apply the transfer learning method to improve prediction accuracy. We have added a discussion on this in the Discussion Section.

      (3) The use of pan-cancer datasets, while offering broad applicability, may not be optimal for specific cancer subtypes with distinct biological mechanisms. Developing subtype-specific models or adjusting the current model to account for these differences could improve prediction accuracy for individual cancer types.

      We agree with the reviewer that the current settings of DIPx might not be optimal for specific cancers due to the cancer heterogeneity. However, building subtype-specific models is currently constrained by limitation of data availability, which in turn restricts their predictive power. In the Discussion section, we mention this as one of DIPx's limitations and suggest future improvements in cancer-specific models.

      (4) Line 127, "Since DIPx uses only molecular data, to make a fair comparison, we trained TAJI using only molecular features and referred to it as TAJI-M.". TAJI was designed to use both monotherapy drug-response and molecular data, and likely won't be able to reach maximum potential if removing monotherapy drug-response from the training model. It would be critical to use the same training datasets and then compare the performances. From Figure 6 of TAJI's paper (Li et al., 2018, PMID: 30054332) , i.e., the mean Pearson correlation for breast cancer and lung cancer is around 0.5 - 0.6.

      It is true that using monotherapy drug responses can enhance the performance of TAIJI as described in its original paper. In fact, TAIJI builds separate prediction modules for molecular data and monotherapy drug-response data, then combine their results to obtain the final prediction. In our paper we prioritize the exploration of molecular mechanisms in drug combinations while achieving performance comparable to the molecular model of TAIJI. DIPx can be expected to achieve similarly improved performance if we integrate the monotherapy drug response data using the same approach.

      My major concerns were listed in the public review. Here are some writing issues:

      (5) Some content in the Results section looks like a discussion: i.e, L129, "The extra information from the use of monotherapy data in TAJI is rather small, approximately 10% increase in the overall Spearman correlation, and, of course, we could also use such data in DIPx, so it is more convenient and informative to focus the comparisons on prediction based on molecular data alone."; L257, "As we discuss above, to get synergy, the two drugs in a combination theoretically should not have the same target. However, there is of course no guarantee that two drugs that do not share target genes can produce synergy. ".

      We have revised the texts and moved them to the Discussion section.  

      Reviewer #2 (Public Review):

      Trac, Huang, et al used the AZ Drug Combination Prediction DREAM challenge data to make a new random forest-based model for drug synergy. They make comparisons to the winning method and also show that their model has some predictive capacity for a completely different dataset. They highlight the ability of the model to be interpretable in terms of pathway and target interactions for synergistic effects. While the authors address an important question, more rigor is required to understand the full behavior of the model.

      We thank the reviewer for his/her time and effort in carefully reading the manuscript and acknowledging the significance of the study.

      Major Points

      (1) The authors compare DIPx to the winning method of the DREAm challenge, TAJI to show that from molecular features alone they retrain TAJI to create TAJI-M without the monotherapy data inputs. They mention that "of course, we could also use such data in DIPx...", but they never show the behaviour of DIPx with these data. The authors need to demonstrate that this statement holds true or else compare it to the full TAJI.

      This is similar to point 4 raised by Reviewer 1 regarding the exclusive use of molecular data in DIPx. In fact, TAIJI uses separate prediction modules for molecular data and drugresponse data which are then combined to obtain the final results. While integrating monotherapy drug data could enhance DIPx’s overall performance, for example, simply replacing TAIJI’s molecular model with DIPx in the full TAIJI to achieve comparable results, this is not the primary goal of DIPx. Our focus is on exploring the potential molecular mechanisms of drug action. Using only molecular data allows for more convenient and intuitive inference of pathway importance compared to integrating multiple data types.

      We have revised the related text with the discussion in section “Validation and comparisons in the AZS dataset” of the main text.

      (2) It would be neat to see how the DIPx feature importance changes with monotherapy input. For most realistic scenarios in which these models are used robust monotherapy data do exist.

      Indeed, some existing models incorporate monotherapy data into their predictions; for example, a recent study [PMID: 33203866] uses only monotherapy data to predict drug combinations. TAIJI, as discussed in Point 1, uses separate models for monotherapy and molecular data. In general, both data types can be integrated into a single prediction model, allowing for the consideration of feature importance from both. While such an approach can highlight features contributing to predictive performance, the significance of a monotherapy feature does not necessarily indicate the activated pathways of a synergistic drug combination, which is the primary focus of our study. For this reason, we have excluded monotherapy data from DIPx.

      (3) In Figure 2, the authors compare DIPx and TAJI-M on various test sets. If I understood correctly, they also bootstrapped the training set with n=100 and reported all the model variants in many of the comparisons. While this is a nice way of showing model robustness, calculating p-values with bootstrapped data does not make sense in my opinion as by increasing the value of n, one can make the p-value arbitrarily small.

      The p-value should only be reported for the original models.

      The reviewer is correct that we cannot compute the p-value by using an independent twosample test, because the bootstrap correlation values are based on the same data. However, p-values can still be computed to compare the two prediction models using the bootstrap. Theoretically, the bootstrap can be used to compute a confidence interval for the differential correlation in the test set. However, there is a close relationship between p-values and confidence intervals (see Pawitan, 2001, chapter 5; particularly p.134). Specifically, in this case, we compute the p-value as follows: (1) For each bootstrap, (i) compute the Spearman correlation between the predicted and observed scores in the test set for DIPx and TAIJI-M.

      Denote this by r1 and r2. (ii) compute the difference in the Spearman correlations d= (r1-r2). (2). Repeat the bootstrap n=100 times. (3). Compute the minimum of these two proportions:

      proportion of d<0 or proportion of d>0. (4). The two-sided p-value = 2x the minimum proportion in (3). To overcome the limited bootstrap sample size, we use the normal approximation in computing the proportions in (3). Note that in this method of computing the p-value, larger numbers of bootstrap replicates do not produce more significant results.

      We have re-computed the p-values using this method and added this text to the ‘Methods and Materials’ Section. 

      (4) From Figures 2 and 3, it appears DIPx is overfit on the training set with large gaps in Spearman correlations between Test Set 2/ONeil set and Test Set 1. It also features much better in cases where it has seen both compounds. Could the authors also compare TAJI on the ONeil dataset to show if it is as much overfit?

      The poor performance in ONeil dataset is not due to overfitting as such, but more likely due structural differences between the training and ONeil datasets.  (To investigate the overfitting issue, we have conducted a 10-fold cross validation in the AZS training set. The median correlation between the predicted and observed Loewe score across ten folds is 0.48, which is comparable to the median of 0.50 in the Test Set 1. Therefore, the model does not suffer from overfitting issue.  We have added this cross-validation result in the Section “Validation and Comparisons in the AZS Dataset” (page 4)).

      We have now obtained TAIJI’s results on the ONeil dataset. TAIJI-M relies on a gene-gene interaction network to integrate the indirect drug targeting effects. This approach limits its applicability to new datasets, as it can only predict synergy scores for drug combinations present in the training dataset. Among the set of drug combinations present in the training set (n = 1102), both DIPx and TAIJI-M perform poorly, with Spearman correlations between predicted and observed synergy scores of 0.09 and 0.05, respectively.

      (Additional note: The original version of TAIJI-M uses gene expression, CNV, mutation, and methylation data. However, there is no methylation data in the ONeil dataset, so we retrained TAIJI-M without the methylation features. According to the final report of TAIJI in the challenge (https://www.synapse.org/Synapse:syn5614689/wiki/396206), Guan et al. reported that methylation features do not contribute to prediction performance in the postchallenge analysis. This means that retraining TAIJI-M without the methylation data will not materially affect the comparison between DIPx and TAIJI-M on the ONeil dataset.)

      Minor Points:

      (5) Pg 4, line 130: Citation needed for 10% contribution of monotherapy.

      (6) The general language of this paper is informal at times. I request the authors to refine it a bit.

      We thank the reviewer for pointing this out. We have added the appropriate citation for the statement and carefully revised the text to make it more formal.

      Reviewer #3 (Public Review):

      Summary:

      Predicting how two different drugs act together by looking at their specific gene targets and pathways is crucial for understanding the biological significance of drug combinations. Such combinations of drugs can lead to synergistic effects that enhance drug efficacy and decrease resistance. This study incorporates drug-specific pathway activation scores (PASs) to estimate synergy scores as one of the key advancements for synergy prediction. The new algorithm, Drug synergy Interaction Prediction (DIPx), developed in this study, uses gene expression, mutation profiles, and drug synergy data to train the model and predict synergy between two drugs and suggests the best combinations based on their functional relevance on the mechanism of action. Comprehensive validations using two different datasets and comparing them with another best-performing algorithm highlight the potential of its capabilities and broader applications. However, the study would benefit from including experimental validation of some predicted drug combinations to enhance its reliability.

      Strengths:

      The DIPx algorithm demonstrates the strengths listed below in its approach for personalized drug synergy prediction. One of its strengths lies in its utilization of biologically motivated cancer-specific (driver genes-based) and drug-specific (target genes-based) pathway activation scores (PASs) to predict drug synergy. This approach integrates gene expression, mutation profiles, and drug synergy data to capture information about the functional interactions between drug targets, thereby providing a potential biological explanation for the synergistic effects of combined drugs. Additionally, DIPx's performance was tested using the AstraZeneca-Sanger (AZS) DREAM Challenge dataset, especially in Test Set 1, where the Spearman correlation coefficient between predicted and observed drug synergy was 0.50 (95% CI: 0.470.53). This demonstrates the algorithm's effectiveness in handling combinations already in the training set. Furthermore, DIPx's ability to handle novel combinations, as evidenced by its performance in Test Set 2, indicates its potential for extrapolating predictions to new and untested drug combinations. This suggests that the algorithm can adapt to and make accurate predictions for previously unencountered combinations, which is crucial for its practical application in personalized medicine. Overall, DIPx's integration of pathway activation scores and its performance in predicting drug synergy for known and novel combinations underscore its potential as a valuable tool for personalized prediction of drug synergy and exploration of activated pathways related to the effects of combined drugs.

      Weaknesses:

      While the DIPx algorithm shows promise in predicting drug synergy based on pathway activation scores, it's essential to consider its limitations. One limitation is that the algorithm's performance was less accurate when predicting drug synergy for combinations absent from the training set. This suggests that its predictive capability may be influenced by the availability of training data for specific drug combinations. Additionally, further testing and validation across different datasets (more than the current two datasets) would be necessary to assess the algorithm's generalizability and robustness fully. It's also important to consider potential biases in the training data and ensure that DIPx predictions are validated through empirical studies including experimental testing of predicted combinations. Despite these limitations, DIPx represents a valuable step towards personalized prediction of drug synergy and warrants continued investigation and improvement. It would benefit if the algorithm's limitations are described with some examples and suggest future advancement steps.

      We are grateful to the reviewer for the thoughtful and encouraging comments, and for the time and effort to read our manuscript. We have carefully addressed them in our revision.

      Reviewer #3 (Recommendations For The Authors):

      The authors could consider some of the recommendations below to further improve the DIPx algorithm and its application in personalized drug synergy prediction. Firstly, expanding the training dataset to include a broader range of drug combinations could improve the algorithm's predictive capabilities, especially for novel combinations. This would help address the observed decrease in performance when predicting drug synergy for combinations absent from the training set. This could help assess the robustness of the algorithm and provide a more comprehensive evaluation of its performance for untrained combinations to strengthen its application.

      We agree that expanding the training dataset with a broader range of drug combinations would likely improve performance. However, the vast number of possible combinations, along with the associated cost of the experiment, limits the availability of drug combination data. To increase the size of the training data, we could combine different studies, but data from different studies are often generated using different protocols and experimental settings, introducing biases that complicate the integration. As technology continues to advance, we anticipate that more standardized and comprehensive data will become available in the future, which will help address this issue.

      Furthermore, the authors may consider incorporating additional features or data sources, such as drug-specific characteristics, i.e., availability of the drug, to enrich the information utilized by the algorithm. This could potentially improve the accuracy of the predictions and provide a more holistic understanding of the factors contributing to drug synergy.

      Indeed, incorporating additional information such as monotherapy data and drug-specific characteristics, as in TAIJI’s approach, could enhance overall prediction performance. As discussed in Point 5 below, the current study is focused on exploring the potential molecular mechanisms of drug combinations, rather than optimizing overall prediction accuracy. However, in its application, it is natural to add the monotherapy or drug-specific information into the algorithm, as done in TAIJI.

      Finally, conducting experimental studies to validate the predictions generated by DIPx in laboratory-based cell lines would be essential to confirm its accuracy and reliability. This could involve a few drug IC50 experimental validations of predicted synergistic drug combinations and their associated pathway activations to strengthen the algorithm's clinical relevance. By considering these recommendations, the authors can further refine and advance the DIPx algorithm.

      We agree that laboratory-based validation, such as IC50 experiments for predicted synergistic drug combinations and pathway activations, would indeed strengthen the clinical relevance of the algorithm. We hope future studies can build on this work by incorporating this experimental validation.

      Below are my specific comments:

      Major comments:

      (1) The description of all the outputs of the DIPX algorithm is not clearly explained. It is unclear whether it provides only the Loewe score, the confidence score, the PAS score, or all of them. It is necessary to clarify the output of the proposed algorithm to guide the reader on what to expect while using it. The steps from PASs to synergy scores are not well explained.

      We apologize for the lack of clarity. Regarding the outputs of DIPx, for any triplet (drug A + drug B, cell line C), DIPx provides both the predicted Loewe score and the corresponding confidence score as the output. PASs are used as the input data for the random forest algorithm, which processes PASs into the synergy score. We do not provide the details in the manuscript, but refer to the article by Ishwaran H et al., (2021). We have revised the first paragraph of the 'A Pathway-Based Drug Synergy Prediction Model' section (page 3) and Figure 1 to improve the presentation of the method.

      (2) In Figure 1, the predicted Loewe score for the Capivasertib + Sapitinib combination is not provided. However, Figures 1e and 4a show the pathways with the highest contribution for this combination. What is the predicted Loewe score for the Capivasertib + Sapitinib combination?

      Figures 1e and 4a presents the pathways with the highest contribution for the combination which are identified based on the drug-combination data from 12 cell lines, not a single data point.

      We have added the median Loewe score (=7.6) across 12 cell lines in the test sets (Test 1 + Test 2) for the Capivasertib + Sapitinib combination in Figure 1e and reported related information for this combination in Supplementary Table S1. Additionally, we revised the 'Inference of the Mechanism of Action Based on PAS' section (page 7) to clarify the pathway importance inference.

      (3) In Figure 1d, the combination of doxorubicin + AZ12623380 is predicted to exhibit high Loewe synergy, with a confidence score of 0.33. It is important to provide details of this prediction, including the pathway predictions, and to explain why the model suggested high synergy. Although Figure 4f contains information, it seems to be listed for the observed Loewe score rather than the predicted score provided in Figure 1d. DIPx predicts the doxorubicin + AZ12623380 combination to be synergistic, while in Figure 4, it is labeled as a non-synergistic combination. It is necessary for the authors to clearly indicate which illustration represents the predicted outcome and which hypothesis is based on the observed Loewe score.

      In Figure 1d, we reported both predicted and observed Loewe score for the experiment (combination = doxorubicin + AZ12623380, cell line = SW900). Although the predicted score is high, a confidence score of 0.33 indicates that there is a low chance of the prediction is synergistic. And this is indeed confirmed by the non-synergistic observed score of -6, so it does not merit further investigation. This example highlights the value of the confidence score to supplement the predicted values. 

      (4) Figure 3 - The external validation using ONeil requires more rigorous analysis to understand the biological significance of the predictions. It is important to provide pathway activation scores and their potential mechanism of action predicted by the DIPx algorithm when working with a new dataset. Additionally, including the predictions of TAIJI-M on the ONeil dataset would be beneficial for comparing the performance of both algorithms on a new dataset.

      We have included an example of potential pathways related to the MK2206 + Erlotinib combination in the ONeil cohort, as inferred by DIPx, in the last paragraph of the 'Inference of the Mechanism of Action Based on PAS' section (page 9). In this example, we identify 'Metabolism by CYP Enzymes' as the most significant pathway associated with this combination, which aligns with previous studies that both MK2206 and Erlotinib are metabolized by the CYP enzyme families [PMID: 24387695].

      Regarding the prediction of TAIJI-M on the ONeil dataset, we have a similar request in question 4 from Reviewer 2, which we have carefully addressed above. Briefly, due to differences between two datasets, we retrained TAIJI-M without methylation data to enable prediction on the ONeil dataset. (As previously reported, methylation data did not significantly contribute to the results of TAIJI, and TAIJI-M can only predict synergy scores for drug combinations present in the training set.) Focusing on this subset of drug combinations, both TAIJI-M and DIPx perform poorly, with Spearman correlations of r=0.05 and r=0.09, respectively. The poor performance could be attributed to the limited overlap of drugs between the ONeil dataset and the AZS DREAM Challenge dataset.

      (5) TAIJI by Li et al., 2018 reported a high prediction correlation (0.53) in their study, while the modified version of TAIJI, TAJI-M, shows a lower prediction correlation in this study. The authors should clarify why the performance decreased when using the same dataset. Is it because only molecular data was used, excluding the monotherapy drug-response data? There is a spelling error in calling the algorithm - it is reported as TAIJI by Li et al., 2018, whereas this study calls it TAJI - an "I" is missing in TAIJI throughout the manuscript.

      Indeed, TAIJI-M has a lower prediction correlation (0.38) compared to the full TAIJI model (0.53), which includes the monotherapy data. Some studies such as [PMID: 33203866] even use only monotherapy data in prediction of drug combinations, suggesting the importance of monotherapy data in the drug-combination prediction. However, DIPx focuses on exploration of potential molecular mechanisms of drug combinations rather than overall prediction results, therefore, we exclude the monotherapy data from analysis. We have discussed on this in the 'Validation and Comparisons in the AZS Dataset' section (page 4).

      We thank the reviewer for pointing the spelling error for TAIJI; this has been corrected throughout the manuscript.

      (6) The authors should provide the predicted versus observed Loewe scores for all the combinations as a supplementary file. This would benefit the readers who want to replicate the results in the future. In the same way, including a sample output for the toy dataset on GitHub is required to assess the performance of the DIPx algorithm by a new user.

      All predicted and observed drug synergy scores are given in Supplementary Table S2. We also have already uploaded a simple example on our GitHub page, along with detailed instructions for users on how to run the method, including generating PAS and training the prediction model. Since we do not have permission to host data from the AZS DREAM Challenge and the ONeil datasets on our GitHub page, users can download these datasets separately and directly apply the provided code.

      (7) GitHub can include all the input and output data to reproduce the correlation plots in the manuscript. GitHub could also include the modified version of TAIJI-M and its corresponding input for comparison. The methods section should include how TAIJI was performed.

      We have uploaded all the codes and related data to the GitHub page to allow replication of all correlation plots in the manuscript. TAIJI-M represents the molecular model of the full TAIJI model. Both TAIJI-M and TAIJI are documented on the GitHub page of the original study. We have also included a link to the source code for TAIJI-M and TAIJI in the 'Data Availability' section.

      (8) Figure 5 - the data associated with this figure needs to be provided as supplementary listing the predicted values of Loewe scores for all the combinations.

      We report the associated data including the median of predicted and observed Loewe scores related to Figure 5c in Supplementary Table S2.

      Minor comments:

      (9) Abbreviations for the pathways are not included.

      We have included a list of abbreviations for all relevant pathways in Supplementary Table S5.

      (10) Line: 369. What is considered as bias correction? This needs to be explained.

      Bias correction refers to adjusting the original estimate of the Spearman correlation between the predicted and observed Loewe scores when there is a systematic difference between the estimates obtained from the bootstrap samples and the original correlation estimate. We revised the related text in page 13 to improve the explanation.

      (11) Line 364. Formulae or details for calculating actual predicted synergy (Ps) are missing.

      The predicted Loewe score, Ps, is the output of the regression random forest model. For simplicity, we do not describe the details in the manuscript, but refer to the description of the method article (Ishwaran H et al., 2021). We have revised the text accordingly.

    1. Author response:

      Reviewer #1 (Public review):

      Summary:

      Jocher, Janssen, et al examine the robustness of comparative functional genomics studies in primates that make use of induced pluripotent stem cell-derived cells. Comparative studies in primates, especially amongst the great apes, are generally hindered by the very limited availability of samples, and iPSCs, which can be maintained in the laboratory indefinitely and defined into other cell types, have emerged as promising model systems because they allow the generation of data from tissues and cells that would otherwise be unobservable.

      Undirected differentiation of iPSCs into many cell types at once, using a method known as embryoid body differentiation, requires researchers to manually assign all cell types in the dataset so they can be correctly analysed. Typically, this is done using marker genes associated with a specific cell type. These are defined a priori, and have historically tended to be characterised in mice and humans and then employed to annotate other species. Jocher, Janssen, et al ask if the marker genes and features used to define a given cell type in one species are suitable for use in a second species, and then quantify the degree of usefulness of these markers. They find that genes that are informative and cell type specific in a given species are less valuable for cell type identification in other species, and that this value, or transferability, drops off as the evolutionary distance between species increases.

      This paper will help guide future comparative studies of gene expression in primates (and more broadly) as well as add to the growing literature on the broader challenges of selecting powerful and reliable marker genes for use in single-cell transcriptomics.

      Strengths:

      Marker gene selection and cell type annotation is a challenging problem in scRNA studies, and successful classification of cells often requires manual expert input. This can be hard to reproduce across studies, as, despite general agreement on the identity of many cell types, different methods for identifying marker genes will return different sets of genes. The rise of comparative functional genomics complicates this even further, as a robust marker gene in one species need not always be as useful in a different taxon. The finding that so many marker genes have poor transferability is striking, and by interrogating the assumption of transferability in a thorough and systematic fashion, this paper reminds us of the importance of systematically validating analytical choices. The focus on identifying how transferability varies across different types of marker genes (especially when comparing TFs to lncRNAs), and on exploring different methods to identify marker genes, also suggests additional criteria by which future researchers could select robust marker genes in their own data.

      The paper is built on a substantial amount of clearly reported and thoroughly considered data, including EBs and cells from four different primate species - humans, orangutans, and two macaque species. The authors go to great lengths to ensure the EBs are as comparable as possible across species, and take similar care with their computational analyses, always erring on the side of drawing conservative conclusions that are robustly supported by their data over more tenuously supported ones that could be impacted by data processing artefacts such as differences in mappability, etc. For example, I like the approach of using liftoff to robustly identify genes in non-human species that can be mapped to and compared across species confidently, rather than relying on the likely incomplete annotation of the non-human primate genomes. The authors also provide an interactive data visualisation website that allows users to explore the dataset in depth, examine expression patterns of their own favourite marker genes and perform the same kinds of analyses on their own data if desired, facilitating consistency between comparative primate studies.

      We thank the Reviewer for their kind assessment of our work.

      Weaknesses and recommendations:

      (1) Embryoid body generation is known to be highly variable from one replicate to the next for both technical and biological reasons, and the authors do their best to account for this, both by their testing of different ways of generating EBs, and by including multiple technical replicates/clones per species. However, there is still some variability that could be worth exploring in more depth. For example, the orangutan seems to have differentiated preferentially towards cardiac mesoderm whereas the other species seemed to prefer ectoderm fates, as shown in Figure 2C. Likewise, Supplementary Figure 2C suggests a significant unbalance in the contributions across replicates within a species, which is not surprising given the nature of EBs, while Supplementary Figure 6 suggests that despite including three different clones from a single rhesus macaque, most of the data came from a single clone. The manuscript would be strengthened by a more thorough exploration of the intra-species patterns of variability, especially for the taxa with multiple biological replicates, and how they impact the number of cell types detected across taxa, etc.

      You are absolutely correct in pointing out that the large clonal variability in cell type composition is a challenge for our analysis. We also noted the odd behavior of the orangutan EBs, and their underrepresentation of ectoderm. There are many possible sources for these variable differentiation propensities: clone, sample origin (in this case urine) and individual. However, unfortunately for the orangutan, we have only one individual and one sample origin and thus cannot say whether this germ layer preference says something about the species or is due to our specific sample.

      Because of this high variability from multiple sources, getting enough cell types with an appreciable overlap between species was limiting to analyses. In order to be able to derive meaningful conclusions from intra-species analyses and the impact of different sources of variation on cell type propensity, we would need to sequence many more EBs with an experimental design that balances possible sources of variation. This would go beyond the scope of this study.

      Instead, here we control for intra-species variation in our analyses as much as possible: For the analysis of cell type specificity and conservation the comparison is relative for the different specificity degrees (Figure 3C).  For the analysis of marker gene conservation, we explicitly take intra-species variation into account (Figure 4D).

      The same holds for the temporal aspect of the data, which is not really discussed in depth despite being a strength of the design. Instead, days 8 and 16 are analysed jointly, without much attention being paid to the possible differences between them.

      Concerning the temporal aspect, indeed we knowingly omitted to include an explicit comparison of day 8 and day 16 EBs, because we felt that it was not directly relevant to our main message. Our pseudotime analysis showed that the differences of the two time points were indeed a matter of degree and not so much of quality. All major lineages were already present at day 8 and even though day 8 cells had on average earlier pseudotimes, there was a large overlap in the pseudotime distributions between the two sampling time points (Author response image 1). That is why we decided to analyse the data together.

      Are EBs at day 16 more variable between species than at day 8? Is day 8 too soon to do these kinds of analyses?

      When we started the experiment, we simply did not know what to expect. We were worried that cell types at day 8 might be too transient, but longer culture can also introduce biases. That is why we wanted to look at two time points, however as mentioned above the differences are in degree.

      Concerning the cell type composition: yes, day 16 EBs are more heterogeneous than day 8 EBs. Firstly, older EBs have more distinguishable cell types and hence even if all EBs had identical composition, the sampling variance would be higher given that we sampled a similar number of cells from both time points. Secondly, in order to grow EBs for a longer time, we moved them from floating to attached culture on day 8 and it is unclear how much variance is added by this extra handling step.

      Are markers for earlier developmental progenitors better/more transferable than those for more derived cell types?

      We did not see any differences in the marker conservation between early and late cell types, but we have too little data to say whether this carries biological meaning.

      Author response image 1.

      Pseudotime analysis for a differentiation trajectory towards neurons. Single cells were first aggregated into metacells per species using SEACells (Persad et al. 2023). Pluripotent and ectoderm metacells were then integrated across all four species using Harmony and a combined pseudotime was inferred with Slingshot (Street et al. 2018), specifying iPSCs as the starting cluster. Here, lineage 3 is shown, illustrating a differentiation towards neurons. (A) PHATE embedding colored by pseudotime (Moon et al. 2019). (B) PHATE embedding colored by celltype. (C) Pseudotime distribution across the sampling timepoints (day 8 and day 16) in different species.

      (2) Closely tied to the point above, by necessity the authors collapse their data into seven fairly coarse cell types and then examine the performance of canonical marker genes (as well as those discovered de novo) across the species. However some of the clusters they use are somewhat broad, and so it is worth asking whether the lack of specificity exhibited by some marker genes and driving their conclusions is driven by inter-species heterogeneity within a given cluster.

      Author response image 2.

      UMAP visualization for the Harmony-integrated dataset across all four species for the seven shared cell types, colored by cell type identity (A) and species (B).

      Good point, if we understand correctly, the concern is that in our relatively broadly defined cell types, species are not well mixed and that this in turn is partly responsible for marker gene divergence. This problem is indeed difficult to address, because most approaches to evaluate this require integration across species which might lead to questionable results (see our Discussion).

      Nevertheless, we attempted an integration across all four species. To this end, we subset the cells for the 7 cell types that we found in all four species and visualized cell types and species in the UMAPs above (Author response image 2).

      We see that cardiac fibroblasts appear poorly integrated in the UMAP, but they still have very transferable marker genes across species. We quantified integration quality using the cell-specific mixing score (cms) (Lütge et al. 2021) and indeed found that the proportion of well integrated cells is lowest for cardiac fibroblasts (Author response image 3A). On the other end of the cms spectrum, neural crest cells appear to have the best integration across species, but their marker transferability between species is rather worse than for cardiac fibroblasts (Supplementary Figure 9). Cell-type wise calculated rank-biased overlap scores that we use for marker gene conservation show the same trends (Author response image 3B) as the F1 scores for marker gene transferability.  Hence, given our current dataset we do not see any indication that the low marker gene conservation is a result of too broadly defined cell types.

      Author response image 3.

      (A) Evaluation of species mixing per cell type in the Harmony-integrated dataset, quantified by the fraction of cells with an adjusted cell-specific mixing score (cms) above 0.05. (B) Summary of rank-biased overlap (RBO) scores per cell type to assess concordance of marker gene rankings for all species pairs.

      Reviewer #2 (Public review):

      Summary:

      The authors present an important study on identifying and comparing orthologous cell types across multiple species. This manuscript focuses on characterizing cell types in embryoid bodies (EBs) derived from induced pluripotent stem cells (iPSCs) of four primate species, humans, orangutans, cynomolgus macaques, and rhesus macaques, providing valuable insights into cross-species comparisons.

      Strengths:

      To achieve this, the authors developed a semi-automated computational pipeline that integrates classification and marker-based cluster annotation to identify orthologous cell types across primates. This study makes a significant contribution to the field by advancing cross-species cell type identification.

      We thank the reviewer for their positive and thoughtful feedback.

      Weaknesses:

      However, several critical points need to be addressed.

      (1) Use of Liftoff for GTF Annotation

      The authors used Liftoff to generate GTF files for Pongo abelii, Macaca fascicularis, and Macaca mulatta by transferring the hg38 annotation to the corresponding primate genomes. However, it is unclear why they did not use species-specific GTF files, as all these genomes have existing annotations. Why did the authors choose not to follow this approach?

      As Reviewer 1 also points out, also we have observed that the annotation of non-human primates often has truncated 3’UTRs. This is especially problematic for 3’ UMI transcriptome data as the ones in the 10x dataset that we present here. To illustrate this we compared the Liftoff annotation derived from Gencode v32,  that we also used throughout our manuscript to the Ensembl gene annotation Macaca_fascicularis_6.0.111. We used transcriptomes from human and cynomolgus iPSC bulk RNAseq  (Kliesmete et al. 2024) using the Prime-seq protocol (Janjic et al. 2022) which is very similar to 10x in that it also uses 3’ UMIs. On average using Liftoff produces higher counts than the Ensembl annotation (Author response image 4A). Moreover, when comparing across species, using Ensembl for the macaque leads to an asymmetry in differentially expressed genes, with apparently many more up-regulated genes in humans. In contrast, when we use the Liftoff annotation, we detect fewer DE-genes and a similar number of genes is up-regulated in macaques as in humans (Author response image 4B). We think that the many more DE-genes are artifacts due to mismatched annotation in human and cynomolgus macaques. We illustrate this for the case of the transcription factor SALL4 in Author response image 4 C,D.  The Ensembl annotation reports 2 transcripts, while Liftoff from Gencode v32 suggests 5 transcripts, one of which has a longer 3’UTR. This longer transcript is also supported by Nanopore data from macaque iPSCs. The truncation of the 3’UTR in this case leads to underestimation of the expression of SALL4 in macaques and hence SALL4 is detected as up-regulated in humans (DESeq2: LFC= 1.34, p-adj<2e-9). In contrast, when using the Liftoff annotation SALL4 does not appear to be DE between humans and macaques (LFC=0.33, p.adj=0.20).

      Author response image 4. 

      (A) UMI-counts/ gene for the same cynomolgus macaque iPSC samples. On the x-axis the gtf file from Ensembl Macaca_fascicularis_6.0.111 was used to count and on the y-axis we used our filtered Liftoff annotation that transferred the human gene models from Gencode v32. (B) The # of DE-genes between human  and cynomolgus iPSCs detected with DESeq2. In Liftoff, we counted human samples using Gencode v32 and compared it to the Liftoff annotation of the same human gene models to macFas6. In Ensembl, we use Gencode v32 for the human and  Ensembl Macaca_fascicularis_6.0.111 for the Macaque. For both comparisons we subset the genes to only contain one to one orthologues as annotated in biomart. Up and down regulation is relative to human expression. C) Read counts for one example gene SALL4. Here we used in addition to the Liftoff and Ensembl annotation also transcripts derived from Nanopore cDNA sequencing of cynomolgus iPSCs. D) Gene models for SALL4 in the space of MacFas6 and a coverage for iPSC-Prime-seq bulk RNA-sequencing.

      (2) Transcript Filtering and Potential Biases

      The authors excluded transcripts with partial mapping (<50%), low sequence identity (<50%), or excessive length differences (>100 bp and >2× length ratio). Such filtering may introduce biases in read alignment. Did the authors evaluate the impact of these filtering choices on alignment rates?

      We excluded those transcripts from analysis in both species, because they present a convolution of sequence-annotation differences and expression. The focus in our study is on regulatory evolution and we knowingly omit marker differences that are due to a marker being mutated away, we will make this clearer in the text of a revised version.

      (3) Data Integration with Harmony

      The methods section does not specify the parameters used for data integration with Harmony. Including these details would clarify how cross-species integration was performed.

      We want to stress  that none of our conservation and marker gene analyses relies on cross-species integration. We only used the Harmony integrated data for visualisation in Figure 1 and the rough germ-layer check up in Supplementary Figure S3.  We will add a better description in the revised version.

      References

      Janjic, Aleksandar, Lucas E. Wange, Johannes W. Bagnoli, Johanna Geuder, Phong Nguyen, Daniel Richter, Beate Vieth, et al. 2022. “Prime-Seq, Efficient and Powerful Bulk RNA Sequencing.” Genome Biology 23 (1): 88.

      Kliesmete, Zane, Peter Orchard, Victor Yan Kin Lee, Johanna Geuder, Simon M. Krauß, Mari Ohnuki, Jessica Jocher, Beate Vieth, Wolfgang Enard, and Ines Hellmann. 2024. “Evidence for Compensatory Evolution within Pleiotropic Regulatory Elements.” Genome Research 34 (10): 1528–39.

      Lütge, Almut, Joanna Zyprych-Walczak, Urszula Brykczynska Kunzmann, Helena L. Crowell, Daniela Calini, Dheeraj Malhotra, Charlotte Soneson, and Mark D. Robinson. 2021. “CellMixS: Quantifying and Visualizing Batch Effects in Single-Cell RNA-Seq Data.” Life Science Alliance 4 (6): e202001004.

      Moon, Kevin R., David van Dijk, Zheng Wang, Scott Gigante, Daniel B. Burkhardt, William S. Chen, Kristina Yim, et al. 2019. “Visualizing Structure and Transitions in High-Dimensional Biological Data.” Nature Biotechnology 37 (12): 1482–92.

      Persad, Sitara, Zi-Ning Choo, Christine Dien, Noor Sohail, Ignas Masilionis, Ronan Chaligné, Tal Nawy, et al. 2023. “SEACells Infers Transcriptional and Epigenomic Cellular States from Single-Cell Genomics Data.” Nature Biotechnology 41 (12): 1746–57.

      Street, Kelly, Davide Risso, Russell B. Fletcher, Diya Das, John Ngai, Nir Yosef, Elizabeth Purdom, and Sandrine Dudoit. 2018. “Slingshot: Cell Lineage and Pseudotime Inference for Single-Cell Transcriptomics.” BMC Genomics 19 (1): 477.

    1. Author response:

      The following is the authors’ response to the original reviews.

      We appreciate that both reviewers found our findings significant and recognized the strength of the presented data in demonstrating the potential value of ASO-mediated Emc10 expression modulation for treating 22q11.2DS. We are grateful for the reviewers' valuable input and constructive suggestions, which we believe have significantly strengthened our manuscript. Below, we address the main points and concerns, followed by our point-by-point responses:

      Evaluation of ASO-Mediated Emc10 Reduction: We appreciate the feedback and the opportunity to clarify this point. While we agree that ASO-mediated reduction of Emc10 should ideally be evaluated at both the mRNA and protein levels, we would like to emphasize that this was indeed performed in our study. Specifically, we conducted both qRT-PCR and Western Blot (WB) assays on the same animal cohort, focusing on the left and right hippocampus (rather than the PFC) following ASO injection (see Figure S11C and D). We prioritized the hippocampus for the WB assay because our primary behavioral assays and observed phenotypes in this study are strongly hippocampus-centric. This approach reflects our aim to investigate Emc10's role in the brain regions most relevant to the observed phenotypes. We hope this clarification addresses the reviewer’s concerns. While protein-level analysis would ideally complement RNA measurements, the Emc10 antibodies available were suboptimal in specificity and sensitivity, requiring substantial optimization. Additionally, challenges in obtaining sufficient high-quality protein from small regions like the hippocampus limited the use of protein detection as a standalone method. We plan to refine antibody protocols or explore alternative methods in future work. Notably, in all instances where we performed parallel protein and RNA measurements in both, mouse brain tissue and human cell lines, there was excellent concordance between the datasets, strongly suggesting that mRNA levels are a reliable indicator of Emc10 protein levels in our model.

      ASO Neuronal Uptake: While ASO uptake by neurons in the brain can vary considerably depending on factors such as ASO chemistry, delivery method, target brain region, and cell type, our targeted delivery approach, ASO design optimization, and ASO screening strategy were specifically tailored to achieve uniform and efficient uptake across hippocampal and cortical regions, in both neurons and glia. The figures included in our manuscript at both low and high magnification (see Figure S14A) clearly display the extensive (over 97%) overlap of ASO-positive cells (green signal) with cells expressing the neuronal marker NeuN (red signal). While quantifying ASO-positive cells in different brain regions could add value, the robust diffusion of ASO into neurons and glia is effectively demonstrated in the current figures and indirectly supported by the robust downregulation of Emc10 in ASO-treated animals as shown by qRT-PCR assays of hippocampal and cortical brain regions.

      Transcriptomic Data in Mutant EMC10 NGN2-iNs: Reduction in EMC10 levels is not expected to directly affect transcription or to broadly reorganize the differential gene expression profile of the Q6/Q5 patient/control NGN2-iN lines. Accordingly, our transcriptional profiling was not designed to assess the direct impact of EMC10 deficiency on gene expression but rather to serve as an indirect measure of cellular pathways affected by the reduction in EMC10 levels in the patient Q6 line. We aimed to identify genes and related functional pathways differentially expressed between the Q6/Q5 patient/control lines, where these expression differences are either abolished or significantly attenuated in Q6/EMC10<sup>HET</sup> or Q6/EMC10<sup>HOM</sup> NGN2-iNs.

      Statistical Analysis: We have meticulously reviewed all statistical analyses in the manuscript to ensure their appropriateness and adherence to established practices. For Figure S2, we acknowledge that the statistical details were not fully specified in the figure legend, though they are provided for each miRNA in Supplemental Table S2. In the revised manuscript, we ensured that the statistical methods and corresponding values are clearly indicated for each comparison.

      We are confident that the revisions outlined above, along with the point-by-point responses provided below, will significantly strengthen our manuscript and address all the concerns raised by the reviewers. We would like to express our sincere thanks to the reviewers for their valuable feedback and constructive suggestions.

      Reviewer #1 (Recommendations For The Authors):

      My comments here are generally limited to minor comments that reflect possible small additions or edits to the manuscript:

      (1) Panel 1A is very small. Please consider making that bigger as space permits.

      We have increased the panel size of Figure 1A in the revised manuscript to improve its visibility and clarity.

      (2) Are you able to identify the dot that represents EMC10 in panel 1C? I understand that EMC10 is represented in Supplementary Figure 4A.

      We appreciate the reviewer's observation. In Figure 1C, the volcano plot depicts differentially expressed miRNAs in the Q5/Q6 neuronal samples, as identified through miRNA-sequencing. Since EMC10, as a protein-coding gene and a downstream target of miRNA dysregulation, is not included in this analysis. However, as the reviewer correctly notes, EMC10 gene expression is represented in the volcano plot in Supplementary Figure 4A, which displays differentially expressed genes identified through bulk RNA-seq analysis of the same neuronal samples. To avoid any confusion, we have clarified the title of Figure 1C to emphasize that it represents miRNA expression changes.

      (3) With regard to studies using iPSC. Some of the studies are executed across multiple distinct pairs and some are only done in a single pair. Overall, while results are coherent and often complimentary, would it be valuable for the authors to comment on experiments where studies in multiple pairs seemed particularly important, or others wherein it was less important?

      We thank the reviewer for this insightful question regarding our use of multiple versus single hiPSC pairs. Our investigation began with the Q5/Q6 sibling (dizygotic twin) pair, which shares the most similar genetic background. This minimized the impact of confounding genetic factors and provided a robust foundation for testing our hypothesis that EMC10 upregulation, driven by miRNA dysregulation, is a key consequence of the 22q11.2 deletion in human neurons, thus validating our previous findings from the Df(16)A<sup>+/-</sup> mouse model (Stark et al., 2008; Xu et al., 2013). To ensure the generalizability of our findings, we incorporated additional hiPSC lines from another sibling pair as well as a case/control pair, demonstrating that EMC10 upregulation is a consistent feature of 22q11.2DS. Subsequently, we focused on the well-matched Q5/Q6 pair for detailed morphological, functional, and genetic rescue experiments. This approach allowed us to perform in-depth studies while controlling for potential genetic confounders. By using both multiple and single hiPSC pairs, we balanced the need for generalizable findings with the practical considerations of conducting technically complex and resource-intensive experiments. This strategy enabled us to provide both broad and detailed insights into the mechanisms underlying 22q11.2DS. We have modified the introductory paragraph of the Results section to better highlight this issue.

      (4) While the majority of the experiments seem sufficiently powered to test the hypothesis in question in the iPSC studies, Figure 2B raises the question if the study replicates here were underpowered, and perhaps the authors might consider mentioning this, although this is a very minor comment.

      We thank the reviewer for raising this point. We acknowledge that the statistical power to detect a significant difference in pre-miR-485 levels in Figure 2B may be limited due to the relatively small sample size and the inherent variability in hiPSC-derived neuronal cultures. However, it is important to emphasize that the functional impact of miRNAs is primarily mediated by their mature transcript forms. Our miRNA-seq data (Supplementary Table 2 and Figure S2) did not show significant alterations in the levels of mature miR-485-5p or miR-485-3p. This finding aligns with the reported expression pattern of miR-485 in hiPSC-derived neurons, where relatively low levels are observed in early neuronal development, with increased expression occurring in older, more mature neurons (Soutschek et al. 2023; https://ethz-ins.org/igNeuronsTimeCourse/ database from the Institute of Neurogenomics, ETH Zurich). This database provides a valuable resource for examining gene expression dynamics during human neuronal differentiation. Given that our hiPSC-derived neurons were analyzed at a relatively early developmental stage (DIV8 for these experiments), it is likely that miR-485 expression had not yet reached levels sufficient to reveal significant differences. While we acknowledge the potential limitation in statistical power for detecting subtle changes in pre-miR-485 levels, the combined evidence suggests that miR-485 may not be a significant contributor to the observed phenotypes at this developmental stage.

      A paragraph has been added in the corresponding Results section to address this issue.

      (5) There are a few situations where the authors could help out the reader a little bit by providing more labels on the figures directly. For example: in Figure 2, there are expression levels, over-expression, and inhibition of miRNA but the X-axis is named with similar labels for the miRNAs in question for each of these distinct experiments. If the authors want to help the reader, they may consider labeling these panels with a descriptive title to reflect the experiment being done or use more descriptive terms in the X-axis panels. Again, this is minor. Similarly, in Figure 5, it might be helpful for the authors to help out the reader again with more labels on the panels, such as in Figures 5B, 5C, and 5D. Would they consider labeling these panels, HPC, PFC, SSC with the brain location as they did in Figure 4?

      We thank the reviewer for these helpful suggestions to improve the clarity of our figures. We have implemented the proposed changes. In Figure 2C-E, we have added specific titles to the panels to clearly distinguish between the different experimental conditions such as miRNA overexpression and inhibition. Similarly, in Figure 5, we labeled panels 5B, 5C, and 5D with the brain regions analyzed (HPC, PFC, SSC) to match the labeling used in Figure 4. We believe these revisions enhance the readability and overall interpretability of the figures, making it easier for readers to follow the experiments and results.

      (6) Figure 3: There is some overshoot of the data in EMC10 homozygous null, in panel 3E, and also, overshoot of the het in panel 3H. Would there be value in the authors commenting on the potential basis for this in the discussion? Some issues are minor, such as the lack of electrophysiological analysis of circuits in vivo or in ex vivo slices that may further support the proposed rescue.

      The reviewer correctly highlights the observation in Figures 3E and 3H, where the number of branch points in the Q6/EMC10<sup>HOM</sup> line exceeds wildtype levels and the calcium response in the Q6/EMC10<sup>HET</sup> and Q6/EMC10<sup>HOM</sup> lines surpasses that of the control. This overshoot is indeed intriguing and warrants discussion. EMC10 is part of the ER Membrane Complex (EMC), which plays a critical role in the proper folding and localization of various membrane proteins, including neurotransmitter receptors and ion channels such as voltage-gated calcium channels (Chitwood et al., 2018; Shurtleff et al., 2018; Chitwood and Hegde, 2019). In the context of the 22q11.2 deletion, EMC10 dysregulation may disrupt the proper localization of these proteins at the synapse, affecting both dendritic morphology and calcium signaling. The precise basis of this overshoot remains unclear. The overshoot may result from a dosage-sensitive inhibitory effect of Emc10, where both reduced and increased expression alter normal neuronal processes, with excessive responses potentially triggered upon gene restoration by the mutant system’s adaptation to dysfunction, leading to altered receptor sensitivity or signaling dynamics. This underscores the critical importance of precise Emc10 expression for proper neuronal development and function, in line with previous findings suggesting that EMC10 plays an auxiliary or modulatory role in EMC function. A short comment on the potential basis for this overshoot has been added in the corresponding Results section of the manuscript. Regardless of the underlying mechanisms, these findings emphasize the importance of precise titration of ASO constructs, rigorous gene dosage controls, and thorough analysis of context-specific responses to ensure both efficacy and safety in clinical applications.

      We also agree with the reviewer that electrophysiological studies, particularly in the 22q11.2 deletion mouse model, would provide valuable insights into the impact of EMC10 modulation by ASOs on neuronal activity and circuit function at the in vivo and ex vivo levels. Incorporating such experiments into future studies will allow us to assess synaptic transmission and plasticity, contributing to a more comprehensive understanding of the therapeutic potential of ASO-mediated EMC10 modulation in 22q11.2DS.

      (7) Did the authors take out the behavior studies further than 9 weeks? Would the authors consider commenting on what they speculate might be the duration of the treatment effect? For both mice and definitely humans.

      We thank the reviewer for raising the important question regarding the duration of the ASO treatment effect, which is crucial for translating our findings into clinically relevant therapies. While behavioral studies beyond 9 weeks were not conducted in this study, our in vivo experiments and findings from prior publications (detailed below) enable an informed speculative assessment.

      We utilized 2'-O-methoxyethyl (2'-MOE) modified ASOs, known for their enhanced binding affinity, nuclease resistance, and increased metabolic stability. In our in vivo post-injection screening of ASOs (Figure S13C), we predicted that Emc10 expression levels return to normal WT levels (~T100%) approximately 26 weeks post-treatment in Emc10<sup>ASO</sup> (#1466182) treated mice. This prediction is supported by our Emc10 expression profiles across various brain regions, which demonstrate robust repression of Emc10 lasting up to 10 weeks post-administration (Figure 6D-F). While these findings suggest that the treatment effect in our model could extend significantly beyond 10 weeks following a single ASO injection, further empirical validation is required through extended follow-up studies. Encouragingly, long-term effects of 2'-MOE ASOs have been observed in other neurological disorders (Kordasiewicz et al., 2012; Scoles et al., 2017; Finkel et al., 2017; Darras et al., 2019). However, factors such as ASO distribution, target cell turnover, and disease-specific pathophysiology could influence the duration of the effect. To address these uncertainties, we have added a paragraph in the Discussion section emphasizing the need for additional studies, including extended follow-up periods and eventual clinical trials, to determine the specific duration of effect for our Emc10<sup>ASO</sup> constructs in treating 22q11.2DS.

      Reviewer #2 (Recommendations For The Authors):

      (1) It is acknowledged that the iPSC-derived cells in Figure 1 are no longer progenitors, but differentiation markers for astrocytes and glia are also needed in Figure 1b to establish that equal rates of differentiation have occurred across genotypes.

      We thank the reviewer for raising this important point about ensuring equal rates of differentiation across genotypes. As the reviewer notes, we employed a well-established protocol for directed differentiation of hiPSCs into cortical neurons using a combination of small molecule inhibitors, as previously described by Qi et al. (2017). This protocol has been extensively validated and is known to robustly generate cortical neurons while actively suppressing glial differentiation, as evidenced by the lack of upregulation of glial markers such as GFAP, AQP4, or OLIG2 in the original study. Given the established neuronal specificity of this protocol and our focus on neuronal phenotypes, we prioritized the confirmation of successful neuronal differentiation using the established neuronal markers TUJ1 and TBR1. Therefore, additional markers for astrocytes and glia are not included in this figure, as we did not expect significant glial differentiation under these conditions. A sentence has been added in the corresponding Results section to address this issue.

      (2) For the RNA-seq experiments outlined in Figures 3J and K, a more comprehensive analysis is needed of the genes disrupted in the parental Q6 line relative to the het and homo lines. What percent are rescued, unaffected, vs uniquely disrupted?

      Reduction in EMC10 levels is not expected to directly affect transcription or broadly reorganize the gene expression profile of the Q6/Q5 NGN2-iN lines. Our transcriptional profiling was not designed to assess the direct impact of EMC10 deficiency on gene expression but rather to measure the cellular pathways affected by reduced EMC10 in the patient Q6 line. We identified genes differentially expressed between the Q6 (patient) and Q5 (control) lines, whose expression differences were either abolished or significantly attenuated ("rescued") in the Q6/EMC10<sup>HET</sup> or Q6/EMC10<sup>HOM</sup> lines. In the Q6/EMC10<sup>HET</sup> line, 237 DEGs (6%) were rescued, while in the Q6/EMC10<sup>HOM</sup> line, 382 DEGs (11%) were rescued. Importantly, further analysis revealed 103 shared rescued DEGs in these lines, which was statistically significant (enrichment factor = 1.7; p < 0.0001, based on a hypergeometric test). We added a new figure panel (Figure 3L) to visualize the significant overlap of rescued DEGs from the Q6/EMC10<sup>HET</sup> and Q6/EMC10<sup>HOM</sup> lines. This overlap suggests these genes play a critical role in biological pathways impacted by EMC10 levels, particularly in nervous system development, as indicated by our functional annotation analysis. We also performed protein-protein interaction (PPI) network analysis to explore the functional relationships among these 103 shared DEGs (Figure S8). Future studies will further investigate these gene sets to gain deeper insights into the molecular mechanisms underlying 22q11.2DS and the role of EMC10.

      (3) The authors claim that 50% EMC10 loss in adult mice is safe and should be toned down. EMC10 knockout mice have motor, anxiety, and social phenotypes. It would be unique amongst highly dosage-sensitive genes (MeCP2, CDKL5, TCF4, FMR1, etc.) for there to only be a neurodevelopmental component. In all those cases, and others, the effects of over and under-expression are reversible into adulthood. Establishing the range in adults is critical to establishing therapeutic utility. Absent a detailed examination of non-cognitive phenotypes, this claim cannot be made.

      The reviewer raises an important point about the potential effects of EMC10 reduction in adult mice and the need to establish a safe therapeutic window by evaluating both cognitive and non-cognitive phenotypes. We agree that such a comprehensive evaluation is critical for assessing the safety and translational potential of Emc10-targeting therapies. While the International Mouse Genotyping Consortium reported motor and anxiety phenotypes in homozygous Emc10 knockout mice, these data are unpublished and based on a relatively small number of animals. Furthermore, in our previous work (Diamantopoulou et al., 2017), we demonstrated that complete Emc10 loss does not impair cognition or social behavior, as assessed by prepulse inhibition (PPI), working memory (WM), and social memory (SM) assays (see Figure 3A-D; Diamantopoulou et al., 2017). Additionally, heterozygous Emc10 mice, which exhibit a ~50% reduction in Emc10 expression similar to that achieved with our ASO treatment, showed no evidence of motor deficits or anxiety-like behavior. Specifically, Emc10<sup>+/-</sup> mice displayed locomotor activity comparable to WT mice in the open field (OF) test (Figure S4A, Diamantopoulou et al., 2017). Moreover, genetic normalization of Emc10 expression in Df(16)A<sup>+/-</sup> mice demonstrated no signs of anxiety-like behavior, as assessed by the OF test (Figure S4A) and elevated plus maze (EPM) (Figure S4B; Diamantopoulou et al., 2017). To further support these findings, we have added new data to the current manuscript (see Figure S10J) showing that TAM treatment-mediated restoration of Emc10 levels in the brain of adult Df(16)A<sup>+/-</sup> mice did not affect the time that mutant mice spent in the center area of the OF (Fig. S10J), suggesting that Emc10 reduction does not influence anxiety-related behavior. These results suggest that a 50% reduction in EMC10 expression is unlikely to result in motor or anxiety-like phenotypes in adult mice. Finally, as noted in the manuscript, in addition to prior findings from animal models, a substantial number of relatively rare LoF variants or potentially damaging missense variants have been identified in the human EMC10 gene among likely healthy individuals in gnomAD, a database largely devoid of individuals known to be affected by severe neurodevelopmental disorders (NDDs).

      Nevertheless, the Discussion has been revised to underscore the importance of establishing a more detailed safety profile, including non-cognitive phenotypes, to fully validate the therapeutic potential of Emc10-targeting approaches. It also highlights the need for future studies to expand on these evaluations, addressing this critical aspect and laying a stronger foundation for advancing these findings into clinical drug development

      (4) Supplemental Figure 10: The protein validation of Emc10 knockout following tamoxifen injection needs to be validated in all brain regions, not just the PFC. This is particularly important as the rest of the paper focuses on HPC-mediated phenotypes.

      First, we want to emphasize that we conducted both qRT-PCR and WB assays on the same animal cohort, specifically examining the left and right hippocampus following ASO injection (see Figure S11C and D). This approach is crucial, given the central role of hippocampus in the phenotypes investigated in our ASO-mediated Emc10 knockdown experiments.

      The reviewer raises an important point regarding the validation of EMC10 reduction at the protein level across all relevant brain regions using the Emc10 conditional knockout strain. We agree that such validation would ideally confirm the efficacy of our tamoxifen-induced knockout model comprehensively. However, we hope the reviewer appreciates that obtaining sufficient high-quality protein for WB analysis from smaller brain regions like the hippocampus poses a significant technical challenge. This difficulty is further compounded by the need to reserve the same samples for qRT-PCR to ensure consistency between mRNA and protein measurements. Importantly, our data from ASO-mediated Emc10 knockdown experiments (Figures S11C-D) demonstrate a clear and consistent correlation between reductions in Emc10 mRNA and protein levels in both the left and right hippocampus. Furthermore, in our constitutive Emc10-knockout mouse model (Diamantopoulou et al., 2017; see Figure S1A-B), we observed a strong agreement between mRNA and protein levels, supporting the reliability of mRNA data as a proxy for EMC10 protein levels in our experiments. Importantly, in all instances where we performed parallel protein and RNA measurements in human cell lines, there was excellent concordance between the datasets. Thus, while we acknowledge the limitations of relying primarily on mRNA data, we are confident that the Emc10 mRNA expression data in Figure S10 accurately reflect protein-level changes across brain regions in our conditional knockout model. To address this concern more fully in the future, we are working to refine antibody detection and optimize our protein extraction protocols to enable more routine and precise protein-level validation across smaller brain regions. We appreciate the reviewer’s feedback and will continue to refine our methodologies to strengthen the robustness of our findings.

      (5) Figure 3: 1 way ANOVA would be more appropriate to analyze the data in B-G than t-tests.

      We appreciate the suggestion of the reviewer. As mentioned above, we carefully selected statistical tests appropriate for each analysis. For Figure 3B-G, we chose to use pairwise t-tests to address specific hypotheses regarding the disease phenotype and rescue effects. This approach is consistent with prior experimental studies in the field, including our own (e.g., Xu et al., 2013; Figure 7H-I). Importantly, most of our t-tests yielded highly significant results (p < 0.001 or p < 0.01), reinforcing the robustness of our findings.

      (6) Figure 5-6: Protein data is needed to complement the mRNA knockdown data.

      We agree with the reviewer on the importance of protein-level validation to complement the mRNA knockdown data. As mentioned in our response to Reviewer’s Comment (4), in all instances where we performed parallel protein and RNA measurements, either in mouse brain or human cell lines, we observed excellent concordance between the datasets. This supports the reliability of our mRNA data as a proxy for protein changes. Nevertheless, we acknowledge the value of including protein validation in future experiments and will consider incorporating it to further strengthen our findings.

      (7) The use of additional phenotypic measures is applauded in Figure 6, however, to appropriately interpret the data more is needed. Shao et al 2021 (Figure S9) show data from the International Mouse Genotyping Consortium claiming EMC10 KO mice have gait, activity, and anxiety phenotypes. All of these parameters could impact the SM assay and the y-maze assay. Changes in SM interaction time could be linked to anxiety or motor impairments, but interpreted as cognitive deficits because these symptoms were not assessed. At a minimum, discussion is needed about this limitation, as well as the inclusion of distance explored in the SM and Y-maze assays.

      We thank the reviewer for their insightful comment regarding the potential influence of locomotor, gait, or anxiety phenotypes on the observed deficits in the SM and Y-maze assays. The behavioral phenotypes reported for Emc10 knockout mice by the International Mouse Genotyping Consortium (https://www.mousephenotype.org/data/genes/MGI:1916933) were limited to homozygous female mice and based on a small sample size (4–6 females) compared to a larger WT control group. Moreover, these data are unpublished and thus challenging to evaluate fully. Importantly, no abnormal behaviors were reported for Emc10 heterozygous knockout mice in these datasets. Additionally, the claim by Shao et al. (2021) regarding cognitive impairments in Emc10 knockout mice based on our previous work (Diamantopoulou et al., 2017) is inaccurate.

      Our analysis of both the constitutive Emc10 knockout model (Diamantopoulou et al., 2017) and the current conditional Emc10 heterozygous knockout model consistently demonstrates that Emc10 reduction does not affect locomotor activity or anxiety-like behavior. In our earlier characterization of constitutive heterozygous Emc10 knockout mice (Emc10<sup>+/-</sup>), we observed no signs of anxiety-like behavior or motor impairments in OF assays (see Figure 2A-B and Figure S4A, Diamantopoulou et al., 2017). Similarly, results from Df(16)A<sup>+/-</sup> mice with genetically normalized Emc10 expression [Df(16)A<sup>+/-</sup>; Emc10<sup>+/-</sup>] also showed no indications of anxiety-like behavior or locomotor changes in the OF and EPM assays (see Figure S4A-B, Diamantopoulou et al., 2017). Consistent with these findings, our current data from Df(16)A<sup>+/-</sup> mice with conditional Emc10 reduction in the brain show no significant differences in locomotor activity and anxiety-related measures as assessed by OF assays (Figure S10J). Furthermore, total arm entries in Y-maze assays conducted in Df(16)A<sup>+/-</sup> mice treated with Emc10 ASOs were comparable to controls (Figures S14C and G-H), providing additional support for the conclusion that locomotor activity remains unaffected in these models.

      We further appreciate the reviewer’s suggestion that changes in social interaction time during the SM assay could be influenced by anxiety or motor impairments. However, we consider this scenario unlikely in our model. Interaction times during the first trial of the SM assay, which measures general social interest, are comparable between Df(16)A<sup>+/-</sup> mice with reduced Emc10 expression (either genetically or through ASO treatment) and WT controls (see Figures 4E, 5E, and S10G). These findings indicate that our mouse models do not exhibit inherent difficulties in initiating social interaction, as might be expected if motor impairments or heightened anxiety were present. Reduced social interaction is commonly used as a behavioral marker for anxiety in rodent studies (reviewed by Bailey and Crawley, Anxiety-Related Behaviors in Mice, 2009). “Anxious” mice typically exhibit decreased social interaction, spending less time engaging with other mice compared to non-anxious counterparts. However, the specific deficit we observe in the second trial of the SM assay—when mice are reintroduced to a familiar juvenile—is indicative of impaired social recognition memory, as previously documented for Df(16)A<sup>+/-</sup> mice (Piskorowski et al., 2016; Donegan et al., 2020). This deficit is distinct from the general social avoidance typically associated with heightened anxiety.

      Based on our comprehensive assessment of locomotor activity, anxiety-related behaviors, and social interaction, we conclude that the observed rescue of social memory and spatial memory deficits in mice with reduced Emc10 expression is most likely due to improved cognitive function rather than alterations in motor or anxiety-related domains.

      (8) For ASO optimization experiments, it is not sufficient to claim robust uptake. A quantitative measure is needed using the PO antibody showing what percentage of cells were positive for the ASO. Since the contention is that only Emc10 in excitatory neurons is important, it would be helpful if this also included a breakdown of ASO uptake in excitatory and inhibitory neurons and astrocytes.

      We thank the reviewer for highlighting the importance of quantifying ASO uptake and assessing cell-type specificity. To address this, we have added new data to the panel, as shown in the high-magnification images in Figure S14A. These images provide evidence that a large majority of NeuN-positive neurons exhibit a strong ASO signal. Specifically, we observed widespread ASO uptake (green) that extensively colocalized with the neuronal marker NeuN (red) in both the hippocampus and prefrontal cortex. Quantitative analysis of this overlap indicates that over 97% of NeuN-positive neurons were ASO-positive, demonstrating efficient neuronal uptake. This robust neuronal uptake aligns with the significant normalization of Emc10 levels and the behavioral improvements observed in ASO-treated Df(16)A<sup>+/-</sup> mice, further supporting the functional efficacy of our approach in modulating Emc10 expression within the relevant neuronal populations. Overall, the observed ASO uptake in neurons, as demonstrated by IHC, combined with RNA assays and the behavioral improvements in treated mice, strongly supports the efficacy of our approach in targeting Emc10 expression in the intended neuronal populations.

      (9) An interpretation is needed in Figure S3 as to why ~50% of the pathways increased are also present on the decreased list. Ie. G1/transition, viral reproductive process, pos regulator of cell stress, etc. 4/10 GO terms are present in both increased and decreased groups in A and 7/10 in B.

      We thank the reviewer for pointing out the overlap between pathways enriched in both the upregulated and downregulated miRNA groups in Figure S3. This overlap likely reflects the complex nature of miRNA regulation, where individual miRNAs can target multiple genes within a pathway, and single genes can be regulated by multiple miRNAs, sometimes with opposing effects (reviewed in Bartel, 2009; Bartel, 2018). For example, in the “G1/S transition” pathway, upregulated miRNAs such as miR-92a-3p, miR-92b-3p, and miR-34a-5p may promote the transition by targeting cell cycle regulators like FBXW7, CDKN1C, and CDK6 (Zhou et al., 2015; Zhao et al., 2021; Oda et al., 2024). Conversely, downregulated miRNAs such as miR-143-3p and miR-200b are known to suppress the transition by targeting genes such as HK2 and GATA-4 (Zhou et al., 2015; Yao et al., 2013). Our analysis identified overlapping predicted target genes for both upregulated and downregulated miRNAs, supporting the notion that many genes are subject to complex regulation by multiple miRNAs with potentially synergistic or antagonistic effects. Thus, the enrichment of certain GO terms in both groups likely reflects this intricate interplay of miRNA-mediated gene regulation. Future investigations focusing on specific miRNA-target interactions within these pathways will be critical to fully elucidate the underlying mechanisms and better understand the functional consequences of these opposing regulatory effects.

      Minor Concerns:

      (1) Define SM before using it.

      We have defined the SM assay in the main text upon its first mention, where we describe the assay and its relevance to cognitive function (see page 11 of the revised manuscript).

      (2) Statistics have been run in Figure S2, but not presented. The text only states that the differences between groups are significant. Please add in.

      We have revised the legend of Figure S2 to include the specific statistical test used (students t-tests) and the corresponding p-values.

      (3) The switch from ASO1 to ASO2 between Figures 5 and 6 needs more discussion. Why were new ASOs generated when ASO1 worked?

      We thank the reviewer for their question regarding the transition from Emc10<sup>ASO1</sup> to Emc10<sup>ASO2</sup> between Figure 4 and Figures 5-6. Emc10<sup>ASO1</sup> served as our initial proof-of-concept ASO construct, successfully demonstrating the feasibility of inhibiting Emc10 mRNA expression and providing evidence for behavioral rescue in our mouse model. As outlined in the manuscript, Emc10<sup>ASO2</sup> targets a different region of the Emc10 transcript (intron 1, Figure 5A) compared to Emc10<sup>ASO1</sup> (intron 2, Figure 4A). This distinction provides an additional layer of validation for our targeting strategy and ensures specificity in modulating Emc10 expression. In addition, Emc10<sup>ASO1</sup> exhibited limited distribution in the brain, primarily targeting the hippocampus with weaker inhibition of Emc10 in other regions such as the cortex (Figure 4C, right panel). Emc10<sup>ASO2</sup> overcame this limitation and achieve broader brain distribution, as demonstrated by the qRT-PCR data in Figure 5C. Given that 22q11.2DS can affect multiple brain regions and cognitive domains beyond the hippocampus, achieving broader distribution of the ASO is critical for a more comprehensive assessment of therapeutic potential.

      (4) Page 3: Define "LoF"

      We have defined Loss-of-Function (LoF) in the main text where it is first mentioned in the Introduction, where we discuss the potential of using LoF mutations to devise therapeutic interventions (see page 3 of the revised manuscript).

      References

      Bailey and Crawley, Anxiety-Related Behaviors in Mice, In: Methods of Behavior Analysis in Neuroscience. 2nd edition. Boca Raton (FL): CRC Press/Taylor & Francis; Chapter 5, (2009).

      Bartel, MicroRNAs: target recognition and regulatory functions, Cell 136(2):215-33, (2009).

      Bartel, Metazoan MicroRNAs, Cell, 173(1):20-51, (2018).

      Chitwood et al., EMC Is Required to Initiate Accurate Membrane Protein Topogenesis, Cell 175, 1507-1519 e1516, (2018).

      Chitwood and Hegde, The Role of EMC during Membrane Protein Biogenesis, Trends Cell Biol. (5):371-384, (2019).

      Darras et al., Nusinersen in later-onset spinal muscular atrophy: Long-term results from the phase 1/2 studies, Neurology 92(21), (2019).

      Diamantopoulou et al., Loss-of-function mutation in Mirta22/Emc10 rescues specific schizophrenia-related phenotypes in a mouse model of the 22q11.2 deletion, Proc Natl Acad Sci U S A 114, E6127-E6136, (2017).

      Donegan et al., Coding of social novelty in the hippocampal CA2 region and its disruption and rescue in a 22q11.2 microdeletion mouse model, Nat Neurosci 23, 1365-1375, (2020).

      Finkel et al., Nusinersen versus Sham Control in Infantile-Onset Spinal Muscular Atrophy, N Engl J Med 377(18):1723-1732, (2017).

      Kordasiewicz et al., Sustained therapeutic reversal of Huntington's disease by transient repression of huntingtin synthesis, Neuron 74(6):1031-44, (2012).

      Oda et al., MicroRNA-34a-5p: A pivotal therapeutic target in gallbladder cancer, Mol Ther Oncol, 32(1):200765, (2024).

      Piskorowski et al., Age-Dependent Specific Changes in Area CA2 of the Hippocampus and Social Memory Deficit in a Mouse Model of the 22q11.2 Deletion Syndrome. Neuron 89, 163-176, (2016).

      Qi et al., Combined small-molecule inhibition accelerates the derivation of functional cortical neurons from human pluripotent stem cells. Nat Biotechnol 35, 154-163, (2017).

      Scoles et al., Antisense oligonucleotide therapy for spinocerebellar ataxia type 2, Nature 44(7650):362-366, (2017).

      Shao et al., A recurrent, homozygous EMC10 frameshift variant is associated with a syndrome of developmental delay with variable seizures and dysmorphic features, Genet Med 23, 1158-1162, (2021).

      Shurtleff et al., The ER membrane protein complex interacts cotranslationally to enable biogenesis of multipass membrane proteins, Elife 7, (2018).

      Soutschek et al., A human-specific microRNA controls the timing of excitatory synaptogenesis, bioRxiv, (2023).

      Stark et al., Altered brain microRNA biogenesis contributes to phenotypic deficits in a 22q11-deletion mouse model. Nat Genet 40, 751-760, (2008).

      Xu et al., Derepression of a neuronal inhibitor due to miRNA dysregulation in a schizophrenia-related microdeletion, Cell 152, 262-275, (2013).

      Yao et al., miR-200b targets GATA-4 during cell growth and differentiation, RNA Biol.10(4):465-8, (2013).

      Zhao et al., miR-92b-3p Regulates Cell Cycle and Apoptosis by Targeting CDKN1C, Thereby Affecting the Sensitivity of Colorectal Cancer Cells to Chemotherapeutic Drugs, Cancers 2;13(13):3323, (2021).

      Zhou et al., miR-92a is upregulated in cervical cancer and promotes cell proliferation and invasion by targeting FBXW7, Biochem Biophys Res Commun 458(1):63-9, (2015).

      Zhou et al., MicroRNA-143 acts as a tumor suppressor by targeting hexokinase 2 in human prostate cancer, Am J Cancer Res. 5(6):2056-6 (2015).

    1. Author response:

      The following is the authors’ response to the original reviews.

      Public Reviews:

      Reviewer #1 (Public Review):

      In this manuscript, the authors study the effects of synaptic activity on the process of eye-specific segregation, focusing on the role of caspase 3, classically associated with apoptosis. The method for synaptic silencing is elegant and requires intrauterine injection of a tetanus toxin light chain into the eye. The authors report that this silencing leads to increased caspase 3 in the contralateral eye (Figure 1) and demonstrate evidence of punctate caspase 3 that does not overlap neuronal markers like map2. However, the quantifications showing increased caspase 3 in the silenced eye (done at P5) are complicated by overlap with the signal from entire dying cells in the thalamus. The authors also show that global caspase 3 deficiency impairs the process of eye-specific segregation and circuit refinement (Figures 3-4).

      The reviewer states: “this silencing leads to increased caspase 3 in the contralateral eye”. We observed increased caspase-3 activity, not protein levels, in the contralateral dLGN, not eye.

      The reviewer states: “and demonstrate evidence of punctate caspase 3 that does not overlap neuronal markers like map2”. We do not believe that this statement is accurate, as we show that the punctate active caspase-3 signals overlap with the dendritic marker MAP2 (Figure S4A).

      The reviewer also states: “, the quantifications showing increased caspase 3 [activity] in the silenced [dLGN] (done at P5) are complicated by overlap with the signal from entire dying cells in the thalamus”. We do not believe that this statement is accurate. The apoptotic neurons we observed are relay neurons (confirmed by their morphology and positive staining of NeuN – Figure S4B-C) located in the dLGN (the dLGN is clearly labeled by expression of fluorescent proteins in RGCs, and only caspase-3 activity in the dLGN area is analyzed), not “cells” of unknown lineage (as suggested by the reviewer) in the general “thalamus” area (as suggested by the reviewer). If the dying cells were non-neuronal cells, that would indeed confound our quantification and conclusions, but that is not the case.

      We argue that whole-cell caspase-3 activation in dLGN relay neurons is a bona fide response to synaptic silencing by TeTxLC and therefore should be included in the quantification. We have two sets of controls: one is between the strongly inactivated dLGN and the weakly inactivated dLGN in the same TeTxLC-injected animal; and the second is between the dLGN of TeTxLC-injected animals and mock-injected animals. In both controls, only the dLGNs receiving strong synapse inactivation have more apoptotic dLGN relay neurons, demonstrating that these cells occur because of synapse inactivation. It is also unlikely that our perturbation is causing cell death through a non-synaptic mechanism. Since mock injections do not cause apoptosis in dLGN neurons, this phenomenon is not related to surgical damage. TeTxLC is injected into the eyes and only expressed in presynaptic RGCs, not in postsynaptic relay neurons, so this phenomenon is also unlikely to be caused by TeTxLC-related toxicity. Furthermore, if apoptosis of dLGN relay neurons is not related to synapse inactivation, then when TeTxLC is injected into both eyes, one would expect to see either the same amount or more apoptotic relay neurons, but we instead observed a reduction in dLGN neuron apoptosis, suggesting that synapse-related mechanisms are responsible. Considering the above, occasional whole-cell caspase-3 activation in relay neurons in TeTxLC-inactivated dLGN is causally linked to synapse inactivation and should be included in the quantification.

      We also revised the manuscript to better explain the possible mechanistic connection between localized caspase-3 activity and whole-cell caspase-3 activity. We propose that whole-cell caspase-3 activation occurs because of uncontrolled accumulation of localized caspase-3 activation. Please see line 127-140 and line 403-413 for details.

      Additionally, we would like to clarify that we are not claiming that synapse inactivation leads to only localized caspase-3 activation or only whole-cell caspase-3 activation, as is suggested by the editors and reviewers in the eLife assessment. We have clearly stated in the manuscript that both types of signals were observed. However, we reasoned that, because whole-cell caspase-3 activation in unperturbed dLGNs – which undergo normal synapse elimination – is infrequently observed, whole-cell caspase-3 activation may not be a significant driver of synapse elimination during normal development. In this revision, we included a new experiment to corroborate this hypothesis. If whole-cell caspase-3 activation in dLGN relay neurons is a prevalent phenomenon during normal development, such caspase-3 activity would lead to significant death of dLGN relay neurons during normal development. Consequently, if we block caspase-3 activation by deleting caspase-3, the number of relay neurons in the dLGN should increase. However, in support of our hypothesis, we observed comparable numbers of relay neurons in Casp3<sup>+/+</sup> and Casp3<sup>-/-</sup> mice. Please see Figure S7 for details.

      The authors also report that "synapse weakening-induced caspase-3 activation determines the specificity of synapse elimination mediated by microglia but not astrocytes" (abstract). They report that microglia engulf fewer RGC axon terminals in caspase 3 deficient animals (Figure 5), and that this preferentially occurs in silenced terminals, but this preferential effect is lost in caspase 3 knockouts. Based on this, the authors conclude that caspase 3 directs microglia to eliminate weaker synapses. However, a much simpler and critical experiment that the authors did not perform is to eliminate microglia and show that the caspase 3 dependent effects go away. Without this experiment, there is no reason to assume that microglia are directing synaptic elimination.

      The reviewer states: “microglia engulf fewer RGC axon terminals in caspase 3 deficient animals (Figure 5), and that this preferentially occurs in silenced terminals, but this preferential effect is lost in caspase 3 knockouts”. We are not sure what the reviewer means by “this preferentially occurs in silenced terminals”. Our results show that microglia preferentially engulf silenced terminals, and such preference is lost in caspase-3 deficient mice (Figure 6).

      We do not understand the experiment where the reviewer suggested to: “eliminate microglia and show that the caspase 3 dependent effects go away”. To quantify caspase-3 dependent engulfment of synaptic material by microglia or preferential engulfment of silenced terminals by microglia, microglia must be present in the tissue sample. If we eliminate microglia, neither of these measurements can be made. What could be measured if microglia are eliminated is the refinement of retinogeniculate pathway. This experiment would test whether microglia are required for caspase-3 dependent phenotypes. This is not a claim made in the manuscript. Instead, we claimed caspase-3 is required for microglia to engulf weak synapses, as supported by the evidence presented in Figure 6.

      We did not claim that “microglia are directing synaptic elimination”. Our claim is that synapse inactivation induces caspase-3 activity, and caspase-3 activation in turn leads to engulfment of weak synapses by microglia. Based on this model, it is the neuronal activity that fundamentally directs synapse elimination. Synapse engulfment by microglia is only a readout we used to measure the outcome of activity-dependent synapse elimination. We have revised all sections in the manuscript that are related to synapse engulfment by microglia to emphasize the logic of this model.

      We have also revised the abstract and title of the paper to better align it with our main claims, removed the reference to astrocytes, and clarified that microglia engulfment measurements are used as readouts of synapse elimination.

      Finally, the authors also report that caspase 3 deficiency alters synapse loss in 6-month-old female APP/PS1 mice, but this is not really related to the rest of the paper.

      We respectfully disagree that Figure 7 is not related to the rest of the paper. Many genes involved in postnatal synapse elimination, such as C1q and C3, have been implicated in neurodegeneration. It is therefore natural and important to ask whether the function of caspase-3 in regulating synaptic homeostasis extends to neurodegenerative diseases in adult animals. The answer to this question may have broad therapeutic impacts.

      Reviewer #2 (Public Review):

      Summary:

      This manuscript by Yu et al. demonstrates that activation of caspase-3 is essential for synapse elimination by microglia, but not by astrocytes. This study also reveals that caspase 3 activation-mediated synapse elimination is required for retinogeniculate circuit refinement and eye-specific territories segregation in dLGN in an activity-dependent manner. Inhibition of synaptic activity increases caspase-3 activation and microglial phagocytosis, while caspase-3 deficiency blocks microglia-mediated synapse elimination and circuit refinement in the dLGN. The authors further demonstrate that caspase-3 activation mediates synapse loss in AD, loss of caspase-3 prevented synapse loss in AD mice. Overall, this study reveals that caspase-3 activation is an important mechanism underlying the selectivity of microglia-mediated synapse elimination during brain development and in neurodegenerative diseases.

      Strengths:

      A previous study (Gyorffy B. et al., PNSA 2018) has shown that caspase-3 signal correlates with C1q tagging of synapses (mostly using in vitro approaches), which suggests that caspase-3 would be an underlying mechanism of microglial selection of synapses for removal. The current study provides direct in vivo evidence demonstrating that caspase-3 activation is essential for microglial elimination of synapses in both brain development and neurodegeneration.

      The paper is well-organized and easy to read. The schematic drawings are helpful for understanding the experimental designs and purposes.

      Weaknesses:

      It seems that astrocytes contain large amounts of engulfed materials from ipsilateral and contralateral axon terminals (Figure S11B) and that caspase-3 deficiency also decreased the volume of engulfed materials by astrocytes (Figures S11C, D). So the possibility that astrocyte-mediated synapse elimination contributes to circuit refinement in dLGN cannot be excluded.

      We would like to clarify that we do not claim that astrocytes are unimportant for synapse elimination or circuit refinement. We acknowledge that the claim made in the original submitted manuscript that caspase-3 does not regulate synapse elimination by astrocytes lacks strong supporting evidence. We have removed this claim and revised the section related to synapse engulfment by astrocytes to provide a more rigorous interpretation of our data. We also removed the section in discussion regarding distinct substrate preferences of microglia and astrocytes.

      Does blocking single or dual inactivation of synapse activity (using TeTxLC) increase microglial or astrocytic engulfment of synaptic materials (of one or both sides) in dLGN?

      We assume that by “blocking single or dual inactivation of synapse activity”, the reviewer refers to inactivating retinogeniculate synapses from one or both eyes.

      We showed that inactivating retinogeniculate synapses from one eye (single inactivation) increases engulfment of inactive synapses by microglia (Figure 6). We did not measure synapse engulfment by microglia while inactivating retinogeniculate synapses from both eyes (dual inactivation). However, based on the total active caspase-3 signal (Figure 2) in the dual inactivation scenario, we do not expect to see an increase in engulfment of synaptic material by microglia.

      We did not measure astrocyte-mediated engulfment with single or dual inactivation, as we did not see a robust caspase-3 dependent phenotype in synapse engulfment by astrocytes.

      Recommendations for the authors:

      Reviewer #1 (Recommendations for the Authors):

      (1) Figure 1 - It is not clear from this figure whether the authors are measuring caspase 3 in dendritic compartments or in dying relay neurons in the thalamus. The authors state that "either" whole cell death (1B) or smaller punctate signals (1F) were observed. When quantifying "photons" in Figure 1E, it appears most of the signal captured will be of dying relay neurons. What determined which signal was observed, and what is being quantified in Figure 1E? This also applies to the quantifications being reported in Figure 2.

      The quantification includes both types of signals – it is sum of all active caspase-3 signal within the dLGN boundary. We note that there is a significant amount of punctate signal in the TeTxLC-inactivated dLGN. Unfortunately, due to file compression, these signals are not clearly visible in the submitted manuscript file. We have provided high resolution figures in this revision.

      As argued above in the response to the public review, apoptotic relay neurons in TeTxLC-inactivated dLGN (not the general thalamus area) occur as a direct consequence of synapse inactivation. Therefore, active caspase-3 signals in these relay neurons should be included in the quantification.

      We believe it is the extent of synapse inactivation (i.e., the number of synapses that are inactivated) that determines whether dLGN relay neuron apoptosis occurs or not. Such apoptosis is expected considering the nature of the apoptosis signaling cascade. In the intrinsic apoptosis pathway, release of cytochrome-c from mitochondria induces cleavage of the initiator caspase, caspase-9, and caspase-9 in turn cleaves the executioner caspases, caspase-3/7, which causes apoptosis. Caspase-3 can cleave upstream factors in the apoptosis pathway, leading to explosive amplification of caspase-3 activity (McComb et al., DOI: 10.1126/sciadv.aau9433). When a relay neuron receives a few inactivated synapses, caspase-3 activation in the postsynaptic dendrite can remain local (as we observed in Figure 1), constrained by mechanisms such as proteasomal degradation of cleaved caspase-3 (Erturk et al., DOI: 10.1523/JNEUROSCI.3121-13.2014). However, when a relay neuron receives many inactivated synapses, the cumulative caspase-3 activity induced in the dendrite can overwhelm negative regulation and lead to significantly higher levels of caspase-3 activity in entire dendrites (Figure S4B) through positive feedback amplification, eventually leading to caspase-3 activation in entire relay neurons. Please see line 127-140 and line 403-413 for our discussion in the main text.

      (2) Figure 5 - Figures 5c-d and Fig 6 are confounded by pseudoreplication, whereby performing statistics on 50-60 microglia inflates statistical significance. Could the authors show all these data per mouse?

      If we understand the reviewer correctly, the reviewer is suggesting that reporting measurements from multiple microglia in one animal constitutes pseudo-replication. This is correct in a strict sense, as microglia in the same animal are more likely to be similar than microglia from different animals. In the revised version, we have plotted the data by animal in Figure S11 and S13. The observations remain valid. However, we would like to point out that averaging measurements from all microglia in each animal and report by mouse is very conservative, as measurements from microglia in the same animal still vary greatly due to cell-to-cell differences.

      (3) Although the authors are not the only ones to use this strategy, it is worth noting that performing all microglial experiments in Cx3cr1 heterozygotes could lead to alterations in microglial function that may not be reflective of their homeostatic roles.

      We acknowledge that Cx3cr1 heterozygosity could cause alterations in microglial physiology.

      While Cx3cr1 heterozygosity may impact microglia physiology, we note that the engulfment assay in Figure 5 is comparing microglia in Cx3cr1<sup>+/-</sup>; Casp3<sup>+/-</sup> and Cx3cr1<sup>+/-</sup>; Casp3<sup>-/-</sup> animals. Therefore, the impact of Cx3cr1 heterozygosity is controlled for in our experiment, and the observed difference in engulfed synaptic material in microglia is an effect specific to caspase-3 deficiency. However, we acknowledge that this difference could be quantitatively affected by Cx3cr1 heterozygosity.

      It is important to note that we did not perform all microglia engulfment analyses using Cx3cr1<sup>+/-</sup> mice. We have edited the manuscript to make this more clear. In the activity-dependent microglia engulfment analysis performed in Figure 6, we used Casp3<sup>+/+</sup> and Casp3<sup>-/-</sup> animals and detected microglia with anti-Iba1 immunostaining. Therefore, the impact of Cx3cr1 heterozygosity is not a problem for this experiment.

      Minor:

      (1) Figures are presented out of order, which makes the manuscript difficult to follow.

      We have revised text regarding the segregation analysis to align with the order of figures.

      (2) Figure S3 is very confusing- the terms "left" and "right" are used in three or four partly overlapping contexts (which eye, which injection, which panel or subpanel of the figure is being referred to). Would this not be more appropriately analyzed with a repeated measures ANOVA (multiple comparisons not necessary) rather than multiple separate T-tests?

      We have revised Figure S3 and S5 with better annotation and legends.

      Yes, it is possible to use repeated measure two-way ANOVA. The analysis reports significant effect from genotypes, with a dF of 1, SoS and MoS of 0.0001081, F(1,13) = 7.595, and p = 0.0164. We used multiple separate t-tests because we wanted to show how genotype effects change with increasing thresholds, whereas two-way ANOVA only provides one overall p-value.

      (3) Could the authors clarify why the percentage overlap (in the controls) is so different between Figure 3C and Figure S3C, and why different thresholds are applied?

      This difference is primary due to difference in age. Figure 3 and Figure S5 are acquired at age of P10, while Figure S3 is acquired at P8. While the segregation process is largely complete by P8, the segregation continues from P8 to P10. Therefore, overlap measured at P10 will be lower than that measured at P8. If we compare overlap at the same threshold (e.g., 10%) and at the same age in Figure 3 and S5, the overlap is very similar.

      The choice of threshold is related to the methods of labeling. In Figure 3, RGC terminals are labeled with AlexaFlour conjugated cholera toxin subunit-beta (CTB). In Figure S3 and S5, RGC axons are labeled by expression of fluorescent proteins. Labeling with CTB only labels membrane surfaces but yields stronger and slightly different signals at fine scales than labeling with fluorescent protein which are cell fillers. For Figure S3 and S5 (which use fluorescent protein labeling), higher thresholds such as those used in Figure 3 (which use CTB labeling) can be applied and the same trend still holds, but the data will be noisier. Regardless of the small difference in thresholds used, the important observation is that the defects in TeTxLC-injected or caspase-3 deficient animals are clear across multiple thresholds.

      (4) Many describe the eye-specific segregation process as being complete "between P8-10". Other studies have quantified ESS at P10 (Stevens 2007). The authors state they did all quantifications at P8 (l. 82) and refer to Figure 3, but Figure 3 shows images from P10, whereas Figure S3 shows data from P8.

      We did not say we performed all quantification at P8. In line 85, we said “To validate the efficacy of our synapse inactivation method, we injected AAV-hSyn-TeTxLC into the right eye of wildtype E15 embryos and analyzed the segregation of eye-specific territories at postnatal day 8 (P8), when the segregation process is largely complete”. The age of postnatal day 8 in this context is specifically referring to the experiment shown in Figure S3. For the segregation analysis in Figure 3, we specifically stated that the experiment was conducted at P10 (line 277).

      Although the experiment in Figure S3 is conducted at P8, and Figure S5 and Figure 3 show results at P10, each dataset always included appropriate age-matched controls.  P8 is generally considered an age where segregation is mostly complete and sufficient for us to assess the potency of TeTxLC-delivered AAV on eye segregation.  We don’t think performing the experiment shown in Figure S3 at P8 impacts the interpretation of the data.

      (5) Is Figure 6 also using Cx3cr1 GFP to label microglia? This is not clarified.

      We apologize for this oversight. In Figure 6 microglia are labeled by anti-Iba1 immunostaining. We have clarified this in figure legends and text.

      Reviewer #2 (Recommendations for the Authors):

      (1) The authors quantified the caspase-3 activity using immunostaining and confocal microscopy (Figures 1B-E). They may need to verify the result (increased level of activated caspase-3 upon synapse inactivation) using alternative methods, such as western blotting.

      Both western blot and immunostaining are based on antibody-antigen interaction. These two methods are not likely sufficiently independent. Additionally, to perform a western blot, we would need to surgically collect the TeTxLC-inactivated dLGN to avoid sample contamination from other brain regions. Such collection at the age we are interested in (P5) is very challenging. We have tested the anti-cleaved caspase-3 antibody using caspase-3 deficient mice and we can confirm it is a highly specific antibody that doesn’t generate signal in the caspase-3 deficient tissue samples.

      (2) Does caspase-3 deficiency alter the density of microglia or astrocytes in dLGN?

      No. Neither the density of microglia nor astrocytes changed with caspase-3 deficiency. In the case of microglia, we find that the mean density of microglia per unit area of dLGN is virtually the same in wild type and caspase-3 deficient mice (two-tailed t test P = 0.8556, 6 wild type and 5 Casp3<sup>-/-</sup> mice). Some overviews showing microglia in dLGNs of wildtype and caspase-3 deficient mice can be found in Figure S10.  Similarly for astrocytes, we did not observe overt changes in astrocytes dLGN density linked to caspase-3 deficiency.

      (3) During dLGN eye-specific segregation in normal developing animals, did the authors observe different levels of activated caspase-3 in different regions (territories)?

      For normal developing animals, the activated caspase-3 signal is generally sparse, and it is difficult to distinguish whether the signal is related to synapse elimination. For animals receiving TeTxLC-injection, we did notice that in the dLGN contralateral to the injection, where most inactivated synapses are located, the punctate caspase-3 signal tends to concentrate on the ventral-medial side of the dLGN (Figure 1B), which is the region preferentially innervated by the contralateral eye.

      (4) Recording of NMDAR-mediated synaptic currents may not be necessary for demonstrating that caspase 3 is essential for dLGN circuit refinement. In addition, the PPR may not necessarily reflect the number of innervations that a dLGN neuron receives. Instead, showing the changes in the frequency of mEPSCs (or synapse/spine density) may be more supportive.

      Thank you for the comment. We have performed the suggested mEPSC measurements and reported the results in revised Figure 4D-F.

      (5) Why is caspase 3 activation enhanced (compared to control) only at 4 months of age, when A-beta deposition has not formed yet, but not at later time points in AD mice (Figure S17)?

      A prevailing hypothesis in the field is that the form of A-beta that is most neurotoxic is the soluble oligomeric form, not the fibril form that leads to plaque deposition. As the oligomeric form appears before plaque deposition, the enhanced caspase-3 activation we observed at 4-month may reflect an increase in oligomeric A-beta, which occurs before any visible A-beta plaque formation.

      (6) The manuscript can be made more concise, and the figures more organized.

      We removed superfluous details and corrected text-figure mismatches in the revised manuscript to improve readability.

    1. Author response:

      The following is the authors’ response to the original reviews.

      Major changes in the revised manuscript include:

      (1) The distinction between condition-dependent versus condition-independent variation in neural activity has been clarified. 

      (2) Principal angle calculations have been added. 

      (3) Neurons modulated during action execution but not during action observation have been analyzed to compare and contrast with mirror neurons. 

      (4) Canonical correlation analysis has been extended to three dimensions. 

      (5) Speculations have been moved to and modified in the Discussion. 

      (6) Computational details have been expanded in the Methods.

      Public Reviews: 

      Reviewer #1 (Public Review): 

      Summary and strengths. This paper starts with an exceptionally fair and balanced introduction to a topic, the mirror neuron literature, which is often debated and prone to controversies even in the choice of the terminology. In my opinion, the authors made an excellent job in this regard, and I really appreciated it. Then, they propose a novel method to look at population dynamics to compare neural selectivity and alignment between execution and observation of actions performed with different types of grip. 

      Thank you.

      Weakness.

      Unfortunately, the goal and findings within this well-described framework are less clear to me. The authors aimed to investigate, using a novel analytic approach, whether and to what extent a match exists between population codes and neural dynamics when a monkey performs an action or observes it performed by an experimenter. This motivation stems from the fact that the general evidence in the literature is that the match between visual and motor selectivity of mirror neuron responses is essentially at a chance level. While the approach devised by the author is generally well-described and understandable, the main result obtained confirms this general finding of a lack of matching between the two contexts in 2 out of the three monkeys. Nevertheless, the authors claim that the patterns associated with execution and observation can be re-aligned with canonical correlation, indicating that these distinct neural representations show dynamical similarity that may enable the nervous system to recognize particular actions. This final conclusion is hardly acceptable to me, and constitutes my major concern, at least without a more explicit explanation: how do we know that this additional operation can be performed by the brain? 

      Point taken.  In the Discussion, we now have clarified that this is our speculation rather than a conclusion and we also offer an alternative interpretation (lines 724 to 744):

      “One classic interpretation of similar latent dynamics in the PM MN population during execution and observation would be that this similarity provides a means for the brain to recognize similar movements performed by the monkey during execution and by the experimenter during observation. Through some process akin to a communication subspace (Semedo et al., 2019), brain regions beyond PM might recognize the correspondence between the latent dynamics of the executed and observed actions.

      Alternatively, given that observation of another individual can be considered a form of social interaction, PM MN population activity during action observation, rather than representing movements made by another individual similar to one’s own movements, instead may represent different movements one might execute oneself in response to those made by another individual (Ninomiya et al., 2020; Bonini et al., 2022; Ferrucci et al., 2022; Pomper et al., 2023). This possibility is consistent with the finding that the neural dynamics of PM MN populations are more similar during observation of biological versus non-biological movements than during execution versus observation (Albertini et al., 2021). Though neurons active only during observation of others (AO units) have been hypothesized to drive observation activity in MNs, the present AO populations were too small to analyze with the approaches we applied here.  Nevertheless, the similar relative organization of the execution and observation population activity in PM MNs revealed here by alignment of their latent dynamics through CCA could constitute a correspondence between particular movements that might be made by the subject in response to particular movements made by the other individual, i.e. responsive movements which would not necessarily be motorically similar to the observed movements.”

      Is this a computational trick to artificially align something that is naturally non-aligned, or can it capture something real and useful? 

      We feel this is more than a trick.  In the Introduction, we now have clarified (lines 166 to 170):

      “Such alignment would indicate that the relationships among the trajectory segments in the execution subspace are similar to the relationships among the trajectory segments in the observation subspace, indicating a corresponding structure in the latent dynamic representations of execution and observation movements by the same PM MN population.”

      In the Results we give the follow example (lines 446 to 455):

      “Such alignment would indicate that neural representations of trials involving the four objects bore a similar relationship to one another in neural space during execution and observation, even though they occurred in different subspaces.  For example, the trajectories of PMd+M1 neuron populations recorded from two different monkeys during center-out reaching movements could be aligned well (Safaie et al., 2023).  CCA showed, for example, that in both brains the neural trajectory for the movement to the target at 0° was closer to the trajectory for movement to the target at 45° than to the trajectory for the movement to the target at 180°. Relationships among these latent dynamic representations of the eight movements thus were similar even though the neural populations were recorded from two different monkeys.”

      And in the Discussion we now compare (lines 677 to 686):

      “Corresponding neural representations of action execution and observation during task epochs with higher neural firing rates have been described previously in PMd MNs and in PMv MNs using representational similarity analysis RSA (Papadourakis and Raos, 2019).  And during force production in eight different directions, neural trajectories of PMd neurons draw similar “clocks” during execution, cooperative execution, and passive observation (Pezzulo et al., 2022).  Likewise in the present study, despite execution and observation trajectories progressing through largely distinct subspaces, in all three monkeys execution and observation trajectory segments showed some degree of alignment, particularly the Movement and Hold segments (Figure 8C), indicating similar relationships among the latent dynamic representations of the four RGM movements during execution and observation.”

      Based on the accumulated evidence on space-constrained coding of others' actions by mirror neurons (e.g., Caggiano et al. 2009; Maranesi et al. 2017), recent evidence also cited by the authors (Pomper et al. 2023), and the most recent views supported even by the first author of the original discovery (i.e., Vittorio Gallese, see Bonini et al. 2022 on TICS), it seems that one of the main functions of these cells, especially in monkeys, might be to prepare actions and motor responses during social interaction rather than recognizing the actions of others - something that visual brain areas could easily do better than motor ones in most situations. In this perspective, and given the absence of causal evidence so far, the lack of visuo-motor congruence is a potentially relevant feature of the mechanism rather than something to be computationally cracked at all costs. 

      We agree that this perspective provides a valuable interpretation of our findings.  In the Discussion, we have added the following paragraph (lines 730 to 744):

      “Alternatively, given that observation of another individual can be considered a form of social interaction, PM MN population activity during action observation, rather than representing movements made by another individual similar to one’s own movements, instead may represent different movements one might execute oneself in response to those made by another individual (Ninomiya et al., 2020; Bonini et al., 2022; Ferrucci et al., 2022; Pomper et al., 2023). This possibility is consistent with the finding that the neural dynamics of PM MN populations are more similar during observation of biological versus non-biological movements than during execution versus observation (Albertini et al., 2021). Though neurons active only during observation of others (AO units) have been hypothesized to drive observation activity in MNs, the present AO populations were too small to analyze with the approaches we applied here.  Nevertheless, the similar relative organization of the execution and observation population activity in PM MNs revealed here by alignment of their latent dynamics through CCA could constitute a correspondence between particular movements that might be made by the subject in response to particular movements made by the other individual, i.e. responsive movements which would not necessarily be motorically similar to the observed movements.”

      Specific comments on Results/Methods: 

      I can understand, based on the authors' hypothesis, that they employed an ANOVA to preliminarily test whether and which of the recorded neurons fit their definition of "mirror neurons". However, given the emphasis on the population level, and the consolidated finding of highly different execution and observation responses, I think it could be interesting to apply the same analysis on (at least also) the whole recorded neuronal population, without any preselection-based on a single neuron statistic. Such preselection of mirror neurons could influence the results of EXE-OBS comparisons since all the neurons activated only during EXE or OBS are excluded. Related to this point, the authors could report the total number of recorded neurons per monkey/session, so that also the fraction of neurons fitting their definition of mirror neuron is explicit. 

      We are aware that a number of recent studies from other laboratories already have analyzed the entire population of neurons during execution versus observation, without selectively analyzing neurons active during both execution and observation (Jiang et al., 2020; Albertini et al., 2021). However, our focus lies not in how the entire PM neural population encodes execution versus observation, but in the differential activity of the mirror neuron subpopulation in these two contexts.  Our new Table 2 presents the numbers of mirror neurons (MN), action execution only neurons (AE), action observation only neurons (AO), and neurons not significantly task-related during either execution or observation (NS).  Although we often recorded substantial numbers of AE neurons, very few AO neurons were found in our recordings.  In analyzing the AE subpopulation, we found unexpected differences in canonical correlation alignment between and within the MN and AE neuron populations. In view of the editors’ comments that “…the reviewers provided several specific recommendations of new analyses to include. However, now the paper feels extremely long…”. We have chosen to focus on comparing AE neurons with MNs.  

      Furthermore, the comparison of the dynamics of the classification accuracy in figures 4 and 5, and therefore the underlying assumption of subspaces shift in execution and observation, respectively, reveal substantial similarities between monkeys despite the different contexts, which are clearly greater than the similarities among neural subspaces shifts across task epochs: to me, this suggests that the main result is driven by the selected neural populations in different monkeys/implants rather than by an essential property of the neuronal dynamics valid across animals. Could the author comment on this issue? This could easily explain the "strange" result reported in figure 6 for monkey T. 

      We have taken the general approach of emphasizing findings common across individual animals, but also reporting individual differences.  We have added the following in the Discussion (lines 645 to 654):

      “We did not attempt to classify neurons in our PM MN populations as strictly congruent, broadly congruent, or non-congruent.  Nevertheless, the minimal overlap we found in instantaneous execution and observation subspaces would be consistent with a low degree of congruence in our PM MN populations.  Particularly during one session monkey T was an exception in this regard, showing a considerable degree of overlap between execution and observation subspaces, not unlike the shared subspace found in other studies that identified orthogonal execution and observation subspaces as well (Jiang et al., 2020).  Although our microelectrode arrays were placed in similar cortical locations in the three monkeys, by chance monkey T’s PM MN population may have included a substantial proportion of congruent neurons.”

      Reviewer #2 (Public Review): 

      In this work, the authors set out to identify time-varying subspaces in the premotor cortical activity of monkeys as they executed/observed a reach-grasp-hold movement of 4 different objects. Then, they projected the neural activity to these subspaces and found evidence of shifting subspaces in the time course of a trial in both conditions, executing and observing. These shifting subspaces appear to be distinct in execution and observation trials. However, correlation analysis of neural dynamics reveals the similarity of dynamics in these distinct subspaces. Taken together, Zhao and Schieber speculate that the condition-dependent activity studied here provides a representation of movement that relies on the actor. 

      This work addresses an interesting question. The authors developed a novel approach to identify instantaneous subspaces and decoded the object type from the projected neural dynamics within these subspaces. As interesting as these results might be, I have a few suggestions and questions to improve the manuscript: 

      (1) Repeating the analyses in the paper, e.g., in Fig5, using non-MN units only or the entire population, and demonstrating that the results are specific to MNs would make the whole study much more compelling. 

      We have added analyses of those non-MNs modulated significantly during action execution but not during observation, which we refer to as AE neurons.  The additional findings from these analyses are spread throughout the manuscript:

      Lines 284-293:

      “We also examined the temporal progression of the instantaneous subspace of AE neurons.  As would be expected given that AE neurons were not modulated significantly during observation trials, in the observation context AE populations had no gradual changes in principal angle (Figure 4 – figure supplement 3).  During execution, however, Figure 4I-L show that the AE populations had a pattern of gradual decrease in principal angle similar to that found in the MN population (Figure 4A-D).  After the instruction onset, the instantaneous subspace shifted quickly away from that present at time I and progressed gradually toward that present at times G and M, only shifting toward that present at time H after movement onset.  As for the PM MN populations, the condition-dependent subspace of the PM AE populations shifted progressively over the time course of execution RGM trials.” 

      Lines 411-419:

      “During execution trials, classification accuracy for AE populations (Figure 6I-L) showed a time course quite similar to that for MN populations, though amplitudes were lower overall, most likely because of the smaller population sizes. During observation, AE populations showed only low-amplitude, short-lived peaks of classification accuracy around times I, G, M, and H (Figure 6 – figure supplement 1).  Given that individual AE neurons showed no statistically significant modulation during observation trials, even these small peaks might not have been expected.  Previous studies have indicated, however, that neurons not individually related to task events nevertheless may contribute to a population response (Shenoy et al., 2013; Cunningham and Yu, 2014; Gallego et al., 2017; Jiang et al., 2020).”

      Lines 495-508:

      “Although MNs are known to be present in considerable numbers in both the primary motor cortex and premotor cortex (see Introduction), most studies of movement-related cortical activity in these areas make no distinction between neurons with activity only during action execution (AE neurons) and those with activity during both execution and observation (MNs).  This reflects an underlying assumption that during action execution, mirror neurons function in parallel with AE neurons, differing only during observation.  We therefore tested the hypothesis that MN and AE neuron execution trajectory segments from the same session would align well.  Figure 8C (blue) shows the mean CCs between MN and AE execution trajectory segments across 8 alignments (MN/AE; 2 R, 3 T, 3 F), which reached the highest values for the Hold segments .  All three of these coefficients were substantially lower than those for the MN execution vs. observation alignments given above.  Surprisingly, the alignment of AE neuron execution trajectory segments with those of the simultaneously recorded MN population was weaker than the alignment of MN trajectories during execution vs. observation.

      Did these differences in MN:1/2, MN:E/O, and MN/AE alignment result from consistent differences in their respective patterns of co-modulation, or from of greater trial-by-trial variability in the patterns of co-modulation among MNs during observation than during execution, and still greater variability among AE neurons during execution?  The bootstrapping approach we used for CCA (see Methods) enabled us to evaluate the consistency of relationships among trajectory segments across repeated samplings of trials recorded from the same neuron population in the same session and in the same context (execution or observation).  We therefore performed 500 iterations of CCA between two different random samples of MN execution (MN:E/E), MN  observation (MN:O/O), or AE execution (AE:E/E) trajectory segments from a given session (2 R, 3 T, 3 F). This within-group alignment of MN execution trajectory segments from the same session (Figure 8D, MN:E/E, gray, Hold: () was as strong as between session alignment (Figure 8C, MN/1:2, black).  But within-group alignment of MN observation trajectory segments (Figure 8D, MN:O/O, orange, Hold: () was lower than that found with MN execution segments (Figure 8C, MN:E/O, red, .  Likewise, within-group alignment of AE neuron trajectory segments (Figure 8D, AE:E/E, light blue, Hold: () was lower than their alignment with MN execution segments (Figure 8C, MN/AE, blue, Hold: ().  Whereas MN execution trajectories were relatively consistent within sessions, MN observation trajectories and AE execution trajectories were less so.”

      And in the Discussion we now suggest (lines 682 to 698):

      “Based on the assumption that AE neurons and MNs function as a homogenous neuron population during action execution, we had expected AE and MN execution trajectory segments to align closely.  During execution trials, the progression of instantaneous condition-dependent subspaces and of classification accuracy in AE populations was quite similar to that in MN populations.  We were surprised to find, therefore, that alignment between execution trajectory segments from AE populations and from the simultaneously recorded MN populations was even lower than alignment between MN execution and observation segments (Figure 8C, blue versus red).  Moreover, whereas within-group alignment of MN execution trajectory segments was high, within-group alignment of AE neuron execution trajectory segments was low (Figure 8D, gray versus light blue).  These findings indicate that the predominant patterns of co-modulation among MNs during execution are quite consistent within sessions, but the patterns of comodulation among AE neurons are considerably more variable.  Together with our previous finding that modulation of MNs leads that of non-mirror neurons in time, both at the single neuron level and at the population level (Mazurek and Schieber, 2019), this difference in consistency versus variability leads us to speculate that during action execution, while MNs carry a consistent forward model of the intended movement, AE neurons carry more variable feedback information.”

      (2) The method presented here is similar and perhaps related to principal angles (https://doi.org/10.2307/2005662). It would be interesting to confirm these results with principal angles. For instance, instead of using the decoding performance as a proxy for shifting subspaces, principal angles could directly quantify the 'shift' (similar to Gallego et al, Nat Comm, 2018). 

      Point taken.  We now have calculated the principal angles as a function of time and present them as a new section of the Results including new figure 4 (lines 237 to 293). 

      “Instantaneous subspaces shift progressively during both execution and observation 

      We identified an instantaneous subspace at each one millisecond time step of RGM trials.  At each time step, we applied PCA to the 4 instantaneous neural states (i.e. the 4 points on the neural trajectories representing trials involving the 4 different objects each averaged across 20 trials per object, totaling 80 trials), yielding a 3-dimensional subspace at that time (see Methods).  Note that because these 3-dimensional subspaces are essentially instantaneous, they capture the condition-dependent variation in neural states, but not the common, condition-independent variation.  To examine the temporal progression of these instantaneous subspaces, we then calculated the principal angles between each 80-trial instantaneous subspace and the instantaneous subspaces averaged across all trials at four behavioral time points that could be readily defined across trials, sessions, and monkeys: the onset of the instruction (I), the go cue (G), the movement onset (M), and the beginning of the final hold (H).  This process was repeated 10 times with replacement to assess the variability of the principal angles.  The closer the principal angles are to 0°, the closer the two subspaces are to being identical; the closer to 90°, the closer the two subspaces are to being orthogonal.  

      Figure 4A-D illustrate the temporal progression of the first principal angle of the mirror neuron population in the three sessions (red, green, and blue) from monkey R during execution trials. As illustrated in Figure 4 – figure supplement 1 (see also the related Methods), in each session all three principal angles, each of which could range from 0° to 90°, tended to follow a similar time course.  In the Results we therefore illustrate only the first (i.e. smallest) principal angle.  Solid traces represent the mean across 10-fold cross validation using the 80-trial subsets of all the available trials; shading indicates ±1 standard deviation.  As would be expected, the instantaneous subspace using 80 trials approaches the subspace using all trials at each of the four selected times—I, G, M, and H—indicated by the relatively narrow trough dipping toward 0°.  Of greater interest are the slower changes in the first principal angle in between these four time points.  Figure 4A shows that after instruction onset (I) the instantaneous subspace shifted quickly away from the subspace at time I, indicated by a rapid increase in principal angle to levels not much lower than what might be expected by chance alone (horizontal dashed line). In contrast, throughout the remainder of the instruction and delay epochs (from I to G), Figure 4B and C show that the 80-trial instantaneous subspace shifted gradually and concurrently, not sequentially, toward the all-trial subspaces that would be reached at the end of the delay period (G) and then at the onset of movement (M), indicated by the progressive decreases in principal angle. As shown by Figure 4D, shifting toward the H subspace did not begin until the movement onset (M). To summarize, these changes in principal angles indicate that after shifting briefly toward the subspace present at time the instruction appeared (I), the instantaneous subspace shifted progressively throughout the instruction and delay epochs toward the subspace that would be reached at the time of the go cue (G), then further toward that at the time of movement onset (M), and only thereafter shifted toward the instantaneous subspace that would be present at the time of the hold (H).

      Figure 4E-H show the progression of the first principal angle of the mirror neuron population during observation trials.  Overall, the temporal progression of the MN instantaneous subspace during observation was similar to that found during execution, particularly around times I and H.  The decrease in principal angle relative to the G and M instantaneous subspaces during the delay epoch was less pronounced during observation than during execution.  Nevertheless, these findings support the hypothesis that the condition-dependent subspace of PM MNs shifts progressively over the time course of RGM trials during both execution and observation, as illustrated schematically in Figure 1A.

      We also examined the temporal progression of the instantaneous subspace of AE neurons.  As would be expected given that AE neurons were not modulated significantly during observation trials, in the observation context AE populations had no gradual changes in principal angle (Figure 4 – figure supplement 3).  During execution, however, Figure 4I-L show that the AE populations had a pattern of gradual decrease in principal angle similar to that found in the MN population (Figure 4A-D).  After the instruction onset, the instantaneous subspace shifted quickly away from that present at time I and progressed gradually toward that present at times G and M, only shifting toward that present at time H after movement onset.  As for the PM MN populations, the condition-dependent subspace of the PM AE populations shifted progressively over the time course of execution RGM trials.”

      The related Methods are now described in subsection “Subspace Comparisons—Principal Angles”

      Relatedly, why the decoding of the 'object type' is used to establish the progressive shifting of the subspaces? I would be interested to see the authors' argument. 

      We have clarified the reason for our decoding analysis as follows (lines 295 to 297):

      “The progressive changes in principal angles do not capture another important aspect of condition-dependent neural activity.  The neural trajectories during trials involving different objects separated increasingly as trials progressed in time.”

      And… (lines 332 to 348):

      “Decodable information changes progressively during both execution and observation 

      As RGM trials proceeded in time, the condition-dependent neural activity of the PM MN population thus changed in two ways.  First, the instantaneous condition-dependent subspace shifted, indicating that the patterns of firing-rate co-modulation among neurons representing the four different RGM movements changed progressively, both during execution and during observation.  Second, as firing rates generally increased, the neural trajectories representing the four RGM movements became progressively more separated, more so during execution than during observation. 

      To evaluate the combined effects of these two progressive changes, we clipped 100 ms single-trial trajectory segments beginning at times I, G, M, or H, and projected these trajectory segments from individual trials into the instantaneous 3D subspaces at 50 ms time steps.  At each of these time steps, we trained a separate LSTM decoder to classify individual trials according to which of the four objects was involved in that trial.  We expected that the trajectory segments would be classified most accurately when projected into instantaneous subspaces near the time at which the trajectory segments were clipped.  At other times we reasoned that classification accuracy would depend both on the similarity of the current instantaneous subspace to that found at the clip time as evaluated by the principal angle (Figure 4), and on the separation of the four trajectories at the clip time (Figure 5).”

      The object type should be much more decodable during movement or hold, than instruction, which is probably why the chance-level decoding performance (horizontal lines) is twice the instruction segment for the movement segment. 

      Indeed, the object type is more decodable during the movement and hold than during instruction or delay epochs.

      (3) Why aren't execution and observation subspaces compared together directly? Especially given that there are both types of trials in the same session with the same recorded population of neurons. Using instantaneous subspaces, or the principal angles between manifolds during exec trials vs obs trials.

      Point taken.  We now have added comparison of the execution and observation subspaces using the principal angles between instantaneous subspaces (lines 421 to 436):

      “Do PM mirror neurons progress through the same subspaces during execution and observation?

      Having found that PM mirror neuron populations show similar progressive shifts in their instantaneous neural subspace during execution and observation of RGM trials, as well as similar changes in decodable information, we then asked whether this progression passes through similar subspaces during execution and observation.  To address this question, we first calculated the principal angles between the instantaneous mirror-neuron execution subspace at selected times I, G, M, or H and the entire time series of instantaneous mirror-neuron observation subspaces (Figure 7A-D).  Conversely, we calculated the principal angles between the instantaneous observation subspaces at selected times I, G, M, or H and the entire time series of instantaneous execution subspaces (Figure 7E-H).  Although the principal angles were slightly smaller than might be expected from chance alone, indicating some minimal overlap of execution and observation instantaneous subspaces, the instantaneous observation subspaces did not show any progressive shift toward the I, G, M, or H execution subspace (Figure 7A-D), nor did the instantaneous execution subspaces shift toward the I, G, M, or H observation subspace (Figure 7E-H).”

      (4) The definition of the instantaneous subspaces is a critical point in the manuscript. I think it is slightly unclear: based on the Methods section #715-722 and the main text #173-#181, I gather that the subspaces are based on trial averaged neural activity for each of the 4 objects, separately. So for each object and per timepoint, a vector of size (1, n) -n neurons- is reduced to a vector of (1, 2 or 3 -the main text says 2, methods say 3-) which would be a single point in the low-d space. Is this description accurate? This should be clarified in the manuscript.  

      In the Methods, we now have clarified (lines 849 to 859):

      “Instantaneous subspace identification 

      Instantaneous neural subspaces were identified at 1 ms intervals.  At each 1 ms time step, the N-dimensional neural firing rates from trials involving the four different objects— sphere, button, coaxial cylinder, and perpendicular cylinder—were averaged separately, providing four points in the N-dimensional space representing the average neural activity for trials involving the different objects at that time step.  PCA then was performed on these four points.  Because three dimensions capture all the variance of four points, three principal component dimensions fully defined each instantaneous subspace.  Each instantaneous 3D subspace can be considered a filter described by a matrix, W, that can project high-dimensional neural activity into a low-dimensional subspace, with the time series of instantaneous subspaces, W_i, forming a time series of filters (Figure 1B).”

      (5) Isn't the process of projecting segments of neural dynamics and comparing the results equivalent to comparing the projection matrices in the first place? If so, that might have been a more intuitive avenue to follow. 

      As described in more detail in our responses to item 2, above, we have added analyses of principal angles to compare the projection matrices directly.  However, “the process of projecting segments of neural dynamics and comparing the results” incorporates the progressively increasing separation of the trajectory segments and hence is not simply equivalent to comparing the subspaces with principal angles.

      (6) Lines #385-#389: This process seems unnecessarily complicated. Also, given the number of trials available, this sometimes doesn't make sense. E.g. Monkey R exec has only 8 trials of one of the objects, so bootstrapping 20 trials 500 times would be spurious. Why not, as per Gallego et al, Nat Neurosci 2020 and Safaie et al, Nat 2023 which are cited, concatenate the trials? 

      In the Methods we now clarify that (lines 953 to 969):

      “To provide an estimate of variability, we used a bootstrapping approach to CCA.  From each of two data sets we randomly selected 20 trials involving each target object (totaling 80 trials) with replacement, clipped trajectory segments from each of those trials for 100 ms (100 points at 1 ms intervals) after the instruction onset, go cue, movement onset, or beginning of the final hold, and performed CCA as described above. (Note that because session 1 from monkey R included only 8 button trials (Table 1), we excluded this session from CCA analyses.)  With 500 iterations, we obtained a distribution of the correlation coefficients (CCs) between the two data sets in each of the three dimensions of the aligned subspace, which permitted statistical comparisons. We then used this approach to evaluate alignment of latent dynamics between different sessions (e.g. execution trials on two different days), between different contexts (e.g. execution and observation), and between different neural populations (e.g. MNs and AE neurons).This bootstrapping approach further enabled us to assess the consistency of relationships among neural trajectories within a given group—i.e. the same neural population during the same context (execution or observation) in the same session—by drawing two separate random samples of 80 trials from the same population, context, and session (Figure 8D), which would not have been possible had we concatenated trajectory segments from all trials in the session (Gallego et al., 2020; Safaie et al., 2023).”

      And we report results that could not have been obtained by concatenating all the trials (lines 522 to 541):

      “Did these differences in MN:1/2, MN:E/O, and MN/AE alignment result from consistent differences in their respective patterns of co-modulation, or from of greater trial-by-trial variability in the patterns of co-modulation among MNs during observation than during execution, and still greater variability among AE neurons during execution?  The bootstrapping approach we used for CCA (see Methods) enabled us to evaluate the consistency of relationships among trajectory segments across repeated samplings of trials recorded from the same neuron population in the same session and in the same context (execution or observation).  We therefore performed 500 iterations of CCA between two different random samples of MN execution (MN:E/E), MN  observation (MN:O/O), or AE execution (AE:E/E) trajectory segments from a given session (2 R, 3 T, 3 F). This within-group alignment of MN execution trajectory segments from the same session (Figure 8D, MN:E/E, gray, Hold: () was as strong as between session alignment (Figure 8C, MN/1:2, black).  But within-group alignment of MN observation trajectory segments (Figure 8D, MN:O/O, orange, Hold: () was lower than that found with MN execution segments (Figure 8C, MN:E/O, red, .  Likewise, within-group alignment of AE neuron trajectory segments (Figure 8D, AE:E/E, light blue, Hold: () was lower than their alignment with MN execution segments (Figure 8C, MN/AE, blue, Hold: ().  Whereas MN execution trajectories were relatively consistent within sessions, MN observation trajectories and AE execution trajectories were less so.”

      Because only 8 button trials were available in Session 1 from Monkey R, we excluded this session from the CCA analyses.  Sessions 2 and 3 from monkey R provide valid results, however.  For example, we now state explicitly (lines 468 to 472):

      “As a positive control, we first aligned MN execution trajectory segments from two different sessions in the same monkey (which we abbreviate as MN:1/2).  The 2 sessions in monkey R provided only 1 possible comparison, but the 3 sessions in monkeys T and F each provided 3 comparisons.  For each of these 7 comparisons, we found the bootstrapped average of CC1, of CC2, and of CC3.”

      (7) Related to the CCA analysis, what behavioural epoch has been used here, the same as the previous analyses, i.e. 100ms? how many datapoint is that in time? Given that CCA is essentially a correlation value, too few datapoints make it rather meaningless. If that's the case, I encourage using, let's say, one window combined of I and G until movement, and one window of movement and hold, such that they are both easier to interpret. Indeed low values of exec-exec in CC2 compared to Gallego et al, Nat Neurosci, 2020 might be a sign of a methodological error. 

      In the Methods described for CCA, we now have clarified that (lines 953 to 961):

      “To provide an estimate of variability, we used a bootstrapping approach to CCA.  From each of two data sets we randomly selected 20 trials involving each target object (totaling 80 trials) with replacement, clipped trajectory segments from each of those trials for 100 ms (100 points at 1 ms intervals) after the instruction onset, go cue, movement onset, or beginning of the final hold, and performed CCA as described above. (Note that because session 1 from monkey R included only 8 button trials (Table 1), we excluded this session from CCA analyses.)  With 500 iterations, we obtained a distribution of the correlation coefficients (CCs) between the two data sets in each of the three dimensions of the aligned subspace, which permitted statistical comparisons.”

      And in the Results we report that (lines 475 to 480):

      “The highest values for MN:1/2 correlations were obtained for the Movement trajectory segments .  These values indicate consistent relationships among the Movement neural trajectory segments representing the four different RGM movements from session to session, as would have been expected from previous studies (Gallego et al., 2018; Gallego et al., 2020; Safaie et al., 2023).”

      Reviewer #3 (Public Review): 

      Summary: 

      In their study, Zhao et al. investigated the population activity of mirror neurons (MNs) in the premotor cortex of monkeys either executing or observing a task consisting of reaching to, grasping, and manipulating various objects. The authors proposed an innovative method for analyzing the population activity of MNs during both execution and observation trials. This method enabled to isolate the condition-dependent variance in neural data and to study its temporal evolution over the course of single trials. The method proposed by the authors consists of building a time series of "instantaneous" subspaces with single time step resolution, rather than a single subspace spanning the entire task duration. As these subspaces are computed on an instant time basis, projecting neural activity from a given task time into them results in latent trajectories that capture condition-dependent variance while minimizing the condition-independent one. The authors then analyzed the time evolution of these instantaneous subspaces and revealed that a progressive shift is present in subspaces of both execution and observation trials, with slower shifts during the grasping and manipulating phases compared to the initial preparation phase. Finally, they compared the instantaneous subspaces between execution and observation trials and observed that neural population activity did not traverse the same subspaces in these two conditions. However, they showed that these distinct neural representations can be aligned with Canonical Correlation Analysis, indicating dynamic similarities of neural data when executing and observing the task. The authors speculated that such similarities might facilitate the nervous system's ability to recognize actions performed by oneself or another individual. 

      Strengths: 

      Unlike other areas of the brain, the analysis of neural population dynamics of premotor cortex MNs is not well established. Furthermore, analyzing population activity recorded during non-trivial motor actions, distinct from the commonly used reaching tasks, serves as a valuable contribution to computational neuroscience. This study holds particular significance as it bridges both domains, shedding light on the temporal evolution of the shift in neural states when executing and observing actions. The results are moderately robust, and the proposed analytical method could potentially be used in other neuroscience contexts. 

      Weaknesses: 

      While the overall clarity is satisfactory, the paper falls short in providing a clear description of the mathematical formulas for the different methods used in the study. 

      We have added the various mathematical formulas in the Methods.

      For Cumulative Separation (lines 864 to 871): 

      “To quantify the separation between the four trial-averaged trajectory segments involving the different objects in a given instantaneous subspace, we then calculated their cumulative separation (𝐶𝑆) as: 

      where d<sub>ij</sub>(t) is the 3-dimensional Euclidean distance between the i<sup>th</sup> and j<sup>th</sup> trajectories at time point 𝑡. We summed the 6 pairwise distances between the 4 trajectory segments across time points and normalized by the number of time points, 𝑇 = 100.  The larger the 𝐶𝑆, the greater the separation of the trajectory segments.”

      For principal angles (lines 877 to 884): 

      For example, given the 3-dimensional instantaneous subspace at the time of movement onset, W<sub>M</sub> and at any other time, W<sub>i</sub>, we calculated their 3x3 inner product matrix and performed singular value decomposition to obtain:

      where 3x3 matrices P<sub>M</sub> and W<sub>P</sub> define new manifold directions which successively minimize the 3 principal angles specific to the two subspaces being compared. The elements of diagonal matrix 𝐶 then are the ranked cosines of the principal angles, 𝜃𝑖 , ordered from smallest to largest: 

      For CCA (lines 945 to 952): 

      “CCA was performed as follows: The original latent dynamics, L<sub>A</sub> and L<sub>B</sub>, first were transformed and decomposed as and .  The first m = 3 column vectors of each 𝑄𝑖 provide an orthonormal basis for the column vectors of (where 𝑖 = 𝐴, 𝐵).  Singular value decomposition on the inner product matrix of  𝑄𝐴 and 𝑄𝐵 then gives , and new manifold directions that maximize pairwise correlations are provided by and .  We then projected the original latent dynamics into the new, common subspace: .  Pairwise correlation coefficients between the aligned latent dynamics sorted from largest to smallest then are given by the elements of the diagonal matrix .”

      Moreover, it was not immediately clear why the authors did not consider a (relatively) straightforward metric to quantity the progressive shift of the instantaneous subspaces, such as computing the angle between consecutive subspaces, rather than choosing a (in my opinion) more cumbersome metric based on classification of trajectory segments representing different movements. 

      Point taken.  We now have calculated the principal angles as a function of time and present them as a new section of the Results including new figure 4 (lines 237 to 293). 

      “Instantaneous subspaces shift progressively during both execution and observation 

      We identified an instantaneous subspace at each one millisecond time step of RGM trials.  At each time step, we applied PCA to the 4 instantaneous neural states (i.e. the 4 points on the neural trajectories representing trials involving the 4 different objects each averaged across 20 trials per object, totaling 80 trials), yielding a 3-dimensional subspace at that time (see Methods).  Note that because these 3-dimensional subspaces are essentially instantaneous, they capture the condition-dependent variation in neural states, but not the common, condition-independent variation.  To examine the temporal progression of these instantaneous subspaces, we then calculated the principal angles between each 80-trial instantaneous subspace and the instantaneous subspaces averaged across all trials at four behavioral time points that could be readily defined across trials, sessions, and monkeys: the onset of the instruction (I), the go cue (G), the movement onset (M), and the beginning of the final hold (H).  This process was repeated 10 times with replacement to assess the variability of the principal angles.  The closer the principal angles are to 0°, the closer the two subspaces are to being identical; the closer to 90°, the closer the two subspaces are to being orthogonal.  

      Figure 4A-D illustrate the temporal progression of the first principal angle of the mirror neuron population in the three sessions (red, green, and blue) from monkey R during execution trials. As illustrated in Figure 4 – figure supplement 1 (see also the related Methods), in each session all three principal angles, each of which could range from 0° to 90°, tended to follow a similar time course.  In the Results we therefore illustrate only the first (i.e. smallest) principal angle.  Solid traces represent the mean across 10-fold cross validation using the 80-trial subsets of all the available trials; shading indicates ±1 standard deviation.  As would be expected, the instantaneous subspace using 80 trials approaches the subspace using all trials at each of the four selected times—I, G, M, and H—indicated by the relatively narrow trough dipping toward 0°.  Of greater interest are the slower changes in the first principal angle in between these four time points.  Figure 4A shows that after instruction onset (I) the instantaneous subspace shifted quickly away from the subspace at time I, indicated by a rapid increase in principal angle to levels not much lower than what might be expected by chance alone (horizontal dashed line). In contrast, throughout the remainder of the instruction and delay epochs (from I to G), Figure 4B and C show that the 80-trial instantaneous subspace shifted gradually and concurrently, not sequentially, toward the all-trial subspaces that would be reached at the end of the delay period (G) and then at the onset of movement (M), indicated by the progressive decreases in principal angle. As shown by Figure 4D, shifting toward the H subspace did not begin until the movement onset (M). To summarize, these changes in principal angles indicate that after shifting briefly toward the subspace present at time the instruction appeared (I), the instantaneous subspace shifted progressively throughout the instruction and delay epochs toward the subspace that would be reached at the time of the go cue (G), then further toward that at the time of movement onset (M), and only thereafter shifted toward the instantaneous subspace that would be present at the time of the hold (H).

      Figure 4E-H show the progression of the first principal angle of the mirror neuron population during observation trials.  Overall, the temporal progression of the MN instantaneous subspace during observation was similar to that found during execution, particularly around times I and H.  The decrease in principal angle relative to the G and M instantaneous subspaces during the delay epoch was less pronounced during observation than during execution.  Nevertheless, these findings support the hypothesis that the condition-dependent subspace of PM MNs shifts progressively over the time course of RGM trials during both execution and observation, as illustrated schematically in Figure 1A.

      We also examined the temporal progression of the instantaneous subspace of AE neurons.  As would be expected given that AE neurons were not modulated significantly during observation trials, in the observation context AE populations had no gradual changes in principal angle (Figure 4 – figure supplement 3).  During execution, however, Figure 4I-L show that the AE populations had a pattern of gradual decrease in principal angle similar to that found in the MN population (Figure 4A-D).  After the instruction onset, the instantaneous subspace shifted quickly away from that present at time I and progressed gradually toward that present at times G and M, only shifting toward that present at time H after movement onset.  As for the PM MN populations, the condition-dependent subspace of the PM AE populations shifted progressively over the time course of execution RGM trials.”

      The related Methods are now described in subsection “Subspace Comparisons—Principal Angles”

      Specific comments: 

      In the methods, it is stated that instantaneous subspaces are found with 3 PCs. Why does it say 2 here?  

      We now have clarified. (lines 295 to 310):

      “The progressive changes in principal angles do not capture another important aspect of condition-dependent neural activity.  The neural trajectories during trials involving different objects separated increasingly as trials progressed in time.  To illustrate this increasing separation, we clipped 100 ms segments of high-dimensional MN population trial-averaged trajectories beginning at times I, G, M, and H, for trials involving each of the four objects.  We then projected the set of four object-specific trajectory segments clipped at each time into each of the four instantaneous 3D subspaces at times I, G, M, and H.  This process was repeated separately for execution trials and for observation trials.  

      For visualization, we projected these trial-averaged trajectory segments from an example session into the PC1 vs PC2 planes (which consistently captured > 70% of the variance) of the I, G, M, or H instantaneous 3D subspaces.  In Figure 5, the trajectory segments for each of the four objects (sphere – purple, button – cyan, coaxial cylinder – magenta, perpendicular cylinder – yellow) sampled at different times (rows) have been projected into each of the four instantaneous subspaces defined at different times (columns).  Rather than appearing knotted as in Figure 3, these short trajectory segments are distinct when projected into each instantaneous subspace.”

      And in the legend for Figure 5 we now clarify that:

      “Each set of these four segments then was projected into the PC1 vs PC2 plane of the instantaneous 3D subspace present at four different times (columns: I, G, M, H).”

      Another doubt on how instantaneous subspaces are computed: in the methods you state that you apply PCA on trial-averaged activity at each 50ms time step. From the next sentence, I gather that you apply PCA on an Nx4 data matrix (N being the number of neurons, and 4 being the trial-averaged activity of the four objects) every 50 ms. Is this right? It would help to explicitly specify the dimensions of the data matrix that goes into PCA computation. 

      We apologize for this confusion.  Although the LSTM decoding was performed in 50 ms time steps, the instantaneous subspaces were calculated at 1 ms intervals. In the Methods we now have clarified (lines 849 to 759):

      “Instantaneous subspace identification 

      Instantaneous neural subspaces were identified at 1 ms intervals.  At each 1 ms time step, the N-dimensional neural firing rates from trials involving the four different objects— sphere, button, coaxial cylinder, and perpendicular cylinder—were averaged separately, providing four points in the N-dimensional space representing the average neural activity for trials involving the different objects at that time step.  PCA then was performed on these four points.  Because three dimensions capture all the variance of four points, three principal component dimensions fully defined each instantaneous subspace.  Each instantaneous 3D subspace can be considered a filter described by a matrix, W, that can project high-dimensional neural activity into a low-dimensional subspace, with the time series of instantaneous subspaces, W_i, forming a time series of filters (Figure 1B).”

      It would help to include some equations in the methods section related to the LSTM decoding. Just to make sure I understood correctly: after having identified the instantaneous subspaces (every 50 ms), you projected the Instruction, Go, Movement, and Holding segments from individual trials (each containing 100 samples, since they are sampled from a 100ms window) onto each instantaneous subspace. So you have four trajectories for each subspace. In the methods, it is stated that a single LSTM classifier is trained for each subspace. Do you also have a separate classifier for each trajectory segment? What is used as input to the classifier? Each trajectory segment should be a 100x3 matrix once projected in an instantaneous subspace. Is that what (each of) the LSTMs take as input? And lastly, what is the LSTM trained to predict exactly? Just a label indicating the type of object that was manipulated in that trial? I apologize if I overlooked any detail, but I believe a clearer explanation of the LSTM, preferably with mathematical formulas, would greatly help readers understand this section. 

      LSTM decoding is not readily described with a set of equations.  However, we have expanded our description to provide the information requested (lines 910 to 937):

      “Decodable information—LSTM

      As illustrated schematically in Figure 1B, the same segment of high-dimensional neural activity projected into different instantaneous subspaces can generate low-dimensional trajectories of varying separation.  The degree of separation among the projected trajectory segments will depend, not only on their separation at the time when the segments were clipped, but also on the similarity of the subspaces into which the trajectory segments are projected.  To quantify the combined effects of trajectory separation and projection into different subspaces, we projected high-dimensional neural trajectory segments (each including 100 points at 1 ms intervals) from successful trials involving each of the four different target objects into time series of 3-dimensional instantaneous subspaces at 50 ms intervals. In each of these instantaneous subspaces, the neural trajectory segment from each trial thus became a 100 point x 3 dimensional matrix.  For each instantaneous subspace in the time series, we then trained a separate long short-term memory (LSTM, (Hochreiter and Schmidhuber, 1997)) classifier to attribute each of the neural trajectories from individual trials to one of the four target object labels: sphere, button, coaxial cylinder, or perpendicular cylinder. Using MATLAB’s Deep Learning Toolbox, each LSTM classifier had 3 inputs (instantaneous subspace dimensions), 20 hidden units in the bidirectional LSTM layer, and a softmax layer preceding the classification layer which had 4 output classes (target objects). The total number of successful trials available in each session for each object is given in Table 1.  To avoid bias based on the total number of successful trials, we used the minimum number of successful trials across the four objects in each session, selecting that number from the total available randomly with replacement. Each LSTM classifier was trained with MATLAB’s adaptive moment estimation (Adam) optimizer on 40% of the selected trials, and the remaining 60% were decoded by the trained classifier.  The success of this decoding was used as an estimate of classification accuracy from 0 (no correct classifications) to 1 (100% correct classifications). This process was repeated 10 times and the mean ± standard deviation across the 10 folds was reported as the classification accuracy at that time.  Classification accuracy of trials projected into each instantaneous subspace at 50 ms intervals was plotted as a function of trial time.”

      Recommendations for the authors:

      Reviewer #1 (Recommendations For The Authors): 

      Here are some more specific comments. 

      Abstract. Line 41. "same action" is not justified, there is plenty of evidence showing that the action does not need to be the same (or it has not even to be an action), rephrasing or substituting with "similar" is necessary, especially in the light of the subsequent sentence (which is totally correct). 

      Thank you for pointing this out.  As recommended, we have changed “same” to “similar” (lines 40 to 41):  

      “Many neurons in the premotor cortex show firing rate modulation whether the subject performs an action or observes another individual performing a similar action.”

      Introduction. A relevant, missing reference in the otherwise exhaustive introduction is Albertini et al. 2021 J Neurophysiol, showing that neural dynamics and similarities between biological and nonbiological movements in premotor areas are greater than those between the same executed and observed movements. 

      Thank you for pointing out this important finding.  After revision, we felt it was now cited most appropriately in the revised Discussion as follows (lines 730 to 736):

      “Alternatively, given that observation of another individual can be considered a form of social interaction, PM MN population activity during action observation, rather than representing movements made by another individual similar to one’s own movements, instead may represent different movements one might execute oneself in response to those made by another individual (Ninomiya et al., 2020; Bonini et al., 2022; Ferrucci et al., 2022; Pomper et al., 2023). This possibility is consistent with the finding that the neural dynamics of PM MN populations are more similar during observation of biological versus non-biological movements than during execution versus observation (Albertini et al., 2021)."

      In Line 85, the sentence about Papadourakis and Raos 2019 has to be generalized to PMv, as they show that the proportion of congruent MNs is at chance in both PMd and PMv. 

      Point taken.  We have rephrased this sentence as follows (lines 88 to 89): 

      “And in both PMv and PMd, the proportion of congruent neurons may not be different from that expected by chance alone (Papadourakis and Raos, 2019).”

      Lines 122-132. The initial sentence was unclear to me at first glance. I was wondering how subspaces could be "at other times over the course of the trial" if they are instantaneous. I could imagine that the subspaces referred to corresponding behavioral intervals of execution and observation conditions (and this may be what they will later call "condition dependent" activity), but nevertheless, they could hardly be understood as "instantaneous". I grasped the author's idea only when reading the results, with the statement "no-time dependent variance is captured". The idea is to take a static snapshot of the evolution of population activity at each checkpoint (i.e. I, G, M, and H): I suggest clarifying this point immediately in the introduction to improve readability. 

      We have clarified this point by adding two paragraphs to the Introduction first defining condition independent versus condition-dependent variance and then explaining the use of instantaneous subspaces (lines 125 to 153):

      “A relevant but often overlooked aspect of such dynamics in neuron populations active during both execution and observation has to do with the distinction between condition independent and condition-dependent variation in neuronal activity (Kaufman et al., 2016; Rouse and Schieber, 2018).  The variance in neural activity averaged across all the conditions in a given task context is condition-independent.  For example, in an 8-direction center-out reaching task, averaging a unit’s firing rate as a function of time across all 8 directions may show an initially low firing rate that increases prior to movement onset, peaks during the movement, and then declines during the final hold, irrespective of the movement direction.  Subtracting this condition-independent activity from the unit’s firing rate during each trial gives the remaining variance, and averaging separately across trials in each of the 8 directions then averages out noise variance, leaving the condition-dependent variance that represents the unit’s modulation among the 8 directions (conditions). Alternatively, condition-independent, condition dependent, and noise variance can be partitioned through demixed principal component analysis (Kobak et al., 2016; Gallego et al., 2018).  The extent to which neural dynamics occur in a subspace shared by execution and observation versus subspaces unique to execution or observation may differ for the condition-independent versus condition-dependent partitions of neural activity.  Here, we tested the hypothesis that the condition-dependent activity of PM mirror neuron populations progresses through distinct subspaces during execution versus observation, which would indicate distinct patterns of co-modulation amongst mirror neurons during execution versus observation.

      Because of the complexity of condition-dependent neural trajectories for movements involving the hand, we developed a novel approach.  Rather than examining trajectories over the entire time course of behavioral trials, we identified time series of instantaneous PM mirror neuron subspaces covering the time course of behavioral trials. We identified separate time series for execution trials and for observation trials, both involving four different reach-graspmanipulation (RGM) movements.  Given that each subspace in these time series is instantaneous (a snapshot in time), it captures condition-dependent variance in the neural activity among the four RGM movements while minimizing condition-independent (time dependent) variance.”

      Results. 

      Regarding the execution-observation alignment, as explained in my initial comment, it does not sound convincing. Applying a CCA to align EXE and OBS activities (which the authors had just shown being essentially not aligned), even separately for each epoch segment (line 396), seems to be a trick to show that they nonetheless share some similarities. Couldn't this be applied to any pairs of differently encoded conditions to create some sort of artificial link between them? Is the similarity in the neural data or rather in the method used to realign them? 

      CCA would not align arbitrary sets of neural data.  The similarity is in the data, not in the method.  For example, in an 8-direction center-out task, the neural representation of movement to the 45° target is between the neural representations of the 0° and the 90° targets.  If the same is true in a second data set, then CCA will give high correlation coefficients.  But if in the second data set the neural representation of the 45° target is between the 135° and 180° targets, CCA will give low correlation coefficients. 

      In the end, what does this tell us about the brain? 

      In the Introduction we now clarify that (lines 166 to 170):

      “Such alignment would indicate that the relationships among the trajectory segments in the execution subspace are similar to the relationships among the trajectory segments in the observation subspace, indicating a corresponding structure in the latent dynamic representations of execution and observation movements by the same PM MN population.”

      And in the Results (lines 449 to 455):

      “For example, the trajectories of PMd+M1 neuron populations recorded from two different monkeys during center-out reaching movements could be aligned well (Safaie et al., 2023).  CCA showed, for example, that in both brains the neural trajectory for the movement to the target at 0° was closer to the trajectory for movement to the target at 45° than to the trajectory for the movement to the target at 180°. Relationships among these latent dynamic representations of the eight movements thus were similar even though the neural populations were recorded from two different monkeys.”

      In relation to Figure 8 (lines 461 to 467)

      “But when both sets of trajectory segments are projected into another common subspace identified with CCA, as shown in Figure 8B, a similar relationship among the neural representations of the four movements during execution and observation is revealed.  In both behavioral contexts the neural representation of movements involving the sphere (purple) is now closest to the representation of movements involving the coaxial cylinder (magenta) and farthest from that of movements involving the button (cyan). The two sets of trajectory segments are more or less “aligned.”

      And in the Discussion (lines 665 to 674):

      “Corresponding neural representations of action execution and observation during task epochs with higher neural firing rates have been described previously in PMd MNs and in PMv MNs using representational similarity analysis RSA (Papadourakis and Raos, 2019).  And during force production in eight different directions, neural trajectories of PMd neurons draw similar “clocks” during execution, cooperative execution, and passive observation (Pezzulo et al., 2022).  Likewise in the present study, despite execution and observation trajectories progressing through largely distinct subspaces, in all three monkeys execution and observation trajectory segments showed some degree of alignment, particularly the Movement and Hold segments (Figure 12A), indicating similar relationships among the latent dynamic representations of the four RGM movements during execution and observation.”

      Concerning the discussion, I would like to reconsider it after having seen the authors' response to the comments above and to my general concern about the relevance of the findings from the neurophysiological point of view. 

      Certainly, please do.

      Reviewer #2 (Recommendations For The Authors): 

      Here are a few issues that I want to bring to the authors' attention (in no particular order): 

      • I am not clear on what is meant by "condition-dependent". Is the condition exec vs obs, or the object types? 

      In the Introduction, we now clarify (lines 125 to 144): 

      “A relevant but often overlooked aspect of such dynamics in neuron populations active during both execution and observation has to do with the distinction between condition independent and condition-dependent variation in neuronal activity (Kaufman et al., 2016; Rouse and Schieber, 2018).  The variance in neural activity averaged across all the conditions in a given task context is condition-independent.  For example, in an 8-direction center-out reaching task, averaging a unit’s firing rate as a function of time across all 8 directions may show an initially low firing rate that increases prior to movement onset, peaks during the movement, and then declines during the final hold, irrespective of the movement direction.  Subtracting this condition-independent activity from the unit’s firing rate during each trial gives the remaining variance, and averaging separately across trials in each of the 8 directions then averages out noise variance, leaving the condition-dependent variance that represents the unit’s modulation among the 8 directions (conditions). Alternatively, condition-independent, condition dependent, and noise variance can be partitioned through demixed principal component analysis (Kobak et al., 2016; Gallego et al., 2018).  The extent to which neural dynamics occur in a subspace shared by execution and observation versus subspaces unique to execution or observation may differ for the condition-independent versus condition-dependent partitions of neural activity.  Here, we tested the hypothesis that the condition-dependent activity of PM mirror neuron populations progresses through distinct subspaces during execution versus observation, which would indicate distinct patterns of co-modulation amongst mirror neurons during execution versus observation.”

      And in the Results, we have added a new Figure 3 to illustrate condition-independent versus conditiondependent activity using an example from the present data sets (lines 208 to 236): 

      “Condition-dependent versus condition-independent neural activity in PM MNs

      Whereas a large fraction of condition-dependent neural variance during reaching movements without grasping can be captured in a two-dimensional subspace (Churchland et al., 2012; Ames et al., 2014), condition-dependent activity in movements that involve grasping is more complex (Suresh et al., 2020). In part, this may reflect the greater complexity of controlling the 24 degrees of freedom in the hand and wrist as compared to the 4 degrees of freedom in the elbow and shoulder (Sobinov and Bensmaia, 2021).  Figure 3 illustrates this complexity in a PM MN population during the present RGM movements.  Here, PCA was performed on the activity of a PM MN population across the entire time course of execution trials involving all four objects.  The colored traces in Figure 3A show neural trajectories averaged separately across trials involving each of the four objects and then projected into the PC1 vs PC2 plane of the total neural space.  Most of the variance in these four trajectories is comprised of a shared rotational component.  The black trajectory, obtained by averaging trajectories from trials involving all four objects together, represents this condition-independent (i.e. independent of the object involved) activity.  The condition-dependent (i.e. dependent on which object was involved) variation in activity is reflected by the variation in the colored trajectories around the black trajectory.  The condition-dependent portions can be isolated by subtracting the black trajectory from each of the colored trajectories. The resulting four condition dependent trajectories have been projected into the PC1 vs PC2 plane of their own common subspace in Figure 3B.  Rather than exhibiting a simple rotational motif, these trajectories appear knotted. To better understand how these complex, condition-dependent trajectories progress over the time course of RGM trials, we chose to examine time series of instantaneous subspaces.”

      While there is an emphasis on the higher complexity of manipulating objects compared to just reaching movements in the Abstract, the majority of the analysis relates to the instruction, movement initiation, and grasp, and there is no specific analyses looking at manipulation and how those presumably more complex dynamics compare to the reaching dynamics, and how they differ from reaching in the mirror neurons. 

      We have clarified that (lines 178 to 187):

      “Because we chose to study relatively naturalistic movements, the reach, grasp, and manipulation components were not performed separately, but rather in a continuous fluid motion during the movement epoch of the task sequence (Figure 2B).  In previous studies involving a version of this task without separate instruction and delay epochs, we have shown that joint kinematics, EMG activity, and neuron activity in the primary motor cortex, all vary throughout the movement epoch in relation to both reach location and object grasped, with location predominating early in the movement epoch and object predominating later (Rouse and Schieber, 2015, 2016a, b).  The present task, however, did not dissociate the reach, the hand shape used to grasp the object, and the manipulation performed on the object.”

      • The analysis in Fig3C,D is interesting, however, in my opinion, requires control. For instance, what would these values look like if you projected the segments to a subspace defined by the activity during the entire length of the trial, or if you projected the activity during intertrials, just to get a sense of how meaningful these values are? 

      This material is now presented in Figure 5 – figure supplement 1.  In the legend to this figure supplement, we have clarified that (lines 327 to 328):

      “CS values, which we use only to characterize the phenomenon of trajectory separation,….”

      • MN is used (#85) before definition (#91). Similar for RGM, I believe. 

      Thanks for catching this problem.  We have now defined these abbreviations at first use as follows:

      In lines 89 to 92:

      “Though many authors apply the term mirror neurons strictly to highly congruent neurons, here we will refer to all neurons modulated during both contexts—execution and observation—as mirror neurons (MNs).”

      And in lines 148 to 150:

      We identified separate time series for execution trials and for observation trials, both involving four different reach-grasp-manipulation (RGM) movements.”

      • I believe in the Intro when presenting the three hypotheses, there is a First, and a Third, but no Second. 

      We have revised this part of the Introduction without numbering our hypotheses as follows (lines 145 to 173):

      “Because of the complexity of condition-dependent neural trajectories for movements involving the hand, we developed a novel approach.  Rather than examining trajectories over the entire time course of behavioral trials, we identified time series of instantaneous PM mirror neuron subspaces covering the time course of behavioral trials. We identified separate time series for execution trials and for observation trials, both involving four different reach-graspmanipulation (RGM) movements.  Given that each subspace in these time series is instantaneous (a snapshot in time), it captures condition-dependent variance in the neural activity among the four RGM movements while minimizing condition-independent (time dependent) variance.

      We then tested the hypothesis that the condition-dependent subspace shifts progressively over the time course of behavioral trials (Figure 1A) by calculating the principal angles between four selected instantaneous subspaces that occurred at times easily defined in each behavioral trial—instruction onset (I), go cue (G), movement onset (M), and the beginning of the final hold (H)—and every other instantaneous subspace in the time series.  Initial analyses showed that condition-dependent neural trajectories for the four RGM movements tended to separate increasingly over the course of behavioral trials.  We therefore additionally examined the combined effects of i) the progressively shifting subspaces and ii) the increasing trajectory separation, by decoding neural trajectory segments sampled for 100 msec after times I, G, M, and H and projected into the time series of instantaneous subspaces (Figure 1B).

      Finally, we used canonical correlation to ask whether the prevalent patterns of mirror neuron co-modulation showed similar relationships among the four RGM movements during execution and observation (Figure 1C).  Such alignment would indicate that the relationships among the trajectory segments in the execution subspace are similar to the relationships among the trajectory segments in the observation subspace, indicating a corresponding structure in the latent dynamic representations of execution and observation movements by the same PM MN population.  And finally, because we previously have found that during action execution the activity of PM mirror neurons tends to lead that of non-mirror neurons which are active only during action execution (AE neurons) (Mazurek and Schieber, 2019), we performed parallel analyses of the instantaneous state space of PM AE neurons.”

      • The use of the term 'instantaneous subspaces' in the abstract confused me initially, as I wasn't sure what it meant. It might be a good idea to define or rephrase it. 

      In the Abstract we now state (lines 51 to 52):

      “Rather than following neural trajectories in subspaces that contain their entire time course, we identified time series of instantaneous subspaces …”

      And in the Introduction, we have clarified (lines 145 to 153):

      “Because of the complexity of condition-dependent neural trajectories for movements involving the hand, we developed a novel approach.  Rather than examining trajectories over the entire time course of behavioral trials, we identified time series of instantaneous PM mirror neuron subspaces covering the time course of behavioral trials. We identified separate time series for execution trials and for observation trials, both involving four different reach-graspmanipulation (RGM) movements.  Given that each subspace in these time series is instantaneous (a snapshot in time), it captures condition-dependent variance in the neural activity among the four RGM movements while minimizing condition-independent (time dependent) variance.”

      And in the Methods (lines 849 to 859):

      “Instantaneous subspace identification 

      Instantaneous neural subspaces were identified at 1 ms intervals.  At each 1 ms time step, the N-dimensional neural firing rates from trials involving the four different objects— sphere, button, coaxial cylinder, and perpendicular cylinder—were averaged separately, providing four points in the N-dimensional space representing the average neural activity for trials involving the different objects at that time step.  PCA then was performed on these four points.  Because three dimensions capture all the variance of four points, three principal component dimensions fully defined each instantaneous subspace.  Each instantaneous 3D subspace can be considered a filter described by a matrix, 𝑊, that can project high-dimensional neural activity into a low-dimensional subspace, with the time series of instantaneous subspaces, 𝑊𝑖, forming a time series of filters (Figure 1B).”

      Reviewer #3 (Recommendations For The Authors): 

      (1) Page 4, lines 127-131. In the introduction, it was not immediately clear to me what you meant by 'separation' and 'decoding' of the projected neural activity. You do mention that you are separating/decoding trajectory segments representing different movements at the end of this paragraph, but at this point of the paper it was not very clear to me what those different movements were (I only understood that after reading the results section). I suggest briefly expanding on these concepts here. 

      To clarify these points in the Introduction, we have expanded exposition of these concepts (lines 145 to 163):

      “Because of the complexity of condition-dependent neural trajectories for movements involving the hand, we developed a novel approach.  Rather than examining trajectories over the entire time course of behavioral trials, we identified time series of instantaneous PM mirror neuron subspaces covering the time course of behavioral trials. We identified separate time series for execution trials and for observation trials, both involving four different reach-graspmanipulation (RGM) movements.  Given that each subspace in these time series is instantaneous (a snapshot in time), it captures condition-dependent variance in the neural activity among the four RGM movements while minimizing condition-independent (time dependent) variance.

      We then tested the hypothesis that the condition-dependent subspace shifts progressively over the time course of behavioral trials (Figure 1A) by calculating the principal angles between four selected instantaneous subspaces that occurred at times easily defined in each behavioral trial—instruction onset (I), go cue (G), movement onset (M), and the beginning of the final hold (H)—and every other instantaneous subspace in the time series.  Initial analyses showed that condition-dependent neural trajectories for the four RGM movements tended to separate increasingly over the course of behavioral trials.  We therefore additionally examined the combined effects of i) the progressively shifting subspaces and ii) the increasing trajectory separation, by decoding neural trajectory segments sampled for 100 msec after times I, G, M, and H and projected into the time series of instantaneous subspaces (Figure 1B).”

      (2) Page 6, line 175. In the methods, it is stated that instantaneous subspaces are found with 3 PCs. Why does it say 2 here? 

      Thank you for noticing this discrepancy.  In the Methods, we have clarified that the instantaneous subspaces are 3-dimensional (see our reply to the next comment), but in Figure 5 (previously Figure 3), for purposes of visualization, we are projecting trajectory segments into the PC1-PC2 plane (lines 295 to 308):

      “The progressive changes in principal angles do not capture another important aspect of condition-dependent neural activity.  The neural trajectories during trials involving different objects separated increasingly as trials progressed in time.  To illustrate this increasing separation, we clipped 100 ms segments of high-dimensional MN population trial-averaged trajectories beginning at times I, G, M, and H, for trials involving each of the four objects.  We then projected the set of four object-specific trajectory segments clipped at each time into each of the four instantaneous 3D subspaces at times I, G, M, and H.  This process was repeated separately for execution trials and for observation trials.  

      For visualization, we projected these trial-averaged trajectory segments from an example session into the PC1 vs PC2 planes (which consistently captured > 70% of the variance) of the I, G, M, or H instantaneous 3D subspaces.  In Figure 5, the trajectory segments for each of the four objects (sphere – purple, button – cyan, coaxial cylinder – magenta, perpendicular cylinder – yellow) sampled at different times (rows) have been projected into each of the four instantaneous subspaces defined at different times (columns).”

      And in the legend for Figure 5 we now clarify that:

      “Each set of these four segments then was projected into the PC1 vs PC2 plane of the instantaneous 3D subspace present at four different times (columns: I, G, M, H).”

      Another doubt on how instantaneous subspaces are computed: in the methods you state that you apply PCA on trial-averaged activity at each 50ms time step. From the next sentence, I gather that you apply PCA on an Nx4 data matrix (N being the number of neurons, and 4 being the trial-averaged activity of the four objects) every 50 ms. Is this right? It would help to explicitly specify the dimensions of the data matrix that goes into PCA computation. 

      Thank you for catching an error: The instantaneous subspaces were computed at 1 ms intervals. (It is the LSTM decoding that was done in 50 ms time steps).  We have clarified how the instantaneous subspaces were computed in the Methods (lines 849 to 859):

      “Instantaneous subspace identification 

      Instantaneous neural subspaces were identified at 1 ms intervals.  At each 1 ms time step, the N-dimensional neural firing rates from trials involving the four different objects— sphere, button, coaxial cylinder, and perpendicular cylinder—were averaged separately, providing four points in the N-dimensional space representing the average neural activity for trials involving the different objects at that time step.  PCA then was performed on these four points.  Because three dimensions capture all the variance of four points, three principal component dimensions fully defined each instantaneous subspace.  Each instantaneous 3D subspace can be considered a filter described by a matrix, 𝑊, that can project high-dimensional neural activity into a low-dimensional subspace, with the time series of instantaneous subspaces, 𝑊𝑖, forming a time series of filters (Figure 1B).”

      (3) Page 7, line 210-212. I am not sure if I missed it in the discussion, but have you speculated on why the greatest separation in observation trials was observed during the holding phase while in execution trials during the movement phase? 

      This was a consistent finding, and we therefore point it out as a difference between execution and observation.  Of course, this reflects greater condition-dependent variance in the PM MN population in the movement epoch than in the hold epoch during execution, whereas the reverse is true during observation.  We have no clear speculation as to why this occurs, however.

      (4) Figure 3. Add a legend with color scheme for each object in panels A and B. Also, please specify what metric is represented by the colorbar of panels C, D, E, F (write it down next to the colorbar itself and not just in the caption). 

      This is now Figure 5.  We have added a color legend for A and B.  Panels C, D, E, and F, now have been moved to Figure 5 – figure supplement 1, where we have indicated that the colorbar represents cumulative separation.

      (5) Page 9, line 228. I found the description of this decoding analysis a bit confusing initially (and perhaps still do), this should be clarified. 

      We have clarified our decoding analysis in the Methods (lines 910 to 937):

      “Decodable information—LSTM

      As illustrated schematically in Figure 1B, the same segment of high-dimensional neural activity projected into different instantaneous subspaces can generate low-dimensional trajectories of varying separation.  The degree of separation among the projected trajectory segments will depend, not only on their separation at the time when the segments were clipped, but also on the similarity of the subspaces into which the trajectory segments are projected.  To quantify the combined effects of trajectory separation and projection into different subspaces, we projected high-dimensional neural trajectory segments (each including 100 points at 1 ms intervals) from successful trials involving each of the four different target objects into time series of 3-dimensional instantaneous subspaces at 50 ms intervals. In each of these instantaneous subspaces, the neural trajectory segment from each trial thus became a 100 point x 3 dimensional matrix.  For each instantaneous subspace in the time series, we then trained a separate long short-term memory (LSTM, (Hochreiter and Schmidhuber, 1997)) classifier to attribute each of the neural trajectories from individual trials to one of the four target object labels: sphere, button, coaxial cylinder, or perpendicular cylinder. Using MATLAB’s Deep Learning Toolbox, each LSTM classifier had 3 inputs (instantaneous subspace dimensions), 20 hidden units in the bidirectional LSTM layer, and a softmax layer preceding the classification layer which had 4 output classes (target objects). The total number of successful trials available in each session for each object is given in Table 1.  To avoid bias based on the total number of successful trials, we used the minimum number of successful trials across the four objects in each session, selecting that number from the total available randomly with replacement. Each LSTM classifier was trained with MATLAB’s adaptive moment estimation (Adam) optimizer on 40% of the selected trials, and the remaining 60% were decoded by the trained classifier.  The success of this decoding was used as an estimate of classification accuracy from 0 (no correct classifications) to 1 (100% correct classifications). This process was repeated 10 times and the mean ± standard deviation across the 10 folds was reported as the classification accuracy at that time.  Classification accuracy of trials projected into each instantaneous subspace at 50 ms intervals was plotted as a function of trial time.”

      (6) Page 9, line 268. This might be trivial, but can you speculate on why the accuracy for Instruction segments had a lower peak compared to the rest of the segments? Is it because there is less 'distinct' information embedded in neural data about the type of object manipulated until you are actually reaching toward it or holding it? The latter seems straightforward, but the former not so much. 

      Thank you for asking this question.  We have added the following speculations (lines 592 to 604): 

      “Short bursts of “signal” related discharge are known to occur in a substantial fraction of PMd neurons beginning at latencies of ~60 ms following an instructional stimulus (Weinrich et al., 1984; Cisek and Kalaska, 2004).  Here we found that the instantaneous subspace shifted briefly toward the subspace present at the time of instruction onset (I), similarly during execution and observation.  This brief trough in principal angle (Figure 4A) and the corresponding peak in classification accuracy (Figure 7A) in part may reflect smoothing of firing rates with a 50 ms Gaussian kernel.  We speculate, however, that the early rise of this peak at the time of instruction onset also reflects the anticipatory activity often seen in PMd neurons in expectation of an instruction, which may not be entirely non-specific, but rather may position the neural population to receive one of a limited set of potential instructions (Mauritz and Wise, 1986). We attribute the relatively low amplitude of peak classification accuracy for Instruction trajectory segments to the likely possibility that only the last 40 ms of our 100 ms Instruction segments captured signal related discharge.”

      (7) Figure 8. Shouldn't the plots in panel A resemble those in Figure 3? Here you are projecting the hold trajectory segments into the subspace at time H, which should be the same as in Fig. 3A/B bottom right panel. 

      The previous Figure 8 is now Figure 8 panels A and B, and the previous Figure 3 is now Figure 5.  The data used in these two figures come from two different recording sessions in two different monkeys. The current Figure 8A,B uses data from monkey F, session 2; whereas Figure 5 uses data from monkey T, session 3, which we now state in the legend to each figure, respectively.  Consequently, the relative arrangement of the trajectory segments in the instantaneous subspace at time H differs.  The session used in Figure 8A,B, which we now show in three dimensions, better illustrates how CCA identifies a common subspace in which execution versus observations segments show alignment (Figure 8B) that was not evident in their original subspaces (Figure 8A).

      (8) Page 14, line 369. Are you computing CCA using only 2 components? I thought the subspaces were 3 dimensional. Why not align all three dimensions? 

      We have expanded this analysis to use all three dimensions, as illustrated in Figure 8 above.

      (9) Page 14, line 407. Does this mean that instantaneous subspaces between execution and observation trials are more similar to each other during the Movement and Holding phase? Is this related to the fact that in those moments there is a smaller progressive shift of the subspaces within execution and observation trials? 

      Our new analyses of principal angles (see our reply to your comment 11, below) show that the progressive shifting of the instantaneous subspace continues through the movement and hold epochs.  We now discuss this better alignment of the Movement and Hold trajectory segments as follows (lines 656 to 664):

      “Given the complexity of condition-dependent neural trajectories across the entire time course of RGM trials (Figure 3B), rather than attempting to align entire neural trajectories, we applied canonical correlation to trajectory segments clipped for 100 ms following four well defined behavioral events: Instruction onset, Go cue, Movement onset, and the beginning of the final Hold.  In all cases, alignment was poorest for Instruction segments, somewhat higher for Go segments, and strongest for Movement and Hold segments.  This progressive increase in alignment likely reflects a progressive increase in the difference between average neuron firing rates for trials involving different objects (Figure 6) relative to the trial-by-trial variance in firing rate for a given object.”

      (10) page 15, line 431. Typo, it should be Table 3. 

      We have removed Table 3 which no longer applies.

      (11) A more general observation: did you try to compute another metric to assess the progressive shift of subspaces over time? I am thinking of something like computing the principal angles between consecutive subspaces. If it is true that the shifts happen over time, but it slows down during movement and hold, you should be able to conclude it from principal angles as well. Am I missing something? Is there any reason you went with classification accuracy instead of a metric like this?  

      Point taken.  We now have calculated the principal angles as a function of time and have presented them as a new section of the Results including new Figure 4 and Figure 4 – figure supplement 3 (lines 237 to 293). 

      “Instantaneous subspaces shift progressively during both execution and observation 

      We identified an instantaneous subspace at each one millisecond time step of RGM trials.  At each time step, we applied PCA to the 4 instantaneous neural states (i.e. the 4 points on the neural trajectories representing trials involving the 4 different objects each averaged across 20 trials per object, totaling 80 trials), yielding a 3-dimensional subspace at that time (see Methods).  Note that because these 3-dimensional subspaces are essentially instantaneous, they capture the condition-dependent variation in neural states, but not the common, condition-independent variation.  To examine the temporal progression of these instantaneous subspaces, we then calculated the principal angles between each 80-trial instantaneous subspace and the instantaneous subspaces averaged across all trials at four behavioral time points that could be readily defined across trials, sessions, and monkeys: the onset of the instruction (I), the go cue (G), the movement onset (M), and the beginning of the final hold (H).  This process was repeated 10 times with replacement to assess the variability of the principal angles.  The closer the principal angles are to 0°, the closer the two subspaces are to being identical; the closer to 90°, the closer the two subspaces are to being orthogonal.  

      Figure 4A-D illustrate the temporal progression of the first principal angle of the mirror neuron population in the three sessions (red, green, and blue) from monkey R during execution trials. As illustrated in Figure 4 – figure supplement 1 (see also the related Methods), in each session all three principal angles, each of which could range from 0° to 90°, tended to follow a similar time course.  In the Results we therefore illustrate only the first (i.e. smallest) principal angle.  Solid traces represent the mean across 10-fold cross validation using the 80-trial subsets of all the available trials; shading indicates ±1 standard deviation.  As would be expected, the instantaneous subspace using 80 trials approaches the subspace using all trials at each of the four selected times—I, G, M, and H—indicated by the relatively narrow trough dipping toward 0°.  Of greater interest are the slower changes in the first principal angle in between these four time points.  Figure 4A shows that after instruction onset (I) the instantaneous subspace shifted quickly away from the subspace at time I, indicated by a rapid increase in principal angle to levels not much lower than what might be expected by chance alone (horizontal dashed line). In contrast, throughout the remainder of the instruction and delay epochs (from I to G), Figure 4B and C show that the 80-trial instantaneous subspace shifted gradually and concurrently, not sequentially, toward the all-trial subspaces that would be reached at the end of the delay period (G) and then at the onset of movement (M), indicated by the progressive decreases in principal angle. As shown by Figure 4D, shifting toward the H subspace did not begin until the movement onset (M). To summarize, these changes in principal angles indicate that after shifting briefly toward the subspace present at time the instruction appeared (I), the instantaneous subspace shifted progressively throughout the instruction and delay epochs toward the subspace that would be reached at the time of the go cue (G), then further toward that at the time of movement onset (M), and only thereafter shifted toward the instantaneous subspace that would be present at the time of the hold (H).

      Figure 4E-H show the progression of the first principal angle of the mirror neuron population during observation trials.  Overall, the temporal progression of the MN instantaneous subspace during observation was similar to that found during execution, particularly around times I and H.  The decrease in principal angle relative to the G and M instantaneous subspaces during the delay epoch was less pronounced during observation than during execution.  Nevertheless, these findings support the hypothesis that the condition-dependent subspace of PM MNs shifts progressively over the time course of RGM trials during both execution and observation, as illustrated schematically in Figure 1A.

      We also examined the temporal progression of the instantaneous subspace of AE neurons.  As would be expected given that AE neurons were not modulated significantly during observation trials, in the observation context AE populations had no gradual changes in principal angle (Figure 4 – figure supplement 3).  During execution, however, Figure 4I-L show that the AE populations had a pattern of gradual decrease in principal angle similar to that found in the MN population (Figure 4A-D).  After the instruction onset, the instantaneous subspace shifted quickly away from that present at time I and progressed gradually toward that present at times G and M, only shifting toward that present at time H after movement onset.  As for the PM MN populations, the condition-dependent subspace of the PM AE populations shifted progressively over the time course of execution RGM trials.”

      The related Methods are now described is subsection “Subspace Comparisons—Principal Angles”

      Is there any reason you went with classification accuracy instead of a metric like this? 

      We now point out that (lines 295 to 297):

      “The progressive changes in principal angles do not capture another important aspect of condition-dependent neural activity.  The neural trajectories during trials involving different objects separated increasingly as trials progressed in time.”

      And we further clarify this as follows (lines 331 to 348):

      “Decodable information changes progressively during both execution and observation 

      As RGM trials proceeded in time, the condition-dependent neural activity of the PM MN population thus changed in two ways.  First, the instantaneous condition-dependent subspace shifted, indicating that the patterns of firing-rate co-modulation among neurons representing the four different RGM movements changed progressively, both during execution and during observation.  Second, as firing rates generally increased, the neural trajectories representing the four RGM movements became progressively more separated, more so during execution than during observation. 

      To evaluate the combined effects of these two progressive changes, we clipped 100 ms single-trial trajectory segments beginning at times I, G, M, or H, and projected these trajectory segments from individual trials into the instantaneous 3D subspaces at 50 ms time steps.  At each of these time steps, we trained a separate LSTM decoder to classify individual trials according to which of the four objects was involved in that trial.  We expected that the trajectory segments would be classified most accurately when projected into instantaneous subspaces near the time at which the trajectory segments were clipped.  At other times we reasoned that classification accuracy would depend both on the similarity of the current instantaneous subspace to that found at the clip time as evaluated by the principal angle (Figure 4), and on the separation of the four trajectories at the clip time (Figure 5).”

    1. Author response:

      We would like to express our gratitude to all three reviewers for their time and valuable feedback on the manuscript. Below, we provide our point-by-point responses to their comments. Additionally, we summarize here the experiments we plan to conduct in accordance with the reviewers' suggestions:

      Revision plan 1. To include live imaging of Dl/Notch trafficking in normal and GlcT mutant ISCs.

      We agree that the effect of GlcT mutation on Dl trafficking was not convincingly demonstrated in our previous work. Although we attempted live imaging of the intestine using GFP tagged at the C-terminal of Dl, the fluorescent signal was regrettably too weak for reliable capture. In this revision, we will optimize the imaging conditions to determine if this issue can be resolved. Alternatively, we will transiently express GFP/RFP-tagged Dl in both normal and mutant ISCs to investigate the trafficking dynamics through live imaging.

      Revision plan 2. To update and improve the presentation of the data regarding the features of early/late/recycling endosomes in GlcT mutant ISCs.

      Our analysis of Rab5 and Rab7 endosomes in both normal and GlcT mutant ISCs revealed that Dl tends to accumulate in Rab5 endosomes in GlcT mutant ISCs. To strengthen our findings, we will include additional quantitative data and conduct further analysis on recycling endosomes labeled with Rab11-GFP. We acknowledge that this portion of the data is not entirely convincing, and in accordance with the reviewers' suggestions, we will revise our conclusions to present a more tempered interpretation.

      Revision plan 3. To include western blot analysis of Dl in normal and GlcT mutant ISCs.

      While we propose that MacCer may function as a component of lipid rafts, facilitating the anchorage of Dl on the membrane and its proper endocytosis, it is also possible that it acts as a substrate for the modification of Dl, which is essential for its functionality. To investigate this further, we will conduct Western blot analysis to determine whether the depletion of GlcT alters the protein size of Dl.

      Please find our detailed point-by-point responses below.

      Public Reviews:

      Reviewer #1 (Public review):

      Summary:

      From a forward genetic mosaic mutant screen using EMS, the authors identify mutations in glucosylceramide synthase (GlcT), a rate-limiting enzyme for glycosphingolipid (GSL) production, that result in EE tumors. Multiple genetic experiments strongly support the model that the mutant phenotype caused by GlcT loss is due to by failure of conversion of ceramide into glucosylceramide. Further genetic evidence suggests that Notch signaling is comprised in the ISC lineage and may affect the endocytosis of Delta. Loss of GlcT does not affect wing development or oogenesis, suggesting tissue-specific roles for GlcT. Finally, an increase in goblet cells in UGCG knockout mice, not previously reported, suggests a conserved role for GlcT in Notch signaling in intestinal cell lineage specification.

      Strengths:

      Overall, this is a well-written paper with multiple well-designed and executed genetic experiments that support a role for GlcT in Notch signaling in the fly and mammalian intestine. I do, however, have a few comments below.

      Weaknesses:

      (1) The authors bring up the intriguing idea that GlcT could be a way to link diet to cell fate choice. Unfortunately, there are no experiments to test this hypothesis.

      We indeed attempted to establish an assay to investigate the impact of various diets (such as high-fat, high-sugar, or high-protein diets) on the fate choice of ISCs. Subsequently, we intended to examine the potential involvement of GlcT in this process. However, we observed that the number or percentage of EEs varies significantly among individuals, even among flies with identical phenotypes subjected to the same nutritional regimen. We suspect that the proliferative status of ISCs and the turnover rate of EEs may significantly influence the number of EEs present in the intestinal epithelium, complicating the interpretation of our results. Consequently, we are unable to conduct this experiment at this time. The hypothesis suggesting that GlcT may link diet to cell fate choice remains an avenue for future experimental exploration.

      (2) Why do the authors think that UCCG knockout results in goblet cell excess and not in the other secretory cell types?

      This is indeed an interesting point. In the mouse intestine, it is well-documented that the knockout of Notch receptors or Delta-like ligands results in a classic phenotype characterized by goblet cell hyperplasia, with little impact on the other secretory cell types. This finding aligns very well with our experimental results, as we noted that the numbers of Paneth cells and enteroendocrine cells appear to be largely normal in UGCG knockout mice. By contrast, increases in other secretory cell types are typically observed under conditions of pharmacological inhibition of the Notch pathway.

      (3) The authors should cite other EMS mutagenesis screens done in the fly intestine.

      To our knowledge, the EMS screen on 2L chromosome conducted in Allison Bardin’s lab is the only one prior to this work, which leads to two publications (Perdigoto et al., 2011; Gervais, et al., 2019). We will include citations for both papers in the revised manuscript.

      (4) The absence of a phenotype using NRE-Gal4 is not convincing. This is because the delay in its expression could be after the requirement for the affected gene in the process being studied. In other words, sufficient knockdown of GlcT by RNA would not be achieved until after the relevant signaling between the EB and the ISC occurred. Dl-Gal4 is problematic as an ISC driver because Dl is expressed in the EEP.

      We agree that the lack of an observable phenotype using NRE-Gal4 might be attributed to a delay in its expression, which could result in missing the critical window necessary for effective GlcT knockdown. Consequently, we cannot rule out the possibility that GlcT may also play a role in early EBs or EEPs. We will revise our manuscript to present a more cautious conclusion on this issue.

      (5) The difference in Rab5 between control and GlcT-IR was not that significant. Furthermore, any changes could be secondary to increases in proliferation.

      We agree that it is possible that the observed increase in proliferation could influence the number of Rab5+ endosomes, and we will temper our conclusions on this aspect accordingly. However, it is important to note that, although the difference in Rab5+ endosomes between the control and GlcT-IR conditions appeared mild, it was statistically significant and reproducible. As we have indicated earlier, we plan to further analyze Rab11+ endosomes, as this additional analysis may provide further support for our previous conclusions.

      Reviewer #2 (Public review):

      Summary:

      This study genetically identifies two key enzymes involved in the biosynthesis of glycosphingolipids, GlcT and Egh, which act as tumor suppressors in the adult fly gut. Detailed genetic analysis indicates that a deficiency in Mactosyl-ceramide (Mac-Cer) is causing tumor formation. Analysis of a Notch transcriptional reporter further indicates that the lack of Mac-Ser is associated with reduced Notch activity in the gut, but not in other tissues.

      Addressing how a change in the lipid composition of the membranes might lead to defective Notch receptor activation, the authors studied the endocytic trafficking of Delta and claimed that internalized Delta appeared to accumulate faster into endosomes in the absence of Mac-Cer. Further analysis of Delta steady-state accumulation in fixed samples suggested a delay in the endosomal trafficking of Delta from Rab5+ to Rab7+ endosomes, which was interpreted to suggest that the inefficient, or delayed, recycling of Delta might cause a loss in Notch receptor activation.

      Finally, the histological analysis of mouse guts following the conditional knock-out of the GlcT gene suggested that Mac-Cer might also be important for proper Notch signaling activity in that context.

      Strengths:

      The genetic analysis is of high quality. The finding that a Mac-Cer deficiency results in reduced Notch activity in the fly gut is important and fully convincing.

      The mouse data, although preliminary, raised the possibility that the role of this specific lipid may be conserved across species.

      Weaknesses:

      This study is not, however, without caveats and several specific conclusions are not fully convincing.

      First, the conclusion that GlcT is specifically required in Intestinal Stem Cells (ISCs) is not fully convincing for technical reasons: NRE-Gal4 may be less active in GlcT mutant cells, and the knock-down of GlcT using Dl-Gal4ts may not be restricted to ISCs given the perdurance of Gal4 and of its downstream RNAi.

      As previously mentioned, we acknowledge that a role for GlcT in early EBs or EEPs cannot be completely ruled out. We will revise our manuscript to present a more cautious conclusion and explicitly describe this possibility in the updated version.

      Second, the results from the antibody uptake assays are not clear.: i) the levels of internalized Delta were not quantified in these experiments; ii) additionally, live guts were incubated with anti-Delta for 3hr. This long period of incubation indicated that the observed results may not necessarily reflect the dynamics of endocytosis of antibody-bound Delta, but might also inform about the distribution of intracellular Delta following the internalization of unbound anti-Delta. It would thus be interesting to examine the level of internalized Delta in experiments with shorter incubation time.

      We thank the reviewer for these excellent questions. In our antibody uptake experiments, we noted that Dl reached its peak accumulation after a 3-hour incubation period. We recognize that quantifying internalized Dl would enhance our analysis, and we will include the corresponding statistical graphs in the revised version of the manuscript. In addition, we agree that during the 3-hour incubation, the potential internalization of unbound anti-Dl cannot be ruled out, as it may influence the observed distribution of intracellular Dl. To address this concern, we plan to supplement our findings with live imaging experiments to capture the dynamics of Dl endocytosis in GlcT mutant ISCs.

      Overall, the proposed working model needs to be solidified as important questions remain open, including: is the endo-lysosomal system, i.e. steady-state distribution of endo-lysosomal markers, affected by the Mac-Cer deficiency? Is the trafficking of Notch also affected by the Mac-Cer deficiency? is the rate of Delta endocytosis also affected by the Mac-Cer deficiency? are the levels of cell-surface Delta reduced upon the loss of Mac-Cer?

      Regarding the impact on the endo-lysosomal system, this is indeed an important aspect to explore. While we did not conduct experiments specifically designed to evaluate the steady-state distribution of endo-lysosomal markers, our analyses utilizing Rab5-GFP overexpression and Rab7 staining did not indicate any significant differences in endosome distribution in MacCer deficient conditions. Moreover, we still observed high expression of the NRE-LacZ reporter specifically at the boundaries of clones in GlcT mutant cells (Fig. 4A), indicating that GlcT mutant EBs remain responsive to Dl produced by normal ISCs located right at the clone boundary. Therefore, we propose that MacCer deficiency may specifically affect Dl trafficking without impacting Notch trafficking.

      In our 3-hour antibody uptake experiments, we observed a notable decrease in cell-surface Dl, which was accompanied by an increase in intracellular accumulation. These findings collectively suggest that Dl may be unstable on the cell surface, leading to its accumulation in early endosomes.

      Third, while the mouse results are potentially interesting, they seem to be relatively preliminary, and future studies are needed to test whether the level of Notch receptor activation is reduced in this model.

      In the mouse small intestine, olfm4 is a well-established target gene of the Notch signaling pathway, and its staining provides a reliable indication of Notch pathway activation. While we attempted to evaluate Notch activation using additional markers, such as Hes1 and NICD, we encountered difficulties, as the corresponding antibody reagents did not perform well in our hands. Despite these challenges, we believe that our findings with Olfm4 provide an important start point for further investigation in the future.

      Reviewer #3 (Public review):

      Summary:

      In this paper, Tang et al report the discovery of a Glycoslyceramide synthase gene, GlcT, which they found in a genetic screen for mutations that generate tumorous growth of stem cells in the gut of Drosophila. The screen was expertly done using a classic mutagenesis/mosaic method. Their initial characterization of the GlcT alleles, which generate endocrine tumors much like mutations in the Notch signaling pathway, is also very nice. Tang et al checked other enzymes in the glycosylceramide pathway and found that the loss of one gene just downstream of GlcT (Egh) gives similar phenotypes to GlcT, whereas three genes further downstream do not replicate the phenotype. Remarkably, dietary supplementation with a predicted GlcT/Egh product, Lactosyl-ceramide, was able to substantially rescue the GlcT mutant phenotype. Based on the phenotypic similarity of the GlcT and Notch phenotypes, the authors show that activated Notch is epistatic to GlcT mutations, suppressing the endocrine tumor phenotype and that GlcT mutant clones have reduced Notch signaling activity. Up to this point, the results are all clear, interesting, and significant. Tang et al then go on to investigate how GlcT mutations might affect Notch signaling, and present results suggesting that GlcT mutation might impair the normal endocytic trafficking of Delta, the Notch ligand. These results (Fig X-XX), unfortunately, are less than convincing; either more conclusive data should be brought to support the Delta trafficking model, or the authors should limit their conclusions regarding how GlcT loss impairs Notch signaling. Given the results shown, it's clear that GlcT affects EE cell differentiation, but whether this is via directly altering Dl/N signaling is not so clear, and other mechanisms could be involved. Overall the paper is an interesting, novel study, but it lacks somewhat in providing mechanistic insight. With conscientious revisions, this could be addressed. We list below specific points that Tang et al should consider as they revise their paper.

      Strengths:

      The genetic screen is excellent.

      The basic characterization of GlcT phenotypes is excellent, as is the downstream pathway analysis.

      Weaknesses:

      (1) Lines 147-149, Figure 2E: here, the study would benefit from quantitations of the effects of loss of brn, B4GalNAcTA, and a4GT1, even though they appear negative.

      We will incorporate the quantifications for the effects of the loss of brn, B4GalNAcTA, and a4GT1 in the updated Figure 2.

      (2) In Figure 3, it would be useful to quantify the effects of LacCer on proliferation. The suppression result is very nice, but only effects on Pros+ cell numbers are shown.

      We will add quantifications of the number of EEs per clone to the updated Figure 3.

      (3) In Figure 4A/B we see less NRE-LacZ in GlcT mutant clones. Are the data points in Figure 4B per cell or per clone? Please note. Also, there are clearly a few NRE-LacZ+ cells in the mutant clone. How does this happen if GlcT is required for Dl/N signaling?

      In Figure 4B, the data points represent the fluorescence intensity per single cell within each clone. It is true that a few NRE-LacZ+ cells can still be observed within the mutant clone; however, this does not contradict our conclusion. As noted, high expression of the NRE-LacZ reporter was specifically observed around the clone boundaries in MacCer deficient cells (Fig. 4A), indicating that the mutant EBs can normally receive Dl signal from the normal ISCs located at the clone boundary and activate the Notch signaling pathway. Therefore, we believe that, although affecting Dl trafficking, MacCer deficiency does not significantly affect Notch trafficking.

      (4) Lines 222-225, Figure 5AB: The authors use the NRE-Gal4ts driver to show that GlcT depletion in EBs has no effect. However, this driver is not activated until well into the process of EB commitment, and RNAi's take several days to work, and so the author's conclusion is "specifically required in ISCs" and not at all in EBs may be erroneous.

      As previously mentioned, we acknowledge that a role for GlcT in early EBs or EEPs cannot be completely ruled out. We will revise our manuscript to present a more cautious conclusion and describe this possibility in the updated version.

      (5) Figure 5C-F: These results relating to Delta endocytosis are not convincing. The data in Fig 5C are not clear and not quantitated, and the data in Figure 5F are so widely scattered that it seems these co-localizations are difficult to measure. The authors should either remove these data, improve them, or soften the conclusions taken from them. Moreover, it is unclear how the experiments tracing Delta internalization (Fig 5C) could actually work. This is because for this method to work, the anti-Dl antibody would have to pass through the visceral muscle before binding Dl on the ISC cell surface. To my knowledge, antibody transcytosis is not a common phenomenon.

      We thank the reviewer for these insightful comments and suggestions. In our in vivo experiments, we observed increased co-localization of Rab5 and Dl in GlcT mutant ISCs, indicating that Dl trafficking is delayed at the transition to Rab7⁺ late endosomes, a finding that is further supported by our antibody uptake experiments. We acknowledge that the data presented in Fig. 5C are not fully quantified and that the co-localization data in Fig. 5F may appear somewhat scattered; therefore, we will include additional quantification and enhance the data presentation in the revised manuscript.

      Regarding the concern about antibody internalization, we appreciate this point. We currently do not know if the antibody reaches the cell surface of ISCs by passing through the visceral muscle or via other routes. Given that the experiment was conducted with fragmented gut, it is possible that the antibody may penetrate into the tissue through mechanisms independent of transcytosis.

      As mentioned earlier, we plan to supplement our findings with live imaging experiments to investigate the dynamics of Dl/Notch endocytosis in both normal and GlcT mutant ISCs. Anyway, due to technical challenges and potential pitfalls associated with the assays, we agree that this part of data is not fully convincing and we will provide a more cautious conclusion in the revised manuscript.

      (6) It is unclear whether MacCer regulates Dl-Notch signaling by modifying Dl directly or by influencing the general endocytic recycling pathway. The authors say they observe increased Dl accumulation in Rab5+ early endosomes but not in Rab7+ late endosomes upon GlcT depletion, suggesting that the recycling endosome pathway, which retrieves Dl back to the cell surface, may be impaired by GlcT loss. To test this, the authors could examine whether recycling endosomes (marked by Rab4 and Rab11) are disrupted in GlcT mutants. Rab11 has been shown to be essential for recycling endosome function in fly ISCs.

      We agree that assessing the state of recycling endosomes, especially by using markers such as Rab11, would be valuable in determining whether MacCer regulates Dl-Notch signaling by directly modifying Dl or by influencing the broader endocytic recycling pathway. We will incorporate these experiments into our future experimental plans to further characterize Dl trafficking in GlcT mutant ISCs.

      (7) It remains unclear whether Dl undergoes post-translational modification by MacCer in the fly gut. At a minimum, the authors should provide biochemical evidence (e.g., Western blot) to determine whether GlcT depletion alters the protein size of Dl.

      While we propose that MacCer may function as a component of lipid rafts, facilitating Dl membrane anchorage and endocytosis, we also acknowledge the possibility that MacCer could serve as a substrate for protein modifications of Dl necessary for its proper function. Conducting biochemical analyses to investigate potential post-translational modifications of Dl by MacCer would indeed provide valuable insights. To address this, we will incorporate Western blot analysis into our experimental plan to determine whether GlcT depletion affects the protein size of Dl.

      (8) It is unfortunate that GlcT doesn't affect Notch signaling in other organs on the fly. This brings into question the Delta trafficking model and the authors should note this. Also, the clonal marker in Figure 6C is not clear.

      In the revised working model, we will explicitly specify that the events occur in intestinal stem cells. Regarding Figure 6C, we will delineate the clone with a white dashed line to enhance its clarity and visual comprehension.

      (9) The authors state that loss of UGCG in the mouse small intestine results in a reduced ISC count. However, in Supplementary Figure C3, Ki67, a marker of ISC proliferation, is significantly increased in UGCG-CKO mice. This contradiction should be clarified. The authors might repeat this experiment using an alternative ISC marker, such as Lgr5.

      Previous studies have indicated that dysregulation of the Notch signaling pathway can result in a reduction in the number of ISCs. While we did not perform a direct quantification of ISC numbers in our experiments, our olfm4 staining—which serves as a reliable marker for ISCs—demonstrates a clear reduction in the number of positive cells in UGCG-CKO mice.

      The increased Ki67 signal we observed reflects enhanced proliferation in the transit-amplifying region, and it does not directly indicate an increase in ISC number. Therefore, in UGCG-CKO mice, we observe a decrease in the number of ISCs, while there is an increase in transit-amplifying (TA) cells (progenitor cells). This increase in TA cells is probably a secondary consequence of the loss of barrier function associated with the UGCG knockout.

    1. Author response:

      Reviewer #1 (Public review):

      Summary:

      The authors propose a transformer-based model for the prediction of condition - or tissue-specific alternative splicing and demonstrate its utility in the design of RNAs with desired splicing outcomes, which is a novel application. The model is compared to relevant existing approaches (Pangolin and SpliceAI) and the authors clearly demonstrate its advantage. Overall, a compelling method that is well thought out and evaluated.

      Strengths:

      (1) The model is well thought out: rather than modeling a cassette exon using a single generic deep learning model as has been done e.g. in SpliceAI and related work, the authors propose a modular architecture that focuses on different regions around a potential exon skipping event, which enables the model to learn representations that are specific to those regions. Because each component in the model focuses on a fixed length short sequence segment, the model can learn position-specific features. Another difference compared to Pangolin and SpliceAI which are focused on modeling individual splice junctions is the focus on modeling a complete alternative splicing event.

      (2) The model is evaluated in a rigorous way - it is compared to the most relevant state-of-the-art models, uses machine learning best practices, and an ablation study demonstrates the contribution of each component of the architecture.

      (3) Experimental work supports the computational predictions.    

      (4) The authors use their model for sequence design to optimize splicing outcomes, which is a novel application.

      We wholeheartedly thank Reviewer #1 for these positive comments regarding the modeling approach we took to this task and the evaluations we performed. We have put a lot of work and thought into this and it is gratifying to see the results of that work acknowledged like this.

      Weaknesses:

      No weaknesses were identified by this reviewer, but I have the following comments:

      (1) I would be curious to see evidence that the model is learning position-specific representations.

      This is an excellent suggestion to further assess what the model is learning. We have several ideas on how to test this which we will plan to report in the revised version. 

      (2) The transformer encoders in TrASPr model sequences with a rather limited sequence size of 200 bp; therefore, for long introns, the model will not have good coverage of the intronic sequence. This is not expected to be an issue for exons.

      Yes we can divide predictions by intron length, that’s a good suggestion. We will report on that in the revision.

      (3) In the context of sequence design, creating a desired tissue- or condition-specific effect would likely require disrupting or creating motifs for splicing regulatory proteins. In your experiments for neuronal-specific Daam1 exon 16, have you seen evidence for that? Most of the edits are close to splice junctions, but a few are further away.

      That is another good question and suggestion. In the original paper describing the mutation locations some motif similarities were noted to PTB (CU) and CUG/Mbnl-like elements (Barash et al Nature 2010). We could revisit this now with an RBP motif D.B. such as http://rbpdb.ccbr.utoronto.ca/. We note the ENCODE uses human cell lines and cannot be used for this but we will also look for mouse CLIP and KD data supporting such regulatory findings. 

      (4) For sequence design, of tissue- or condition-specific effect in neuronal-specific Daam1 exon 16 the upstream exonic splice junction had the most sequence edits. Is that a general observation? How about the relative importance of the four transformer regions in TrASPr prediction performance?

      This is another excellent question that we plan to follow up with matching analysis in the revision.

      (5) The idea of lightweight transformer models is compelling, and is widely applicable. It has been used elsewhere. One paper that came to mind in the protein realm:

      Singh, Rohit, et al. "Learning the language of antibody hypervariability." Proceedings of the National Academy of Sciences 122.1 (2025): e2418918121.

      Yes, we are for sure not the only/first to advocate for such an approach. We will be sure to make that point clear in the revision and thank the reviewer for the example from a different domain.  

      Reviewer #2 (Public review):

      Summary:

      The authors present a transformer-based model, TrASPr, for the task of tissue-specific splicing prediction (with experiments primarily focused on the case of cassette exon inclusion) as well as an optimization framework (BOS) for the task of designing RNA sequences for desired splicing outcomes.

      For the first task, the main methodological contribution is to train four transformer-based models on the 400bp regions surrounding each splice site, the rationale being that this is where most splicing regulatory information is. In contrast, previous work trained one model on a long genomic region. This new design should help the model capture more easily interactions between splice sites. It should also help in cases of very long introns, which are relatively common in the human genome.

      TrASPr's performance is evaluated in comparison to previous models (SpliceAI, Pangolin, and SpliceTransformer) on numerous tasks including splicing predictions on GTEx tissues, ENCODE cell lines, RBP KD data, and mutagenesis data. The scope of these evaluations is ambitious; however, significant details on most of the analyses are missing, making it difficult to evaluate the strength of the evidence. Additionally, state-of-the-art models (SpliceAI and Pangolin) are reported to perform extremely poorly in some tasks, which is surprising in light of previous reports of their overall good prediction accuracy; the reasoning for this lack of performance compared to TrASPr is not explored.

      In the second task, the authors combine Latent Space Bayesian Optimization (LSBO) with a Transformer-based variational autoencoder to optimize RNA sequences for a given splicing-related objective function. This method (BOS) appears to be a novel application of LSBO, with promising results on several computational evaluations and the potential to be impactful on sequence design for both splicing-related objectives and other tasks.

      We thank Reviewer #2 for this detailed summary and positive view of our work. It seems the main issue raised in this summary regards the evaluations: The reviewer finds details of the evaluations missing and the fact that SpliceAI and Pangolin perform poorly on some of the tasks to be surprising. In general, we made a concise effort to include the required details, including code and data tables, but will be sure to include more details based on the specific questions/comments listed below. As for the perceived performance issues for Pangolin/SpliceAI we believe this may be the result of not making it clear what tasks they perform well on vs those in which they do not work well. We give more details below. 

      Strengths:

      (1) A novel machine learning model for an important problem in RNA biology with excellent prediction accuracy.

      (2) Instead of being based on a generic design as in previous work, the proposed model incorporates biological domain knowledge (that regulatory information is concentrated around splice sites). This way of using inductive bias can be important to future work on other sequence-based prediction tasks.

      Weaknesses:

      (1) Most of the analyses presented in the manuscript are described in broad strokes and are often confusing. As a result, it is difficult to assess the significance of the contribution.

      We made an effort to make the tasks be specific and detailed,  including making the code and data of those available. Still, it is evident from the above comment Reviewer #2 found this to be lacking. We will review the description and make an effort to improve that given the clarifications we include below. 

      (2) As more and more models are being proposed for splicing prediction (SpliceAI, Pangolin, SpliceTransformer, TrASPr), there is a need for establishing standard benchmarks, similar to those in computer vision (ImageNet). Without such benchmarks, it is exceedingly difficult to compare models. For instance, Pangolin was apparently trained on a different dataset (Cardoso-Moreira et al. 2019), and using a different processing pipeline (based on SpliSER) than the ones used in this submission. As a result, the inferior performance of Pangolin reported here could potentially be due to subtle distribution shifts. The authors should add a discussion of the differences in the training set, and whether they affect your comparisons (e.g., in Figure 2). They should also consider adding a table summarizing the various datasets used in their previous work for training and testing. Publishing their training and testing datasets in an easy-to-use format would be a fantastic contribution to the community, establishing a common benchmark to be used by others.

      There are several good points to unpack here. First, we agree that a standard benchmark will be useful to include. We will work to create and include one for the revision. That said, we note that unlike the example given by Reviewer #2 (ImageNet) there are no standards for the splicing prediction tasks. There are actually different task definitions with different input/outputs as we tried to cover briefly in the introduction section. 

      Second, regarding the usage of different data and distribution shifts as potential reasons for Pangolin performance differences. We originally evaluated Pangolin after retraining it with MAJIQ based quantifications and found no significant changes. We will include a more detailed analysis of Pangolin retrained like this in the revision. We also note that Pangolin original training involved significantly more data as it was trained on four species with four tissues each, and we only evaluated it on three of those tissues (for human), in exons the authors deemed as test data. That said, we very much agree that retraining Pangolin as mentioned above is warranted, as well as clearly listing what data was used for training as suggested by the reviewer.

      (3) Related to the previous point, as discussed in the manuscript, SpliceAI, and Pangolin are not designed to predict PSI of cassette exons. Instead, they assign a "splice site probability" to each nucleotide. Converting this to a PSI prediction is not obvious, and the method chosen by the authors (averaging the two probabilities (?)) is likely not optimal. It would interesting to see what happens if an MLP is used on top of the four predictions (or the outputs of the top layers) from SpliceAI/Pangolin. This could also indicate where the improvement in TrASPr comes from: is it because TrASPr combines information from all four splice sites? Also, consider fine-tuning Pangolin on cassette exons only (as you do for your model).

      As mentioned above, we originally did try to retrain Pangolin with MAJIQ PSI values without observing much differences, but we will repeat this and include the results in the revision. Trying to combine 4 different SpliceAI models as proposed by the Reviewer seems to be a different kind of a new model, one that takes 4 large ResNets and combines those with annotation. Related to that, we did try to replace the transformers in our ablation study. The reviewer’s suggestion seems like another interesting architecture to try but since this is a non existing model that would likely require some adjustments. Given that, we view adding such a new model architecture as beyond the scope of this work.

      (4) L141, "TrASPr can handle cassette exons spanning a wide range of window sizes from 181 to 329,227 bases - thanks to its multi-transformer architecture." This is reported to be one of the primary advantages compared to existing models. Additional analysis should be included on how TrASPr performs across varying exon and intron sizes, with comparison to SpliceAI, etc.

      Yes, that is a good suggestion, similar to one made by Reviewer #1 as well. We plan to include such analysis in the revision. 

      (5) L171, "training it on cassette exons". This seems like an important point: previous models were trained mostly on constitutive exons, whereas here the model is trained specifically on cassette exons. This should be discussed in more detail.

      Previous models were not trained exclusively on constitutive exons and Pangolin specifically was trained with their version of junction usage across tissues. That said, the reviewer’s point is valid (and similar to ones made above) about a need to have a matched training/testing. As noted above we plan to include Pangolin training on our PSI values for comparison.

      (6) L214, ablations of individual features are missing.

      OK

      (7) L230, "ENCODE cell lines", it is not clear why other tissues from GTEx were not included.

      The task here was to assess predictions in very different conditions, hence we tested on completely different data of human cell lines rather than similar tissue samples. Yes, we can also assess on unseen GTEX tissues as well.

      (8) L239, it is surprising that SpliceAI performs so badly, and might suggest a mistake in the analysis. Additional analysis and possible explanations should be provided to support these claims. Similarly, the complete failure of SpliceAI and Pangolin is shown in Figure 4d.

      Line 239 refers to predicting relative inclusion levels between competing 3’ and 5’ splice sites. We admit we too expected this to be better for SpliceAI and Pangolin and will be sure to recheck for bugs, but to be fair we are not aware of a similar assessment being done for either of those algorithms (i.e. relative inclusion for 3’ and 5’ alternative splice site events).

      One issue we ran into, reflected in Reviewer #2 comments, is the mix between tasks that SpliceAI and Pangolin excel at and other tasks where they should not necessarily be expected to excel. Both algorithms focus on cryptic splice site creation/disruption. This has been the focus of those papers and subsequent applications.  While Pangolin added tissue specificity to SpliceAI training, the authors themselves admit “...predicting differential splicing across tissues from sequence alone is possible but remains a considerable challenge and requires further investigation”. The actual performance on this task is not included in Pangolin’s main text, but we refer Reviewer #2 to supplementary figure S4 in that manuscript to get a sense of Pangolin’s reported performance on this task. Similar to that, Figure 4d is for predicting *tissue specific* regulators. We do not think it is surprising that SpliceAI (tissue agnostic) and Pangolin (slight improvement compared to SpliceAI in tissue specific predictions) do not perform well on this task.  Similarly, we do not find the results in Figure 4C surprising either. These are for mutations that slightly alter inclusion level of an exon, not something SpliceAI was trained on, as it was simply trained on splice sites yes/no predictions. As noted and we will stress in the revision as well, training Pangolin on this dataset like TrASPr gives similar performance. That is to be expected as well - Pangolin is constructed to capture changes in PSI, those changes are not even tissue specific for CD19 data and the model has no problem/lack of capacity to generalize from the training set just like TrASPr does. In fact, if you only use combination of known mutations seen during training a simple regression model gives correlation of ~92-95% (Cortés-López et al 2022). In summary, we believe that better understanding of what one can realistically expect from models such as SpliceAI, Pangolin, and TrASPr will go a long way to have them better understood and used effectively. We will try to improve on that in the revision.

      (9) BOS seems like a separate contribution that belongs in a separate publication. Instead, consider providing more details on TrASPr.

      We thank the reviewer for the suggestion. We agree those are two distinct contributions and we indeed considered having them as two separate papers. However, there is strong coupling between the design algorithm (BOS) and the predictor that enables it (TrASPr). This coupling is both conceptual (TrASPr as a “teacher”) and practical in terms of evaluations. While we use experimental data (experiments done involving Daam1 exon 16, CD19 exon 2) we still rely heavily on evaluations by TrASPr itself. A completely independent evaluation would have required a high-throughput experimental system to assess designs, which is beyond the scope of the current paper. For those reasons we eventually decided to make it into what we hope is a more compelling combined story about generative models for prediction and design of RNA splicing. 

      (10) The authors should consider evaluating BOS using Pangolin or SpliceTransformer as the oracle, in order to measure the contribution to the sequence generation task provided by BOS vs TrASPr.

      We can definitely see the logic behind trying BOS with different predictors. That said, as we note above most of BOS evaluations are based on the “teacher”. As such, it is unclear what value replacing the teacher would bring. We also note that given this limitation we focus mostly on evaluations in comparison to existing approaches (genetic algorithm or random mutations as a strawman).

    1. Author response:

      Public Reviews:

      Reviewer #1 (Public review):

      Summary

      Fleming et al. present the first, proteomics-based attempt to identify the possible mechanism of action of ALS-linked DNAJC7 molecular chaperone in pathology. Impressively, it is the first report of DNAJC7 interactome studies, using a suitable iPSC-derived lower motor neuron model. Using a co-immunoprecipitation approach the authors identified that the interactome of DNAJC7 is predominantly composed of proteins engaged in response to stress, but also that this interactome is enriched in RNA-binding proteins. The authors also created a DNAJC7 haploinsufficiency cellular model and show the resulting increased insolubility of HNRNPU protein which causes disruptions in its functionality as shown by analysis of its transcriptional targets. Finally, this study uses pharmacological agents to test the effect of decreased DNAJC7 expression on cell response to proteotoxic stress and finds evidence that DNAJC7 regulates the activation of Heat shock factor 1 (HSF1) protein upon stress conditions.

      Strengths

      (1) This study uses the best so far model to study the interactome and possible mechanism of action of DNAJC7 molecular chaperone in an iPSC-derived cellular model of motor neurons. Furthermore, the authors also looked into available transcriptome databases of ALS patient samples to further test whether their findings may yield relevance to pathology.

      (2) The extent to which the authors are explicit about the sample sizes, protocols, and statistical tests used throughout this manuscript, should be applauded. This will help the whole field in their efforts to reliably replicate the results in this study.

      We thank the reviewer for highlighting the strengths of our study.

      Weaknesses

      (1) The most significant caveat of interactome experiments inherently comes from the method of choice. It is possible that by using the co-purification approach of DNAJC7 IP the resulting pool of binding partners is depleted in proteins that interact with DNAJC7 weakly or transiently. An alternative approach presumably more sensitive towards weaker binders could use the TurboID-based proximity-labeling method.

      The reviewer raises a valid point that TurboID-based proximity biotinylation could be a more sensitive approach for identifying DNAJC7 protein-protein interactions compared to IP-MS. We agree that this strategy could be better suited to detect weak or transient interactions, and we have previously used it to characterize protein nanoenvironments and interactomes in vitro and in vivo (Wang et al. Mol Psychiatry 2024, Quan et al. mBio 2024). However, proximity biotinylation also has significant limitations, such as potential artifacts due to overexpression and high background levels. We selected the IP-MS approach to identify DNAJC7 binding partners in neurons without the need of genetically modifying or over-expressing DNAJC7.

      (2) The authors mention in Results (and Figure 2D) that HNRNPA1 was identified as DNAJC7-interacting protein in their co-IP experiments, however, an identifier for this protein cannot be found in Figure 1C and Table S1 listing the proteomics results. Could the authors appropriately update Figure 1C and Table S1, or if HNRNPA1 wasn't really a hit then remove it from listed HNRNPs?

      We apologize for the confusion. HNRNPA1 was pulled down exclusively with DNAJC7 in 2/3 independent experiments and was initially included in our list of targets. However, in our final and most stringent analysis we only considered proteins that appeared in 3/3 experiments and thus HNRNPA1 was filtered out of Figure 1C and Table S1. We will therefore remove it from Figure 2D in the revised manuscript.

      (3) No further validation of DNAJC7-interacting proteins from the heat-shock protein (HSP) family. Current validation of mass spectrometry-identified proteins comes from IP-western blots with antibodies against HSPs. It would be interesting to further inspect possible interactions of these proteins by inspecting co-localization with immunocytochemistry.

      As the reviewer points out we did in fact validate the interaction of DNAJC7 with HSP90 and HSP70 (HSP90AB1 and HSPA1A) by IP-WB as shown in Fig 1F. We agree that examining co-localization of these proteins by immunocytochemistry (ICC) would be important to investigate. However, we have been unable to do this due to technical limitations. Specifically, we have tried to perform ICC using 6 commercially available DNAJC7 antibodies and have so far been unsuccessful. In our hands the DNAJC7 ICC signal appears to be non-specific as it is not reduced when using DNAJC7 knockout and knockdown cells as controls.

      (4) Similarly, the observation of DNAJC7 haploinsufficiency causing an increase in HNRNPU insolubility could be also easily further confirmed by checking for the emergence of "puncta" under a fluorescence microscope, in addition to provided WB experiments from MN lysates.

      This is a good suggestion, and we can assess the emergence of HNRNPU "puncta" by ICC in DNAJC7 mutant iPSC-derived neurons and/or postmortem sporadic ALS patient tissue.

      (5) I would like to recommend the authors to also provide with this manuscript a complete dataset (possibly in the form of a table, presented similarly as Table S1) resulting from experiments presented in Figures 2F and S2D. The information on upregulated and downregulated targets in their DNAJC7 haploinsufficiency model would be a valuable resource for the field and enable further investigations.

      This is a good suggestion and in the revised version we will provide in Table S2 the dataset presented in Figs. 2F and S2D.

      Reviewer #2 (Public review):

      Summary:

      The manuscript titled "The ALS-associated co-chaperone DNAJC7 mediates neuroprotection against proteotoxic stress by modulating HSF1 activity" describes experiments carried out in iPS cells re-differentiated into motor neurons (iNeuons, MNs) seeking to assess the functions of the J protein DnaJC7 in proteostasis. This study also investigates how an ALS-associated mutant variant (R156X) alters DnaJC7 function. The proteomic studies identify proteins interacting with DnaJC7. Using mRNA profiling in haplo-insufficient cells (+/R156X) compared to wild-type cells, the study seeks to identify pathways modulated by partial loss of DnaJC7 function. Studies in the DnaJC7 haplo-insufficient cells also indicate changes in the properties of ALS-associated proteins, such as HNRNPU and Matrin3 both of which are involved in the regulation of gene expression. The study also shows data indicating that DnaJC7 haploinsufficiency sensitizes cells to proteostatic stress induced by proteosome inhibition by MG132 and Hsp90 inhibition by Ganetespib. Lastly, the study investigates how DnaJC7 modulates the activity of the heat shock transcription factor (Hsf1) and thus the heat shock response.

      Strengths<br /> (1) The manuscript is well presented and most of the data is of high quality and convincing. The figures and supplementary figures are clear and easy to follow.

      (2) This study overall provides important new insights into a mostly underexplored molecular co-chaperone and its role in proteostasis. The proteomic and transcriptomic experiments certainly advance our understanding of DnaJC7. The MN model is well-suited for these studies addressing the role of DnaJC7, particularly regarding ALS. The haplo-insufficient MNs are also a suitable model to study a potential loss of function mechanism caused by (some) fALS-associated mutants in ALS, such as the R156X mutation used here.

      (3) Since so little is known about DnaJC7 function, the exploratory approaches applied here are particularly useful.

      We thank the reviewer for highlighting the strengths of our study.

      Weaknesses

      (1) Without follow-up studies, however, e.g., with select interacting proteins, the study provides merely a descriptive list of possible interactions without mechanistic insights. Also, most interactions have not been extensively (only a few examples) validated by other methods or individual experiments.

      We appreciate the reviewers concern and agree that there are several intriguing DNAJC7 interactors worth studying further, that is why we wanted to share this resource with the broader community as quickly as possible. As the first study focused on DNAJC7 and its link to ALS we could not possibly investigate multiple potential interactors and focused on two: HNRNPU and HSP70/HSP90, associated with RNA metabolism and stress response respectively, as these are two pathways have previously been implicated in ALS pathogenesis. We do provide validation of these interactions and some mechanistic insight into how DNAJC7 haploinsufficiency impairs their function.

      A major limitation of the study in its current form is that none of the experimental approaches allow for assessing the specific functions of JC7. In the absence of specificity controls, e.g., other J proteins or HOP, which, like DnaJC7, contains TPR domains and can interact with Hsp70 and Hsp90, it remains unclear if the proposed functions of DnaJC7 are specific/unique or shared by other J proteins or molecular chaperones. Accordingly, it would be highly informative to add experiments to assess if some of the reported DnaJC7 protein-protein interactions and the transcriptional alterations in haplo-insufficient cells are DnaJC7specific or also occur with other J proteins or molecular chaperones. This seems particularly important to discern specific DnaJC7 functions from general effects caused by impaired proteostasis.

      We agree with the reviewer that is a very interesting question, as for example mutations in DNAJC6 can cause rare forms of Parkinson’s Disease1. However, addressing the functional overlap of DNAJC7 with other J proteins such as DNAJC6 would require substantial time and resources and is out of scope of the current manuscript. 

      It would be informative to explore how cellular stress (e.g., MG132 treatment) alters DnaJC7 interactions with other proteins (J proteins, HOP), ideally in additional/comparative proteomic studies. The mechanism underlying the proposed regulation of Hsf1 by DnaJC7 is not quite clear to me (Figures 4 A-I). There is no evidence of a direct physical interaction between DnJC7 and Hsf1 in the proteomic data or elsewhere. It seems plausible that Hsf1/HSR dysregulation in the haplo-insufficient cells might be due to rather indirect effects, e.g., increased protein misfolding. Also, additional data showing differential activation of Hsf1 in +/+ versus +/- cells would strengthen this part, e.g. showing differences in Hsf1 trimerization, Hsp70 interactions, nuclear localization, etc.

      The reviewer makes two good points here. Firstly, we do agree we should provide additional data to better understand the differential activation of HSF1 in DNACJ7 heterozygous neurons and we will focus on this question during the revision. We also agree that the mechanism underlying the regulation of HSF1 by DNAJC7 is not well defined and we acknowledge it could be indirect. Of note, HSF1 activation is regulated by HSP70, of which DNAJC7 is a co-chaperone. We will attempt to define this mechanism better during the revision.

      The manuscript might also benefit from considering the literature showing an unusually inactive HSR and Hsf1 activity in motor neurons (e.g. published by the Durham lab).

      Yes—we did in fact note this in our discussion: “At the same time, mouse MNs have previously been shown to maintain a high threshold of induction of the HSF1-mediated stress response relative to other cell types including glial cells, with the suggestion that this contributes to their vulnerability to stress signals such as insoluble proteins.” We will further consider how our findings are in line with those of Durham et al., in the revised discussion.

      The correlation with transcriptomic data from ALS patients compared to neurotypical controls (Figures 4 L, M) suggesting a direct role of Hsf1/HSR seems unlikely at this point. In my view, the transcriptional dysregulation in ALS patients could be unrelated to Hsf1 dysregulation and caused by rather non-specific effects of neuronal decay in ALS.

      This is a very reasonable concern.  We acknowledge that the HSF1 effects in patients could be driven by multiple other factors including C9-DPRs etc. However, the point of this analysis is not to claim that DNAJC7 is the cause; but rather to highlight the importance of the HSF1 pathway, which we identified as being mis-regulated in DNAJC7 mutant neurons, as broadly relevant in sporadic and other forms of genetic ALS. 

      Reviewer #3 (Public review):

      Summary:

      Fleming et al sought to better understand DNAJC7's function in motor neurons as mutations in this gene have been associated with amyotrophic lateral sclerosis (ALS). The research question is relevant and important. The authors use an induced pluripotent stem cell (iPSC) line to derive motor neurons (iMNs) finding that DNAJC7 interacts with RNA-binding proteins (RBP) in wild-type cells and a truncated mutant DNAJC7[R156*] disrupts the RBP, hnRNPU, by promoting its accumulation into insoluble fractions. Given that DNAJC7 is predicted to regulate stress responses, the authors then find that DNAJC7[R156*] expression sensitizes the iMNs to proteosomal stress by disrupting the expression of the key heat stress response regulator, HSF1. These findings support that loss-of-function mutations in DNAJC7 will indeed sensitize motor neurons to proteotoxic stress, potentially driving ALS. The association with RBPs, which routinely are found to be disrupted in ALS, is of interest and warrants further study.

      Strengths

      (1) The research question is relevant and important. The authors provide interesting data that DNAJC7 mutations impact two important features in ALS, the dysregulation of RNA binding proteins and the sensitivity of motor neurons to proteotoxic stress.

      (2) The authors provide solid data to support their findings and the assays are appropriate.

      We thank the reviewer for highlighting the strengths of our study.

      Weaknesses

      (1) The authors rely on a single iPSC line throughout the text, using the same line to make the mutation-carrying cells. iPSCs are highly variable and at minimum 3 lines, typically 5 lines, should be used to define consistent findings. This work would be greatly strengthened if 3 or more lines were used to confirm consistent effects. This is particularly concerning given that iPSCs were differentiated using growth factors versus genetic induction. Growth-factor-based differentiations are more variable.

      We will substantiate the major findings by the use of additional models and genetic backgrounds during the revision. However, our experiments utilize isogenic controls and extensive quality control assays (on-target, off target analysis, whole genome sequencing, karyotype etc.) to ensure that our isogenic lines are genomically identical --other than the DNAJC7 mutation-- and thus any phenotypes are likely caused by mutant DNAJC7 itself.   

      (2) The authors argue that HSF1 and its targets are downregulated in sporadic ALS and mutant C9orf72 ALS. The first concern is that these transcriptomics data were derived from cortical tissue which does not contain motor neurons (Pineda et al. 2024 Cell 187: 1971-1989.e1916). The second concern is that the inclusion of C9orf72 mutant tissue is not well justified as (1) this mutation is associated with an upregulation of HSF1 and its targets in patients (Mordes et al, Acta Neuropathol Commun 2018 6(1):55; Lee et al Neuron 2023 111(9):1381-1390) and (2) the C9orf72 mutation is associated with a ALS/FTD spectrum disorder defined by TDP-43 pathology. Disease mechanisms associated with this spectrum disorder may not overlap with traditional ALS which is typically defined by SOD1 pathology.

      SOD1 pathology represents only a small fraction (<2%) of all ALS patients and is therefore not traditional ALS. The majority (<97%) of sporadic and familial ALS cases (including C9orf72 but excluding SOD1 and FUS cases) are uniformly characterized by TDP-43 pathology. Nevertheless, we do agree that it would be better to assess spinal cord data but unfortunately such single cell datasets form ALS patients do not currently exist. We acknowledge that the HSF1 effects in patients could be driven by multiple other factors including C9-DPRs etc. However, the point of this analysis is not to claim that DNAJC7 is the cause; but rather to highlight the importance of the HSF1 pathway, which we identified as being mis-regulated in DNAJC7 mutant neuron, as being broadly relevant in sporadic and other forms of genetic ALS. 

      (3) As a whole, the findings are mechanistically disjointed, and additional experiments or discussion would help to connect the dots a bit more.

      We will revise the manuscript with additional experiments and discussion to better connect the dots.

      Citations

      (1) Kurian, M. A. & Abela, L. in GeneReviews(®)   (eds M. P. Adam et al.)  (University of Washington, Seattle Copyright © 1993-2025, University of Washington, Seattle. GeneReviews is a registered trademark of the University of Washington, Seattle. All rights reserved., 1993).

    1. Author response:

      Public Reviews:

      Reviewer #1 (Public review):

      (1) While the study demonstrates that ZSS has protective effects across a wide range of animal models, including AD, FTD, DLB, PD, and both young and aged mice, it is broad and lacks a detailed investigation into the underlying mechanisms. This is the most significant concern.

      We appreciate this comment. We recognize that elucidating the mechanism is an important research topic, and we are currently working on it. The purpose of publishing this paper at this time is to inform the public as soon as possible about natural materials and methods that may be effective in preventing dementia and neurodegenerative diseases, and to encourage similar research.

      (2) The authors highlight that the non-extracted simple crush powder of ZSS shows more substantial effects than its hot water extract and extraction residue. However, the manuscript provides very limited data comparing the effects of these three extracts.

      Certainly, it would be better to compare them in several different models, but we believe that important results have already been obtained in tau Tg mice, and comparative data in other models are just additive and confirmatory.

      (3) The authors have not provided a rationale for the dosing concentrations used, nor have they tested the effects of the treatment in normal mice to verify its impact under physiological conditions.

      As described in the Materials and Methods section, the dosage was determined based on the results of preliminary experiments. The beneficial effects in normal mice are shown in Figure 5.

      (4) Regarding the assessment of cognitive function in mice, the authors only utilized the Morris Water Maze (MWM) test, which includes a five-day spatial learning training phase followed by a probe trial. The authors focused solely on the learning phase. However, it is relevant to note that data from the learning phase primarily reflects the learning ability of the mice, while the probe trial is more indicative of memory. Therefore, it is essential that probe trial data be included for a more comprehensive analysis. A justification should be included to explain why the latency of 1st is about 50s not 60s.

      We agree that it is better to include the results of the probe test. We did not include them this time, but we would like to include them in the future. In the memory acquisition training, five trials were performed per day. Since the mice learned the location of the platform during the first five trials, the latency on the first day became around 50 seconds.

      (5) The BDNF immunohistochemical staining in the manuscript appears to be non-specific.

      We cannot understand the basis for saying it is non-specific.

      (6) The central pathological regions in PD are the substantia nigra and striatum. Please replace the staining results from the cortex and hippocampus with those from these regions in the PD model.

      We examined the substantia nigra and found that synuclein pathology appeared in Tg mice and was suppressed by ZSS administration. However, because we did not investigate the striatum, we decided not to show the results for the nigrostriatal system this time. Instead, we thought that we could demonstrate the inhibitory effect of ZSS on synuclein pathology by showing the results for the cortex and hippocampus, which showed early functional decline in these mice (Fig. 4E).

      Reviewer #2 (Public review):

      The authors' study lacked an in-depth exploration of mechanisms, including changes in intracellular signal transduction, drug targets, and drug toxicity detection.

      We appreciate this comment. We understand that the mechanism, targets, and toxicity are important issues to be considered in the future.

      Reviewer #3 (Public review):

      However, this work did not include a mechanistic study or target data on ZSS were included, and PK data were also not involved. Mechanisms or targets and PK study are suggested. A human PK study is preferred over mice or rats. E.g. which main active ingredients and the concentration in plasma, in this context, to study the pharmacological mechanisms of ZSS.

      We appreciate this comment. We understand that the mechanism and target are important issues to consider in the future. As the reviewer pointed out, to conduct PK studies, we must first identify the active ingredients. Unfortunately, we have not been able to identify them yet.

      Reviewer #2 (Recommendations for the authors):

      The authors have proved that ZSS has neuroprotective effects through rigorous animal experiments. However, ZSS contains other active substances besides jujuboside A, jujuboside B, and spinosin, which is more concerning. More critical data may be obtained if experiments have been designed to search for active substances.

      We appreciate this suggestion. We recognize that identifying the true active ingredients is a very important issue. Future studies will be designed to identify them and elucidate their mechanism of action.

    1. Author response:

      The following is the authors’ response to the original reviews.

      General responses:

      The authors sincerely thank all the reviewers for their valuable and constructive comments. We also apologize for the long delay in providing this rebuttal due to logistical and funding challenges. In this revision, we modified the bipolar gradients from one single direction to all three directions. Additionally, in response to the concerns regarding data reliability, we conducted a thorough examination of each step in our data processing pipeline. In the original processing workflow, the projection-onto-convex-set (POCS) method was used for partial Fourier reconstruction. Upon examination, we found that applying the POCS method after parallel image reconstruction significantly altered the signal and resulted in considerable loss of functional feature. Futhermore, the original scan protocol employed a TE of 46 ms, which is notably longer than the typical TE of 33 ms. A prolonged TE can increase the ratio of extravascular to intravascular contributions. Importantly, the impact of TE on the efficacy of phase regression remains unclear, introducing potential confounding effects. To address these issues, we revised the protocol by shortening the TE from 46 ms to 39 ms. This adjustment was achieved by modifying the SMS factor to 3 and the in-plane acceleration rate to 3, thereby minimizing the confounding effects associated with an extended TE.

      Following these changes, we recollected task-based fMRI data (N=4) and resting-state fMRI data (N=14) under the updated protocol. Using the revised dataset, we validated layer-specific functional connectivity (FC) through seed-based analyses. These analyses revealed distinct connectivity patterns in the superficial and deep layers of the primary motor cortex (M1), with statistically significant inter-layer differences. Furthermore, additional analyses with a seed in the primary sensory cortex (S1) corroborated the robustness and reliability of the revised methodology. We also changed the ‘directed’ functional connectivity in the title to ‘layer-specific’ functional connectivity, as drawing conclusions about directionality requires auxiliary evidence beyond the scope of this study.

      We provide detailed responses to the reviewers’ comments below.

      Reviewer #1 (Public Review):

      Summary:

      (1)   This study aims to provide imaging methods for users of the field of human layer-fMRI. This is an emerging field with 240 papers published so far. Different than implied in the manuscript, 3T is well represented among those papers. E.g. see the papers below that are not cited in the manuscript. Thus, the claim on the impact of developing 3T methodology for wider dissemination is not justified. Specifically, because some of the previous papers perform whole brain layer-fMRI (also at 3T) in more efficient, and more established procedures.

      3T layer-fMRI papers that are not cited:

      Taso, M., Munsch, F., Zhao, L., Alsop, D.C., 2021. Regional and depth-dependence of cortical blood-flow assessed with high-resolution Arterial Spin Labeling (ASL). Journal of Cerebral Blood Flow and Metabolism. https://doi.org/10.1177/0271678X20982382

      Wu, P.Y., Chu, Y.H., Lin, J.F.L., Kuo, W.J., Lin, F.H., 2018. Feature-dependent intrinsic functional connectivity across cortical depths in the human auditory cortex. Scientific Reports 8, 1-14. https://doi.org/10.1038/s41598-018-31292-x

      Lifshits, S., Tomer, O., Shamir, I., Barazany, D., Tsarfaty, G., Rosset, S., Assaf, Y., 2018. Resolution considerations in imaging of the cortical layers. NeuroImage 164, 112-120. https://doi.org/10.1016/j.neuroimage.2017.02.086

      Puckett, A.M., Aquino, K.M., Robinson, P.A., Breakspear, M., Schira, M.M., 2016. The spatiotemporal hemodynamic response function for depth-dependent functional imaging of human cortex. NeuroImage 139, 240-248. https://doi.org/10.1016/j.neuroimage.2016.06.019

      Olman, C.A., Inati, S., Heeger, D.J., 2007. The effect of large veins on spatial localization with GE BOLD at 3 T: Displacement, not blurring. NeuroImage 34, 1126-1135. https://doi.org/10.1016/j.neuroimage.2006.08.045

      Ress, D., Glover, G.H., Liu, J., Wandell, B., 2007. Laminar profiles of functional activity in the human brain. NeuroImage 34, 74-84. https://doi.org/10.1016/j.neuroimage.2006.08.020

      Huber, L., Kronbichler, L., Stirnberg, R., Ehses, P., Stocker, T., Fernández-Cabello, S., Poser, B.A., Kronbichler, M., 2023. Evaluating the capabilities and challenges of layer-fMRI VASO at 3T. Aperture Neuro 3. https://doi.org/10.52294/001c.85117

      Scheeringa, R., Bonnefond, M., van Mourik, T., Jensen, O., Norris, D.G., Koopmans, P.J., 2022. Relating neural oscillations to laminar fMRI connectivity in visual cortex. Cerebral Cortex. https://doi.org/10.1093/cercor/bhac154

      We thank the reviewer for listing out 8 papers related to 3T layer-fMRI papers. The primary goal of our work is to develop a methodology for brain-wide, layer-dependent resting-state functional connectivity at 3T. Upon review of the cited papers, we found that:

      (1) One study (Lifshits et al.) was not an fMRI study.

      (2) One study (Olman et al.) was conducted at 7T, not 3T.

      (3) Two studies (Taso et al. and Wu et al.) employed relatively large voxel sizes (1.6 × 2.3 × 5 mm³ and 1.5 mm isotropic, respectively), which limits layer specificity.

      (4) Only one of the listed studies (Huber et al., Aperture Neuro 2023) provides coverage of more than half of the brain.

      While each of these studies offers valuable insights, the VASO study by Huber et al. is the most relevant to our work, given its brain-wide coverage. However, the VASO method employs a relatively long TR (14.137 s), which may not be optimal for resting-state functional connectivity analyses.

      To address these limitations, our proposed method achieves submillimeter resolution, layer specificity, brain-wide coverage, and a significantly shorter TR (<5 s) altogether. We believe this advancement provides a meaningful contribution to the field, enabling broader applicability of layer-fMRI at 3T.

      (2) The authors implemented a sequence with lots of nice features. Including their own SMS EPI, diffusion bipolar pulses, eye-saturation bands, and they built their own reconstruction around it. This is not trivial. Only a few labs around the world have this level of engineering expertise. I applaud this technical achievement. However, I doubt that any of this is the right tool for layer-fMRI, nor does it represent an advancement for the field. In the thermal noise dominated regime of sub-millimeter fMRI (especially at 3T), it is established to use 3D readouts over 2D (SMS) readouts. While it is not trivial to implement SMS, the vendor implementations (as well as the CMRR and MGH implementations) are most widely applied across the majority of current fMRI studies already. The author's work on this does not serve any previous shortcomings in the field.

      We would like to thank the reviewer for their comments and the recognition of the technical efforts in implementing our sequence. We would like to address the points raised:

      (1) We completely agree that in-house implementation of existing techniques does not constitute an advancement for the field. We did not claim otherwise in the manuscript. Our focus was on the development of a method for brain-wide, layer-dependent resting-state functional connectivity at 3T, as mentioned in the response above.

      (2) The reviewer stated that "it is established to use 3D readouts over 2D (SMS) readouts". This is a strong claim, and we believe it requires robust evidence to support it. While it is true that 3D readouts can achieve higher tSNR in certain regions, such as the central brain, as shown in the study by Vizioli et al. (ISMRM 2020 abstract; https://cds.ismrm.org/protected/20MProceedings/PDFfiles/3825.html?utm_source=chatgpt.com ), higher tSNR does not necessarily equate to improved detection power in fMRI studies. For instance, Le Ster et al. (PLOS ONE, 2019; https://doi.org/10.1371/journal.pone.0225286 ). demonstrated that while 3D EPI had higher tSNR in the central brain, SMS EPI produced higher t-scores in activation maps.

      (3) When choosing between SMS EPI and 3D EPI, multiple factors should be taken into account, not just tSNR. For example, SMS EPI and 3D EPI differ in their sensitivity to motion and the complexity of motion correction. The choice between them depends on the specific research goals and practical constraints.

      (4) We are open to different readout strategies, provided they can be demonstrated suitable to the research goals. In this study, we opted for 2D SMS primarily due to logistical considerations. This choice does not preclude the potential use of 3D readouts in the future if they are deemed more appropriate for the project objectives.

      The mechanism to use bi-polar gradients to increase the localization specificity is doubtful to me. In my understanding, killing the intra-vascular BOLD should make it less specific. Also, the empirical data do not suggest a higher localization specificity to me.

      We will elaborate the mechanism and reasoning in the later responses.

      Embedding this work in the literature of previous methods is incomplete. Recent trends of vessel signal manipulation with ABC or VAPER are not mentioned. Comparisons with VASO are outdated and incorrect.

      The reproducibility of the methods and the result is doubtful (see below).

      In this revision, we updated the scan protocol and recollected the imaging data. Detailed explanations and revised results are provided in the later responses.

      I don't think that this manuscript is in the top 50% of the 240 layer-fmri papers out there.

      We respect the reviewer’s personal opinion. However, we can only address scientific comments or critiques.

      Strengths:

      See above. The authors developed their own SMS sequence with many features. This is important to the field. And does not leave sequence development work to view isolated monopoly labs. This work democratises SMS.

      The questions addressed here are of high relevance to the field: getting tools with good sensitivity, user-friendly applicability, and locally specific brain activity mapping is an important topic in the field of layer-fMRI.

      Weaknesses:

      (1) I feel the authors need to justify why flow-crushing helps localization specificity. There is an entire family of recent papers that aim to achieve higher localization specificity by doing the exact opposite. Namely, MT or ABC fRMRI aims to increase the localization specificity by highlighting the intravascular BOLD by means of suppressing non-flowing tissue. To name a few:

      Priovoulos, N., de Oliveira, I.A.F., Poser, B.A., Norris, D.G., van der Zwaag, W., 2023. Combining arterial blood contrast with BOLD increases fMRI intracortical contrast. Human Brain Mapping hbm.26227. https://doi.org/10.1002/hbm.26227.

      Pfaffenrot, V., Koopmans, P.J., 2022. Magnetization Transfer weighted laminar fMRI with multi-echo FLASH. NeuroImage 119725. https://doi.org/10.1016/j.neuroimage.2022.119725

      Schulz, J., Fazal, Z., Metere, R., Marques, J.P., Norris, D.G., 2020. Arterial blood contrast ( ABC ) enabled by magnetization transfer ( MT ): a novel MRI technique for enhancing the measurement of brain activation changes. bioRxiv. https://doi.org/10.1101/2020.05.20.106666

      Based on this literature, it seems that the proposed method will make the vein problem worse, not better. The authors could make it clearer how they reason that making GE-BOLD signals more extra-vascular weighted should help to reduce large vein effects.

      The proposed VN fMRI method employs VN gradients to selectively suppress signals from fast-flowing blood in large vessels. Although this approach may initially appear to diverge from the principles of CBV-based techniques (Chai et al., 2020; Huber et al., 2017a; Pfaffenrot and Koopmans, 2022; Priovoulos et al., 2023), which enhance sensitivity to vascular changes in arterioles, capillaries, and venules while attenuating signals from static tissue and large veins, it aligns with the fundamental objective of all layer-specific fMRI methods. Specifically, these approaches aim to maximize spatial specificity by preserving signals proximal to neural activation sites and minimizing contributions from distal sources, irrespective of whether the signals are intra- or extra-vascular in origin. In the context of intravascular signals, CBV-based methods preferentially enhance sensitivity to functional changes in small vessels (proximal components) while demonstrating reduced sensitivity to functional changes in large vessels (distal components). For extravascular signals, functional changes are a mixture of proximal and distal influences. While tissue oxygenation near neural activation sites represents a proximal contribution, extravascular signal contamination from large pial veins reflects distal effects that are spatially remote from the site of neuronal activity. CBV-based techniques mitigate this challenge by unselectively suppressing signals from static tissues, thereby highlighting contributions from small vessels. In contrast, the VN fMRI method employs a targeted suppression strategy, selectively attenuating signals from large vessels (distal components) while preserving those from small vessels (proximal components). Furthermore, the use of a 3T scanner and the inclusion of phase regression in the VN approach mitigates contamination from large pial veins (distal components) while preserving signals reflecting local tissue oxygenation (proximal components). By integrating these mechanisms, VN fMRI improves spatial specificity, minimizing both intravascular and extravascular contributions that are distal to neuronal activation sites. We have incorporated the responses into Discussion section.

      The empirical evidence for the claim that flow crushing helps with the localization specificity should be made clearer. The response magnitude with and without flow crushing looks pretty much identical to me (see Fig, 6d).

      In the new results in Figure 4, the application of VN gradients attenuated the bias towards pial surface. Consistent with the results in Figure 4, Figure 5 also demonstrated the suppression of macrovascular signal by VN gradients.

      It's unclear to me what to look for in Fig. 5. I cannot discern any layer patterns in these maps. It's too noisy. The two maps of TE=43ms look like identical copies from each other. Maybe an editorial error?

      In this revision, the original Figure 5 has been removed. However, we would like to clarify that the two maps with TE = 43 ms in the original Figure 5 were not identical. This can be observed in the difference map provided in the right panel of the figure.

      The authors discuss bipolar crushing with respect to SE-BOLD where it has been previously applied. For SE-BOLD at UHF, a substantial portion of the vein signal comes from the intravascular compartment. So I agree that for SE-BOLD, it makes sense to crush the intravascular signal. For GE-BOLD however, this reasoning does not hold. For GE-BOLD (even at 3T), most of the vein signal comes from extravascular dephasing around large unspecific veins, and the bipolar crushing is not expected to help with this.

      The reviewer’s statement that "most of the vein signal comes from extravascular dephasing around large unspecific veins" may hold true for 7T. However, at 3T, the susceptibility-induced Larmor frequency shift is reduced by 57%, and the extravascular contribution decreases by more than 35%, as shown by Uludağ et al. 2009 ( DOI: 10.1016/j.neuroimage.2009.05.051 ).

      Additionally, according to the biophysical models (Ogawa et al., 1993; doi: 10.1016/S0006-3495(93)81441-3 ), the extravascular contamination from the pial surface is inversely proportional to the square of the distance from vessel. For a vessel diameter of 0.3 mm and an isotropic voxel size of 0.9 mm, the induced frequency shift is reduced by at least 36-fold at the next voxel. Notably, a vessel diameter of 0.3 mm is larger than most pial vessels. Theoretically, the extravascular effect contributes minimally to inter-layer dependency, particularly at 3T compared to 7T due to weaker susceptibility-related effects at lower field strengths. Empirically, as shown in Figure 7c, the results at M1 demonstrated that layer specificity can be achieved statistically with the application of VN gradients. We have incorporated this explanation into the Introduction and Discussion sections of the manuscript.

      (2) The bipolar crushing is limited to one single direction of flow. This introduces a lot of artificial variance across the cortical folding pattern. This is not mentioned in the manuscript. There is an entire family of papers that perform layer-fmri with black-blood imaging that solves this with a 3D contrast preparation (VAPER) that is applied across a longer time period, thus killing the blood signal while it flows across all directions of the vascular tree. Here, the signal cruising is happening with a 2D readout as a "snap-shot" crushing. This does not allow the blood to flow in multiple directions.

      VAPER also accounts for BOLD contaminations of larger draining veins by means of a tag-control sampling. The proposed approach here does not account for this contamination.

      Chai, Y., Li, L., Huber, L., Poser, B.A., Bandettini, P.A., 2020. Integrated VASO and perfusion contrast: A new tool for laminar functional MRI. NeuroImage 207, 116358. https://doi.org/10.1016/j.neuroimage.2019.116358

      Chai, Y., Liu, T.T., Marrett, S., Li, L., Khojandi, A., Handwerker, D.A., Alink, A., Muckli, L., Bandettini, P.A., 2021. Topographical and laminar distribution of audiovisual processing within human planum temporale. Progress in Neurobiology 102121. https://doi.org/10.1016/j.pneurobio.2021.102121

      If I would recommend anyone to perform layer-fMRI with blood crushing, it seems that VAPER is the superior approach. The authors could make it clearer why users might want to use the unidirectional crushing instead.

      We understand the reviewer’s concern regarding the directional limitation of bipolar crushing. As noted in the responses above, we have updated the bipolar gradient to include three orthogonal directions instead of a single direction. Furthermore, flow-related signal suppression does not necessarily require a longer time period. Bipolar diffusion gradients have been effectively used to nullify signals from fast-flowing blood, as demonstrated by Boxerman et al. (1995; DOI: 10.1002/mrm.1910340103). Their study showed that vessels with flow velocities producing phase changes greater than p radians due to bipolar gradients experience significant signal attenuation. The critical velocity for such attenuation can be calculated using the formula: 1/(2gGDd) where g is the gyromagnetic ratio, G is the gradient strength, d is the gradient pulse width and D is the time between the two bipolar gradient pulses. In the framework of Boxerman et al. at 1.5T, the critical velocity for b value of 10 s/mm<sup>2</sup> is ~8 mm/s, resulting in a ~30% reduction in functional signal. In our 3T study, b values of 6, 7, and 8 s/mm<sup>2</sup> correspond to critical velocities of 16.8, 15.2, and 13.9 mm/s, respectively. The flow velocities in capillaries and most venules remain well below these thresholds. Notably, in our VN fMRI sequences, bipolar gradients were applied in all three orthogonal directions, whereas in Boxerman et al.'s study, the gradients were applied only in the z-direction. Given the voxel dimensions of 3 × 3 × 7 mm<sup>3</sup> in the 1.5T study, vessels within a large voxel are likely oriented in multiple directions, meaning that only a subset of fast-flowing signals would be attenuated. Therefore, our approach is expected to induce greater signal reduction, even at the same b values as those used in Boxerman et al.'s study. We have incorporated this text into the Discussion section of the manuscript.

      (3) The comparison with VASO is misleading.

      The authors claim that previous VASO approaches were limited by TRs of 8.2s. The authors might be advised to check the latest literature of the last years.

      Koiso et al. performed whole brain layer-fMRI VASO at 0.8mm at 3.9 seconds (with reliable activation), 2.7 seconds (with unconvincing activation pattern, though), and 2.3 (without activation).

      Also, whole brain layer-fMRI BOLD at 0.5mm and 0.7mm has been previously performed by the Juelich group at TRs of 3.5s (their TR definition is 'fishy' though).

      Koiso, K., Müller, A.K., Akamatsu, K., Dresbach, S., Gulban, O.F., Goebel, R., Miyawaki, Y., Poser, B.A., Huber, L., 2023. Acquisition and processing methods of whole-brain layer-fMRI VASO and BOLD: The Kenshu dataset. Aperture Neuro 34. https://doi.org/10.1101/2022.08.19.504502

      Yun, S.D., Pais‐Roldán, P., Palomero‐Gallagher, N., Shah, N.J., 2022. Mapping of whole‐cerebrum resting‐state networks using ultra‐high resolution acquisition protocols. Human Brain Mapping. https://doi.org/10.1002/hbm.25855

      Pais-Roldan, P., Yun, S.D., Palomero-Gallagher, N., Shah, N.J., 2023. Cortical depth-dependent human fMRI of resting-state networks using EPIK. Front. Neurosci. 17, 1151544. https://doi.org/10.3389/fnins.2023.1151544

      We thank the reviewer for providing these references. While the protocol with a TR of 3.9 seconds in Koiso’s work demonstrated reasonable activation patterns, it was not tested for layer specificity. Given that higher acceleration factors (AF) can cause spatial blurring, a protocol should only be eligible for comparison if layer specificity is demonstrated.

      Secondly, the TRs reported in Koiso’s study pertain only to either the VASO or BOLD acquisition, not the combined CBV-based contrast. To generate CBV-based images, both VASO and BOLD data are required, effectively doubling the TR. For instance, if the protocol with a TR of 3.9 seconds is used, the effective TR becomes approximately 8 seconds. The stable protocol used by Koiso et al. to acquire whole-brain data (94.08 mm along the z-axis) required 5.2 seconds for VASO and 5.1 seconds for BOLD, resulting in an effective TR of 10.3 seconds. The spatial resolution achieved was 0.84 mm isotropic.

      Unfortunately, we could not find the Juelich paper mentioned by the reviewer.

      To have a more comprehensive comparison, we collated relevant literature on brain-wide layer-specific fMRI. We defined brain-wide acquisition as imaging protocols that cover more than half of the human brain, specifically exceeding 55 mm along the superior-inferior axis. We identified five studies and summarized their scan parameters, including effective TR, coverage, and spatial resolution, in Table 1.

      The authors are correct that VASO is not advised as a turn-key method for lower brain areas, incl. Hippocampus and subcortex. However, the authors use this word of caution that is intended for inexperienced "users" as a statement that this cannot be performed. This statement is taken out of context. This statement is not from the academic literature. It's advice for the 40+ user base that wants to perform layer-fMRI as a plug-and-play routine tool in neuroscience usage. In fact, sub-millimeter VASO is routinely being performed by MRI-physicists across all brain areas (including deep brain structures, hippocampus etc). E.g. see Koiso et al. and an overview lecture from a layer-fMRI workshop that I had recently attended: https://youtu.be/kzh-nWXd54s?si=hoIJjLLIxFUJ4g20&t=2401

      In this revision, we decided to focus on cortico-cortical functional connectivity and have removed the LGN-related content. Consequently, the text mentioned by the reviewer was also removed. Nevertheless, we apologize if our original description gave the impression that functional mapping of deep brain regions using VASO is not feasible. The word of caution we used is based on the layer-fMRI blog ( https://layerfmri.com/2021/02/22/vaso_ve/ ) and reflects the challenges associated with this technique, as outlined by experts like Dr. Huber and Dr. Strinberg.

      According to the information provided, including the video, functional mapping of the hippocampus and amygdala using VASO is indeed possible but remains technically challenging. The short arterial arrival times in these deep brain regions can complicate the acquisition, requiring RF inversion pulses to cover a wider area at the base of the brain. For example, as of 2023, four or more research groups were attempting to implement layer-fMRI VASO in the hippocampus. One such study at 3T required multiple inversion times to account for inflow effects, highlighting the technical complexity of these applications. This is the context in which we used the word of caution. We are not sure whether recent advancements like MAGEC VASO have improved its applicability. As of 2024, we have not identified any published VASO studies specifically targeting deep brain structures such as the hippocampus or amygdala. Therefore, it is difficult to conclude that “sub-millimeter VASO is routinely being performed by MRI physicists on deep brain structures such as the hippocampus.”

      Thus, the authors could embed this phrasing into the context of their own method that they are proposing in the manuscript. E.g. the authors could state whether they think that their sequence has the potential to be disseminated across sites, considering that it requires slow offline reconstruction in Matlab?

      We are enthusiastic about sharing our imaging sequence, provided its usefulness is conclusively established. However, it's important to note that without an online reconstruction capability, such as the ICE, the practical utility of the sequence may be limited. Unfortunately, we currently don’t have the manpower to implement the online reconstruction. Nevertheless, we are more than willing to share the offline reconstruction codes upon request.

      Do the authors think that the results shown in Fig. 6c are suggesting turn-key acquisition of a routine mapping tool? In my humble opinion, it looks like random noise, with most of the activation outside the ROI (in white matter).

      As we mentioned in the ‘general response’ in the beginning of the rebuttal, the POCS method for partial Fourier reconstruction caused the loss of functional feature, potentially accounting for the activation in white matter. In this revision, we have modified the pulse sequence, scan protocol and processing pipelines.

      According to the results in Figure 4, stable activation in M1 was observed at the single-subject level across most scan protocols. Yet, the layer-dependent activation profiles in M1 were spatially unstable, irrespective of the application of VN gradients. This spatial instability is not entirely unexpected, as T2*-based contrast is inherently sensitive to various factors that perturb the magnetic field, such as eye movements, respiration, and macrovascular signal fluctuations. Furthermore, ICA-based artifact removal was intentionally omitted in Figure 4 to ensure fair comparisons between protocols, leaving residual artifacts unaddressed. Inconsistency in performing the button-pressing task across sessions may also have contributed to the observed variability. These results suggest that submillimeter-resolution fMRI may not yet be suitable for reliable individual-level layer-dependent functional mapping, unless group-level statistics are incorporated to enhance robustness. We have incorporated this text into the Limitation section of the manuscript.

      (4) The repeatability of the results is questionable.

      The authors perform experiments about the robustness of the method (line 620). The corresponding results are not suggesting any robustness to me. In fact, the layer profiles in Fig. 4c vs. Fig 4d are completely opposite. The location of peaks turns into locations of dips and vice versa.

      The methods are not described in enough detail to reproduce these results.

      The authors mention that their image reconstruction is done "using in-house MATLAB code" (line 634). They do not post a link to github, nor do they say if they share this code.

      We thank the reviewer for the comments regarding reproducibility and data sharing. In response, we have revised the Methods section and elaborated on the technical details to improve clarity and reproducibility.

      Regarding code sharing, we acknowledge that the current in-house MATLAB reconstruction code requires further refinement to improve its readability and usability. Due to limited manpower, we have not yet been able to complete this task. However, we are committed to making the code publicly available and will upload it to GitHub as soon as the necessary resources are available.

      For data sharing, we face logistical challenges due to the large size of the dataset, which spans tens of terabytes. Platforms like OpenNeuro, for example, typically support datasets up to 10TB, making it difficult to share the data in its entirety. Despite this limitation, we are more than willing to share offline reconstruction codes and raw data upon request to facilitate reproducibility.

      Regarding data robustness, we kindly refer the reviewer to our response to the previous comment, where we addressed these concerns in greater detail.

      It is not trivial to get good phase data for fMRI. The authors do not mention how they perform the respective coil-combination.

      No data are shared for reproduction of the analysis.

      Obtaining phase data is relatively straightforward when the images are retrieved directly from raw data. For coil combination, we employed the adaptive coil combination approach described by (Walsh et al.; DOI: 10.1002/(sici)1522-2594(200005)43:5<682::aid-mrm10>3.0.co;2-g ) The MATLAB code for this implementation was developed by Dr. Diego Hernando and is publicly available at https://github.com/welton0411/matlab .

      (5) The application of NODRIC is not validated.

      Previous applications of NORDIC at 3T layer-fMRI have resulted in mixed success. When not adjusted for the right SNR regime it can result in artifactual reductions of beta scores, depending on the SNR across layers. The authors could validate their application of NORDIC and confirm that the average layer-profiles are unaffected by the application of NORDIC. Also, the NORDIC version should be explicitly mentioned in the manuscript.

      Akbari, A., Gati, J.S., Zeman, P., Liem, B., Menon, R.S., 2023. Layer Dependence of Monocular and Binocular Responses in Human Ocular Dominance Columns at 7T using VASO and BOLD (preprint). Neuroscience. https://doi.org/10.1101/2023.04.06.535924

      Knudsen, L., Guo, F., Huang, J., Blicher, J.U., Lund, T.E., Zhou, Y., Zhang, P., Yang, Y., 2023. The laminar pattern of proprioceptive activation in human primary motor cortex. bioRxiv. https://doi.org/10.1101/2023.10.29.564658

      We appreciate the reviewer’s suggestion. To validate the application of NORDIC denoising in our study, we compared the BOLD activation maps before and after denoising in the visual and motor cortices, as well as the depth-dependent activation profiles in M1. These results are presented in Figure 3. The activation patterns in the denoised maps were consistent with those in the non-denoised maps but exhibited higher statistical significance. Notably, BOLD activation within M1 was only observed after NORDIC denoising, underscoring the necessity of this approach. Figure 3c shows the depth-dependent activation profiles in M1, highlighted by the green contours in Figure 3b. Both denoised and non-denoised profiles followed similar trends; however, as expected, the non-denoised profile exhibited larger confidence intervals compared to the NORDIC-denoised profile. These results confirm that NORDIC denoising enhances sensitivity without introducing distortions in the functional signal. The corresponding text has been incorporated into the Results section.

      Regarding the implementation details of NORDIC denoising, the reconstructed images were denoised using a g-factor map (function name: NIFTI_NORDIC). The g-factor map was estimated from the image time series, and the input images were complex-valued. The width of the smoothing filter for the phase was set to 10, while all other hyperparameters were retained at their default values. This information has been integrated into the Methods section for clarity and reproducibility.

      Reviewer #2 (Public Review):

      This study developed a setup for laminar fMRI at 3T that aimed to get the best from all worlds in terms of brain coverage, temporal resolution, sensitivity to detect functional responses, and spatial specificity. They used a gradient-echo EPI readout to facilitate sensitivity, brain coverage and temporal resolution. The former was additionally boosted by NORDIC denoising and the latter two were further supported by parallel-imaging acceleration both in-plane and across slices. The authors evaluated whether the implementation of velocity-nulling (VN) gradients could mitigate macrovascular bias, known to hamper the laminar specificity of gradient-echo BOLD.

      The setup allows for 0.9 mm isotropic acquisitions with large coverage at a reasonable TR (at least for block designs) and the fMRI results presented here were acquired within practical scan-times of 12-18 minutes. Also, in terms of the availability of the method, it is favorable that it benefits from lower field strength (additional time for VN-gradient implementation, afforded by longer gray matter T2*).

      The well-known double peak feature in M1 during finger tapping was used as a test-bed to evaluate the spatial specificity. They were indeed able to demonstrate two distinct peaks in group-level laminar profiles extracted from M1 during finger tapping, which was largely free from superficial bias. This is rather intriguing as, even at 7T, clear peaks are usually only seen with spatially specific non-BOLD sequences. This is in line with their simple simulations, which nicely illustrated that, in theory, intravascular macrovascular signals should be suppressible with only minimal suppression of microvasculature when small b-values of the VN gradients are employed. However, the authors do not state how ROIs were defined making the validity of this finding unclear; were they defined from independent criteria or were they selected based on the region mostly expressing the double peak, which would clearly be circular? In any case, results are based on a very small sub-region of M1 in a single slice - it would be useful to see the generalizability of superficial-bias-free BOLD responses across a larger portion of M1.

      We appreciate and understand the reviewer’s concerns. Given the small size of the hand knob region within M1 and its intersubject variability in location, defining this region automatically remains challenging. However, we applied specific criteria to minimize bias during the delineation of M1: 1) the hand knob region was required to be anatomically located in the precentral sulcus or gyrus; 2) it needed to exhibit consistent BOLD activation across the majority of testing conditions; and 3) the region was expected to show BOLD activation in the deep cortical layers under the condition of b = 0 and TE = 30 ms. Once the boundaries across cortical depth were defined, the gray matter boundaries of hand knob region were delineated based on the T1-weighted anatomical image and the cortical ribbon mask but excluded the BOLD activation map to minimize potential bias in manual delineation. Based on the new criteria, the resulting depth-dependent profiles, as shown in Figure 4, are no longer superficial-bias-free.

      As repeatedly mentioned by the authors, a laminar fMRI setup must demonstrate adequate functional sensitivity to detect (in this case) BOLD responses. The sensitivity evaluation is unfortunately quite weak. It is mainly based on the argument that significant activation was found in a challenging sub-cortical region (LGN). However, it was a single participant, the activation map was not very convincing, and the demonstration of significant activation after considerable voxel-averaging is inadequate evidence to claim sufficient BOLD sensitivity. How well sensitivity is retained in the presence of VN gradients, high acceleration factors, etc., is therefore unclear. The ability of the setup to obtain meaningful functional connectivity results is reassuring, yet, more elaborate comparison with e.g., the conventional BOLD setup (no VN gradients) is warranted, for example by comparison of tSNR, quantification and comparison of CNR, illustration of unmasked-full-slice activation maps to compare noise-levels, comparison of the across-trial variance in each subject, etc. Furthermore, as NORDIC appears to be a cornerstone to enable submillimeter resolution in this setup at 3T, it is critical to evaluate its impact on the data through comparison with non-denoised data, which is currently lacking.

      We appreciate the reviewer’s comments and acknowledge that the LGN results from a single participant were not sufficiently convincing. In this revision, we have removed the LGN-related results and focused on cortico-cortical FC. To evaluate data quality, we opted to present BOLD activation maps rather than tSNR, as high tSNR does not necessarily translate to high functional significance. In Figure 3, we illustrate the effect of NORDIC denoising, including activation maps and depth-dependent profiles. Figure 4 presents activation maps acquired under different TE and b values, demonstrating that VN gradients effectively reduce the bias toward the pial surface without altering the overall activation patterns. The results in Figure 4 and Figure 5 provide evidence that VN gradients retain sensitivity while reducing superficial bias. The ability of the setup to obtain meaningful FC results was validated through seed-based analyses, identifying distinct connectivity patterns in the superficial and deep layers of the primary motor cortex (M1), with significant inter-layer differences (see Figure 7). Further analyses with a seed in the primary sensory cortex (S1) demonstrated the reliability of the method (see Figure 8). For further details on the results, including the impact of VN gradients and NORDIC denoising, please refer to Figures 3 to 8 in the Results section.

      Additionally, we acknowledge the limitations of our current protocol for submillimeter-resolution fMRI at the individual level. We found that robust layer-dependent functional mapping often requires group-level statistics to enhance reliability. This issue has been discussed in detail in the Limitations section.

      The proposed setup might potentially be valuable to the field, which is continuously searching for techniques to achieve laminar specificity in gradient echo EPI acquisitions. Nonetheless, the above considerations need to be tackled to make a convincing case.

      Reviewer #3 (Public Review):

      Summary:

      The authors are looking for a spatially specific functional brain response to visualise non-invasively with 3T (clinical field strength) MRI. They propose a velocity-nulled weighting to remove the signal from draining veins in a submillimeter multiband acquisition.

      Strengths:

      - This manuscript addresses a real need in the cognitive neuroscience community interested in imaging responses in cortical layers in-vivo in humans.

      - An additional benefit is the proposed implementation at 3T, a widely available field strength.

      Weaknesses:

      - Although the VASO acquisition is discussed in the introduction section, the VN-sequence seems closer to diffusion-weighted functional MRI. The authors should make it more clear to the reader what the differences are, and how results are expected to differ. Generally, it is not so clear why the introduction is so focused on the VASO acquisition (which, curiously, lacks a reference to Lu et al 2013). There are many more alternatives to BOLD-weighted imaging for fMRI. CBF-weighted ASL and GRASE have been around for a while, ABC and double-SE have been proposed more recently.

      The major distinction between diffusion-weighted fMRI (DW-fMRI) and our methodology lies in the b-value employed. DW-fMRI typically measures cellular swelling using b-values greater than 1000 s/mm<sup>2</sup> (e.g., 1800 s/mm(sup>2</sup>). In contrast, our VN-fMRI approach measures hemodynamic responses by employing smaller b-values specifically designed to suppress signals from fast-flowing draining veins rather than detecting microstructural changes.

      Regarding other functional contrasts, we agree that more layer-dependent fMRI approaches should be mentioned. In this revision, we have expanded the Introduction section to include discussions of the double spin-echo approach and CBV-based methods, such as MT-weighted fMRI, VAPER, ABC, and CBF-based method ASL. Additionally, the reference to Lu et al. (2013) has been cited in the revised manuscript. The corresponding text has been incorporated into the Introduction section to provide a more comprehensive overview of alternative functional imaging techniques.

      - The comparison in Figure 2 for different b-values shows % signal changes. However, as the baseline signal changes dramatically with added diffusion weighting, this is rather uninformative. A plot of t-values against cortical depth would be much more insightful.

      - Surprisingly, the %-signal change for a b-value of 0 is not significantly different from 0 in the gray matter. This raises some doubts about the task or ROI definition. A finger-tapping task should reliably engage the primary motor cortex, even at 3T, and even in a single participant.

      - The BOLD weighted images in Figure 3 show a very clear double-peak pattern. This contradicts the results in Figure 2 and is unexpected given the existing literature on BOLD responses as a function of cortical depth.

      - Given that data from Figures 2, 3, and 4 are derived from a single participant each, order and attention affects might have dramatically affected the observed patterns. Especially for Figure 4, neither BOLD nor VN profiles are really different from 0, and without statistical values or inter-subject averaging, these cannot be used to draw conclusions from.

      We appreciate the reviewer’s suggestions. In this revision, we have made significant updates to the participant recruitment, scan protocol, data processing, and M1 delineation. Please refer to the "General Responses" at the beginning of the rebuttal and the first response to Reviewer #2 for more details.

      Previously, the variation in depth-dependent profiles was calculated across upscaled voxels within a specific layer. However, due to the small size of the hand knob region, the number of within-layer voxels was limited, resulting in inaccurate estimations of signal variation. In the revised manuscript, the signal was averaged within each layer before performing the GLM analysis, and signal variation was calculated using the temporal residuals. The technical details of these changes are described in the "Materials and Methods" section. Furthermore, while the initial submission used percentage signal change for the profiles of M1, the dramatic baseline fluctuations observed previously are no longer an issue after the modifications. For this reason, we retained the use of percentage signal change to present the depth-dependent profiles. After these adjustments, the profiles exhibited a bias toward the pial surface, particularly in the absence of VN gradients.

      - In Figure 5, a phase regression is added to the data presented in Figure 4. However, for a phase regression to work, there has to be a (macrovascular) response to start with. As none of the responses in Figure 4 are significant for the single participant dataset, phase regression should probably not have been undertaken. In this case, the functional 'responses' appear to increase with phase regression, which is contra-intuitive and deserves an explanation.

      We agreed with reviewer’s argument. In the revised results, the issues mentioned by the reviewer are largely diminished. The updated analyses demonstrate that phase regression effectively reduces superficial bias, as shown in Figures 4 and 5.

      - Consistency of responses is indeed expected to increase by a removal of the more variable vascular component. However, the microvascular component is always expected to be smaller than the combination of microvascular + macrovascular responses. Note that the use of %signal changes may obscure this effect somewhat because of the modified baseline. Another expected feature of BOLD profiles containing both micro- and microvasculature is the draining towards the cortical surface. In the profiles shown in Figure 7, this is completely absent. In the group data, no significant responses to the task are shown anywhere in the cortical ribbon.

      We agreed with reviewer’s comments. In the revised manuscript, the results have been substantially updated to addressing the concerns raised. The original Figure 7 is no longer relevant and has been removed.

      - Although I'd like to applaud the authors for their ambition with the connectivity analysis, I feel that acquisitions that are so SNR starved as to fail to show a significant response to a motor task should not be used for brain wide directed connectivity analysis.

      We appreciate the reviewer’s comments and share the concern about SNR limitations. In the updated results presented in Figure 5, the activation patterns in the visual cortex were consistent across TEs and b values. At the motor cortex, stable activation in M1 was observed at the single-subject level across most scan protocols. However, the layer-dependent activation profiles in M1 exhibited spatial instability, irrespective of the application of VN gradients. This spatial instability is not entirely unexpected, as T2*-based contrast is inherently sensitive to factors that perturb the magnetic field, such as eye movements, respiration, and macrovascular signal fluctuations. Additionally, ICA-based artifact removal was intentionally omitted in Figure 4 to ensure fair comparisons across protocols, leaving some residual artifacts unaddressed. Variability in task performance during button-pressing sessions may have further contributed to the observed inconsistencies.

      Although these findings suggest that submillimeter-resolution fMRI may not yet be reliable for individual-level layer-dependent functional mapping, the group-level FC analyses can still yield robust results. In Figure 7, group-level statistics revealed distinct functional connectivity (FC) patterns associated with superficial and deep layers in M1. These FC maps exhibited significant differences between layers, demonstrating that VN fMRI enhances inter-layer independence. Additional FC analyses with a seed placed in S1 further validated these findings (see Figure 8).

      The claim of specificity is supported by the observation of the double-peak pattern in the motor cortex, previously shown in multiple non-BOLD studies. However, this same pattern is shown in some of the BOLD weighted data, which seems to suggest that the double-peak pattern is not solely due to the added velocity nulling gradients. In addition, the well-known draining towards the cortical surface is not replicated for the BOLD-weighted data in Figures 3, 4, or 7. This puts some doubt about the data actually having the SNR to draw conclusions about the observed patterns.

      We appreciate the reviewer’s comments. In the updated results, the efficacy of the VN gradients is evident near the pial surface, as shown in Figures 4 and 5. In Figure 4, comparing the second and third columns (b = 0 and b = 6 s/mm<sup>2</sup>, respectively, at TE = 38 ms), the percentage signal change in the superficial layers is generally lower with b = 6 s/mm<sup>2</sup> than with b = 0. This indicates that VN gradient-induced signal suppression is more pronounced in the superficial layers. Additionally, in Figure 5, the VN gradients effectively suppressed macrovascular signals as highlighted by the blue circles. These observations support the role of VN gradients in enhancing specificity by reducing superficial bias and macrovascular contamination. Furthermore, bias towards cortical surface was observed in the updated results in Figure 4.

      Recommendations for the authors:

      Reviewer #2 (Recommendations For The Authors):

      (1) L141: "depth dependent" is slightly misleading here. It could be misunderstood to suggest that the authors are assessing how spatial specificity varies as a function of depth. Rather, they are assessing spatial specificity based on depth-dependent responses (double peak feature). Perhaps "layer-dependent spatial specificity" could be substituted with laminar specificity?

      We thank the reviewer for the suggestion. The term “depth dependent” has been replaced by “layer dependent” in the revised manuscript.

      (2) L146-149: these do not validate spatial specificity.

      The original text is removed.

      (3) L180: Maybe helpful to describe what the b-value is to assist unfamiliar readers.

      We have clarified the b-value as “the strength of the bipolar diffusion gradients” where it is first mentioned in the manuscript.

      (4) Figure 1B: I think it would be appropriate with a sentence of how the authors define micro/macrovasculature. Figure 1B seems to suggest that large ascending veins are considered microvascular which I believe is a bit unconventional. Nevertheless, as long as it is clearly stated, it should be fine.

      In our context, macrovasculature refers to vessels that are distal to neural activation sites and contribute to extravascular contamination. These vessels are typically larger in size (e.g., > 0.1 mm in diameter) and exhibit faster flow rates (e.g., > 10 mm/s).

      (5) I think the authors could be more upfront with the point about non-suppressed extravascular effects from macrovasculature, which was briefly mentioned in the discussion. It could already be highlighted in the introduction or theory section.

      We thank the reviewer’s suggestions. We have expanded the discussion of extravascular effects from macrovasculature in both the Introduction (5th paragraph) and Discussion (3rd paragraph) sections.

      (6) The phase regression figure feels a bit misplaced to me. If the authors agree: rather than showing the TE-dependency of the effect of phase regression, it may be more relevant for the present study to compare the conventional setup with phase regression, with the VN setup without phase regression. I.e., to show how the proposed setup compares to existing 3T laminar fMRI studies.

      In this revision, both the TE-dependent and VN-dependent effects of phase regression were investigated. The results in Figure 4 and Figure 5 demonstrated that phase regression effectively suppresses macrovascular contributions primarily near the gray matter/CSF boundary, irrespective of TE or the presence of VN gradients.

      (7) L520: It might be beneficial to also cite the large body of other laminar studies showing the double peak feature to underscore that it is highly robust, which increases its relevance as a test-bed to assess spatial specificity.

      We agreed. More literatures have been cited (Chai et al., 2020; Huber et al., 2017a; Knudsen et al., 2023; Priovoulos et al., 2023).

      (8) L557: The argument that only one participant was assessed to reduce inter-subject variability is hard to buy. If significant variability exists across subjects, this would be highly relevant to the authors and something they would want to capture.

      We thank the reviewer for the suggestions. In this revision, we have increased the number of participants to 4 for protocol development and 14 for resting-state functional connectivity analysis, allowing us to better assess and account for inter-subject variability.

      (9) L637: add download link and version number.

      The download link has been added as requested. The version number is not applicable.

      (10) L638: How was the phase data coil-combined?

      The reconstructed multi-channel data, which were of complex values, were combined using the adaptive combination method (Walsh et al.; DOI: 10.1002/(sici)1522-2594(200005)43:5<682::aid-mrm10>3.0.co;2-g). The MATLAB code for this implementation was developed by Dr. Diego Hernando and is publicly available at https://github.com/welton0411/matlab . The phase data were then extracted using the MATLAB function ‘angle’.

      (11) L639: Why was the smoothing filter parameter changed (other parameters were default)?

      The smoothing filter parameter was set based on the suggestion provided in the help comments of the NIFTI_NORDIC function:

      function  NIFTI_NORDIC(fn_magn_in,fn_phase_in,fn_out,ARG)

      % fMRI

      %

      %  ARG.phase_filter_width=10;

      In other words, we simply followed the recommendation outlined in the NIFTI_NORDIC function’s documentation.

      (12) I assume the phase data was motion corrected after transforming to real and imaginary components and using parameters estimated from magnitude data? Maybe add a few sentences about this.

      Prior to phase regression, the time series of real and imaginary components were subjected to motion correction, followed by phase unwrapping. The phase regression was incorporated early in the data processing pipeline to minimize the discrepancy in data processing between magnitude and phase images (Stanley et al., 2021).

      (13) Was phase regression applied with e.g., a deming model, which accounts for noise on both the x and y variable? In my experience, this makes a huge difference compared with regular OLS.

      We appreciate the reviewer’s insightful comment. We are aware that the noise present in both magnitude and phase data therefore linear Deming regression would be a good fit to phase regression (Stanley et al., 2021). To perform Deming regression, however, the ratio of magnitude error variance to phase error variance must be predefined. In our initial tests, we found that the regression results were sensitive to this ratio. To avoid potential confounding, we opted to use OLS regression for the current analysis. However, we agreed Deming model could enhance the efficacy of phase regression if the ratio could be determined objectively and properly.

      (14) Figure 2: What is error bar reflecting? I don't think the across-voxel error, as also used in Figure 4, is super meaningful as it assumes the same response of all voxels within a layer (might be alright for such a small ROI). Would it be better to e.g. estimate single-trial response magnitude (percent signal change) and assess variability across? Also, it is not obvious to me why b=30 was chosen. The authors argue that larger values may kill signal, but based on this Figure in isolation, b=48 did not have smaller response magnitudes (larger if anything).

      We agreed with the reviewer’s opinion on the across-voxel error. In the revised manuscript, the signal was averaged within each layer before performing the GLM analysis, and signal variation was calculated using the temporal residuals. The technical details of these changes are described in the "Materials and Methods" section.

      Additionally, the bipolar diffusion gradients were modified from a single direction to three orthogonal directions. As a result, the questions and results related to b=30 or b=48 are no longer applicable.

      (15) Figure 5: would be informative to quantify the effect of phase regression over a large ROI and evaluate reduction in macrovascular influence from superficial bias in laminar profiles.

      We appreciate the reviewer’s suggestion. In the revised manuscript, the reduction in macrovascular influence from superficial bias across a large ROI is displayed in Figure 5. Additionally, the impact on laminar profiles is demonstrated in Figure 4.

      (16) L406-408: What kind of robustness?

      We acknowledge that describing the protocol as “robust” was an overstatement. The updated results indicate that the current protocol for submillimeter fMRI may not yet be suitable for reliable individual-level layer-dependent functional mapping. However, group-level functional connectivity (FC) analyses demonstrated clear layer-specific distinctions with VN fMRI, which were not evident in conventional fMRI. These findings highlight the enhanced layer specificity achievable with VN fMRI.

      (17) Figure 8: I think C) needs pointers to superficial, middle, and deep layers? Why is it not in the same format as in Figure 9C? The discussion of the FC results could benefit from more references supporting that these observations are in line with the literature.

      In the revised results, the layer pooling shown in Figure 9c has been removed, making the question regarding format alignment no longer applicable. Additionally, references supporting the FC results have been added to the revised Discussion section (7th paragraph).

      (18) L456-457: But correlation coefficients may also be biased by different CNR across layers.

      That is correct. In the updated FC results in Figure 7 to 9, we used group-level statistics rather than correlation coefficients.

      Reviewer #3 (Recommendations For The Authors):

      The results in Figure 2-6 should be repeated over, or averaged over, a (small) group of participants. N=6 is usual in this field. I would seriously reconsider the multiband acceleration - the acquisition seemingly cannot support the SNR hit.

      A few more specific points are given below:

      (1) Abstract: The sentence about LGN in the abstract came for me out of the blue - why would LGN be important here, it's not even a motor network node? Perhaps the aims of the study should be made more clear - if it's about networks as suggested earlier then a network analysis result would be expected too. Expanding the directed FC findings would improve the logical flow of the abstract. Given the many concerns, removing the connectivity analysis altogether would also be an option.

      We thank the reviewer for the suggestions. The LGN-related results indeed diluted the focus of this study and have been completely removed in this revision.

      (2) Line 105: in addition to the VASO method, ..

      The corresponding text has been revised, and as a result, the reviewer’s suggestion is no longer applicable.

      (3) If out of the set MB 4 / 5 / 6 MB4 was best, why did the authors not continue with a comparison including MB3 and MB2? It seems to me unlikely that the MB4 acquisition is actually optimal.

      Results: We appreciate the reviewer’s suggestions. In this revision, we decreased the MB factor to 3, as it allowed us to increase the in-plane acceleration rate to 3, thereby shortening the TE. The resulting sensitivity for both individual and group-level results is detailed in earlier responses, such as the response to Q16 for Reviewer #2.

      (4) The formatting of the references is occasionally flawed, including first names and/or initials. Please consider using a reliable reference manager.

      We used Zotero as our reference manager in this revision to ensure consistency and accuracy. The references have been formatted according to the APA style.

      (5) In the caption of Figure 5, corrected and uncorrected p values are identical. What multiple comparisons correction was made here? A multiple comparisions over voxels (as is standard) would usually lead to a cut-off ~z=3.2. That would remove most of the 'responses' shown in figure 5.

      We appreciate the reviewer’s comment. The original results presented in Figure 5 have been removed in the revised manuscript, making this comment no longer applicable.

    1. Author response:

      The following is the authors’ response to the original reviews.

      Public Reviews:

      Reviewer #1 (Public Review):

      Summary:

      In this study, Millard and colleagues investigated if the analgesic effect of nicotine on pain sensitivity, assessed with two pain models, is mediated by Peak Alpha Frequency (PAF) recorded with resting state EEG. The authors found indeed that nicotine (4 mg, gum) reduced pain ratings during phasic heat pain but not cuff pressor algometry compared to placebo conditions. Nicotine also increased PAF (globally). However, mediation analysis revealed that the reduction in pain ratings elicited by the phasic heat pain after taking nicotine was not mediated by the changes in PAF. Also, the authors only partially replicated the correlation between PAF and pain sensitivity at baseline (before nicotine treatment). At the group-level no correlation was found, but an exploratory analysis showed that the negative correlation (lower PAF, higher pain sensitivity) was present in males but not in females. The authors discuss the lack of correlation.

      In general, the study is rigorous, methodology is sound and the paper is well-written. Results are compelling and sufficiently discussed.

      Strengths:

      Strengths of this study are the pre-registration, proper sample size calculation, and data analysis. But also the presence of the analgesic effect of nicotine and the change in PAF.

      Weaknesses:

      It would even be more convincing if they had manipulated PAF directly.

      We thank Reviewer #1 for their positive and constructive comments regarding our study. We appreciate the view that the study was rigorous and methodologically sound, that the paper was well-written, and that the strengths included our pre-registration, sample size calculation, and data analysis.

      In response to the reviewer's comment about more directly manipulating Peak Alpha Frequency (PAF), we agree that such an approach could provide a more direct investigation of the role of PAF in pain processing. We chose nicotine to modulate PAF as the literature suggested it was associated with a reliable increase in PAF speed. As mentioned in our Discussion, there are several alternative methods to manipulate PAF, such as non-invasive brain stimulation techniques (NIBS) like transcranial alternating current stimulation (tACS) or neurofeedback training. These approaches could help clarify whether a causal relationship exists between PAF and pain sensitivity. Although methods such as NIBS still require further investigation as there is little evidence for these approaches changing PAF (Millard et al., 2024).

      Reviewer #2 (Public Review):

      Summary:

      The study by Millard et al. investigates the effect of nicotine on alpha peak frequency and pain in a very elaborate experimental design. According to the statistical analysis, the authors found a factor-corrected significant effect for prolonged heat pain but not for alpha peak frequency in response to the nicotine treatment.

      Strengths:

      I very much like the study design and that the authors followed their research line by aiming to provide a complete picture of the pain-related cortical impact of alpha peak frequency. This is very important work, even in the absence of any statistical significance. I also appreciate the preregistration of the study and the well-written and balanced introduction. However, it is important to give access to the preregistration beforehand.

      Weaknesses:

      The weakness of the study revolves around three aspects:

      (1) I am not entirely convinced that the authors' analysis strategy provides a sufficient signal-tonoise ratio to estimate the peak alpha frequency in each participant reliably. A source separation (ICA or similar) would have been better suited than electrode ROIs to extract the alpha signal. By using a source separation approach, different sources of alpha (mu, occipital alpha, laterality) could be disentangled.

      (2) Also, there's a hint in the literature (reference 49 in the manuscript) that the nicotine treatment may not work as intended. Instead, the authors' decision to use nicotine to modulate the peak alpha frequency and pain relied on other, not suitable work on chronic pain and permanent smokers. In the present study, the authors use nicotine treatment and transient painful stimulation on nonsmokers.

      (3) In my view, the discussion could be more critical for some aspects and the authors speculate towards directions their findings can not provide any evidence. Speculations are indeed very important to generate new ideas but should be restricted to the context of the study (experimental pain, acute interventions). The unfortunate decision to use nicotine severely hampered the authors' aim of the study.

      Impact:

      The impact of the study could be to show what has not worked to answer the research questions of the authors. The authors claim that their approach could be used to define a biomarker of pain. This is highly desirable but requires refined methods and, in order to make the tool really applicable, more accurate approaches at subject level.

      We thank reviewer #2 for their recognition of the study’s design, the importance of this research area, and the pre-registration of our study. In response to the weaknesses highlighted:

      (1) We appreciate the reviewer’s suggestion to improve the signal-to-noise ratio by applying source separation techniques, such as ICA, which have now been performed and incorporated into the manuscript. Our original decision to use sensor-level ROIs followed the precedent set in previous studies, our rationale being to improve reproducibility and avoid  biases from picking individual electrodes or manually picking sources. We have  added analyses using an automated pipeline that selects components based on the presence of a peak in the alpha range and alignment with a predefined template topography representing sensorimotor sites. Here again we found no significant differences in the mediation results that used a sensor space sensorimotor ROI, further supporting the robustness of the chosen approach. ICA could still potentially disentangle different sources of alpha, such as occipital alpha and mu rhythm, and provide new insights into the PAF-pain relationship. We have now added a discussion in the manuscript about the potential advantages of source separation techniques and suggest that the possible contributions of separate alpha sources be investigated and compared to sensor space PAF as a direction for future research.

      (2) We recognise the reviewer's concern regarding our choice of nicotine as a modulator of pain and alpha peak frequency (PAF). The meta-analysis by Ditre et al. (2016) indeed points to small effect sizes for nicotine's impact on experimental pain and highlights the potential for publication bias. However, our decision to use nicotine in this study was not primarily based on its direct analgesic effects, but rather on its well-documented ability to modulate PAF, in smoking and non-smoker populations, as outlined in our study aims.

      In this regard, the intentional use of nicotine was to assess whether changes in PAF could mediate alterations in pain. This approach aligns with the broader concept that a direct effect of an intervention is not necessary to observe indirect effects (Fairchild & McDaniel, 2017). We have, however, revised our introduction to further clarify this rationale, highlighting that nicotine was used as a tool for PAF modulation, not solely for its potential analgesic properties.

      (3) We agree with the reviewer’s observation that certain aspects of the Discussion could be more cautious, particularly regarding speculations about nicotine’s effects and PAF as a biomarker of pain. We have revised the Discussion to ensure that our interpretations are better grounded in the data from this study, clearly stating the limitations and avoiding overgeneralization. This revision focuses on a more critical evaluation of the potential relationships between PAF, nicotine, and pain sensitivity based solely on our experimental context.

      Finally, We also apologize for not providing access to the preregistration earlier. This was an oversight on our end, and we will ensure that future preregistrations are made available upfront.

      Reviewer #3 (Public Review):

      In this manuscript, Millard et al. investigate the effects of nicotine on pain sensitivity and peak alpha frequency (PAF) in resting state EEG. To this end, they ran a pre-registered, randomized, double-blind, placebo-controlled experiment involving 62 healthy adults who received either 4 mg nicotine gum (n=29) or placebo (n=33). Prolonged heat and pressure were used as pain models. Resting state EEG and pain intensity (assessed with a visual analog scale) were measured before and after the intervention. Additionally, several covariates (sex at birth, depression and anxiety symptoms, stress, sleep quality, among others) were recorded. Data was analyzed using ANCOVAequivalent two-wave latent change score models, as well as repeated measures analysis of variance. Results do not show *experimentally relevant* changes of PAF or pain intensity scores for either of the prolonged pain models due to nicotine intake.

      The main strengths of the manuscript are its solid conceptual framework and the thorough experimental design. The researchers make a good case in the introduction and discussion for the need to further investigate the association of PAF and pain sensitivity. Furthermore, they proceed to carefully describe every aspect of the experiment in great detail, which is excellent for reproducibility purposes. Finally, they analyse the data from almost every possible angle and provide an extensive report of their results.

      The main weakness of the manuscript is the interpretation of these results. Even though some of the differences are statistically significant (e.g., global PAF, pain intensity ratings during heat pain), these differences are far from being experimentally or clinically relevant. The effect sizes observed are not sufficiently large to consider that pain sensitivity was modulated by the nicotine intake, which puts into question all the answers to the research questions posed in the study.

      We would like to express our gratitude to Reviewer #3 for their thoughtful and constructive review, including the positive feedback on the strengths of our study's conceptual framework, experimental design, and thorough methodological descriptions.

      We acknowledge the concern regarding the experimental and clinical relevance of some statistically significant results (e.g., global PAF and pain intensity during heat pain) and agree that small effect sizes may limit their practical implications. However, our primary goal was to assess whether nicotine-induced changes in PAF mediate pain changes, rather than to demonstrate large direct effects on pain sensitivity. Nicotine was chosen for its known ability to modulate PAF, and our focus was on the mechanistic role of PAF in pain perception. To clarify this, we have revised the discussion to better differentiate between statistical significance, experimental relevance, and clinical applicability. We emphasize that this study represents a preliminary step towards understanding PAF’s mechanistic role in pain, rather than a direct clinical application.

      We appreciate the suggestion to refine our interpretation. We have adjusted our language to ensure it aligns with the effect sizes observed and made recommendations for future research, such as testing different nicotine doses, to potentially uncover stronger or more clinically relevant effects.

      Although modest, we believe these findings offer valuable insights into the potential mechanisms by which nicotine affects alpha oscillations and pain. We have also discussed how these small effects could become more pronounced in different populations (e.g., chronic pain patients) and over time, offering guidance for future research on PAF modulation and pain sensitivity.

      Recommendations for the authors:

      Reviewer #2 (Recommendations For The Authors):

      I have a number of points that the authors may want to consider for this or future work.

      (1) By reviewing the literature provided by the authors in the introduction I think that using nicotine as a means to modulate pain and alpha peak frequency was a mistake. The only work that may give a hint on whether nicotine can modulate experimental pain is the meta-analysis by Ditre and colleagues (2016). They suggest that their small effect may contain a publication bias. I think the other "large body of evidence" is testing something else than analgesia.

      Thank you for your consideration of our choice of nicotine in the study. The meta-analysis by Ditre and colleagues (2016) suggests small effect sizes for nicotine's impact on experimental pain, compared to the moderate effects claimed in some papers, especially when accounting for the potential publication bias you mentioned. However, our selection of nicotine was primarily driven by its documented ability to modulate PAF rather than its direct analgesic effects, as clearly stated in our aims. Therefore, we do not view our decision to use nicotine as a mistake; instead, it was aligned with our goal of assessing whether changes in PAF mediate alterations in pain and thus served as a valuable tool. This perspective aligns with the broader concept that a direct effect is not a prerequisite for observing indirect effects of an intervention on an outcome (Fairchild &

      McDaniel, 2017). To further enhance clarity, we've revised the introduction to emphasize the role of nicotine in manipulating PAF in relation to our study's aims.

      Previously we wrote: “A large body of evidence suggests that nicotine is an ideal choice for manipulating PAF, as both nicotine and smoking increase PAF speed [37,40–47] as well as pain thresholds and tolerance [48–52].” This has been changed to read: “Because evidence suggests that nicotine can modulate PAF, where both nicotine and smoking increase PAF speed [37,40–47], we chose nicotine to assess our aim of whether changes in PAF mediate changes in pain in a ‘mediation by design’ approach [48]. In addition, given evidence that nicotine may increase experimental pain thresholds and tolerance [49–53], nicotine could also influence pain ratings during tonic pain.”

      (2) As mentioned above, the OSF page is not accessible.

      We apologise for this. We had not realised that the pre-registration was under embargo, but we have now made it available.

      (3) I generally struggle with the authors' approach to investigating alpha. With the approach the authors used to detect peak alpha frequency it might be that the alpha signal may just show such a low amplitude that it is impossible to reliably detect it at electrode level. In my view, the approach is not accurate enough, which can be seen by the "jagged" shape of the individual alpha peak frequency. In my view, a source separation technique would have been more useful. I wonder which of the known cortical alphas contributes to the effects the authors have reported previously: occipital, mu rhythms projections or something else? A source separation approach disentangles the different alphas and will increase the SNR. My suggestion would be to work on ICA components or similar approaches. The advantage is that the components are almost completely free of any artefacts. ICAs could be run on the entire data or separately for each individual. In the latter case, it might be that some participants do not exhibit any alpha component.

      We appreciate your thoughtful consideration of our approach to investigating alpha. The calculation of PAF involves various methods and analysis steps across the literature (Corcoran et al., 2018; Gil Avila et al., 2023; McLain et al., 2022). Your query about which known cortical alphas contribute to reported effects is important. Initially focusing on a sensorimotor component from an ICA in Furman et al., 2018, subsequent work from our labs suggested a broader relationship between PAF and pain across the scalp (Furman et al., 2019; Furman et al., 2020; Millard et al., 2022), and a desire to conduct analyses at the sensor level in order to improve the reproducibility of the methods (Furman et al., 2020). However, based on your comment we have made several additions to the manuscript, including: explaining why we did not use manual ICA methods, suggest this for future research, and added an exploratory analysis using a recently developed automated pipeline that selects components based on the presence of a peak in the alpha range and alignment with a predefined template topography representing activity from occipital or motor sites.

      While we acknowledge that ICA components can offer a better signal-to-noise ratio (SNR) and possibly smoother spectral plots, we opted for our chosen method to avoid potential bias inherent in deciding on a component following source separation. The desire for a quick, automated, replicable, and unbiased pipeline, crucial for potential clinical applications of PAF as a biomarker, influenced this decision. At the time of analysis registration, automated methods for deciding which alpha components to extract following ICA were not apparent. We have now added this reasoning to Methods.

      “Contrary to some previous studies that used ICA to isolate sensory region alpha sources (Furman et al., 2018; De Martino et al., 2021; Valentini et al., 2022), we used pre-determined sensor level ROIs to improve reproducibility and reduce the potential for bias when individually selecting ICA components. Using sensor level ROIs may decrease the signal-to-noise ratio of the data; however, this approach has still been effective for observing the relationship between PAF and experimental pain (Furman et al., 2019; Furman et al., 2020).”

      We have also added use of ICA and development of methods as a suggestion for future research in the discussion:

      “Additionally, the use of global PAF may have introduced mediation measurement error into our mediation analysis. The spatial precision used in the current study was based on previous literature on PAF as a biomarker of pain sensitivity, which have used global and/or sensorimotor ROIs (Furman et al., 2018; Furman et al., 2020). Identification and use of the exploratory electrode clusters found in this study could build upon the current work (e.g., Furman et al., 2021). However, exploratory analysis of the clusters found in the present analysis demonstrated no influence on mediation analysis results (Supplementary Materials 3.8-3.10). Alternatively, independent component analysis (ICA) could be used to identify separate sources of alpha oscillations (Choi et al., 2005), as used in other experimental PAF-pain studies (Furman et al., 2018; Valentini et al., 2022), which could aid to disentangle the potential relevance of different alpha sources in the PAFpain relationship. Although this comes with the need to develop more reproducible and automated methods for identifying such components.”

      The specific location or source of PAF that relates to pain remains unclear. Because of this, we did employ an exploratory cluster-based permutation analysis to assess the potential for variations in the presence of PAF changes across the scalp at sensor level, and emphasise that location of PAF change could be explored in future. However, we have now conducted the mediation analysis (difference score 2W-LCS model) using averages from the data-driven parietal cluster, frontal cluster, and both clusters together. For these we see a stronger effect of gum on PAF change, which was expected given the data driven approach of picking electrodes. There was still a total and direct effect of nicotine on pain during the PHP model, but still no indirect effect via change in PAF. For the CPA models, there were still no significant total, direct, or indirect effects of nicotine on CPA ratings. Therefore, using these data-driven clusters did not alter results compared to the model using the global PAF variable.

      The reader has been directed to this supplementary material so:

      “The potential mediating effect of this change in PAF on change in PHP and CPA was explored (not pre-registered) by averaging within each cluster (central-parietal: CP1, CP2, Cpz, P1, P2, P3, P4, Pz, POz; right-frontal: F8, FT8, FT10) and across both clusters. This averaging across electrodes produced three new variables, each assessed in relation to mediating effects on PHP and CPA ratings. The resulting in six exploratory mediation analysis (difference score 2W-LCS) models demonstrated minimal differences from the main analysis of global PAF (8-12 Hz), except for the

      expected stronger effect of nicotine on change in PAF (bs = 0.11-0.14, ps < .003; Supplementary

      Materials 3.8-3.10).”

      Moreover, our team has been working on an automated method for selecting ICA components, so in response to your comment we assessed whether using this method altered the results of the current analysis. The in-depth methodology behind this new automatic pipeline will be published with a validation from some co-authors in the current collaboration in due course. At present, in summary, this automatic pipeline conducts independent component analysis (ICA) 10 times for each resting state, and selects the component with the highest topographical correlation to a template created of a sensorimotor alpha component from Furman et al., (2018). 

      The results of the PHP or CPA mediation models were not substantially different using the PAF calculated from independent components than that using the global PAF. For the PHP model, the total effect (b = -0.648, p \= .033) and direct effects (b = -0.666, p \= .035) were still significant, and there was still no significant indirect effect (b = 0.018, p \= .726). The general fit was reduced, as although the CFI was above 0.90, akin to the original model, the RMSEA and SRMR were not below 0.08, unlike the original models (Little, 2013). For the CPA model, there were still no significant total (b = -0.371, p \= .357), direct (b = -0.364, p \= .386), or indirect effects (b = -0.007, p \= .906), and the model fit also decreased, with CFI below 0.90 and RMSEA and SRMR above 0.08. See supplementary material (3.11). Note that still no correlations were seen between this IC sensorimotor PAF and pain (PHP: r = 0.11, p = .4; CPA: r \= -0.064, p = .63).

      Interestingly, in both models, there was now no longer a significant a-path (PHP: b = 0.08, p =

      0.292; CPA: b = 0.039, p = 0.575), unlike previously observed (PHP: b = 0.085, p = 0.018; CPA: b = 0.089, p = 0.011). We interpret this as supporting the previously highlighted difference between finding an effect on PAF globally but not in a sensorimotor ROI (and now a sensorimotor IC), justifying the exploratory CBPA and the suggestion in the discussion to explore methodology.

      We understand that this analysis does not fully uncover the reviewer’s question in which they wondered which of the known cortical alphas contributes to the effects reported in our previous work. However, we consider this exploration to be beyond the scope of the current paper, as it would be more appropriately addressed with larger datasets or combinations of datasets, potentially incorporating MEG to better disentangle oscillatory sources. The highlighted differences seen between global PAF, sensorimotor ROI PAF, sensorimotor IC PAF, as well as the CBPA of PAF changes provide ample directions for future research to build upon: 1) which alpha (sensor or source space) are related to pain, 2) how are these alpha signals represented robustly in a replicable way, and 3) which alpha (sensor or source space) are manipulable through interventions. These are all excellent questions for future studies to investigate.

      The below text has been added to the Discussion:

      In-house code was developed to compare a sensorimotor component to the results presented in this manuscript (Supplementary Material 3.11), showing similar results to the sensorimotor ROI mediation analysis presented here. However, examination of which alpha - be it sensor or source space - are related to pain, how they can be robustly represented, and how they can be manipulated are ripe avenues for future study.

      (4) I have my doubts that you can get a reliable close to bell-shaped amplitude distribution for every participant. The argument that the peak detection procedure is hampered by the high-amplitude lower frequency can be easily solved by subtracting the "slope" before determining the peak. My issue is that the entire analysis is resting on the assumption that each participant has a reliable alpha effect at electrode level. This is not the case. Non-alpha participants can severely distort the statistics. ICA-based analyses would be more sensitive but not every participant will show alpha. You may want to argue with robust group effects but In my view, every single participant counts, particularly for this type of data analysis, where in the case of a low SNR the "peak" can easily shift to the extremes. In case there is an alpha effect for a specific subject, we should see a smooth bump in the frequency spectrum between 8 and 12 12Hz. Anything beyond that is hard to believe. The long stimulation period allows a broad FFT analysis window with a good frequency resolution in order to detect the alpha frequency bump.

      The reviewer is correct that non-alpha participants can distort the statistics. We did visually assess the EEG of each individual’s spectra at baseline to establish the presence of global peaks, as we believe this is good practice to aid understanding of the data. Please see Author response image 1 for individual spectra seen at baseline. Although not all participants had a ‘smooth bump in the frequency spectrum between 8 and 12 Hz’, we prefer to not apply/necessitate this assumption to our data. Chiang et al., (2011) suggest that ~3% of individuals do not have a discernible alpha peak, and in our data we observed only one participant without a very obvious spectral peak (px-39). But, this participant does have enough activity within the alpha range to identify PAF by the CoG method (i.e. not just flat spectra and activity on top of 1/f characteristics). Without a pre-registered and standardised decision process to remove such a participant in place, we opted to not remove any participants to avoid curation of our data.

      Author response image 1.

      (5) I find reports on frequent channel rejections reflect badly on the data quality. Bad channels can be avoided with proper EEG preparation. EEG should be continuously monitored during recording in order to obtain best data quality. Have any of the ROI channels been rejected?

      We appreciate your attention to the channel rejection. We believe that the average channels removed (0.94, 0.98, 0.74, and 0.87 [range: 0-4] for each of the four resting states out of 64 channels) does not suggest overly frequent rejection, as it was less than one electrode on average and the numbers are below the accepted number of bad channels to remove/interpolate (i.e. 10%) in EEG pipelines (Debnath et al., 2020; Kayhan et al., 2022). To maintain data quality, consistently poor channels were identified and replaced over time. We hope you will accept our transparency on this issue and note that by stating how channel removal decisions were made (i.e. 8 or more deviations) and reporting the number of channels removed, we adhere to the COBIDAS guidelines (Pernet et al., 2018; 2020).

      During analysis, cases of sensorimotor ROI channels being rejected were noted and are now specified in our manuscript. “Out of 248 resting states recorded, 14 resting states had 4 ROI channels instead of 5. Importantly, no resting state had fewer than 4 channels for the sensorimotor ROI.”

      Note, we also realised that we had not specified that we did interpolate channels for the cluster based permutation analysis. This has been corrected with the following sentence:

      “Removed channels were not interpolated for the pre-registered global and sensorimotor ROI averaged analyses, but were interpolated for an exploratory cluster based permutation analysis using the nearest neighbour average method in `Fieldtrip`.”

      (6) I have some issues buying the authors' claims that there is an effect of nicotine on prolonged pain. By looking at the mean results for the nicotine and placebo condition, this can not be right. What was the point in including the variables in the equation? In my view, in this within-subject design the effect of nicotine should be universal, no matter what gender, age, or depression. The unconditional effect of nicotine is close to zero. I can not get my head around how any of the variables can turn the effects into significance. There must be higher or lower variable scores that might be related to a higher or lower effect on nicotine. The question is not to consider these variables as a nuisance but to show how they modulate the pain-related effect of nicotine treatment. Still, the overall nicotine effect of the entire group is basically zero.

      Another point is that for within-subject analyses even tiny effects can become statistically significant if they are systematically in one direction. This might be the case here. There might be a significant effect of nicotine on pain but the actual effect size (5.73 vs. 5.78) is actually not interpretable. I think it would be interesting for the reader how (in terms of pain rating difference) each of the variables can change the effect of nicotine.

      Thank you for your comments. We recognize the concern about interpreting the effect of nicotine on prolonged pain solely based on mean results, and in fact wish to discourage this approach. It's crucial to note that both PAF and pain are highly individual measures (i.e. high inter-individual variance), necessitating the use of random intercepts for participants in our analyses to acknowledge the inherent variability at baseline across participants. Including random intercepts rather than only considering the means helps address the heterogeneity in baseline levels among participants. We also recognise that displaying the mean PHP ratings for all participants in Table 2 could be misleading, firstly because these means do not have weight in an analysis that takes into account a random-effects intercept for participants, and secondly because two participants (one from each group) did not have post-gum PHP assessments and were not included in the mediation analysis due to list-wise deletion of missing data. Therefore, to reduce the potential for misinterpretation, we have added extra detail to display both the full sample and CPA mediation analysis (i.e. N=62) and the data used for PHP mediation analysis (i.e. n=60) in Table 2. We hope that the extra details added to this table will help the readers interpretation of results.

      In light of this, we have also altered the PAF Table 3 to reflect both the pre-post values used for the CPA mediation and baseline correlations with CPA and PHP pain (i.e. N=62), and the pre-post values used for the PHP mediation (i.e. n=60).

      It is inherently difficult to visualise the findings of a mediation analysis with confounding variables that also used latent change scores (LCS) and random-effect intercepts for participants. LCS was specifically used because of issues of regression to the mean that occur if you calculate a straightforward ‘difference-score’, therefore calculating the difference in order to demonstrate the results of the statistical model in a figure, for example, does not provide a full description of the data assessed (Valente & McKinnon, 2017). Nevertheless, if we look at the data descriptively with this in mind, then calculating the change in PHP ratings does indicate that, for the nicotine group, the mean change in PHP ratings was -0.047 (SD = 1.05, range: -4.13, 1.45). Meanwhile, for the placebo group the mean change in PHP ratings was 0.33 (SD = 0.75, range: -1.37, 1.66). Therefore suggesting a slight decrease in pain ratings on average for the nicotine group compared to a slight increase on average for the placebo group. With control for pre-determined confounders, we found that the latent change score was -0.63 lower for the nicotine group compared to the control group (i.e. the direct effect of nicotine on change in pain).

      If the reviewer is only discussing the effect of nicotine on pain, we do not believe that this effect ‘should be universal’. There is clear evidence that effects of nicotine on other measures can vary greatly across individuals (Ettinger et al., 2009; Falco & Bevins, 2015; Pomerleau et al., 1995). Our intention would not be to propose a universal effect but to understand how these variables may influence nicotine's impact on pain for individuals. Here we focus on the effects of nicotine on PAF and pain sensitivity, but attempted to control for the potential influence of these other confounding factors. Therefore, our statistical approach goes beyond mean values, incorporating variables like sex at birth, age, and depression to control for and explore potential modulating factors. Control for confounding factors is an important aspect of mediation analysis (Lederer et al., 2019; VanderWeele, 2019).

      Regarding the seemingly small effect size, we understand your concern. Indeed ‘tiny effects can become statistically significant if they are systematically in one direction’, which may be what we see in this analysis. We do not agree that the effect is ‘not interpretable’, rather that it should be interpreted in light of its small effect size (effect size being the beta coefficient in our analysis, rather than the mean group difference). We agree on the importance of considering practical significance alongside statistical significance and hope to conduct additional experiments and analyses in future to elucidate the contribution of each variable to the subtle and therefore not entirely conclusive overall effect you mention.

      Your feedback on this is valuable, and we have ensured a more detailed discussion in the revised manuscript on how these factors should be interpreted alongside some additional post-hoc analyses of confounding factors that were significant in our mediation, with the note that investigation of these interactions is exploratory. We had already discussed the potential contribution of sex on the effect of nicotine on PAF, with exploratory post-hoc analysis on this included in supplementary materials. In addition, we have now added an exploratory post-hoc analysis on the potential contribution of stress on the effect of nicotine on pain. This then shows the stratified effects by the covariates that our model suggest are influencing change in PAF and pain.

      Results edits:

      “There was also a significant effect of perceived stress at baseline on change in PHP ratings when controlling for group allocation and other confounding variables (b = -0.096, p = .048, bootstrapped 95% CI: [-0.19, -0.000047]), where higher perceived stress resulted in larger decreases in PHP ratings (see Supplementary Material 3.3 for post-hoc analysis of stress).”

      Supplementary material addition:

      “3.3 Exploratory analysis of the influence of perceived stress on the effects of nicotine on change in PHP ratings “

      “Due to the significant estimated effects of perceived stress on change in PHP ratings in the 2WLCS mediation model, we also explored post-hoc effects of stress on change in PHP ratings. We found that there is strong evidence for a negative correlation between stress and change in PHP rating within the nicotine group (n = 28, r = −0.39, BF10 = 13.65; Figure 3) that is not present in the placebo group, with equivocal evidence (n = 32, r = −0.14, BF10 = 0.46). This suggests that those with higher baseline stress who had nicotine gum experienced greater decreases in PHP ratings. Note that there was less, but still sufficient evidence for this relationship within the nicotine group when the participant who was a potential outlier for change in PHP rating was removed (n = 27, r = −0.32, BF10 = 1.45). “

      Author response image 2.

      Spearman correlations od baseline perceived stress with the change in phasic heat pain (PHP) ratings, suggest strong evidence for a negative relationship for the nicotine gum groupin orange (n=28; BF<sub>10</sub>=13.65) but not for the placebo group in grey (n=32; BF<sub>10</sub>=0.46). Regression lines and 95% confidence intervals.

      Discussion edits:

      “For example, in addition to the effect of nicotine on prolonged heat pain ratings, our results suggest an effect of stress on changes in heat pain ratings, with those self-reporting higher stress at baseline having greater reductions in pain. Our post-hoc analysis suggested that this relationship between higher stress and larger decrease in PHP ratings was only present for the nicotine group (Supplementary Material 3.3). As stress is linked to nicotine use [69,70] and pain [71–73], these interactions should be explored in future.”

      (7) Is the differential effect of nicotine vs. placebo based on the pre vs. post treatment effect of the placebo condition or on the pre vs. post effect of the nicotine treatment? Can the mediation model be adapted and run for each condition separately? The placebo condition seems to have a stronger effect and may have driven the result.

      Thank you for your comments. In our mediation analysis, the differential effect of nicotine vs. placebo is assessed as a comparison between the pre-post difference within each condition. A latent change score (i.e. pre-post) is calculated for each condition (nicotine and placebo), and then the effect of being in the nicotine group (dummy coded as 1) is compared to being in the placebo group (dummy coded as 0). The comparison between conditions is needed for this model (Valente & MacKinnon, 2017), as we are assessing the change in PAF and pain in the nicotine group compared to the change in the placebo group.

      However, to address your response, it is possible to simplify and assess the relationship between the change in peak alpha frequency (PAF) and change in pain within each gum group (nicotine and placebo) independently, without including the intervention as a factor. To do this, the mediation model can be simplified to regression analysis with latent change scores that focus purely on these relationships. The results of this can help to understand whether change in PAF influences change in pain within each group separately. As with the main analysis, we see no significant influence of change in PAF on change in pain while controlling for the same confounding variables within the nicotine group (Beta = -0.146 +/- 1.105, p = 0.895, 95% CI: -2.243, 2.429) or the placebo group (Beta = 0.730 +/- 2.061, p = 0.723, 95% CI: -4.177, 3.625).

      When suggesting that the “the placebo condition seems to have a stronger effect and may have driven the result”, we believe you are referring to the increase in mean PHP ratings within the placebo group from pre (5.51 +/- 2.53) to post-placebo gum (5.84 +/- 2.67). Indeed there was a significant increase in pain ratings pre to post chewing placebo gum (t(31) = -2.53, p = 0.0165, 95% CI: -0.603, -0.0653), that was not seen after chewing nicotine gum (t(27) = 0.237, p = 0.81, 95% CI: -0.358, 0.452). In lieu of a control where no gum was chewed (i.e. simply a second pain assessment ~30 minutes after the first), we assume the gum without nicotine is a good reference that controls for the effect of time plus expectation of chewing nicotine gum. With this in mind, as we describe in our results, the change in PHP ratings is reduced in the nicotine group compared to the placebo group. Note that this phrasing keeps the effect of placebo on pain as our reference from which to view the effect of nicotine on pain. However, you are correct that we need to ensure we emphasise that the change in pain in the PHP group is reduced in comparison to the change seen after placebo.

      We have not included these extra statistics in our revised manuscript, but hope that they aid the your understanding and interpretation of the included analyses and have highlighted these nuances in the discussion.

      “However, we note that the observed effect of nicotine on pain was small in magnitude, and most prominent in comparison to the effect of placebo, where pain ratings increased after chewing, which brings into question whether this reduction in pain is meaningful in practice.”

      (8) I would not dare to state that nicotine can function as an acute analgesic. Acute analgesics need to work for everyone. The average effect here is close to zero.

      In light of your feedback, we have refined our language to avoid a sweeping assertion of universal analgesic effects and emphasize individual variability. Nicotine's role as a coping strategy for pain is acknowledged in the literature (Robinson et al., 2022), with the meta-analysis by Ditre et al. (2016) discussing its potential as an acute analgesic in humans, along with some evidence from animal research (Zhang et al., 2020). Our revised discussion underscores the need for further exploration into factors influencing nicotine's potential impact on pain. We have also specified the short-term nature of nicotine use in this context to distinguish acute effects from potential opposing effects after long-term use (Zhang et al., 2020).

      “Short-term nicotine use is thought to have acute analgesic properties in experimental settings, with a review reporting that nicotine increased pain thresholds and pain tolerance [49]. In addition, research in a rat model suggests analgesic effects on mechanical thresholds after short-term nicotine use (Zhang et al., 2020). However, previous research has not assessed the acute effects of nicotine on prolonged experimental pain models. The present study found that 4 mg of nicotine reduced heat pain ratings during prolonged heat pain compared to placebo for our human participants, but that prolonged pressure pain decreased irrespective of which gum was chewed. Our findings are thus partly consistent with the idea that nicotine may have acute analgesic properties [49], although further research is required to explore factors that may influence nicotine’s potential impact on a variety of prolonged pain models. We further advance the literature by reporting this effect in a

      model of prolonged heat pain, which better approximates the experience of clinical pain than short lasting models used to assess thresholds and tolerance [50]. However, we note that the observed effect of nicotine on pain was small in magnitude, and most prominent in comparison to the effect of placebo, where pain ratings increased after chewing, which brings into question whether this reduction in pain is meaningful in practice. Future research should examine whether effects on pain increase in magnitude with different nicotine administration regimens (i.e. dose and frequency).”

      (9) Figures 2E and 2F are not particularly intuitive. Usually, the colour green in "jet" colour coding is being used for "zero" values. I would suggest to cut off the blue and use only the range between red green and red.

      We have chosen to retain the current colour scale for several reasons. In our analysis, green represents the middle of the frequency range (approx 10 Hz in this case), and if we were to use green as zero, it would effectively remove both blue and green from the plot, resulting in only red shades. Additionally, we have provided a clear colour scale for reference next to the plot, which allows readers to interpret the data accurately. Our intention is to maintain clarity and precision in representing the data, rather than conforming strictly to conventional practices in color coding.

      We believe that the current representation effectively conveys the results of our study while allowing readers to interpret the data within the context provided. Thank you again for your suggestion, and we hope you understand our reasoning in this matter.

      (10) Did the authors do their analysis on the parietal ROI or on the pre-registerred ROI?

      The analysis was conducted on the pre-registered sensorimotor ROI and on the global values. We have now also conducted the analysis with the regions suggested with the cluster based permutation analysis as requested by reviewer 2, comment 3.

      (11) Point 3.2 in the discussion. I would be very cautious to discuss smoking and chronic pain in the context of the manuscript. The authors can not provide any additional knowledge with their design targeting non-smokers, acute nicotine and experimental pain. The information might be interesting in the introduction in order to provide the reader with some context but is probably misleading in the discussion.

      We appreciate your perspective and agree with your caution regarding the discussion of smoking and chronic pain. While our study specifically targets non-smokers and focuses on acute nicotine effects in experimental pain, we understand the importance of contextual clarity. We have removed these points from the discussion to not mislead the reader.

      Previously we wrote, and have removed: “For those with chronic pain, smoking and nicotine use is reported as a coping strategy for pain [52]; abstinence can increase pain sensitivity [48,50], and pain is thus seen as a barrier to smoking cessation due to fear of worsening pain [51,52]. Therefore, continued understanding of the acute effects of nicotine on models of prolonged pain could improve understanding of the role of nicotine and smoking use in chronic pain [49,51,52].”

      (12) I very much appreciate section 3.3 of the discussion. I would not give up on PAF as a target to modulate pain. A modulation might not be possible in such a short period of experimental intervention. PAF might need longer and different interventions to gradually shift in order to attenuate the intensity of pain. As discussed by the authors themselves, I would also consider other targets for alpha analysis (as mentioned above not other electrodes or ROIs but separated sources.)

      Thank you for your comments on section 3.3. We appreciate your recognition of the potential significance of PAF as a target for pain modulation. Your insights align with our considerations that the experimental intervention duration or type might be a limiting factor in observing substantial shifts in PAF to attenuate pain intensity. We had mentioned the use of the exploratory electrode clusters in future work, but have now also mentioned that the use of ICA to identify separate ICA sources may provide an alternative approach. See responses to your previous ICA comment regarding separate sources.

      REFERENCES for responses to reviewer 2

      Chiang, A. K. I., Rennie, C. J., Robinson, P. A., Van Albada, S. J., & Kerr, C. C. (2011). Age trends and sex differences of alpha rhythms including split alpha peaks. Clinical Neurophysiology, 122(8), 1505-1517.

      Debnath, R., Buzzell, G. A., Morales, S., Bowers, M. E., Leach, S. C., & Fox, N. A. (2020). The Maryland analysis of developmental EEG (MADE) pipeline. Psychophysiology, 57(6), e13580.

      Ettinger, U., Williams, S. C., Patel, D., Michel, T. M., Nwaigwe, A., Caceres, A., ... & Kumari, V. (2009). Effects of acute nicotine on brain function in healthy smokers and non-smokers: estimation of inter-individual response heterogeneity. Neuroimage, 45(2), 549-561.

      Falco, A. M., & Bevins, R. A. (2015). Individual differences in the behavioral effects of nicotine: a review of the preclinical animal literature. Pharmacology Biochemistry and Behavior, 138, 80-90.

      Kayhan, E., Matthes, D., Haresign, I. M., Bánki, A., Michel, C., Langeloh, M., ... & Hoehl, S. (2022). DEEP: A dual EEG pipeline for developmental hyperscanning studies. Developmental cognitive neuroscience, 54, 101104.

      Lederer, D. J., Bell, S. C., Branson, R. D., Chalmers, J. D., Marshall, R., Maslove, D. M., ... & Vincent, J. L. (2019). Control of confounding and reporting of results in causal inference studies. Guidance for authors from editors of respiratory, sleep, and critical care journals. Annals of the American Thoracic Society, 16(1), 22-28.

      Little TD. Longitudinal structural equation modeling. Guilford press; 2013.

      Pernet, C., Garrido, M., Gramfort, A., Maurits, N., Michel, C. M., Pang, E., ... & Puce, A. (2018). Best practices in data analysis and sharing in neuroimaging using MEEG.

      Pernet, C., Garrido, M. I., Gramfort, A., Maurits, N., Michel, C. M., Pang, E., ... & Puce, A. (2020). Issues and recommendations from the OHBM COBIDAS MEEG committee for reproducible EEG and MEG research. Nature neuroscience, 23(12), 1473-1483.

      Pomerleau, O. F. (1995). Individual differences in sensitivity to nicotine: implications for genetic research on nicotine dependence. Behavior genetics, 25(2), 161-177.

      Robinson, C. L., Kim, R. S., Li, M., Ruan, Q. Z., Surapaneni, S., Jones, M., ... & Southerland, W. (2022). The Impact of Smoking on the Development and Severity of Chronic Pain. Current Pain and Headache Reports, 26(8), 575-581.

      Xia, J., Mazaheri, A., Segaert, K., Salmon, D. P., Harvey, D., Shapiro, K., ... & Olichney, J. M. (2020). Event-related potential and EEG oscillatory predictors of verbal memory in mild cognitive impairment. Brain communications, 2(2), fcaa213.

      VanderWeele, T. J. (2019). Principles of confounder selection. European journal of epidemiology, 34, 211-219.

      Valente, M. J., & MacKinnon, D. P. (2017). Comparing models of change to estimate the mediated effect in the pretest–posttest control group design. Structural Equation Modeling: A Multidisciplinary Journal, 24(3), 428-450.

      Vimolratana, O., Aneksan, B., Siripornpanich, V., Hiengkaew, V., Prathum, T., Jeungprasopsuk, W., ... & Klomjai, W. (2024). Effects of anodal tDCS on resting state eeg power and motor function in acute stroke: a randomized controlled trial. Journal of NeuroEngineering and Rehabilitation, 21(1), 1-15.

      Zhang, Y., Yang, J., Sevilla, A., Weller, R., Wu, J., Su, C., ... & Candiotti, K. A. (2020). The mechanism of chronic nicotine exposure and nicotine withdrawal on pain perception in an animal model. Neuroscience letters, 715, 134627.

      Reviewer #3 (Recommendations For The Authors):

      Introduction

      (1) Rationale and link to chronic pain. I am not sure I agree with the statement "The ability to identify those at greater risk of developing chronic pain is limited". I believe there is an abundance of literature associating risk factors with the different instances of chronic pain (e.g., Mills et al., 2019). The fact that the authors cite studies involving potential neuroimaging biomarkers leads me to believe that they perhaps did not intend to make such a broad statement, or that they wanted to focus on individual prediction instead of population risk.

      We thank the reviewer for the thought put into this comment. We did indeed wish to refer to individual prediction, but also realise that the focus on predicting pain might not be the most appropriate opening for this manuscript. Therefore, we have adjusted the below sentence to refer to the need to identify modifiable factors rather than the need to predict pain.

      “Identifying modifiable factors that influence pain sensitivity could be a key step in reducing the presence and burden of chronic pain (van der Miesen et al., 2019; Davis et al., 2020; Tracey et al., 2021).”

      (2) The statement "Individual peak alpha frequency (PAF) is an electro-physiological brain measure that shows promise as a biomarker of pain sensitivity, and thus may prove useful for predicting chronic pain development" is a non sequitur. PAF may very well be a biomarker of pain sensitivity, but the best measures of pain sensitivity we have (selfreported pain intensity ratings) in general are not in themselves predictive of the development of chronic pain. Conversely, features that are not related to pain sensitivity could be useful for predicting chronic pain (e.g., Tanguay-Sabourin et al., 2023).

      We agree that it is essential to acknowledge that self-reported pain intensity ratings alone are not definitive predictors of chronic pain development. To align with this, we have revised the sentence, removing the second clause to avoid overstatement. The adjusted sentence now reads, "Individual peak alpha frequency (PAF) is an electrophysiological brain measure that shows promise as a biomarker of pain sensitivity."

      (3) Finally, some of the statements in the discussion comparing a tonic heat pain model with chronic neuropathic pain might be an overstatement. Whereas it is true that some of the descriptors are similar, the time courses and mechanisms are vastly different.

      We appreciate this comment, and agree that it is difficult to compare the heat pain model used to clinical neuropathic pain. This was an oversight and with further understanding we have removed this comment from the introduction and the discussion:

      “In parallel, we saw no indication of a relationship between PAF and pain ratings during CPA. The introduction of the CPA model, specifically calibrated to a moderate pain threshold, provides further support for the notion that the relationship between PAF and pain is specific to certain pain types [17,28]. Prolonged heat pain was pre-dominantly described as moderate/severe shooting, sharp, and hot pain, whereas prolonged pressure pain was predominantly described as mild/moderate throbbing, cramping, and aching in the present study. It is possible that the PAF–pain relationship is specific to particular pain models and protocols [12,17].”

      Methodology

      (4) or the benefit of good science. However, I am compelled to highlight that I could not access the preregistered files, even though I waited for almost two weeks after requesting permission to do so. This was a problem on two levels: the main one is that I could not check the hypothesized effect sizes of the sample size estimation, which are not only central to my review, and in general negate all the benefits that should go with preregistration (i.e., avoiding phacking, publication bias, data dredging, HARKing, etc.). The second one is that I had to provide an email address to request access. This allows the authors to potentially identify the reviewers. Whereas I have no issues with this and I support transparent peer review practices (https://elifesciences.org/inside-elife/e3e90410/increasingtransparency-in-elife-s-review-process), I also note that this might condition other reviewers.

      We apologise for this. We had not realised that the pre-registration was under embargo, but we have now made it available.

      Interpretation of results

      (5)To be perfectly clear, I trust the results of this study more than some of the cited studies regarding nicotine and pain because it was preregistered, the sample size is considerably larger, and it seems carefully controlled. I just do not agree with the interpretation of the results, stated in the first paragraph of the Discussion. Quoting J. Cohen, "The primary product of a research inquiry is one or more measures of effect size, not P values" (Cohen, 1990). As I am sure the authors are aware of, even tiny differences between conditions, treatments or groups will eventually be statistically significant given arbitrarily large sample sizes. What really matters then is the magnitude of these differences. In general, the authors hypothesize on why there were no differences on the pressure pain model, and why decreases in heat pain were not mediated by PAF, but do not seem to consider the possibility that the intervention just did not cause the intended effect on the nociceptive system, which would be a much more straightforward explanations for all observations.

      While acknowledging and agreeing with the concern that 'even tiny differences between conditions, treatments, or groups will eventually be statistically significant given arbitrarily large sample sizes,' it's crucial to clarify that our sample size of N=62 does not fall into the category of arbitrarily large. We carefully considered the observed outcomes in the pressure pain model and the lack of PAF mediation in heat pain, as dictated by our statistical approach and the obtained results.

      The suggestion of a straightforward explanation aligning with the intervention not causing the intended effect on the nociceptive system is a valid consideration. We did contemplate the possibility of a false positive, emphasising this in the limitations of our findings and the need for replication to draw stronger conclusions to follow up this initial study.

      (6) In this regard, I do not believe that an average *increase* of 0.05 / 10 (Nicotine post - pre) can be considered a "reduction of pain ratings", regardless of the contrast with placebo (average increase of 0.24 / 10). This tiny effect size is more relevant in the context of the considerable inter-individual variation, in which subjects scored the same heat pain model anywhere from 1 to 10, and the same pressure pain model anywhere from 1 to 8.5. In this regard, the minimum clinically or experimentally important differences (MID) in pain ratings varies from study to study and across painful conditions but is rarely below 1 / 10 in a VAS or NRS scale, see f. ex. (Olsen et al., 2017). It is not my intention to question whether nicotine can function as an acute analgesic in general (as stated in the Discussion), but instead, if it worked as such under these very specific experimental conditions. I also acknowledge that the authors note this issue in two lines in the Discussion, but I believe that this is not weighed properly.

      We appreciate your perspective on the interpretation of the effect size, and we understand the importance of considering it in the context of individual variation.

      As also discussed in response to comment 6 From reviewer 2, we recognize the concern about interpreting the effect of nicotine on prolonged pain solely based on mean results, and in fact wish to discourage this approach. It's crucial to note that both PAF and pain are highly individual measures (i.e. high inter-individual variance), necessitating the use of random intercepts for participants in our analyses to acknowledge the inherent variability at baseline across participants. Including random intercepts rather than only considering the means helps address the heterogeneity in baseline levels among participants. We also recognise that displaying the mean PHP ratings for all participants in Table 2 could be misleading, firstly because these means do not have weight in an analysis that takes into account a random-effects intercept for participants, and secondly because two participants (one from each group) did not have post-gum PHP assessments and were not included in the mediation analysis due to list-wise deletion of missing data. Therefore, to reduce the potential for misinterpretation, we have added extra detail to display both the full sample and CPA mediation analysis (i.e. N=62) and the data used for PHP mediation analysis (i.e. n=60) in Table 2. We hope that the extra details added to this table will help the readers interpretation of results.

      Moreover, we have made sure refer to the comparison with the placebo group when discussing the reduction or decrease in pain seen in the nicotine group, for example:

      “2) nicotine reduced prolonged heat pain intensity but not prolonged pressure pain intensity compared to placebo gum;”

      “The nicotine group had a decrease in heat pain ratings compared to the placebo group and increased PAF speed across the scalp from pre to post-gum, driven by changes at central-parietal and right-frontal regions.”

      We have kept our original comment of whether this effect on pain is meaningful in practice to refer to the minimum clinically or experimentally important differences in pain ratings as highlighted by Olsen et al., 2017.

      “While acknowledging the modest effect size, it’s essential to consider the broader context of our study’s focus. Assessing the clinical relevance of pain reduction is pertinent in applications involving the use of any intervention for pain management [69]. However, from a mechanistic standpoint, particularly in understanding the implications of and relation to PAF, the specific magnitude of the pain effect becomes less pivotal. Nevertheless, future research should examine whether effects on pain increase in magnitude with different nicotine administration regimens (i.e. dose and frequency).”

      (7) In line with the topic of effect sizes, average effect sizes for PAF in the study cited in the manuscript range from around 1 Hz (Boord et al., 2008; Wydenkeller et al., 2009; Lim et al., 2016), to 2 Hz (Foulds et al., 1994), compared with changes of 0.06 Hz (Nicotine post - pre) or -0.01 Hz (Placebo post - pre). MIDs are not so clearly established for peak frequencies in EEG bands, but they should be certainly larger than some fractions of a Hertz (which is considerably below the reliability of the measurement).

      We appreciate your care of these nuances. We acknowledge the differences in effect sizes between our study and those referenced in the manuscript. Given the current state of the literature, it's noteworthy that ‘MIDs’ for peak frequencies in EEG bands, particularly PAF changes, are not clearly established, other than a recent publication suggesting that even small changes in PAF are reliable and meaningful (Furman et al., 2021). In light of this, we have addressed the uncertainty around the existence and determination of MIDs in our revision, highlighting the need for further research in this area.

      In addition, our study employed a greater frequency resolution (0.2 Hz) compared to some of the referenced studies, with approximately 0.5 Hz resolution (Boord et al., 2008; Wydenkeller et al., 2009; Foulds et al., 1994). This improved resolution allows for a more precise measurement of changes in PAF. Considering this, it is plausible that studies with lower resolution might have conflated increases in PAF, and our higher resolution contributes to a more accurate representation of the observed changes.

      We have also incorporated this insight into the manuscript, emphasising the methodological advancements in our study and their potential impact on the interpretation of PAF changes. Thank you for your thoughtful feedback.

      “The ability to detect changes in PAF can be considerably impacted by the frequency resolution used during Fourier Transformations, an element that is overlooked in recent methodological studies on PAF calculation [16,95]. Changes in PAF within individuals might be obscured or conflated by lower frequency resolutions, which should be considered further in future research.”

      (8) The authors also ran alternative statistical models to analyze the data and did not find consistent results in terms of PHP ratings (PAF modulation was still statistically significantly different). The authors attribute this to the necessity of controlling for covariates. Now, considering the effects sizes, aren't these statistically significant differences just artifacts stemming from the inclusion of too many covariates (Simmons et al., 2011)? How much influence should be attributable to depression and anxiety symptoms, stress, sleep quality and past pain, considering that these are healthy volunteers? Should these contrasting differences call the authors to question the robustness of the findings (i.e., whether the same data subjected to different analysis provides the same results), particularly when the results do not align with the preregistered hypothesis (PAF modulation should occur on sensorimotor ROIs)?

      Thank you for your comments on our alternative statistical models. By including these covariates, we aim to provide a more nuanced understanding of the complexities within our data by considering their potential impact on the effects of interest. The decision to include covariates was preregistered (apologies again that this was not available) and made with consideration of balancing model complexity and avoiding potential confounding. Moreover, we hope that the insights gained from these analyses will offer valuable information about the behaviour of our data and aid future research in terms of power calculations, expected variance, and study design.

      (9) Beyond that, I believe in some cases that the authors overreach in an attempt to provide explanations for their results. While I agree that sex might be a relevant covariate, I cannot say whether the authors are confirming a pre-registered hypothesis regarding the gender-specific correlation of PAF and pain, or if this is just a post hoc subgroup analysis. Given the large number of analyses performed (considering the main document and the supplementary files), caution should be exercised on the selective interpretation of those that align with the researchers' hypotheses.

      We chose to explore the influence of sex on the correlation between PAF and pain, because this has also been investigated in previous publications of the relationship (Furman et al., 2020).  We state that the assessment by sex is exploratory in our results on p.17: “in an exploratory analysis of separate correlations in males and females (Figure 5, plot C)”. For clarity regarding whether this was a pre-registered exploration or not, we have adjusted this to be: “in an exploratory analysis (not pre-registered) of separate correlations in males and females (Figure 5, plot C), akin to those conducted in previous research on this topic (Furman et al., 2020),

      We have made sure to state this in the discussion also. Therefore, when we previously said on p.22:

      “Regarding the relationship between PAF and pain at baseline, the negative correlation between PAF and pain seen in previous work [7–11,15] was only observed here for male participants during the PHP model for global PAF.” We have now changed this to: “Regarding the relationship between PAF and pain at baseline, the negative correlation between PAF and pain seen in previous work [7– 11,15] was only observed here for male participants during the PHP model for global PAF in an exploratory analysis.”

      Please also note that we altered the colour and shape of points on the correlation plot (Figure 5 in initial submission), the male brown was changed to a dark brown as we realised that the light brown colour was difficult to read. The shape was then changed for male points so that the two groups can be distinguished in grey-scale.

      Overall, your thoughtful feedback is instrumental in refining the interpretation of our findings, and we look forward to presenting a more comprehensive and nuanced discussion. Thank you for your comments.

      REFERENCES for responses to reviewer 3

      Arendt-Nielsen, L., & Yarnitsky, D. (2009). Experimental and clinical applications of quantitative sensory testing applied to skin, muscles and viscera. The Journal of Pain, 10(6), 556-572.

      Chowdhury, N. S., Skippen, P., Si, E., Chiang, A. K., Millard, S. K., Furman, A. J., ... & Seminowicz, D. A. (2023). The reliability of two prospective cortical biomarkers for pain: EEG peak alpha frequency and TMS corticomotor excitability. Journal of Neuroscience Methods, 385, 109766.

      Fishbain, D. A., Lewis, J. E., & Gao, J. (2013). Is There Significant Correlation between SelfReported Low Back Pain Visual Analogue Scores and Low Back Pain Scores Determined by Pressure Pain Induction Matching?. Pain practice, 13(5), 358-363.

      Furman, A. J., Prokhorenko, M., Keaser, M. L., Zhang, J., Chen, S., Mazaheri, A., & Seminowicz, D. A. (2021). Prolonged pain reliably slows peak alpha frequency by reducing fast alpha power.

      bioRxiv, 2021-07.

      Heitmann, H., Ávila, C. G., Nickel, M. M., Dinh, S. T., May, E. S., Tiemann, L., ... & Ploner, M. (2022). Longitudinal resting-state electroencephalography in patients with chronic pain undergoing interdisciplinary multimodal pain therapy. Pain, 163(9), e997.

      McLain, N. J., Yani, M. S., & Kutch, J. J. (2022). Analytic consistency and neural correlates of peak alpha frequency in the study of pain. Journal of neuroscience methods, 368, 109460.

      Ngernyam, N., Jensen, M. P., Arayawichanon, P., Auvichayapat, N., Tiamkao, S., Janjarasjitt, S., ... & Auvichayapat, P. (2015). The effects of transcranial direct current stimulation in patients with neuropathic pain from spinal cord injury. Clinical Neurophysiology, 126(2), 382-390.

      Parker, T., Huang, Y., Raghu, A. L., FitzGerald, J., Aziz, T. Z., & Green, A. L. (2021). Supraspinal effects of dorsal root ganglion stimulation in chronic pain patients. Neuromodulation: Technology at the Neural Interface, 24(4), 646-654.

      Petersen-Felix, S., & Arendt-Nielsen, L. (2002). From pain research to pain treatment: the role of human experimental pain models. Best Practice & Research Clinical Anaesthesiology, 16(4), 667680.

      Sarnthein, J., Stern, J., Aufenberg, C., Rousson, V., & Jeanmonod, D. (2006). Increased EEG power and slowed dominant frequency in patients with neurogenic pain. Brain, 129(1), 55-64.

      Sato, G., Osumi, M., & Morioka, S. (2017). Effects of wheelchair propulsion on neuropathic pain and resting electroencephalography after spinal cord injury. Journal of Rehabilitation Medicine, 49(2), 136-143.

      Sufianov, A. A., Shapkin, A. G., Sufianova, G. Z., Elishev, V. G., Barashin, D. A., Berdichevskii, V. B., & Churkin, S. V. (2014). Functional and metabolic changes in the brain in neuropathic pain syndrome against the background of chronic epidural electrostimulation of the spinal cord. Bulletin of experimental biology and medicine, 157(4), 462-465.

    1. Author response:

      The following is the authors’ response to the original reviews.

      Reviewer #1 (Public review):

      Summary:

      This work investigated the role of CXXC-finger protein 1 (CXXC1) in regulatory T cells. CXXC1-bound genomic regions largely overlap with Foxp3-bound regions and regions with H3K4me3 histone modifications in Treg cells. CXXC1 and Foxp3 interact with each other, as shown by co-immunoprecipitation. Mice with Treg-specific CXXC1 knockout (KO) succumb to lymphoproliferative diseases between 3 to 4 weeks of age, similar to Foxp3 KO mice. Although the immune suppression function of CXXC1 KO Treg is comparable to WT Treg in an in vitro assay, these KO Tregs failed to suppress autoimmune diseases such as EAE and colitis in Treg transfer models in vivo. This is partly due to the diminished survival of the KO Tregs after transfer. CXXC1 KO Tregs do not have an altered DNA methylation pattern; instead, they display weakened H3K4me3 modifications within the broad H3K4me3 domains, which contain a set of Treg signature genes. These results suggest that CXXC1 and Foxp3 collaborate to regulate Treg homeostasis and function by promoting Treg signature gene expression through maintaining H3K4me3 modification.

      Strengths:

      Epigenetic regulation of Treg cells has been a constantly evolving area of research. The current study revealed CXXC1 as a previously unidentified epigenetic regulator of Tregs. The strong phenotype of the knockout mouse supports the critical role CXXC1 plays in Treg cells. Mechanistically, the link between CXXC1 and the maintenance of broad H3K4me3 domains is also a novel finding.

      Weaknesses:

      (1) It is not clear why the authors chose to compare H3K4me3 and H3K27me3 enriched genomic regions. There are other histone modifications associated with transcription activation or repression. Please provide justification.

      Thank you for highlighting this important point. We chose to focus on H3K4me3 and H3K27me3 enriched genomic regions because these histone modifications are well-characterized markers of transcriptional activation and repression, respectively. H3K4me3 is predominantly associated with active promoters, while H3K27me3 marks repressed chromatin states, particularly in the context of gene regulation at promoters. This duality provides a robust framework for investigating the balance between transcriptional activation and repression in Treg cells. While histone acetylation, such as H3K27ac, is linked to enhancer activity and transcriptional elongation, our focus was on promoter-level regulation, where H3K4me3 and H3K27me3 are most relevant. Although other histone modifications could provide additional insights, we chose to focus on these two to maintain clarity and feasibility in our analysis. We have revised the text accordingly; please refer to Page 18, lines 353-356.

      (2) It is not clear what separates Clusters 1 and 3 in Figure 1C. It seems they share the same features.

      We apologize for not clarifying these clusters clearly. Cluster 1 and 3 are both H3K4me3 only group, with H3K4me3 enrichment and gene expression levels being higher in Cluster 1. At first, we divided the promoters into four categories because we wanted to try to classify them into four categories: H3K4me3 only, H3K27me3 only, H3K4me3-H3K27me3 co-occupied, and None. However, in actual classification, we could not distinguish H3K4me3-H3K27me3 co-occupied group. Instead, we had two categories of H3K4me3 only, with cluster 1 having a higher enrichment level for H3K4me3 and gene expression levels.

      (3) The claim, "These observations support the hypothesis that FOXP3 primarily functions as an activator by promoting H3K4me3 deposition in Treg cells." (line 344), seems to be a bit of an overstatement. Foxp3 certainly can promote transcription in ways other than promoting H3K3me3 deposition, and it also can repress gene transcription without affecting H3K27me3 deposition. Therefore, it is not justified to claim that promoting H3K4me3 deposition is Foxp3's primary function.

      Thank you for your insightful feedback. We agree that the statement in line 344 may have overstated the role of FOXP3 in promoting H3K4me3 deposition as its primary function. As you pointed out, FOXP3 is indeed a multifaceted transcription factor that regulates gene expression through various mechanisms. It can promote transcription independent of H3K4me3 deposition, as well as repress transcription without directly influencing H3K27me3 levels.

      To more accurately reflect the broader regulatory functions of FOXP3, we have revised the manuscript. The updated text (Page 19, lines 385-388) now reads:

      "These findings collectively support the conclusion that FOXP3 contributes to transcriptional activation in Treg cells by promoting H3K4me3 deposition at target loci, while also regulating gene expression directly or indirectly through other epigenetic modifications.

      (4) For the in vitro suppression assay in Figure S4C, and the Treg transfer EAE and colitis experiments in Figure 4, the Tregs should be isolated from Cxxc1 fl/fl x Foxp3 cre/wt female heterozygous mice instead of Cxxc1 fl/fl x Foxp3 cre/cre (or cre/Y) mice. Tregs from the homozygous KO mice are already activated by the lymphoproliferative environment and could have vastly different gene expression patterns and homeostatic features compared to resting Tregs. Therefore, it's not a fair comparison between these activated KO Tregs and resting WT Tregs.

      Thank you for raising this insightful point regarding the potential activation status of Treg cells in homozygous knockout mice. To address this concern, we performed additional experiments using Treg cells isolated from Foxp3<sup>Cre/+</sup>Cxxc1<sup>fl/fl</sup> (hereafter referred to as “het-KO”) female mice and their littermate controls, Foxp3<sup>Cre/+</sup>Cxxc1<sup>fl/+</sup> (referred to as “het-WT”) mice.

      The results of these new experiments are now included in the manuscript (Page25, lines 507–509, Figure 6E and Figure S6A-E):

      (1) In the in vitro suppression assay, Treg cells from het-KO mice exhibited reduced suppressive function compared to het-WT Treg cells. This finding underscores the intrinsic defect in Treg cells suppressive capacity attributable to the loss of one Cxxc1 allele.

      (2) In the experimental autoimmune encephalomyelitis (EAE) model, Treg cells isolated from het-KO mice also demonstrated impaired suppressive function.

      (5) The manuscript didn't provide a potential mechanism for how CXXC1 strengthens broad H3K4me3-modified genomic regions. The authors should perform Foxp3 ChIP-seq or Cut-n-Taq with WT and Cxxc1 cKO Tregs to determine whether CXXC1 deletion changes Foxp3's binding pattern in Treg cells.

      Thank you for raising this important point. To address your suggestion, we performed CUT&Tag experiments and found that Cxxc1 deletion does not alter FOXP3 binding patterns in Treg cells. Most FOXP3-bound regions in WT Treg cells were similarly enriched in KO Treg cells, indicating that Cxxc1 deficiency does not impair FOXP3’s DNA-binding ability. These results have been added to the revised manuscript (Page 28, lines 567-575, Figure S8A-B) and are further discussed in the Discussion (Pages 28-29, lines 581-587).

      Reviewer #2 (Public review):

      FOXP3 has been known to form diverse complexes with different transcription factors and enzymes responsible for epigenetic modifications, but how extracellular signals timely regulate FOXP3 complex dynamics remains to be fully understood. Histone H3K4 tri-methylation (H3K4me3) and CXXC finger protein 1 (CXXC1), which is required to regulate H3K4me3, also remain to be fully investigated in Treg cells. Here, Meng et al. performed a comprehensive analysis of H3K4me3 CUT&Tag assay on Treg cells and a comparison of the dataset with the FOXP3 ChIP-seq dataset revealed that FOXP3 could facilitate the regulation of target genes by promoting H3K4me3 deposition.

      Moreover, CXXC1-FOXP3 interaction is required for this regulation. They found that specific knockdown of Cxxc1 in Treg leads to spontaneous severe multi-organ inflammation in mice and that Cxxc1-deficient Treg exhibits enhanced activation and impaired suppression activity. In addition, they have also found that CXXC1 shares several binding sites with FOXP3 especially on Treg signature gene loci, which are necessary for maintaining homeostasis and identity of Treg cells.

      The findings of the current study are pretty intriguing, and it would be great if the authors could fully address the following comments to support these interesting findings.

      Major points:

      (1) There is insufficient evidence in the first part of the Results to support the conclusion that "FOXP3 functions as an activator by promoting H3K4Me3 deposition in Treg cells". The authors should compare the results for H3K4Me3 in FOXP3-negative conventional T cells to demonstrate that at these promoter loci, FOXP3 promotes H3K4Me3 deposition.

      Thank you for this insightful comment. We have already performed additional experiments comparing H3K4Me3 levels between FOXP3-positive Treg cells and FOXP3-negative conventional T cells (Tconv). Please refer to Pages 18, lines 361-368, and Figure 1C and Figure S1C for the results. Our results show that H3K4Me3 abundance is higher at many Treg-specific gene loci in Treg cells compared to Tconv cells. This supports our conclusion that FOXP3 promotes H3K4Me3 deposition at these loci.

      (2) In Figure 3 F&G, the activation status and IFNγ production should be analyzed in Treg cells and Tconv cells separately rather than in total CD4+ T cells. Moreover, are there changes in autoantibodies and IgG and IgE levels in the serum of cKO mice?

      Thank you for your valuable suggestions. In response to your comment, we reanalyzed the data in Figures 3F and 3G to assess the activation status and IFN-γ production in Tconv cells. The updated analysis revealed that Cxxc1 deletion in Treg cells leads to increased activation and IFN-γ production in Tconv cells. Additionally, we corrected the analysis of IL-17A and IL-4 expression, which were upregulated in Tconv cells. These updated results are now included in the revised manuscript (Page 21, lines 429-431, Figure 3I and Figure S3E-F).

      Additionally, we examined autoantibodies and immunoglobulin levels in the serum of Cxxc1 cKO mice. Our data show a significant increase in serum IgG levels, accompanied by elevated IgG autoantibodies, indicating heightened autoimmune responses. In contrast, serum IgE levels remained largely unchanged. The results are detailed in the revised manuscript (Page 21, lines 421-423, Figure 3E and Figure S3B).

      (3) Why did Cxxc1-deficient Treg cells not show impaired suppression than WT Treg during in vitro suppression assay, despite the reduced expression of Treg cell suppression assay -associated markers at the transcriptional level demonstrated in both scRNA-seq and bulk RNA-seq?

      Thank you for your thoughtful comment. The absence of impaired suppression in Cxxc1-deficient Treg cells from homozygous knockout (KO) mice during the in vitro suppression assay, despite the reduced expression of Treg-associated markers at the transcriptional level (as demonstrated by scRNA-seq), can likely be explained by the activated state of these Treg cells. In homozygous KO mice, Treg cells are already activated due to the lymphoproliferative environment, resulting in gene expression patterns that differ from those of resting Treg cells. This pre-activation may obscure the effect of Cxxc1 deletion on their suppressive function in vitro.

      To address this limitation, we used heterozygous Foxp3<sup>Cre/+</sup>Cxxc1<sup>fl/fl</sup> (het-KO) female mice, along with their littermate controls, Foxp3<sup>Cre/+</sup>Cxxc1<sup>fl/+</sup> (het-WT) mice. In these heterozygous mice, we observed an impairment in Treg cell suppressive function in vitro, which was accompanied by the downregulation of several key Treg-associated genes, as confirmed by RNA-Seq analysis.

      These updated findings, based on the use of het-KO mice, are now incorporated into the revised manuscript (Page 25, lines 507–509, Figure 6E).

      (4) Is there a disease in which Cxxc1 is expressed at low levels or absent in Treg cells? Is the same immunodeficiency phenotype present in patients as in mice?

      This is indeed a very meaningful and intriguing question, and we are equally interested in understanding whether low or absent Cxxc1 expression in Treg cells is associated with any human diseases. However, despite an extensive review of the literature and available data, we found no reports linking Cxxc1 deficiency in Treg cells to immunodeficiency phenotypes in patients comparable to those observed in mice.

      Reviewer #3 (Public review):

      In the report entitled "CXXC-finger protein 1 associates with FOXP3 to stabilize homeostasis and suppressive functions of regulatory T cells", the authors demonstrated that Cxxc1-deletion in Treg cells leads to the development of severe inflammatory disease with impaired suppressive function. Mechanistically, CXXC1 interacts with Foxp3 and regulates the expression of key Treg signature genes by modulating H3K4me3 deposition. Their findings are interesting and significant. However, there are several concerns regarding their analysis and conclusions.

      Major concerns:

      (1) Despite cKO mice showing an increase in Treg cells in the lymph nodes and Cxxc1-deficient Treg cells having normal suppressive function, the majority of cKO mice died within a month. What causes cKO mice to die from severe inflammation?

      Considering the results of Figures 4 and 5, a decrease in the Treg cell population due to their reduced proliferative capacity may be one of the causes. It would be informative to analyze the population of tissue Treg cells.

      Thank you for your insightful observation regarding the mortality of cKO mice despite increased Treg cells in lymph nodes and the normal suppressive function of Cxxc1-deficient Treg cells.

      As suggested, we hypothesized that the reduction of tissue-resident Treg cells could be a key factor. Additional experiments revealed a significant decrease in Treg cell populations in the small intestine lamina propria (LPL), liver, and lung of cKO mice. These findings highlight the critical role of tissue-resident Treg cells in preventing systemic inflammation.

      This reduction aligns with Figures 4 and 5, which demonstrate impaired proliferation and survival of Cxxc1-deficient Treg cells. Together, these defects lead to insufficient Treg populations in peripheral tissues, escalating localized inflammation into systemic immune dysregulation and early mortality.

      These additional results have been incorporated into the revised manuscript (Page21, lines 424-427, Figure 3G and Figure S3C).

      (2) In Figure 5B, scRNA-seq analysis indicated that the Mki67+ Treg subset is comparable between WT and Cxxc1-deficient Treg cells. On the other hand, FACS analysis demonstrated that Cxxc1-deficient Treg shows less Ki-67 expression compared to WT in Figure 5I. The authors should explain this discrepancy.

      Thank you for pointing out the apparent discrepancy between the scRNA-seq and FACS analyses regarding Ki-67 expression in Cxxc1-deficient Treg cells.

      In Figure 5B, the scRNA-seq analysis identified the Mki67+ Treg subset as comparable between WT and Cxxc1-deficient Treg cells. This finding reflects the overall proportion of cells expressing Mki67 transcripts within the Treg population. In contrast, the FACS analysis in Figure 5I specifically measures Ki-67 protein levels, revealing reduced expression in Cxxc1-deficient Treg cells compared to WT.

      To resolve this discrepancy, we performed additional analyses of the scRNA-seq data to directly compare the expression levels of Mki67 mRNA between WT and Cxxc1-deficient Treg cells. The results revealed a consistent reduction in Mki67 transcript levels in Cxxc1-deficient Treg cells, aligning with the reduced Ki-67 protein levels observed by FACS.

      These new analyses have been included in the revised manuscript (Author response image 1) to clarify this point and demonstrate consistency between the scRNA-seq and FACS data.

      Author response image 1.

      Violin plots displaying the expression levels of Mki67 in T<sub>reg</sub> cells from Foxp3<sup>cre</sup> and Foxp3<sup>cre</sup>Cxxc1<sup>fl/fl</sup> mice.

      In addition, the authors concluded on line 441 that CXXC1 plays a crucial role in maintaining Treg cell stability. However, there appears to be no data on Treg stability. Which data represent the Treg stability?

      Thank you for your valuable comment. We agree that our wording in line 441 may have been too conclusive. Our data focus on the impact of Cxxc1 deficiency on Treg cell homeostasis and transcriptional regulation, rather than directly measuring Treg cell stability. Specifically, the downregulation of Treg-specific suppressive genes and upregulation of pro-inflammatory markers suggest a shift in Treg cell function, which points to disrupted homeostasis rather than stability.

      We have revised the manuscript to clarify that CXXC1 plays a crucial role in maintaining Treg cell function and homeostasis, rather than stability (Page 24, lines 489-491).

      (3) The authors found that Cxxc1-deficient Treg cells exhibit weaker H3K4me3 signals compared to WT in Figure 7. This result suggests that Cxxc1 regulates H3K4me3 modification via H3K4 methyltransferases in Treg cells. The authors should clarify which H3K4 methyltransferases contribute to the modulation of H3K4me3 deposition by Cxxc1 in Treg cells.

      We appreciate the reviewer’s insightful comment regarding the role of H3K4 methyltransferases in regulating H3K4me3 deposition by CXXC1 in Treg cells.

      CXXC1 has been reported to function as a non-catalytic component of the Set1/COMPASS complex, which includes the H3K4 methyltransferases SETD1A and SETD1B—key enzymes responsible for H3K4 trimethylation(1-4). Based on these findings, we propose that CXXC1 modulates H3K4me3 levels in Treg cells by interacting with and stabilizing the activity of the Set1/COMPASS complex.

      These revisions are further discussed in the Discussion (Page 30-31, lines 624-632).

      Furthermore, it would be important to investigate whether Cxxc1-deletion alters Foxp3 binding to target genes.

      Thank you for raising this important point. To address your suggestion, we performed CUT&Tag experiments and found that Cxxc1 deletion does not alter FOXP3 binding patterns in Treg cells. Most FOXP3-bound regions in WT Treg cells were similarly enriched in KO Treg cells, indicating that Cxxc1 deficiency does not impair FOXP3’s DNA-binding ability. These results have been added to the revised manuscript (Page 28, lines 567-575, Figure S8A-B) and are further discussed in the Discussion (Pages 28-29, lines 581-587).

      (4) In Figure 7, the authors concluded that CXXC1 promotes Treg cell homeostasis and function by preserving the H3K4me3 modification since Cxxc1-deficient Treg cells show lower H3K4me3 densities at the key Treg signature genes. Are these Cxxc1-deficient Treg cells derived from mosaic mice? If Cxxc1-deficient Treg cells are derived from cKO mice, the gene expression and H3K4me3 modification status are inconsistent because scRNA-seq analysis indicated that expression of these Treg signature genes was increased in Cxxc1-deficient Treg cells compared to WT (Figure 5F and G).

      Thank you for your insightful comment. To clarify, the Cxxc1-deficient Treg cells analyzed for H3K4me3 modifications in Figure 7 were derived from Cxxc1 conditional knockout (cKO) mice, not mosaic mice.

      Regarding the apparent inconsistency between reduced H3K4me3 levels and the increased expression of Treg signature genes observed in scRNA-seq analysis (Figure 5F and G), we believe this discrepancy can be attributed to distinct mechanisms regulating gene expression. H3K4me3 is an epigenetic mark that facilitates chromatin accessibility and transcriptional regulation, reflecting upstream chromatin dynamics. However, gene expression levels are influenced by a combination of factors, including transcriptional activators, downstream compensatory mechanisms, and the inflammatory environment in cKO mice.

      The upregulation of Treg signature genes in scRNA-seq data likely reflects an activated or pro-inflammatory state of Cxxc1-deficient Treg cells in response to systemic inflammation, as previously described in the manuscript. This contrasts with the intrinsic reduction in H3K4me3 levels at these loci, indicating a loss of epigenetic regulation by CXXC1.

      To further support this interpretation, RNA-seq analysis of Treg cells from Foxp3<sup>Cre/+</sup> Cxxc1<sup>fl/fl</sup> (“het-KO”) and their littermate Foxp3<sup>Cre/+</sup> Cxxc1<sup>fl/+</sup> (“het-WT”) female mice (Figure S6C) revealed a significant reduction in key Treg signature genes such as Icos, Ctla4, Tnfrsf18, and Nt5e in het-KO Treg cells. These results align with the diminished H3K4me3 modifications observed in cKO Treg cells, further underscoring the role of CXXC1 as an epigenetic regulator.

      In summary, while the gene expression changes observed in scRNA-seq may reflect adaptive responses to inflammation, the reduced H3K4me3 modifications directly highlight the critical role of CXXC1 in maintaining the epigenetic landscape essential for Treg cell homeostasis and function.

      Recommendations for the authors:

      Reviewer #1 (Recommendations for the authors):

      In Figure 7E, the y-axis scale for H3K4me3 peaks at the Ctla4 locus should be consistent between WT and cKO samples.

      We thank the reviewer for pointing out the inconsistency in the y-axis scale for the H3K4me3 peaks at the Ctla4 locus in Figure 7E. We have carefully revised the figure to ensure that the y-axis scale is now consistent between the WT and cKO samples.

      We appreciate the reviewer’s attention to this detail, as it enhances the rigor of the data presentation. Please find the updated Figure 7E in the revised manuscript.

      Reviewer #2 (Recommendations for the authors):

      In lines 455 and 466, the name of Treg signature markers validated by flow cytometry should be written as protein name and capitalized.

      Thank you for pointing this out. We have carefully reviewed lines 455 and 466 and have revised the text to ensure that the Treg signature markers validated by flow cytometry are referred to using their protein names, with proper capitalization.

      Reviewer #3 (Recommendations for the authors):

      (1) On line 431, "Cxxc1-deficient cells" should be Cxxc1-deficient Treg cells".

      We thank the reviewer for highlighting this oversight. On line 431, we have revised "Cxxc1-deficient cells" to "Cxxc1-deficient Treg cells" to provide a more accurate and specific description. We appreciate the reviewer's attention to detail, as this correction improves the precision of our manuscript.

      (2) In Figure 4H, negative values should be removed from the y-axis.

      Thank you for your observation. We have revised Figure 4H to remove the negative values from the y-axis, as requested. This adjustment ensures a more accurate and meaningful representation of the data.

      (3) It is better to provide the lists of overlapping genes in Figure 7C.

      Thank you for your suggestion. We agree that providing the lists of overlapping genes in Figure 7C would enhance the clarity and reproducibility of the results. We have now included the gene lists as supplementary information (Supplementary Table 3) accompanying Figure 7C.

      (1) Lee, J. H. & Skalnik, D. G. CpG-binding protein (CXXC finger protein 1) is a component of the mammalian set1 histone H3-Lys4 methyltransferase complex, the analogue of the yeast Set1/COMPASS complex. Journal of Biological Chemistry 280, 41725-41731, doi:10.1074/jbc.M508312200 (2005).

      (2) Thomson, J. P., Skene, P. J., Selfridge, J., Clouaire, T., Guy, J., Webb, S., Kerr, A. R. W., Deaton, A., Andrews, R., James, K. D., Turner, D. J., Illingworth, R. & Bird, A. CpG islands influence chromatin structure via the CpG-binding protein Cfp1. Nature 464, 1082-U1162, doi:10.1038/nature08924 (2010).

      (3) Shilatifard, A. in Annual Review of Biochemistry, Vol 81 Vol. 81 Annual Review of Biochemistry (ed R. D. Kornberg)  65-95 (2012).

      (4) Brown, D. A., Di Cerbo, V., Feldmann, A., Ahn, J., Ito, S., Blackledge, N. P., Nakayama, M., McClellan, M., Dimitrova, E., Turberfield, A. H., Long, H. K., King, H. W., Kriaucionis, S., Schermelleh, L., Kutateladze, T. G., Koseki, H. & Klose, R. J. The SET1 Complex Selects Actively Transcribed Target Genes via Multivalent Interaction with CpG Island Chromatin. Cell Reports 20, 2313-2327, doi:10.1016/j.celrep.2017.08.030 (2017).

    1. Author response:

      The following is the authors’ response to the original reviews.

      Reviewer #1:

      Summary:

      The manuscript by Bohra et al. describes the indirect effects of ligand-dependent gene activation on neighboring non-target genes. The authors utilized single-molecule RNA-FISH (targeting both mature and intronic regions), 4C-seq, and enhancer deletions to demonstrate that the non-enhancer-targeted gene TFF3, located in the same TAD as the target gene TFF1, alters its expression when TFF1 expression declines at the end of the estrogen signaling peak. Since the enhancer does not loop with TFF3, the authors conclude that mechanisms other than estrogen receptor or enhancer-driven induction are responsible for TFF3 expression. Moreover, ERα intensity correlations show that both high and low levels of ERα are unfavorable for TFF1 expression. The ERa level correlations are further supported by overexpression of GFP-ERa. The authors conclude that transcriptional machinery used by TFF1 for its acute activation can negatively impact the TFF3 at peak of signaling but once, the condensate dissolves, TFF3 benefits from it for its low expression.

      Strengths:

      The findings are indeed intriguing. The authors have maintained appropriate experimental controls, and their conclusions are well-supported by the data.

      Weaknesses:

      There are some major and minor concerns that related to approach, data presentation and discussion. But I think they can be fixed with more efforts.

      We thank the reviewer for their positive comments on the paper. We have addressed all their specific recommendations below.  

      The deletion of enhancer reveals the absolute reliance of TFF1 on its enhancers for its expression. Authors should elaborate more on this as this is an important finding.

      We thank the reviewer for the comment. We have now added a more detailed discussion on the requirement of enhancer for TFF1 expression in the revised manuscript (line 368-385).  

      In Fig. 1, TFF3 expression is shown to be induced upon E2 signaling through qRT-PCR, while smFISH does not display a similar pattern. The authors attribute this discrepancy to the overall low expression of TFF3. In my opinion, this argument could be further supported by relevant literature, if available. Additionally, does GRO-seq data reveal any changes in TFF3 expression following estrogen stimulation? The GRO-seq track shown in Fig.1 should be adjusted to TFF3 expression to appreciate its expression changes.

      We have now included a browser shot image of TFF3 region showing GRO-Seq signal at E2 time course (Fig. S1C). We observed an increased transcription towards the 3’ end of TFF3 gene body at 3h.  The increased transcription at 3h, corroborates with smFISH data. The relative changes of TFF3 expression measured by qRT-PCR and smFISH for intronic transcripts are somewhat different, we speculate that such biased measurements that are dependent on PCR amplifications could be more for genes that express at low levels and smFISH using intronic probes may be a more sensitive assay to detect such changes.    

      Since the mutually exclusive relationship between TFF1 and TFF3 is based on snap shots in fixed cells, can authors comment on whether the same cell that expresses TFF1 at 1h, expresses TFF3 at 3h? Perhaps, the calculations taking total number of cells that express these genes at 1 and 3h would be useful.

      Like pointed out by the reviewer, since these are fixed cells, we cannot comment on the fate of the same cell at two time points. To further address this limitation, future work could employ cells with endogenous tags for TFF1 and TFF3 and utilize live cell imaging techniques. In a fixed cell assay, as the reviewer suggests, it can be investigated whether a similar fraction shows high TFF3 expression at 3h, as the fraction that shows high TFF1 expression at 1 h. To quantify the fractions as suggested by the reviewer, we plotted the fraction of cells showing high TFF1 and TFF3 expression at 1h and 3h. We identify truly high expressing cells by taking mean and one standard deviation (for single cell level data) at E2-1hr as the threshold for TFF1 (80 and above transcript counts) and mean and one standard deviation (for single cell level data) at E2-3hr as the threshold for TFF3 (36 and above transcript counts). The fraction with high TFF1 expression at 1h  (12.06 ± 2.1) is indeed comparable to that with high TFF3 expression at 3h (12.50 ± 2.0) (Fig. 2C and Author response image 1). We should note that if the transcript counts were normally distributed, a predetermined fraction would be expected to be above these thresholds and comparable fractions can arise just from underlying statistics. But in our experiments, this is unlikely to be the case given the many outliers that affect both the mean and the standard deviation, and the lack of normality and high dispersion in single cell distributions. Of course, despite the fractions being comparable, we cannot be certain if it is the same set of cells that go from high expression of TFF1 to high expression of TFF3, but definitely that is a possibility. We thank the reviewer for pointing out this comparison.

      Author response image 1.

      The graph represents the percent of cells that show high expression for TFF1 and TFF3 at 1h and 3h post E2 signaling. The threshold was collected by pooling in absolute RNA counts from 650 analyzed cells (as in Fig. 2C). The mean and standard deviation over single cell data were calculated. Mean plus one standard deviation was used to set the threshold for identifying high expressing cells. For TFF1, as it maximally expresses at 1h the threshold used was 80. For TFF3, as it maximally expresses at 3h the threshold used was 36. Fraction of cells expressing above 80 and 36 for TFF1 and TFF3 respectively were calculated from three different repeats. Mean of means and standard deviations from the three experiments are plotted here.

      Authors conclude that TFF3 is not directly regulated by enhancer or estrogen receptor. Does ERa bind on TFF3 promoter? 

      The ERa ChIP-seq performed at 1h and 3h of signaling suggests that TFF3 promoter is not bound by ERa as shown in supplementary Fig. 1B and S1B. However, one peak upstream to TFF1 promoter is visible and that is lost at 3h. 

      Minor comments:

      Reviewer’s comment -The figures would benefit from resizing of panels. There is very little space between the panels.

      We have now resized the figures in the revised manuscript.

      The discussion section could include an extrapolation on the relationship between ERα concentration and transcriptional regulation. Given that ERα levels have been shown to play a critical role in breast cancer, exploring how varying concentrations of ERα affect gene expression, including the differential regulation of target and non-target genes, would provide valuable insights into the broader implications of this study.

      This is a very important point that was missing from the manuscript. We have included this in the discussion in the revised manuscript (line 426-430).

      Reviewer #2:

      Summary:

      In this manuscript by Bohra et al., the authors use the well-established estrogen response in MCF7 cells to interrogate the role of genome architecture, enhancers, and estrogen receptor concentration in transcriptional regulation. They propose there is competition between the genes TFF1 and TFF3 which is mediated by transcriptional condensates. This reviewer does not find these claims persuasive as presented. Moreover, the results are not placed in the context of current knowledge.

      Strengths:

      High level of ERalpha expression seems to diminish the transcriptional response. Thus, the results in Fig. 4 have potential insight into ER-mediated transcription. Yet, this observation is not pursued in great depth however, for example with mutagenesis of ERalpha. However, this phenomenon - which falls under the general description of non monotonic dose response - is treated at great depth in the literature (i.e. PMID: 22419778). For example, the result the authors describe in Fig. 4 has been reported and in fact mathematically modeled in PMID 23134774. One possible avenue for improving this paper would be to dig into this result at the single-cell level using deletion mutants of ERalpha or by perturbing co-activators.

      We thank the reviewer for pointing us to the relevant literature on our observation which will enhance the manuscript. We have discussed these findings in relations to ours in the discussion section (Line 400-413). We thank the reviewer for insight on non-monotonic behavior.

      Weaknesses:

      There are concerns with the sm-RNA FISH experiments. It is highly unusual to see so much intronic signal away from the site of transcription (Fig. 2) (PMID: 27932455, 30554876), which suggests to me the authors are carrying out incorrect thresholding or have a substantial amount of labelling background. The Cote paper cited in the manuscript is likewise inconsistent with their findings and is cited in a misleading manner: they see splicing within a very small region away from the site of transcription. 

      We thank the reviewer for this comment, and apologize if they feel we misrepresented the argument from Cote et al. This has now been rectified in the manuscript. However, we do not agree that the intronic signals away from the site of transcription are an artefact. First, the images presented here are just representative 2D projections of 3D Z-stacks; whereas the full 3D stack is used for spot counting using a widely-used algorithm that reports spot counts that are constant over wide range of thresholds (Raj et al., 2008). The veracity of automated counts was first verified initially by comparison to manual counts. Even for the 2D representations the extragenic intronic signals show up at similar thresholds to the transcription sites. 

      The signal is not non-specific arising from background labeling, explained by following reasons:

      • To further support the time-course smFISH data and its interpretation without depending on the dispersed intronic signal, we have analyzed the number of alleles firing/site of transcription at a given time in a cell under the three conditions. We counted the sites of transcription in a given cell and calculated the percentage of cells showing 1,2,3,4 or >4 sites. We see that the percent of cells showing a single site of transcription for TFF1 is very high in uninduced cells and this decreases at 1h. At 1h, the cells showing 2, 3 and 4 sites of transcription increase which again goes down at 3h (Author response image 2A). This agrees with the interpretation made from mean intronic counts away from the site of transcription. Similarly, for TFF3, the number of cells showing 2,3 and 4 sites of transcription increase slightly at 3hr compared to uninduced and 1hr (Author response image 2B).  We can also see that several cells have no alleles firing at a given time as has been quantified in the graphs on right showing total fraction of cells with zero versus non-zero alleles firing (Author response image 2A-B). A non-specific signal would be present in all cells.

      • There is literature on post-transcriptional splicing of RNA beyond our work, which suggests that intronic signal can be found at relatively large distances away from the site of transcription. Waks et al. showed that some fraction of unspliced RNA could be observed up to 6-10 microns away from the site of transcription suggesting that there can be a delay between transcription and (alternative) splicing (Waks et al., 2011). Pannuclear disperse intronic signals can arise as there can be more than one allele firing at a time in different nuclear locations. The spread of intronic transcripts in our images is also limited in cells in which only 1 allele is firing at E2-1 hour (Author response image 2C) or uninduced cells (Author response image 2D). Furthermore, Cote et al. discuss that “Of note, we see that increased transcription level correlates with intron dispersal, suggesting that the percentage of splicing occurring away from the transcription site is regulated by transcription level for at least some introns. This may explain why we observe posttranscriptional splicing of all genes we measured, as all were highly expressed.” This is in line with our interpretation that intron signal dispersal can occur in case of posttranscriptional splicing (Coté et al., 2023). Additionally, other studies have suggested that transcripts in cells do not necessarily undergo co-transcriptional splicing which leads us to conclude that intronic signal can be found farther away from the site of transcription. Coulon et al. showed that splicing can occur after transcript release from the site and suggested that no strict checkpoint exists to ensure intron removal before release which results in splicing and release being kinetically uncoupled from each other (Coulon et al., 2014). Similarly, using live-cell imaging, it was shown that splicing is not always coupled with transcription, and this could depend on the nature and structural features of transcript (such as blockage of polypyrimidine tract which results in delayed recognition) (Vargas et al., 2011). Drexler  et al. showed that as opposed to drosophila transcripts that are shorter, in mammalian cells, splicing of the terminal intron can occur post-transcriptionally (Drexler et al., 2020). Using RNA polymerase II ChIP-Seq time course data from ERα activation in the MCF-7 cells, Honkela et al. showed that large number of genes can show significant delays between the completion of transcription and mRNA production (Honkela et al., 2015). This was attributed to faster transcription of shorter genes which results in splicing  delays suggesting rapid completion of transcription on shorter genes can lead to splicing-associated delays (Honkela et al., 2015). More recently, comparisons of nascent and mature RNA levels suggested a time lapse between transcription and splicing for the genes that are early responders during signaling (Zambrano et al., 2020). The presence of significant numbers of TFF1 nascent RNA in the nucleus in our data corroborates with above observations. 

      • Uniform intensities across many transcripts suggests these are true signal arising from RNA molecules which would not be the case for non-specific, background signal (Author response image 2E).

      • Splicing occurs in the nucleus and intron containing pre-transcripts should be nuclear localized. Thus, intronic signals should remain localized to the nucleus unlike the mature mRNA which translocate to the cytoplasm after processing and thus exonic signals can be found both in the nucleus and the cytoplasm. In keeping with this, we observe no signal in the cytoplasm for the intronic probes and it remains localized within the nucleus as expected and can be seen in Author response image 2F, while exonic signals are observed in both compartments. This suggests to us that the signal is coming from true pre-transcripts. There is no reason for non-specific background labelling to remain restricted to the nucleus.

      • We observe that the mean intronic label counts for both the genes TFF1 and TFF3 increases upon E2-induction compared to uninduced condition (Fig. 2B). Similarly, the mean intronic count for both genes reduce drastically in the TFF1-enhancer deleted cells (Fig. 3C, D). This change in the number of intronic signal specifically on induction and enhancer deletion suggests that the signal is not an artefact and arises from true nascent transcripts that are sensitive to stimulus or enhancer deletion.

      • We expect colocalization of intronic signal with exonic signals in the nucleus, while there can be exonic signals that do not colocalize with intronic, representing more mature mRNA. Indeed, we observe a clear colocalization between the intronic and exonic signals in the nucleus, while exonic signals can occur independent of intronic both in the nucleus and the cytoplasm. This clearly demonstrates that the intronic signals in our experiments are specific and not simply background labelling (Author response image 2G).

      These studies and the arguments above lead us to conclude that the presence of intronic transcripts in the nucleus, away from the site of transcription is not an artefact. We hope the reviewer will agree with us. These analyses have now been included in the manuscript as Supplementary Figure 6 and have been added in the manuscript at line numbers 106-111, 201204,  215-217 and line 231-235. We thank the reviewer for raising this important point.

      Author response image 2.

      Dynamic induction and RNA localization of TFF1 and TFF3 transcription across cell populations using smRNA FISH A. Bar graph depicting the percentage of cells with 1,2,3,4, or greater than 4 sites of transcription for TFF1 (left) is shown. The graph shows the mean of means from different repeats of the experiment, and error bars denote SEM (n>200, N=3). Only the cells with at least one allele firing were counted and cells with no alleles were not included in this. The graph on right shows the number of cells with zero or non-zero number of alleles firing. B. Bar graph depicting the percentage of cells with 1,2,3,4 or greater than 4 sites of transcription for TFF3 (left) is shown. The graph shows the mean of means from different repeats of the experiment, and error bars denote SEM (n>200, N=3). Only the cells with at least one allele firing were counted and cells with no alleles were not included in this. The graph in the middle shows the number of cells with 2,3,4 or greater than 4 sites of transcription for TFF3.The graph on the right shows the number of cells with zero or non-zero number of alleles firing. C. Images from single molecule RNA FISH experiment showing transcripts for InTFF1 in cells induced for 1 hour with E2. The image shows that when a single allele of TFF1 is firing, the transcripts show a more spatially restricted localisation. The scale bar is 5 microns. D. Images from single molecule RNA FISH experiment showing transcripts for InTFF1 in uninduced cells. The image shows that when a single allele of TFF1 is firing and transcription is low, the transcripts show a more spatially restricted localisation. The scale bar is 5 microns. E. Line profile through several transcripts in the nucleus show uniform and similar intensities indicating that these are true signals. F. 60X Representative images from a single molecule RNA FISH experiment showing transcripts for InTFF1 and ExTFF1 (top) and InTFF3 and ExTFF3 (bottom). The image shows that there is no intronic signal in the cytoplasm, while exonic signals can be found both in the nucleus and the cytoplasm. The scale bar is 5 microns. G. 60X Representative images from single molecule RNA FISH experiment showing transcripts for InTFF1 and ExTFF1. The image shows that all intronic signals are colocalized with exonic signals, but all exonic signals are expectedly not colocalized with intronic signals, representing more mature mRNA. The scale bar is 5 microns.

      One substantial way to improve the manuscript is to take a careful look at previous single cell analysis of the estrogen response, which in some cases has been done on the exact same genes (PMID: 29476006, 35081348, 30554876, 31930333). In some of these cases, the authors reach different conclusions than those presented in the present manuscript. Likewise, there have been more than a few studies that have characterized these enhancers (the first one I know of is: PMID 18728018). Also, Oh et al. 2021 (cited in the manuscript) did show an interaction between TFF1e and TFF3, which seems to contradict the conclusion from Fig. 3. In summary, the results of this paper are not in dialogue with the field, which is a major shortcoming. 

      We thank the reviewer for pointing out these important studies. The studies from Prof. Larson group are particularly very insightful (Rodriguez et al., 2019). We have now included this in the discussion (line 106-111 and line 420-424) where we suggest the differences and similarities between our, Larson’s group and also Mancini’s group (Patange et al., 2022; Stossi et al., 2020). 

      The 4C-Seq data from the manuscript Oh et al. 2021 is exactly consistent with our observation from Fig 3 as they also observed little to no interaction between TFF1e and TFF3p in WT cells, only upon TFF1p deletion, did the TFF1e become engaged with the TFF3p. In agreement with this, we also observe little to no interaction between TFF1e and TFF3p in WT cells (Fig.3A). This is also consistent with our competition model for resources between these two genes. Oh et al. shows interaction between TFF1e and TFF3 when the TFF1 promoter is deleted showing that when the primary promoter is not available the enhancer is retargeted to the next available gene (Oh et al., 2021). It does not show that in WT or at any time point of E2 signalling does TFF1e and TFF3 interact.

      In the opinion of this reviewer, there are few - if any - experiments to interrogate the existence of LLPS for diffraction-limited spots such as those associated with transcription. This difficulty is a general problem with the field and not specific to the present manuscript. For example, transient binding will also appear as a dynamic 'spot' in the nucleus, independently of any higher-order interactions. As for Fig. 5, I don't think treating cells with 1,6 hexanediol is any longer considered a credible experiment. For example, there are profound effects on chromatin independent of changes in LLPS (PMID: 33536240).  

      We are cognizant of and appreciate the limitations pointed out by the reviewer. We and others have previously shown that ERa forms condensates on TFF1 chromatin region using ImmunoFISH assay (Saravanan et al., 2020).  The data below shows the relative mean ERα intensity on TFF1 FISH spots and random regions clearly showing an appearance of the condensate at the TFF1 site. Further, the deletion of TFF1e causes the reduction in size of this condensate. Thus, we expect that these ERα condensates are characterized by higher-order interactions and become disrupted on treatment with 1,6-hexanediol. These condensates are the size of below micron as mentioned by the reviewer, but most TF condensates are of the similar sizes. We agree with the reviewer that 1,6- hexanediol treatment is a brute-force experiment with several irreversible changes to the chromatin. Although we have tried to use it at a low concentration for a short period of time and it has been used in several papers (Chen et al., 2023; Gamliel et al., 2022). The opposite pattern of TFF1 vs. TFF3 expression upon 1,6- hexanediol treatment suggests that there is specificity. Further, to perturb condensates, mutants of ERa can be used (N-terminus IDR truncations) however, the transcriptional response of these mutants is also altered due to perturbed recruitment of coactivators that recognize Nterminus of ER, restricting the distinction between ERa functions and condensate formation.

      References:

      Chen, L., Zhang, Z., Han, Q., Maity, B. K., Rodrigues, L., Zboril, E., Adhikari, R., Ko, S.-H., Li, X., Yoshida, S. R., Xue, P., Smith, E., Xu, K., Wang, Q., Huang, T. H.-M., Chong, S., & Liu, Z. (2023). Hormone-induced enhancer assembly requires an optimal level of hormone receptor multivalent interactions. Molecular Cell, 83(19), 3438-3456.e12. https://doi.org/10.1016/j.molcel.2023.08.027

      Coté, A., O’Farrell, A., Dardani, I., Dunagin, M., Coté, C., Wan, Y., Bayatpour, S., Drexler, H. L., Alexander, K. A., Chen, F., Wassie, A. T., Patel, R., Pham, K., Boyden, E. S., Berger, S., Phillips-Cremins, J., Churchman, L. S., & Raj, A. (2023). Post-transcriptional splicing can occur in a slow-moving zone around the gene. eLife, 12. https://doi.org/10.7554/eLife.91357.2

      Coulon, A., Ferguson, M. L., de Turris, V., Palangat, M., Chow, C. C., & Larson, D. R. (2014). Kinetic competition during the transcription cycle results in stochastic RNA processing. eLife, 3, e03939. https://doi.org/10.7554/eLife.03939

      Drexler, H. L., Choquet, K., & Churchman, L. S. (2020). Splicing Kinetics and Coordination Revealed by Direct Nascent RNA Sequencing through Nanopores. Molecular Cell, 77(5), 985-998.e8. https://doi.org/10.1016/j.molcel.2019.11.017

      Gamliel, A., Meluzzi, D., Oh, S., Jiang, N., Destici, E., Rosenfeld, M. G., & Nair, S. J. (2022). Long-distance association of topological boundaries through nuclear condensates. Proceedings of the National Academy of Sciences of the United States of America, 119(32), e2206216119. https://doi.org/10.1073/pnas.2206216119

      Honkela, A., Peltonen, J., Topa, H., Charapitsa, I., Matarese, F., Grote, K., Stunnenberg, H. G., Reid, G., Lawrence, N. D., & Rattray, M. (2015). Genome-wide modeling of transcription kinetics reveals patterns of RNA production delays. Proceedings of the National Academy of Sciences of the United States of America, 112(42), 13115. https://doi.org/10.1073/pnas.1420404112

      Oh, S., Shao, J., Mitra, J., Xiong, F., D’Antonio, M., Wang, R., Garcia-Bassets, I., Ma, Q., Zhu, X., Lee, J.-H., Nair, S. J., Yang, F., Ohgi, K., Frazer, K. A., Zhang, Z. D., Li, W., & Rosenfeld, M. G. (2021). Enhancer release and retargeting activates disease-susceptibility genes. Nature, 595(7869), Article 7869. https://doi.org/10.1038/s41586-021-03577-1

      Patange, S., Ball, D. A., Wan, Y., Karpova, T. S., Girvan, M., Levens, D., & Larson, D. R. (2022). MYC amplifies gene expression through global changes in transcription factor dynamics. Cell Reports, 38(4). https://doi.org/10.1016/j.celrep.2021.110292

      Raj, A., van den Bogaard, P., Rifkin, S. A., van Oudenaarden, A., & Tyagi, S. (2008). Imaging individual mRNA molecules using multiple singly labeled probes. Nature Methods, 5(10), Article 10. https://doi.org/10.1038/nmeth.1253

      Rodriguez, J., Ren, G., Day, C. R., Zhao, K., Chow, C. C., & Larson, D. R. (2019). Intrinsic Dynamics of a Human Gene Reveal the Basis of Expression Heterogeneity. Cell, 176(1–2), 213-226.e18. https://doi.org/10.1016/j.cell.2018.11.026

      Saravanan, B., Soota, D., Islam, Z., Majumdar, S., Mann, R., Meel, S., Farooq, U., Walavalkar, K., Gayen, S., Singh, A. K., Hannenhalli, S., & Notani, D. (2020). Ligand dependent gene regulation by transient ERα clustered enhancers. PLOS Genetics, 16(1), e1008516. https://doi.org/10.1371/journal.pgen.1008516

      Stossi, F., Dandekar, R. D., Mancini, M. G., Gu, G., Fuqua, S. A. W., Nardone, A., De Angelis, C., Fu, X., Schiff, R., Bedford, M. T., Xu, W., Johansson, H. E., Stephan, C. C., & Mancini, M. A. (2020). Estrogeninduced transcription at individual alleles is independent of receptor level and active conformation but can be modulated by coactivators activity. Nucleic Acids Research, 48(4), 1800. https://doi.org/10.1093/nar/gkz1172

      Vargas, D. Y., Shah, K., Batish, M., Levandoski, M., Sinha, S., Marras, S. A. E., Schedl, P., & Tyagi, S. (2011). Single-Molecule Imaging of Transcriptionally Coupled and Uncoupled Splicing. Cell, 147(5), 1054–1065. https://doi.org/10.1016/j.cell.2011.10.024

      Waks, Z., Klein, A. M., & Silver, P. A. (2011). Cell-to-cell variability of alternative RNA splicing. Molecular Systems Biology, 7(1), 506. https://doi.org/10.1038/msb.2011.32

      Zambrano, S., Loffreda, A., Carelli, E., Stefanelli, G., Colombo, F., Bertrand, E., Tacchetti, C., Agresti, A., Bianchi, M. E., Molina, N., & Mazza, D. (2020). First Responders Shape a Prompt and Sharp NF-κB-Mediated Transcriptional Response to TNF-α. iScience, 23(9), 101529. https://doi.org/10.1016/j.isci.2020.101529

    1. Author response:

      The following is the authors’ response to the original reviews.

      Public Reviews:

      Reviewer #1 (Public Review):

      Summary:

      In this study, the authors developed a mathematical model to predict human biological ages using physiological traits. This model provides a way to identify environmental and genetic factors that impact aging and lifespan.

      Strengths:

      (1) The topic addressed by the authors - human age predication using physiological traits - is an extremely interesting, important, and challenging question in the aging field. One of the biggest challenges is the lack of well-controlled data from a large number of humans. However, the authors took this challenge and tried their best to extract useful information from available data.

      Authors thank an anonymous reviewer for agreeing that physiological clock building and analysis is an interesting and important even though challenging task.

      (2) Some of the findings can provide valuable guidelines for future experimental design for human and animal studies. For example, it was found that this mathematical model can best predict age when all different organ and physiological systems are sampled. This finding makes sense in general but can be, and has been, neglected when people use molecular markers to predict age. Most of those studies have used only one molecular trait or different traits from one tissue.

      Authors thank an anonymous reviewer for highlighting the importance of the approach we employ to sample traits for biological age prediction from multiple organs and systems, which ultimately provides more wholistic information

      Weaknesses:

      (1) As I mentioned above, the Biobank data used here are not designed for this current study, so there are many limitations for model development using these data, e.g., missing data points and irrelevant measurements for aging. This is a common caveat for human studies and has been discussed by the authors.

      Thank you for pointing out the caveats. Indeed, most databases and datasets including the UKBB that we use here have missing or inaccurate entries. We do discuss it in the text, as well as suggest and employ strategies to mitigate these caveats. We now updated the text to highlight these issues even further. Specifically, in the second paragraph of the “Results” section, we added the following text: “Most large human databases and datasets, including UKBB, have certain limitations, such as incomplete or missing data points. Therefore, before proceeding to modelling aging, we needed to address the following three issues:”

      (2) There is no validation dataset to verify the proposed model. The authors suggested that human biological age can be predicted with high accuracy using 12 simple physiological measurements. It will be super useful and convincing if another biobank dataset containing those 12 traits can be applied to the current model.

      Thank you for this comment. Indeed, having a replication cohort would be quite valuable. As of today, there is no comparable dataset to verify performance of the clock model or to attempt to validate GWAS results. The closest possible is the NIH-led research program “All Of Us”, which aims to collect data on 1 million people, which unfortunately is not available to for-profit companies. It is theoretically possible to rebuild a clock only using a small number of phenotypes present in both datasets with the goal of training it on one dataset and test-applying it to another, but this won’t ultimately address the accuracy of the wholistic physiological clock presented here. We hope academic labs will utilize our clock-modeling approach and apply it to datasets currently unavailable to us and publish their findings.

      To strengthen the credentials of our biological clock, we would like to remind the reviewer that we performed 10 rounds of validation, where, in each round, 10% of the data were left out from the model training such that the clock was created using remaining 90%. The model was subsequently tested on the 10% that was left out. Over 10 rounds, different 10% of data were left out and statistics for this 10-fold cross-validation age available in the supplementary materials. We have now updated the text to make this validation more apparent.

      Specifically, we added to the "Results” section, “A mathematical model to predict age” subsection, third paragraph, the following text: “Specifically, we performed 10 rounds of cross-validation, where 10% of data were held out and the remaining 90% used for training. Over 10 rounds, different 10% were held out for validation. In each case, the findings were validated in the test set. Full statistics and approach are described in supplementary computational methods.”

      Additionally, the details of this cross-validation are described in detail in supplementary methods.

      Additionally, we compared published GWAS results obtained for human aging clocks using modalities that were different yet relevant to human health. Specifically, we looked at GWAS for “Epigenetic Blood Age Acceleration” (Lu et al., 2018), ML-imaging-based human retinal aging clock (Ahadi et al., 2023), PhenoAgeAcceleration and BioAgeAcceleration (Kuo et al., 2021), and the ∆Age GWAS that we presented in our manuscript. We now describe the results of this comparison in our manuscript. Briefly, there is no overlap between GWAS results for any two of these published clocks built via different modalities – retina, DNA methylation, or physiological functions (between each other or with our model). However, there is a significant genetic overlap (p<10E-8) between clocks built using human phenotypic measures in a cohort of National Health and Nutrition Examination Survey (NHANES) III in the United States (7 variables) and ∆Age from Physiological clock from UKBB that we describe here (121 variables), further validating our approach. It is interesting to consider the reasons why genetic associations for human aging built using different modalities do not appear to have common genetic corelates, something we also now discuss in our manuscript.

      Specifically, we added to the "Results” section, “Genetic loci associated with biological age” subsection, third paragraph, the following text: “Additionally, we compared our ∆Age GWAS association results with similar GWAS studies that were performed for other biological clocks. For example, (McCartney et al., 2021) used DNA methylation data on 40,000 individuals to compute biological age called GrimAge. After that they calculated an intrinsic epigenetic age acceleration (IEAA, a value similar to ∆Age, which measured a deviation of biological age from chronological age) and performed GWAS.” Additionally, we added to the “Discussion” section, “Broader implications of the model for physiological aging” subsection, fourth paragraph, the following text: “To further analyze the meaning of genetic associations with ∆Age that we described above, we compared several published GWAS results obtained for human aging clocks using different health modalities. Specifically, we looked at GWAS for “Epigenetic Blood Age Acceleration” (Lu et al., 2018), ML-imaging-based human retinal aging clock (Ahadi et al., 2023), PhenoAgeAcceleration and BioAgeAcceleration (Kuo et al., 2021), and the ∆Age GWAS we presented in our manuscript. Surprisingly, we discovered that there is no overlap between GWAS results for any two of these clocks built via different modalities – retina, DNA methylation, or physiological functions. However, there is a significant genetic overlap between clocks built using human phenotypic measures and our ∆Age model we describe. For example, the Biological Age Clock Acceleration calculated using HbA1c, Albumin, Cholesterol, FEV, Urea nitrogen, SBP, and Creatinine (Levine, 2013) in a US cohort [from National Health and Nutrition Examination Survey (NHANES)] yielded 16 significant hits in the GWAS analysis, five of which were also significant in our GWAS for UKBB based ∆Age. These five common loci were close to the following genes - APOB, PIK3CG, TRIB1, SMARCA4, and APOE. The significance of this overlap is p < 10<sup>-8</sup>, suggesting that the ∆Age model we propose might be translatable to other cohorts of people.

      An interesting question to consider is why GWAS results from other clock modalities, such as DNA methylation and retinal imaging do not yield any genetic similarities to each other or to physiological and biological clocks. It is possible that these modalities of age assessment depend on completely genetically independent biological processes. For example, in a simplified manner - blood composition might be heavily weighted for DNA methylation, vascular structure for retinal scans, and muscle/bone/kidney health for physiological clocks. Data from model organisms suggest the master regulators of aging exist, and APOE is the best genetic variant known to influence human aging. Interestingly, only the biological and physiological clock models that we propose here pick it up as a hit. Alternatively, it is also possible that the true master regulators of aging rate are under stringent purifying selection; for example, due to an important role in development, and therefore, do not have genetic variability in human populations examined. As such, they could not be identified as hits in any GWAS studies.”

      Reviewer #2 (Public Review):

      In this manuscript, Libert et al. develop a model to predict an individual's age using physiological traits from multiple organ systems. The difference between the predicted biological age and the chronological age -- ∆Age, has an effect equivalent to that of a chronological year on Gompertz mortality risk. By conducting GWAS on ∆Age, the authors identify genetic factors that affect aging and distinguish those associated with age-related diseases. The study also uncovers environmental factors and employs dropout analysis to identify potential biomarkers and drivers for ∆Age. This research not only reveals new factors potentially affecting aging but also shows promise for evaluating therapeutics aimed at prolonging a healthy lifespan. This work represents a significant advancement in data-driven understanding of aging and provides new insights into human aging. Addressing the points raised would enhance its scientific validity and broaden its implications.

      Thank you!

      Major points:

      (1) Enhance the description and clarity of model evaluation.

      The manuscript requires additional details regarding the model's evaluation. The authors have stated "To develop a model that predicts age, we experimented with several algorithms, including simple linear regression, Gradient Boosting Machine (GBM) and Partial Least Squares regression (PLS). The outcomes of these approaches were almost identical". It is currently unclear whether the 'almost identical outcomes' mentioned refer to the similarity in top contribution phenotypes, the accuracy of age prediction, or both. To resolve this ambiguity, it would be beneficial to include specific results and comparisons from each of these models.

      Thank you for this comment. We now describe details of the model selection and provide data on outcome caparisons. Briefly, different approaches have different advantages and limitations; however, we chose one approach, and did not develop and analyze several independent models in parallel in order to not artificially inflate our False Discovery Rate (FDR). However, we now provide rationale and comparative performance of these three approaches. Specifically, we added to the "Results” section, “A mathematical model to predict age” subsection, first paragraph the following text: “Different approaches have different advantages and limitations; however, we decided to choose one approach, and not develop and analyze several independent models in parallel in order to not artificially inflate the False Discovery Rate (FDR). We ultimately selected PLS regression because it enabled us to determine the number and composition of components required to predict age optimally from the data, which provides additional insights into the biology of human aging. But before making this selection, we compared the performance of the three approaches. The outcomes of PLS and linear regression were almost identical (R-squared between ∆Age values derived by these two methods was 0.99, meaning that if one model were to predict an individual was 62 years old, the other model would have the same prediction). This similarity is likely due to the small number of predictors (121 phenotypes) and comparatively large number of participants (over 400,000). The correlation between GBM model outcomes and PLS (and linear regression) was slightly smaller (R-squared = 0.87). The reason for the lower correlation is likely the need for imputation in PLS and linear regression models. The GBM model tolerates missing data, whereas linear regression and PLS methods require imputation or removal of individuals with too many datapoints missing, an approach we describe in more detail below.”

      Additionally, after we obtained associations of ∆Age values with genetical loci, which formed the candidate base for gene targets to influence human aging (figure 5b), we verified the top association obtained via the PLS model in Linear and GBM models. All the top candidates that we verified had statistically significant associations in all the models of ∆Age (CST3, APOE, HLA locus, CPS1, PIK3CG, IGF1). The precise strengths of the associations were different, but that is to be expected given that linear datasets had some data imputed while GBM model was built with missing values. We believe that due to small number of predictors (121) compared to a vastly larger number of individuals (over 400,000), the differences the three models introduced to final outcomes were quite small.

      To convey this message, we added to the "Discussion” section, “Broader implications of the model for physiological aging” subsection, 7th paragraph, the following text: “It is interesting to note that the three approaches we used to generate age prediction model (PLS, GBM, and linear regression) yielded very similar or identical results in performance. We chose to settle on one approach (PLS) to not artificially inflate the False Discovery Rate (FDR); however, we verified that the top genetic loci associations obtained via the PLS model were also obtained in the GBM and linear models. Specifically, the top candidates (CST3, APOE, HLA locus, CPS1, PIK3CG, IGF1) identified in the PLS approach had statistically significant associations in all the models of ∆Age. It is likely that due to the small number of predictors (121) compared to a vastly larger number of individuals (over 400,000), the differences that these models introduce to final outcomes are quite small, which increases our confidence in the results.”

      Furthermore, the authors mention "to test for overfitting, a PLS model had been generated on randomly selected 90% of individuals and tested on the remaining 10% with similar results". To comprehensively assess the model's performance, it is crucial to provide detailed results for both the test and validation datasets. This should at least include metrics such as correlation coefficients and mean squared error for both training and test datasets.

      Thank you for bringing up this point. The detailed description, details and statistics of cross-validation procedure is described in supplementary computational methods. Briefly, across 10 rounds of validation the Root Mean Square Error of Prediction (RMSEP) did not exceed 4.81 for females when all 9 PLS components were considered, and RMSEP form males was 5.1 when all 11 components were considered. The variation of RMSEP between different datasets was less than 0.1. We have now updated the text to make this validation more apparent. Specifically, we added to the "Results” section, “A mathematical model to predict age” subsection, third paragraph the following text: “Specifically, we performed 10 rounds of cross-validation, where 10% of data were held out and the remaining 90% used for training. Over 10 rounds, different 10% were held out for validation. In each case, the findings were validated in the test set. Full statistics and approach are described in supplementary computational methods.”

      (2) External validation and generalization of results

      To enhance the robustness and generalizability of the study's findings, it is crucial to perform external validation using an independent population. Specifically, conducting validation with the participants of the 'All of Us' research program offers a unique opportunity. This diverse and extensive cohort, distinct from the initial study group, will serve as an independent validation set, providing insights into the applicability of the study's conclusions across varied demographics.

      Thank you for this comment. As we mentioned above, we agree that having a replication cohort would be very valuable for this study, as well as many other studies that stem from UKBB dataset. However, yet, there is no comparable dataset to verify performance of the clock or to attempt to validate GWAS results. The closest possible is NIH-led research program “All Of Us”, which aims to collect data on 1 million people, which unfortunately is not available to for-profit companies. It is theoretically possible to rebuild a clock only using the small number of phenotypes present in both datasets with the goal of training it on one dataset and test-applying it to another, but that approach would not ultimately be informative about the accuracy of the complete physiological clock presented here. We hope academic labs will utilize our clock approach and apply it to datasets currently unavailable to us and publish their findings. For the detailed response on this issue, please see the response to the second comment of the first reviewer above.

      Recommendations for the authors:

      Reviewer #1 (Recommendations For The Authors):

      Specific questions/suggestions:<br /> - It looks like the ages of participants are enriched around 60 years (Fig. 1, Fig 3b). Can authors clarify whether age distribution affects the correlation tests (e.g. correlation in Fig 2)?

      Indeed, the distribution of people by age is enriched by 60–65-year-olds and is depleted at younger and older ages. Such a distribution influences the uncertainty of correlations that we compute, with error bars being larger for 40- and 70-year-olds and lower for 50- and 60-year-olds. The example of this can be seen on figure 1F. Figures 2a,b,g,h mostly deal with the correlation of phenotypes with each other and thus are not influenced by age. For other computations, such age prediction, it is theoretically possible that if age determinants among 65-year-olds differ from those for 40- or 80-year-olds, the calculated contributions would be skewed to increase accuracy in the middle of distribution at the expense of the ends. ∆Age, however, was explicitly normalized for each age cohort (Fig. 3a) to avoid “birth cohort” bias, therefore minimizing the effect of uneven distribution on further analysis, such as GWAS. We now acknowledge and describe this feature of UKBB dataset in the first paragraph of the “Results” section.

      - Phenotypic variation usually increases during aging. However, the authors showed that delta-age and age are not correlated (Figure 3a), suggesting that biological variation does not increase during aging in their analysis. Can authors provide more evidence supporting their findings? Is this phenomenon affected by their normalization method?

      Thank you for this comment. We find that there is no strict rule for phenotypic variation change with age. Certain phenotypes, such as blood pressure (Fig. 1a) or SHGB (Fig. 1d), indeed increase in variation with advanced age, however many others, such as grip strength (Fig. 1b) and BMI do not change in variation, and certain phenotypes even decrease their variation with age. As we stated above, in order to minimize the possible effect of “birth cohort” bias on subsequent analysis, as well as uneven distribution of people across ages, ∆Age was normalized per age cohort. Additionally, purifying selection likely also limits how far most physiological factors can deviate. For example, people with too high or too low blood pressures would simply perish, which would limit continuous increase in variation. 

      - Authors correlate GWAS data with delta-age (Figure 4). It would be important to show whether the delta-age from young and old participants correlates with GWAS patterns in a similar manner. If not, the authors have to consider how age differences affect delta-age and the GWAS correlation. For example, the authors mentioned that APOE genotype influences age-delta even in the 40-year-old group (Figure 4f). If the APOE genotype already shows high delta-age in the 40-year-old group, how does aging affect the delta-age distribution?

      Thank you for this comment. It is an interesting question to understand how age influences GWAS hits identified through ∆Age. At the same time, one must remember that our dataset is cross-sectional in nature and “different age” in reality is a subset of different people, which lived in different times with different exposures to environments and different standards of medical care (which are evolving over time). We specifically attempted to factor age and this “cohort effect” out of our analysis and presented Figure 4f simply as an illustration that APOE variants seem to influence human aging at any age, which challenges the theory proposed by previous studies that APOE is implicated in aging simply because APOE4 carriers likely die from Alzheimer disease and are thus excluded from the oldest cohorts. To investigate the question raised by the reviewer it is possible to do GWAS on age, however one must keep in mind the limitations associated with interpreting those results; as “age” in reality (in this cross-sectional cohort) also represents changes in population composition, changes in the environment, food quality, early life care, medical care, social habits, and other parameters associated with changing society.

      - For the discussion part, it would be great if the authors could add one section to provide guidelines for future human and lab animal studies based on observations from the current study. For example, what physiological traits are most useful, and what can be further added when collecting human data?

      Thank you for the great suggestion. We now propose and discuss certain experiments that can be performed in humans and animals to better differentiate between drivers and markers of aging.

      - In line 479, I found the statement "It is possible that synapse function accounts for the association of computer gaming with ΔAge" came from nowhere, and suggest removing it.

      Done—thank you.

      - Minor. Line 155. Is it a wrong citation of table S2c, 2d as there are only 2a and 2b?<br />

      Thank you, corrected.

      Reviewer #2 (Recommendations For The Authors):

      (1) Between lines 300-305, there is a missing reference to Figure 3e.

      Thank you, corrected.

      (2) For Figures 4a and 4c, please add the lambda statistic to the QQ plots.

      Thank you, we have added lambda inflation factors to the QQ plots.

      (3) In line 384, the p-value cut-off is mentioned as 10-9. However, this does not seem to be consistently represented in Figures 4b and 4d, where the gray lines do not align with this threshold. Please adjust these figures to accurately reflect the mentioned p-value cut-off.

      Thank you, corrected.

      (4) Clarification for Figure 5a. Add titles and correlation coefficients to Figure 5a to clearly define what the clusters represent. Please also add a discussion to explain why the cluster 10 (general health) dropout model can affect ∆Age compared to the full model, with some individuals showing a 5-year difference. Furthermore, despite the substantial effect of removing cluster 10 on ΔAge, all the top loci remain unchanged in terms of effect sizes and p-values compared to the full model.

      We have added the titles and correlation coefficients to the Figure 5a. Thank you for these suggestions, it makes the presentation of data much clearer. It is an interesting observation that whereas dropping out cluster 10 resulted in quite significant changes of ∆Age distribution, the genetic signature as determined by GWAS did not change much. The most obvious explanation is that many parameters in this category are influenced by environment more than by genetics, therefore genetic signature did not change much after the cluster removal. We now mention this observation in the text. Specifically, in the subsection “Cluster-dropout analysis enriches for GWAS hits that influence aging globally”, we added the following text: “Another interesting observation is that degree by which certain cluster contributes to the model does not necessarily correlate with how much this cluster contributes to genetic signature of human aging. For example, while dropping out cluster 10 (General Health) resulted in quite significant changes of ∆Age distribution (R<sup>2</sup>=0.88), the genetic signature as determined by GWAS did not change substantially. The most likely explanation is that many parameters in this category are influenced by environment more strongly than by genetics; for example, not as much as caused by cluster 1 (muscle-related) removal.”

      (5) Discussion on drivers and markers. Given the theoretical nature of the study, it would be beneficial to propose potential experimental validations for your findings. Even if these validations have not been performed, suggesting them would greatly enhance the value of the discussion.

      Thank you, it is a great idea. We now propose and discuss certain experiments that can be performed in humans and animals to better differentiate between drivers and markers of aging. Specifically, in the subsection “Cluster-dropout analysis enriches for GWAS hits that influence aging globally”, we added the following text: “To definitively distinguish whether a gene is a driver or a marker of aging, an experiment would need to be performed. It is possible that certain gene activities are influenced by existing FDA-approved medications, and retrospective analyses of human cohorts who take certain medications can be performed. More likely, however, an animal model would need to be employed, where animals with candidate genes modified via genetic means are investigated for lifespan and onset and progression of age-associated conditions. For example, one can engineer a mouse with a conditional allele of Cystatin-C and evaluate how changes in dosage of this protein influence various phenotypes of aging.”

    1. Author response:

      The following is the authors’ response to the original reviews.

      Responses to Reviewer’s Comments:  

      To Reviewer #2:

      (1) The use of two m<sup>5</sup>C reader proteins is likely a reason for the high number of edits introduced by the DRAM-Seq method. Both ALYREF and YBX1 are ubiquitous proteins with multiple roles in RNA metabolism including splicing and mRNA export. It is reasonable to assume that both ALYREF and YBX1 bind to many mRNAs that do not contain m<sup>5</sup>C. 

      To substantiate the author's claim that ALYREF or YBX1 binds m<sup>5</sup>C-modified RNAs to an extent that would allow distinguishing its binding to non-modified RNAs from binding to m<sup>5</sup>Cmodified RNAs, it would be recommended to provide data on the affinity of these, supposedly proven, m<sup>5</sup>C readers to non-modified versus m<sup>5</sup>C-modified RNAs. To do so, this reviewer suggests performing experiments as described in Slama et al., 2020 (doi: 10.1016/j.ymeth.2018.10.020). However, using dot blots like in so many published studies to show modification of a specific antibody or protein binding, is insufficient as an argument because no antibody, nor protein, encounters nanograms to micrograms of a specific RNA identity in a cell. This issue remains a major caveat in all studies using so-called RNA modification reader proteins as bait for detecting RNA modifications in epitranscriptomics research. It becomes a pertinent problem if used as a platform for base editing similar to the work presented in this manuscript.

      The authors have tried to address the point made by this reviewer. However, rather than performing an experiment with recombinant ALYREF-fusions and m<sup>5</sup>C-modified to unmodified RNA oligos for testing the enrichment factor of ALYREF in vitro, the authors resorted to citing two manuscripts. One manuscript is cited by everybody when it comes to ALYREF as m<sup>5</sup>C reader, however none of the experiments have been repeated by another laboratory. The other manuscript is reporting on YBX1 binding to m<sup>5</sup>C-containing RNA and mentions PARCLiP experiments with ALYREF, the details of which are nowhere to be found in doi: 10.1038/s41556-019-0361-y.

      Furthermore, the authors have added RNA pull-down assays that should substitute for the requested experiments. Interestingly, Figure S1E shows that ALYREF binds equally well to unmodified and m<sup>5</sup>C-modified RNA oligos, which contradicts doi:10.1038/cr.2017.55, and supports the conclusion that wild-type ALYREF is not specific m<sup>5</sup>C binder. The necessity of including always an overexpression of ALYREF-mut in parallel DRAM experiments, makes the developed method better controlled but not easy to handle (expression differences of the plasmid-driven proteins etc.) 

      Thank you for pointing this out. First, we would like to correct our previous response: the binding ability of ALYREF to m<sup>5</sup>C-modified RNA was initially reported in doi: 10.1038/cr.2017.55, (and not in doi: 10.1038/s41556-019-0361-y), where it was observed through PAR-CLIP analysis that the K171 mutation weakens its binding affinity to m<sup>5</sup>C -modified RNA.

      Our previous experimental approach was not optimal: the protein concentration in the INPUT group was too high, leading to overexposure in the experimental group. Additionally, we did not conduct a quantitative analysis of the results at that time. In response to your suggestion, we performed RNA pull-down experiments with YBX1 and ALYREF, rather than with the pan-DRAM protein, to better validate and reproduce the previously reported findings. Our quantitative analysis revealed that both ALYREF and YBX1 exhibit a stronger affinity for m<sup>5</sup>C -modified RNAs. Furthermore, mutating the key amino acids involved in m<sup>5</sup>C recognition significantly reduced the binding affinity of both readers. These results align with previous studies (doi: 10.1038/cr.2017.55 and doi: 10.1038/s41556-019-0361-y), confirming that ALYREF and YBX1 are specific readers of m<sup>5</sup>C -modified RNAs. However, our detection system has certain limitations. Despite mutating the critical amino acids, both readers retained a weak binding affinity for m<sup>5</sup>C, suggesting that while the mutation helps reduce false positives, it is still challenging to precisely map the distribution of m<sup>5</sup>C modifications. To address this, we plan to further investigate the protein structure and function to obtain a more accurate m<sup>5</sup>C sequencing of the transcriptome in future studies. Accordingly, we have updated our results and conclusions in lines 294-299 and discuss these limitations in lines 109114.

      In addition, while the m<sup>5</sup>C assay can be performed using only the DRAM system alone, comparing it with the DRAM<sup>mut</sup> control enhances the accuracy of m<sup>5</sup>C region detection. To minimize the variations in transfection efficiency across experimental groups, it is recommended to use the same batch of transfections. This approach not only ensures more consistent results but also improve the standardization of the DRAM assay, as discussed in the section added on line 308-312.

      (2) Using sodium arsenite treatment of cells as a means to change the m<sup>5</sup>C status of transcripts through the downregulation of the two major m<sup>5</sup>C writer proteins NSUN2 and NSUN6 is problematic and the conclusions from these experiments are not warranted. Sodium arsenite is a chemical that poisons every protein containing thiol groups. Not only do NSUN proteins contain cysteines but also the base editor fusion proteins. Arsenite will inactivate these proteins, hence the editing frequency will drop, as observed in the experiments shown in Figure 5, which the authors explain with fewer m<sup>5</sup>C sites to be detected by the fusion proteins.

      The authors have not addressed the point made by this reviewer. Instead the authors state that they have not addressed that possibility. They claim that they have revised the results section, but this reviewer can only see the point raised in the conclusions. An experiment would have been to purify base editors via the HA tag and then perform some kind of binding/editing assay in vitro before and after arsenite treatment of cells.

      We appreciate the reviewer’s insightful comment. We fully agree with the concern raised. In the original manuscript, our intention was to use sodium arsenite treatment to downregulate NSUN mediated m<sup>5</sup>C levels and subsequently decrease DRAM editing efficiency, with the aim of monitoring m<sup>5</sup>C dynamics through the DRAM system. However, as the reviewer pointed out, sodium arsenite may inactivate both NSUN proteins and the base editor fusion proteins, and any such inactivation would likely result in a reduced DRAM editing.

      This confounds the interpretation of our experimental data.

      As demonstrated in Author response image 1A, western blot analysis confirmed that sodium arsenite indeed decreased the expression of fusion proteins. In addition, we attempted in vitro fusion protein purificationusing multiple fusion tags (HIS, GST, HA, MBP) for DRAM fusion protein expression, but unfortunately, we were unable to obtain purified proteins. However, using the Promega TNT T7 Rapid Coupled In Vitro Transcription/Translation Kit, we successfully purified the DRAM protein (Author response image 1B). Despite this success, subsequent in vitro deamination experiments did not yield the expected mutation results (Author response image 1C), indicating that further optimization is required. This issue is further discussed in line 314-315.

      Taken together, the above evidence supports that the experiment of sodium arsenite treatment was confusing and we determined to remove the corresponding results from the main text of the revised manuscript.

      Author response image 1.

      (3) The authors should move high-confidence editing site data contained in Supplementary Tables 2 and 3 into one of the main Figures to substantiate what is discussed in Figure 4A. However, the data needs to be visualized in another way then excel format. Furthermore, Supplementary Table 2 does not contain a description of the columns, while Supplementary Table 3 contains a single row with letters and numbers.

      The authors have not addressed the point made by this reviewer. Figure 3F shows the screening process for DRAM-seq assays and principles for screening highconfidence genes rather than the data contained in Supplementary Tables 2 and 3 of the former version of this manuscript.

      Thank you for your valuable suggestion. We have visualized the data from Supplementary Tables 2 and 3 in Figure 4A as a circlize diagram (described in lines 213-216), illustrating the distribution of mutation sites detected by the DRAM system across each chromosome. Additionally, to improve the presentation and clarity of the data, we have revised Supplementary Tables 2 and 3 by adding column descriptions, merging the DRAM-ABE and DRAM-CBE sites, and including overlapping m<sup>5</sup>C genes from previous datasets.

      Responses to Reviewer’s Comments:  

      To Reviewer #3:

      The authors have again tried to address the former concern by this reviewer who questioned the specificity of both m<sup>5</sup>C reader proteins towards modified RNA rather than unmodified RNA. The authors chose to do RNA pull down experiments which serve as a proxy for proving the specificity of ALYREF and YBX1 for m<sup>5</sup>C modified RNAs. Even though this reviewer asked for determining the enrichment factor of the reader-base editor fusion proteins (as wildtype or mutant for the identified m<sup>5</sup>C specificity motif) when presented with m<sup>5</sup>C-modified RNAs, the authors chose to use both reader proteins alone (without the fusion to an editor) as wildtype and as respective m<sup>5</sup>C-binding mutant in RNA in vitro pull-down experiments along with unmodified and m<sup>5</sup>C-modified RNA oligomers as binding substrates. The quantification of these pull-down experiments (n=2) have now been added, and are revealing that (according to SFigure 1 E and G) YBX1 enriches an RNA containing a single m<sup>5</sup>C by a factor of 1.3 over its unmodified counterpart, while ALYREF enriches by a factor of 4x. This is an acceptable approach for educated readers to question the specificity of the reader proteins, even though the quantification should be performed differently (see below).

      Given that there is no specific sequence motif embedding those cytosines identified in the vicinity of the DRAM-edits (Figure 3J and K), even though it has been accepted by now that most of the m<sup>5</sup>C sites in mRNA are mediated by NSUN2 and NSUN6 proteins, which target tRNA like substrate structures with a particular sequence enrichment, one can conclude that DRAM-Seq is uncovering a huge number of false positives. This must be so not only because of the RNA bisulfite seq data that have been extensively studied by others, but also by the following calculations: Given that the m<sup>5</sup>C/C ratio in human mRNA is 0.02-0.09% (measured by mass spec) and assuming that 1/4 of the nucleotides in an average mRNA are cytosines, an mRNA of 1.000 nucleotides would contain 250 Cs. 0.02- 0.09% m<sup>5</sup>C/C would then translate into 0.05-0.225 methylated cytosines per 250 Cs in a 1000 nt mRNA. YBX1 would bind every C in such an mRNA since there is no m<sup>5</sup>C to be expected, which it could bind with 1.3 higher affinity. Even if the mRNAs would be 10.000 nt long, YBX1 would bind to half a methylated cytosine or 2.25 methylated cytosines with 1.3x higher affinity than to all the remaining cytosines (2499.5 to 2497.75 of 2.500 cytosines in 10.000 nt, respectively). These numbers indicate a 4999x to 1110x excess of cytosine over m<sup>5</sup>C in any substrate RNA, which the "reader" can bind as shown in the RNA pull-downs on unmodified RNAs. This reviewer spares the reader of this review the calculations for ALYREF specificity, which is slightly higher than YBX1. Hence, it is up to the capable reader of these calculations to follow the claim that this minor affinity difference allows the unambiguous detection of the few m<sup>5</sup>C sites in mRNA be it in the endogenous scenario of a cell or as fusion-protein with a base editor attached? 

      We sincerely appreciate the reviewer’s rigorous analysis. We would like to clarify that in our RNA pulldown assays, we indeed utilized the full DRAM system (reader protein fused to the base editor) to reflect the specificity of m<sup>5</sup>C recognition. As previously suggested by the reviewer, to independently validate the m<sup>5</sup>C-binding specificity of ALYREF and YBX1, we performed separate pulldown experiments with wild-type and mutant reader proteins (without the base editor fusion) using both unmodified and m<sup>5</sup>C-modified RNA substrates. This approach aligns with established methodologies in the field (doi:10.1038/cr.2017.55 and doi: 10.1038/s41556-019-0361-y). We have revised the Methods section (line 230) to explicitly describe this experimental design.

      Although the m<sup>5</sup>C/C ratios in LC/MS-assayed mRNA are relatively low (ranging from 0.02% to 0.09%), as noted by the reviewer, both our data and previous studies have demonstrated that ALYREF and YBX1 preferentially bind to m<sup>5</sup>C-modified RNAs over unmodified RNAs, exhibiting 4-fold and 1.3-fold enrichment, respectively (Supplementary Figure 1E–1G). Importantly, this specificity is further enhanced in the DRAM system through two key mechanisms: first, the fusion of reader proteins to the deaminase restricts editing to regions near m<sup>5</sup>C sites, thereby minimizing off-target effects; second, background editing observed in reader-mutant or deaminase controls (e.g., DRAM<sup>mut</sup>-CBE in Figure 2D) is systematically corrected for during data analysis.

      We agree that the theoretical challenge posed by the vast excess of unmodified cytosines. However, our approach includes stringent controls to alleviate this issue. Specifically, sites identified in NSUN2/NSUN6 knockout cells or reader-mutant controls are excluded (Figure 3F), which significantly reduces the number of false-positive detections. Additionally, we have observed deamination changes near high-confidence m<sup>5</sup>C methylation sites detected by RNA bisulfite sequencing, both in first-generation and high-throughput sequencing data. This observation further substantiates the validity of DRAM-Seq in accurately identifying m<sup>5</sup>C sites.

      We fully acknowledge that residual false positives may persist due to the inherent limitations of reader protein specificity, as discussed in line 299-301 of our manuscript. To address this, we plan to optimize reader domains with enhanced m<sup>5</sup>C binding (e.g., through structure-guided engineering), which is also previously implemented in the discussion of the manuscript.

      The reviewer supports the attempt to visualize the data. However, the usefulness of this Figure addition as a readable presentation of the data included in the supplement is up to debate.

      Thank you for your kind suggestion. We understand the reviewer's concern regarding data visualization. However, due to the large volume of DRAM-seq data, it is challenging to present each mutation site and its characteristics clearly in a single figure. Therefore, we chose to categorize the data by chromosome, which not only allows for a more organized presentation of the DRAM-seq data but also facilitates comparison with other database entries. Additionally, we have updated Supplementary Tables 2 and 3 to provide comprehensive information on the mutation sites. We hope that both the reviewer and editors will understand this approach. We will, of course, continue to carefully consider the reviewer's suggestions and explore better ways to present these results in the future.

      (3) A set of private Recommendations for the Authors that outline how you think the science and its presentation could be strengthened

      NEW COMMENTS to TEXT:

      Abstract:

      "5-Methylcytosine (m<sup>5</sup>C) is one of the major post-transcriptional modifications in mRNA and is highly involved in the pathogenesis of various diseases."

      In light of the increasing use of AI-based writing, and the proof that neither DeepSeek nor ChatGPT write truthfully statements if they collect metadata from scientific abstracts, this sentence is utterly misleading.

      m<sup>5</sup>C is not one of the major post-transcriptional modifications in mRNA as it is only present with a m<sup>5</sup>C/C ratio of 0.02- 0.09% as measured by mass-spec. Also, if m<sup>5</sup>C is involved in the pathogenesis of various diseases, it is not through mRNA but tRNA. No single published work has shown that a single m<sup>5</sup>C on an mRNA has anything to do with disease. Every conclusion that is perpetuated by copying the false statements given in the many reviews on the subject is based on knock-out phenotypes of the involved writer proteins. This reviewer wishes that the authors would abstain from the common practice that is currently flooding any scientific field through relentless repetitions in the increasing volume of literature which perpetuate alternative facts.

      We sincerely appreciate the reviewer’s insightful comments. While we acknowledge that m<sup>5</sup>C is not the most abundant post-transcriptional modification in mRNA, we believe that research into m<sup>5</sup>C modification holds considerable value. Numerous studies have highlighted its role in regulating gene expression and its potential contribution to disease progression. For example, recent publications have demonstrated that m<sup>5</sup>C modifications in mRNA can influence cancer progression, lipid metabolism, and other pathological processes (e.g., PMID: 37845385; 39013911; 39924557; 38042059; 37870216).

      We fully agree with the reviewer on the importance of maintaining scientific rigor in academic writing. While m<sup>5</sup>C is not the most abundant RNA modification, we cannot simply draw a conclusion that the level of modification should be the sole criterion for assessing its biological significance. However, to avoid potential confusion, we have removed the word “major”.

      COMMENTS ON FIGURE PRESENTATION:

      Figure 2D:

      The main text states: "DRAM-CBE induced C to U editing in the vicinity of the m<sup>5</sup>C site in AP5Z1 mRNA, with 13.6% C-to-U editing, while this effect was significantly reduced with APOBEC1 or DRAM<sup>mut</sup>-CBE (Fig.2D)." The Figure does not fit this statement. The seq trace shows a U signal of about 1/3 of that of C (about 30%), while the quantification shows 20+ percent

      Thank you for your kind suggestion. Upon visual evaluation, the sequencing trace in the figure appears to suggest a mutation rate closer to 30% rather than 22%. However, relying solely on the visual interpretation of sequencing peaks is not a rigorous approach. The trace on the left represents the visualization of Sanger sequencing results using SnapGene, while the quantification on the right is derived from EditR 1.0.10 software analysis of three independent biological replicates. The C-to-U mutation rates calculated were 22.91667%, 23.23232%, and 21.05263%, respectively. To further validate this, we have included the original EditR analysis of the Sanger sequencing results for the DRAM-CBE group used in the left panel of Figure 2D (see Author response image 2). This analysis confirms an m<sup>5</sup>C fraction (%) of 22/(22+74) = 22.91667, and the sequencing trace aligns well with the mutation rate we reported in Figure 2D. In conclusion, the data and conclusions presented in Figure 2D are consistent and supported by the quantitative analysis.

      Author response image 2.

      Figure 4B: shows now different numbers in Venn-diagrams than in the same depiction, formerly Figure 4A

      We sincerely thank the reviewer for pointing out this issue, and we apologize for not clearly indicating the changes in the previous version of the manuscript. In response to the initial round of reviewer comments, we implemented a more stringent data filtering process (as described in Figure 3F and method section) : "For high-confidence filtering, we further adjusted the parameters of Find_edit_site.pl to include an edit ratio of 10%–60%, a requirement that the edit ratio in control samples be at least 2-fold higher than in NSUN2 or NSUN6knockout samples, and at least 4 editing events at a given site." As a result, we made minor adjustments to the Venn diagram data in Figure 4A, reducing the total number of DRAM-edited mRNAs from 11,977 to 10,835. These changes were consistently applied throughout the manuscript, and the modifications have been highlighted for clarity. Importantly, these adjustments do not affect any of the conclusions presented in the manuscript.

      Figure 4B and D: while the overlap of the DRAM-Seq data with RNA bisulfite data might be 80% or 92%, it is obvious that the remaining data DRAM seq suggests a detection of additional sites of around 97% or 81.83%. It would be advised to mention this large number of additional sites as potential false positives, unless these data were normalized to the sites that can be allocated to NSUN2 and NSUN6 activity (NSUN mutant data sets could be substracted).

      Thank you for pointing this out. The Venn diagrams presented in Figure 4B and D already reflect the exclusion of potential false-positive sites identified in methyltransferasedeficient datasets, as described in our experimental filtering process, and they represent the remaining sites after this stringent filtering. However, we acknowledge that YBX1 and ALYREF, while preferentially binding to m<sup>5</sup>C-modified RNA, also exhibit some affinity for unmodified RNA. Although we employed rigorous controls, including DRAM<sup>mut</sup> and deaminase groups, to minimize false positives, the possibility of residual false positives cannot be entirely ruled out. Addressing this limitation would require even more stringent filtering methods, as discussed in lines 299–301 of the manuscript. We are committed to further optimizing the DRAM system to enhance the accuracy of transcriptome-wide m<sup>5</sup>C analysis in future studies.

      SFigure 1: It is clear that the wild type version of both reader proteins are robustly binding to RNA that does not contain m<sup>5</sup>C. As for the calculations of x-fold affinity loss of RNA binding using both ALYREF -mut or YBX1 -mut, this reviewer asks the authors to determine how much less the mutated versions of the proteins bind to a m<sup>5</sup>C-modified RNAs. Hence, a comparison of YBX1 versus YBX1 -mut (ALYREF versus ALYREF -mut) on the same substrate RNA with the same m<sup>5</sup>C-modified position would allow determining the contribution of the so-called modification binding pocket in the respective proteins to their RNA binding. The way the authors chose to show the data presently is misleading because what is compared is the binding of either the wild type or the mutant protein to different RNAs.

      We appreciate the reviewer’s valuable feedback and apologize for any confusion caused by the presentation of our data. We would like to clarify the rationale behind our approach. The decision to present the wild-type and mutant reader proteins in separate panels, rather than together, was made in response to comments from Reviewer 2. Below, we provide a detailed explanation of our experimental design and its justification.

      First, we confirmed that YBX1 and ALYREF exhibit stronger binding affinity to m<sup>5</sup>Cmodified RNA compared to unmodified RNA, establishing their role as m<sup>5</sup>C reader proteins. Next, to validate the functional significance of the DRAM<sup>mut</sup> group, we demonstrated that mutating key amino acids in the m<sup>5</sup>C-binding pocket significantly reduces the binding affinity of YBX1<sup>mut</sup> and ALYREF<sup>mut</sup> to m<sup>5</sup>C-modified RNA. This confirms that the DRAM<sup>mut</sup> group effectively minimizes false-positive results by disrupting specific m<sup>5</sup>C interactions.

      Crucially, in our pull-down experiments, both the wild-type and mutant proteins (YBX1/YBX1<sup>mut</sup> and ALYREF/ALYREF<sup>mut</sup>) were incubated with the same RNA sequences. To avoid any ambiguity, we have included the specific RNA sequence information in the Methods section (lines 463–468). This ensures a assessment of the reduced binding affinity of the mutant versions relative to the wild-type proteins, even though they are presented in separate panels.

      We hope this explanation clarifies our approach and demonstrates the robustness of our findings. We sincerely appreciate the reviewer’s understanding and hope this addresses their concerns.

      SFigure 2C: first two panels are duplicates of the same image.

      Thank you for pointing this out. We sincerely apologize for incorrectly duplicating the images. We have now updated Supplementary Figure 2C with the correct panels and have provided the original flow cytometry data for the first two images. It is important to note that, as demonstrated by the original data analysis, the EGFP-positive quantification values (59.78% and 59.74%) remain accurate. Therefore, this correction does not affect the conclusions of our study. Thank you again for bringing this to our attention.

      Author response image 3.

      SFigure 4B: how would the PCR product for NSUN6 be indicative of a mutation? The used primers seem to amplify the wildtype sequence.

      Thank you for your kind suggestion. In our NSUN6<sup>-/-</sup> cell line, the NSUN6 gene is only missing a single base pair (1bp) compared to the wildtype, which results in frame shift mutation and reduction in NSUN6 protein expression. We fully agree with the reviewer that the current PCR gel electrophoresis does not provide a clear distinction of this 1bp mutation. To better illustrate our experimental design, we have included a schematic representation of the knockout sequence in SFigure 4B. Additionally, we have provided the original sequencing data, and the corresponding details have been added to lines 151-153 of the manuscript for further clarification.

      Author response image 4.

      SFigure 4C: the Figure legend is insufficient to understand the subfigure.

      Thank you for your valuable suggestion. To improve clarity, we have revised the figure legend for SFigure 4C, as well as the corresponding text in lines 178-179. We have additionally updated the title of SFigure 4 for better clarity. The updated SFigure 4C now demonstrates that the DRAM-edited mRNAs exhibit a high degree of overlap across the three biological replicates.

      SFigure 4D: the Figure legend is insufficient to understand the subfigure.

      Thank you for your kind suggestion. We have revised the figure legend to provide a clearer explanation of the subfigure. Specifically, this figure illustrates the motif analysis derived from sequences spanning 10 nucleotides upstream and downstream of DRAMedited sites mediated by loci associated with NSUN2 or NSUN6. To enhance clarity, we have also rephrased the relevant results section (lines 169-175) and the corresponding discussion (lines 304-307).

      SFigure 7: There is something off with all 6 panels. This reviewer can find data points in each panel that do not show up on the other two panels even though this is a pairwise comparison of three data sets (file was sent to the Editor) Available at https://elife-rp.msubmit.net/elife-rp_files/2025/01/22/00130809/02/130809_2_attach_27_15153.pdf

      Response: We thank the reviewer for pointing this out. We would like to clarify the methodology behind this analysis. In this study, we conducted pairwise comparisons of the number of DRAM-edited sites per gene across three biological replicates of DRAM-ABE or DRAM-CBE, visualized as scatterplots. Each data point in the plots corresponds to a gene, and while the same gene is represented in all three panels, its position may vary vertically or horizontally across the panels. This variation arises because the number of mutation sites typically differs between replicates, making it unlikely for a data point to occupy the exact same position in all panels. A similar analytical approach has been used in previous studies on m6A (PMID: 31548708). To address the reviewer’s concern, we have annotated the corresponding positions of the questioned data points with arrows in Author response image 5.

      Author response image 5.

    1. Author response:

      The following is the authors’ response to the original reviews.

      Public Reviews:

      Reviewer #1 (Public review):

      Summary:

      Tamoxifen resistance is a common problem in partially ER-positive patients undergoing endocrine therapy, and this manuscript has important research significance as it is based on clinical practical issues. The manuscript discovered that the absence of FRMD8 in breast epithelial cells can promote the progression of breast cancer, thus proposing the hypothesis that FRMD8 affects tamoxifen resistance and validating this hypothesis through a series of experiments. The manuscript has a certain theoretical reference value.

      Strengths:

      At present, research on the role of FRMD8 in breast cancer is very limited. This manuscript leverages the MMTV-Cre+;Frmd8fl/fl;PyMT mouse model to study the role of FRMD8 in tamoxifen resistance, and single-cell sequencing technology discovered the interaction between FRMD8 and ESR1. At the mechanistic level, this manuscript has demonstrated two ways in which FRMD8 affects ERα, providing some new insights into the development of ER-positive breast cancer in patients who are resistant to tamoxifen.

      Weaknesses:

      This manuscript repeatedly emphasizes the role of FRMD8/FOXO3A in tamoxifen resistance in ER-positive breast cancer, but the specific mechanisms have not yet been fully elucidated. Whether FRMD8 can become a biomarker should be verified in large clinical samples or clinical data.

      We appreciate your recognition and valuable suggestions. The proliferation of ERα-positive breast cancer cells is contingent upon the expression of ERα. Tamoxifen, a selective estrogen receptor modulator, competitively binds to ERα, thereby inhibiting the activation of the proliferation signaling pathway. Previous studies have demonstrated that the downregulation of ERα expression results in a reduction in the sensitivity of breast cancer cells to tamoxifen (PMID: 15894097; PMID: 922747). Our study revealed the molecular mechanism by which FRMD8 regulates ERα expression through FOXO3A and UBE3A, and thus FRMD8 deficiency is a cause of tamoxifen treatment resistance. 

      In this study, our results showed that low expression of FRMD8 predicts poor prognosis in breast cancer patients. We agree with this reviewer and will validate the role of FRMD8 in more patient samples and expand its application in different cancer types.

      Reviewer #2 (Public review):

      Summary:

      The manuscript presents a valuable finding on the impact of FRMD8 loss on tumor progression and the resistance to tamoxifen therapy. The author conducted systematic experiments to explore the role of FRMD8 in breast cancer and its potential regulatory mechanisms, confirming that FRMD8 could serve as a potential target to revere tamoxifen resistance.

      Strengths:

      The majority of the research is logically clear, smooth, and persuasive.

      Weaknesses:

      Some research in the article lacks depth and some sentences are poorly organized.

      Thank you for your helpful suggestion. We have carefully revised the manuscript again. 

      Recommendations for the authors:  

      Reviewer #1 (Recommendations for the authors):

      This manuscript suggests that the resistance of tamoxifen in breast cancer is linked to the loss of function of FRMD8. This is a relatively good and valuable contribution. However, there are several points that confused me.

      (1) The subfigures with important conclusions should include quantitative analysis, for example, Figure 4D, 4E, and 6A. In Figure 6F, which subtypes of normal and tumor tissues were investigated.

      Thank you for your helpful suggestions. We have quantified the bands in Figure 4D, 4E, and 6A and labelled them in the figures. 

      We have also provided details of the tumor samples in Table S3 and the “Materials and Methods” section. The majority of tumor tissues are invasive ductal carcinomas.

      (2) In the luminal epithelium-specific Frmd8 knockout mice (MMTV-Cre+; Frmd8fl/fl), the authors demonstrated that the loss of FRMD8 promotes the growth of breast tumors. In Figure 3A, the expression of ERα and PR in tumors is nearly negative. However, why was the validation of the mechanism performed in breast tumor cell lines and not in epithelial cells?

      Thanks for the question. Early-stage mammary tumors in MMTV-PyMT mice express ERα, while ERα is negative in advanced tumors of MMTV-PyMT mice. Figure 3A shows the results of tumors from four-month-old mice. Meanwhile, our supplementary results showed that loss of Frmd8 decreased ERα expression also in normal and atypical hyperplasia mammary tissues from 7-week-old MMTV-PyMT mice, when the mice had no palpable tumors and ERα is positive (Fig. S3E). We believe that the absence of FRMD8 contributes to the acceleration of the malignant progression during the dynamic evolution of breast cancer. Limited by the difficulty of transfection in breast normal epithelial cell line (MCF10A), we explored the subsequent mechanisms mainly in breast cancer cells and HEK293, a human embryonic kidney cell line. Besides, Figure S3E also showed the regulation of ERα expression by Frmd8 in mouse mammary

      epithelial cells.

      (3) To explore the mechanism by which FRMD8 inhibits ERα degradation, what is the reason for choosing HEK293A?

      Thank you for the good question. HEK293 cell line is commonly used in mechanistic studies. We also employed the breast cancer cell line T47D to verify the observations in HEK293 cells. Furthermore, the mass spectrometry result of HEK293A cells presented in Figure 5E was an additional experiment performed when we were exploring the regulation of the cell cycle by FRMD8, which is published in Cell Reports (PMID: 37527040). Based on the mass spectrometry result, we assumed that FRMD8 may influence ERα degradation mediated by UBE3A.

      Reviewer #2 (Recommendations for the authors):

      Introduction

      (1) In order for the reader to better understand the content of the article, it is better to briefly describe the role of ERα in the progression of breast cancer.

      Thank you for your suggestion. We have provided a brief description of the role of ERα in the introduction of revised manuscript:

      “ERα is a ligand-activated transcription factor that is activated by oestrogen, and promotes cell proliferation during breast cancer development (Harbeck et al., 2019).”

      (2) As ESR1 is mentioned in the second paragraph, a brief description of the relationship between ESR1 and ERα can make the article more logical.

      Thank you for the suggestion. We have added the description in the introduction:

      “Multiple transcription factors, such as AP-2γ, FOXO3, FOXM1, and GATA3, have been reported to bind to the promoter region of ESR1, the gene encoding ERα, and participate in transcriptional regulation of ESR1(Jia et al., 2019; Koš et al., 2001).”

      (3) In the text, there are two variations of the term FRMD8: 'FRMD8' and 'Frmd8'. It is best to standardize on one form throughout the document.

      We apologize for any confusion. The terms "FRMD8" and "Frmd8" are used to indicate proteins derived from human and mouse, respectively.

      Results

      (4) In Figure 2L, there is no noticeable difference in the expression levels of Pgr and Esr1 between the Cre+ tumor and Cre- tumor groups. Figure S2E is more suitable for inclusion in the main text compared to Figure 2L.

      Thank you for this suggestion. ERα and PR are positive in early-stage mammary tumors of MMTV-PyMT mice, while ERα and PR are gradually lost as the tumor progresses. In figure 2, mammary tumors from 4-month-old MMTV-PyMT mice were subjected to scRNA-seq analysis. Since the expression of ERα was very low in tumor cells at this time, there appears to be no difference between the two groups. We have exchanged Figure 2L and Figure S2E in the manuscript.

      (5) The CNV score can be used to assess the malignancy of cells, it would be better to compare the malignancy levels between the two groups.

      This is a very good suggestion. However, copy number variations usually occur randomly and have a high degree of heterogeneity. Due to the limited sample size in our study, we did not compare the difference between the two groups.

      (6) Enrichment analysis is crucial for single-cell sequencing studies. It is recommended to perform differential gene analysis and enrichment analysis between the Cre+ and Cre- groups to further explore the impact of FRMD8 deficiency on the functions of malignant cells.

      Thank you for your suggestion. We have performed differential gene analysis and biological process enrichment analysis on the results of scRNA sequence using the gene ontology (GO) database. Our results showed that upregulated genes in luminal progenitor (Lp) epithelial cells were enriched in epithelial cell proliferation and transmembrane receptor protein serine/threonine kinase signaling pathways, suggesting that Frmd8 deficiency significantly promotes epithelial cells proliferation in MMTV-PyMT mice.

      Author response image 1.

      (7) The coherent logic in lines 300 to 308 should be that FRMD8 is expressed at higher levels in normal Hsd epithelial cells in mice, hence further verification was conducted to examine the expression levels of FRMD8 in various human breast cancer cell lines.

      We have revised the figures and text as suggested.  

      Discussion

      (8) In lines 352 to 360, the background narrative in the first half seems to have little connection with the research findings in the second half; it is suggested to reorganize the language of this section.

      Thank you for the advice. We have rewritten this paragraph in the manuscript:

      “In MMTV-PyMT mice, early-stage mammary tumors express ERα and PR, but these receptors are gradually lost as the tumor progresses (Lapidus et al., 1998). Our scRNA-seq results revealed that mammary tumor epithelial cells in MMTV-PyMT mice fall into four clusters, with only Hsd epithelial cells showing ERα and PR expression. Additionally, Hsd epithelial cells exhibited the lowest CNV score, indicating a closer resemblance to normal epithelial cells. The loss of Frmd8 reduced the proportion of Hsd epithelial cells and led to a downregulation of ERα and PR expression, implying that Frmd8 deficiency promotes the loss of luminal features in the mammary gland and accelerates mammary tumor progression.”

      (9) As stated in the result section, the depletion of FRMD8 may lead to the decrease of the Hsd epithelial cells proportion, it might be beneficial to discuss the significance of this finding.

      We have added a discussion of the Hsd epithelial cell proportion in the third paragraph of this section (please refer to the above question (8) ).

      Figures

      (10) The structural layout of Figure 4 should be reorganized to make it more aesthetically pleasing.

      Thank you for this suggestion. We have rearranged Figure 4 as suggested.

    1. Author response:

      Reviewer #1 (Public review):

      Strengths:

      The genetic approaches here for visualizing the recombination status of an endogenous allele are very clever, and by comparing the turnover of wildtype and mutant cells in the same animal the authors can make very convincing arguments about the effect of chronic loss of pu.1. Likely this phenotype would be either very subtle or nonexistent without the point of comparison and competition with the wildtype cells.

      Using multiple species allows for more generalizable results, and shows conservation of the phenomena at play.

      The demonstration of changes to proliferation and cell death in concert with higher expression of tp53 is compelling evidence for the authors' argument.

      Weaknesses:

      This paper is very strong. It would benefit from further investigating the specific relationship between pu.1 and tp53 specifically. Does pu.1 interact with the tp53 locus? Specific molecular analysis of this interaction would strengthen the mechanistic findings.

      We agree with the reviewer’s assessment regarding the significance of the relationship between PU.1 and TP53. A previous study by Tschan et al(1) has shown that PU.1 attenuates the transcriptional activity of the p53 tumor suppressor family through direct binding to the DNA-binding and/or the oligomerization domains of p53/p73 proteins. We will discuss this point in the revised manuscript and cite this paper accordingly. Moreover, to further investigate the interaction between Pu.1 and Tp53 in zebrafish, we intend to perform a comprehensive analysis of the tp53 promoter region utilizing bioinformatic prediction tools. This approach aims to identify potential Pu.1 binding sites, thereby providing insights into the direct regulatory interactions between Pu.1 and the tp53 promoter in zebrafish. 

      Reviewer #2 (Public review):

      Strengths:

      Generation of an elegantly designed conditional pu.1 allele in zebrafish that allows for the visual detection of expression of the knockout allele.

      The combination of analysis of pu.1 function in two model systems, zebrafish and mouse, strengthens the conclusions of the paper.

      Confirmation of the functional significance of the observed upregulation of tp53 in mutant microglia through double mutant analysis provides some mechanistic insight.

      Weaknesses:

      (1) The presented RNA-Seq analysis of mutant microglia is underpowered and details on how the data was analyzed are missing. Only 9-15 cells were analyzed in total (3 pools of 3-5 cells each). Further, the variability in relative gene expression of ccl35b.1, which was used as a quality control and inclusion criterion to define pools consisting of microglia, is extremely high (between ~4 and ~1600, Figure S7A).

      In the revised manuscript, we will elaborate on the methodological details of the RNA analysis. Owing to the technical challenge of unambiguously distinguishing microglia from dendritic cells (DCs) in brain cell suspensions, we employed a strategy of isolating 3-5 cells per pool and quantifying the relative expression of the microglia-specific marker ccl34b.1 normalized to the DC-specific marker ccl19a.1. This approach aimed to reduce DC contamination in downstream analyses. Across all experimental groups subjected to RNA-seq analysis, the ccl34b.1/ccl19a.1 expression ratios exceeded 5, confirming microglia as the dominant cell population. Nonetheless, residual DC contamination in the RNA-seq data cannot be entirely ruled out. We will explicitly acknowledge this technical constraint in the revised manuscript to ensure methodological transparency.

      (2) The authors conclude that the reduction of microglia observed in the adult brain after cKO of pu.1 in the spi-b mutant background is due to apoptosis (Lines 213-215). However, they only provide evidence of apoptosis in 3-5 dpf embryos, a stage at which loss of pu.1 alone does lead to a complete loss of microglia (Figure 2E). A control of pu.1 KI/d839 mutants treated with 4OHT should be added to show that this effect is indeed dependent on the loss of spi-b. In addition, experiments should be performed to show apoptosis in the adult brain after cKO of pu.1 in spi-b mutants as there seems to be a difference in the requirement of pu.1 in embryonic and adult stages.

      We apologize for the omission of data regarding conditional pu.1 knockout alone in the embryos in our manuscript which may have led to ambiguity. We would like to clarify that conditional pu.1 knockout alone at the embryonic stage does not induce microglial death (Author response image 1). Microglial death occurs only when Pu.1 is disrupted in the spi-b mutant background, in both embryonic and adult brains. The blebbing morphology of some microglia after pu.1 conditional knock out in adult spi-b mutant indicated microglia undergo apoptosis at both embryonic (Figure S4) and adult stages Author response image 2). The reviewer’s concern likely arises from the distinct outcomes of global pu.1 knockout (Figure 2) versus conditional pu.1 ablation. Global knockout eliminates microglia during early development due to Pu.1’s essential role in myeloid lineage specification. We plan to include this clarification in the revised manuscript.

      Author response image 1.

      Conditional depletion of Pu.1 in embryonic microglia had no effect for their short-term survival. (A) Schematics of 4-OHT treatment for pu.1<sup>KI/WT</sup> Tg(coro1a:CreER) and pu.1<sup>KI/Δ839</sup> Tg(coro1a:CreER) at embryonic stage. (B) Representative images of DsRed<sup>+</sup> microglia in pu.1<sup>KI/WT</sup> and pu.1<sup>KI/Δ839</sup> at 5 dpf. (C) Quantification of DsRed<sup>+</sup> microglia in pu.1<sup>KI/WT</sup> and pu.1<sup>KI/Δ839</sup> at 3 dpf and 5 dpf. Values represent means ± SD, n.s., P >0.05.

      Author response image 2. Simultaneous inactivation of Pu.1 and Spi-b lead to microglia death in adult zebrafish. (A) The experimental setup for pu.1 conditional knockout in adult spi-b<sup>Δ232/Δ232</sup> mutants (B) the representative images of the midbrain cross section of adult pu.1<sup>KI/+</sup>;spi-b<sup>Δ232/Δ232</sup>;Tg(coro1a:CreER) and pu.1<sup>KI/WT</sup>spi-b<sup>Δ232/Δ232</sup>;Tg(coro1a:CreER) fish at 2 dpi. The white arrow indicates microglia with blebbing morphology.

      (3) The number of microglia after pu.1 knockout in zebrafish did only show a significant decrease 3 months after 4-OHT injection, whereas microglia were almost completely depleted already 7 days after injection in mice. This major difference is not discussed in the paper.

      We propose that zebrafish Pu.1 and Spi-b function cooperatively to regulate microglial maintenance, analogous to the role of PU.1 alone in mice. This cooperative mechanism likely explains the observed difference in microglial depletion kinetics between zebrafish and mice following pu.1 conditional knockout. Specifically, the compensatory activity of Spi-b in zebrafish may buffer the immediate loss of Pu.1, whereas in mice, the absence of SPI-B expression in microglia eliminates this redundancy, resulting in rapid microglial depletion. Furthermore, during evolution, SPI-B appears to have acquired lineagespecific roles, becoming absent in microglia. We will expand on this evolutionary divergence and its implications for microglial regulation in the revised manuscript.

      (4) Data is represented as mean +/-.SEM. Instead of SEM, standard deviation should be shown in all graphs to show the variability of the data. This is especially important for all graphs where individual data points are not shown. It should also be stated in the figure legend if SEM or SD is shown

      We plan to represent our data as mean ± SD in the revised manuscript.

      Reference:

      (1) Tschan MP, Reddy VA, Ress A, Arvidsson G, Fey MF, Torbett BE. PU.1 binding to the p53 family of tumor suppressors impairs their transcriptional activity. Oncogene. 2008 May 29;27(24):3489-93.

    1. Author response:

      Reviewing editor comments:

      Overall, the reviewers found the imaging data to be strong but identified the physiology experiments as the weakest aspect of the study. Please consider either removing Figures 7 and 8 from the manuscript or significantly revising the data. If you choose to revise these figures, refer to the specific reviewer comments addressing them. Additionally, several reviewers noted that the prior literature was not adequately cited, so please consider addressing this concern.

      As noted below, we will work to strengthen the physiological side of the study and ensure that we are more scrupulous in citing the prior literature. Below we summarize the major concerns of each reviewer and outline our proposed response.

      Reviewer #1:

      (1) Sex differences and generalizability

      Various studies have shown sex differences in emotional responses and neural activity in mice, but to study both male and female mice would have required much larger numbers of mice than we could accommodate for practical reasons, so we chose to use only female mice to lay a solid foundation for future studies that compare (and perhaps contrast) males.

      We will:

      Make clear in the main text that we used only females.

      Cite literature on sex-specific mPFC-BLA/NAc functions in the Discussion.

      (2) Missing link between behavioral states and "emotional states"...relevant readouts such as cortisol

      We appreciate the reviewer pointing out this inadvertent conceptual slippage. We will:

      Include corticosterone measurements using an ELISA kit from archived plasma samples (collected before and after OFT/EPM tests) to correlate with behavioral and neural activity (approach refers to Panczyszyn-Trzewik et al., Steroids, 2024).

      Be more precise in our language to differentiate behavioral correlates from inferred emotional states.

      Carefully review the literature on OFT center time, EPM open-arm exploration, and tube test outcomes as anxiety/social hierarchy indicators and decide the best interpretation for our findings.

      (3) Improve methodological detail and rigor of population-level analysis

      We will:

      Expand the methods section with electrophysiology parameters (e.g., access resistance criteria, stimulus protocols).

      Add detailed histology figures (viral targeting, electrode placements) for mPFC-BLA/NAc projections.

      Include raw data points in all plots and report exact p-values, effect sizes, and group sizes (e.g., n = 12 cells from 4 mice).

      To enhance statistical rigor, we will provide clearer scatter plots with individual data points, report exact p-values, and specify group sizes in all figures.

      (4) Acute vs. sustained effects after tube test and additional controls

      We would like to clarify that we used repeated tube tests (3 times a day and continuing for 7 days) for assessing sustained rank effects. To address concerns about sustained emotional state changes post-tube test, we will:

      Assess corticosterone levels pre/post-tube test (approach refers to Panczyszyn-Trzewik et al., Steroids, 2024).

      Discuss the transient nature of hierarchy effects and cite studies using repeated tube tests for sustained rank effects.

      Reviewer #2:

      (1) Sub-region targeting in BLA/NAc

      Although different subregions within the BLA and NAc receive distinct inputs and exhibit diverse functions, comparing neuronal activity across these subregions is beyond the scope of this paper. Our primary focus is on mPFC projections, emphasizing presynaptic activity rather than postsynaptic activity within the NAc and BLA. We focused on the PL-NAc shell and PL-BLA (BA) regions because PL-to-NAc shell projections in mice are well-documented, particularly in studies utilizing viral tracers and optogenetic tools (Britt et al., Neuron, 2012; Bossert et al., J. Neurosci., 2012). These projections regulate aversive behaviors, stress responses, and motivational states and are implicated in drug-seeking behaviors and emotional valence encoding (Jocelyn & Berridge, Biol. Psychiatry, 2013; Fetcho et al., Nat. Commun., 2023; Capuzzo & Floresco, J. Neurosci., 2020; Xie et al., BioRxiv., 2025; Domingues et al., Nat Commun., 2025). The PL-BLA projection in turn sends topographically organized projections to BLA subregions, primarily targeting the basal (BA) nuclei of the BLA (McGarry & Carter, J. Neurosci., 2016; Hoover & Vertes, Brain Struct. Funct., 2007). Both the recorded NAc shell and BLA subregions are involved in emotional valence encoding.

      A detailed comparison of neuronal activity across different NAc shell and BLA subregions or comparing different cell types, such as NAc shell D1- and D2-medium spiny neurons, could each be the subject of a whole other study. Nevertheless,

      We will discuss how sub-region connectivity could contribute to observed heterogeneity in the discussion, citing relevant studies, and make sure we clarify our rationale for our experimental design.

      (2) Electrophysiological confounds

      To strengthen the rationale for our patch-clamp recordings, we will:

      Clarify in methods that recordings were performed in acute slices from behaviorally naive mice (post-tube test) to isolate synaptic changes.

      Include access resistance and cell health criteria (e.g., resting membrane potential, input resistance ranges), along with precise optogenetic stimulus protocols.

      Add example traces of mEPSCs/mIPSCs and quantify exclusion rates.

      Reviewer #3:

      (1) Specify the sexes used throughout the manuscript.

      We will make this clear throughout the paper.

      (2) Exclusion of mice lacking "center-ON" neurons

      We will:

      Explain the exclusion of mice that lacked center-ON neurons. We will also discuss the potential interpretations (e.g., floor effects in anxiety tasks) in the limitations section.

      (3) Baseline activity comparisons

      We will:

      Add baseline neuronal activity comparison between mPFC-BLA and mPFC-NAc neurons.

      (4) Stress from repeated behavioral testing

      We will:

      Clarify our experimental design to state how we tried to minimize the stress caused by multiple behavioral assays.

      Include pre-test habituation protocols in methods.

      Discuss potential cumulative stress effects in limitations.

      (5) Grooming classification

      While the reviewer is correct that grooming can be a stress-relieving behavior, it also obviously has many other functions, from the pragmatic to the social. In our study grooming occurred primarily in the periphery of the open field test, where it was exhibited as a behavior corresponding to neural activity patterns that differed from that which occurred in the center. As we classify the behavior in the center zone of the open field test as anxiety-like, we interpreted the peripheral grooming as indicative of the animal's adjustment to a novel environment, as suggested by previous work (Estanislau et al., Neurosci. Res., 2013; Rojas-Carvajal et al., Animal Behaviour, 2018). The nature of the grooming was primarily rostral body-licking, which accords with what Rojas-Carvajal et al. calls a “de-arousal inhibition system” that subserves novelty habituation. The duration and nature of this behavior are, interestingly enough, influenced by whether the mouse or rat lived in an enriched environment prior to the OFT (enriched environments made them quicker to explore a new environment but also quicker to get bored - no surprise, really).

      We did not explain any of this in the manuscript, however, so in our revision, we will make sure to discuss these nuances and cite the relevant literature.

      (6) Integrate neuronal activity and behavioral data

      We will:

      Include additional analyses quantifying neuronal activity overlap across tasks and refine our Discussion to better integrate these findings with prior literature.

      Perform cross-correlation analyses to quantify activity overlap between OFT, EPM, and SI tasks.

      Minor weaknesses

      - Clarify the cohorts of mice that were used for each behavioral assay.

      - Adjust Figure 2G scale and add insets to highlight sniffing differences.

      - Specify that M1/M2 were age-/sex-matched unfamiliar mice in the three-chamber test.

      - Detail statistical tests (e.g., mixed-effects models) and animal selection criteria in methods.

      We believe these revisions will address the reviewers’ major concerns and significantly improve the manuscript. We welcome further feedback on these plans and will provide updated figures/data for the resubmission.

    1. Author response:

      Public Reviews:

      Reviewer #1 (Public review):

      Summary:

      The authors in this study extensively investigate how telomere length (TL) regulates hTERT expression via non-telomeric binding of the telomere-associated protein TRF2. They conclusively show that TRF2 binding to long telomeres results in a reduction in its binding to the hTERT promoter. In contrast, short telomeres restore TRF2 binding in the hTERT promoter, recruiting repressor complexes like PRC2, and suppressing hTERT expression. The study presents several significant findings revealing a previously unknown mechanism of hTERT regulation by TRF2 in a TL-dependent manner

      Strengths:

      (1) A previously unknown mechanism linking telomere length and hTERT regulation through the non-telomeric TRF2 protein has been established strengthening the telomere biology understanding.

      (2) The authors used both cancer cell lines and iPSCs to showcase their hypothesis and multiple parameters to validate the role of TRF2 in hTERT regulation.

      (3) Comprehensive integration of the recent literature findings and implementation in the current study.

      (4) In vivo validation of the findings.

      (5) Rigorous controls and well-designed assays have been use.

      Weaknesses:

      (1) The authors should comment on the cell proliferation and morphology of the engineered cell lines with ST or LT.

      The cell proliferation and morphology of the engineered cells were monitored during experiments. With a doubling time within 16-18 hours, all the cancer cell line pairs used in the study were counted and seeded equally before experiments.

      No significant difference in morphology or cell count (before harvesting for experiments) was noted for the stable cell lines, namely, HT1080 ST-HT1080 LT, HCT116 p53 null scrambled control-HCT116 p53 null hTERC knockdown.

      MDAMB 231 cells which were treated with guanine-rich telomere repeats (GTR) over a period of 12 days, as per the protocol mentioned in Methods. Due to the alternate day of GTR treatment in serum-free media followed by replenishment with serum-supplemented media, we noted that cells would undergo periodic delay in their proliferation (or transient arrest) aligning with the GTR oligo-feeding cycles and appeared somewhat larger in comparison to their parental untreated cells.

      Next, the cells with Cas9-telomeric sgRNA mediated telomere trimming were maintained transiently (till 3 days after transfection). During this time, no significant change in morphology or cell proliferation was observed in any of the cell lines, namely HCT116 or HEK293T Gaussia Luciferase reporter cells. iPSCs were also monitored. However, no change in morphology or cellular proliferation was observed during the 5 days post-transfection and antibiotic selection.  

      (2) Also, the entire study uses engineered cell lines, with artificially elongated or shortened telomeres that conclusively demonstrate the role of hTERT regulation by TRF2 in telomere-length dependent manner, but using ALT negative cell lines with naturally short telomere length vs those with long telomeres will give better perspective. Primary cells can also be used in this context.

      The reviewer correctly highlights (as we also acknowledge in the Discussion) that our study primarily utilizes engineered cell lines with artificially elongated or shortened telomeres. We agree that using ALT-negative cells with naturally short versus long telomeres would provide additional perspective in testing our hypothesis. However, a key challenge in this experimental setup is the inherent variation in TRF2 protein levels among these cell types—a parameter central to our hypothesis. Comparing observations across such non-isogenic cell line pairs would require extensive normalization for multiple factors and could introduce additional complexities, potentially raising more questions among scientific readers.

      We had also explored primary cells, specifically foreskin fibroblasts and MRC5 lung fibroblasts, as suggested by the reviewer. However, we encountered two significant challenges. To achieve a notable telomere length difference of at least 20%, these primary cells had to undergo a minimum of 25 passages. During this period, we observed a substantial decline in their proliferation capacity and an increased tendency toward replicative senescence. Additionally, we noted a significant reduction in TRF2 protein levels as the primary cells aged, consistent with findings from Fujita K et al., 2010 (Nat Cell Biol.), which reported p53-induced, Siah-1-mediated proteasomal degradation of TRF2. Due to these practical limitations, we focused on cancerous cell lines with an isogenic background, ensuring a controlled experimental framework. This, in turn, opens new avenues for future research to explore broader implications. Investigating other primary cell types that may not present these challenges could be a valuable direction for future studies.

      (3) The authors set up time-dependent telomere length changes by dox induction, which may differ from the gradual telomere attrition or elongation that occurs naturally during aging, disease progression, or therapy. This aspect should be explored.

      In this study, we utilized a Doxycycline-inducible hTERT expression system to modulate telomere length in cancer cells, aiming to capture any gradual changes that might occur upon steady telomerase induction or overexpression—an event frequently observed in cancer progression. We monitored telomere length and telomerase activity at regular intervals (Supplementary Figure 2), noting a gradual increase until a characteristic threshold was reached, followed by a reversal to the initial telomere length.

      While this model provides interesting insights in context of cancer cells, it does not replicate the conditions of aging or therapeutic intervention. We agree that exploring telomere length-dependent regulation of hTERT in normal aging cells is an important avenue for future research. Investigating TRF2 occupancy on the hTERT promoter in response to telomere length alterations through therapeutic interventions—such as telomestatin or imetelstat (telomerase inhibitors) and 6-thio-2’-deoxyguanosine (telomere damage inducer)—would provide valuable insights and warrants further exploration.

      (4) How does the hTERT regulation by TRF2 in a TL-dependent manner affect the ETS binding on hTERT mutant promoter sites?

      In our previous study (Sharma et al., 2021, Cell Reports), we have experimentally demonstrated that GABPA and TRF2 do not compete for binding at the mutant hTERT promoter (Figure 4M-R). Silencing GABPA in various mutant hTERT promoter cells did not increase TRF2 binding. While GABPA has been reported to show increased binding at the mutant promoter compared to the wild-type (Bell et al., 2015, Science), no telomere length (TL) sensitivity has been noted yet. This manuscript shows that telomere alterations in hTERT mutant cells do not significantly increase TRF2 occupancy at the promoter, reinforcing our earlier findings that G-quadruplex formation is crucial for TRF2 recruitment. Since TRF2 binding does not increase significantly at the mutant promoter and does not compete with GABPA, TL-sensitive TRF2 binding is unlikely to directly influence ETS binding by GABPA. Hence, increased GABPA binding to the mutant promoter as reported in the literature, remains independent of TL-sensitive TRF2 binding. However, an experimental demonstration of the above observation-based speculation would be ideal to answer the query in the future.

      (5) Stabilization of the G-quadruplex structures in ST and LT conditions along with the G4 disruption experimentation (demonstrated by the authors) will strengthen the hypothesis.

      We agree with the reviewer’s suggestion that stabilizing G-quadruplex (G4) structures in mutant promoter cells under ST and LT conditions would further strengthen our hypothesis. From our ChIP experiments on hTERT promoter mutant cells following G4 stabilization with ligands, as reported in Sharma et al. 2021 (Figure 5G), we observed that TRF2 occupancy was regained in the telomere-length unaltered versions of -124G>A and -146G>A HEK293T Gaussia luciferase cells (referred to as LT cells in the current manuscript).

      Based on these published findings, we anticipate a similar restoration of TRF2 binding in the short telomere (ST) versions, given the increased availability of TRF2 protein molecules, as proposed in our Telomere Sequestration Partitioning model.

      (6) The telomere length and the telomerase activity are not very consistent (Figure 2A, and S1A, Figure 4B and S3). Please comment.

      In this study, we employed both telomerase-dependent and independent methods for telomere elongation.

      HT1080 model: Telomere elongation resulted from constitutive overexpression of hTERC and hTERT, leading to a direct correlation with telomerase activity.

      HCT116 (p53-null) model: hTERC silencing in ST cells, a known limiting factor for telomerase activity, resulted in significantly lower telomerase activity and a 1.5-fold telomere length difference.

      MDAMB231 model: Guanine-rich telomeric repeat (GTR) feeding induced telomere elongation through recombinatorial mechanisms (Wright et al., 1996), leading to significant telomere length gain but no notable change in telomerase activity.

      HCT116 Cas9-telomeric sgRNA model: Telomere shortening occurred without modifying telomerase components, resulting in a minor, insignificant increase in telomerase activity (Figure 2A, S1).

      Regarding xenograft-derived HT1080 ST and LT cells (Figure 4B, S3), the observed variability in telomere length and telomerase activity may stem from infiltrating mouse cells, which naturally have longer telomeres and higher telomerase activity than human cells. Since in the reported assay tumour masses were not sorted to exclude mouse cells, using species-specific markers or fluorescently labelled HT1080 cells in future experiments would minimize bias. However, even though telomere length and telomerase activity assays cannot differentiate for cross-species differences, mRNA analysis and ChIP experiments performed specifically for hTERT and hTERC mRNA levels, TRF2 occupancy, and H3K27me3 enrichment on hTERT promoter (Figure 4B–E) strongly support our conclusions.

      (7) Please comment on the other telomere-associated proteins or regulatory pathways that might contribute to hTERT expression based on telomere length.

      The current study provides experimental evidence that TRF2, a well-characterized telomere-binding protein, mediates crosstalk between telomeres and the regulatory region of the hTERT gene in a telomere length-dependent manner. Given the observed link between hTERT expression and telomere length, it is likely that additional telomere-associated proteins and regulatory pathways contribute to this regulation.

      The remaining shelterin complex components—POT1, hRap1, TRF1, TIN2, and TPP1—may play crucial roles in this context, as they are integral to telomere maintenance and protection. Additionally, several DNA damage response (DDR) proteins, which interact with telomere-binding factors and help preserve telomere integrity, could potentially influence hTERT regulation in a telomere length-dependent manner. However, direct interactions or regulatory roles would require further experimental validation. Another group of proteins with potential relevance in this mechanism are the sirtuins, which directly associate with telomeres and are known to positively regulate telomere length, undergoing repression upon telomere shortening. Notably, SIRT1 has been reported to interact with telomerase (Lee SE et al., 2024, Biochem Biophys Res Commun.), while SIRT6 has been implicated in TRF2 degradation and telomerase activation. Given their roles in telomere homeostasis, sirtuins may serve as key mediators of telomere length-dependent hTERT regulation.

      Beyond protein-mediated mechanisms like the Telomere Sequestration partitioning model, telomere length-dependent regulation of hTERT may also involve chromatin architecture. The Telomere Position Effect—Over Long Distances (TPE-OLD), a phenomenon whereby telomere conformation influences gene expression at distant loci, has been reviewed extensively (Kim et al., 2018, Differentiation).

      Reviewer #2 (Public review):

      Summary:

      Telomeres are key genomic structures linked to everything from aging to cancer. These key structures at the end of chromosomes protect them from degradation during replication and rely on a complex made up of human telomerase RNA gene (hTERC) and human telomerase reverse transcriptase (hTERT). While hTERC is expressed in all cells, the amount of hTERT is tightly controlled. The main hypothesis being tested is whether telomere length itself could regulate the hTERT enzyme. The authors conducted several experiments with different methods to alter telomere length and measured the binding of key regulatory proteins to this gene. It was generally observed that the shortening of telomere length leads to the recruitment of factors that reduce hTERT expression and lengthening of telomeres has the opposite effect. To rule out direct chromatin looping between telomeres and hTERT as driving this effect artificial constructs were designed and inserted a significant distance away and similar results were obtained.

      Overall, the claims of telomere length-dependent regulation of hTERT are supported throughout the manuscript.

      Strengths:

      The paper has several important strengths. Firstly, it uses several methods and cell lines that consistently demonstrate the same directionality of the findings. Secondly, it builds on established findings in the field but still demonstrates how this mechanism is separate from that which has been observed. Specifically, designing and implementing luciferase assays in the CCR5 locus supports that direct chromatin looping isn't necessary to drive this effect with TRF2 binding. Another strength of this paper is that it has been built on a variety of other studies that have established principles such as G4-DNA in the hTERT locus and TRF2 binding to these G4 sites.

      Weaknesses:

      The largest technical weakness of the paper is that minimal replicates are used for each experiment. I understand that these kinds of experiments are quite costly, and many of the effects are quite large, however, experiments such as the flow cytometry or the IPSC telomere length and activity assays appear to be based on a single sample, and several are based upon two maximum three biological replicates. If samples were added the main effects would likely hold, and many of the assays using GAPDH as a control would result in significant differences between the groups. This unnecessarily weakens the strength of the claims.

      We appreciate the reviewer’s recognition of the resource-intensive nature of our experiments, and we are confident in the robustness of the observed results. Due to the project’s timeline constraints and the need for consistency across experiments, we have reported findings based on 3 biological replicates with appropriate statistical analysis.

      Regarding the fibroblast-iPSC model, we would like to clarify that we have presented data from two independent biological replicates, each consisting of a fibroblast and its derived iPS cell pair, rather than a single sample. Additionally, the Tel-FACS assay involved analyzing at least 10,000 events, ensuring statistical significance in all cases. Alongside this, we also conducted qRT-PCR-based telomere length determination assays. While both assays were performed, we chose to report the more sensitive Tel-FACS data in the manuscript to provide a clearer representation of the results.

      Another detail that weakens the confidence in the claims is that throughout the manuscript there are several examples of the control group with zero variance between any of the samples: e.g. Figure 2K, Figure 3N, and Figure 6G. It is my understanding that a delta delta method has been used for calculation (though no exact formula is reported and would assist in understanding). If this is the case, then an average of the control group would be used to calculate that fold change and variance would exist in the group. The only way I could understand those control group samples always set to 1 is if a tube of cells was divided into conditions and therefore normalized to the control group in each case. A clearer description in the figure legend and methods would be required if this is what was done and repeated measures ANOVA and other statistics should accompany this.

      We thank the reviewer for their valuable feedback. In response to the comment about the control group and error calculation, we would like to clarify our approach. In our previous analysis, we set the control group (Day 0) as 1 to calculate the fold change and did not include error bars, as there was no variation in the control group (since all values were normalized to 1). However, as per the reviewer’s suggestion, we will now include error bars on the Day 0 control group. These error bars will be calculated based on the standard deviation (SD) of the Ct values across the biological replicates for the control group. For the Day 10 and Day 24 time points, we retain the error bars that reflect the variance in fold change across replicates, as originally reported.

      This adjustment would allow for a clearer representation of the data and variance in the control group. We believe this addresses the reviewer’s concerns about the error calculation, and we shall update the figure legend and methods to reflect these changes. Statistical analysis, including ANOVA, was already applied as indicated in the figure.

      A final technical weakness of the paper is the data in Figure 5 where the modified hTERT promoter was inserted upstream of the luciferase gene. Specifically, it is unclear why data was not directly compared between the constructs that could and could not form G4s to make this point. For this reason, the large variance in several samples, and minimal biological replicates, this data was the least convincing in the manuscript (though other papers from this laboratory and others support the claim, it is not convincing standalone data).

      We appreciate the reviewer's thoughtful feedback on the presentation of the luciferase assay data in Figure 5. The data for the wild-type hTERT promoter (capable of forming G4 structures) was previously reported in Figure 2G-K. To avoid redundancy in data presentation, we initially chose to report the results of the mutated promoter separately. However, we recognize that directly comparing the wild-type and mutated promoter constructs within the same figure would provide clearer context and strengthen the interpretation of the results. In light of this, we will revise Figure 5 in the updated manuscript to include the data for both constructs, ensuring a more comprehensive and informative comparison.

      The second largest weakness of the paper is formatting.

      When I initially read the paper without a careful reading of the methods, I thought that the authors did not have appropriate controls meaning that if a method is applied to lengthen, there should be one that is not lengthened, and when a method is applied to shorten, one which is not shortened should be analysed as well. In fact, this is what the authors have done with isogenic controls. However, by describing all samples as either telomere short or telomere long, while this simplifies the writing and the colour scheme, it makes it less clear that each experiment is performed relative to an unmodified. I would suggest putting the isogenic control in one colour, the artificially shortened in another, and the artificially lengthened in another.

      Similarly, the graphs, in general, should be consistent with labelling. Figure 2 was the most confusing. I would suggest one dotted line with cell lines above it, and then the method of either elongation or shortening below it. I.e. HT1080 above, hTERC overexpression below, MDAMB-231 above guanine terminal repeats below, like was done on the right. Figure 2 readability would also be improved by putting hTERT promoter GAPDH (-ve control) under each graph that uses this (Panel B and Panel C not just Panel C). All information is contained in the manuscript but one must currently flip between figure legends, methods, and figures to understand what was done and this reduces clarity for the reader.

      We sincerely thank the reviewer for their constructive feedback on the formatting and clarity of the figures. We appreciate the time and effort taken to suggest ways to enhance the visual presentation and readability of the manuscript. We agree that clearer differentiation of the experimental groups would help avoid confusion, and we will consider ways to improve the visual organization, as much as possible. Additionally, we will work on restructuring the graphs for greater consistency in labeling and alignment, especially in Figure 2, to improve readability and reduce the need for cross-referencing between the figures, figure legends, and methods section. We will also ensure the hTERT promoter GAPDH (-ve control) label appears under all relevant graphs for consistency. We will make revisions to the figures in line with these suggestions to improve the overall clarity and flow of the manuscript, as much as possible.

    1. Author response:

      The following is the authors’ response to the original reviews.

      Reviewer #1 (Public Review):

      Summary:

      This study provides valuable and comprehensive information about the SARS-CoV-2 seroprevalence during 2021 and 2022 in different regions of Bolivia. Moreover, data on immune responses against the SARS-CoV-2 variants based on neutralization tests denotes the presence of several virus variants circulating in the Bolivian population. Evidence for seroprevalence data provided by the authors is solid, across the study period, while data regarding variant circulation is limited to the early stages of the pandemic.

      Strengths:

      The major strength of this study is that it provided nationwide seroprevalence estimates from infection and/or vaccination based on antibodies against both spike and the nucleocapsid protein in a large representative sample of sera collected at two time-points from all departments of Bolivia, gaining insight into COVID-19 epidemiology. On the other hand, data from virus neutralization assays inferred the circulation during the study period of four SARS-CoV-2 variants in the population. Overall, the study results provide an overview of the level of viral transmission and vaccination and insights into the spread across the country of SARS-CoV-2 variants.

      Weaknesses:

      The assessment of a Lambda variant that circulated in several neighboring countries (Peru, Chile, and Argentina), which had a significant impact on the COVID-19 pandemic in the region, may have strengthened the study to contrast Gamma spread. In addition, even though neutralizing antibodies can certainly reveal previous infections of SARSCOV2 variants in the population, it is of limited value to infer from this information some potential timing estimates of specific variant circulation, considering the heterogeneous effects that past infections, vaccinations, or a combination of both could have on the level of variant-specific neutralizing antibodies and/or their cross-neutralization capacity.

      An appraisal of whether the authors achieved their aims, and whether the results support their conclusions:

      The conclusions of this paper are well supported by data, particularly regarding seroprevalence that reliably reflects the epidemiology of COVID-19 in Bolivia, and seroprevalence trends in other low- and middle-income countries.

      A discussion of the likely impact of the work on the field, and the utility of the methods and data to the community:

      Since this is the first study that has been conducted to assess indicators of immunity against SARSCoV-2 in the population of Bolivia at a nationwide scale, seroprevalence data provided by geographic regions at two time-points can be useful as a reference for potential retrospective global metaanalysis and further explore and compare the risk factors for infection, variant distribution, and the impact on infection and vaccination, gaining deeper insights into understanding the evolution of the COVID-19 pandemic in Bolivia and in the region.

      Reviewer #2 (Public Review):

      Significance of the findings:

      In this study, blood donors were assessed using serology and viral neutralization assays to determine the prevalence of SARS-CoV-2 antibodies. S1 and NCP antibodies were used to distinguish between vaccination and natural infection and virus-specific neut titers were used to determine which variants the antibodies respond to. The study reports almost universal antibody prevalence and increases in antibodies against specific variants at different points corresponding to circulating variants identified phylogenetically in neighbouring countries. The authors propose this approach for settings like Bolivia where genetic sequencing is not readily available. Unfortunately, there are significant limitations to this approach that limit its utility - serological data are available after the fact in a fast-moving pandemic and so are a poor alternative to phylogenetic data. Rather, serological information can supplement phylogenetic data and is most useful in estimating population-level immunity.

      (1) Considerations in interpreting the results:

      We appreciate the reviewer's valuable feedback, which will certainly enhance the quality of our manuscript. As a result, we have revised the text to address their suggestions as thoroughly as possible.

      a. Serology provides different information to phylogenetic sequencing of the viruses and so both are important. Viral sequencing provides real-time information on circulating variants and indicates the proportion of each variant in circulation at any point as there are almost always multiple variants spreading but it is the fastest spreading variant that comes to dominate. Importantly serology measures asymptomatic infections as well, providing population estimates of infection that are not available through viral gene sequencing.

      We underscored this point in the introduction by incorporating the following sentences:

      “Seroprevalence studies are a valuable adjunct to active surveillance because they allow analysis of the level of immunity of a population to a specific pathogen without the need for prospective testing, and also provide information on the frequency of cases that do not attract medical attention (asymptomatic infections)(4).” and “To date, the circulation of SARS-CoV-2 variants has mainly been studied through molecular surveillance, giving the proportion of circulating variants in real time. Therefore, genomic surveillance and serology offer distinct yet complementary insights thus far.”

      b. A major concern in the interpretation of serology is that antibody titers vary markedly over time with rapid declines in the first year post-infection or post-vaccination. However, these declines vary depending on whether hybrid immunity is present. Disentangling this retrospectively is a challenge. A low antibody titer could reflect an infection that occurred a few months ago but may be below the threshold for positivity at the time of testing. There is also substantial individual variability in antibody responses.

      This limitation merits emphasis and has consequently been elaborated upon in the discussion section:

      “Secondly, our results are based on serological data and may not be strictly identical to the genomic data from a quantitative point of view, although they are likely to reflect similar trends and distributions (see below). The results could also be influenced by various factors, including significant individual variation in antibody responses, as well as the decline in antibody titers during the first months following infection or vaccination(31-34) and could therefore sligly underestimated. As the complexity of SARS-CoV-2 antigen exposure histories increased among tested individuals, we observed a tendency for serological data to start diverging from genomic data. This suggests, as expected, that the effectiveness of this method would be greater if implemented early in an epidemic when the occurrence of multiple infections with different variants or the administration of varying doses of vaccine in the analyzed population before or after infection (resulting in hybrid immunity) is still limited. However, to mitigate the potential challenges arising from complex antigen exposure, we employed straightforward criteria to identify the variant among the four tested in VNT that exhibited the highest value (cf methods), thereby likely indicating the main or most recent infection and minimizing the influence of crossneutralization on the final outcomes. In addition, several approaches were used to analyze the results, including quantification of circulating antigenic groups and individual variants, yielding results that were comparable and closely aligned with the genomic data.”

      c. Serology becomes increasingly difficult to untangle when an individual has had doses of vaccine and multiple natural infections with different variants. Due to the importance of hybrid immunity in population risk to new variants, it would be useful for estimates of hybrid immunity to be generated based on anti-S1 and anti-NCP antibodies. From a population immunity perspective, this could be important in guiding future protection and boosting strategies.

      We estimated the hybrid immunity for each department in 2021 and 2022 based on the prevalence of anti-S1 and anti-NCP antibodies and added a new Supplementary Table 1. We also added a description of this table in the result section: “The estimated hybrid immunity, based on the prevalence of anti-S1 and anti-NCP antibodies, ranged from 51.4% in Pando to 73.6% in Potosí in 2021. By 2022, this increased to between 83.3% in Santa Cruz and 90.6% in Tarija (Supplementary Table 1).”

      d. Since there is cross-neutralization by the antibodies stimulated by each variant, it is important to establish the sensitivity and specificity of each of the neutralization assays in a panel comprising multiple variants. An assessment of the accuracy of the neut assay for each variant is needed to be confident that it is able to distinguish between variants.

      Assessing the performance of a the VNT for each SARS-CoV-2 variants is a highly complex task. This evaluation requires samples with comprehensive data on vaccination and infection specific to each variant to determine the specificity of each VNT for each variant. However, the access to such samples for every newly emerging variant remains challenging. In order to circumvent this issue, we evaluated the circulation level of γ, δ, and ο variants under increasingly stringent conditions, by calculating the proportion of the population with log2-ratio values of ≤0 (variant titer equal to or greater than D614G), ≤-1 (variant titer at least twice that of D614G), and ≤-2 (variant titer at least four times that of D614G).

      e. Blood donors are notoriously poor representations of the general population in many countries, driven partly by whether donation is financially rewarded. For example, in the USA, drug addicts are disproportionately over-represented in blood donor populations as they use it as a source of money. The authors provide no information on whether the blood donor population in Bolivia is representative of the entire population. Comparison of the prevalence of specific disease markers in the general population and in blood donors could provide a signal of their comparability.

      This is a significant aspect addressed in point 3.

      (2) Please provide the sensitivity and specificity of each of the assays so that the reader can assess the degree of accuracy in the assay that claims that the prevalent antibodies are due to, for example, omicron.

      The sensitivity and specificity of the in vitro assays are now referenced in a previous study: “The sensitivity and specificity of the in vitro assays were described previously(23).”

      Neutralization assays are considered the gold standard for measuring neutralizing antibodies against SARS-CoV-2 and its variants, and they are widely used in seroprevalence studies. However, until now, no one has successfully evaluated the specificity and sensitivity of this assay for SARS-CoV-2 variants, as it requires sera from individuals exposed to a single variant, which are increasingly difficult to collect for each newly emerging variants. Nevertheless, using sera from laboratory-infected animals (primarily hamsters) with a single variant exposure has enabled the antigenic characterization of SARS-CoV-2 variants through viral neutralization. This approach has shown that it is possible to distinguish between sera from individuals infected with different variants, even among the Omicron subvariants (Anna Z. Mykytyn et al. Antigenic cartography of SARS-CoV-2 reveals that Omicron BA.1 and BA.2 are antigenically distinct.Sci. Immunol.7,eabq4450(2022); Samuel H. Wilks et al. Mapping SARS-CoV-2 antigenic relationships and serological responses.Science382,eadj0070(2023)).

      (3) Please provide an assessment of the representativity of the blood donor population eg. Is the prevalence of hepatitis B serological markers in the blood donor population comparable with the prevalence of hepatitis B serological markers in the general population from community-based studies?

      A new sentence was included in the discussion to offer support for considering the blood donor population as a representative sample of the general population: “In addition, in Bolivia, blood donation is unrewarded, and blood donors appear to be quite representative of the general population. Indeed, routine screening for several infection markers (such as HIV or HBV) is conducted in all donors, and the prevalences of these markers do not differ from those observed in the general population. For example, UNAIDS data highlights a 0.4% HIV prevalence within the Bolivian general population, with significantly higher rates exceeding 25% observed in high-risk groups such as men who have sex with men(29). Moreover, Sheena et al. estimated a 0.6% prevalence of HBsAg in Bolivia in 2019(30). Bolivian national statistics of National Blood Program of the Ministry of Health and Sports, indicate that between 2019 and 2023, the proportion of HIV- and HBV-reactive units among screened blood donors ranged from 0.26% to 0.41% and 0.16% to 0.25%, respectively (Dr. Lissete Bautista’s personal communication).”

    1. Author response:

      The following is the authors’ response to the original reviews.

      Reviewer #1 (Public review):

      Summary:

      This study demonstrates the significant role of secretory leukocyte protease inhibitor (SLPI) in regulating B. burgdorferi-induced periarticular inflammation in mice. They found that SLPI-deficient mice showed significantly higher B. burgdorferi infection burden in ankle joints compared to wild-type controls. This increased infection was accompanied by infiltration of neutrophils and macrophages in periarticular tissues, suggesting SLPI's role in immune regulation. The authors strengthened their findings by demonstrating a direct interaction between SLPI and B. burgdorferi through BASEHIT library screening and FACS analysis. Further investigation of SLPI as a target could lead to valuable clinical applications.

      The conclusions of this paper are mostly well supported by data, but two aspects need attention:

      (1) Cytokine Analysis:

      The serum cytokine/chemokine profile analysis appears without TNF-alpha data. Given TNF-alpha's established role in inflammatory responses, comparing its levels between wild-type and infected B. burgdorferi conditions would provide valuable insight into the inflammatory mechanism.

      (2) Sample Size Concerns:

      While the authors note limitations in obtaining Lyme disease patient samples, the control group is notably smaller than the patient group. This imbalance should either be addressed by including additional healthy controls or explicitly justified in the methodology section.

      We thank the reviewer for the careful review and positive comments.

      (1) We did look into the level of TNF-alpha in both WT and SLPI-/- mice with and without B. burgdorferi infection. At serum level, using ELISA, we did not observe any significant difference between all four groups. At gene expression level, using RT-qPCR on the tibiotarsal tissue, we also did not observe any significant differences. Our RT-qPCR result is consistent with the previous microarray study using the whole murine joint tissue (DOI: 10.4049/jimmunol.177.11.7930). The microarray study did not show significant changes in TNF-alpha level in C57BL/6 mice following B. burgdorferi infection. A brief discussion has been added, and the above data is provided as Supplemental figure 4 in the revised manuscript, line 334-339, and 756-763.

      (2) We agree with the reviewer that the control group is smaller than the patient group. Among the archived samples that are available, the number of adult healthy controls are limited. It has been shown that the serum level of SLPI in healthy volunteers is in average about 40 ng/ml  (DOI: 10.3389/fimmu.2019.00664 and 10.1097/00003246-200005000-00003). The median level in the healthy control in our data was 38.92 ng/ml, which is comparable to the previous results. A brief discussion has been added in the revised manuscript, line 364-369.

      Reviewer #2 (Public review):

      Summary:

      This manuscript by Yu and coworkers investigates the potential role of Secretory leukocyte protease inhibitor (SLPI) in Lyme arthritis. They show that, after needle inoculation of the Lyme disease (LD) agent, B. burgdorferi, compared to wild type mice, a SLPI-deficient mouse suffers elevated bacterial burden, joint swelling and inflammation, pro-inflammatory cytokines in the joint, and levels of serum neutrophil elastase (NE). They suggest that SLPI levels of Lyme disease patients are diminished relative to healthy controls. Finally, they find that SLPI may interact directly the B. burgdorferi.

      Strengths:

      Many of these observations are interesting and the use of SLPI-deficient mice is useful (and has not previously been done).

      We appreciate the reviewer’s careful reading and positive comments.

      Weaknesses:

      (a) The known role of SLPI in dampening inflammation and inflammatory damage by inhibition of NE makes the enhanced inflammation in the joint of B. burgdorferi-infected mice a predicted result;

      We agree that the observation of the elevated NE level and the enhanced inflammation is theoretically likely. Indeed, that was the hypothesis that we explored, and often what is theoretically possible does not turn out to occur. In addition, despite the known contribution of neutrophils to the severity of murine Lyme arthritis, the importance of the neutrophil serine proteases and anti-protease has not been specifically studied, and neutrophils secrete many factors. Therefore, our data fill an important gap in the knowledge of murine Lyme arthritis development – and set the stage for the further exploration of this hypothesis in the genesis of human Lyme arthritis.

      (b) The potential contribution of the greater bacterial burden to the enhanced inflammation is not addressed;

      We agree with the reviewer’s viewpoint that the increased infection burden in the tibiotarsal tissue of the infected SLPI-/- mice could contribute to the enhanced inflammation. A brief discussion of this possibility has been added in the revised manuscript, line 287-288.

      (c) The relationship of SLPI binding by B. burgdorferi to the enhanced disease of SLPI-deficient mice is not clear; and

      We agree with the reviewer that we have not shown the importance of the SLPI-B. burgdorferi binding in the development of periarticular inflammation. It is an ongoing project in our lab to identify the SLPI binding partner in B. burgdorferi. Our hypothesis is that SLPI could bind and inhibit an unknown B. burgdorferi virulence factor that contributes to murine Lyme arthritis. A brief discussion has been added in the revised manuscript, line 401-407.

      (d) Several methodological aspects of the study are unclear.

      We appreciate the critique. We have modified the methods section in greater detail in the revised manuscript.

      Reviewer #3 (Public review):

      Summary:

      The authors investigated the role of secretory leukocyte protease inhibitors (SLPI) in developing Lyme disease in mice infected with Borrelia burgdorferi. Using a combination of histological, gene expression, and flow cytometry analyses, they demonstrated significantly higher bacterial burden and elevated neutrophil and macrophage infiltration in SLPI-deficient mouse ankle joints. Furthermore, they also showed direct interaction of SLPI with B. burgdorferi, which likely depletes the local environment of SLPI and causes excessive protease activity. These results overall suggest ankle tissue inflammation in B. burgdorferi-infected mice is driven by unchecked protease activity.

      Strengths:

      Utilizing a comprehensive suite of techniques, this is the first study showing the importance of anti-protease-protease balance in the development of periarticular joint inflammation in Lyme disease.

      We greatly appreciate the reviewer’s careful reading and positive comments.

      Weaknesses:

      Due to the limited sample availability, the authors investigated the serum level of SLPI in both in Lyme arthritis patients and patients with earlier disease manifestations.

      We agree with the reviewer that it would be ideal to have more samples from Lyme arthritis patients. However, among the available archived samples, samples from Lyme arthritis patients are limited. For the samples from patients with single EM, the symptom persisted into 3-4 month after diagnosis, the same timeframe when acute arthritis is developed. A brief discussion has been added in the revised manuscript, line 364-369.

      Recommendations for the authors:

      Reviewer #1 (Recommendations for the authors):

      (1) In Figure 2, for histological scoring, do they have similar n numbers?

      In panel B, 20 infected WT mice and 19 infected SLPI-/- mice were examined. In panel D, 13 infected WT and SLPI-/- mice were examined. Without infection, WT and SLPI-/- mice do not develop spontaneous arthritis. Due to the slow breeding of the SLPI-/- mice, a small number of uninfected control animals were used. All the supporting data values are provided in the supplemental excel.

      (2) In Figure 3, for macrophage population analysis, maybe consider implementing Ly6G-negative gating strategy to prevent neutrophil contamination in macrophage population?

      We appreciate reviewer’s suggestion. We have analyzed the data using the Ly6G-negative gating strategy and provided the result in the Supplemental figure 1. The two gating strategies showed consistent result, significantly higher percentage of infiltrating macrophages in the tibiotarsal tissue from infected SLPI-/- mice, line 154-158, line 726-729.

      Reviewer #2 (Recommendations for the authors):

      (1) The investigators should address the possibility that much of the enhanced inflammatory features of infected SLPI-deficient mice are simply due to the higher bacterial load in the joint.

      We agree with the reviewer’s viewpoint that the increased infection burden in the tibiotarsal tissue of the infected SLPI-/- mice could contribute to the enhanced inflammation. A brief discussion of this possibility has been added in the revised manuscript, line 287-288.

      (2) Fig. 1. (A) There is no statistically significant difference in the bacterial load in the heart or skin, in contrast to the tibiotarsal joint. It would be of interest to know whether other tissues that are routinely sampled to assess the bacterial load, such as injection site, knee, and bladder, also harbored increased bacterial load in SLPI-deficient mice. (B) Heart and joint burden were measured at "21-28" days. The two time points should be analyzed separately rather than pooled.

      (A) We appreciate the reviewer’s suggestion. We agree that looking into the infection load in other tissues is helpful. However, studies into murine Lyme arthritis have been predominantly focused on tibiotarsal tissue, which displays the most consistent and prominent swelling that’s easy to observe and measure. Thus, we focused on the tibiotarsal joint in our study. (B) We collected the heart and joint tissue approximately 3-week post infection within a 3-day window based on the feasibility and logistics of the laboratory. Using “21-28 d”, we meant to describe between 21 to 24 days post infection. We apologize for the mislabeling and it has been corrected it in the revised manuscript. In the methods, we defined the timeframe as “Mice were euthanized approximately 3-week post infection within a 3-day window (between 21 to 24 dpi) based on the feasibility and logistics of the laboratory”, line 464-466. In the results and figure legend, we corrected it as “between 21 to 24 dpi”.

      (3) Fig. 2. (A) The same ambiguity as to the days post-infection as cited above in Point 2B exists in this figure. (B) Panel B: Caliper measurements to assess joint swelling should be utilized rather than visual scoring. (In addition, the legend should make clear that the black circles represent mock-infected mice.)

      (A) The histology scoring, and histopathology examination were performed at the same time as heart and joint tissue collection, approximately 3 weeks post infection within a 3-day window based on the feasibility and logistics of the laboratory. We apologize for the mislabeling and it has been corrected in the revised manuscript. (B) We appreciate the reviewer’s suggestion. However, our extensive experience is that caliper measurement can alter the assessment of swelling by placing pressure on the joints and did not produce consistent results. Double blinded scoring was thus performed. Histopathology examination was performed by an independent pathologist and confirmed the histology score and provided additional measurements.

      (4) Fig. 3. (A) See Point 2B. (B) For Panels C-E, uninfected controls are lacking.

      We apologize for this omission. Uninfected controls have been provided in Figure 3 in the revised manuscript.

      (5) Fig. 4. Fig. 4. Some LD subjects were sampled multiple times (5 samples from 3 subjects with Lyme arthritis; 13 samples from 4 subjects with EM), and samples from same individuals apparently are treated as biological replicates in the statistical analysis. In contrast, the 5 healthy controls were each sampled only once.

      We agree with the reviewer that the control group is smaller than the patient group. Among the archived samples that are available, the number of adult healthy controls are limited, and sampled once. We used these samples to establish the baseline level of SLPI in the serum. It has been shown that the serum level of SLPI in healthy volunteers is in average about 40 ng/ml  (DOI: 10.3389/fimmu.2019.00664 and 10.1097/00003246-200005000-00003). The median level in the healthy control in our data was 38.92 ng/ml, which is comparable to the previous results. A brief discussion has been added in the revised manuscript, line 364-369.

      (6) Fig. 5. (A) Panel A: does binding occur when intact bacteria are used? (B) Panels B, C: Were bacteria probed with PI to indicate binding likely to occur to surface? How many biological replicates were performed for each panel? Is "antibody control" a no SLPI control? What is the blue line?

      Actively growing B. burgdorferi were collected and used for binding assays. We do not permeabilize the bacteria for flow cytometry. Thus, all the binding detected occurs to the bacterial surface. Three biological replicates were performed for each panel. The antibody control is no SLPI control. For panel D, the bacteria were stained with Hoechst, which shows the morphology of bacteria. We apologize for the missing information. A complete and detailed description of Figure 5 has been provided in both methods and figure legend in the revised manuscript. 

      (7) Sup Fig. 1. (A) Panel A: Was this experiment performed multiple times? I.e., how many biological replicates? (B) Panel B: Strain should be specified.

      The binding assay to B. burgdorferi B31A was performed two times. In panel B, B. burgdorferi B31A3 was used. We apologize for the missing information. A complete and detailed description has been provided in the figure legend in the revised manuscript. 

      (8) Fig. S2. It is not clear that the condition (20% serum) has any bactericidal activity, so the potential protective activity of SLPI cannot be determined. (Typical serum killing assays in the absence of specific antibody utilized 40% serum.)

      In Fig. S2, panel B, the first two bars (without SLPI, with 20% WT anti serum) showed around 40% viability. It indicates that the 20% WT anti serum has bactericidal activity. Serum was collected from B. burgdorferi-infected WT mice at 21 dpi, which should contain polyclonal antibody against B. burgdorferi.

      Reviewer #3 (Recommendations for the authors):

      It was a pleasure to review! I congratulate the authors on this elegant study. I think the manuscript is very well-written and clearly conveys the research outcomes. I only have minor suggestions to improve the readability of the text.

      We greatly appreciate the reviewer’s recognition of our work.

      Line 92: Please briefly summarize the key results of the study at the end of the introduction section.

      We appreciate the reviewer’s suggestion. A brief summary has been added in the revised manuscript, line 93-103.

      Line 108: Why is the inflammation significantly occurred only in ankle joints of SLPI-I mice? Could you please provide a brief explanation?

      The inflammation may also happen in other joints the B. burgdorferi infected SLPI-/- mice, which has not been studied. The study into murine Lyme arthritis has been predominantly done in the tibiotarsal tissue, which displays the most prominent swelling that’s easy to observe and measure. Thus, we focused on the tibiotarsal joint in our study.

      Line 136: Please also include the gene names in Figure 3.

      We apologize for the omission. Gene names has been included in figure legend in the revised manuscript.

      Line 181: Please briefly introduce BASEHIT. Why did you use this tool? What are the benefits?

      We appreciate the reviewer’s suggestion. We have provided a brief introduction on BASEHIT in the revised manuscript, line 216-218.

    1. Author response:

      The following is the authors’ response to the original reviews.

      Public Reviews:

      Reviewer #1 (Public review):

      Summary:

      In this manuscript, the authors address an important issue in Babesia research by repurposing cipargamin (CIP) as a potential therapeutic against selective Babesia spp. In this study, CIP demonstrated potent in vitro inhibition of B. bovis and B. gibsoni with IC<sub>50</sub> values of 20.2 ± 1.4 nM and 69.4 ± 2.2 nM, respectively, and the in vivo efficacy against Babesia spp. using mouse model. The authors identified two key resistance mutations in the BgATP4 gene (BgATP4<sup>L921I</sup> and BgATP4<sup>L921V</sup>) and explored their implications through phenotypic characterization of the parasite using cell biological experiments, complemented by in silico analysis. Overall, the findings are promising and could significantly advance Babesia treatment strategies.

      Strengths:

      In this manuscript, the authors effectively repurpose cipargamin (CIP) as a potential treatment for Babesia spp. They provide compelling in vitro and in vivo data showing strong efficacy. Key resistance mutations in the BgATP4 gene are identified and analyzed through both phenotypic and in silico methods, offering valuable insights for advancing treatment strategies.

      Thank you for your insightful comments and for taking the time to review our manuscript.

      Weaknesses:

      The manuscript explores important aspects of drug repurposing and rational drug design using cipargamin (CIP) against Babesia. However, several weaknesses should be addressed. The study lacks novelty as similar research on cipargamin has been conducted, and the experimental design could be improved. The rationale for choosing CIP over other ATP4-targeting compounds is not well-explained. Validation of mutations relies heavily on in silico predictions without sufficient experimental support. The Ion Transport Assay has limitations and would benefit from additional assays like Radiolabeled Ion Flux and Electrophysiological Assays. Also, the study lacks appropriate control drugs and detailed functional characterization. Further clarity on mutation percentages, additional safety testing, and exploration of cross-resistance would strengthen the findings.

      We appreciate your feedback and for giving us the chance to improve our paper. We have specified how we revised the below comments one by one. I hope these address your concerns.

      Comment 1: It is commendable to explore drug repurposing, drug deprescribing, drug repositioning, and rational drug design, especially using established ATP4 inhibitors that are well-studied in Plasmodium and other protozoan parasites. While the study provides some interesting findings, it appears to lack novelty, as similar investigations of cipargamin on other protozoan parasites have been conducted. The study does not introduce new concepts, and the experimental design could benefit from refinement to strengthen the results. Additionally, the rationale for choosing CIP over other MMV compounds targeting ATP4 is not clearly articulated. Clarifying the specific advantages CIP may offer against Babesia would be beneficial. Finally, the validation of the identified mutations might be strengthened by additional experimental support, as reliance on in silico predictions alone may not fully address the functional impact, particularly given the potential ambiguity of the mutations (BgATP4 L to V and I).

      Thank you for your thoughtful feedback. We have addressed the concerns as follows: (1) Introduction of new concepts and experimental design: While our study primarily builds on existing frameworks, it provides novel insights into the interaction of CIP with Babesia parasites, which we believe contribute to the field. Regarding the experimental design, we acknowledge its limitations and have revised the manuscript to include additional experiments to strengthen the robustness of our findings. Specifically, we have added experiments on the detection of BgATP4-associated ATPase activity (Figure 3H), the evaluation of cross-resistance to antibabesial agents (Figures 5A and 5B), and the efficacy of CIP plus TQ combination in eliminating B. microti infection with no recrudescence in SCID mice (Figure 5C).

      (2) Rationale for choosing CIP over other MMV compounds targeting ATP4: We appreciate this point and have expanded the introduction section to articulate our rationale for selecting CIP (Lines 94-97). Specifically, CIP was chosen due to its previously demonstrated efficacy against Plasmodium and other protozoan parasites.

      (3) Validation of identified mutations: We agree that additional experimental data would strengthen the validation of the identified mutations. In response, we have indicated the ratio of wild-type to mutant parasites by Illumina NovaSeq6000 to validate the impact of the BgATP4 C-to-G and A mutations (Figure 2D).

      Comment 2: Conducting an Ion Transport Assay is useful but has limitations. Non-specific binding or transport by other cellular components can lead to inaccurate results, causing false positives or negatives and making data interpretation difficult. Indirect measurements, like changes in fluorescence or electrical potential, can introduce artifacts. To improve accuracy, consider additional assays such as

      a. Radiolabeled Ion Flux Assay: tracks the movement of Na<sup>+</sup> using radiolabeled ions, providing direct evidence of ion transport.

      b. Electrophysiological Assay: measures ionic currents in real-time with patch-clamp techniques, offering detailed information about ATP4 activity.

      Thank you for highlighting the limitations of the ion transport assay and suggesting alternative approaches to improve accuracy. However, they require specialized equipment and expertise not currently available in our laboratory. We have acknowledged these limitations and included these alternative methods as part of the study's future directions. Thank you for your suggestions which will undoubtedly enhance the rigor and depth of our research.

      Comment 3: In-silico predictions can provide plausible outcomes, but it is essential to evaluate how the recombinant purified protein and ligand interact and function at physiological levels. This aspect is currently missing and should be included. For example, incorporating immunoprecipitation and ATPase activity assays with both wild-type and mutant proteins, as well as detailed kinetic studies with Cipargamin, would be recommended to validate the findings of the study.

      Thank you for your insightful suggestions regarding the validation of in-silico predictions. We recognize the importance of evaluating the interaction and function of recombinant purified proteins and ligands at physiological levels to strengthen the study's findings. (1) Incorporating experimental validation:

      a. Immunoprecipitation assays: We agree that immunoprecipitation could provide valuable evidence of protein-ligand interactions. While this was not included in the current study due to limitations in sample availability, we plan to incorporate this assay in follow-up experiments.

      b. ATPase activity assays: Assessing ATPase activity in both wild-type and mutant proteins is a crucial step in validating the functional impact of the identified mutations. We included the results in the revised manuscript (Figure 3H).

      (2) Detailed kinetic studies with cipargamin: We appreciate the recommendation to conduct detailed kinetic analyses. These studies would provide deeper insights into the binding affinity and inhibition dynamics of cipargamin. We have included the results of these experiments in the current study (Figure 3I).

      Comment 4: The study lacks specific suitable control drugs tested both in vitro and in vivo. For accurate drug assessment, especially when evaluating drugs based on a specific phenotype, such as enlarged parasites, it is important to use ATP4 gene-specific inhibitors. Including similar classes of drugs, such as Aminopyrazoles, Dihydroisoquinolines, Pyrazoleamides, Pantothenamides, Imidazolopiperazines (e.g., GNF179), and Bicyclic Azetidine Compounds, would provide more comprehensive validation.

      Thank you for emphasizing the importance of including suitable control drugs. We acknowledge the absence of specific control drugs in the previous version of the manuscript. To date, no drug targeting ATP4 proteins in Babesia has been definitively identified. The suggested drugs could potentially disrupt the parasite's ability to regulate sodium levels by inhibiting PfATP4, a protein essential for its survival. This highlights PfATP4 as an attractive target for antimalarial drug development. However, further studies are required to evaluate whether these drugs exhibit similar activity against ATP4 homologs in Babesia.

      Comment 5: Functional characterization of CIP through microscopic examination and quantification for assessing parasite size enlargement is not entirely reliable. A Flow Cytometry-Based Assay is recommended instead 9 along with suitable control antiparasitic drugs). To effectively monitor Cipargamin's action, conducting time-course experiments with 6-hour intervals is advisable rather than relying solely on endpoint measurements. Additionally, for accurate assessment of parasite morphology, obtaining representative qualitative images using Scanning Electron Microscopy (SEM) or Transmission Electron Microscopy (TEM) for treated versus untreated samples is recommended for precise measurements.

      Thank you for your constructive feedback regarding the methods for functional characterization of CIP and the evaluation of parasite morphology.

      (1) Flow Cytometry-Based Assay: We agree that a flow cytometry-based assay would enhance the accuracy of detecting changes in parasite size and morphology. We will implement this method in future studies as our laboratory currently does not have the capability to conduct such experiments.

      (2) Microscopy for Morphology Assessment: We acknowledge the importance of obtaining high-resolution, representative images of treated and untreated samples. Utilizing Scanning Electron Microscopy (SEM) or Transmission Electron Microscopy (TEM) for qualitative analysis will significantly improve the precision of our morphological assessments. However, both methods have limitations.

      a. SEM: This technique can only scan the erythrocytes' surface; it cannot scan the parasite itself because it is inside the erythrocytes.

      b. TEM: Since the parasite is fixed, observations from various angles may reveal longitudinal or cross-sectional portions, making it impossible to precisely view the parasite's dimensions. As a result, we employed TEM to precisely observe the parasite's internal structure alterations both before and after treatment, as seen in Figure 3C.

      Comment 6: A notable contradiction observed is that mutant cells displayed reduced efficacy and affinity but more pronounced phenotypic effects. The BgATP4<sup>L921I</sup> mutation shows a 2x lower susceptibility (IC<sub>50</sub> of 887.9 ± 61.97 nM) and a predicted binding affinity of -6.26 kcal/mol with CIP. However, the phenotype exhibits significantly lower Na<sup>+</sup> concentration in BgATP4<sup>L921I</sup> (P = 0.0087) (Figure 3E).

      The seemingly contradicting observation of reduced CIP binding and efficacy in the BgATP4<sup>L921I</sup> mutant with a significant decrease in intracellular Na<sup>+</sup> concentration may be explained by factors other than the direct CIP interaction. Logically, we consider that CIP binds less effectively to its target in the BgATP4<sup>L921I</sup> mutant, but the observed phenotype may be attributed to the functional consequences of the mutation. The BgATP4<sup>L921I</sup> mutation probably directly impacts the function of BgATP4's ion transport mechanism, which likely disrupts Na<sup>+</sup> homeostasis independently. Thus, we hypothesize that the dysregulated Na<sup>+</sup> homeostasis is driven by the mutation itself rather than the already weakened inhibitory effect of CIP.

      Comment 7: The manuscript does not clarify the percentage of mutations, and the number of sequence iterations performed on the ATP4 gene. It is also unclear whether clonal selection was carried out on the resistant population. If mutations are not present in 100% of the resistant parasites, please indicate the ratio of wild-type to mutant parasites and represent this information in the figure, along with the chromatograms.

      Thank you for your valuable comments. We appreciate your detailed observations and giving us the opportunity to clarify these points. During the long-term culture process, subculturing was performed every three days. Although clonal selection was not conducted, mutant strains were effectively selected during this process. Using the Illumina NovaSeq6000 sequencing platform, high-throughput next-generation sequencing was performed to detect ratio of wild-type to mutant parasites. Results showed that for BgATP4<sup>L921V</sup>, 99.97% of 7,960 reads were G, and for BgATP4<sup>L921I</sup>, 99.92% of 7,862 reads were A. To enhance clarity, we have included a new figure (Figure 2D) illustrating the sequencing results. We believe this addition will help provide a clearer understanding for the readers.

      Comment 8: While the compound's toxicity data is well-established, it is advisable to include additional testing in epithelial cells and liver-specific cell lines (e.g., HeLa, HCT, HepG2) if feasible for the authors. This would provide a more comprehensive assessment of the compound's safety profile.

      Thank you for your thoughtful suggestion. We included toxicity testing in human foreskin fibroblasts (HFF) as supplemental toxicity data to provide a more comprehensive evaluation of the compound's safety profile (Figure supplement 1B).

      Comment 9: In the in vivo efficacy study, recrudescent parasites emerged after 8 days of treatment. Did these parasites harbor the same mutation in the ATP4 gene? The authors did not investigate this aspect, which is crucial for understanding the basis of recrudescence.

      Thank you for raising this important point. We acknowledge that understanding the genetic basis of recrudescence is critical for elucidating mechanisms of resistance and treatment failure. Although our current study did not include an analysis of the BrATP4 gene in relapse parasites due to limitations in sample availability, we evaluated CIP efficacy in SCID mice and performed sequencing analysis of the BmATP4 gene in recrudescent samples. However, no mutation points were identified (Lines 211-212). We believe that if a relapse occurs after the 7-day treatment, it is unlikely that the parasites would easily acquire mutations.  

      Comment 10: The authors should explain their choice of BABL/c mice for evaluating CIP efficacy, as these mice clear the infection and may not fully represent the compound's effectiveness. Investigating CIP efficacy in SCID mice would be valuable, as they provide a more reliable model and eliminate the influence of the immune system. The rationale for not using SCID mice should be clarified.

      We appreciate the reviewer's suggestion regarding the use of SCID mice to evaluate the efficacy of CIP. In response to your suggestion, we have now included an experiment using SCID mice to evaluate the efficacy of CIP and to eliminate the confounding influence of the immune system. We further investigated the potential of combined administration of CIP plus TQ to eliminate parasites, as we are concerned that the long-term use of CIP as a monotherapy may be limited due to its potential for developing resistance. The results are shown in Figure 5C.

      Comment 11: Do the in vitro-resistant parasites show any potential for cross-resistance with commonly used antiparasitic drugs? Have the authors considered this possibility, and what are their expectations regarding cross-resistance?

      Thank you for your insightful question regarding the potential for cross-resistance between in vitro-resistant parasites and commonly used antiparasitic drugs. In response to your suggestion, we have now included experiments to assess whether B. gibsoni parasites that are resistant to CIP exhibit any cross-resistance to other commonly used antiparasitic drugs, such as atovaquone (ATO) and tafenoquine (TQ). The IC<sub>50</sub> values for both ATO and TQ in the resistant strains showed only slight changes compared to the wild-type strain, with less than a onefold difference (Figure 5A, 5B). This minimal variation suggests that the resistant strain has a mild alteration in susceptibility to ATO and TQ, but not enough to indicate strong resistance or significant cross-resistance. This suggests that CIP could be used in combination with TQ to treat babesiosis.

      Reviewer #2 (Public review):

      Summary:

      In this manuscript, the authors have tried to repurpose cipargamin (CIP), a known drug against plasmodium and toxoplasma against babesia. They proved the efficacy of CIP on babesia in the nanomolar range. In silico analyses revealed the drug resistance mechanism through a single amino acid mutation at amino acid position 921 on the ATP4 gene of Babesia. Overall, the conclusions drawn by the authors are well justified by their data. I believe this study opens up a novel therapeutic strategy against babesiosis.

      Strengths:

      The authors have carried out a comprehensive study. All the experiments performed were carried out methodically and logically.

      Thank you for the comments and your time to review our manuscript.

      Weaknesses:

      The introduction section needs to be more informative. The authors are investigating the binding of CIP to the ATP4 gene, but they did not give any information about the gene or how the ATP4 inhibitors work in general. The resolution of the figures is not good and the font size is too small to read properly. I also have several minor concerns which have been addressed in the "Recommendations for the authors" section.

      We thank the reviewer for their valuable comments. In response, we have revised the introduction to include a more detailed explanation of the ATP4 gene, its biological significance, and the mechanism of ATP4 inhibitors to provide a better context of the study (Lines 86-93). Additionally, we have reformatted the figures to enhance resolution and increased the font size to ensure improved readability. We also appreciate the reviewer's careful assessment of the manuscript and have addressed all minor concerns outlined in the "Recommendations for the Authors" section. A detailed, point-by-point response to each concern is provided in the response letter, and the corresponding revisions have been incorporated into the manuscript.

      Reviewer #3 (Public review):

      Summary:

      The authors aim to establish that cipargamin can be used for the treatment of infection caused by Babesia organisms.

      Strengths:

      The study provides strong evidence that cipargamin is effective against various Babesia species. In vitro, growth assays were used to establish that cipargamin is effective against Babesia bovis and Babesia gibsoni. Infection of mice with Babesia microti demonstrated that cipargamin is as effective as the combination of atovaquone plus azithromycin. Cipargamin protected mice from lethal infection with Babesia rodhaini. Mutations that confer resistance to cipargamin were identified in the gene encoding ATP4, a P-type Na<sup>+</sup> ATPase that was found in other apicomplexan parasites, thereby validating ATP4 as the target of cipargamin.

      We appreciate the reviewer for taking the time to review our manuscript.

      Weaknesses:

      Cipargamin was tested in vivo at a single dose administered daily for 7 days. Despite the prospect of using cipargamin for the treatment of human babesiosis, there was no attempt to identify the lowest dose of cipagarmin that protects mice from Babesia microti infection. Exposure to cipargamin can induce resistance, indicating that cipargamin should not be used alone but in combination with other drugs. There was no attempt at testing cipargamin in combination with other drugs, particularly atovaquone, in the mouse model of Babesia microti infection. Given the difficulty in treating immunocompromised patients infected with Babesia microti, it would have been informative to test cipargamin in a mouse model of severe immunosuppression (SCID or rag-deficient mice).

      We thank the reviewer for raising these important comments. We address each concern as follows:

      (1) Identifying the lowest protective dose of CIP:

      Although our current study was designed to assess the efficacy of CIP at a single therapeutic dose over a 7-day period, we acknowledge that identifying the lowest effective dose would provide valuable information for optimizing treatment regimens. We plan to address this in future studies by conducting a dose-response experiment to identify the minimal protective dose of CIP.

      (2) Testing CIP in combination with other drugs:

      In the current study, we have tested the efficacy of tafenoquine (TQ) combined with CIP, as well as CIP or TQ administered individually, in a mouse model of B. microti infection. Our results demonstrated that, compared with monotherapy, the combination of CIP and TQ completely eliminated the parasites within 90 days of observation (Figure 5C).

      (3) Testing in an immunocompromised mouse model:

      We agree with the reviewer that evaluating CIP in immunocompromised models is critical for understanding its potential in treating immunocompromised patients. To address this, we have conducted experiments using SCID mice infected with B. microti. Our results indicated that the combination therapy of CIP plus TQ was effective in eliminating parasites in the severely immunocompromised model (Figure 5D).

      Recommendations for the authors:

      Reviewer #1 (Recommendations for the authors):

      Comment 1: Table: Include the in-silico binding energies for each mutation and ligand.

      We have added binding energies for each mutation and ligand in Table supplement 3.

      Comment 2: Did the authors investigate the potential of combination therapies involving CIP?

      We have tested the efficacy of TQ combined with CIP in a mouse model of B. microti infection.

      Comment 3: Does this mutation affect the transmission of the parasite?

      Based on our observations, the growth and generation rates of the mutant strain are comparable to those of the wild-type strain. These findings suggest that the mutation does not significantly affect the spread or transmission of the parasite. We have included this observation in the revised manuscript (Lines 243-244).

      Comment 4: 60: Use abbreviations CLN for clindamycin and QUI for quinine.

      We have revised them accordingly (Lines 59-60).

      Comment 5: 86: The hypothesis is not strong or convincing; it needs to be modified to be more specific and convincing.

      We have revised the hypothesis to reflect the rationale behind the study better and to support our claim more strongly (Lines 94-97).

      Comment 6: 93: Change to: "In vitro efficacy of CIP against B. bovis and B. gibsoni.".

      We have changed the suggested content in the manuscript (Line 104).

      Comment 7: 96: Define CC<sub>50</sub>.

      We have added the definition of CC<sub>50</sub> (Line 106).

      Comment 8: 102: Change to: "...Balb/c mice increased dramatically in the...".

      We have changed the word following your recommendation (Line 114).

      Comment 9: 108: "...significant decrease at 12 DPI...".

      We have revised it according to your suggestion (Line 120).

      Comment 10: 110: "This indicates that the administration...".

      We have revised it according to your suggestion (Line 122).

      Comment 11: Figure 1:

      (1) Panels A and B should clearly indicate parasite species within the graph for better self-explanation.

      We have indicated parasite species within the graph.

      (2) For panels C, D, and E, if mice were eliminated or euthanized in the study, include a symbol in the graph to indicate this.

      For panels C and D, no mice were eliminated during the study; therefore, no symbol was added to these graphs. Panel F already provides information about the number of eliminated mice, which corresponds to the data in Panel E.

      (3) In panels C, D, and E, use a continuation arrow for drug treatment rather than a straight line, to cover the duration of the treatment.

      We have updated the figures to use continuation arrows instead of straight lines to represent the duration of drug treatment.

      Comment 12: Figure 2: The color combination for the WT and mutant curves is hard to read; consider using regular, less fluorescent, and more distinguishable colors.

      We have adjusted the color scheme to use more distinguishable and less fluorescent colors, ensuring better readability and clarity. The revised figure with the updated color scheme has been included in the updated manuscript, and we hope this resolves the readability concern.

      Comment 13: Figure 3:

      (1) Panel A: Represent a single infected iRBC rather than a field for better visualization.

      We have updated Panel A to display a single infected iRBC instead of a field.

      (2) Panels E and F: Change the color patterns, as the current colors, especially the green variants (WT and mutant L921V), are difficult to read.

      To improve readability, we have updated the color patterns for these panels by selecting more distinguishable colors with higher contrast (Figure 3F, 3G).

      Comment 14: Figure 4: Panels B, C, and D: The text is too small to read; increase the font size or change the resolution.

      We have increased the font size and replaced the panels with high-resolution versions (Figure 4B, 4C, 4D).

      Reviewer #2 (Recommendations for the authors):

      Comment 1: In the last paragraph of the introduction, the authors mentioned determining the activity of CIP in vitro in B. bovis and B. gibsoni while in vivo in B. microti and B. rodhaini. It is not explained why they are testing the in vitro and in vivo effects on different Babesia species. Could you please add some logic there? Also, why did they mention measuring the inhibitory activity of CIP by monitoring the Na<sup>+</sup> and H<sup>+</sup> balance? This part needs to be rewritten with more information. The ATP4 gene is not properly introduced in the manuscript.

      We thank the reviewer for raising these important points. Below, we address each aspect of the comment in detail:

      (1) Rationale for testing different Babesia spp. in vitro and in vivo:

      B. bovis and B. gibsoni are well-established Babesia models for in vitro culture systems, allowing evaluation of CIP's inhibitory activity under controlled laboratory conditions. B. microti and B. rodhaini, on the other hand, are commonly used rodent models for the in vivo studies of babesiosis, enabling the assessment of drug efficacy in a mammalian host system. This multi-species approach provides a comprehensive evaluation of CIP's efficacy across Babesia spp. with different biological characteristics.

      (2) Measuring CIP's inhibitory activity via Na<sup>+</sup> and H<sup>+</sup> balance:

      We acknowledge that this section of the introduction requires more context. The revised manuscript now includes additional information explaining that the ATP4 gene, which encodes a Na<sup>+</sup>/H<sup>+</sup> transporter, is the proposed target of CIP (Lines 86-93). CIP disrupts the ion homeostasis maintained by ATP4, leading to an imbalance in Na<sup>+</sup> and H<sup>+</sup> concentrations. Monitoring these ionic changes provides a mechanistic understanding of CIP's mode of action and its impact on parasite viability. This rationale has been expanded in the introduction to clarify its significance.

      Comment 2: The figure fonts are too small. The resolution for the images is also poor.

      We have increased the font size in all figures to improve readability. Additionally, we have replaced the figures with high-resolution versions to ensure clarity and visual quality.

      Comment 3: Figures 1A and 1B: one of the error bars merged to the X-axis legend. Please modify these panels. Which curve was used to determine the IC<sub>50</sub> values (although it's mentioned in the methods section, would it be better to have the information in the figure legends as well)?

      We thank the reviewer for their comments regarding Figures 1A and 1B.

      (1) Error bars overlapping the X-axis legend:

      The error bars in the figures were automatically generated using GraphPad Prism9 based on the data and are determined by the values themselves. Unfortunately, this overlap cannot be avoided without altering the data representation.

      (2) IC<sub>50</sub> curve information:

      To clarify the determination of IC<sub>50</sub> values, we have already included gray dashed lines in the graphs to indicate where the IC<sub>50</sub> values were derived from the curves. This visual representation provides clear information about the IC<sub>50</sub> points.

      Comment 4: Supplementary Figure 1: what are MDCK cells? What is CC<sub>50</sub>? Please mention their full forms in the text and figure legends (they should be described here because the methods section comes later). What is meant by a predicted selectivity index? There should be an explanation of why and how they did it. Which curve was used to determine the IC<sub>50</sub> values?

      We thank the reviewer for pointing out the need to clarify terms and provide additional context in the supplementary figure and text. We have updated the figure legend and text to include the full forms of MDCK (Madin-Darby canine kidney) cells and CC<sub>50</sub> (50% cytotoxic concentration), ensuring clarity for readers encountering these terms for the first time. In text, now we have included a brief explanation of the selectivity index as a measure of a drug's safety and specificity (Lines 108-110). The selectivity index is calculated as the ratio between the half maximal inhibitory concentration (IC<sub>50</sub>) and the 50% cytotoxic concentration (CC<sub>50</sub>) values (Lines 333-335). We also have already included gray dashed lines in the graphs to indicate where the IC<sub>50</sub> values were derived from the curves (Figure supplement 1).

      Comment 5: Figures 1C-F: It feels unnecessary to write down n=6 for each panel and each group. Since "n" is equal for all, it would be nice to just mention it in the figure legend only.

      We appreciate the reviewer's suggestion regarding the notation of "n=6" in Figures 1C-F. To improve clarity and reduce redundancy, we have removed the "n=6" notation from the individual panels and included it in the figure legend instead.

      Comment 6: Figure 2A: was never mentioned in the text.

      We have described the sequencing results for the wild-type B. gibsoni ATP4 gene with a reference to Figure 2A in the revised manuscript (Lines 134-135).

      Comment 7: Figure 2D: some of the error bars merged to the X-axis legend. Please modify. Again, which curve was used to determine the IC<sub>50</sub> values? Can the authors explain why the pH declined after 4 minutes?

      We thank the reviewer for this insightful question.

      (1) Error bars overlapping the X-axis legend:

      The error bars in Figure 2E were automatically generated using GraphPad Prism9 and are determined by the underlying data values. Unfortunately, this overlap cannot be avoided without altering the data representation.

      (2) IC<sub>50</sub> curve information:

      Since Figure 2E contains three separate curves, adding dashed lines to indicate the IC<sub>50</sub> for each curve would make the figure overly cluttered and reduce readability. To address this, we have clearly indicated the IC<sub>50</sub> values in Figures 1A and 1B and described the methodology for determining IC<sub>50</sub> values in the Methods section. We believe this approach provides sufficient clarity without compromising the visual experience of Figure 2E.

      (3) The pH decline observed after 4 minutes (Figure 3E) may be attributed to the following factors:

      a. Ion transport dynamics:

      The initial rise in pH likely reflects the rapid inhibition of Na<sup>+</sup>/H<sup>+</sup> exchange mediated by CIP, which temporarily alkalinizes the intracellular environment. However, after this initial phase, compensatory mechanisms, such as proton influx or metabolic acid production, may lead to a subsequent decline in pH.

      b. Drug kinetics and target interaction:

      The decline could also result from the time-dependent effects of CIP on ATP4-mediated ion transport. As the drug action stabilizes, the parasite may partially restore ionic balance, leading to a decrease in intracellular pH.

      Comment 8: Supplementary Figure 2: It's difficult to distinguish between red and pink colors, so it would be wise to use two contrasting colors to distinguish between Pf and Tg CIP resistant cites.

      We have updated the figure to enhance clarity. Purple squares and arrows now represent sites linked to P. falciparum CIP resistance, replacing the previous red squares. Similarly, gray squares and arrows have replaced the green squares to denote sites associated with T. gondii (Figure supplement 2).

      Comment 9: Line 65: Is it possible to add a reference here?

      We have added a reference in line 65.

      Comment 10: Line 69: Please spell the full form of G6PD as it was never mentioned before.

      We have added the full form of G6PD in lines 69-70.

      Comment 11: Line 103: mention what DPI is (irrespective of the methods section which comes later).

      We have spelled out DPI (days postinfection) in line 115.

      Comment 12: Line 120: It's not explained why B. gibsoni ATP4 gene was investigated? There should be more explanation and references to previous work.

      We thank the reviewer for pointing out the need to provide more context for investigating the B. gibsoni ATP4 gene. To address this, we have added more information to the introduction, explaining that the ATP4 gene, which encodes a Na<sup>+</sup>/H<sup>+</sup> transporter, is the proposed target of CIP (Lines 86-93).

      Comment 13: Line 203-219: line spacing seems different from the rest of the manuscript.

      We have corrected the incorrect format (Lines 262-278).

      Reviewer #3 (Recommendations for the authors):

      Comment 1: Lines 66-68: The report by Marcos et al. 2022 did not demonstrate that tafenoquine was effective in curing relapsing babesiosis. In the discussion of that article, the authors state that "it is impossible to conclude that the drug tafenoquine provided any clinical benefit." The first demonstration of tafenoquine efficacy against relapsing babesiosis was reported by Rogers et al. 2023 and confirmed by Krause et al. 2024. Please rephrase the statement and use relevant citations.

      We thank the reviewer for pointing out this issue and we have rephrased the statement and used relevant citations (Lines 66-68).

      Comment 2: Line 103: mean parasitemia at 10 DPI is reported to be 35.88% but Figure 1C appears to indicate otherwise.

      We are sorry for the carelessness, the correct mean parasitemia at 10 DPI is 38.55%, and this has been updated in line 115 of the revised manuscript to reflect the data shown in Figure 1C.

      Comment 3: Line 116: parasitemia is said to recur on day 14 post-infection but Figure 1E indicates that recurrence was already noted on day 12 post-infection.

      We thank the reviewer for pointing out this inconsistency. We have corrected the relapse day to reflect that recurrence was noted on day 12 post-infection, as shown in Figure 1E. This correction has been made in the revised manuscript (Line 128).

      Comment 4: Line 120: Replace "wells" with "strains". Also, start the paragraph with one brief sentence to state how resistant parasites were generated.

      We have replaced "wells" with "strains" and added one brief sentence to explain how resistant parasites were generated (Lines 132-134).

      Comment 5: Line 169: is Ji et al, 2022b truly the appropriate reference to support a statement on tafenoquine?

      We thank the reviewer for highlighting this point. We have added one other reference to support a statement on tafenoquine. The IC<sub>50</sub> value of TQ was 20.0 ± 2.4 μM against B. gibsoni (Ji et al., 2022b), and 31 μM against B. bovis (Carvalho et al., 2020) (Lines 223-225).

      Comment 6: Lines 184-185: given that exposure to CIP induces mutations in the ATP4 gene and therefore resistance to CIP, what is the prospect of using CIP for the treatment of babesiosis? Can the authors speculate on whether CIP should not be used alone but rather in combination with other drugs currently used for the treatment of human babesiosis?

      We thank the reviewer for raising this important question. Given that exposure to CIP induces mutations in the ATP4 gene, leading to resistance, we acknowledge that the long-term use of CIP as a monotherapy may be limited due to the potential for resistance development. To address this concern, we investigated the combination therapy of TQ and CIP to achieve the complete elimination of B. microti in infected mice (a model for human babesiosis). The results of this study are presented in Figure 5C.

      Comment 7: Lines 258-259: it is stated that drug treatment was initiated on day 4 post-infection when mean parasitemia was 1% and that drug treatment was continued for 7 days. This is not the case for B. rodhaini infection. As reported in Figure 1E, treatment was initiated on day 2 post-infection.

      We apologize for the oversight and any confusion caused. We have corrected the statement to reflect that drug treatment for B. rodhaini-infected mice was initiated at 2 DPI, as reported in Figure 1E (Lines 347-349).

      Comment 8: Lines 282-285: RBCs are said to be exposed to CIP for 3 days but parasite size is said to be measured on day 4. Which is correct?

      We thank the reviewer for pointing out this discrepancy. To clarify, the infected erythrocytes were exposed to CIP for three consecutive days (72 hours). Blood smears were then prepared at the 73<sup>rd</sup> hour, corresponding to the fourth day.

      Comment 9: Lines 35-37: this sentence can be omitted from the abstract as it does not summarize additional insight or additional data.

      We have omitted this sentence from the abstract.

      Comment 10: Line 55: replace Drews et al. 2023 with Gray and Ogden 2021 (doi: 10.3390/pathogens10111430). This excellent article directly supports the statement made by the authors.

      We appreciate the reviewer's suggestion and have replaced the reference with Gray and Ogden, 2021 (doi: 10.3390/pathogens10111430) (Line 54).

      Comment 11: Line 55: modify the start of sentence to read "The disease is known as babesiosis ...".

      We have modified the sentence (Line 54).

      Comment 12: Line 56: rephrase to read ".... but chronic infections can be asymptomatic".

      We have modified the sentence (Line 55).

      Comment 13: Line 57: rephrase to read "The fatality rate ranges from 1% among all cases to 3% among hospitalized cases but has been as high as 20% in immunocompromised patients."

      We have rephrased the sentence (Lines 55-57).

      Comment 14: Line 61: replace Holbrook et al. 2023 with Krause et al. 2021 (doi: 10.1093/cid/ciaa1216).

      We have replaced Holbrook et al. 2023 with Krause et al. 2021 (doi: 10.1093/cid/ciaa1216) (Line 60).

      Comment 15: Line 62: rephrase to read "... cytochrome b, which is targeted by atovaquone, were identified in patients with relapsing babesiosis." Here, also cite Lemieux et al., 2016; Simon et al., 2017; Rosenblatt et al, 2021, Marcos et al., 2022; Rogers et al., 2023; Krause et al., 2024.

      We have rephrased the sentence and cited the suggested references (Lines 61-64).

      Comment 16: Line 65: rephrase "Despite its efficacy, this combination can elicit adverse drug reactions (Vannier and Krause, 2012)."

      We have rephrased the sentence (Lines 65-66).

      Comment 17: Lines 75-77: rephrase to read "... of the drug indicated that CIP taken orally had good absorption, a long half-life, and ...".

      We have rephrased the sentence (Lines 76-77).

      Comment 18: Line 79: remove "the".

      We have removed "the" (Lines 79-80).

      Comment 19: Lines 83-85: rephrase to read "Mice infected with T. gondii that were treated with CIP on the day of infection and the following day had 90% fewer parasites 5 days post-infection (Zhou et al., 2014).".

      We have rephrased the sentence (Lines 83-85).

      Comment 20: Line 90: shorten the sentence to end as follows "... of CIP on Babesia parasites.".

      We have shortened the sentence in line 100 with your suggestion.

      Comment 21: Line 96: spell out CC<sub>50</sub>.

      We have spelled out the full form of CC<sub>50</sub> (Line 106).

      Comment 22: Line 104: remove "of body weight".

      We have removed "of body weight" (Line 116).

      Comment 23: Line 108: delete "from 8 DPI to 24 DPI, with statistically significant decreases".

      We have deleted "from 8 DPI to 24 DPI, with statistically significant decreases" (Line 120).

      Comment 24: Line 111: start a new paragraph with the sentence "BALB/c mice infected ...".

      We have started a new paragraph with the sentence "BALB/c mice infected ..." (Line 124).

      Comment 25: Line 123: replace "showed" with "occurred".

      We have replaced "showed" with "occurred" (Line 138).

      Comment 26: Line 127: rephrase to read "... sensitivity of the resistant parasite lines ...".

      We have rephrased the sentence (Line 144).

      Comment 27: Lines 137-140: rephrase to read ".... lines were lower when compared with ..." .

      We have rephrased the sentence (Line 158).
      Comment 28: Line 149: replace "BgATP4" with "B. gibsoni ATP4".

      We have replaced "BgATP4" with "B. gibsoni ATP4" (Line 183).

      Comment 29: Line 154: spell out "pLDDT" prior to pLDDT.

      We have provided the full form of pLDDT in the revised manuscript (Line 188).
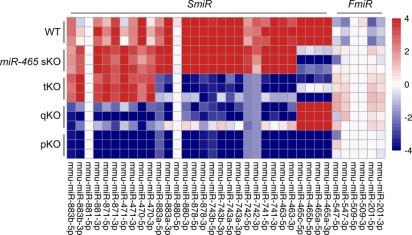
      Comment 30: Lines 165-166: rephrase to read "CIP is a novel compound that inhibits Plasmodium development by targeting ATP4 and has been ...".

      We have rephrased the sentence (Lines 219-220).
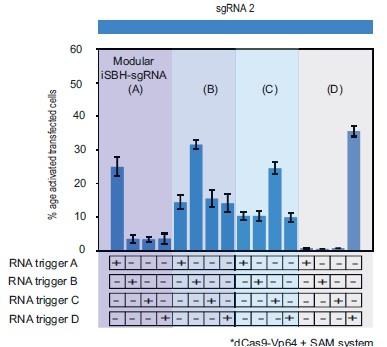
      Comment 31: Lines 171-172: rephrase to read "...AZI, the combination recommended by the CDC in the United States.
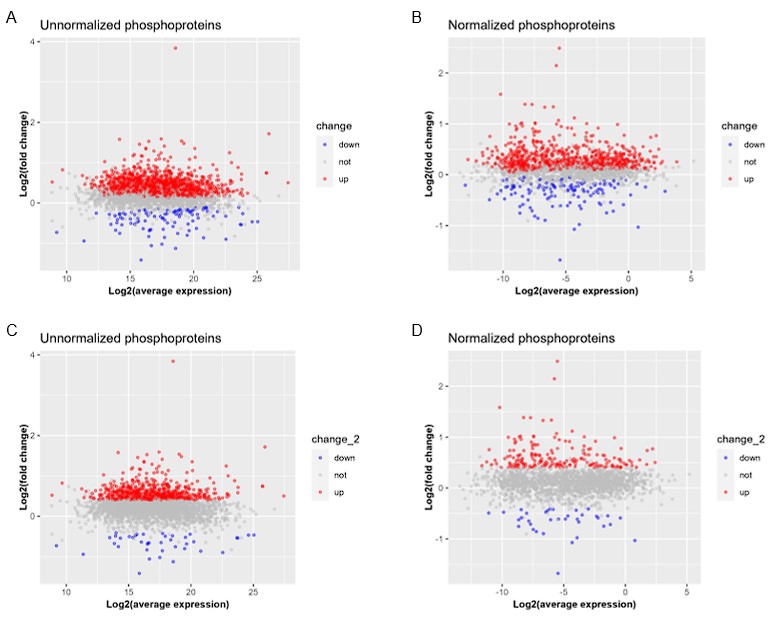
      We have rephrased the sentence (Lines 226-227).

      Comment 32: Line 173: rephrase to read "... B. rodhaini infection, with survival up to 67%.".

      We have rephrased the sentence (Line 228).

      Comment 33: Lines 175-178: rephrase to read "In a previous study, a P. falciparum Dd2 strain that acquired resistance to CIP carried the G358S mutation in the ...".

      We have rephrased the sentence (Lines 230-231).

      Comment 34: Lines 179-180: rephrase to read "ATP4 is found in the parasite plasma membrane and is specific to the subclass of apicomplexan parasites.".

      We have rephrased the sentence (Lines 232-233).

      Comment 35: Lines 182-184: rephrase to read "In another study of Toxoplasma gondii, a cell line that carried the mutation G419S in the TgATP4 gene was 34 times ...".

      We have rephrased the sentence (Lines 235-237).

      Comment 36: Lines 201-202: deleted the last sentence of this paragraph.

      We have deleted the last sentence of the paragraph (Line 261).

      Comment 37: Line 228: rephrase to read "... that CIP had a weaker binding to BgATP4<sup>L921I</sup> than to BgATP4<sup>L921V</sup>.".

      We have rephrased the sentence (Lines 294-295).

      Comment 38: Lines 261-262: please state that drugs were prepared in sesame oil. Add "20 mg/kg" in front of AZI.

      We have stated that drugs were prepared in sesame oil and added "20 mg/kg" in front of AZI (Lines 350-352).

      Comment 39: Line 265: replace "care" with "treatments".

      We have replaced "care" with "treatments" (Line 355).

      Comment 40: Line 267: replace "observe" with "assess".

      We have replaced "observe" with "assess" (Line 357).

      Comment 41: Lines 269-271: please provide the absolute numbers of B. gibsoni infected RBCs and the absolute numbers of uninfected RBCs that were added to the culture medium.

      We thank the reviewer for this suggestion. In the revised manuscript, we have included the absolute numbers of B. gibsoni-infected RBCs and uninfected RBCs added to the culture medium. Specifically, the culture medium contained 10 μL (5×10 <sup>6</sup>) B. gibsoni iRBCs mixed with 40 μL (4×10 <sup>8</sup>) uninfected RBCs (Lines 360-361).

      Comment 42: Line 279: replace "confirmed" with "identified".

      We have replaced "confirmed" with "identified" (Line 370).

      Comment 43: Figure Supplement 2: the squares are not readily visible. Could the entire column corresponding to the mutation position be highlighted?

      We thank the reviewer for this suggestion. To improve visibility, we have changed the color of the squares and added arrows to make the mutation sites as prominent as possible. Unfortunately, due to software limitations, we were unable to highlight the entire column corresponding to the mutation position.

      Comment 44: Figure Supplement 4: for the parasite that carries a mutation in BgATP4, please delete the arrows that are next to BgATP4. These arrows send the message that the mutation ATP4 has an active role in pumping back Na<sup>+</sup> and H<sup>+</sup> back in their compartment, which is not the case.

      We thank the reviewer for their observation. The dotted arrows next to BgATP4 are intended to indicate the recovery of H<sup>+</sup> and Na<sup>+</sup> balance facilitated by the mutated ATP4, which reduces susceptibility to ATP4 inhibitors. To avoid potential confusion, we have revised the figure legend to clearly explain the role of the arrows, ensuring the intended message is accurately conveyed.

    1. Author response:

      The following is the authors’ response to the original reviews.

      Public Reviews:

      Reviewer #1 (Public Review):

      Summary:

      As our understanding of the immune system increases it becomes clear that murine models of immunity cannot always prove an accurate model system for human immunity. However, mechanistic studies in humans are necessarily limited. To bridge this gap many groups have worked on developing humanised mouse models in which human immune cells are introduced into mice allowing their fine manipulation. However, since human immune cells will attack murine tissues, it has proven complex to establish a human-like immune system in mice. To help address this, Vecchione et al have previously developed several models using human cell transfer into mice with or without human thymic fragments that allow negative selection of autoreactive cells. In this report they focus on the examination of the function of the B-helper CD4 T-cell subsets T-follicular helper (Tfh) and T-peripheral helper (Tph) cells. They demonstrate that these cells are able to drive both autoantibody production and can also induce B-cell independent autoimmunity.

      Strengths:

      A strength of this paper is that currently there is no well-established model for Tfh or Tph in HIS mice and that currently there is no clear murine Tph equivalent making new models for the study of this cell type of value. Equally, since many HIS mice struggle to maintain effective follicular structures Tfh models in HIS mice are not well established giving additional value to this model.

      Weaknesses:

      A weakness of the paper is that the models seem to lack a clear ability to generate germinal centres. For Tfh it is unclear how we can interpret their function without the structure where they have the greatest influence. In some cases, the definition of Tph does not seem to differentiate well between Tph and highly activated CD4 T-cells in general.

      The limited ability of HIS mice to generate well-defined lymphoid tissue structures is well noted. While the emergence of T cells in HIS mice increases the size of lymphoid tissues, the structure remains suboptimal and vaccination responses are limited. We believe this is mainly due to the common gamma chain knockout, which results in a lack of murine lymphoid tissue inducer (LTi) cells, which require IL-7 signaling to interact with murine mesenchymal cells for normal lymphoid tissue development. Ongoing efforts by our group and others aim to address this challenge by providing the necessary signals. Despite this challenge, these mice do develop Tfh cells, allowing us to study this cell subset.

      We agree with the reviewer that the distinction between Tph and highly activated CD4 T cells is incomplete.

      However, we have provided several distinctions in our manuscript that support the presence of Tph in HIS mice: 1) Tph cells exhibit very high levels of PD-1 expression, whereas other activated CD4 cells have varying levels of PD-1 expression. 2) Tph cells express IL-21. 3) Tph cells promote B cell differentiation and antibody production. 

      Reviewer #2 (Public Review):

      Summary:

      Humanized mice, developed by transplanting human cells into immunodeficient NSG mice to recapitulate the human immune system, are utilized in basic life science research and preclinical trials of pharmaceuticals in fields such as oncology, immunology, and regenerative medicine. However, there are limitations to using humanized mice for mechanistic analysis as models of autoimmune diseases due to the unnatural T cell selection, antigen presentation/recognition process, and immune system disruption due to xenogeneic GVHD onset.

      In the present study, Vecchione et al. detailed the mechanisms of autoimmune disease-like pathologies observed in a humanized mouse (Human immune system; HIS mouse) model, demonstrating the importance of CD4+ Tfh and Tph cells for the disease onset. They clarified the conditions under which these T cells become reactive using techniques involving the human thymus engraftment and mouse thymectomy, showing their ability to trigger B cell responses, although this was not a major factor in the mouse pathology. These valuable findings provide an essential basis for interpreting past and future autoimmune disease research conducted using HIS mice.

      Strengths:

      (1) Mice transplanted with human thymus and HSCs were repeatedly executed with sufficient reproducibility, with each experiment sometimes taking over 30 weeks and requiring desperate efforts. While the interpretation of the results is still debatable, these description is valuable knowledge for this field of research.

      (2) Mechanistic analysis of T-B interaction in humanized mice, which has not been extensively addressed before, suggests part of the activation mechanism of autoreactive B cells. Additionally, the differences in pathogenicity due to T cell selection by either the mouse or human thymus are emphasized, which encompasses the essential mechanisms of immune tolerance and activation in both central and peripheral systems.

      Weaknesses:

      (1) In this manuscript, for example in Figure 2, the proportion of suppressive cells like regulatory T cells is not clarified, making it unclear to what extent the percentages of Tph or Tfh cells reflect immune activation. It would have been preferable to distinguish follicular regulatory T cells, at least. While Figure 3 shows Tregs are gated out using CD25- cells, it is unclear how the presence of Treg cells affects the overall cell population immunogenic functionally.

      We analyzed the % FOXP3+ cells and the % of ICOS+ cells within the Tfh and Tph cells in the spleen of Hu/Hu and Mu/Hu mice at 20 weeks post-transplantation. Importantly, we see no difference in FOXP3 expression between Tfh of Mu/Hu and Hu/Hu mice. The results have been added to panels J and K of Figure 2. 

      (2) The definition of "Disease" discussed after Figure 6 should be explicitly described in the Methods section. It seems to follow Khosravi-Maharlooei et al. 2021. If the disease onset determination aligns with GVHD scoring, generally an indicator of T cell response, it is unsurprising that B cell contribution is negligible. The accelerated disease onset by B cell depletion likely results from lymphopenia-induced T cell activation. However, this result does not prove that these mice avoid organ-specific autoimmune diseases mediated by auto-antibodies and the current conclusion by the authors may overlook significant changes. For instance, would defining Disease Onset by the appearance of circulating autoantibodies alter the result of Disease-Free curve? Are there possibly histological findings at the endpoint of the experiment suggesting tissue damage by autoantibodies?

      We have added a definition of disease to the Methods section as requested. Regarding the possibility of antibody-mediated disease that may be missed by this definition, we acknowledge this point in the Discussion section. However, we also discuss the point that the deficient complement pathway in NSG mice is likely to have protected the HIS mice from autoantibody-mediated organ damage.

      (3) Helper functions, such as differentiating B cells into CXCR5+, were demonstrated for both Hu/Hu and Mu/Huderived T cells. This function seemed higher in Hu/Hu than in Mu/Hu. From the results in Figure 7-8, Hu/Hu Tph/Tfh cells have a stronger T cell identity and higher activation capacity in vivo on a per-cell basis than Mu/Hu's ones. However, Hu/Hu-T cells lacked an ability to induce class-switching in contrast to Mu/Hu's. The mechanisms causing these functional differences were not fully discussed. Discussions touching on possible changes in TCR repertoire diversity between Mu/Hu- and Hu/Hu- T cells would have been beneficial. 

      Consistent with the reviewer’s suggestion, we have previously shown that the TCR repertoire in Mu/Hu mice is less diverse than that in Hu/Hu mice (Khosravi-Maharlooei M, et al., J Autoimmun., 2021). We believe that the narrowed TCR repertoire in the periphery of Mu/Hu mice, combined with the inadequate negative selection in the murine thymus reported in the paper cited above, results in selective peripheral expansion primarily of the few T cell clones that are cross-reactive with HLA/murine self peptide complexes presented by human APCs in the periphery.  We have discussed the reasons why these cells, when transferred to secondary recipients containing the same APCs, might not be as active as the more diverse, HLA-selected T cell repertoire transferred from Hu/Hu mice.  These possible reasons include exhaustion of the T cells in Mu/Hu mice, limited expression of the few targeted HLA-peptide complexes recognized by the narrow cross-reactive TCR repertoire of Mu/Hu T cells and the consequent relatively impaired T-B cell collaboration in these mice.   

      Recommendations for the authors:  

      Reviewer #1 (Recommendations For The Authors):

      The authors note that they removed an outlier result from Figures 1 B & C. With only 4 mice it seems difficult to see exactly how they determined the result was an outlier. Presumably, it was quite different from the others but in such a small dataset removing data without a very clear statistical rationale seems likely to strongly influence the results.

      We have revised Fig 1 to include the previously-deleted outlier mouse.   

      Figure 4. The authors describe the follicular area. Were they able to observe any GC-like structures in their data?

      From the examples, I can see that the PNA staining is sometimes diffuse but even if the authors felt they could not observe a distinct GC this should be stated and discussed in the text.

      We now describe the three colors IF staining in more detail in accordance with this comment. We characterized 4 Hu/Hu and 3 Mu/Hu spleens earlier than 20 weeks post-transplant. In all of these mice, distinct B cell areas (CD20+) were obvious and PNA+ cells were more concentrated in the B cell zones. We stained 4 Hu/Hu and 3 Mu/Hu spleens from mice between 20-30 weeks post-transplant and found that B cell areas were smaller in all these spleens compared to those taken before 20-weeks post-transplant. PNA+ areas are also more diffusely distributed and are not enriched in the B cell areas. Only 2 Mu/Hu mice showed clear B cell zones with some enriched PNA+ areas in the B cell zones. Additionally, we stained 2 Hu/Hu and 2 Mu/Hu mice later than week 30 post-transplant. No distinct B cell areas were observed in any of the spleens of these mice and PNA+ cells were diffusely distributed.  

      In Figure 3E the authors sort CD25-CXCR5-CD45RA- CD4 T-cells as Tph. This does seem a very loose definition including essentially all non-naïve CD4 cells that are not Tregs or Tfh.

      We agree with the reviewer that the distinction between Tph and highly activated CD4 T cells is incomplete.

      However, we have provided several distinctions in our manuscript that support the presence of Tph in HIS mice: 1) Tph cells exhibit very high levels of PD-1, whereas other activated CD4 cells have varying levels of PD-1 expression. 2) Tph cells express IL-21. 3) Tph cells promote B cell differentiation and antibody production. 

      Tph is sometimes a hard cell type to separate from more general highly activated CD4 T-cells. The broad CXCR5PD1+ phenotype they have used is common in the literature and the authors have confirmed some enrichment of IL21 production by these cells. However, they should consider if there are ways of further confirming this by examination of other markers such as CCR2 and CCR5 or elimination of other effector identities such as Th1 and Th17 or PD1+ exhaustion phenotypes.

      For this study, we chose to follow the commonly used definitions in the literature for Tph and Tfh cells. For this reason, we are careful to refer to “Tph-like” cells rather than Tph cells in this manuscript. Distinguishing Tph cells from other subsets of activated CD4 cells would require further studies such as single cell RNA seq, which we hope to be able to perform in the future with additional funding.  

      Figure 8. The authors perform some analysis of B-cell phenotypes looking at markers such as CD27, IgD in 8B, and CD11c in 8C. Why is CD11c considered in isolation? The level of expression of the other markers would change how this data would be interpreted e.g. IgD-CD27-CD11c+ = DN2/Atypical cells, IgD-CD27+CD11c+ = Activated or ageassociated, etc.

      In response to this comment, we reanalyzed the splenic samples of the donor Mu/Hu and Hu/Hu mice and their adoptive recipients. Interestingly, in the T cell donors, the Mu/Hu B cells included greater proportions of activated/age-associated B cells (IgD-CD27+CD11c+) and atypical cells (IgD-CD27-CD11c+), compared to the Hu/Hu B cells. This is consistent with the increased disease, increased Tph/Tfh and increased IgG antibody findings in the primary Mu/Hu compared to Hu/Hu mice. These results have been added to Figure 5G. We performed a similar analysis in the blood (week 9) and spleen of adoptive recipient mice. These studies showed that activated/ageassociated B cells (IgD-CD27+CD11c+) and atypical cells (IgD-CD27-CD11c+) were significantly increased in the adoptive recipients of Hu/Hu Tph and Tfh cells compared to the adoptive recipients of Mu/Hu Tph and Tfh cells (Fig. 8C). These results are consistent with the disease, T cell expansion and antibody results in the adoptive recipients. 

      Data not shown occurs often in this manuscript. In some cases what is not shown is potentially important. The authors note in the text relating to Figure 7 that the "purity of the cell populations as assessed by FCM ranged from 56-60% (data not shown)". Those numbers are a little alarming. They are referring to the purity of the FCS sorted Tfh and Tph prior to transfer? Currently, some of the discussion of this paper is about the possibility of plasticity, with Tfh switching into a Tph phenotype. If the transferred cell populations are 56-60% pure I don't think it is possible to make any interpretation of plasticity.

      We looked into this further and realized that the purity figure cited in the original manuscript was erroneous due to a misunderstanding on the part of the first author of a question from the senior author. Unfortunately, data on the purity of the FACS-sorted population was not saved. However, we have added panel B to Figure 7 to show the sorting strategy for Tfh and Tph cells.   We agree that any discussion of plasticity between these cell types is speculative, as outgrowth of a minor population is possible even from well-purified sorted cells.  

      Minor points:

      Some graphs have issues with presentation; Figures 5D and 5E, split scale clips data points. 5F the color representing time would be better replaced with direct labels. 6C and 6C some distortion of text clipping other elements.

      We changed 5D and 5E y axis scales to avoid cutting the data points. Also, we changed 5F labels. Distortion of text clipping and other elements in Fig 6E and 6A have been corrected.  

      The abbreviation LIP is used in the abstract without a clear definition until later in the text.

      This abbreviation has been defined again in the text.

      Generally, the discussion section is quite long.

      We agree that the discussion is quite long, but the results are quite complex and require considerable discussion.  We have attempted to be as concise as possible.

      Reviewer #2 (Recommendations For The Authors):

      Suggestion

      Can Supplementary Figures be merged into the mains for the convenience of readers? There is enough extra margin.

      We prefer to keep the order of main and supplementary figures as they are. 

      There are some confusing results which I would recommend to make the additional explanation for readers. For example, about 10% of Hu/Hu CD3+ T cells reacted to Auto-DC in Figure 1B, but neither CD4+ nor CD8+ cells did in Figure 1C.

      We have re-analyzed the data in Fig 1 and included the previously-deleted outlier mouse. 

      Minor

      Figure 3C

      The figure legend does not explain the figure. Hu/Mu or Mu/Mu?

      Both groups were combined in the figure, as the results were similar for both.  The N per group is given in the figure legend.  The same applies to figure 3D.

      Figure 4B, 4C

      Why were Hu/Hu and Mu/Hu data merged only in 4B? They should be discussed in the context of parallel comparison. Both y-axis labels are the same between B and C despite the legend saying differently.

      We switched the order of Figure 4B and 4C, each of which serves a different purpose. Figure 4B aims to demonstrate the similarity between the two groups at each timepoint.  Figure 4C combines the two groups in order to provide sufficient animal numbers to demonstrate the statistically significant changes over time. 

      Figure 5D

      The axis label was missing and the uncertain bar emerged. The authors should replace it with the corrected one.

      The axis and the bar in 5D have been corrected.

      Figure 5F

      The legend does not explain the figure. What are these numbers? Also, it is better if the authors add a detailed explanation to the manuscript about the reason why the sum of antibody titer represents the poly-reactivity of IgM in these mice.

      The numbers in the previous version of the figure were eartag numbers, which we have now renumbered as animal 1,2,3, etc in each group. Please refer to the final paragraph of the "Autoreactivity of IgM and IgG in HIS Mice" section in the Results section for an explanation of IgM polyreactivity.

      Fig. 7D-E etc.

      The definition of Asterisk is insufficient. Between what to what in the multiple comparisons?

      The green asterisks show significant differences between the Tph in Hu/Hu vs Mu/Hu mice, while the orange asterisks show significant differences between the Tfh in Hu/Hu vs Mu/Hu mice. This has been added to the figure legend.

      Figure 7 ~ Figure 8

      The legends on the figure are confusing due to the different order of figures. The scales are inappropriate in some figures. The readers cannot interpret the data from the unfairly compressed plots.

      We made the plots bigger to make them readable and changed the order.

      Methods

      In the description of B cell depletion Experiments, the authors should directly mention the figure number instead of "In the second Experiment ..."

      We have corrected this in the Methods section.

      There is no definition of how to define the "disease" onset.

      This definition has been added to the Methods section.

      Several undefined abbreviations: "LIP", "BLT" ...

      We defined these in the text.

    1. Author response:

      The following is the authors’ response to the original reviews.

      Reviewer 1:

      Comment 1- I would like the authors to discuss and justify their use of high-dose (1.3%) isolfurane. A recent consensus paper on rat fMRI (Grandjean et al., "A Consensus Protocol for Functional Connectivity Analysis in the Rat Brain.") found that medetomidine combined with low dose isoflurane provided optimal control of physiology and fMRI signal. To overcome any doubts about the effects of the high-dose anaesthetic I'd encourage the authors to show the results of their functional connectivity specificity using the same or similar image processing protocol as described in that consensus paper. This is especially true since the fMRI ICs in Figure 2A appear fairly restricted.

      We thank the reviewer for their insightful comments. We agree that the combination of medetomidine and isoflurane, as recommended by Grandjean et al. in their consensus paper, provides superior physiological stability and fMRI signal quality, and should indeed be considered the preferred protocol for future studies. In fact, we have adopted this combination in our subsequent research [1]. However, the data acquired in the present study were acquired prior to the publication of the consensus recommendations and have been previously published [2, 3]. While isoflurane is not the ideal anesthetic for functional connectivity studies, we have demonstrated in earlier work [4], that using isoflurane at 1.3% maintains stable physiological parameters and avoids burst suppression, a key issue with higher isoflurane doses.

      Regarding preprocessing, we acknowledge the importance of standardized approaches as outlined in the consensus paper. However, to maintain methodological consistency with our prior work, we retained the original preprocessing pipeline for this study. This decision ensures comparability with our previous analyses. To address the reviewer’s concerns and encourage further verification, we have uploaded the full dataset to a public repository (as suggested in Comment 4). This will enable other researchers to reanalyze the data using updated preprocessing pipelines or explore additional analyses.

      We have updated the manuscript discussion (page 19) to clearly acknowledge these points:

      “One limitation of our study is that our experimental protocols predate the recently published consensus recommendations for rat fMRI [42], particularly concerning anesthesia and preprocessing pipelines. The use of isoflurane anesthesia, although common at the time of data acquisition, introduces a potential confound due to its known effects on neuronal activity. However, we previously demonstrated that isoflurane at 1.3% maintains stable physiological parameters and avoids burst suppression [43], a concern at higher doses. Furthermore, other studies have reported that low-dose isoflurane remains feasible for resting-state functional connectivity studies [44]. While isoflurane, as a GABA-A agonist, could theoretically interact with the mechanisms of MDMA in the brain, we found no evidence in the literature suggesting significant cross-talk between these substances. Future studies employing medetomidine-based protocols may help minimize this potential confound.

      Regarding data preprocessing, we chose to retain the same pipeline used in our prior publications [13, 14] to maintain methodological consistency. While we recognize the advantages of adopting standardized preprocessing as outlined in the consensus guidelines, this approach ensures comparability with our previous analyses. To facilitate further investigation, we have made the full dataset publicly available (see Data Availability Statement), enabling reanalysis with updated pipelines or additional explorations of this dataset.”

      Comment 2 - I'd also be interested to read more about why the cerebellum was chosen as a reference region, given that serotonin is highly expressed in the cerebellum, and what effects the choice of reference region has on their quantification.

      This is something we ourselves have examined in a paper, dedicated to determine the most suitable reference region for [11C]DASB, and while the reviewer is correct in saying there is also serotonin in the cerebellum, we found the lowest binding for this tracer in the cerebellar gray matter, recommending this region as a valid reference area. (“Displaceable binding of (11)C-DASB was found in all brain regions of both rats and mice, with the highest binding being in the thalamus and the lowest in the cerebellum. In rats, displaceable binding was largely reduced in the cerebellar cortex”, please refer to [5]).

      We amended our materials and methods part to specify that we had shown in this previous publication that the cerebellar gray matter is appropriate as a reference region (page 6):

      “Binding potentials were calculated frame-wise for all dynamic PET scans using the DVR-1 (equation 1) to generate regional BPND values with the cerebellar gray matter as a reference region, which our earlier studies have demonstrated to be the most appropriate for this tracer in rats [5, 6]:”

      Comment 3 - The PET ICs appear less bilateral than the fMRI ICs. Is that simply a thresholding artefact or is it a real signal?

      We thank the reviewer for this observation. The reduced bilaterality of PET ICs compared to fMRI ICs is likely due to the inherent limitation in the temporal resolution of PET, which provides significantly fewer frames (100 frames compared to 3000 frames for fMRI). This lower temporal resolution leads to reduced signal-to-noise ratio when computing the ICA, which can affect the stability and symmetry of the ICs during ICA computation, particularly at higher IC numbers. While thresholding may also a minor role, we believe the primary factor is poorer SNR associated with the PET data. We have clarified this point in the discussion section (page 17) as follows:

      “In our analysis, PET ICs appeared less bilateral than fMRI ICs. This is likely due to the lower temporal resolution of PET (100 frames) compared to fMRI (3000 frames), resulting in reduced signal-to-noise ratio (SNR) and potentially affecting the stability and symmetry of the independent components.”

      Comment 4 - "The data will be made available upon reasonable request" is not sufficient - please deposit the data in an open repository and link to its location.

      We agree with the request of the reviewer and uploaded the data to a Dryad repository. We amended our Data Availability Statement accordingly.

      Comment 5 (recommendation) - Please add the age and sex of the rats in lines 92-97.

      Amended.

      Comment 6 (recommendation) - There are multiple typos throughout the manuscript - for example, "z-vlaue" on line 164, "negligable" on line 194, etc.. Sometimes the 11 in 11C is superscripted, sometimes it isn't. This paper would benefit from a careful proofread.

      Thank you for pointing this out. We sent the manuscript for language and grammar editing to AJE (see certificate).

      Reviewer 2:

      Comment 1 - While the study protocol is referenced in the paper, it would be useful to at least report whether the study uses bolus, constant infusion, or a combination of the two and the duration of the frames chosen for reconstruction. Minimal details on anesthesia should also be reported, clarifying whether an interaction between the pharmacological agent for anesthesia and MDMA can be expected (whole-brain or in specific regions).

      We fully agree that this would improve the readability of our manuscript and added the information to the materials and methods and discussion accordingly. Please refer to page 4/5.

      Comment 2 - Some terminology is used in a bit unclear way. E.g. "seed-based" usually refers to seed-to-voxel and not ROI-to-ROI analysis, or e.g. it is a bit confusing to have IC1 called SERT network when in fact all ICs derived from DASB data are SERT networks. Perhaps a different wording could be used (IC1 = SERT xxxxx network; IC2= SERT salience network).

      Based on the reviewer´s suggestion, we suggest to rename IC1 and IC2 according to their anatomical and functional characteristics (page 13):

      “IC1 = SERT Salience Network: This name highlights the involvement of the regions typically associated with the salience network (e.g., CPu, Cg, NAc, Amyg, Ins, mPFC), which play key roles in emotional and cognitive processing.”

      “IC2 = SERT Subcortical Network: This name reflects the involvement of subcortical regions which play a role in arousal, stress response, and autonomic regulation, which are heavily modulated by serotonin in areas like the hypothalamus, PAG, and thalamus.”

      Comment 3 - The limited sample size for the rats undergoing pharmacological stimulation which might make the study (potentially) not particularly powerful. This could not be a problem if the MDMA effect observed is particularly consistent across rats. Information on inter-individual variability of FC, MC, and BPND could be provided in this regard.

      We thank the reviewer for raising this point. To address the concern about limited sample size and inter-individual variability, we have added this information to Figures 5 B and D. Regarding the BPND variability, the dotted lines in Figure 3 indicate the standard deviation in the regional BPNDs, however, this was not clearly stated in the original figure description. We have now amended the figure legend to explicitly clarify this point.

      Comment 4 (recommendation) - "Our research employs a novel approach named "molecular connectivity" (MC), which merges the strengths of various imaging methods to offer a comprehensive view of how molecules interact within the brain and affect its function." I'd recommend rephrasing to "..how molecular interact across different areas within the brain..". Molecular connectivity is a potentially ambiguous term (used to study interactions across different molecules (in the same compartment/environment) vs. to study interactions across the same molecules in different areas). I'd add a couple of references to help the reader disambiguate too (e.g. https://pubmed.ncbi.nlm.nih.gov/30544240/ , https://pubmed.ncbi.nlm.nih.gov/36621368/)

      We appreciate the reviewer’s suggestion and agree that the term "Molecular Connectivity" could be ambiguous. To clarify, we rephrased the description to emphasize that our approach specifically examines interactions of the same molecule (i.e., serotonin transporter) across different brain regions, rather than interactions between different molecules within the same environment. We propose the following revised text (page 2):

      “Our research employs a novel approach termed molecular connectivity (MC), which combines the strengths of various imaging methods to provide a comprehensive view of how specific molecules, such as the serotonin transporter, interact across different brain regions and influence brain function.”

      Additionally, we will incorporate the suggested references to help the reader further contextualize the use of this term.

      Comment 5 - In the methods, it is not clear if for MC the authors also compute ROI-to-ROI correlations or only ICA.

      Thank you for highlighting this point. To clarify, our MC analysis, includes both ROI-to-ROI correlations and ICA. Specifically, as described at the end of the “Molecular Connectivity Analysis” subchapter, we compute ROI-to-ROI correlations using the following steps: 1. The first 20 minutes of each scan are discarded to account for perfusion effects. 2. A detrending approach is applied to the remaining 60 minutes of BP<sub>ND</sub> time courses. 3. ROI-to-ROI calculations are then calculated and organized into subject-level correlation matrices, which are subsequently z-transformed to generate mean correlation matrices across subjects.

      We revised the methods section to explicitly state that both ROI-to-ROI correlations and ICA are integral components of the MC analysis to ensure this point is clear to readers (page 6).

      “The BP<sub>ND</sub> time courses were then used to calculate MC as described above for fMRI: ROI-to-ROI subject-level correlation matrices between all regional time courses were generated and z-transformed correlation coefficients were used to calculate mean correlation matrices.”

      Comment 7 - In the discussion, it could be useful to relate IC1 and IC2 to well-established neuroanatomical/molecular knowledge of the serotoninergic system. Did the authors expect the IC1 and IC2 anatomical distributions? is there a plausible biological reason as to why the time courses of BPnd variations would be somehow different between IC1 and IC2?

      We appreciate the reviewer’s insightful comment and agree on the importance of relating IC1 and IC2 to well-established neuroanatomical and molecular knowledge of the serotonergic system.

      In our discussion, we noted that IC1 primarily encompasses subcortical structures such as the brainstem, midbrain, and thalamus. These regions are consistent with areas housing dense serotonergic projections originating from the raphe nuclei, the primary source of serotonin release. In contrast, IC2 involves limbic and cortical regions - including the striatum, amygdala, cingulate, insular, and prefrontal cortices - which are key targets of the serotonergic pathways. This anatomical distinction aligns with the hierarchical organization of the serotonergic system, where the brainstem nuclei exert both local and distal serotonergic modulation.

      The observed differences in the temporal dynamics of the binding potential (BP<sub>ND</sub>) variations between IC1 and IC2 likely reflect the distinct functional roles of these regions within the serotonergic network. The more immediate changes in IC1 could be attributed to the direct effect of MDMA on the raphe nuclei, leading to rapid serotonin release in subcortical structures. In contrast, the delayed changes in IC2 may reflect downstream modulation in cortical and limbic regions involved in processing more complex emotional and cognitive functions.

      That said, while these interpretations are plausible based on current neuroanatomical and functional knowledge, the exact biological mechanisms underlying the differential time courses remain unclear. As discussed in the manuscript, future studies incorporating direct, simultaneous measurements of serotonin levels and imaging data will be essential to fully elucidate the temporal and spatial dynamics of serotonin transmission in these regions. We have revised to better highlight this limitation in the discussion section (page 17) as an important area for further investigation:

      “Our results demonstrate that compared with FC, MDMA induces more pronounced changes in MCs, particularly in regions associated with the SERT subcortical network. The distinct temporal dynamics of BPnd variations between these components may reflect the hierarchical organization of the serotonergic system. Specifically, the raphe nuclei, as the primary source of serotonin, are likely to exert more immediate modulation on posterior subcortical structures (IC2), whereas downstream effects on limbic and cortical regions (IC1) may occur more gradually. While these findings align with current neuroanatomical and molecular knowledge, the precise biological mechanisms driving these temporal differences remain unclear. Future investigations are warranted to elucidate these mechanisms. Future studies combining direct measurements of serotonin levels with neuroimaging data will be critical to fully understanding these components’ distinct roles and temporal profiles in regulating serotonergic function.”

      Comment 8 - In the discussion (physiological basis), could the authors detail the expected "time scale" in changes in SERT expression? How quickly can SERT expression change, especially under resting-state conditions? Is it reasonable to consider tracer fluctuations under rest conditions as biologically meaningful?

      SERT regulation can occur over different time scales depending on the mechanism involved [7].

      Acute, rapid changes (milliseconds to seconds): Protein-protein interactions with key regulatory proteins (e.g., syntaxin1A, neuronal nitric oxide synthase) can lead to rapid modulation of SERT surface expression [8-11]. These interactions often involve changes in transporter trafficking or conformational states and can occur within milliseconds to seconds. For example, syntaxin1A directly interacts with the N-terminus of SERT, influencing its availability on the plasma membrane within short timescales.

      Intermediate time scales (seconds to minutes): Posttranslational modifications, such as phosphorylation by kinases (e.g., protein kinase C) or dephosphorylation by phosphatases, are known to influence SERT function and surface expression [12-14]. These processes are typically initiated in response to cellular signaling and occur over seconds to minutes, affecting the SERT trafficking dynamics and serotonin uptake capacity [15, 16].

      Longer-term changes (minutes to hours): Longer-term regulation involves processes like endocytosis, recycling, or degradation of SERT. These pathways typically take minutes to hours and are often part of more sustained cellular responses to changes in neuronal activity or serotonin levels. Such changes are slower but contribute to the overall cellular homeostasis of SERT under prolonged stimulation.

      Under resting-state conditions, where neurons are not subjected to rapid or dramatic fluctuations in neurotransmitter release or signaling, SERT expression and activity are generally stable but still subject to subtle fluctuations due to ongoing basal regulatory processes. Basal phosphorylation or low-level protein-protein interactions can still dynamically modulate SERT trafficking and function, albeit at a lower intensity than under stimulated conditions. These fluctuations, although smaller in magnitude, may reflect fine-tuning of serotonin homeostasis and can occur on shorter timescales (seconds to minutes).

      Biological Relevance of Tracer Fluctuations at Rest:

      It is reasonable to consider that tracer fluctuations under resting conditions could reflect biologically meaningful variations in SERT expression and function. Even subtle shifts in SERT surface availability or activity can impact serotonin clearance and signaling, given the fine balance required to maintain serotonergic tone. These fluctuations may reflect intrinsic neuronal variability or ongoing homeostatic adjustments to maintain optimal neurotransmitter levels or serve as early indicators of adaptive responses to environmental or physiological changes before more overt modifications in transporter expression or activity become apparent.

      In summary, while SERT expression can change rapidly in response to signaling events (milliseconds to minutes), even under resting-state conditions, subtle regulatory fluctuations can be biologically meaningful. These fluctuations likely reflect ongoing regulatory adjustments essential for maintaining serotonergic balance and should not be disregarded as noise, particularly in experimental measurements using tracers.

      We added the following paragraph to the discussion (page 16):

      In addition, SERT regulation occurs over multiple time scales, ranging from milliseconds to hours, depending on the mechanism involved [31]. Rapid changes in SERT surface expression can be mediated by protein-protein interactions or posttranslational modifications [32, 33], such as phosphorylation, which occur on a timescale of milliseconds to minutes. These processes dynamically modulate surface availability and function, allowing fine-tuned regulation of serotonin uptake even under resting-state conditions. Additionally, while slower processes involving endocytosis, recycling, and degradation typically occur over minutes to hours, subtle fluctuations in SERT trafficking and activity can still occur under basal conditions. These minor yet biologically relevant changes likely reflect ongoing homeostatic regulation essential for maintaining serotonergic balance. Therefore, tracer fluctuations observed during resting-state measurements should not be dismissed, as they may represent meaningful variations in SERT regulation that contribute to the fine control of serotonin clearance.

      Comment 9 - In the discussion, the SERT network results should be commented on more extensively, as there is now only a generic reference to MC changes being stronger than FC ones, without spatial reference to the SERT network (while only negative salience network results are referenced explicitly instead, making the paragraph a bit confusing).

      We expanded the discussion to accommodate a more thorough contemplation of this network. This revised paragraph (page 17) directly addresses the spatial aspects of the SERT network, highlighting the specific regions involved in serotonergic connectivity and contrasting molecular and functional connectivity changes induced by MDMA.

      Comment 10 - Figure 3; I'd switch left and right charts in the bottom panel (last row only), to keep the SERT network always on the left of the Figure.

      We agree with the suggestion and changed the figure accordingly.

      Comment 11 - Figure 4: I'd add FC decreases to the figure, to allow the reader to compare BPnd, MC, and FC changes more easily and I'd add a horizontal line at the equivalent of e.g. Z-1.96 (or similar) so that it is clear which measures/regions display significant changes.

      We prefer to keep the figure focusing on the two analyses of PET alterations, since we want to emphasize their complementarity in the context of PET specifically. However, we added lines indicating significances, in line with the reviewer’s suggestion.

      Comment 12 - In Figure 5D, the y-axis mentioned FC but I suppose it should mention MC.

      We amended the figure accordingly, together with the changes to the names of the networks implemented across the manuscript.

      (1) Marciano, S., et al., Combining CRISPR-Cas9 and brain imaging to study the link from genes to molecules to networks. Proc Natl Acad Sci U S A, 2022. 119(40): p. e2122552119.

      (2) Ionescu, T.M., et al., Striatal and prefrontal D2R and SERT distributions contrastingly correlate with default-mode connectivity. Neuroimage, 2021. 243: p. 118501.

      (3) Ionescu, T.M., et al., Neurovascular Uncoupling: Multimodal Imaging Delineates the Acute Effects of 3,4-Methylenedioxymethamphetamine. J Nucl Med, 2023. 64(3): p. 466-471.

      (4) Ionescu, T.M., et al., Elucidating the complementarity of resting-state networks derived from dynamic [(18)F]FDG and hemodynamic fluctuations using simultaneous small-animal PET/MRI. Neuroimage, 2021. 236: p. 118045.

      (5) Walker, M., et al., In Vivo Evaluation of 11C-DASB for Quantitative SERT Imaging in Rats and Mice. J Nucl Med, 2016. 57(1): p. 115-21.

      (6) Walker, M., et al., Imaging SERT Availability in a Rat Model of L-DOPA-Induced Dyskinesia. Mol Imaging Biol, 2020. 22(3): p. 634-642.

      (7) Lau, T. and P. Schloss, Differential regulation of serotonin transporter cell surface expression. Wiley Interdisciplinary Reviews: Membrane Transport and Signaling, 2012. 1(3): p. 259-268.

      (8) Haase, J., et al., Regulation of the serotonin transporter by interacting proteins. Biochem Soc Trans, 2001. 29(Pt 6): p. 722-8.

      (9) Quick, M.W., Regulating the conducting states of a mammalian serotonin transporter. Neuron, 2003. 40(3): p. 537-49.

      (10) Ciccone, M.A., et al., Calcium/calmodulin-dependent kinase II regulates the interaction between the serotonin transporter and syntaxin 1A. Neuropharmacology, 2008. 55(5): p. 763-70.

      (11) Chanrion, B., et al., Physical interaction between the serotonin transporter and neuronal nitric oxide synthase underlies reciprocal modulation of their activity. Proc Natl Acad Sci U S A, 2007. 104(19): p. 8119-24.

      (12) Qian, Y., et al., Protein kinase C activation regulates human serotonin transporters in HEK-293 cells via altered cell surface expression. J Neurosci, 1997. 17(1): p. 45-57.

      (13) Ramamoorthy, S., et al., Phosphorylation and regulation of antidepressant-sensitive serotonin transporters. J Biol Chem, 1998. 273(4): p. 2458-66.

      (14) Jayanthi, L.D., et al., Evidence for biphasic effects of protein kinase C on serotonin transporter function, endocytosis, and phosphorylation. Mol Pharmacol, 2005. 67(6): p. 2077-87.

      (15) Steiner, J.A., A.M. Carneiro, and R.D. Blakely, Going with the flow: trafficking-dependent and -independent regulation of serotonin transport. Traffic, 2008. 9(9): p. 1393-402.

      (16) Lau, T., et al., Monitoring mouse serotonin transporter internalization in stem cell-derived serotonergic neurons by confocal laser scanning microscopy. Neurochem Int, 2009. 54(3-4): p. 271-6.

    1. Author response:

      The following is the authors’ response to the previous reviews

      According to the reviewers' comments, we appreciate your substantial updates. However, the statistical issue remains unsolved. The following is a general way to get fold changes between controls and experimental samples. Each sample will generate relative differences between target molecules and internal controls. For the case of Fig 1B, the target is pSmad2, and the internal control is the total Smad2. Three control samples will generate three numbers for pSmad2/Smad2 ratios with variations. Similarly, T204D samples will generate three numbers with variations. Then, the average of these three numbers will be set as 1 (with variations) to calculate fold changes between the control and T204D groups. The point is that the statistical significance needs to be evaluated between two groups with variations. This standard method differs from what you described in the manuscript. I hope this explains why the issue needs to be fixed. Please work on the following 11 panels to revise.

      (1) Fig 1B, WB, pSmad2, reference Smad2, loading control GAPDH, fold change by T204D.

      (2) Fig 1C, WB, pSmad2, reference Smad2, loading control GAPDH, fold change by Tb/Rudhira.

      (3) Fig 1D, QRT PCR, pai1/mmp9, fold change by Tb treatment, reference not disclosed.

      (4) Fig 2A, migration, crystal red absorbance.

      (5) Fig 2B, migration, crystal red absorbance.

      (6) Fig 4A, QRT PCR, fold change by Tb.

      (7) Fig 4B, WB, Rudhira, fold change by Tb.

      (8) Fig 4C, intensity, with variation, fine.

      (9) Fig 4D, WB, Rudhira, loading control GAPDH, fold change by Smad2/3 silencing.

      (10) Fig 5A, WB, Rudhira/Glu-Tub, loading control GAPDH, fold change by Tb and/or AcD.

      (11) Fig 5C, WB, Glu-Tub.

      For western blots:

      Graphs for western blots in the following figures have been modified to show the variance in controls, as suggested:

      (1) Fig 1B, WB, pSmad2, reference Smad2, loading control GAPDH, fold change by T204D.

      (2) Fig 1C, WB, pSmad2, reference Smad2, loading control GAPDH, fold change by Tb/Rudhira.

      (7) Fig 4B, WB, Rudhira, fold change by Tb.

      (9) Fig 4D, WB, Rudhira, loading control GAPDH, fold change by Smad2/3 silencing.

      (10) Fig 5A, WB, Rudhira/Glu-Tub, loading control GAPDH, fold change by Tb and/or AcD.

      (11) Fig 5C, WB, Glu-Tub.

      For qPCRs:

      The reader’s comment asked to display error bars if the variance in controls was considered. The variance in controls was not considered, which is a standard practice in the qPCR assay. In this regard, an example from an eLife paper is cited below (variation not considered in controls):

      Fig 4C from Conti et al., N6-methyladenosine in DNA promotes genome stability, revised v2 Feb 3, 2025.

      Accordingly, the following graphs remain unchanged:

      (3) Fig 1D, QRT PCR, pai1/mmp9, fold change by Tb treatment, reference not disclosed.

      (6) Fig 4A, QRT PCR, fold change by Tb.

      For crystal violet experiments:

      Due to variability in the procedure introduced from CV preparation, uptake, and extraction etc., in the absence of a reference/standard, it is not possible to determine the absolute cell number across experiments. To simplify the calculation, we normalize CV intensity of all the samples to control for an experiment, so the control group doesn’t have error bars. In this regard, an example from an eLife paper is cited below (variation not considered in controls).

      Fig 2H from Brunner et al., PTEN and DNA-PK determine sensitivity and recovery in response to WEE1 inhibition in human breast cancer, version of record July 6, 2020.

      Accordingly, the following graphs remain unchanged:

      (4) Fig 2A, migration, crystal red absorbance.

      (5) Fig 2B, migration, crystal red absorbance.

      Lastly, #8 remains unchanged.

      (8) Fig 4C, intensity, with variation, fine.

    1. Author response:

      The following is the authors’ response to the original reviews.

      Public Reviews:

      Reviewer #1 (Public reviews):

      Summary:

      In this study, Fakhar et al. use a game-theoretical framework to model interregional communication in the brain. They perform virtual lesioning using MSA to obtain a representation of the influence each node exerts on every other node, and then compare the optimal influence profiles of nodes across different communication models. Their results indicate that cortical regions within the brain's "rich club" are most influential.

      Strengths:

      Overall, the manuscript is well-written. Illustrative examples help to give the reader intuition for the approach and its implementation in this context. The analyses appear to be rigorously performed and appropriate null models are included.

      Thank you.

      Weaknesses:

      The use of game theory to model brain dynamics relies on the assumption that brain regions are similar to agents optimizing their influence, and implies competition between regions. The model can be neatly formalized, but is there biological evidence that the brain optimizes signaling in this way? This could be explored further. Specifically, it would be beneficial if the authors could clarify what the agents (brain regions) are optimizing for at the level of neurobiology - is there evidence for a relationship between regional influence and metabolic demands? Identifying a neurobiological correlate at the same scale at which the authors are modeling neural dynamics would be most compelling.

      This is a fundamental point, and we put together a new project to address it. The current work focuses on, firstly, rigorously formalizing a prevailing assumption that brain regions optimize communication, and then uncovering what are the characteristics of communication if this optimization is indeed taking place. Based on our findings, we suspect the mechanism of an optimal communication to be through broadcasting (compared to other modes explored in our work, e.g., the shortest-path signalling or diffusion). However, we recognize that our game-theoretical framework does not directly address “how” this mechanism is implemented. Thus, in our follow-up work, we are analyzing available datasets of signal propagation in the brain to see if communication dynamics there match the predictions of the game-theoretical setup. However, following your question, we extended our discussion to cover this point, cited five other works on this topic, and what, we think, could be the neurobiological mechanism of optimal signalling.  

      It is not entirely clear what Figure 6 is meant to contribute to the paper's main findings on communication. The transition to describing this Figure in line 317 is rather abrupt. The authors could more explicitly link these results to earlier analyses to make the rationale for this figure clearer. What motivated the authors' investigation into the persistence of the signal influence across steps?

      Great question. Figure 6 in part follows Figure 5, which summarizes a key aspect of our work: Signals subside at every step but not exponentially (Figure 5), and they nearly fall apart after around 6 steps (Figure 6 A and B). Subplots A and B together suggest that although measures like communicability account for all possible pathways, the network uses a handful instead, presumably to balance signalling robustness versus the energetic cost of signalling. Subplot C, one of our main findings, then shows how one simple model is all needed to predict a large portion of optimal influence compared to other models and variables. In sum, Figure 5 focused on the decay dynamics while Figure 6 focused on the extent, in terms of steps, given that the decay is monotonic. Together, our motivation for this figure was to show how the right assumption about decay rate and dynamics can outperform other measures in predicting optimal communication. 

      The authors used resting-state fMRI data to generate functional connectivity matrices, which they used to inform their model of neural dynamics. If I understand correctly, their functional connectivity matrices represent correlations in neural activity across an entire fMRI scan computed for each individual and then averaged across individuals. This approach seems limited in its ability to capture neural dynamics across time. Modeling time series data or using a sliding window FC approach to capture changes across time might make more sense as a means of informing neural dynamics.

      We agree with you on the fact that static fMRI is limited in capturing neural dynamics. However, we opted not to perform dynamic functional connectivity fitting just yet for a practical reason: Other communication models used here do not fit to any empirical data and provide a static view of the dynamics, comparable to the static functional connectivity. Since one of our goals was to compare different communication regimes, and the fact that fitting dynamics does not seem to substantially change the outcome if the end result is static (Figure 7), we decided to go with the poorer representation of neural data for this work. However, part of our follow-up project involves looking into the dynamics of influence over time and for that, we will fit our models to represent more realistic dynamics.

      The authors evaluated their model using three different structural connectomes: one inferred from diffusion spectrum imaging in humans, one inferred from anterograde tract tracing in mice, and one inferred from retrograde tract-tracing in macaque. While the human connectome is presumably an undirected network, the mouse and macaque connectomes are directed. What bearing does experimentally inferred knowledge of directionality have on the derivation of optimal influence and its interpretation?

      In terms of if directionality changes the interpretation of optimal influence, we think it sets limits for how much we can compare communication dynamics of these two types of networks. We think interpreting optimal communication in directed graphs needs to disentangle incoming influence from outgoing influence, e.g., analyzing “projector hubs/coordinators” and “receiver hubs/integrators” instead of putting both into a common class of hubs. Also, here we showed the extent of which a signal travels before it significantly degrades, having done so in an undirected graph. One of its implications for a directed graph is the possibility that some nodes can be unreachable from others, given the more restricted navigation. A possibility that we did not observe in the human connectome as all nodes could reach others, although with limited influence (see Figure 2. C). We did not explore these differences, as we used mice and macaque connectomes primarily to control for modality-specific confounds of DSI. However, our relatively poorer fit for directed networks (Supplementary Figure 2) motivated us to analyze how reciprocal connections shape dynamics and what impact do they have on networks’ function. Using the same connectomes as the current work, we addressed this question in a separate publication (Hadaeghi et al., 2024) and plan to extend both works by analyzing the signalling properties of directed networks.

      It would be useful if the authors could assess the performance of the model for other datasets. Does the model reflect changes during task engagement or in disease states in which relative nodal influence would be expected to change? The model assumes optimality, but this assumption might be violated in disease states.

      This is a wonderful idea that we initially had in mind for this work as well, but decided to dedicate a separate work on deviations in different tasks states, as well as disease states (mainly neurodegenerative disorders). We noticed the practical challenges of fitting large-scale models to task dynamics and harmonizing neuroimaging datasets of neurodegenerative disorders is beyond the scope of the current work. Unfortunately, this effort, although exciting and promising, is still pending as the corresponding author does not yet have the required expertise of neuroimaging processing pipelines.

      The MSA approach is highly computationally intensive, which the authors touch on in the Discussion section. Would it be feasible to extend this approach to task or disease conditions, which might necessitate modeling multiple states or time points, or could adaptations be made that would make this possible?

      Continuing our response from the previous point, yes, we think, in theory, the framework is applicable to both settings. Currently, our main point of concern is not the computational cost of the framework but the harmonization of the data, to ensure differences in results are not due to differences in preprocessing steps. However, assuming that all is taken care of, we believe a reasonable compute cluster should suffice by parallelizing the analytical pipeline over subjects. We acknowledge that the process would still be time-consuming, but besides the fitting process, we expect a modern high-performance CPU with about 32–64 threads to take up to 3 days analyzing one subject, given 100 brain regions or fewer. This performance then scales with the number of cluster nodes that can each work on one subject. We note that the analytical estimators such as SAR could be used instead, as it largely predicts the results from MSA. The limitations are then the lack of dynamics over time and potential estimation errors.

      Reviewer #2 (Public review):

      Summary:

      The authors provide a compelling method for characterizing communication within brain networks. The study engages important, biologically pertinent, concerns related to the balance of dynamics and structure in assessing the focal points of brain communication. The methods are clear and seem broadly applicable, however further clarity on this front is required.

      Strengths:

      The study is well-developed, providing an overall clear exposition of relevant methods, as well as in-depth validation of the key network structural and dynamical assumptions. The questions and concerns raised in reading the text were always answered in time, with straightforward figures and supplemental materials.

      Thank you.

      Weaknesses:

      The narrative structure of the work at times conflicts with the interpretability. Specifically, in the current draft, the model details are discussed and validated in succession, leading to confusion. Introducing a "base model" and "core datasets" needed for this type of analysis would greatly benefit the interpretability of the manuscript, as well as its impact.

      Following your suggestion, we modified the introduction to emphasize on the human connectome and the linear model as the main toolkit. We also added a paragraph explaining the datasets that can be used instead.

      Recommendations for the authors:

      Essential Revisions (for the authors):

      (1) The method presents an important and well-validated method for linking structural and functional networks, but it was not clear precisely what the necessary data inputs were and what assumptions about the data mattered. To improve the clarity of the presentation for the reader, it would be beneficial to have an early and explicit description of the flow of the method - what exact kinds of datasets are needed and what decisions need to be made to perform the analysis. In addition, there were questions about how the use or interpretation of the method might change with different methods of measuring structure or function, which could be answered via an explicit discussion of the issue. For example, how do undirected fMRI correlation networks compare to directed tracer injection projection networks? Similarly, could this approach apply in cases like EM connectomics with linked functional imaging that do not have full observability in both modalities?

      This is an important point that we missed addressing in detail in the original manuscript. Now we did so, by first adding a paragraph (lines 292-305, page 10) explaining the pipeline and how our framework handles different modeling choices, and then further discussing it in the Discussion (lines 733-748, page 28). Moreover, we adjusted Figure 1, by delineating two main steps of the pipeline. Briefly, we clarified that MSA is model-agnostic, meaning that, in principle, any model of neural dynamics can be used with it, from the most abstract to the most biologically detailed. Moreover, the approach extends to networks built on EM connectomics, tract-tracing, DTI, and other measures of anatomical connectivity. However, we realized that a key detail was not explicitly discussed (pointed to by Reviewer #2), that is, the fact that these models naturally need to be fitted to the empirical dataset, even though this fitting step appears not to be critical, as shown in Figure 7.

      Lines 292-305:

      “The MSA begins by defining a ‘game.’ To derive OSP, this game is formulated as a model of dynamics, such as a network of interacting nodes. These can range from abstract epidemic and excitable models (Garcia et al., 2012; Messé et al., 2015a) to detailed spiking neural networks (Pronold et al., 2023) and to mean-field models of the whole brain dynamics, as chosen here (see below). The model should ideally be fitted to reflect real data dynamics, after which MSA systematically lesions all nodes to derive the OSP. Put together, the framework is general and model-agnostic in the sense that it accommodates a wide range of network models built on different empirical datasets, from human neuroimaging and electrophysiology to invertebrate calcium imaging, and anything in between. In essence, the framework is not bound to specific modelling paradigms, allowing direct comparison among different models (e.g., see section Global Network Topology is More Influential Than Local Node Dynamics).”

      Lines 733-740:

      “As noted in the introduction, OI is model-agnostic, here, we leveraged this liberty to compare signaling under different models of local dynamics, primarily built upon undirected human connectome data. We also considered different modalities, e.g., tract tracing in Macaque (see Structural and Functional Connectomes under Materials and Methods) to confirm that the influence of weak connections is not inflated due to imaging limitations (Supplementary Figure 5. A). The game theoretical formulation of signaling allows for systematic comparison among many combinations of modeling choices and data sources.”

      We then continued with addressing the issue of full observability. We clarified that in this work, full observability was assumed. However, the mathematical foundations of our method capture unobserved contributors/influencers as an extra term, similar to the additive error term of a linear regression model. To keep the paper as non-technical as possible, we omitted expanding the axioms and the proof of how this is achieved, and instead referred to previous papers introducing the framework. 

      Lines 740-748:

      “Nonetheless, in this work, we assumed full observability, i.e., complete empirical knowledge of brain structure and function that is not necessarily practically given. Although a detailed investigation of this issue is needed, mathematical principles behind the method suggest that the framework can isolate the unobserved influences. In these cases, activity of the target node is decomposed such that the influence from the observed sources is precisely mapped, while the unobserved influences form an extra term, capturing anything that is left unaccounted for, see (Algaba et al., 2019b; Fakhar et al., 2024) for more technical details.”

      (2) The value of the normative game theoretic approach was clear, but the neurobiological interpretation was less so. To better interpret the model and understand its range of applicability, it would be useful to have a discussion of the potential neurobiological correlates that were at the same level of resolution as the modeling itself. Would such an optimization still make sense in disease states that might also be of interest?

      This is a brilliant question, which we decided to explore further in separate studies. Specifically, the link between optimal communication and brain disorders is a natural next step that we are pursuing. Here, we expanded our discussion with a few lines first explaining the roots of our main assumption, which is that neurons optimize information flow, among other goals. We then hypothesized that the biological mechanisms by which this goal is achieved include (based on our findings) adopting a broadcasting regime of signaling. We suspect that this mode of communication, operationalized on complex network topologies, is a trade-off between robust signaling and energy efficiency. Currently, we are planning practical steps to test this hypothesis.

      Lines 943-962:

      “Nonetheless, our framework is grounded in game theory where its fundamental assumption is that nodes aim at maximizing their influence over each other, given the existing constraints. This assumption is well explored using various theoretical frameworks (Buehlmann and Deco, 2010; Bullmore and Sporns, 2012; Chklovskii et al., 2002; Laughlin and Sejnowski, 2003; O’Byrne and Jerbi, 2022) and remains open to further empirical investigation. Here, we used game theory to mathematically formalize a theoretical optimum for communication in brain networks. Our findings then provide a possible mechanism for achieving this optimality through broadcasting. Based on our results, we speculate that, there exists an optimal broadcasting strength that balances robustness of the signal with its metabolic cost. This hypothesis is reminiscent of the concept of brain criticality, which suggests the brain to be positioned in a state in which the information propagates maximally and efficiently (O’Byrne and Jerbi, 2022; Safavi et al., 2024). Together, we suggest broadcasting to be the possible mechanism with which communication is optimized in brain networks, however, further research directions include investigating whether signaling within brain networks indeed aligns with a game-theoretic definition of optimality. Additionally, if it does, subsequent studies could then examine how deviations from optimal communication contribute to or result from various brain states or neurological and psychiatric disorders.”

      Reviewer #1 (Recommendations for the authors):

      I would recommend that the authors consider the following point in a revision, as well as the major weaknesses of the public review. Some aspects of Figure 1 could be clearer. What is being illustrated by the looping arrow to MSA? What is being represented in the matrices (labeling "source" and "target" on the matrix might enhance clarity)? Is R2 the metric used to assess the degree of similarity between communication models? These could be addressed by making small additions to the figure legend or to the figure itself.

      Thank you for your constructive comment on Figure 1, which is arguably the most important figure in the manuscript. We adjusted the figure and its caption (see above) based on your suggestions. After doing so, we think the figure is now clearer regarding the pipeline used in this work.

      Reviewer #2 (Recommendations for the authors):

      Overall, as stated in the public review and the short assessment, the manuscript is in a clearly mature state and brings an important method to link the fields of structural and functional brain networks.

      Nevertheless, the paper would benefit from an early, and clear, discussion of the:

      (1) components of the model, and assumptions of each, should be stated at the end of the introduction, or early in results. (2) datasets necessary to run the analysis.

      The confusion arises from lines 130-131, stating "In the present work (summarized in Figure 1), we used the human connectome, large-131 scale models of dynamics, and a game-theoretical perspective of signaling." This, to me, indicated that a structural connectivity map may be the only dataset required, as the dynamics model and game theory component are solely simulated. However, later, lines 214-216 state that the empirical functional connectivity is estimated from the structural connectivity, indicating that the method is only applied to cases where we have both.

      Finally, Supplemental Figure 5 validates a number of metrics on different solely structural networks (which is a very necessary and well-done control). Similarly, while the dynamical model is discussed in depth, and beautifully shown that the specific choice of dynamical model does not directly impact the results, it would be helpful to clarify the dynamical model utilized in the early figures.

      Thank you for pointing out a critical detail that we missed elaborating sufficiently early in the paper: the modelling step. Following your suggestions, we added a paragraph from line 292 to 305 (page 10) expanding on the modelling framework. We also explicitly divided the modelling step in Figure 1 and briefly clarified our modelling choices in the caption. Together, we emphasized the fact that our framework is generally model agnostic, which allows different models of dynamics to be plugged into various anatomical networks. We then clarified that, like in any modelling effort, one needs to first fit/optimize the model parameters to reproduce empirical data. In other words, we emphasized the fact that our framework relies on a computational model as its ‘game’ to infer how regions interact, and we fine-tuned our models to reproduce the empirical FC.

      Again, this is not a critique of the methods, which are excellent, but the presentation. It would help readers, and even me, to have a clear indication of the model earlier. Further, it would help to discuss, both in the introduction and discussion, the datasets required for applying these methods more broadly. For instance, 2-photon recordings are discussed - would it be possible to apply this method then to EM connectomes with functional data recorded for them? In theory, it seems like yes, although the current datasets have 100% observability, whereas 2-photon imaging, or other local methods, will not have perfect overlap between structural and functional connectomes. Discussions like this, related to the assumptions of the model, the necessary datasets, and broader application directions beyond DSI, fMRI, and BOLD cases where the method was validated, would increase the impact and interpretability for a broad readership.

      This is a valid point that we should have been more explicit about. The revised manuscript now contains a paragraph (lines 740-748) clarifying the fact that, throughout this work, we assumed full observability. We then briefly discuss, based on the mathematical principles of the framework, what we expect to happen in cases with partial observability. We then point at two references in which the details of a framework with partial observability are laid out, one containing mathematical proofs and the other using numerical simulations.

      References:

      Hadaeghi, F., Fakhar, K., & Hilgetag, C. C. (2024). Controlling Reciprocity in Binary and Weighted Networks: A Novel Density-Conserving Approach (p. 2024.11.24.625064). bioRxiv. https://doi.org/10.1101/2024.11.24.625064

    1. Author response:

      The following is the authors’ response to the previous reviews

      Public Reviews:

      Reviewer #1 (Public review):

      Summary:

      The paper addresses the problem of optimising the mapping of serum antibody responses against a known antigen. It uses the croEM analysis of polyclonal Fabs to antibody genes, with the ultimate aim of getting complete and accurate antibody sequences. The method, commonly termed EMPEM, is becoming increasingly used to understand responses in convalescent sera and optimisation of the workflows and

      The authors do not address the experimental aspects of the methods and do not present novel computational tools, rather they use a series of established computational methods to provide workflows that simplify the interpretation of the EM map in terms of the sequences of dominant antibodies.

      We would like to thank the reviewer for this assessment. While indeed we implement ModelAngelo as published without changes to its algorithms or code, we did add new functionality to Stitch to read the generated output from ModelAngelo and assemble it against known databases of germline-encoded antibody sequences. Of note, ModelAngelo was not primarily developed to determine exact sequence from CryoEM images, but instead to provide input for sequence determination from sequence searches with profile HMMs. Such models are designed to handle ambiguous calls of residues at different positions of a protein sequence. We are of the opinion that one of the main contributions of our study is to finally benchmark the EMPEM approach against known sequences to build a framework for data quality requirements in the future. From our study in best-case scenario’s EM data alone will provide sequences at 80-90% accuracy. In other words, the sequences are riddled with errors and cannot be taken at face value without orthogonal sequencing data. We demonstrate that mass spectrometry data can fill this requirement and yield much improved accuracy of the sequences even against high backgrounds of unrelated antibody sequences. We are incredibly excited about the prospects and future developments for EMPEM and believe that its integration with orthogonal sequencing approaches like MS are critical moving forward. By developing this pipeline we hope to have taken steps in the right direction.

      Strengths:

      The paper is well-written and clearly argued. The tests constructed seem appropriate and fair and demonstrate that the workflow works pretty well. For a small subset (~17%) of the EMPEM maps analysed the workflow was able to get convincing assignments of the V-genes.

      Thanks for the kind assessment.

      Weaknesses:

      The AI methods used are not a substitute for high quality data and at present very few of the results obtained from EMPEM will be of sufficient quality to robustly assign the sequence of the antibody. However, rather more are likely to be good enough, especially in combination with MS data, to provide a pretty good indication of the V-gene family.

      We fully agree with the assessment of the reviewer, as this being a general limitation of the EMPEM field. If anything, we hope our benchmark study and developed pipeline to integrate with MS-based sequencing data have more clearly established the current limitations of the technique and the requirements/prospects for orthogonal sequencing data to fill the missing gaps.

      Reviewer #2 (Public review):

      In this manuscript, the authors seek to demonstrate that it is possible to sequence antibody variable domains from cryoEM reconstructions in combination with bottom-up LC-MSMS. In particular, they extract de novo sequences from single particle-cryo-EM-derived maps of antibodies using the "deep-learning tool ModelAngelo", which are run through the program Stitch to try to select the top scoring V-gene and construct a placeholder sequence for the CDR3 of both the heavy and light chain of the antibody under investigation. These reconstructed variable domains are then used as templates to guide the assembly of de novo peptides from LC-MS/MS data to improve the accuracy of the candidate sequence.

      Using this approach the authors claim to have demonstrated that "cryoEM reconstructions of monoclonal antigen-antibody complexes may contain sufficient information to accurately narrow down candidate V-genes and that this can be integrated with proteomics data to improve the accuracy of candidate sequences".

      WhiIe the approach is clearly a work in progress, the manuscript should made easier to understand for the general reader. Indeed, I had a hard time understanding the workflow until I got to Fig. 3. So re-ordering the figures, for example, may be helpful in this regard.

      It would be useful to provide additional concrete examples where the described workflow would assist in the elucidation of CDR3's, in cases where this isn't already known. (In the benchmark dataset from the Electron Microscopy Data Bank, all the antibodies and Fabs are presumably known, as is the case for the monoclonal antibody CR3022). I am having difficulty envisioning how one would prepare samples from actual plasma samples that would be appropriate for single particle cryo-EM and MS data on dominant antibodies of interest. In my experience, most of these samples tend to be quite complex mixtures. So additional discussion of this point would be helpful.

      We would like to thank the reviewer for their kind and critical assessment of our work. We have adopted the suggestion to reorder the graphical material, such that the workflow schematic is now Figure 1 in the main text. We hope this will improve the readability.

      Regarding the concrete examples where the workflow could aid in elucidating CDR3 sequences, we would like to refer to all published EMPEM studies and in particular those highlighted in Figure 6. We are also actively working to integrate EMPEM data with MS-based sequencing on novel samples, but those will be subject of later studies. We have added additional discussion regarding the experimental feasibility of the approach. We have highlighted several milestone results where functional antibodies were reconstructed from EMPEM and/or MS data. In the discussion we write:

      “While sample complexity remains an important bottleneck, and questions remain about the dynamic range of the true serum antibody repertoire and the depth of coverage from these novel experimental approaches, several studies have recently reached the important milestone of reconstructing functional antibodies from direct measurements of the secreted serum components.” (see references in manuscript)

      “We believe that both EMPEM and MS-based polyclonal antibody sequencing are still limited to the top 1-10 antibodies in the polyclonal mixture. The EMPEM approach is biased towards bigger and well-ordered target antigens, which calls for additional complementary approaches like HDX-MS for a comprehensive polyclonal epitope mapping exercise.”

      Recommendations for the authors:

      Reviewer #1 (Recommendations for the authors):

      Line 172: I am surprised the heavy chain is not worse than the light chain

      We have added the following sentence:

      “The length of the complete antigen binding loops was estimated with an average error of 0.5 ± 3.3 or 1.7 ± 6.0 residues for heavy and light chain, with average sequence identities of 0.63 and 0.41. While CDRH3 is the more challenging region in MS-based approaches to antibody sequencing, we believe that the moderately better length and sequence accuracy of CDRH3 compared to CDRL3 in ModelAngelo output reflects the CDRH3’s notoriously tight involvement in antigen binding, hence a greater relative stability in the antibody-antigen complex, resulting in better order in the reconstructed EM density maps.”

      Line 175: Global FSC is not going to be useful. Why not use a local value?

      We agree that local resolution estimates would be more appropriate, that is exactly why we added this remark to our initial analysis. However, local resolution estimates are non-trivial and raise the question about ‘how local’ we need to estimate the quality of the map (see for instance https://doi.org/10.1016/j.sbi.2020.06.005). At present, we believe that the required work for this local resolution analysis is not warranted, only to arrive at the rather intuitive if not tautological conclusion that a better map quality translates into more accurate sequences. While we agree that a better quantitative understanding of the data requirements for EMPEM could benefit the field, we opted to leave this, especially considering that the Stitch alignment score is already a good alternative predictor of sequence accuracy compared to map resolution as demonstrated in Figure 3,

      Line 259: 'of the 23 maps' .... Actually there were 46 maps originally, so I feel this is a tad misleading.

      The statistic of ‘46 total’ was added to the text.

    1. Author response:

      The following is the authors’ response to the original reviews.

      Alternate explanations for major conclusions.

      The major conclusions are (a) surface motility of W3110 requires pili which is not novel, (b) pili synthesis and pili-dependent surface motility require putrescine — 1 mM is optimal, and 4 mM is inhibitory, and (c) the existence of a putrescine homeostatic network that maintains intracellular putrescine that involves compensatory mechanisms for low putrescine, including diversion of energy generation toward putrescine synthesis.

      Conclusion a: Reviewer 3 suggests that the mutant may have lost surface motility because of outer surface structures that actually mediate motility but are co-regulated with or depend on pili synthesis. The reviewer explicitly suggests flagella as the alternate appendage, although flagella and pili are reciprocally regulated. Most experiments were performed in a Δ_fliC_ background, which lacks the major flagella subunit, in order to prevent the generation of fast-moving flagella-dependent variants. Furthermore, no other surface structure that could mediate surface motility is apparent in the electron microscope images. This observation does not definitively rule out this possibility, especially because of the large transcriptomic changes with low putrescine. Our explanation is the simplest.

      Conclusion b, first comment: Reviewer 1 states that “it is not possible to conclude that the effects of gene deletions to biosynthetic, transport or catabolic genes on pili-dependent surface motility are due to changes in putrescine levels unless one takes it on faith that there must be changes to putrescine levels.” The comment ignores both the nutritional supplementation and the transcript changes that strongly suggest compensatory mechanisms for low putrescine. Why compensate if the putrescine concentration does not change? The reviewer then implicitly acknowledges changes in putrescine content: “it is important to know how much putrescine must be depleted in order to exert a physiological effect”.

      Conclusion b, second comment: Reviewer 1 proposes that agmatine accumulation can account for some of the observed properties, but which property is not specified. With respect to motility, agmatine accumulation cannot account for motility defects because motility is impaired in (a) a speA mutant which cannot make agmatine and (b) a speC speF double mutant which should not accumulate agmatine. With respect to the transcriptomic results, even if high agmatine is the reason for some transcript changes, the results still suggest a putrescine homeostasis network.

      Conclusion c: the reviewers made no comments on the RNAseq analysis or the interpretation of the existence of a homeostatic network.

      Additional experiments proposed.

      Complementation. Reviewers 1 and 3 suggested complementation experiments, but the latter states that nutritional supplementation strengthens our arguments. The most relevant complementation is with speB.  We tried complementation and found that our control plasmid inhibited motility by increasing the lag time before movement commenced. A plasmid with speB did stimulate motility relative to the control plasmid, but movement with the speB plasmid took 4 days, while wild-type movement took 1.5 days. We think that interpretation of this result is ambiguous. We did not systematically search for plasmids that had no effect on motility.

      The purpose of complementation is to determine whether a second-site mutation is the actual cause of the motility defect. In this case, the artifact is that an alteration in polyamine metabolism is not the cause of the defect. However, external putrescine reverses the effects on motility and pili synthesis in the speB mutant. This result is inconsistent with a second-site mutation. Still, we agree that complementation is important, and because of our difficulties, we tested numerous mutants with defects in polyamine metabolism. The results present an interpretable and coherent pattern. For example, if putrescine is not the regulator, then mutants in putrescine transport and catabolism should have had no effect. Every single mutant is consistent with a role in movement and pili synthesis. The simplest explanation is that putrescine affects movement and pili synthesis.

      Phase variation. Reviewer 2 noted that we did not discuss phase variation. The comment came from the observation that the speB mutant had fewer fimB transcripts which could explain the loss of motility. The reviewer also suggested a simple experiment, which we performed and found that putrescine does not control phase variation. We present those results in the supplemental material. Our discussion of this topic includes a major qualification.

      Testing of additional strains. Published results from another lab showed that surface motility of MG1655 requires spermidine instead of putrescine (PMID 19493013 and 21266585). MG1655 and the W3110 that we used in our study are E. coli K-12 derivatives and phylogenetic group A. Any number of changes in enzymes that affect intracellular putrescine concentration could result in different responses to putrescine. We are currently studying pili synthesis and motility in other strains. While that study is incomplete, loss of speB in a strain of phylogenetic group D eliminates no surface motility. This work was intended as our initial analysis and the focus was on a single strain.

      Measuring intracellular polyamines. We felt that we had provided sufficient evidence to conclude that putrescine controls pili synthesis and putrescine concentrations are lower in the speB mutant: the nutritional supplementation, the lower levels of transcripts for putrescine catabolic enzymes which require putrescine for their expression strongly suggest lower putrescine in a mutant lacking a putrescine biosynthesis gene, and a transcriptomic analysis that found the speB mutant had transcript changes to compensate for low putrescine. We understand the importance of measuring intracellular polyamines. We are currently examining the quantitative relationship between intracellular polyamines and pili synthesis in multiple strains which respond differently to loss of speB.

      Recommendations for the authors:

      Reviewer #1 (Recommendations for the authors):

      The authors should measure putrescine, agmatine, cadaverine, and spermidine levels in their gene deletion strains.

      Polyamine concentration measurements will be part of a separate study on polyamine control of pili synthesis of a uropathogenic strain. A comparison is essential, and the results from W3110 will be part of that study.

      Reviewer #2 (Recommendations for the authors):

      (1) Line 28. Your statements about urinary tract infections are pure speculation. They are fine for the discussion, but should not be in the abstract.

      The abstract from line 27 on has been reworked. The comment of the reviewer is fair.

      (2) Line 65. Do we need this discussion about the various strains? If you keep it, you should point out that they were all W3110 strains. But you could just say that you confirmed that your background strain can do PDSM (since you are also not showing any data for the other isolates). Discussing the various strains implies that you are not confident in your strain and raises the question of why you didn't use a sequenced wt MG1655, or something like that.

      This section has been reworked. Our strain of W3110 has an insertion in fimB which is relevant for movement but does not affect our results. The insertion limits our conclusions about phase variation. We want to point out that strains variations are large. We also sequenced our strain of W3110.

      (3) Related. You occasionally use "W3110-LR" to designate the wild type. You use this or not, but be consistent throughout the text.

      Fixed

      (4) Line 99. Does eLife allow "data not shown"?  

      (5) Line 119. As you note, the phenotype of the puuA patA double mutant is exactly the opposite of what one would expect. Although you provide additional evidence that high levels also inhibit motility, complementing the double mutant would provide confidence that the strain is correct.

      We rapidly ran into issues with complementation which are discussed in public responses to reviewer comments.

      (6) Figure 6C. Either you need to quantify these data or you need a better picture.

      The files were corrupted. It was repeated several time, but we lost the other data.

      (7) Figure 7. Label panels A and B to indicate that these strains are speB. Also, you need to switch panels C and D to match the order of discussion in the manuscript.

      Done

      (8) Line 134. Is there a statistically significant difference in the ELISA between 1 and 4 mM? You need to say one way or the other.

      No statistical significance and this has been added to the paper

      (9) Figure 10C. You need to quantify these data.

      Quantification added as an extra panel.

      (10) Line 164. You include H-NS in the group of "positive effectors that control fim operon expression" and you reference Ecocyc, rather than any primary reference. Nowhere in the manuscript do you mention phase variation. In the speB mutant, you see decreased fimB, increased fimE, and decreased hns expression. My interpretation of the literature suggests that this would drive the fim switch to the off-state. This could certainly explain some of the results. It is also easily measurable with PCR. This might require testing cells scraped directly from the plates.

      The experiments were performed. There is no need to scrap cells from plates because the fimB result from RNAseq was from a liquid culture, and the prediction would be that the phase-locking should be evident in these cells.

      (11) Figure 10. Likewise, do you know that your hns mutant is not locked in the off-state? Granted, the original hns mutants (pilG) showed increased rates of switching, but growth conditions might matter.

      We also did phase variation for the hns mutant and the hns mutant was not phase locked. This result is shown. In addition to growth conditions, the strain probably matters.

      (12) Line 342. You describe the total genome sequencing of W3110, yet this is not mentioned anywhere else in the manuscript.

      It is now

      Minor points:

      (13) Line 192. "One of the most differentially expressed genes...".

      (14) Line 202. "...implicates extracellular putrescine in putrescine homeostasis."

      (15) Line 209. "...potential pili regulators...".

      (16) You are using a variety of fonts on the figures. Pick one.

      (17) Figure 9A. It took me a few minutes to figure out the labeling for this figure and I was more confused after reading the legend. It would be simpler to independently label red triangles, blue triangles, red circles, and blue circles.

      (18) Figure 9B and 10. The reader can likely figure out what W3110_1.0_3 means, but more straightforward labeling would be better, or you need to define these labels.

      All points were addressed and fixed.

      Reviewer #3 (Recommendations for the authors):

      Other comments:

      (1) Please go through the figures and the reference to figures in the text, as they often do not refer to the right panel (ex: figures 2 and 7 for instance). In the text, please homogenize the reference to figures (Figure 2C vs Figure 3). To help compare motility experiments between figures, please use the same scale in all figures.

      This has been fixed.

      (2) Lines 65-70: I am not sure I get the reason behind choosing the W3110 strain from your lab stock. In what background were the initial mutants constructed (from l.64-65)? Were the nine strains tested, all variations of W3110? If so, is the phenotype described in the manuscript robust in all strains?

      We have provided more explanation. W3110 was the most stable: insertions that allowed flagella synthesis in the presence of glucose were frequent. We deleted the major flagella subunit for most experiments. Before introduction of the fliC deletion, we needed to perform experiments 10 times so that fast-moving variants, which had mutationally altered flagella synthesis, did not complicate results.

      (3) Line 82-84: As stated in the public review, I think more controls are needed before making this conclusion, especially as type I fimbriae are usually involved in sessile phenotypes.

      Response provided in the public response.

      (4) In Figure 3: Changing the order of the image to follow the text would make the figure easier to follow.

      Fixed as requested

      (5) Lines 100-101: simultaneous - the results presented here do not support this conclusion. In Figure 4b, the addition of putrescine to speB mutants is actually not different from WT. From the results, it seems like one of biosynthesis or transport is needed, but it's not clear if both are needed simultaneously. For this, a mutant with no biosynthesis and no transport is needed and/or completely non-motile mutants would be needed to compare.

      We disagree. If there are two pathways of putrescine synthesis and both are needed, then our conclusion follows.

      (6) Lines 104-105: '... because E. coli secretes putrescine.' - not sure why this statement is there, as most transporters tested after are importers of putrescine? It is also not clear to me if putrescine is supplemented in the media in these experiments. If not, is there putrescine in the GT media?

      Good points, and this section has been reworded to clarify these issues. Some of the material was moved to the discussion.

      (7) Line 109: 'We note that potE and plaP are more highly expressed than potE and puuP...' - first potE should be potF?

      This has been corrected.

      (8) Figure 8: What is the difference between the TEM images in Figure 1 and here? The WT in Figure 1 does show pili without the supplementation unless I'm missing something here. Please specify.

      The reviewer means Figure 2 and not Figure 1. Figure 2 shows a wild-type strain which has both putrescine anabolic pathways while Figure 8 is the ΔspeB strain which lacks one pathway.

      (9) Line160-162: Transcripts for the putrescine-responsive puuAP and puuDRCBE operons, which specify genes of the major putrescine catabolic pathway, were reduced from 1.6- to 14- fold (FDR {less than or equal to} 0.02) in the speB mutant (Supplemental Table 1), which implies lower intracellular putrescine. I might not get exactly the point here. If the catabolic pathways are repressed in the speB mutant, then there will be less degradation which means more putrescine!?

      Expression of these genes is a function of intracellular putrescine: higher expression means more putrescine. Any discussion of steady putrescine must include the anabolic pathways: the catabolic pathways do not determine the intracellular putrescine, they are a reflection of intracellular putrescine.

      (10) Lines 162-163: Deletion of speB reduced transcripts for genes of the fimA operon and fimE, but not of fimB. It seems that the results suggest the opposite a reduction of fimB but not fimE!?

      The reviewer is correct, and it is our mistake, and the text now states what is in the figure..

    1. Author response:

      The following is the authors’ response to the original reviews.

      Reviewer #1 (Public review):

      This manuscript presents an interesting exploration of the potential activation mechanisms of DLK following axonal injury. While the experiments are beautifully conducted and the data are solid, I feel that there is insufficient evidence to fully support the conclusions made by the authors.

      In this manuscript, the authors exclusively use the puc-lacZ reporter to determine the activation of DLK. This reporter has been shown to be induced when DLK is activated.

      However, there is insufficient evidence to confirm that the absence of reporter activation necessarily indicates that DLK is inactive. As with many MAP kinase pathways, the DLK pathway can be locally or globally activated in neurons, and the level of DLK activation may depend on the strength of the stimulation. This reporter might only reflect strong DLK activation and may not be turned on if DLK is weakly activated. The results presented in this manuscript support this interpretation. Strong stimulation, such as axotomy of all synaptic branches, caused robust DLK activation, as indicated by puc-lacZ expression. In contrast, weak stimulation, such as axotomy of some synaptic branches, resulted in weaker DLK activation, which did not induce the puc-lacZ reporter. This suggests that the strength of DLK activation depends on the severity of the injury rather than the presence of intact synapses. Given that this is a central conclusion of the study, it may be worthwhile to confirm this further. Alternatively, the authors may consider refining their conclusion to better align with the evidence presented.

      In Figure 1E we have replotted the puc-lacZ data to show comparisons between different injuries that leave different numbers of spared (or lost) boutons and branches.  We observed no differences between injuries that remove only a small fraction of boutons (injury location (a)) and injuries that remove nearly all of them (injury locations (b) and (c)) and uninjured neurons (Figure 1E). These observations argue against the interpretation that the strength of DLK activation (at least within the cell body) depends on the severity of injury. Rather, puc-lacZ induction appears to be bimodal. It is either induced (in various injuries that remove all synaptic boutons), or not induced, including in injuries that spared only a small fraction of the total boutons. We therefore think that the presence of a remaining synaptic connection rather than the extent of the injury per se is a major determinant of whether the cell body component of Wnd signaling can be activated. 

      The reviewer (and others) fairly point out that our current study focuses on puc-lacZ as a reporter of Wnd signaling in the cell body. We consider this to be a downstream integration of events in axons that are more challenging to detect. It is striking that this integration appears strongly sensitized to the presence of spared synaptic boutons. Examination of Wnd’s activation in axons and synapses is a goal for our future work.

      As noted by the authors, DLK has been implicated in both axon regeneration and degeneration. Following axotomy, DLK activation can lead to the degeneration of distal axons, where synapses are located. This raises an important question: how is DLK activated in distal axons? The authors might consider discussing the significance of this "synapse connection-dependent" DLK activation in the broader context of DLK function and activation mechanisms.

      While it has been noted that inhibition of DLK can mildly delay Wallerian degeneration (Miller et al., 2009), this does not appear to be the case for retinal ganglion cell axons following optic nerve crush (Fernandes et al., 2014). It is also not the case for Drosophila motoneurons and NMJ terminals following peripheral nerve injury (Xiong et al., 2012; Xiong and Collins, 2012). Instead, overexpression of Wnd or activation of Wnd by a conditioning injury leads to an opposite phenotype - an increase in resiliency to Wallerian degeneration for axons that have been previously injured (Xiong et al., 2012; Xiong and Collins, 2012). The downstream outcome of Wnd activation is highly dependent on the context; it may be an integration of the outcomes of local Wnd/DLK activation in axons with downstream consequences of nuclear/cell body signaling.  The current study suggests some rules for the cell body signaling, however, how Wnd is regulated at synapses and why it promotes degeneration in some circumstances but not others are important future questions.

      For the reviewer’s suggestion, it is interesting to consider DLK’s potential contributions to the loss of NMJ synapses in a mouse model of ALS (Le Pichon et al., 2017; Wlaschin et al., 2023). Our findings suggest that the synaptic terminal is an important locus of DLK regulation, while dysfunction of NMJ terminals is an important feature of the ‘dying back’ hypothesis of disease etiology (Dadon-Nachum et al., 2011; Verma et al., 2022). We propose that the regulation of DLK at synaptic terminals is an important area for future study, and may reveal how DLK might be modulated to curtail disease progression. Of note, DLK inhibitors are in clinical trials (Katz et al., 2022; Le et al., 2023; Siu et al., 2018), but at least some have been paused due to safety concerns (Katz et al., 2022). Further understanding of the mechanisms that regulate DLK are needed to understand whether and how DLK and its downstream signaling can be tuned for therapeutic benefit.

      Reviewer #2 (Public review):

      Summary:

      The authors study a panel of sparsely labeled neuronal lines in Drosophila that each form multiple synapses. Critically, each axonal branch can be injured without affecting the others, allowing the authors to differentiate between injuries that affect all axonal branches versus those that do not, creating spared branches. Axonal injuries are known to cause Wnd (mammalian DLK)-dependent retrograde signals to the cell body, culminating in a transcriptional response. This work identifies a fascinating new phenomenon that this injury response is not all-or-none. If even a single branch remains uninjured, the injury signal is not activated in the cell body. The authors rule out that this could be due to changes in the abundance of Wnd (perhaps if incrementally activated at each injured branch) by Wnd, Hiw's known negative regulator. Thus there is both a yet-undiscovered mechanism to regulate Wnd signaling, and more broadly a mechanism by which the neuron can integrate the degree of injury it has sustained. It will now be important to tease apart the mechanism(s) of this fascinating phenomenon. But even absent a clear mechanism, this is a new biology that will inform the interpretation of injury signaling studies across species.

      Strengths:

      (1) A conceptually beautiful series of experiments that reveal a fascinating new phenomenon is described, with clear implications (as the authors discuss in their Discussion) for injury signaling in mammals.

      (2) Suggests a new mode of Wnd regulation, independent of Hiw.

      Weaknesses:

      (1) The use of a somatic transcriptional reporter for Wnd activity is powerful, however, the reporter indicates whether the transcriptional response was activated, not whether the injury signal was received. It remains possible that Wnd is still activated in the case of a spared branch, but that this activation is either local within the axons (impossible to determine in the absence of a local reporter) or that the retrograde signal was indeed generated but it was somehow insufficient to activate transcription when it entered the cell body. This is more of a mechanistic detail and should not detract from the overall importance of the study

      We agree. The puc-lacZ reporter tells us about signaling in the cell body, but whether and how Wnd is regulated in axons and synaptic branches, which we think occurs upstream of the cell body response, remains to be addressed in future studies.

      (2) That the protective effect of a spared branch is independent of Hiw, the known negative regulator of Wnd, is fascinating. But this leaves open a key question: what is the signal?

      This is indeed an important future question, and would still be a question even if Hiw were part of the protective mechanism by the spared synaptic branch. Our current hypothesis (outlined in Figure 4) is that regulation of Wnd is tied to the retrograde trafficking of a signaling organelle in axons. The Hiw-independent regulation complements other observations in the literature that multiple pathways regulate Wnd/DLK (Collins et al., 2006; Feoktistov and Herman, 2016; Klinedinst et al., 2013; Li et al., 2017; Russo and DiAntonio, 2019; Valakh et al., 2013). It is logical for this critical stress response pathway to have multiple modes of regulation that may act in parallel to tune and restrain its activation. 

      Reviewer #3 (Public review):

      Summary:

      This manuscript seeks to understand how nerve injury-induced signaling to the nucleus is influenced, and it establishes a new location where these principles can be studied. By identifying and mapping specific bifurcated neuronal innervations in the Drosophila larvae, and using laser axotomy to localize the injury, the authors find that sparing a branch of a complex muscular innervation is enough to impair Wallenda-puc (analogous to DLK-JNKcJun) signaling that is known to promote regeneration. It is only when all connections to the target are disconnected that cJun-transcriptional activation occurs.

      Overall, this is a thorough and well-performed investigation of the mechanism of sparedbranch influence on axon injury signaling. The findings on control of wnd are important because this is a very widely used injury signaling pathway across species and injury models. The authors present detailed and carefully executed experiments to support their conclusions. Their effort to identify the control mechanism is admirable and will be of aid to the field as they continue to try to understand how to promote better regeneration of axons.

      Strengths:

      The paper does a very comprehensive job of investigating this phenomenon at multiple locations and through both pinpoint laser injury as well as larger crush models. They identify a non-hiw based restraint mechanism of the wnd-puc signaling axis that presumably originates from the spared terminal. They also present a large list of tests they performed to identify the actual restraint mechanism from the spared branch, which has ruled out many of the most likely explanations. This is an extremely important set of information to report, to guide future investigators in this and other model organisms on mechanisms by which regeneration signaling is controlled (or not).

      Weaknesses:

      The weakest data presented by this manuscript is the study of the actual amounts of Wallenda protein in the axon. The authors argue that increased Wnd protein is being anterogradely delivered from the soma, but no support for this is given. Whether this change is due to transcription/translation, protein stability, transport, or other means is not investigated in this work. However, because this point is not central to the arguments in the paper, it is only a minor critique.

      We agree and are glad that the reviewer considers this a minor critique; this is an area for future study. In Supplemental Figure 1 we present differences in the levels of an ectopically expressed GFP-Wnd-kinase-dead transgene, which is strikingly increased in axons that have received a full but not partial axotomy. We suspect this accumulation occurs downstream of the cell body response because of the timing. We observed the accumulations after 24 hours (Figure S1F) but not at early (1-4 hour) time points following axotomy (data not shown). Further study of the local regulation of Wnd protein and its kinase activity in axons is an important future direction.

      As far as the scope of impact: because the conclusions of the paper are focused on a single (albeit well-validated) reporter in different types of motor neurons, it is hard to determine whether the mechanism of spared branch inhibition of regeneration requires wnd-puc (DLK/cJun) signaling in all contexts (for example, sensory axons or interneurons). Is the nerve-muscle connection the rule or the exception in terms of regeneration program activation?

      DLK signaling is strongly activated in DRG sensory neurons following peripheral nerve injury (Shin et al., 2012), despite the fact that sensory neurons have bifurcated axons and their projections in the dorsal spinal cord are not directly damaged by injuries to the peripheral nerve. Therefore it is unlikely that protection by a spared synapse is a universal rule for all neuron types. However the molecular mechanisms that underlie this regulation may indeed be shared across different types of neurons but utilized in different ways. For instance, nerve growth factor withdrawal can lead to activation of DLK (Ghosh et al., 2011), however neurotrophins and their receptors are regulated and implemented differently in different cell types. We suspect that the restraint of Wnd signaling by the spared synaptic branch shares a common underlying mechanism with the restraint of DLK signaling by neurotrophin signaling. Further elucidation of the molecular mechanism is an important next step towards addressing this question. 

      Because changes in puc-lacZ intensity are the major readout, it would be helpful to better explain the significance of the amount of puc-lacZ in the nucleus with respect to the activation of regeneration. Is it known that scaling up the amount of puc-lacZ transcription scales functional responses (regeneration or others)? The alternative would be that only a small amount of puc-lacZ is sufficient to efficiently induce relevant pathways (threshold response).

      While induction of puc-lacZ expression correlates with Wnd-mediated phenotypes, including sprouting of injured axons (Xiong et al., 2010), protection from Wallerian degeneration (Xiong et al., 2012; Xiong and Collins, 2012) and synaptic overgrowth (Collins et al., 2006), we have not observed any correlation between the degree of puc-lacZ induction (eg modest, medium or high) and the phenotypic outcomes (sprouting, overgrowth, etc). Rather, there appears to be a striking all-or-none difference in whether puc-lacZ is induced or not induced. There may indeed be a threshold that can be restrained through multiple mechanisms. We posit in figure 4 that restraint may take place in the cell body, where it can be influenced by the spared bifurcation. 

      Recommendations for the authors:

      Reviewer #2 (Recommendations for the authors):

      This is a beautiful study. Naturally, you're searching now for the underlying mechanism.

      A few questions:

      (1) At present you can not determine if the Wnd signal is never initiated (when a spared branch is present) or if it gets to the cell body but is incapable of activating the puckered reporter. Is there any optical reporter (JNK activation?) that could differentiate this?

      The reviewer is correct that a tool to detect local activity of JNK kinase in axons would be ideal for probing the mechanisms that underlie our observations. A FRET reporter for JNK kinase activity has been developed and utilized in cultured cells (Fosbrink et al. 2010). It would be interesting to implement this reporter in Drosophila; it would need to be sensitive enough to visualize  in single Drosophila axons. We have previously noted Wnd-dependent phosphorylated JNK in the cell body of injured motoneurons following nerve crush (Xiong et al., 2010). However anti-pJNK antibodies detect what appears to be a constitutive signal in uninjured axons that does not appear to be influenced by activation or inhibition of Wnd (Xiong et al., 2010).

      (2) What happens when you injure the axon in a dSarm KO? This is more of a curiosity, not a necessity, but is it the axon dying or the detection of the injury itself?

      We have tested whether overexpression of Nmnat or the WldS transgene, which inhibit Wallerian degeneration of injured axons, affect the induction of puc-lacZ following nerve injury. This manipulation has no effect on puc-lacZ expression in uninjured animals, and also has no effect on the induction of puc-lacZ following peripheral nerve crush (TJ Waller, personal communication).

      (3) Are Wnd rescue experiments possible in this context? Would be an interesting place to do Wnd structure-function and compare it to the synaptic work.

      This is not possible with current reagents. Expression of wild type wnd cDNA under the Gal4/UAS promoter leads to strong induction of puc-lacZ in uninjured animals, even when weak Gal4 driver lines are used (Xiong et al., 2012, 2010). Similar observations of constitutively active signaling have been observed for expression studies of DLK in mammalian cells ((Hao et al., 2016; Huntwork-Rodriguez et al., 2013; Nihalani et al., 2000), and data not shown). These and other observations suggest that the levels of Wnd/DLK protein are tightly controlled by posttranscriptional mechanisms. Delineation of sequences within Wnd/DLK that are required for its regulation would be helpful for addressing this question.

      This will be required reading in my lab.

      That is an honor. We look forward to help from the field to understand how and why this pathway is restrained at synapses. Your students may bring new ideas to the table.

      Reviewer #3 (Recommendations for the authors):

      Piezo is spelled incorrectly in the supplemental table in multiple places.

      Thank you for pointing this out! We have made the correction.

      References cited (in rebuttal)

      Collins CA, Wairkar YP, Johnson SL, DiAntonio A. 2006. Highwire restrains synaptic growth by attenuating a MAP kinase signal. Neuron 51:57–69.

      Dadon-Nachum M, Melamed E, Offen D. 2011. The “dying-back” phenomenon of motor neurons in ALS. J Mol Neurosci 43:470–477.

      Feoktistov AI, Herman TG. 2016. Wallenda/DLK protein levels are temporally downregulated by Tramtrack69 to allow R7 growth cones to become stationary boutons. Development 143:2983–2993.

      Fernandes KA, Harder JM, John SW, Shrager P, Libby RT. 2014. DLK-dependent signaling is important for somal but not axonal degeneration of retinal ganglion cells following axonal injury. Neurobiol Dis 69:108–116.

      Ghosh AS, Wang B, Pozniak CD, Chen M, Watts RJ, Lewcock JW. 2011. DLK induces developmental neuronal degeneration via selective regulation of proapoptotic JNK activity. J Cell Biol 194:751–764.

      Hao Y, Frey E, Yoon C, Wong H, Nestorovski D, Holzman LB, Giger RJ, DiAntonio A, Collins C. 2016. An evolutionarily conserved mechanism for cAMP elicited axonal regeneration involves direct activation of the dual leucine zipper kinase DLK. Elife 5. doi:10.7554/eLife.14048

      Huntwork-Rodriguez S, Wang B, Watkins T, Ghosh AS, Pozniak CD, Bustos D, Newton K, Kirkpatrick DS, Lewcock JW. 2013. JNK-mediated phosphorylation of DLK suppresses its ubiquitination to promote neuronal apoptosis. J Cell Biol 202:747–763.

      Katz JS, Rothstein JD, Cudkowicz ME, Genge A, Oskarsson B, Hains AB, Chen C, Galanter J, Burgess BL, Cho W, Kerchner GA, Yeh FL, Ghosh AS, Cheeti S, Brooks L, Honigberg L, Couch JA, Rothenberg ME, Brunstein F, Sharma KR, van den Berg L, Berry JD, Glass JD. 2022. A Phase 1 study of GDC-0134, a dual leucine zipper kinase inhibitor, in ALS. Ann Clin Transl Neurol 9:50–66.

      Klinedinst S, Wang X, Xiong X, Haenfler JM, Collins CA. 2013. Independent pathways downstream of the Wnd/DLK MAPKKK regulate synaptic structure, axonal transport, and injury signaling. J Neurosci 33:12764–12778.

      Le K, Soth MJ, Cross JB, Liu G, Ray WJ, Ma J, Goodwani SG, Acton PJ, Buggia-Prevot V, Akkermans O, Barker J, Conner ML, Jiang Y, Liu Z, McEwan P, Warner-Schmidt J, Xu A, Zebisch M, Heijnen CJ, Abrahams B, Jones P. 2023. Discovery of IACS-52825, a potent and selective DLK inhibitor for treatment of chemotherapy-induced peripheral neuropathy. J Med Chem 66:9954–9971.

      Le Pichon CE, Meilandt WJ, Dominguez S, Solanoy H, Lin H, Ngu H, Gogineni A, Sengupta Ghosh A, Jiang Z, Lee S-H, Maloney J, Gandham VD, Pozniak CD, Wang B, Lee S, Siu M, Patel S, Modrusan Z, Liu X, Rudhard Y, Baca M, Gustafson A, Kaminker J, Carano RAD, Huang EJ, Foreman O, Weimer R, Scearce-Levie K, Lewcock JW. 2017. Loss of dual leucine zipper kinase signaling is protective in animal models of neurodegenerative disease. Sci Transl Med 9. doi:10.1126/scitranslmed.aag0394

      Li J, Zhang YV, Asghari Adib E, Stanchev DT, Xiong X, Klinedinst S, Soppina P, Jahn TR, Hume RI, Rasse TM, Collins CA. 2017. Restraint of presynaptic protein levels by Wnd/DLK signaling mediates synaptic defects associated with the kinesin-3 motor Unc-104. Elife 6. doi:10.7554/eLife.24271

      Miller BR, Press C, Daniels RW, Sasaki Y, Milbrandt J, DiAntonio A. 2009. A dual leucine kinase-dependent axon self-destruction program promotes Wallerian degeneration. Nat Neurosci 12:387–389.

      Nihalani D, Merritt S, Holzman LB. 2000. Identification of structural and functional domains in mixed lineage kinase dual leucine zipper-bearing kinase required for complex formation and stress-activated protein kinase activation. J Biol Chem 275:7273–7279.

      Russo A, DiAntonio A. 2019. Wnd/DLK is a critical target of FMRP responsible for neurodevelopmental and behavior defects in the Drosophila model of fragile X syndrome. Cell Rep 28:2581–2593.e5.

      Shin JE, Cho Y, Beirowski B, Milbrandt J, Cavalli V, DiAntonio A. 2012. Dual leucine zipper kinase is required for retrograde injury signaling and axonal regeneration. Neuron 74:1015– 1022.

      Siu M, Sengupta Ghosh A, Lewcock JW. 2018. Dual Leucine Zipper Kinase Inhibitors for the Treatment of Neurodegeneration. J Med Chem 61:8078–8087.

      Valakh V, Walker LJ, Skeath JB, DiAntonio A. 2013. Loss of the spectraplakin short stop activates the DLK injury response pathway in Drosophila. J Neurosci 33:17863–17873.

      Verma S, Khurana S, Vats A, Sahu B, Ganguly NK, Chakraborti P, Gourie-Devi M, Taneja V. 2022. Neuromuscular junction dysfunction in amyotrophic lateral sclerosis. Mol Neurobiol 59:1502–1527.

      Wlaschin JJ, Donahue C, Gluski J, Osborne JF, Ramos LM, Silberberg H, Le Pichon CE. 2023. Promoting regeneration while blocking cell death preserves motor neuron function in a model of ALS. Brain 146:2016–2028.

      Xiong X, Collins CA. 2012. A conditioning lesion protects axons from degeneration via the Wallenda/DLK MAP kinase signaling cascade. J Neurosci 32:610–615.

      Xiong X, Hao Y, Sun K, Li J, Li X, Mishra B, Soppina P, Wu C, Hume RI, Collins CA. 2012. The Highwire ubiquitin ligase promotes axonal degeneration by tuning levels of Nmnat protein. PLoS Biol 10:e1001440.

      Xiong X, Wang X, Ewanek R, Bhat P, Diantonio A, Collins CA. 2010. Protein turnover of the Wallenda/DLK kinase regulates a retrograde response to axonal injury. J Cell Biol 191:211– 223.

    1. Author response:

      The following is the authors’ response to the original reviews.

      Public reviews:

      We thank the three reviewers for the constructive suggestions made in the Public Reviews and the Recommendations to Authors. We have now addressed these comments in a revised manuscript as follows:

      (1) We will revise the text according to the reviewer suggestions and provide more detailed explanations in results and discussion.

      (2) We have uploaded higher resolution images of several figures (resolution had been reduced to achieve lower file sizes) to address the comment regarding “data quality”.

      (3) We have included additional data on eCLIP control experiments in the supplementary figures.

      (4) We have performed additional replications of the western blot analysis for Rbm20 knock-out animals and provided the data in a new Figure.

      Recommendations for the authors:

      Reviewer #1:

      (1) The study is missing CLIP-seq data from control mice that do not express HA, or HA-knocked into a safe-harbor locus. This is important because there is plenty of background HA staining in Figure S2B, in wild-type mice. Including this control would allow subsequent peak calling to distinguish between non-specific HA peaks and RBM20 specific peaks.

      The biochemical conditions used in immunostaining are much less stringent than the buffers employed for immunoprecipitation in the eCLIP protocol. Thus, background staining is not a an informative reference to assess specificity of CLIP isolations. In previous experiments, we confirmed very low background with the anti-HA antibodies in our eCLIP protocol. In the present study, we used a “no-crosslinking control” where samples were not irradiated with UV light. This negative control is now included in Supplementary Figure 4.

      (2) The GO analysis performed to infer synapse-gene specific regulation would be more useful if the authors would discuss specific genes that are represented within these terms and have been shown to be associated with neuronal function.

      We have now noted several synapse-related genes identified in the text.

      (3) Some figures would benefit from larger size and higher resolution including Fig S1, S3.

      We had previously embedded Figures as png files in the text document. In the revised version we uploaded the figures in higher resolution as individual jpeg files. Moreover, we now split Figure S1 into two separate supplementary figures (new Fig.S2) which allowed for enlarging the size of panels. We further enlarged the panels of (former) Fig.S3 (now Fig.S4).

      (4) RBP genes in Figure 1A x-axis are all lowercase. This is not standard mouse gene nomenclature.

      We corrected this.

      (5) Typo in Figure S4F rightmost panel y-axis - 'Length' is misspelled.

      We corrected this.

      Reviewer #2:

      Minor points:

      - Shortly explain DESEQ2 (p4)

      We now added a brief note and corresponding reference in the main text of the manuscript.

      - Is RBM20 a shuttling protein? Any detection in the cytoplasm?

      Our immunostainings for the endogenous RBM20 in heart and olfactory bulb cells suggest that the vast majority of wild-type RBM20 is localized to the nucleus. Previous work on RBM20 disease mutants suggest that pathological forms can accumulate in the cytoplasm. However, with the sensitivity of our detection we did not obtain evidence for a significant cytoplasmic pool in neurons. This does not exclude the possibility that the protein is shuttling – but assessing this would require different types of experiments.

      Reviewer #3:

      (1) Figure 1C: It is shown that some of the RBM20 staining do not colocalize with PV. This observation requires further explanation and discussion to clarify the significance.

      As seen in the fluorescent in situ hybridizations as well as the RiboTRap purifications (Fig.S1C,D), we observe mRNA RBM20 expression not only in parvalbumin-positive interneurons but also somatostatin-positive cells of the neocortex. Accordingly, some RBM20-positive cells do not express parvalbumin. We now clarified this in the text.

      Additionally, in Figure S1C, the resolution of the image is low, making it difficult to conclusively determine whether RBM20 RNA is localized in the nucleus. A high-resolution image would be beneficial to address this ambiguity.

      The Rbm20 mRNA is localized in the nucleus and cytoplasm. We have now split Figure S1 into two separate figures to enlarge the panels for S1C and make this more visible. Moreover, we uploaded higher resolution figure files.

      (2) Figure 1E: The molecular weight of RBM20 is approximately 135 kDa, yet there is a band near 135 kDa in the KO heart. How do the authors determine that the 150 kDa band represents RBM20 rather than the 135 kDa band? The authors may consider increasing the sample size to confirm whether the smaller band consistently appears across all KO heart tissues.

      We appreciate that in this higher molecular weight range, the indicated weight markers may not be entirely accurate. We used a validated knock-out mouse line to identify the appropriate RBM20 protein band. As the 150kDa band was reproducibly lost in the knock-out tissue in the brain and the heart tissue whereas the fainter band of lower mobility remained we concluded that on our gel system RBM20 protein has an apparent molecular weight of 150 kDa. This is further supported by the fact that also the endogenously tagged RBM20 protein has a similar mobility.

      As suggested by the reviewer, we now re-ran Western blots from multiple wild-type and corresponding knock-out tissues. This further confirmed the migration of the protein and loss of the 150 kDa band in the mutant mice (new Figure 1E).

      (3) Figure 2A: A higher-resolution image is recommended. Prior studies on RBM20 mutation knock-in mice suggest that when RBM20 localizes to the cytoplasm, it promotes molecular condensate formation. This seems to be the case in Figure 2A; however, the low image quality makes it difficult to see these molecular condensates.

      Figure2A shows endogenous RBM20 (not the epitope-tagged protein in the knock-in mice). The vast majority of the protein is localized in the nucleus rather than the cytoplasm. We are a bit uncertain what “condensates” the reviewer refers to. In the heart, we indeed see accumulations of RBM20 in foci (as described previously in the literature). As judged by their location within the DAPI-positive area, these foci are in the nucleus. By contrast, in the olfactory bulb neurons (which express lower levels of RBM20) we do not see a comparable concentration in nuclear foci but rather broad and diffuse staining. This is consistent with the hypothesis that the nuclear foci depend on the expression of highly expressed target transcripts such as titin. To better visualize this, we now uploaded files with higher resolution for the revised manuscript.

      (4) Figure 4D: This figure is not cited in the main text and should be referenced appropriately.

      We corrected this.

      (5) Page 5: The sentence "Finally, introns bound by RBM20 were significantly longer than expected by chance as assed..." contains a typo. The word "assed" should be corrected to "assessed".

      We corrected this.

      (6) Functional data: The study would benefit from functional experiments to elucidate the physiological role of RBM20 in PV neurons. For instance, since RBM20 regulates calcium-handling genes in neurons, does its absence impair calcium signaling in PV neurons? Additionally, given that RBM20 is involved in synaptic regulation, could RBM20 KO disrupt synaptic function? While it may not be feasible to address all these questions, providing some functional data would greatly enhance the overall significance of the study.

      We completely agree with the reviewer that this would greatly advance the study and the lack of data on cellular functions is the most significant limitation of this work. We attempted to obtain insights into cellular function through the structural investigations (Fig.S5). We had obtained some data on a behavioral phenotype in the mice which indicates that knock-out in vGLUT2 neurons precipitates alterations in behavior. However, due to conditions in our animal facility (emissions from construction) we struggled to solidify/confirm this data. Thus, in the interest of sharing the existing data in a timely manner we felt that more elaborate functional studies on synaptic transmission or calcium imaging should better be performed in a separate effort.

    1. Author response:

      Reviewer #1 (Public review):

      Summary:

      The aim of this paper is to develop a simple method to quantify fluctuations in the partitioning of cellular elements. In particular, they propose a flow-cytometry-based method coupled with a simple mathematical theory as an alternative to conventional imaging-based approaches.

      Strengths:

      The approach they develop is simple to understand and its use with flow-cytometry measurements is clearly explained. Understanding how the fluctuations in the cytoplasm partition vary for different kinds of cells is particularly interesting.

      Weaknesses:

      The theory only considers fluctuations due to cellular division events. This seems a large weakness because it is well known that fluctuations in cellular components are largely affected by various intrinsic and extrinsic sources of noise and only under particular conditions does partitioning noise become the dominant source of noise.

      We thank the Reviewer for her/his evaluation of our manuscript. The point raised is indeed a crucial one. In a cell division cycle, there are at least three distinct sources of noise that affect component numbers [1] : 

      (1) Gene expression and degradation, which determine component numbers fluctuations during cell growth.

      (2) Variability in cell division time, which depending on the underlying model may or may not be a function of protein level and gene expression.

      (3) Noise in the partitioning/inheritance of components between mother and daughter cells.

      Our approach specifically addresses the latter, with the goal of providing a quantitative measure of this noise source. For this reason, in the present work, we consider homogeneous cancer cell populations that could be considered to be stationary from a population point-of-view. By tracking the time evolution of the distribution of tagged components via live fluorescent markers, we aim at isolating partitioning noise effects. However, as noted by the Reviewer, other sources of noise are present, and depending on the considered system the relative contributions of the different sources may change. Thus, we agree that a quantification of the effect of the various noise sources on the accuracy of our measurements will improve the reliability of our method. 

      In this respect, assuming independence between noise sources, we reasoned that variability in cell cycle length would affect the timing of population emergence but not the intrinsic properties of those populations (e.g., Gaussian variance). To test this hypothesis, we conducted a preliminary set of simulations in which cell division times were drawn from an Erlang distribution (mean = 18 h, k=4k = 4k=4). The results, showing the behavior of the mean and variance of the component distributions across generations, are presented in Author response image 1. Under the assumption of independence between different noise sources, no significant effects were observed. Next, we plan to quantify the accuracy of our measurements in the presence of cross-talks between the various noise sources. As suggested, we will update the manuscript to include a more complete discussion on this topic and an evaluation of our model’s stability.

      Author response image 1.

      Variance and mean of the distribution of fluorescence intensity as a function of the generation for a time course dynamic with cell-cycle length variability. We repeated the same simulations as the one in figure 1 of the manuscript, but introducing a variable division time for each cell. The division time of each cell is extracted from an Erlang distribution (mean = 18 h and k = 4). As it is possible to observe in the plots, the results of our theoretical framework are not affected from the introduction of this variability. Hence, the Gaussian Mixture Model is still able to give the correct results  even in a noisy environment.

      (1) Soltani, Mohammad, et al. "Intercellular variability in protein levels from stochastic expression and noisy cell cycle processes." PLoS computational biology 12.8 (2016): e1004972.

      Reviewer #2 (Public review):

      Summary:

      The authors present a combined experimental and theoretical workflow to study partitioning noise arising during cell division. Such quantifications usually require time-lapse experiments, which are limited in throughput. To bypass these limitations, the authors propose to use flow-cytometry measurements instead and analyse them using a theoretical model of partitioning noise. The problem considered by the authors is relevant and the idea to use statistical models in combination with flow cytometry to boost statistical power is elegant. The authors demonstrate their approach using experimental flow cytometry measurements and validate their results using time-lapse microscopy. However, while I appreciate the overall goal and motivation of this work, I was not entirely convinced by the strength of this contribution. The approach focuses on a quite specific case, where the dynamics of the labelled component depend purely on partitioning. As such it seems incompatible with studying the partitioning noise of endogenous components that exhibit production/turnover. The description of the methods was partly hard to follow and should be improved. In addition, I have several technical comments, which I hope will be helpful to the authors.

      We are grateful to the Reviewer for her/his comments. Indeed, both partitioning and production turnover noise are in general fundamental processes. At present the only way to consider them together are time-consuming and costly transfection/microscopy/tracking experiments. In this work, we aimed at developing a method to effectively pinpoint the first component, i.e. partitioning noise thus we opted to separate the two different noise sources.  

      Below, we provide a point-by-point response that we hope will clarify all raised concerns.

      Comments:

      (1) In the theoretical model, copy numbers are considered to be conserved across generations. As a consequence, concentrations will decrease over generations due to dilution. While this consideration seems plausible for the considered experimental system, it seems incompatible with components that exhibit production and turnover dynamics. I am therefore wondering about the applicability/scope of the presented approach and to what extent it can be used to study partitioning noise for endogenous components. As presented, the approach seems to be limited to a fairly small class of experiments/situations.

      We see the Reviewer's point. Indeed, we are proposing a high-throughput and robust procedure to measure the partitioning/inheritance noise of cell components through flow cytometry time courses. By using live-cell staining of cellular compounds, we can track the effect of partitioning noise on fluorescence intensity distribution across successive generations. This specific procedure is purposely optimized to isolate partitioning noise from other sources and, as it is, can not track endogenous components or dyes that require fixation. While this certainly poses limits to the proposed approach, there are numerous contexts in which our methodology could be used to explore the role of asymmetric inheritance. Among others, (i) investigating how specific organelles are differentially partitioned and how this influences cellular behavior could provide deeper insights into fundamental biological processes: asymmetric segregation of organelles is a key factor in cell differentiation, aging, and stress response. During cell division, organelles such as mitochondria, the endoplasmic reticulum, lysosomes, peroxisomes, and centrosomes can be unequally distributed between daughter cells, leading to functional differences that influence their fate. For instance, Kajaitso et al. [1] proposed that asymmetric division of mitochondria in stem cells is associated with the retention of stemness traits in one daughter cell and differentiation in the other. As organisms age, stem cells accumulate damage, and to prevent exhaustion and compromised tissue function, cells may use asymmetric inheritance to segregate older or damaged subcellular components into one daughter cell. (ii) Asymmetric division has also been linked to therapeutic resistance in Cancer Stem Cells  [2]. Although the functional consequences are not yet fully determined, the asymmetric inheritance of mitochondria is recognized as playing a pivotal role [3]. Another potential application of our methodology may be (iii) the inheritance of lysosomes, which, together with mitochondria, appears to play a crucial role in determining the fate of human blood stem cells [4]. Furthermore, similar to studies conducted on liquid tumors [5][6], our approach could be extended to investigate cell growth dynamics and the origins of cell size homeostasis in adherent cells [7][8][9].  The aforementioned cases of study can be readily addressed using our approach that in general is applicable whenever live-cell dyes can be used. We will add a discussion of the strengths and limitations of the method in the Discussion section of the revised version of the manuscript. 

      (1) Katajisto, Pekka, et al. "Asymmetric apportioning of aged mitochondria between daughter cells is required for stemness." Science 348.6232 (2015): 340-343.

      (2) Hitomi, Masahiro, et al. "Asymmetric cell division promotes therapeutic resistance in glioblastoma stem cells." JCI insight 6.3 (2021): e130510.

      (3) García-Heredia, José Manuel, and Amancio Carnero. "Role of mitochondria in cancer stem cell resistance." Cells 9.7 (2020): 1693.

      (4) Loeffler, Dirk, et al. "Asymmetric organelle inheritance predicts human blood stem cell fate." Blood, The Journal of the American Society of Hematology 139.13 (2022): 2011-2023.

      (5) Miotto, Mattia, et al. "Determining cancer cells division strategy." arXiv preprint arXiv:2306.10905 (2023).

      (6) Miotto, Mattia, et al. "A size-dependent division strategy accounts for leukemia cell size heterogeneity." Communications Physics 7.1 (2024): 248.

      (7) Kussell, Edo, and Stanislas Leibler. "Phenotypic diversity, population growth, and information in fluctuating environments." Science 309.5743 (2005): 2075-2078.

      (8) McGranahan, Nicholas, and Charles Swanton. "Clonal heterogeneity and tumor evolution: past, present, and the future." Cell 168.4 (2017): 613-628.

      (9) De Martino, Andrea, Thomas Gueudré, and Mattia Miotto. "Exploration-exploitation tradeoffs dictate the optimal distributions of phenotypes for populations subject to fitness fluctuations." Physical Review E 99.1 (2019): 012417.

      (2) Similar to the previous comment, I am wondering what would happen in situations where the generations could not be as clearly identified as in the presented experimental system (e.g., due to variability in cell-cycle length/stage). In this case, it seems to be challenging to identify generations using a Gaussian Mixture Model. Can the authors comment on how to deal with such situations? In the abstract, the authors motivate their work by arguing that detecting cell divisions from microscopy is difficult, but doesn't their flow cytometry-based approach have a similar problem?

      The point raised is an important one, as it highlights the fundamental role of the gating strategy. The ability to identify the distribution of different generations using the Gaussian Mixture Model (GMM) strongly depends on the degree of overlap between distributions. The more the distributions overlap, the less capable we are of accurately separating them.

      The extent of overlap is influenced by the coefficients of variation (CV) of both the partitioning distribution function and the initial component distribution. Specifically, the component distribution at time t results from the convolution of the component distribution itself at time t−1 and the partitioning distribution function. Therefore, starting with a narrow initial component distribution allows for better separation of the generation peaks. The balance between partitioning asymmetry and the width of the initial component distribution is thus crucial.

      As shown in Author response image 2, increasing the CV of either distribution reduces the ability to distinguish between different generations.

      Author response image 2.

      Components distribution at varying CVs of initial components and partitioning distributions. Starting from a condition in which both division asymmetry and wideness of the initial components distribution are low and different generations are clearly separable, increasing either the CVs leads to distribution mixing and greater reconstruction difficulty.

      However, the variance of the initial distribution cannot be reduced arbitrarily. While selecting a narrow distribution facilitates a better reconstruction of the distributions, it simultaneously limits the number of cells available for the experiment. Therefore, for components exhibiting a high level of asymmetry, further narrowing of the initial distribution becomes experimentally impractical.

      In such cases, an approach previously tested on liquid tumors [1] involves applying the Gaussian Mixture Model (GMM) in two dimensions by co-staining another cellular component with lower division asymmetry.

      Regarding time-lapse fluorescence microscopy, the main challenge lies not in disentangling the interplay of different noise sources, but rather in obtaining sufficient statistical power from experimental data. While microscopy provides detailed insights into the division process and component partitioning, its low throughput limits large-scale statistical analyses. Current segmentation algorithms still perform poorly in crowded environments and with complex cell shapes, requiring a substantial portion of the image analysis pipeline to be performed manually, a process that is time-consuming and difficult to scale. In contrast, our cytometry-based approach bypasses this analysis bottleneck, as it enables a direct population-wide measurement of the system's evolution. We will provide a detailed discussion on these aspects in the revised version of the manuscript.

      (1) Peruzzi, Giovanna, et al. "Asymmetric binomial statistics explains organelle partitioning variance in cancer cell proliferation." Communications Physics 4.1 (2021): 188.

      (3) I could not find any formal definition of division asymmetry. Since this is the most important quantity of this paper, it should be defined clearly.

      We thank the Reviewer for the note. With division asymmetry we refer to a quantity that reflects how similar two daughter cells are likely to be in terms of inherited components after a division process. We opted to measure it via the coefficient of variation (root squared variance divided by the mean) of the partitioning fraction distribution. We will amend this lack of definition in the reviewed version of the manuscript. 

      (4) The description of the model is unclear/imprecise in several parts. For instance, it seems to me that the index "i" does not really refer to a cell in the population, but rather a subpopulation of cells that has undergone a certain number of divisions. Furthermore, why is the argument of Equation 11 suddenly the fraction f as opposed to the component number? I strongly recommend carefully rewriting and streamlining the model description and clearly defining all quantities and how they relate to each other.

      We are amending the text carefully to avoid double naming of variables and clarifying each computation passage. In equation 11 the variable f refers to the fluorescent intensity, but the notation will be changed to increase clarity. 

      (5) Similarly, I was not able to follow the logic of Section D. I recommend carefully rewriting this section to make the rationale, logic, and conclusions clear to the reader.

      We will update the manuscript clarifying the scope of section D and its results. In brief, Section A presents a general model to derive the variance of the partitioning distribution from flow cytometry time-course data without making any assumptions about the shape of the distribution itself. In Section D, our goal is to interpret the origin of asymmetry and propose a possible form for the partitioning distribution. Since the dyes used bind non-specifically to cytoplasmic amines, the tagged proteins are expected to be uniformly distributed throughout the cytoplasm and present in large numbers. Given these assumptions the least complex model for division follows the binomial distribution, with a parameter that measures the bias in the process. Therefore, we performed a similar computation to that in Section A, which allows us to estimate not only the variance but also the degree of biased asymmetry. Finally, we fitted the data to this new model and proposed an experimental interpretation of the results.

      (6) Much theoretical work has been done recently to couple cell-cycle variability to intracellular dynamics. While the authors neglect the latter for simplicity, it would be important to further discuss these approaches and why their simplified model is suitable for their particular experiments.

      We agree with the Reviewer, we will discuss this aspect in the revised version of the manuscript.

      (7) In the discussion the authors note that the microscopy-based estimates may lead to an overestimation of the fluctuations due to limited statistics. I could not follow that reasoning. Due to the gating in the flow cytometry measurements, I could imagine that the resulting populations are more stringently selected as compared to microscopy. Could that also be an explanation? More generally, it would be interesting to see how robust the results are in terms of different gating diameters.

      The Reviewer is right on the importance of the sorting procedure. As already discussed in a previous point, the gating strategy we employed plays a fundamental role: it reduces the overlap of fluorescence distributions as generations progress, enables the selection of an initial distribution distinct from the fluorescence background, allowing for longer tracking of proliferation, and synchronizes the initial population. The narrower the initial distribution, the more separated the peaks of different generations will be. However, this also results in a smaller number of cells available for the experiment, requiring a careful balance between precision and experimental feasibility. A similar procedure, although it would certainly limit the estimation error, would be impracticable In the case of microscopy. Indeed, the primary limitation and source of error is the number of recorded events. Our pipeline allowed us to track on the order of hundreds of division dynamics, but the analysis time scales non-linearly with the number of events. Significantly increasing the dataset would have been extremely time-consuming. Reducing the analysis to cells with similar fluorescence, although theoretically true, would have reduced the statistics to a level where the sampling error would drastically dominate the measure. Moreover, different experiments would have been hardly comparable, since different fluorescences could map in equally sized cells. In light of these factors, we expect higher CV for the microscopy measure than for flow cytometry’s ones.  In the plots below, we show the behaviour of the mean and the standard deviation of N numbers sampled from a gaussian distribution N(0,1) as a function of the sampling number N. The higher is N the closer the sampled distribution will be to the true one. The region in the hundreds of samples is still very noisy, but to do much better we would have to reach the order of thousands. We will add a discussion on these aspects in the reviewed version of the manuscript. 

      Author response image 3.

      Standard deviation and mean value of a distribution of points sampled from a Gaussian distribution with mean 0 and standard deviation 1,  versus the number of samples, N. Increasing N leads to a closer approximation of the expected values. In orange is highlighted the Microscopy Working Region (Microscopy WR) which corresponds to the number of samples we are able to reach with microscopy experiments. In yellow the region we would have to reach to lower the estimating error, which is although very expensive in terms of analysis time.

      (8) It would be helpful to show flow cytometry plots including the identified subpopulations for all cell lines, currently, they are shown only for HCT116 cells. More generally, very little raw data is shown.

      We will provide the requested plots for the other cell lines together with additional raw data coming from simulations in the Supplementary Material. 

      (9) The title of the manuscript could be tailored more to the considered problem. At the moment it is very generic.

      We see the Reviewer point. The proposed title aims at conveying the wide applicability of the presented approach, which ultimately allows for the assessment of the levels of fluctuations in the levels of the cellular components at division. This in turn reflects the asymmetricity in the division.

    1. Author response:

      On the control of taxonomic versus thematic information. Both reviewers had questions about the relationship between the focus of the meta-analysis, the control of responses based on taxonomic versus thematic relationships, and the simulation. Both the model and the meta-analysis focus on the same mechanism, the controlled selection of task-appropriate features. In the case of the meta-analysis, this was the features and associations needed to identify the taxonomic or thematic relationships. As reviewer 1 notes, one possibility is that these kinds of structures are represented in distinct cortical regions. For instance, Mirman, Schwartz and colleagues have suggested that temporoparietal regions may preferentially support thematic knowledge while temporal regions may preferentially support taxonomic knowledge. Alternatively, they may be supported by different features instantiated within the same regions.  However, whether taxonomic and thematic relationships require access to features in different regions or not, is not crucial to the conclusions of this paper. The simulations used here happen to select features based on their inclusion in a particular sensory modality, yet they could learn to select any combination of features. Indeed, prior simulations using the Jackson et al., (2021) model show that the functional impact on learning of “deep” conceptual representations (together with controlled behaviours) is the same regardless of whether the potentiated features are localised within one spoke or distributed across spokes. Thus, the key results regarding the acquisition of semantic knowledge before the maturation of control in the current work should hold regardless of whether knowledge of taxonomic and thematic relations is localised to different anatomical regions.

      On model size and scalability. Both reviewers noted the relatively small size of the model and wondered about implications for ecological validity of the simulations and scalability to larger, noisier, and potentially more systematically structured training environments. We agree this is an important direction for future research, but one that faces two nontrivial challenges. First, reviewer 1 notes that, whereas our model environment employs orthogonal structures across spokes and for the cross-modal features, perceptual structure may be better-aligned with conceptual structure for real-world experience. While we appreciate the intuition, its validity depends to a key extent on how visual information about objects is encoded. Conceptual structure is certainly not apparent, for instance, in the distance between bitmap images of objects, nor the overlap of simple feature-extraction algorithms (such as edge detection or Fourier decomposition, etc). Even in this age of deep vision models, it remains unclear how the visual system extracts and discerns perceptual similarity from retinal input (see e.g. Mukherjee & Rogers, 2025). Most successful contemporary models train neural networks to assign visual images to semantic categories, suggesting that the visual features the model learns, and thus the perceptual similarities it represents, depend on learning to generate semantic information. Therefore, it is not clear whether the similarity that people perceive amongst instances of the same class is natively apparent in the bottom-up visual input, or whether it depends on semantic/cross-modal learning and representation. It should also be noted that within our training environment, there are features in each modality that are predictive of features in other modalities, as well as some that are only predictive of features within this modality. Thus, the full cross-modality conceptual structure is not orthogonal to the information available in each sensory domain, instead there is a relationship between surface and multimodal similarity in the dataset as in the real-world environment. In general, one virtue of the small-scale modelling endeavour in the current work is that we can be very explicit about the nature of the structure apparent within and across spokes.

      The second non-trivial issue concerns the nature of the mechanisms that allow for context-sensitive responding in large-scale language/vision models such as GPT 4. Such models are trained on web-scale language and vision and provide a means of simulating controlled behaviour with realistic stimuli, so might seem to provide a means of assessing scalability of current neuro-cognitive models. Large language/vision models rely, however, on transformer architectures whose relationship to hypothesized mechanisms of control in the mind and brain is unclear. In transformers, context-sensitive responding depends upon “attention” mechanisms that are fully distributed and integrated throughout the entire system—there is no distinction between control, representation, and short-term memory in the architecture. As a consequence, it is very difficult to understand why a model behaves the way it does, or to relate patterns of behaviour to hypothesised mechanisms in the human mind/brain. Yet transformers are currently the only models capable of exhibiting context-sensitive patterns of responding based on both language and vision. Scaling up neuro-cognitive models will require developing alternative architectures that preserve the critical hypothesised distinctions between representation and control while retaining the ability of transformers to learn from large-scale ecologically realistic corpora of language and images. In the meantime, small-scale simulations like those reported here provide some critical insights into aspects of architecture and maturation that may aid in this endeavour.

      On including a response layer. Reviewer 1 notes that our model does not separately simulate response-generation and the selective activation of relevant feature representations. We agree that there are interesting questions about how feature-potentiation and response-generation relate to one another, and that incorporating response selection in the current model would significantly complicate the analysis. The general idea that control potentiates/suppresses task-relevant feature representations in addition to simply promoting the correct response derives from classic work by Martin and others (e.g., Martin et al., 1995) showing that, for instance, regions involved in colour perception activate more strongly in tasks requiring retrieval of colour than tasks involving retrieval of action and vice versa—results consistent with the model training/testing procedure in the current work. In general, it may be counterproductive to become aware of aspects of a concept that would be irrelevant, or even actively unhelpful in making a response, suggesting guided activation is a necessary precursor to response selection (Botvinick & Cohen, 2014). Here, we focus on this important feature potentiation step.

      On the novelty of the meta-analysis. Reviewer 2 suggests the results of the meta-analysis were already known and provided motivation for the simulation. However, an important contribution of the current work is the observation that, in fact, there is little prior work on the development of semantic control. The widely known developmental delay in domain-general executive control, which did indeed motivate the study, is exclusively based on tasks requiring very different forms of executive control. Many of these involve no meaningful stimuli or require the child to completely inhibit a practiced response and generate an opposite or completely arbitrary responses, instead of requiring the child to use context to select among two or more meaningful behaviours that are equally valid in different contexts (see the introduction to Part 2). This observation, coupled with recent evidence that semantic control relies on dedicated and partially non-overlapping neural systems to executive function, illustrates the utility of the current meta-analysis: delineating the developmental trajectory of semantic control requires a task in which control is applied to the context-appropriate retrieval and manipulation of semantic knowledge, such as the triadic matching task. Moreover, the results show that semantic control, while arising later than semantic representation, nevertheless begins to mature earlier (around 2.5 years) than typical estimations of domain-general executive control (around 4). Thus, the meta-analysis contributes to our understanding of cognitive development while also testing a key prediction of the model.

    1. Author response:

      Public Reviews:

      Reviewer #1 (Public review):

      Summary:

      Pavel et al. analyzed a cohort of atrial fibrillation (AF) patients from the University of

      Illinois at Chicago, identifying TTN truncating variants (TTNtvs) and TTN missense variants (TTNmvs). They reported a rare TTN missense variant (T32756I) associated with adverse clinical outcomes in AF patients. To investigate its functional significance, the authors modeled the TTN-T32756I variant using human induced pluripotent stem cell-derived atrial cardiomyocytes (iPSC-aCMs). They demonstrated that mutant cells exhibit aberrant contractility, increased activity of the cardiac potassium channel KCNQ1 (Kv7.1), and dysregulated calcium homeostasis. Interestingly, these effects occurred without compromising sarcomeric integrity. The study further identified increased binding of the titin-binding protein Four-and-a-Half Lim domains 2 (FHL2) with KCNQ1 and its modulatory subunit KCNE1 in the TTN-T32756I iPSCaCMs.

      Strengths:

      This work has translational potential, suggesting that targeting KCNQ1 or FHL2 could represent a novel therapeutic strategy for improving cardiac function. The findings may also have broader implications for treating patients with rare, disease-causing variants in sarcomeric proteins and underscore the importance of integrating genomic analysis with experimental evidence to advance AF research and precision medicine.

      Weaknesses

      (1) Variant Identification: It is unclear how the TTN missense variant (T32756I) was identified using REVEL, as none of the patients' parents reportedly carried the mutation or exhibited AF symptoms. Are there other TTN variants identified in the three patients carrying TTN-T32756I? Clarification on this point is necessary.  

      We thank the reviewer for their insightful comment. Our study identified deleterious missense variants using a stringent REVEL score threshold of ≥0.7; however, variants with a REVEL score above 0.5 are generally considered potentially pathogenic (Ioannidis, Nilah M., et al., Am J Human Genetics 2016; 9.4: 877-885). The TTN-T32756I variant (REVEL Score: 0.58758, Supplementary Table 1) was prioritized due to its occurrence in multiple unrelated individuals within our clinical AF cohort, despite no reported family history of AF in affected individuals. While no parental inheritance was observed, the possibility of a de novo origin cannot be excluded. Furthermore, this variant is located within a region overlapping a deletion mutation recently shown to cause AF in a zebrafish model (Jiang et al., iScience, 2024;27(7):110395) supporting its potential pathogenicity. Notably, the affected individuals did not carry additional loss-of-function TTN variants. We will clarify these points in the revised manuscript.

      (2) Patient-Specific iPSC Lines: Since the TTN-T32756I variant was modeled using only one healthy iPSC line, it is unclear whether patient-specific iPSC-derived atrial cardiomyocytes would exhibit similar AF-related phenotypes. This limitation should be addressed.

      We acknowledge the reviewer’s concern that patient-specific iPSC lines could further validate our findings. However, due to the patients' unavailability of peripheral blood mononuclear cells (PBMCs), we utilized a healthy iPSC line and introduced the TTN-T32756I variant using CRISPR/Cas9 genome editing. This approach ensures an isogenic background, thereby minimizing genetic variability and providing a controlled system to study the direct effects of the mutation. We will acknowledge this limitation in the revised manuscript.

      (3) Hypertension as a Confounding Factor: The three patients carrying TTN-T32756I also have hypertension. Could the hypertension associated with this variant contribute secondarily to AF? The authors should discuss or rule out this possibility.

      We agree that hypertension is a common comorbidity in patients with AF and could contribute to disease progression. However, all three individuals carrying TTN-T32756I exhibited early-onset AF (onset before 66 years), with one case occurring as early as 36 years. This suggests a potential two-hit mechanism, where genetic predisposition and comorbidities influence disease risk. Importantly, our iPSC model isolates the genetic effects of TTN-T32756I from other factors, supporting a direct pathogenic role. We will explicitly discuss this in the revised manuscript.

      (4) FHL2 and KCNQ1-KCNE1 Interaction: Immunostaining data demonstrating the colocalization of FHL2 with the KCNQ1-KCNE1 (MinK) complex in TTN-T32756I iPSC-aCMs are needed to strengthen the mechanistic findings.

      We appreciate the reviewer’s suggestion and agree that additional immunostaining data would strengthen the evidence for FHL2 colocalization with the KCNQ1-KCNE1 complex in TTN-T32756I iPSC-aCMs. We will work on obtaining these additional data to validate our mechanistic findings further.

      (5) Functional Characterization of FHL2-KCNQ1-KCNE1 Interaction: To further validate the proposed mechanism, additional functional assays are necessary to characterize the interaction between FHL2 and the KCNQ1-KCNE1 complex in TTN-T32756I iPSC-aCMs.

      We agree with the reviewer that additional functional assays would further validate the proposed mechanism. We will perform contractility and electrophysiological experiments, such as multielectrode array (MEA) assays, to characterize better the interaction between FHL2 and the KCNQ1-KCNE1 complex in TTN-T32756I iPSC-aCMs.

      Reviewer #2 (Public review):

      Summary:

      The authors present data from a single-center cohort of African-American and Hispanic/Latinx individuals with atrial fibrillation (AF). This study provides insight into the incidences and clinical impact of missense variants in this population in the Titin (TTN) gene. In addition, the authors identified a single amino acid TTN missense variant (TTN-T32756I) that was further studied using human induced pluripotent stem cell-derived atrial cardiomyocytes (iPSC-aCMs). These studies demonstrated that the Four-and-a-Half Lim domains 2 (FHL2) has increased binding with KCNQ1 and its modulatory subunit KCNE1 in the TTN-T32756I-iPSCaCMs, enhancing the slow delayed rectifier potassium current (Iks) and is a potential mechanism for atrial fibrillation. Finally, the authors demonstrate that suppression of FHL2 could normalize the Iks current.

      Strengths:

      The strengths of this manuscript/study are listed below:

      (1) This study includes a previously underrepresented population in the study of the genetic and mechanistic basis of AF.

      (2) The authors utilize current state-of-the-art methods to investigate the pathogenicity of a specific TTN missense variant identified in this underrepresented patient population.

      (3) The findings of this study identify a potential therapeutic for treating atrial fibrillation.

      Weaknesses:

      (1) The authors do not include a non-AF group when evaluating the incidence and clinical significance of TTN missense variants in AF patients.

      We acknowledge the limitation of not including a non-AF group in our clinical analysis. Our cohort is derived from a single-center registry of individuals with AF, and we do not have a matched cohort of non-AF controls to compare the incidence of TTN missense variants. We recognize this as a limitation and will clarify that further studies are needed to define the prevalence of TTN missense variants in broader, multiethnic cohorts that include both AF and non-AF individuals.

      (2) The authors do not provide evidence that TTN-T32756I-iPSC-aCMs are arrhythmogenic, only that there is an increase in the Iks current and associated action potential changes. More specifically, the authors report that "compared to the WT, TTN-T32756I-iPSC-aCMs exhibited increased arrhythmic frequency," yet it is unclear what they are referring to by "arrhythmic frequency."

      We appreciate the reviewer’s request for clarification regarding "arrhythmic frequency." In our study, this term refers to the increased spontaneous beating rate and irregular action potentials observed in TTN-T32756I iPSC-aCMs compared to WT. Our findings suggest that the AF-associated TTN-T32756I variant induces ion channel remodeling and beating abnormalities, possibly contributing to an arrhythmogenic substrate for AF. We will refine our wording in the revised manuscript to enhance clarity and precision.

      (3) There seem to be discrepancies regarding the impact of the TTN-T32756I variant on mechanical function. Specifically, the authors report "both reduced contraction and abnormal relaxation in TTN-T32756I-iPSC-aCMs" yet, separately report "the contraction amplitude of the mutant was also increased … suggesting an increased contractile force by the TTN-T32756IiPSC-aCMs and TTN-T32756I-iPSC-CMs exhibited similar calcium transient amplitudes as the WT."

      We thank the reviewer for pointing this out and apologize for the inconsistency. We intended to report on contraction duration and relaxation rather than contraction force alone. The increased contraction amplitude reflects altered contractile force, whereas the reduced contraction duration and impaired relaxation indicate dysfunctional contractile dynamics. We will revise the text and corresponding figures to convey these findings accurately.

      Reviewer #3 (Public review):

      Summary:

      The authors describe the abnormal contractile function and cellular electrophysiology in an iPSC model of atrial myocytes with a titin missense variant. They provide contractility data by sarcomere length imaging, calcium imaging, and voltage clamp of the repolarizing current iKs. While each of the findings is interesting, the paper comes across as too descriptive because there is no data merging to support a cohesive mechanistic story/statement, especially from the electrophysiological standpoint. There is not enough support for the title "A Titin Missense Variant Causes Atrial Fibrillation", since there is no strong causative evidence. There is some interesting clinical data regarding the variant of interest and its association with HF hospitalization, which may lead to future important discoveries regarding atrial fibrillation.

      Strengths:

      The manuscript is well written, and a wide range of experimental techniques are used to probe this atrial fibrillation model.

      Weaknesses

      (1) While the clinical data is interesting, it is essential to rule out heart failure with preserved EF as a confounder. HFpEF leads to AF due to increased atrial remodeling, so the fact that patients with this missense variant have increased HF hospitalizations does not necessarily directly support the variant as causative of AF. It could be that the variant is associated directly with HFpEF instead, and this needs to be addressed and corrected in the analyses.

      We recognize that AF and HFpEF frequently coexist and that HFpEF-related atrial remodeling could contribute to AF development. The primary aim of our cohort analysis was to explore the potential clinical significance of TTNmv. While we acknowledge the inherent limitations of retrospective observational data in establishing causality, our subsequent in vitro experiments were designed to demonstrate that TTNmv can alter the electrophysiological substrate, potentially predisposing individuals to AF.

      As HFpEF is a potential confounder, it is reasonable to consider whether TTNmv may also be associated with HFpEF. However, to our knowledge, no existing literature directly links TTNmv to HFpEF. In contrast, loss-of-function TTN variants are typically associated with heart failure with reduced ejection fraction (HFrEF) and dilated cardiomyopathy, and even their role in HFrEF remains controversial. To address potential confounding, our multivariable analysis for clinical outcomes was adjusted for reduced ejection fraction, and we conducted a sensitivity analysis excluding patients with nonischemic dilated cardiomyopathy (Supplementary Table 6). We will clarify these points in the revised manuscript.

      (2) All contractility and electrophysiologic data should be done with pacing at the same rate in both control and missense variant groups, to control for the effect of cycle length on APD and calcium loading. A shorter APD cannot be claimed when the firing rate of one set of cells is much faster than the other, since shorter APD is to be expected with a quicker rate. Similarly, contractility is affected by diastolic interval because of the influence of SR calcium content on the myocyte power stroke. So the cells need to be paced at the same rate in the IonOptix for any direct comparison of contractility. The authors should familiarize themselves with the concept of electrical restitution.

      We appreciate the reviewer’s technical concern. iPSC-derived cardiomyocytes (iPSC-CMs) exhibit spontaneous beating due to the presence of pacemaker-like currents and the absence of I<sub>k1</sub>, which allows for the study of intrinsic electrophysiological properties, ion channel function, and disease modeling. In our study, we utilized this unique property of iPSCCMs to test our hypothesis that TTNmvs alter electrophysiological properties through ion channel remodeling.

      While iPSC-CMs with identical backgrounds are expected to show comparable electrophysiological phenotypes under the same conditions, variability due to biological and technical factors (e.g., protein expression and culture handling) can result in differences between samples. We agree with the reviewer that pacing iPSC-CMs at the same rate for action potential duration (APD) and contractility measurements will control for cycle length effects and improve the reliability and interpretability of our findings. We will incorporate this approach into our revised experimental design.

      (3) It is interesting that the firing rate of the myocytes is faster with the missense variant. This should lead to a hypothesis and investigation of abnormal automaticity or triggered activity, which may also explain the increased contractility since all these mechanisms are related to the SR's calcium clock and calcium loading. See #2 above for suggestions on how to probe calcium handling adequately. Such an investigation into impulse initiation mechanisms would be compelling in supporting the primary statement of the paper since these are actual mechanisms thought to cause AF.

      We agree with the reviewer that investigating abnormal automaticity or triggered activity about the increased firing rate observed with the missense variant could provide valuable insights into the mechanisms underlying AF. As these processes are closely linked to calcium handling and the calcium clock, probing calcium cycling abnormalities could strengthen our understanding of how TTNmvs contribute to AF. We will incorporate additional experiments to investigate these mechanisms, further supporting our study's central hypothesis.

      (4) The claim of shortened APD without correcting for cycle length is problematic. However, linking shortened APD in isolated cells alone to AF causation is more complicated. To have a setup for reentry, there must be a gradient of APD from short to long, and this can only be demonstrated at the tissue level, not at the cellular level, so reentry should not be invoked here. If shortened APD is demonstrated with correction of the cycle length problem, restitution curves can be made showing APD shortening at different cycle lengths. If restitution is abnormal (i.e. the APD does not shorten normally in relation to the diastolic interval), this may lead to triggered activity which is an arrhythmogenic mechanism. This would also tie in well with the finding of abnormally elevated iKs current since iKs is a repolarizing current directly responsible for restitution.

      We appreciate the reviewer’s insightful comment. We recognize that isolated cell studies cannot directly demonstrate reentrant circuits, and we agree that reentry should not be invoked solely based on cellular data. Our claim of shortened APD is based on observed abnormalities in APD and beating patterns, which may contribute to conditions conducive to reentry at the tissue level. We will clarify this distinction in the revised manuscript and refrain from directly linking APD shortening to reentry without tissue-level evidence.

    1. Author response:

      Our reviewers brought three things to our notice:

      (1) PolyP has not been introduced as an abbreviation in the abstract.

      (2) 'colorimetric' is misspelled as 'calorimetric' in the following sentence of the results section.

      This method involved the digestion of polyP by recombinant S. cerevisiae exopolyphosphatase 1 (_Sc_Ppx1) followed by calorimetric measurement of the released Pi by malachite green.

      (3) A reference for hNUDT3 has been deleted due to the same technical glitch from the following sentence of introduction.

      Recently, biochemical experiments led to the discovery of endopolyphosphatase NUDT3, an enzyme known as a dinucleoside phosphatase.

    1. Author response:

      The following is the authors’ response to the original reviews.

      Public Reviews (consolidated):

      In the microglia research community, it is accepted that microglia change their shape both gradually and acutely along a continuum that is influenced by external factors both in their microenvironments and in circulation. Ideally, a given morphological state reflects a functional state that provides insight into a microglia's role in physiological and pathological conditions. The current manuscript introduces MorphoCellSorter, an open-source tool designed for automated morphometric analysis of microglia. This method adds to the many programs and platforms available to assess the characteristics of microglial morphology; however, MorphoCellSorter is unique in that it uses Andrew's plotting to rank populations of cells together (in control and experimental groups) and presents "big picture" views of how entire populations of microglia alter under different conditions. Notably, MorphoCellSorter is versatile, as it can be used across a wide array of imaging techniques and equipment. For example, the authors use MorphoCellSorter on images of fixed and live tissues representing different biological contexts such as embryonic stages, Alzheimer's disease models, stroke, and primary cell cultures.

      This manuscript outlines a strategy for efficiently ranking microglia beyond the classical homeostatic vs. active morphological states. The outcome offers only a minor improvement over the already available strategies that have the same challenge: how to interpret the ranking functionally.

      We would like to thank the reviewers for their careful reading and constructive comments and questions. While MorphoCellSorter currently does not rank cells functionally based on their morphology, its broad range of application, ease of use and capacity to handle large datasets provide a solid foundation. Combined with advances in single-cell transcriptomics, MorphoCellSorter could potentially enable the future prediction of cell functions based on morphology.

      Strengths and Weaknesses:

      (1) The authors offer an alternative perspective on microglia morphology, exploring the option to rank microglia instead of categorizing them with means of clusterings like k-means, which should better reflect the concept of a microglia morphology continuum. They demonstrate that these ranked representations of morphology can be illustrated using histograms across the entire population, allowing the identification of potential shifts between experimental groups. Although the idea of using Andrews curves is innovative, the distance between ranked morphologies is challenging to measure, raising the question of whether the authors oversimplify the problem.

      We have access to the distance between cells through the Andrew’s score of each cell. However, the challenge is that these distances are relative values and specific to each dataset. While we believe that these distances could provide valuable information, we have not yet determined the most effective way to represent and utilize this data in a meaningful manner.

      Also, the discussion about the pipeline's uniqueness does not go into the details of alternative models.The introduction remains weak in outlining the limitations of current methods (L90). Acknowledging this limitation will be necessary.

      Thank you for these insightful comments. The discussion about alternative methods was already present in the discussion L586-598 but to answer the request of the reviewers, we have revised the introduction and discussion sections to more clearly address the limitations of current methods, as well as discussed the uniqueness of the pipeline. Additionally, we have reorganized Figure 1 to more effectively highlight the main caveats associated with clustering, the primary method currently in use.

      (2) The manuscript suffers from several overstatements and simplifications, which need to be resolved. For example:

      a)  L40: The authors talk about "accurately ranked cells". Based on their results, the term "accuracy" is still unclear in this context.

      Thank you for this comment. Our use of the term "accurately" was intended to convey that the ranking was correct based on comparison with human experts, though we agree that it may have been overstated. We have removed "accurately" and propose to replace it with "properly" to better reflect the intended meaning.

      b) L50: Microglial processes are not necessarily evenly distributed in the healthy brain. Depending on their embedded environment, they can have longer process extensions (e.g., frontal cortex versus cerebellum).

      Thank you for raising this point to our attention. We removed evenly to be more inclusive on the various morphologies of microglia cells in this introductory sentence

      c)  L69: The term "metabolic challenge" is very broad, ranging from glycolysis/FAO switches to ATP-mediated morphological adaptations, and it needs further clarification about the author's intended meaning.

      Thank you for this comment, indeed we clarified to specify that we were talking about the metabolic challenge triggered by ischemia and added a reference as well.

      d) L75: Is morphology truly "easy" to obtain?

      Yes, it is in comparison to other parameters such as transcripts or metabolism, but we understand the point made by the reviewer and we found another way of writing it. As an alternative we propose: “morphology is an indicator accessible through…”

      e) L80: The sentence structure implies that clustering or artificial intelligence (AI) are parameters, which is incorrect. Furthermore, the authors should clarify the term "AI" in their intended context of morphological analysis.

      We apologize for this confusing writing, we reformulated the sentence as follows: “Artificial intelligence (AI) approaches such as machine learning have also been used to categorize morphologies (Leyh et al., 2021)”.

      f) L390f: An assumption is made that the contralateral hemisphere is a non-pathological condition. How confident are the authors about this statement? The brain is still exposed to a pathological condition, which does not stop at one brain hemisphere.

      We did not say that the contralateral is non-pathological but that the microglial cells have a non-pathological morphology which is slightly different. The contralateral side in ischemic experiments is classically used as a control (Rutkai et al 2022). Although It has been reported that differences in transcript levels can be found between sham operated animals and contralateral hemisphere in tMCAO mice (Filippenkov et al 2022) https://doi.org/10.3390/ijms23137308 showing that indeed the contralateral side is in a different state that sham controls, no report have been made on differences in term of morphology.

      We have removed “non-pathological” to avoid misinterpretations

      g)  Methodological questions:

      a) L299: An inversion operation was applied to specific parameters. The description needs to clarify the necessity of this since the PCA does not require it.

      Indeed, we are sorry for this lack of explanation. Some morphological indexes rank cells from the least to the most ramified, while others rank them in the opposite order. By inverting certain parameters, we can standardize the ranking direction across all parameters, simplifying data interpretation. This clarification has been added to the revised manuscript as follows:

      “Lacunarity, roundness factor, convex hull radii ratio, processes cell areas ratio and skeleton processes ratio were subjected to an inversion operation in order to homogenize the parameters before conducting the PCA: indeed, some parameters rank cells from the least to the most ramified, while others rank them in the opposite order. By inverting certain parameters, we can standardize the ranking direction across all parameters, thus simplifying data interpretation.”

      b) Different biological samples have been collected across different species (rat, mouse) and disease conditions (stroke, Alzheimer's disease). Sex is a relevant component in microglia morphology. At first glance, information on sex is missing for several of the samples. The authors should always refer to Table 1 in their manuscript to avoid this confusion. Furthermore, how many biological animals have been analyzed? It would be beneficial for the study to compare different sexes and see how accurate Andrew's ranking would be in ranking differences between males and females. If they have a rationale for choosing one sex, this should be explained.

      As reported in the literature, we acknowledge the presence of sex differences in microglial cell morphology. Due to ethical considerations and our commitment to reducing animal use, we did not conduct dedicated experiments specifically for developing MorphoCellSorter. Instead, we relied on existing brain sections provided by collaborators, which were already prepared and included tissue from only one sex—either female or male—except in the case of newborn pups, whose sex is not easily determined. Consequently, we were unable to evaluate whether MorphoCellSorter is sensitive enough to detect morphological differences in microglia attributable to sex. Although assessing this aspect is feasible, we are uncertain if it would yield additional insights relevant to MorphoCellSorter’s design and intended applications.

      To address this, we have included additional references in Table 1 of the revised manuscript and clearly indicated the sex of the animals from which each dataset was obtained.

      c) In the methodology, the slice thickness has been given in a range. Is there a particular reason for this variability?

      We could not spot any range in the text, we usually used 30µm thick sections in order to have entire or close to entire microglia cells.

      Although the thickness of the sections was identical for all the sections of a given dataset, only the plans containing the cells of interest were selected during the imaging for both of the ischemic stroke model. This explains why depending on how the cell is distributed in Z the range of the plans acquired vary.

      Also, the slice thickness is inadequate to cover the entire microglia morphology. How do the authors include this limitation of their strategy? Did the authors define a cut-off for incomplete microglia?

      We found that 30 µm sections provide an effective balance, capturing entire or nearly entire microglial cells (consistent with what we observe in vivo) while allowing sufficient antibody penetration to ensure strong signal quality, even at the section's center. In our segmentation process, we excluded microglia located near the section edges (i.e., cells with processes visible on the first or last plane of image acquisition, as well as those close to the field of view’s boundary). Although our analysis pipeline should also function with thicker sections (>30 µm), we confirmed that thinner sections (15 µm or less) are inadequate for detecting morphological differences, as tested initially on the AD model. Segmented, incomplete microglia lack the necessary structural information to accurately reflect morphological differences thus impairing the detection of existing morphological differences.

      c) The manuscript outlines that the authors have used different preprocessing pipelines, which is great for being transparent about this process. Yet, it would be relevant to provide a rationale for the different imaging processing and segmentation pipelines and platform usages (Supplementary Figure 7). For example, it is not clear why the Z maximum projection is performed at the end for the Alzheimer's Disease model, while it's done at the beginning of the others.

      The same holds through for cropping, filter values, etc. Would it be possible to analyze the images with the same pipelines and compare whether a specific pipeline should be preferable to others?

      The pre-processing steps depend on the quality of the images in each dataset. For example, in the AD dataset, images acquired with a wide-field microscope were considerably noisier compared to those obtained via confocal microscopy. In this case, reducing noise plane-by-plane was more effective than applying noise reduction on a Z-projection, as we would typically do for confocal images. Given that accurate segmentation is essential for reliable analysis in MorphoCellSorter, we chose to tailor the segmentation approach for each dataset individually. We recommend future users of MorphoCellSorter take a similar approach. This clarification has been added to the discussion.

      On a note, Matlab is not open-access,

      This is correct. We are currently translating this Matlab script in Python, this will be available soon on Github. https://github.com/Pascuallab/MorphCellSorter.

      This also includes combining the different animals to see which insights could be gained using the proposed pipelines.

      Because of what we have been explaining earlier, having a common segmentation process for very diverse types of acquisitions (magnification, resolution and type of images) is not optimal in terms of segmentation and accuracy in the analysis. Although we could feed MorphoCellSorter with all this data from a unique segmentation pipeline, the results might be very difficult to interprete.

      d) L227: Performing manual thresholding isn't ideal because it implies the preprocessing could be improved. Additionally, it is important to consider that morphology may vary depending on the thresholding parameters. Comparing different acquisitions that have been binarized using different criteria could introduce biases.

      As noted earlier, segmentation is not the main focus of this paper, and we leave it to users to select the segmentation method best suited to their datasets. Although we acknowledge that automated thresholding would be in theory ideal, we were confronted toimage acquisitions that were not uniform, even within the same sample. For instance, in ischemic brain samples, lipofuscin from cell death introduces background noise that can artificially impact threshold levels. We tested global and local algorithms to automatically binarize the cells but these approaches resulted often on imperfect and not optimized segmentation for every cell. In our experience, manually adjusting the threshold provides a more accurate, reliable, and comparable selection of cellular elements, even though it introduces some subjectivity. To ensure consistency in segmentation, we recommend that the same person performs the analysis across all conditions. This clarification has been added to the discussion.

      e) Parameter choices: L375: When using k-means clustering, it is good practice to determine the number of clusters (k) using silhouette or elbow scores. Simply selecting a value of k based on its previous usage in the literature is not rigorous, as the optimal number of clusters depends on the specific data structure. If they are seeking a more objective clustering approach, they could also consider employing other unsupervised techniques, (e.g. HDBSCAN) (L403f).

      We do agree with the referee’s comment but, the purpose of the k-mean we used was just to illustrate the fact that the clusters generated are artificial and do not correspond to the reality of the continuum of microglia morphology. In the course of the study we used the elbow score to determine the k means but this did not work well because no clear elbow was visible in some datasets (probably because of the continuum of microglia morphologies). Anyway, using whatever k value will not change the problem that those clusters are quite artificial and that the boundaries of those clusters are quite arbitrary whatever the way k is determined manually or mathematically.

      L373: A rationale for the choice of the 20 non-dimensional parameters as well as a detailed explanation of their computation such as the skeleton process ratio is missing. Also, how strongly correlated are those parameters, and how might this correlation bias the data outcomes?

      Thank you for raising this point. There is no specific rationale beyond our goal of being as exhaustive as possible, incorporating most of the parameters found in the literature, as well as some additional ones that we believed could provide a more thorough description of microglial morphology.

      Indeed, some of these parameters are correlated. Initially, we considered this might be problematic, but we quickly found that these correlations essentially act as factors that help assign more weight to certain parameters, reflecting their likely greater importance in a given dataset. Rather than being a limitation, the correlated parameters actually enhance the ranking. We tested removing some of these parameters in earlier versions of MorphoCellSorter, and found that doing so reduced the accuracy of the tool.

      Differences between circularity and roundness factors are not coming across and require further clarification.

      These are two distinct ways of characterizing morphological complexity, and we borrowed these parameters and kept the name from the existing literature, not necessarily in the context of microglia. In our case, these parameters are used to describe the overall shape of the cell. The advantage of using different metrics to calculate similar parameters is that, depending on the dataset, one method may be better suited to capture specific morphological features of a given dataset. MorphoCellSorter selects the parameter that best explains the greatest dispersion in the data, allowing for a more accurate characterization of the morphology. In Author response image 1 you will see how circularity and roundness describe differently cells

      Author response image 1.

      Correlation between Circularity and Roundness Factor in the Alzheimer disease dataset. A second order polynomial correlation exists between the two parameters in our dataset. Indeed (1) a single maximum is shared between both parameters. However, Circularity and Roundness Factor are not entirely redundant, as examplified by (2) the possible variety of Roundness Factors for a given Circularity as well as (3) the very different morphology minima of these two parameters.

      One is applied to the soma and the other to the cell, but why is neither circularity nor loudness factor applied to both?

      None of the parameters concern the cell body by itself. The cell body is always relative to another metric(s). Because these parameters and what they represent does not seem to be very clear we have added a graphic representation of the type of measurements and measure they provide in the revised version of the manuscript (Supplemental figure 8).

      f) PCA analysis:

      The authors spend a lot of text to describe the basic principles of PCA. PCA is mathematically well-described and does not require such depth in the description and would be sufficient with references.

      Thank you for this comment indeed the description of PCA may be too exhaustive, we will simplify the text.

      Furthermore, there are the following points that require attention:

      L321: PC1 is the most important part of the data could be an incorrect statement because the highest dispersion could be noise, which would not be the most relevant part of the data. Therefore, the term "important" has to be clarified.

      We are not sure in the case of segmented images the noise would represent most of the data, as by doing segmentation we also remove most of the noise, but maybe the reviewer is concerned about another type of noise? Nonetheless, we thank the reviewer for his comment and we propose the following change, that should solve this potential issue.

      PC<sub>1<.sub> is the direction in which data is most dispersed.”

      L323: As before, it's not given that the first two components hold all the information.

      Thank you for this comment we modified this statement as follows: “The two first components represent most of the information (about 70%), hence we can consider the plan PC<sub>1</sub>, PC<sub>2</sub> as the principal plan reducing the dataset to a two dimensional space”

      L327 and L331 contain mistakes in the nomenclature: Mix up of "wi" should be "wn" because "i" does not refer to anything. The same for "phi i = arctan(yn/wn)" should be "phi n".

      Thanks a lot for these comments. We have made the changes in the text as proposed by the reviewer.

      L348: Spearman's correlation measures monotonic correlation, not linear correlation. Either the authors used Pearson Correlation for linearity or Spearman correlation for monotonic. This needs to be clarified to avoid misunderstandings.

      Sorry for the misunderstanding, we did use Spearman correlation which is monotonic, we thus changed linear by monotonic in the text. Thanks a lot for the careful reading.

      g) If the authors find no morphological alteration, how can they ensure that the algorithm is sensitive enough to detect them? When morphologies are similar, it's harder to spot differences. In cases where morphological differences are more apparent, like stroke, classification is more straightforward.

      We are not entirely sure we fully understand the reviewer's comment. When data are similar or nearly identical, MorphoCellSorter performs comparably to human experts (see Table 1). However, the advantage of using MorphoCellSorter is that it ranks cells do.much faster while achieving accuracy similar to that of human experts AND gives them a value on an axis (andrews score), which a human expert certainly can't. For example, in the case of mouse embryos, MorphoCellSorter’s ranking was as accurate as that made by human experts. Based on this ranking, the distributions were similar, suggesting that the morphologies are generally consistent across samples.

      The algorithm itself does not detect anything—it simply ranks cells according to the provided parameters. Therefore, it is unlikely that sensitivity is an issue; the algorithm ranks the cells based on existing data. The most critical factor in the analysis is the segmentation step, which is not the focus of our paper. However, the more accurate the segmentation, the more distinct the parameters will be if actual differences exist. Thus, sensitivity concerns are more related to the quality of image acquisition or the segmentation process rather than the ranking itself. Once MorphoCellSorter receives the parameters, it ranks the cells accordingly. When cells are very similar, the ranking process becomes more complex, as reflected in the correlation values comparing expert rankings to those from MorphoCellSorter (Table 1).

      Moreover, MorphoCellSorter does not only provide a ranking: the morphological indexes automatically computed offer useful information to compare the cells’ morphology between groups.

      h) Minor aspects:

      % notation requires to include (weight/volume) annotation.

      This has been done in the revised version of the manuscript

      Citation/source of the different mouse lines should be included in the method sections (e.g. L117).

      The reference of the mouse line has been added (RRID:IMSR_JAX:005582) to the revised version of the manuscript.

      L125: The length of the single housing should be specified to ensure no variability in this context.

      The mice were kept 24h00 individually, this is now stated in the text

      L673: Typo to the reference to the figure.

      This has been corrected, thank you for your thoughtful reading.

      Recommendations for the authors:

      Reviewer #1 (Recommendations for the authors):

      Methods

      (1) Alzheimer's disease model: was a perfusion performed and then an hour later brains extracted? Please clarify.

      This is indeed what has been done.

      (2) For in vitro microglial studies: was a percoll gradient used for the separation of immune cells? What percentage percoll was used? Was there separation of myelin and associated debris with the percoll centrifugation? Please clarify the protocol as it is not completely clear how these cells were separated from the initial brain lysate suspension. What cell density was plated?

      The protocol has been completed, as followed: “Myelin and debris were then eliminated thanks to a Percoll® PLUS solution (E0414, Sigma-Aldrich) diluted with DPBS10X (14200075, Gibco) and enriched in MgCl<sub>2</sub> and CaCl<sub>2</sub> (for 50 mL of myelin separation buffer: 90 mL of Percoll PLUS, 10 mL of DPBS10X, 90 μL of 1 M CaCl<sub>2</sub> solution, and 50 μL of 1 M MgCl<sub>2</sub> solution).”. Thank you for your feedback.

      (3) How are the microglia "automatically cropped" in FIJI (for the Phox2b mutant)? Is there a function/macro in the program you used? This is very important for the workflow and needs to be clarified. The methods section of this manuscript is a guide for future users of this workflow and should be as descriptive as possible. It would be useful to give detailed information on the manual classification process, perhaps as a supplement. The authors do a nice job pointing out that these older methods are not effective in categorizing microglia that don't necessarily fit into a predefined phenotype.

      The protocol has been completed, as follows “. Briefly, the centroid of each detected object (i.e. microglia), except the ones on the borders, were detected, and a crop of 300x300 pixels around the objects were generated. Then, the pixels belonging to neighboring cells were manually removed on each generated crop.

      (4) Please address the concern that manual tuning and thresholding are required for this method's accuracy. Is this easily reproducible?

      Yes, it is easily reproducible for a given experimenter and is better suited than automatic thresholding. Although segmentation is not the primary focus of this paper, we leave it to users to choose the segmentation method that best fits their datasets.

      To address your question, we acknowledge that automated thresholding would theoretically be ideal. However, we encountered challenges due to non-uniform image acquisitions, even within the same sample. For instance, in ischemic brain samples, lipofuscin resulting from cell death introduced background noise that could artificially influence threshold levels. We tested both global and local algorithms for automatic binarization of cells, but these approaches often produced suboptimal segmentation results for individual cells.

      Based on our experience, manually adjusting the threshold provided more accurate, reliable, and consistent selection of cellular elements, even though it introduces a degree of subjectivity. To maintain consistency, we recommend that the same individual perform the analysis across all conditions.

      This clarification has been incorporated into the discussion as follows: “Although, automated thresholding would be ideal. In our case, image acquisitions were not entirely uniform, even within the same sample. For instance, in ischemic brain samples, lipofuscin from cell death introduces background noise that can artificially impact threshold levels. This effect is observed even when comparing contralateral and ipsilateral sides of the same brain. In our experience, manually adjusting the threshold provides a more accurate, reliable, and comparable selection of cellular elements, even though it introduces some subjectivity. To ensure consistency in segmentation, we recommend that the same person performs the analysis across all conditions. “

      (5) How are the authors performing the PCA---what program (e.g .R)? Again, please be explicit about how these mathematical operations were computed. (lines 302-345).

      The PCA was made in Matlab, the code can be found on Github (https://github.com/Pascuallab/MorphCellSorter), as stated in the discussion.

      Other:

      (1) Can the authors comment on the challenges of the in vitro microglial analyses? The correlation of the experts v. MorphoCellSorter is much less than the fixed tissue. This is not addressed in the manuscript.

      In vitro, microglial cells exhibit a narrower range of morphological diversity compared to ex vivo or in vivo conditions. A higher proportion of cells share similar morphologies or morphologies with comparable complexities, which makes establishing a precise ranking more challenging. Consequently, the rank of many cells could be adjusted without significantly affecting the overall quality of the ranking.

      This explains why the rankings tend to show slightly greater divergence between experts. Interestingly, the ranking generated by MorphoCellSorter, which is objective and not subject to human bias, lies roughly midway between the rankings of the two experts.

      (2) You point out that the MorphoCellSorter may not be suited for embryonic/prenatal microglial analysis.

      This must be a misunderstanding because it is not what we concluded; we found that the ranking was correct but that we could not spot any differences due to transgenic alteration.

      The lack of differences observed in the embryonic microglia (Figure 5) is not necessarily surprising, as embryonic microglia have diverse morphological characteristics--- immature microglia do not possess highly ramified processes until postnatal development [see Hirosawa et al. (2005) https://doi.org/10.1002/jnr.20480 -they use an Iba1-GFP transgenic mouse to visualize prenatal microglia]. Also, see Bennett et al. (2016) [https://doi.org/10.1073/pnas.1525528113] which shows mature microglia not appearing until 14 days postnatal.

      We agree with the reviewer on that point nonetheless MorphoCellSorter provides an information on the fact that the population is homogeneous and that the mutation has no effect on the morphology.

      (3) Although a semantic issue, Figure 1's categorization of microglia shows predefined groups of microglia do not necessarily usefully bin many cells. Is still possible to categorize the microglia without using hotly debated categorization methods? The literature review in the current manuscript correctly points out the spectrum phenomenon of microglial activation states, though some of the suggestions from Paolicelli et al. (2022) are not put into action. The use of "activated" only further perpetuates the oversimplified classification of microglia. Perhaps the authors could consider using the term "reactive", as it is recognized by the Microglial nomenclature paper cited above. Are "amoeboid microglia" not "activated microglia"? "Reactive" is a less loaded term and is a recommended descriptor. Amoeboid microglia are commonly understood to be indicative of a highly proinflammatory environment, though you could potentially use "hyper-reactive" to differentiate them from the slightly ramified "reactive" cells.

      We changed activated microglia to reactive microglia as requested by the reviewer in the text. Thanks a lot for your comment

      (4) The graphs in Figures 3 B-D are visually difficult to interpret. The better color contrast between the MorphoCellSorter/Expert and Expert1/Expert2 would be useful--- perhaps a color for Expert 1 and a different color for Expert 2. Is this the ranking from the same data in Figure 1 (lines 420-421)? It is unclear what the x-axis represents in 3B-D. E-G is much more intuitive.

      We believe the confusion stems more from Figure 1 than Figure 3, as both figures use similar representations for entirely different analyses (clustering vs. ranking). To address this, we have provided an updated version of Figure 1 to help clarify this distinction and avoid any potential misinterpretation.

      Regarding Figure 3B-D, we do not fully see the need for changing the colors. These panels are histograms that display the distribution of rank differences either between experts and MorphoCellSorter or between the two experts. Assigning specific colors to the experts or MorphoCellSorter would be challenging, as the histograms represent comparative distributions involving both an expert and MorphoCellSorter or the ranking differences between the two experts.

      The same reasoning applies to Figures 3E-G. In these scatter plots, each point is defined by an ordinate (ranking value for one expert) and an abscissa (ranking value for either the other expert or MorphoCellSorter). Therefore, it would not be straightforward or meaningful to assign distinct colors to these elements within this context.

      (5) Line 217: use the term "imaged" rather than "generated" ... or "images were generated of clusters of microglia located .... using MICROSOPE and Zen software." You aren't generating microglia, rather, you are generating images.

      Thanks a lot for raising this problem, we changed the sentence as followed: “For the AD model, crops of individual microglial cells located in the secondary visual cortex were extracted from images using the Zen software (v3.5, Zeiss) and exported to the Tif image format.

      (6) Elaborate on how an "inversion operation" was applied to Lacunarity, roundness factor, convex hull radii ratio, processes cell areas ratio, and skeleton processes. (Lines 299-300) Furthermore, a paragraph separation would be useful if the "inversion operation" is not what is described in the text immediately after this description.

      Indeed, we are sorry for this lack of explanation. Some morphological indexes rank cells from the least to the most ramified, while others rank them in the opposite order. By inverting certain parameters, we can standardize the ranking direction across all parameters, simplifying data interpretation. This clarification has been added to the revised manuscript as follows:

      “Lacunarity, roundness factor, convex hull radii ratio, processes cell areas ratio and skeleton processes ratio were subjected to an inversion operation in order to homogenize the parameters before conducting the PCA: indeed, some parameters rank cells from the least to the most ramified, while others rank them in the opposite order. By inverting certain parameters, we can standardize the ranking direction across all parameters, thus simplifying data interpretation.”

      (7) Line 560: "measureclarke" seems to be an error associated with the reference. Please correct.

      Thanks a lot, this has been corrected

      (8) Discussion: compare MorphoCellSorter to the MIC-MAC program used by Salamanca et al. (2019). They use a similar approach, albeit not Andrew's plot.

      We have added the Salamanca reference

      Reviewer #2 (Recommendations for the authors):

      While it's not expected that the authors address the significance of the morphology in relation to function here, they could help highlight the issue and produce data that would enhance the paper's significance. Therefore, I recommend a small-scale and straightforward study where the authors couple their analysis with a marker (e.g. Lysotracker or Mitotracker) to produce data that link their morphometric analysis to more functional readouts. Furthermore, I encourage the authors to elaborate on the practical applications of these morphometric tools and the implications of their measurements, as this would provide context for their work, which, as it stands, feels like just another tool.

      We would like to thank the reviewer for their thoughtful comment and suggestion. Indeed, MorphoCellSorter is simply another tool, but one that offers a more convenient and efficient approach, producing a variety of results tailored to specific research needs. We strongly believe that MorphoCellSorter should be used in conjunction with other tools, depending on the specific research question.

      In our view, MorphoCellSorter is particularly well-suited for researchers who need a quick and efficient way to determine whether their treatment, gene invalidation, or other experimental conditions affect microglial morphology. In this context, MorphoCellSorter is fast, user-friendly, and highly effective. However, for those who aim to uncover detailed differences in cell morphology, other tools requiring more time-intensive, full reconstructions of the cells would be more appropriate.

      Providing additional data on the relationship between cellular function and morphology could certainly pave the way for new questions and more robust evidence. For instance, combining single-cell transcriptomics with morphological analysis would be an excellent approach to exploring the relationship between function and morphology. However, this would involve significant time, expense, and effort, and it represents a different line of inquiry altogether.

      While it would be ideal to clearly demonstrate the link between morphology and function, we are concerned that pursuing such a goal would considerably delay the implementation and adoption of our tool, potentially raising additional questions beyond the scope of this study.!

      Minor comments:

      (1) Can MorphCellSorter be adapted for use with other cell types (e.g., astrocytes)?

      Yes it could, we have made some pretty conclusive analysis on astrocytes but some parameters have to be adapted before being released.

      (2) What modifications would be necessary? If it is not applicable, would a name that includes "Microglia" be more descriptive?

      Modification would be quite minor, it is mainly the parameters being considered that would change, this is the reason why we will keep the MorphoCellSorter name. Thank you for the suggestion!

      (3) A common challenge with such tools is the technical expertise required to use them. Could a user-friendly interface be developed to better fulfill its intended purpose and benefit the community?

      This is a good point thank you, and the answer is yes, we will translate our Matlab code to Python to open it to a wider audience and we will certainly work on a friendly user interface!

      (4) Given that this tool relies on imaging, can users trace a cell (or group of cells) back to the original image?

      Yes, it is possible if each crop is annotated with the spatial coordinates during the segmentation step. It is not yet implemented in the actual version of the software but mainly depend on the way segmentation is performed, which is not the topic of the paper.

      (5)  Line 36: The "biologically relevant" statement is central and needs to be expanded.

      This is not easy as it is the abstract with a word limit. What we mean by this sentence is that when classifying cells we force them by mathematical tools to enter in a group of cells based on metrics that have not necessarily a biological meaning. We suggest the following modification “However, this classification may lack biological relevance, as microglial morphologies represent a continuum rather than distinct, separate groups, and do not correspond to mathematically defined, clusters irrelevant of microglial cells function.”

      (6) Line 49-50: Provide reference and elaborate. For example, does this apply during early life?

      We have slightly changed the sentence and added a reference.

      (7) Line 69: Provide reference.

      The reference, Hubert et al 2021 has been added

      (8) Lines 78-88: A table summarizing other efforts in morphometric characterization of microglia would be helpful in distinguishing your work from others.

      This has already been done in some review articles; we thus added the references to address readers to these reviews. Here is the revised version of the sentence: “ To date, the literature contains a wide variety of criteria to quantitatively describe microglial morphology, ranging from descriptive measures such as cell body surface area, perimeter, and process length to indices calculating different parameters such as circularity, roundness, branching index, and clustering (Adaikkan et al., 2019; Heindl et al., 2018; Kongsui, Beynon, Johnson, & Walker, 2014; Morrison et al., 2017; Young & Morrison, 2018)”

      (9) Lines 130, 145: Please provide complete genotype information and the sources of the animals used.

      It has been done

      (10) Materials and Methods:

      (1) Standardize the presentation of products (e.g., using # consistently).

      It has been done

      (2) Provide versions of software used.

      We have modified accordingly

      (3) Lines 372-373: A table listing the 20 parameters with brief explanations (as partially done in Materials and Methods) would greatly improve readability.

      This is done in supp figure 8

      (4) Since nomenclature is a critical issue in the literature, you used specific definitions (lines 376-383). However, please indicate (with a reference) why you use the term "activated," as it implies that the others are non-activated. Alternatively, define "activated" cluster differently.

      We change activated microglia to reactive microglia as requested by the reviewer #1.

      (4) Figure 1: In my opinion placing this figure as the first main figure is problematic as it confuses the message of the paper. Since the authors are introducing a new approach for morphological characterization in Figure 2, I recommend the latter for the sake of readability and clarity should be the first main image, while Figure 1 can move the supplements.

      We do agree with the reviewer, we thus changed figure one as explained earlier to reviewer 1. Nonetheless because it is an important step of our reflection process we believe it can stay as a figure. We hope the change made in figure one clarifies the message of the paper.

      (5) Figure 1: Please indicate on the figure the marker for the analysis.

      Figure 2 has been changed

      (6) No funding agencies are communicated.

      This has been corrected

    1. Author response:

      The following is the authors’ response to the original reviews.

      eLife Assessment

      This manuscript represents a fundamental contribution demonstrating that fentanyl-induced respiratory depression can be reversed with a peripherally-restricted mu opioid receptor antagonist. The paper reports compelling and rigorous physiological, pharmacokinetic, and behavioral evidence supporting this major claim, and furthers mechanistic understanding of how peripheral opioid receptors contribute to respiratory depression. These findings reshape our understanding of opioid-related effects on respiration and have significant therapeutic implications given that medications currently used to reverse opioid overdose (such as naloxone) produce severe aversive and withdrawal effects via actions within the central nervous system.

      We thank the reviewers for their insightful comments and critiques, which we have incorporated into the manuscript. We believe these revisions have significantly improved the manuscript. Additionally, following discussions among the authors, we have revised the color scheme across all figures. For example, the color of the symbols in Figure 1B-D now match the bars in Figure 1E-J, rather than the symbols. We feel that this change improves the clarity and visual consistency of the figures, making it easier to interpret the data across figures.

      Public Reviews:

      Reviewer #1 (Public review):

      Summary:

      This paper shows that the synthetic opioid fentanyl induces respiratory depression in rodents. This effect is revised by the opioid receptor antagonist naloxone, as expected. Unexpectedly, the peripherally restricted opioid receptor antagonist naloxone methiodide also blocks fentanyl-induced respiratory depression.

      Strengths:

      The paper reports compelling physiology data supporting the induction of respiratory distress in fentanyl-treated animals. Evidence suggesting that naloxone methiodide reverses this respiratory depression is compelling. This is further supported by pharmacokinetic data suggesting that naloxone methiodide does not penetrate into the brain, nor is it metabolized into brain-penetrant naloxone.

      Weaknesses:

      A weakness of the study is the fact that the functional significance of opioid-induced changes in neural activity in the nTS (as measured by cFos and GcAMP/photometry) is not established. Does the nTS regulate fentanyl-induced respiratory depression, and are changes in nTS activity induced by naloxone and naloxone methiodide relevant to their ability to reverse respiratory depression?

      Reviewer #2 (Public review):

      Summary:

      In this article, Ruyle and colleagues assessed the contribution of central and peripheral mu opioid receptors in mediating fentanyl-induced respiratory depression using both naloxone and naloxone methiodide, which does not cross the blood-brain barrier. Both compounds prevented and reversed fentanyl-induced respiratory depression to a comparable degree. The advantage of peripheral treatments is that they circumvent the withdrawal-like effects of naloxone. Moreover, neurons located in the nucleus of the solitary tract are no longer activated by fentanyl when nalaxone methiodide is administered, suggesting that these responses are mediated by peripheral mu opioid receptors. The results delineate a role for peripheral mu opioid receptors in fentanyl-derived respiratory depression and identify a potentially advantageous approach to treating overdoses without inflicting withdrawal on the patients.

      Strengths:

      The strengths of the article include the intravenous delivery of all compounds, which increase the translational value of the article. The authors address both the prevention and reversal of fentanyl-derived respiratory depression. The experimental design and data interpretation are rigorous and appropriate controls were used in the study. Multiple doses were screened in the study and the approaches were multipronged. The authors demonstrated the activation of NTS cells using multiple techniques and the study links peripheral activation of mu opioid receptors to central activation of NTS cells. Both males and females were used in the experiments. The authors demonstrate the peripheral restriction of naloxone methiodide.

      Weaknesses:

      Nalaxone is already broadly used to prevent overdoses from opioids so in some respects, the effects reported here are somewhat incremental.

      The reviewer is correct that naloxone is the standard antidote for reversing opioid-induced respiratory depression. However, its limitations, including the risk of precipitated withdrawal, are well-documented in both preclinical and clinical studies. The likelihood of withdrawal increases when multiple doses of naloxone are administered. Since naloxone-induced withdrawal is centrally mediated, this study aimed to evaluate a peripherally restricted MOR antagonist for its ability to prevent or reverse fentanyl-induced respiratory depression. A key finding is that NLXM reversed OIRD without inducing aversive behavior. This suggests that peripheral antagonists like NLXM may be integrated into intervention strategies that save lives while preventing the adverse behavioral and physiological effects that are observed after treatment with naloxone.

      Reviewer #3 (Public review):

      Summary:

      This manuscript outlines a series of very exciting and game-changing experiments examining the role of peripheral MORs in OIRD. The authors outline experiments that demonstrate a peripherally restricted MOR antagonist (NLX Methiodide) can rescue fentanyl-induced respiratory depression and this effect coincides with a lack of conditioned place aversion. This approach would be a massive boon to the OUD community, as there are a multitude of clinical reports showing that naloxone rescue post fentanyl over-intoxication is more aversive than the potential loss-of-life to the individuals involved. This important study reframes our understanding of successful overdose rescue with potential for reduced aversive withdrawal effects.

      Strengths:

      Strengths include the plethora of approaches arriving at the same general conclusion, the inclusion of both sexes and the result that a peripheral approach for OIRD rescue may side-step severe negative withdrawal symptoms of traditional NLX rescue.

      Weaknesses:

      The major weakness of this version relates to the data analysis assessed sex-specific contributors to the results.

      Recommendations for the authors:

      Reviewer #1 (Recommendations for the authors):

      Some points for the authors to consider are:

      (1) In the Abstract, it is unclear why "high potency and lipophilicity" contribute to opioid-induced respiratory depression.

      The higher potency of fentanyl compared to other opioids significantly increases the risk of overdose and subsequent respiratory depression. Its high lipophilicity facilitates rapid absorption and central nervous system penetration, which contributes to the rapid onset of these cardiorespiratory depression. The narrow therapeutic window of fentanyl further emphasizes the critical need for timely intervention when an overdose has occurred, and effective antagonists to reverse respiratory depression and save lives. We have revised the abstract to clarify these points.

      (2) Are the doses of fentanyl used in the study (2, 20, or 50 µg/kg IV) relevant to those achieved by fentanyl-exposed human drug users?

      In these studies, we intravenously administered three doses of fentanyl. The human equivalent doses (HED) of 20ug/kg and 50 ug/kg fentanyl are ~3 ug/kg and ~8 ug/kg, respectively. These doses have previously been shown to induce respiratory depression in humans (Dahan et al.,2005).

      (3) In Figure 1, it appeared that only a small fraction of tyrosine hydroxylase-positive (TH+) neurons expressed cFos in response to fentanyl, and the degree of cFos expression was largely similar across all fentanyl doses tested. Thus, it is unclear whether TH+ neurons play a role in fentanyl-induced respiratory depression, and the value of these data is unclear (see point #6 below also).

      As shown in the mean data, the lowest dose of fentanyl, which was below the threshold for inducing OIRD, activated approximately 50% of tyrosine hydroxylase-positive (TH+) nTS neurons. In contrast, the highest dose of fentanyl resulted in a statistically significant increase, with ~75% of TH+ cells co-expressing Fos-IR.

      We included the assessment of catecholaminergic nTS cells for several reasons. The regions of the nTS evaluated in this study contains high expression of MOR and are the termination points of sensory afferent fibers transmitting cardiorespiratory information to the nTS (Aicher et al., 2000; Furdui et al., 2024). Catecholaminergic cells receive direct excitatory inputs from visceral afferents (Appleyard et al., 2007) and exhibit intensity-dependent increases in Fos-IR in rats exposed to hypoxic air (Kline et al., 2010; King et al., 2012). These neurons are essential for generating appropriate cardiorespiratory responses to hypoxic challenges (Bathina et al., 2013; King et al., 2015). As the reviewer notes, rats exposed to fentanyl exhibit a high degree of Fos-IR in the nTS, including catecholaminergic neurons. Despite the robust fentanyl-induced activation (increased Fos-IR) nTS neurons, yet there appears to be a failure to initiate appropriate chemoreflex-mediated cardiorespiratory responses. Our photometry data further indicate that fentanyl-induced changes in neuronal activity are mediated, in part, by peripheral MOR. Collectively, these findings suggest that fentanyl impacts nTS activity through alterations in peripheral afferent signaling to the nTS, which may contribute to the severity and duration of OIRD.

      (4) It would help with the flow of the paper if the pharmacokinetic data shown in Figure 6 were presented earlier (as part of Figure 2).

      We have moved the biodistribution data earlier in the manuscript, now presenting it as Figure 2. The numbering of all subsequent figures has been adjusted accordingly.

      (5) In Figure 5, there appears to be a large number of GCaMP-expressing neurons located outside the nTS. To what degree can the changes in calcium signaling, attributed to alterations in neural activity in the nTS, be explained by altered activity of neurons located outside the nTS?

      The reviewer is correct that our viral spread extends beyond the boundaries of the nTS, raising the possibility that the responses observed in Figure 5 may be influenced by neural activity of cells outside the nTS. While some viral spread beyond the target region is unavoidable, calcium transients were measured at the tip of the fiber, which was positioned directly within the nTS.

      To address this concern further, we performed Fos immunohistochemistry in a subset of animals that received bilateral GCaMP virus injections into the nTS. Following fentanyl administration (50 µg/kg IV), brains were collected two hours later. As shown in the accompanying image, we observed Fos-IR co-expression with GCaMP exclusively within the nTS boundaries. No Fos-IR was detected outside the nTS, including in GCaMP cells. Taken together, these findings support our conclusion that the data depicted in our photometry figure (now Figure 6) accurately represent fentanyl-induced activity changes in nTS neurons.

      Author response image 1.

      Arrowheads: Fos-negative GCaMP cell; Arrows: Co-labeled Fos/GCaMP cell; Asterisk: Fos+ GCaMP-negative cell

      (6) Currently, the cFos and photometry data are descriptive in nature. Are opioid-induced changes in nTS neural activity relevant to respiratory depression? If so, one might expect DREADD-mediated stimulation of the nTS neural activity (or stimulating nTS activity by some other means) would reverse fentanyl-induced respiratory depression similar to naloxone and methyl-naloxone.

      The reviewer raises an interesting point regarding the relevance of the nTS in the context of OIRD. The nTS is a major site of integration of sensory afferent information and involved in the initiation of reflex responses that facilitate a return to homeostasis. As described above, we characterized the collective response of nTS neurons to intravenous fentanyl using both Fos immunohistochemistry and fiber photometry. Our data indicate that fentanyl-induced changes in nTS activity are strongly mediated by peripheral MOR. While the suggestion to use global chemogenetic activation of nTS neurons to reverse fentanyl-induced respiratory depression is intriguing, results from these experiments may be difficult to interpret due to the extensive heterogeneity of the nTS. However, we are currently conducting similar experiments using a more selective approach that will allow us to isolate and evaluate specific nTS phenotypes to better understand their contributions to OIRD.

      (7) Are peripherally restricted mu opioid receptor (MOR) agonists available? If so, it would strengthen the paper if such compounds could be used to show that stimulation of peripheral MORs is sufficient to induce respiratory distress independent of actions on centrally located MORs.

      Peripherally acting Mu Opioid Receptor Antagonists (PAMORAs) are indeed available and currently being evaluated in our laboratory.

      Reviewer #2 (Recommendations for the authors):

      Consider having the figures/data numbered in the order that they appear in the manuscript. Right now, Figure 6 is mentioned between Figures 1 and 2 (minor).

      Thank you for this suggestion. We have reordered the figures so that the biodistribution figure appears before the MOR antagonist pretreatment and reversal figures.

      Reviewer #3 (Recommendations for the authors):

      This manuscript outlines a series of very exciting and game-changing experiments examining the role of peripheral MORs in OIRD. The authors outline experiments that demonstrate a peripherally restricted MOR antagonist (NLX Methiodide) can rescue fentanyl-induced respiratory depression and this effect coincides with a lack of conditioned place aversion. This approach would be a massive boon to the OUD community, as there are a multitude of clinical reports showing that naloxone rescue post fentanyl over-intoxication is more aversive than the potential loss-of-life to the individuals involved. This important study reframes our understanding of successful overdose rescue with potential for reduced aversive withdrawal effects.

      While this is an exciting and important study, there are a few minor to moderate critiques for the authors to consider. These are below.

      (1) Title: "devoid of aversive effects" - While CPA is a good, cumulative indicator of potential aversive effects, it is not an exhaustive one. Since no other withdrawal measures were included, this is an overstatement.

      The reviewer is correct in noting that our analysis of aversive effects is not exhaustive. Since we only assessed changes in aversive behavior between NLX and NLXM, we believe it is more accurate to modify the title accordingly. We have changed the title from “devoid of aversive effects” to “devoid of aversive behavior” better reflect the scope of the experiments conducted.

      (2) Page 3, top line: MOR (mu opioid receptor) is highly expressed...

      An article should likely be included prior to MOR or make plural and adjust the sentence.

      Thank you for this suggestion. We have reworked this section in the manuscript.

      (3) Figure 6D: this figure is very important for the interpretation of every single figure. It should either be moved to figure 1 or 2 or combined with figure 1 or 2.

      Thank you for this suggestion. The biodistribution figure has been moved to Figure 2.

      (4) Page 5, line 164, Figure 21-D: remove the 1.

      Done.

      (5) Sex differences (or lack thereof):

      Throughout the manuscript, the authors report a lack of sex differences. However, while the data is not powered for the distinction of sex differences, there appears to be a bi-modal distribution of the individual data points that likely correspond to sex across most experiments. For example, in Figure 2E there are both color and clear dots, which this reviewer assumes indicates sex (however, this wasn't easily apparent if it was commented on at all in the paper). If you look at the saline oxygen saturation (nadir) levels (2e), there is wide variability with the red-filled circles, but not the clear ones. This may indicate a bimodal distribution (and may be related to the baseline HR sex differences highlighted). This is also the case in Figure 2L but is perhaps more obvious in the CPA score data (Figure 4d), where it seems the nlx negative CPA effects were likely driven primarily by one sex. While this reviewer does not expect a full powering of experiments for sex differences (and also is very appreciative of the inclusion of both sexes), full raw data with sex indicated included in the supplemental data would greatly aid the field in general and allow for those with a specific interest in this area to build upon this data. Additionally, further discussion regarding the potential role of sex differences in the translational value of these findings is also warranted.

      For all bar graphs, open symbols represent females and filled symbols represent males. This information can be found in the first paragraph of the Materials and Methods section. We have also added this information to each figure for increased visibility. We appreciate the acknowledgement of our inclusion of both sexes. For all experiments, we attempted to balance by sex. Unfortunately, we occasionally had to exclude animals for technical reasons (with clogged catheters being the most common reason for exclusion). This sometimes led to an imbalance in sex in some groups, as the reviewer has noted. In the graph of oxygen saturation nadir values in Fig 2E (now Fig 3E in the revised manuscript, all animals received intravenous fentanyl at a dose of 20 ug/kg. The reviewer is correct that there is greater variability in the males (filled symbols) compared to the females (open symbols) in this graph. However, this variability in the distribution was not observed in Fig 1E or Fig 4E, in which male and female rats received an identical dose of 20 ug/kg. Taking this into account, our overall interpretation of the data is that there is relatively minor sex difference in the responses observed after intravenous fentanyl, and the variability in Fig 3E is primarily due to a lower n compared to Fig 1E.

      All raw data will be uploaded to a data repository.

      (6) Page 7, line 209: Figure 5D should be Figure 6D.

      We have incorporated this change.

      (7) Page 8, line 267: Cure should be Curve.

      We have incorporated this change.

      (8) Discussion: Page10, line322 states that "no detectable NLX ... was found in brain tissue". This is incorrect based on Figure 6.

      The sentence the reviewer highlighted refers to detection of NLX or NLXM in brain tissue from animals that received intravenous NLXM. As demonstrated in the biodistribution figure (now Figure 2 in the manuscript), our data demonstrate that an intravenous injection of NLXM did not result in NLX formation in the brain. We have reworked the sentence for clarity.

      (9) jGCaMP injections: Figure 5B/c shows the distribution of the gcamp across animals. The optic fiber is placed directly over the NTs. However, how are we certain there isn't a nearby nuclei/structure outside the NTS that is contributing to the photometry data presented in D-G?

      See our above comment.  

      (10) Fiber Photometry and Sex: These studies unfortunately may have had only 1 of a sex included in the fiber photometry data. While the inclusion is overall good, the single value for a sex suggests that there are differences, given the clustering of the data. While the anesthesia may be driving this potential sex effect, it is not clear based on the data presented. For reference: https://link.springer.com/article/10.1007/s12975-012-0229-y

      The reviewer is correct that there was an imbalance of sex in this dataset. While we made every attempt to balance for sex across all experiments, we unfortunately had to exclude some animals for technical reasons (clogged catheter, missed injection site, etc). This produced an imbalance in our photometry studies and did not allow us to thoroughly evaluate sex differences in fentanyl-induced changes in neural activity or in the responses to anesthesia. We have expanded on this limitation in the discussion.

      (11) Figure 5 - the bars are not the color indicated by the legend.

      We have corrected this in the figure. Thank you.

    1. Author response:

      Public Reviews:

      Reviewer #1 (Public Review):

      (1) It is a nice study but lacks some functional data required to determine how useful these alleles will be in practice, especially in comparison with the figure line that stimulated their creation.

      We are grateful for this comment. For the usefulness of these alleles, figure 3 shows that specific and efficient genetic manipulation of one cell subpopulation can be achieved by mating across the DreER mouse strain to the rox-Cre mouse strain. In addition, figure 6 shows that R26-loxCre-tdT can effectively ensure Cre-loxP recombination on some gene alleles and for genetic manipulation. The expression of the tdT protein is aligned with the expression of the Cre protein (Alb roxCre-tdT and R26-loxCre-tdT, figure 2 and figure 5), which ensures the accuracy of the tracing experiments. We believe more functional data can be shown in future articles that use mice lines mentioned in this manuscript.

      (2) The data in Figure 5 show strong activity at the Confetti locus, but the design of the newly reported R26-loxCre line lacks a WPRE sequence that was included in the iSure-Cre line to drive very robust protein expression.

      Thank you for coming up with this point in the manuscript. In the R26-loxCre-tdT mice knock-in strategy, the WPRE sequence is added behind the loxCre-P2A-tdT sequence.

      (3) the most valuable experiment for such a new tool would be a head-to-head comparison with iSure (or the latest iSure version from the Benedito lab) using the same CreER and target foxed allele. At the very least a comparison of Cre protein expression between the two lines using identical CreER activators is needed.

      According to the reviewer’s suggestion, we will compare iSuRe-Cre with R26-loxCre-tdT by using Alb-CreER and target R26-Confetti in the revised manuscript.

      (4) Why did the authors not use the same driver to compare mCre 1, 4, 7, and 10? The study in Figure 2 uses Alb-roxCre for 1 and 7 and Cdh5-roxCre for 4 and 10, with clearly different levels of activity driven by the two alleles in vivo. Thus whether mCre1 is really better than mCre4 or 10 is not clear.

      Thank you for raising this concern. After screening out four robust versions of mCre, we generated these four roxCre knock-in mice. It is unpredictable for us which is the most robust mCre in vivo. It might be one or two mCre versions that work efficiently. For example, if Alb-mCre1 was competitive with Cdh5-mCre10, we can use them for targeting genes in different cell types, broadening the potential utility of these mice.

      (5) Technical details are lacking. The authors provide little specific information regarding the precise way that the new alleles were generated, i.e. exactly what nucleotide sites were used and what the sequence of the introduced transgenes is. Such valuable information must be gleaned from schematic diagrams that are insufficient to fully explain the approach.

      Thank you for your careful suggestions.

      We will provide schematic figures as well as nucleotide sequences for mice generation in the revised manuscript.

      Reviewer #2 (Public Review):

      (1) The scenario where the lines would demonstrate their full potential compared to existing models has not been tested.

      We are grateful for this suggestion. We will compare iSuRe-Cre with R26-loxCre-tdT by using Alb-CreER and target R26-Confetti in the revised manuscript.

      (2) The challenge lies in performing such experiments, as low doses of tamoxifen needed for inducing mosaic gene deletion may not be sufficient to efficiently recombine multiple alleles in individual cells while at the same time accurately reporting gene deletion. Therefore, a demonstration of the efficient deletion of multiple floxed alleles in a mosaic fashion would be a valuable addition.

      Thank you for your constructive comments. Mosaic analysis using sparse labeling and efficient gene deletion would be our future direction using roxCre and loxCre strategies. We will include some discussion of using such strategy in the revised manuscript.

      (3) When combined with the confetti line, the reporter cassette will continue flipping, potentially leading to misleading lineage tracing results.

      Thank you for your professional comments. Indeed, the confetti used in this study can continue flipping, which would lead to potentially misleading lineage tracing results. Our use of R26-Confetti is to demonstrate the robustness of mCre for recombination. Some multiple-color mice lines that don’t flip have been published, for example, R26-Confetti2(10.1038/s41588-019-0346-6) and Rainbow (10.1161/CIRCULATIONAHA.120.045750). These reporters could be used for tracing Cre-expressing cells, without concerns of flipping of reporter cassettes.

      (4) Constitutive expression of Cre is also associated with toxicity, as discussed by the authors in the introduction.

      Thank you for your professional comments. The toxicity of constitutive expression of Cre and the toxicity associated with tamoxifen treatment in CreER mice line (10.1038/s44161-022-00125-6) are known to the field. This study can’t solve the toxicity of the constitutive expression of Cre in this work. Many mouse lines with constitutive Cre driven by different promoters are present across various fields, representing similar toxicity. To solve this issue, it would be possible to construct a new strategy that enables the removal of Cre after its expression.

      Reviewer #3 (Public Review):

      (1) Although leakiness is rather minor according to the original publication and the senior author of the study wrote in a review a few years ago that there is no leakiness(https://doi.org/10.1016/j.jbc.2021.100509).

      Thank you so much for your careful check. In this review (https://doi.org/10.1016/j.jbc. 2021.100509), the writer’s comments on iSuRe-Cre are on the reader's side, and all summary words are based on the original published paper (10.1038/s41467-019-10239-4). Currently, we have tested iSuRe-Cre in our hands. We did detect some leakiness in the heart and muscle, but hardly in other tissues as shown in the following figure.

      Author response image 1.

      Leakiness in Alb CreER;iSuRe-Cre mouse line. Pictures are representative results for 5 mice. Scale bars, white 100 µm.

      (2) I would have preferred to see a study, which uses the wonderful new tools to address a major biological question, rather than a primarily technical report, which describes the ongoing efforts to further improve Cre and Dre recombinase-mediated recombination.

      We gratefully appreciate your valuable comment. The roxCre and loxCre mice mentioned in this study provide more effective methods for inducible genetic manipulation in studying gene function. We hope that the application of our new genetic tools could help address some major biological questions in different biomedical fields in the future.

      (3) Very high levels of Cre expression may cause toxic effects as previously reported for the hearts of Myh6-Cre mice. Thus, it seems sensible to test for unspecific toxic effects, which may be done by bulk RNA-seq analysis, cell viability, and cell proliferation assays. It should also be analyzed whether the combination of R26-roxCre-tdT with the Tnni3-Dre allele causes cardiac dysfunction, although such dysfunctions should be apparent from potential changes in gene expression.

      We are sorry that we mistakenly spelled R26-loxCre-tdT into R26-roxCre-tdT in our manuscript. We have not generated R26-roxCre-tdT mouse line. We also thank the reviewer for concerns about the toxicity of high Cre expression. The toxicity of constitutive expression of Cre and the toxicity of tamoxifen treatment of CreER mice line (10.1038/s44161-022-00125-6) are known to the field. This study can’t solve the toxicity of the constitutive expression of Cre in this work. Many mouse lines with constitutive Cre driven by different promoters are present across various fields, representing similar toxicity. To solve this issue, it would be possible to construct a new strategy that enables the removal of Cre after its expression.

      (4) Is there any leakiness when the inducible DreER allele is introduced but no tamoxifen treatment is applied? This should be documented. The same also applies to loxCre mice.

      In this study, we come up with new mice tool lines, including Alb roxCre1-tdT, Cdh5 roxCre4-tdT, Alb roxCre7-GFP, Cdh5 roxCre10-GFP and R26-loxCre-tdT. As the data shown in supplementary figure 1, supplementary figure 2, and figure 4D, Alb roxCre1-tdT, Cdh5 roxCre4-tdT, Alb roxCre7-GFP, Cdh5 roxCre10-GFP and R26-loxCre-tdT are not leaky. Therefore, if there is any leakiness driven by the inducible DreER or CreER allele, the leakiness is derived from the DreER or CreER. We will supplement relevant experimental data in the revision.

      (5) It would be very helpful to include a dose-response curve for determining the minimum dosage required in Alb-CreER; R26-loxCre-tdT; Ctnnb1flox/flox mice for efficient recombination.

      Thank you for your suggestion. We understand the reviewer’s concern. We can do a dose-response curve in the revision work.

      (6) In the liver panel of Figure 4F, tdT signals do not seem to colocalize with the VE-cad signals, which is odd. Is there any compelling explanation?

      As the file-loading website has a file size limitation, the compressed image results in some signal unclear. The following are the zoom-out figures. The staining in Figure 4F will be optimized and high-resolution images will be provided in the revision.

      Author response image 2.

      (7) The authors claim that "virtually all tdT+ endothelial cells simultaneously expressed YFP/mCFP" (right panel of Figure 5D). Well, it seems that the abundance of tdT is much lower compared to YFP/mCFP. If the recombination of R26-Confetti was mainly triggered by R26-loxCre-tdT, the expression of tdT and YFP/mCFP should be comparable. This should be clarified.

      Thank you so much for your careful check. We checked these signals carefully and didn't find the “much lower” tdT signal. As the file-loading website has a file size limitation, the compressed image results in some signal unclear. We attached clear high resolution images here. The following figure shows how we split the tdT signal and compared it with YFP/mCFP.

      Author response image 3.

      (8) In several cases, the authors seem to have mixed up "R26-roxCre-tdT" with "R26-loxCre-tdT". There are errors in #251 and #256.Furthermore, in the passage from line #278 to #301. In the lines #297 and #300 it should probably read "Alb-CreER; R26-loxCretdT;Ctnnb1flox/flox"" rather than "Alb-CreER;R26-tdT2;Ctnnb1flox/flox".

      We are grateful for these careful observations. We have corrected these typos accordingly.

    1. Author response:

      The following is the authors’ response to the original reviews.

      Reviewer #1 (Public Review):

      (1) The questions after reading this manuscript are what novel insights have been gained that significantly go beyond what was already known about the interaction of these receptors and, more importantly, what are the physiological implications of these findings? The proposed significance of the results in the last paragraph of the Discussion section is speculative since none of the receptor interactions have been investigated in TNBC cell lines. Moreover, no physiological experiments were conducted using the PRLR and GH knockout T47D cells to provide biological relevance for the receptor heteromers. The proposed role of JAK2 in the cell surface distribution and association of both receptors as stated in the title was only derived from the analysis of box 1 domain receptor mutants. A knockout of JAK2 was not conducted to assess heteromers formation.

      We thank the reviewer for these comments. The novel insight is that two different cytokine receptors can interact in an asymmetric, ligand-dependent manner, such that one receptor regulates the other receptor’s surface availability, mediated by JAK2. To our knowledge this has not been reported before. Beyond our observations, there is the question if this could be a much more common regulatory mechanism and if it has therapeutic relevance. However, answering these questions is beyond the scope of this work.

      Along the same line, the question regarding the biological relevance of our receptor heteromers and JAK2’s role in cell surface distribution is undoubtfully very important. Studying GHR-PRLR cell surface distributions in JAK2 knockout cells and certain TNBC cell lines as proposed by the reviewer could perhaps be insightful. However, most TNBCs down-regulate PRLR [1], so we would first have to identify TNBC cell lines that actually express PRLR at sufficiently high levels. Moreover, knocking out JAK2 is known to significantly reduce GHR surface availability [2,3], such that the proposed experiment would probably provide only limited insights.

      Unfortunately, our team is currently not in the position to perform any experiments (due to lack of funding and shortage of personnel). However, to address the reviewer’s comment as much as possible, we have revised the respective paragraph of the discussion section to emphasize the speculative nature of our statement and have added another paragraph discussing shortcoming and future experiments (see revised manuscript, pages 23-24).

      (1) López-Ozuna, V., Hachim, I., Hachim, M. et al. Prolactin Pro-Differentiation Pathway in Triple Negative Breast Cancer: Impact on Prognosis and Potential Therapy. Sci Rep 6, 30934 (2016). https://www.nature.com/articles/srep30934

      (2) He, K., Wang, X., Jiang, J., Guan, R., Bernstein, K.E., Sayeski, P.P., Frank, S.J. Janus kinase 2 determinants for growth hormone receptor association, surface assembly, and signaling. Mol Endocrinol. 2003;17(11):2211-27. doi: 10.1210/me.2003-0256. PMID: 12920237.

      (3) He, K., Loesch, K., Cowan, J.W., Li, X., Deng, L., Wang, X., Jiang, J., Frank, S.J. Janus Kinase 2 Enhances the Stability of the Mature Growth Hormone Receptor, Endocrinology, Volume 146, Issue 11, 2005, Pages 4755–4765,https://doi.org/10.1210/en.2005-0514

      (2) Except for some investigation of γ2A-JAK2 cells, most of the experiments in this study were conducted on a single breast cancer cell line. In terms of rigor and reproducibility, this is somewhat borderline. The CRISPR/Cas9 mutant T47D cells were not used for rescue experiments with the corresponding full-length receptors and the box1 mutants. A missed opportunity is the lack of an investigation correlating the number of receptors with physiological changes upon ligand stimulation (e.g., cellular clustering, proliferation, downstream signaling strength).

      We appreciate the reviewer’s comments. While we are confident in the reproducibility of our findings, including those obtained in the T47D cell line, we acknowledge that testing in additional cell lines would have strengthened the generalizability of our results. We also recognize that performing a rescue experiment using our T47D hPRLR or hGHR KO cells would have been valuable. Furthermore, examining physiological changes, such as proliferation rates and downstream signaling responses, would have provided additional insights. Unfortunately, these experiments were not conducted at the time, and we currently lack the resources to carry them out.

      (3) An obvious shortcoming of the study that was not discussed seems to be that the main methodology used in this study (super-resolution microscopy) does not distinguish the presence of various isoforms of the PRLR on the cell surface. Is it possible that the ligand stimulation changes the ratio between different isoforms? Which isoforms besides the long form may be involved in heteromers formation, presumably all that can bind JAK2?

      This is a very good point. We fully agree with the reviewer that a discussion of the results in the light of different PRLR isoforms is appropriate. We have added information on PRLR isoforms to the Introduction (see revised manuscript, page 2) and Discussion sections (see revised manuscript, pages 23-24).

      (4) Changes in the ligand-inducible activation of JAK2 and STAT5 were not investigated in the T47D knockout models for the PRL and GHR. It is also a missed opportunity to use super-resolution microscopy as a validation tool for the knockouts on the single cell level and how it might affect the distribution of the corresponding other receptor that is still expressed.

      We thank the reviewer for his comment. We fully agree that such additional experiments could be very valuable. We are sorry but, as already mentioned above, this is not something we are able to address at this stage due to lack of personnel and funding. However, we do hope to address these and other proposed experiments in the future.

      (5) Why does the binding of PRL not cause a similar decrease (internalization and downregulation) of the PRLR, and instead, an increase in cell surface localization? This seems to be contrary to previous observations in MCF-7 cells (J Biol Chem. 2005 October 7; 280(40): 33909-33916).

      It has been recently reported for GHR that not only JAK2 but also LYN binds to the box1-box2 region, creating competition that results in divergent signaling cascades and affects GHR nanoclustering [1]. So, it is reasonable to assume that similar mechanisms may be at work that regulate PRLR cell surface availability. Differences in cells’ expression of such kinases could perhaps play a role in the perceived inconsistency. Also, Lu et al. [2] studied the downregulation of the long PRLR isoform in response to PRL. All other PRLR isoforms were not detectable in MCF-7 cells. So, differences between MCF-7 and T47D may lead to this perceived contradiction.

      At this stage, we can only speculate about the actual reasons for these seemingly contradictory results. However, for full transparency, we are now mentioning this apparent contradiction in the Discussion section (see page 23) and have added the references below.

      (1) Chhabra, Y., Seiffert, P., Gormal, R.S., et al. Tyrosine kinases compete for growth hormone receptor binding and regulate receptor mobility and degradation. Cell Rep. 2023;42(5):112490. doi: 10.1016/j.celrep.2023.112490. PMID: 37163374.

      https://www.cell.com/cell-reports/pdf/S2211-1247(23)00501-6.pdf

      (2) Lu, J.C., Piazza, T.M., Schuler, L.A. Proteasomes mediate prolactin-induced receptor down-regulation and fragment generation in breast cancer cells. J Biol Chem. 2005 Oct 7;280(40):33909-16. doi: 10.1074/jbc.M508118200. PMID: 16103113; PMCID: PMC1976473.

      (6) Some figures and illustrations are of poor quality and were put together without paying attention to detail. For example, in Fig 5A, the GHR was cut off, possibly to omit other nonspecific bands, the WB images look 'washed out'. 5B, 5D: the labels are not in one line over the bars, and what is the point of showing all individual data points when the bar graphs with all annotations and SD lines are disappearing? As done for the y2A cells, the illustrations in 5B-5E should indicate what cell lines were used. No loading controls in Fig 5F, is there any protein in the first lane? No loading controls in Fig 6B and 6H.

      We thank the reviewer for pointing this out. We have amended Fig. 5A to now show larger crops of the two GHR and PRLR Western Blot images and thus a greater range of proteins present in the extracts. Please note that the bands in the WBs other than what is identified as GHR and PRLR are non-specific and reflect roughly equivalent loading of protein in each lane.

      We also made some changes to Figures 5B-5E.

      (7) The proximity ligation method was not described in the M&M section of the manuscript.

      We thank the reviewer for pointing this out. We have added a description of the PL method to the Methods section.

      Reviewer #1 (Recommendations for the Authors):

      A final suggestion for future investigations: Instead of focusing on the heteromer formation of the GHR/PRLR which both signal all through the same downstream effectors (JAK2, STAT5), it would have been more cancer-relevant, and perhaps even more interesting, to look for heteromers between the PRLR and receptors of the IL-6 family since it had been shown that PRL can stimulate STAT3, which is a unique feature of cancer cells. If that is the case, this would require a different modality of the interaction between different JAK kinases.

      We highly appreciate the reviewer’s recommendation and hope to follow up on it in the near future.

      Reviewer #2 (Public Review):

      (1) I could not fully evaluate some of the data, mainly because several details on acquisition and analysis are lacking. It would be useful to know what the background signal was in dSTORM and how the authors distinguished the specific signal from unspecific background fluorescence, which can be quite prominent in these experiments. Typically, one would evaluate the signal coming from antibodies randomly bound to a substrate around the cells to determine the switching properties of the dyes in their buffer and the average number of localisations representing one antibody. This would help evaluate if GHR or PRLR appeared as monomers or multimers in the plasma membrane before stimulation, which is currently a matter of debate. It would also provide better support for the model proposed in Figure 8.

      We are grateful for the reviewer’s comment. In our experience, the background signal is more relevant in dSTORM when imaging proteins that are located at deeper depths (> 3 μm) above the coverslip surface. In our experiments, cells are attached to the coverslip surface and the proteins being imaged are on the cell membrane. In addition, we employed dSTORM’s TIRF (total internal reflection fluorescence) microscopy mode to image membrane receptor proteins. TIRFM exploits the unique properties of an induced evanescent field in a limited specimen region immediately adjacent to the interface between two media having different refractive indices. It thereby dramatically reduces background by rejecting fluorescence from out-of-focus areas in the detection path and illuminating only the area right near the surface.

      Having said that, a few other sources such as auto-fluorescence, scattering, and non-bleached fluorescent molecules close to and distant from the focal plane can contribute to the background signal. We tried to reduce auto-fluorescence by ensuring that cells are grown in phenol-red-free media, imaging is performed in STORM buffer which reduces autofluorescence, and our immunostaining protocol includes a quenching step aside from using blocking buffer with different serum, in addition to BSA. Moreover, we employed extensive washing steps following antibody incubations to eliminate non-specifically bound antibodies. Ensuring that the TIRF illumination field is uniform helps reduce scatter. Additionally, an extended bleach step prior to the acquisition of frames to determine localizations helped further reduce the probability of non-bleached fluorescent molecules.

      In short, due to the experimental design we do not expect much background. However, in the future, we will address this concern and estimate background in a subtype dependent manner. To this end we will distinguish two types of background noise: (A) background with a small change between subsequent frames, which mainly consists of auto-fluorescence and non-bleached out-of-focus fluorescent molecules; and (B) background that changes every imaging frame, which is mainly from non-bleached fluorescent molecules near the focal plane. For type (A) background, temporal filters must be used for background estimation [1]; for type (B) background, low-pass filters (e.g., wavelet transform) should be used for background estimation [2].

      (1) Hoogendoorn, Crosby, Leyton-Puig, Breedijk, Jalink, Gadella, and Postma (2014). The fidelity of stochastic single-molecule super-resolution reconstructions critically depends upon robust background estimation. Scientific reports, 4, 3854. https://doi.org/10.1038/srep03854

      (2) Patel, Williamson, Owen, and Cohen (2021). Blinking statistics and molecular counting in direct stochastic reconstruction microscopy (dSTORM). Bioinformatics, Volume 37, Issue 17, September 2021, Pages 2730–2737, https://doi.org/10.1093/bioinformatics/btab136

      (2) Since many of the findings in this work come from the evaluation of localisation clusters, an image showing actual localisations would help support the main conclusions. I believe that the dSTORM images in Figures 1 and 2 are density maps, although this was not explicitly stated. Alexa 568 and Alexa 647 typically give a very different number of localisations, and this is also dependent on the concentration of BME. Did the authors take that into account when interpreting the results and creating the model in Figures 2 and 8?

      I believe that including this information is important as findings in this paper heavily rely on the number of localisations detected under different conditions.

      Including information on proximity labelling and CRISPR/Cas9 in the methods section would help with the reproducibility of these findings by other groups.

      Figures 1 and 2 show Gaussian interpolations of actual localizations, not density maps. Imaging captured the fluorophores’ blinking events and localizations were counted as true localizations, when at least 5 consecutive blinking events had been observed. Nikon software was used for Gaussian fitting. In other words, we show reconstructed images based on identifying true localizations using gaussian fitting and some strict parameters to identify true fluorophore blinking. This allowed us to identify true localizations with high confidence and generate a high-resolution image for membrane receptors.

      Indeed, Alexa 568 and 647 give different numbers of localization. This is dependent on the intrinsic photo-physics of the fluorophores. Specifically, each fluorophore has a different duty cycle, switching cycle, and survival fraction. However, we note that we focused on capturing the relative changes in receptor numbers over time, before and after stimulation by ligands, not the absolute numbers of surface GHR and PRLR. We are not comparing the absolute numbers of localizations or drawing comparisons for localization numbers between 568 and 647. For all these different conditions/times, the photo-physics for a particular fluorophore remains the same. This allows us to make relative comparisons.

      As far as the effect of BME is concerned, the concentration of mercaptoethanol needs to be carefully optimized, as too high a concentration can potentially quench the fluorescence or affect the overall stability of the sample. However, we are using an optimized concentration which has been previously validated across multiple STORM experiments. This makes the concerns relating to the concentration of BME irrelevant to the current experimental design. Besides, the concentration of BME is maintained across all experimental conditions.

      We have added information regarding PL and CRISPR/Cas9 for generating hGHR KO and hPRLR KO cells in two new subsections to the Methods section.

      Reviewer #2 (Recommendations for the authors):

      In the methods please include:<br /> (1) A section with details on proximity ligation assays.

      We have added a description of the PL method to the Methods section.

      (2) A section on CRISPR/Cas9 technology.

      We have added two new sections on “Generating hGHR knockout and hPRLR knockout T47D cells” and “Design of sgRNAs for hGHR  or hPRLR knockout” to the Methods section.

      (3) List the precise composition of the buffer or cite the paper that you followed.

      We used the buffer recipe described in this protocol [1] and have added the components with concentrations as well as the following reference to the manuscript.

      (1) Beggs, R.R., Dean, W.F., Mattheyses, A.L. (2020). dSTORM Imaging and Analysis of Desmosome Architecture. In: Turksen, K. (eds) Permeability Barrier. Methods in Molecular Biology, vol 2367. Humana, New York, NY. https://doi.org/10.1007/7651_2020_325

      (4) Exposure time used for image acquisition to put 40 000 frames in the context of total imaging time and clarify why you decided to take 40 000 images per channel.

      Our Nikon Ti2 N-STORM microscope is equipped with an iXon DU-897 Ultra EMCCD camera from Andor (Oxford Instruments). According to the camera’s manufacturer, this camera platform uses a back-illuminated 512 x 512 frame transfer sensor and overclocks readout to 17 MHz, pushing speed performance to 56 fps (in full frame mode). We note that we always tried to acquire STORM images at the maximal frame rate. As for the exposure time, according to the manufacturer it can be as short as 17.8 ms. We would like to emphasize that we did not specify/alter the exposure time.

      See also: https://andor.oxinst.com/assets/uploads/products/andor/documents/andor-ixon-ultra-emccd-specifications.pdf

      The decision to take 40,000 images per frame was based on our intention to identify the true population of the molecules of interest that are localized and accurately represented in the final reconstruction image. The total number of frames depends on the sample complexity, density of sample labeling and desired resolution. We tested a range of frames between 20,000 and 60,000 and found for our experimental design and output requirements that 40,000 frames provided the best balance between achieving maximal resolution and desired localizations to make consistent and accurate localization estimates across different stimulation conditions compared to basal controls.

      (5) The lasers used to switch Alexa 568 and Alexa 647. Were you alternating between the lasers for switching and imaging of dyes? Intermittent and continuous illumination will produce very different unspecific background fluorescence.

      Yes, we used an alternating approach for the lasers exciting Alexa 647 and Alexa 568, for both switching and imaging of the dyes.

      (6) A paragraph with a detailed description of methods used to differentiate the background fluorescence from the signal.

      We have addressed the background fluorescence under Point 1 (Public Review). We have added a paragraph in the Methods section on this issue.

      (7) Minor corrections to the text:

      It appears as though there is a large difference in the expression level of GHR and PRLR in basal conditions in Figure 1. This can be due to the switching properties of the dyes, which is related to the amount of BME in the buffer, or it can be because there is indeed more PRL. Would the authors be able to comment on this?

      We thank the reviewer for this suggestions. According to expression data available online there is indeed more PRLR than GHR in T47D cells. According to CellMiner [1], T47D cells have an RNA-Seq gene expression level log2(FPKM + 1) of 6.814 for PRLR, and 3.587 for GHR, strongly suggesting that there is more PRLR than GHR in basal conditions, matching the reviewer’s interpretation of our images in Fig. 1 (basal). However, we would advise against using STORM images for direct comparisons of receptor expression. First, with TIRF images, we are only looking at the membrane fraction (~150 nm close to the coverslip membrane interface) that is attached to the coverslip. Secondly, as discussed above, our data represent relative cell surface receptor levels that allow for comparison of different conditions (basal vs. stimulation) and does not represent absolute quantifications. Everything is relative and in comparison to controls.

      Also, BME is not going to change the level of expression. The differences in growth factor expression as estimated by relative comparison can be attributed to the actual changes in growth factors and is not an artifact of the amount of BME in the buffer or the properties of dyes. These factors are maintained across all experimental conditions and do not influence the final outcome.

      (1) https://discover.nci.nih.gov/cellminer/

      (8) I would encourage the authors to use unspecific binding to characterize the signal coming from single antibodies bound to the substrate. This would provide a mean number of localizations that a single antibody generates. With this information, one can evaluate how many receptors there are per cluster, which would strengthen the findings and potentially provide additional support for the model presented in Figure 8. It would also explain why the distributions of localisations per cluster in Fig. 3B look very different for hGHR and hPRLR. As the authors point out in the discussion, the results on predimerization of these receptors in basal conditions are conflicting and therefore it is important to shed more light on this topic.

      We thank the reviewer for this suggestions. While we are unable to perform this experiment at this stage, we will keep it in mind for future experiments.

      (9) Minor corrections to the figures:

      Figure 1:

      In the legend, please say what representation was used. Are these density maps or another representation? Please provide examples of actual localisations (either as dots or crosses representing the peaks of the Gaussians). Most findings of this work rely on the characterisation of the clusters of localisations and therefore it is of essence to show what the clusters look like. This could potentially go to the supplemental info to minimise additional work. It's very hard to see the puncta in this figure.

      If the authors created zoomed regions in each of the images (as in Figure 3), it would be much easier to evaluate the expression level and the extent of colocalisation. Halfway through GHR 3 min green pixels become grey, but this may be the issue with the document that was created. Please check. Either increase the font on the scale bars in this figure or delete it.

      As described above, Figure 1 does not show density maps. Imaging captured the fluorophores’ blinking events and localizations were counted as true localizations, when at least 5 consecutive blinking events had been observed. Nikon software was used for Gaussian fitting and smoothing.

      We have generated zoomed regions. In our files (original as well as pdf) we do not see pixels become grey. We increased the font size above one of the scale bars and removed all others.

      Figure 3:

      In A, the GHR clusters are colour coded but PRLR are not. Are both DBSCN images? Explain the meaning of colour coding or show it as black and white. Was brightness also increased in the PRLR image? The font on the scale bars is too small. In B, right panels, the font on the axes is too small. In the figure legend explain the meaning of 33.3 and 16.7

      In our document, both GHR and PRLR are color coded but the hGHR clusters are certainly bigger and therefore appear brighter than the hPRLR clusters. Both are DBSCAN images. The color coding allows to distinguish different clusters (there is no other meaning). We have kept the color-coding but have added a sentence to the caption addressing this. Brightness was increased in both images of Panel B equally. 33.3 and 16.7 are the median cluster sizes. We have added a sentence to the caption explaining this. We have increased the font on the axes in B (right panels).

      Figure 4:

      I struggled to see any colocalization in the 2nd and the 3rd image. Please show zoomed-in sections. In the panels B and C, the data are presented as fractions. Is this per cell? My interpretation is that ~80% of PRL clusters also contain GHR.

      Is this in agreement with Figures 1 and 2? In Figure 1, PRL 3 min, Merge, colocalization seems much smaller. Could the authors give the total numbers of GHR and PRLR from which the fractions were calculated at least in basal conditions?

      We have provided zoom-in views. As for panels B and C, fractions are number of clusters containing both receptors divided by the total number of clusters. We used the same strategy that we had used for calculating the localization changes: We randomly selected 4 ROIs (regions of interest) per cell to calculate fractions and then calculated the average of three different cells from independently repeated experiments. We did not calculate total numbers of GHR/PRLR. The numbers are fractions of cluster numbers.

      Moreover, the reviewer interprets results in panels B and C that ~80% of PRLR clusters also contain GHR. We assume the reviewer refers to Basal state. Now, the reviewer’s interpretation is not correct for the following reason: ~80% of clusters have both receptors. How many of the remaining (~20%) clusters have only PRLR or only GHR is not revealed in the panels. Only if 100% of clusters have PRLR, we can conclude that 80% of PRLR clusters also contain GHR.

      Also, while Figures 1 and 2 show localization based on dSTORM images, Figure 3 indicates and quantifies co-localization based on proximity ligation assays following DBSCAN analysis using Clus-DoC. We do not think that the results are directly comparable.

      Reviewer #3 (Public Review):

      (1) The manuscript suffers from a lack of detail, which in places makes it difficult to evaluate the data and would make it very difficult for the results to be replicated by others. In addition, the manuscript would very much benefit from a full discussion of the limitations of the study. For example, the manuscript is written as if there is only one form of the PRLR while the anti-PRLR antibody used for dSTORM would also recognize the intermediate form and short forms 1a and 1b on the T47D cells. Given the very different roles of these other PRLR forms in breast cancer (Dufau, Vonderhaar, Clevenger, Walker and other labs), this limitation should at the very least be discussed. Similarly, the manuscript is written as if Jak2 essentially only signals through STAT5 but Jak2 is involved in multiple other signaling pathways from the multiple PRLRs, including the long form. Also, while there are papers suggesting that PRL can be protective in breast cancer, the majority of publications in this area find that PRL promotes breast cancer. How then would the authors interpret the effect of PRL on GHR in light of all those non-protective results? [Check papers by Hallgeir Rui]

      We thank the reviewer for such thoughtful comments. We have added a paragraph in the Discussion section on the limitations of our study, including sole focus on T47D and γ2A-JAK2 cells and lack of PRLR isoform-specific data. Also, we are now mentioning that these isoforms play different roles in breast cancer, citing papers by Dufau, Vonderhaar, Clevenger, and Walker labs.

      We did not mean to imply that JAK2 signals only via STAT5 or by only binding the long form. We have made this point clear in the Introduction as well as in our revised Discussion section. Moreover, we have added information and references on JAK2 signaling and PRLR isoform specific signaling.

      In our Discussions section we are also mentioning the findings that PRL is promoting breast cancer. We would like to point out that it is well perceivable that PRL is protective in BC by reducing surface hGHR availability but that this effect may depend on JAK2 levels as well as on expression levels of other kinases that competitively bind Box1 and/or Box2 [1]. Besides, could it not be that PRL’s effect is BC stage dependent? In any case, we have emphasized the speculative nature of our statement.

      (1) Chhabra, Y., Seiffert, P., Gormal, R.S., et al. Tyrosine kinases compete for growth hormone receptor binding and regulate receptor mobility and degradation. Cell Rep. 2023;42(5):112490. doi: 10.1016/j.celrep.2023.112490. PMID: 37163374.

      Reviewer #3 (Recommendations for the authors):

      Points for improvement of the manuscript:

      (1) Method details -

      a) "we utilized CRISPR/Cas9 to generate hPRLR knockout T47D cells ......" Exactly how? Nothing is said under methods. Can we be sure that you knocked out the whole gene?

      We have addressed this point by adding two new sections on “Generating hGHR knockout and hPRLR knockout T47D cells” and “Design of sgRNAs for hGHR or hPRLR knockout” to the Methods section.

      b) Some of the Western blots are missing mol wt markers. How specific are the various antibodies used for Westerns? For example, the previous publications are quoted as providing characterization of the antibodies also seem to use just band cutouts and do not show the full molecular weight range of whole cell extracts blotted. Anti-PRLR antibodies are notoriously bad and so this is important.

      There is an antibody referred to in Figure 5 that is not listed under "antibodies" in the methods.

      We have modified Figure 5a, showing the entire gel as well as molecular weight markers. As for specificity of our antibodies, we used monoclonal antibodies Anti-GHR-ext-mAB 74.3 and Anti-PRLR-ext-mAB 1.48, which have been previously tested and used. In addition, we did our own control experiments to ensure specificity. We have added some of our many control results as Supplementary Figures S2 and S3.

      We thank the reviewer for noticing the missing antibody in the Methods section. We have now added information about this antibody.

      c) There is no description of the proximity ligation assay.

      We have addressed this by adding a paragraph on PLA in the Methods section.

      d) What is the level of expression of GHR, PRLR, and Jak2 in the gamma2A-JAK2 cells compared to the T47D cells? Artifacts of overexpression are always a worry.

      γ2A-JAK2 cell series are over-expressing the receptors. That’s the reason we did not only rely on the observation in γ2A-JAK2 cell lines but also did the experiment in T47D cell lines.

      e) There are no concentrations given for components of the dSTORM imaging buffer. On line 380, I think the authors mean alternating lasers not alternatively.

      Thank you. Indeed, we meant alternating lasers. We are referring to [1] (the protocol we followed) for information on the imaging buffer.

      (1) Beggs, R.R., Dean, W.F., Mattheyses, A.L. (2020). dSTORM Imaging and Analysis of Desmosome Architecture. In: Turksen, K. (eds) Permeability Barrier. Methods in Molecular Biology, vol 2367. Humana, New York, NY. https://doi.org/10.1007/7651_2020_325

      f) In general, a read-through to determine whether there is enough detail for others to replicate is required. 4% PFA in what? Do you mean PBS or should it be Dulbecco's PBS etc., etc.?

      We prepared a 4% PFA in PBS solution. We mean Dulbecco's PBS.

      (2) There are no controls shown or described for the dSTORM. For example, non-specific primary antibody and second antibodies alone for non-specific sticking. Do the second antibodies cross-react with the other primary antibody? Is there only one band when blotting whole cell extracts with the GHR antibody so we can be sure of specificity?

      We used monoclonal antibodies Anti-GHR-ext-mAB 74.3 and Anti-PRLR-ext-mAB 1.48 (but also tested several other antibodies). While these antibodies have been previously tested and used, we performed additional control experiments to ensure specificity of our primary antibodies and absence of non-specific binding of our secondary antibodies. We have added some of our many control results as Supplementary Figures S2 and S3.

      (3) Writing/figures-

      a) As discussed in the public review regarding different forms of the PRLR and the presence of other Jak2-dependent signaling

      We have added paragraphs on PRLR isoforms and other JAK2-dependent signaling pathways to the Introduction. Also, we have added a paragraph on PRLR isoforms (in the context of our findings) to the Discussion section.

      b) What are the units for figure 3c and d?

      The figures show numbers of localizations (obtained from fluorophore blinking events). In the figure caption to 3C and 3D, we have specified the unit (i.e. counts).

      c) The wheat germ agglutinin stains more than the plasma membrane and so this sentence needs some adjustment.

      We thank the reviewer for this comment. We have rephrased this sentence (see caption to Fig. 4).

      d) It might be better not to use the term "downregulation" since this is usually associated with expression and not internalization.

      While we understand the reviewer’s discomfort with the use of the word “downregulation”, we still think that it best describes the observed effect. Moreover, we would like to note that in the field of receptorology “downregulation” is a specific term for trafficking of cell surface receptors in response to ligands. That said, to address the reviewer’s comment, we are now using the terms “cell surface downregulation” or “downregulation of cell surface [..] receptor” throughout the manuscript in order to explicitly distinguish it from gene downregulation.

      e) Line 420 talks about "previous work", a term that usually indicates work from the same lab. My apologies if I am wrong, but the reference doesn't seem to be associated with the authors.

      At the end of the sentence containing the phrase “previous work”, we are referring to reference [57], which has Dr. Stuart Frank as senior and corresponding author. Dr. Frank is also a co-corresponding author on this manuscript. While in our opinion, “previous work” does not imply some sort of ownership, we are happy to confirm that one of us was responsible for the work we are referencing.

      Reviewing Editor's recommendations:

      The reviewers have all provided a very constructive assessment of the work and offered many useful suggestions to improve the manuscript. I'd advise thinking carefully about how many of these can be reasonably addressed. Most will not require further experiments. I consider it essential to improve the methods to ensure others could repeat the work. This includes adding methods for the PLA and including detail about the controls for the dSTORM. The reviewers have offered suggestions about types of controls to include if these have not already been done.

      We thank the editor for their recommendations. We have revised the methods section, which now includes a paragraph on PLA as well as on CRISPR/Cas9-based generation of mutant cell lines. We have also added information on the dSTORM buffer to the manuscript. Data of controls indicating antibody specificity (using confocal microscopy) have been added to the manuscript’s supplementary material (see Fig. S2 and S3).

      I agree with the reviewers that the different isoforms of the prolactin receptor need to be considered. I think this could be done as an acknowledgment and point of discussion.

      We have revised the discussions section and have added a paragraph on the different PRLR isoforms, among others.

      For Figure 2E, make it clear in the figure (or at least in legend) that the middle line is the basal condition.

      We thank the editor for their comment. We have made changes to Fig 2E and have added a sentence to the legend making it clear that the middle depicts the basal condition.

      My biggest concern overall was the fact that this is all largely conducted in a single cell line. This was echoed by at least one of the reviewers. I wonder if you have replicated this in other breast cancer cell lines or mammary epithelial cells? I don't think this is necessary for the current manuscript but would increase confidence if available.

      We thank the editor for their comment and fully agree with their assessment. Unfortunately, we have not replicated these experiments in other BC cell lines nor mammary epithelial cells but would certainly want to do so in the near future.

    1. Author response:

      The following is the authors’ response to the original reviews.

      Public Reviews:

      Reviewer #1 (Public review):

      Summary:

      In this manuscript, the authors investigate the role of microtubule dynamics and its effects on neuronal aging. Using C. elegans as a model, the authors investigate the role of evolutionarily conserved Hippo pathway in microtubule dynamics of touch receptor neurons (TRNs) in an age-dependent manner. Using genetic, molecular, behavioral, and pharmacological approaches, the authors show that age-dependent loss of microtubule dynamics might underlie structural and functional aging of TRNs. Further, the authors show that the Hippo pathway specifically functions in these neurons to regulate microtubule dynamics. Specifically, authors show that hyperactivation of YAP-1, a downstream component of the Hippo pathway that is usually inhibited by the kinase activity of the upstream components of the pathway, results in microtubule stabilization and that might underlie the structural and functional decline of TRNs with age. However, how the Hippo pathway regulates microtubule dynamics and neuronal aging was not investigated by the authors.

      Strengths:

      This is a well-conducted and well-controlled study, and the authors have used multiple approaches to address different questions.

      Weaknesses:

      There are no major weaknesses identified, except that the effect of the Hippo pathway seems to be specific to only a subset of neurons. I would like the authors to address the specificity of the effect of the Hippo pathway in TRNs, in their resubmission.

      Although our genetic experiments, including TRNs-specific rescue/overexpression of YAP-1 and knockdown of WTS-1, strongly suggest that a cell-autonomous function of WTS-1-YAP-1 axis in TRNs, the Hpo pathway could have broader roles in neuroprotection. While this pathway may regulate microtubules stability in multiple neurons, other characteristics of TRNs, such as their anatomical localization near the cuticle or their long projections along body axis, could contribute to their susceptibilities to age-related deformation. Otherwise, the Hpo pathway may be truly TRNs-specific. TRNs have unique microtubules in both terms of composition and structure. Among nine α-, six β-tubulin genes in C. elegans, one α-tubulin (mec-12) and one β-tubulin (mec-7) showed highly enriched expression in TRNs [1, 2] and TRNs contain special 15-protofilament microtubule structure, while all other neurons in C. elegans have 11-protofilament microtubules [3]. Transcriptional regulation through YAP-1 may affect the specific microtubule structure of TRNs, leading to premature neuronal deformation. We have included this in the discussion section of the revised manuscript.

      Reviewer #2 (Public review):

      Summary:

      This study examines a novel role of the Hpo signaling pathway, specifically of wts-1/LATS and the downstream regulator of gene expression, yap, in age-related neurodegeneration in C. elegans touch-responsive mechanosensory neurons, ALM and PLM. The study shows that knockdown or deletion of wts-1/LATS causes age-associated morphological abnormalities of these neurons, accompanied by functional loss of touch responsiveness. This is further associated with enhanced, abnormal, microtubule stabilization in these neurons.

      Strengths:

      This study examines a novel role of the Hpo signaling pathway, specifically of wts-1/LATS and the downstream regulator of gene expression, yap, in age-related neurodegeneration in C. elegans touch-responsive mechanosensory neurons, ALM and PLM. The study shows that knockdown or deletion of wts-1/LATS causes age-associated morphological abnormalities of these neurons, accompanied by functional loss of touch responsiveness. This is further associated with enhanced, abnormal, microtubule stabilization in these neurons. Strong pharmacological and especially genetic manipulations of MT-stabilizing or severing proteins show a strong genetic link between yap and regulation of MTs stability. The study is strong and uses robust approaches, especially strong genetics. The demonstrations on the aging-related roles of the Hpo signaling pathway, and the link to MTs, are novel and compelling. Nevertheless, the study also has mechanistic weaknesses (see below).

      Weaknesses:

      Specific comments:

      (1) The study demonstrates age-specific roles of the Hpo pathway, specifically of wts-1/LATS and yap, specifically in TRN mechanosensory neurons, without observing developmental defects in these neurons, or effects in other neurons. This is a strong demonstration. Nevertheless, the study does not address whether there is a correlation of Hpo signaling pathway activity decline specifically in these neurons, and not other neurons, and at the observed L4 stage and onwards (including the first day of adulthood, 1DA stage). Such demonstrations of spatio-temporal regulation of the Hpo signaling pathway and its activation seem important for linking the Hpo pathway with the observed age-related neurodegeneration. Can this age-related response be correlated to indeed a decline in Hpo signaling during adulthood? Especially at L4 and onwards? It will be informative to measure this by examining the decline in wts1 as well as yap levels and yap nuclear localization.

      As described above, we have included possible explanations for the specificity of the Hpo pathway in TRNs. Since components of the Hpo pathway are expressed in various tissues, including the intestine and hypodermis, this pathway could have broader neuroprotective roles across multiple neurons. Alternatively, it could function in TRNs. Given that the TRNs possess unique microtubules in both structure and composition, and that Hpo pathway has crucial roles in microtubule stability regulation, the roles of the Hpo pathway may indeed be TRNs-specific. As we described in the manuscript, our observations, along with those of others, indicate that neuronal deformation of TRNs begins around the 4th day of adulthood. Additionally, the degree of morphological deformation in wts-1 mutants at the L4 stage is comparable to that of aged wild-type worms on the 15th day of adulthood. Therefore, to assess the functional decline of WTS-1 or nuclear localization of YAP-1, observations should begin in 4-day-old animals. Using fluorescence-tagged YAP-1 under the mec-4 promoter, we couldn’t detect a significant increase in nuclear YAP-1 in TRNs of 4-day-old adult. Additionally, we were unable to assess YAP-1 intercellular localization in older animals, such as 10-day-old animals, possibly due to the small cell size of neurons or morphological alteration along with aging of TRNs. Although we did not detect functional decline of WTS-1 or increased nuclear YAP-1 in TRNs, nuclear localization of YAP-1 increases with age in other tissues, such as the intestine and hypodermis (Author response image. 1). This may result from inactivation of the Hippo (Hpo) pathway, an indirect consequence of structural and functional decline—such as tissue stiffness associated with aging—or a combination of both. Additionally, given that morphological deformation of TRNs appears to begin around fourth day of adulthood, nuclear localization of YAP-1 in the intestine and hypodermis seems to have a later onset and be more moderate. It is possible that YAP-1 nuclear localization in TRNs occurs earlier or that other factors contribute early-stage touch neuronal deformation.

      Author response image 1.

      Quantification of the proportion of worms exhibiting nuclear localization of YAP-1. We used GFP-tagged YAP-1 driven by its own 4 kb promoter. A total of 90 animals were observed each day.

      (2) The Hpo pathway eventually activates gene expression via yap. Although the study uses robust genetic manipulations of yap and wts-1/LATS, it is not clear whether the observed effects are attributed to yap-mediated regulation of gene expression (see 3).

      Given that the neuronal deformation in the wts-1 mutant was completely restored by the loss of yap-1 or egl-44, it strongly suggests that YAP-TEAD-mediated transcriptional regulation is responsible for the premature neuronal degeneration of the wts-1 mutant. However, in this study, we were unable to identify specific transcriptional target genes associated with these phenomena, which represents a limitation of our research (please see below).

      (3) The observations on the abnormal MT stabilization, and the subsequent genetic examinations of MT-stability/severing genes, are a significant strength of the study. Nevertheless, despite the strong genetic links to yap and wts-1/LATS, it is not clear whether MT-regulatory genes are regulated by transcription downstream of the Hpo pathway, thus not enabling a strong causal link between MT regulation and Hpo-mediated gene expression, making this strong part of the study mechanistically circumstantial. Specifically, it will be good to examine whether the genes addressed herein, for example, Spastin, are transcriptionally regulated downstream of the Hpo pathway. This comment is augmented by the finding that in the wts-1/ yap-1 double mutants, MT abnormality, and subsequent neuronal morphology and touch responses are restored, clearly indicating that there is an associated transcriptional regulation

      If the target genes of YAP-1 are not identified, it will be difficult to fully understand how YAP-1 regulates microtubule stability. Microtubule-stabilizing genes, whose knockdown alleviates wts-1 mutant neuronal deformation, could be potential transcriptional targets of YAP-1. Among these genes, PTRN-1 and DLK-1 contain MCAT sequences (CATTCCA/T), a well-conserved DNA motif recognized by the TEAD transcription factor, in their promoters near the transcription start site (TSS). We hypothesized that the expression of fluorescence-tagged reporters of promoter regions containing these MCAT sequences would be enhanced in the absence of wts-1 activity. Although both reporters were expressed in TRNs, they did not show significant changes in the wts-1 mutant background. We also focused on spv-1, a worm homolog of ARHGAP29, which negatively regulates RhoA. YAP is known to modulate actin cytoskeleton rigidity through transcriptional regulation of ARHGAP29 [4]. The promoter of spv-1 contains 2 MCAT sequences and loss of spv-1 mitigated neuronal deformation of the wts-1 mutant. However, reporters of promoter regions containing MCAT sequences only weakly expressed in the process of TRNs. More importantly, ectopic expression of dominant-negative form of rho-1/rhoA did not lead to significant deformation of TRNs. While YAP typically functions as a transcriptional co-activator, it has also been reported to repress target gene expression, such as DDIT4 and Trail, in collaborated with TEAD transcriptional factor [5].  As a reviewer pointed out, spas-1 might be transcriptionally repressed by yap-1, given that its loss leads to premature deformation of TRNs. However, since the phenotype of the spas-1 mutant has a later onset than the wts-1 mutant and is relatively restricted to ALM, we excluded it from our candidate gene search. Despite extensive genetic approaches, we were unable to establish a strong causal link between YAP-1 and the regulation of microtubule stability. Unbiased screenings, such as tissue-specific transcriptome analysis, may help address the remaining questions. We have outlined the limitations of this study in the discussion section of the revised manuscript.

      Other comments:

      (1) The TRN-specific knockdown of wts-1 and yap-1 is a clear strength. Nevertheless, these do not necessarily show cell-autonomous effects, as the yap transcription factor may regulate the expression of external cues, secreted or otherwise, thus generating non-cell autonomous effects. For example, it is known that yap regulates TGF-beat expression and signaling.

      In the absence of LATS1/2 activity, activated YAP has been reported to drive biliary epithelial cell lineage specification by directly regulating TGF-β transcription during and after liver development [6]. Even when functioning in an autocrine manner, TGF-β can exhibit non-cell autonomous effects. While it primarily acts on the same cell that secretes it, some molecules may also affect neighboring cells, leading to paracrine effects. Additionally, TGF-β can modify the extracellular matrix (ECM), indirectly affecting surrounding cells. Similarly, if YAP regulates transcription of secretory protein in TRNs, the resulting extracellular factors or surrounding cells may influence touch neuronal microtubules in a non-cell-autonomous manner. Although our genetic data strongly suggest a cell-autonomous function of WTS-1-YAP-1 in TRNs, we could not exclude the possibility that YAP-1 functions non-cell-autonomously, as we were unable to identify its transcriptional targets. We have included this in the discussion section of the revised manuscript.

      (2) Continuing from comment (3) above, it seems that many of the MT-regulators chosen here for genetic examinations were chosen based on demonstrated roles in neurodegeneration in other studies. It would be good to show whether these MT-associated genes are directly regulated by transcription by the Hpo pathway.

      As we described above, several MT-associated genes­­, such as ptrn-1, dlk-1 and spv-1, contain MCAT sequences in their promoter and their knockdown alleviated wts-1-induced neuronal deformation. These genes were tested to determine whether they were directly regulated by WTS-1-YAP-1. Based on our findings, we concluded that they were unlikely to be regulated by the Hpo pathway in TRNs.

      (3) The impairment of the touch response may not be robust: it is only a 30-40% reduction at L4, and even less reduction at 1DA. It would be good to offer possible explanations for this finding.

      As pointed out by the reviewer, the impairment of touch responses of wts-1 mutants showed an approximately 33% reduction at both L4 and 1DA compared to age-matched wild-type animals. At the L4 stage, control worms responded to nearly every gentle touch (94%), whereas wts-1 mutants responded to only 60% of stimuli. By 1DA, control worms exhibited slightly decline in touch responses compared to L4 (82.5%), whereas wts-1 mutants displayed more pronounced impairment (55.7%) (Fig 1E). Regarding the severity and frequency of structural degeneration of wts-1 mutant at both stages, it appears to be relatively moderate. As we noted in the manuscript, our observations, along with those of others, indicate that structural abnormalities in ALM and PLM neurons begin to appear around the fourth day of adulthood and progressively worsen as the worms age [7]. In a previous study, Tank et al. categorized day 10-aged worms into two groups based on their movement ability and then assessed structural deformation in each animal to determine whether structural and functional degeneration of TRNs were correlated. In this same group of animals, they examined the gentle touch response and found that animals responded to gentle touch 46 ± 5.1 %, 84 ± 12.2 %, respectively [8]. It could be said that, on average, day 10 animals had 65% touch response on average, which is consistent with our observation in day 10 animals (Fig. 5E, 56.3%). Given these observations, the function of TRNs of wts-1 mutant or aged animals appears to be preserved despite severe structure failures. The gentle touch response evokes an escape behavior in which animals quickly move away from the stimulus; thus proper touch responses are essential for avoiding predators and ensuring survival. It has been reported to be necessary for evading fungal predation, such as escaping from a constricting hyphal ring [9]. Given that the gentle touch response is crucial for survival, its function is likely well preserved despite structural abnormalities, such as age-related deformation.

      Reviewer #1 (Recommendations for the authors):

      Major comments:

      (1) Why is the effect of the Hippo pathway on microtubule dynamics specific to TRNs? Is it the structure of TRNs that makes them prone to the effects of age-dependent decline in microtubule dynamics? The authors are advised to discuss it in their resubmission.

      As described above, we have included possible explanations for the tissue specificity of the Hpo pathway in TRNs and the vulnerability of TRNs to age-associated decline in the discussion section of the revised manuscript.

      (2) The authors are advised to explain the shorter life span of wts-1; yap-1 double mutants (with restored TRNs) compared to wts-1 single mutants in Figure 2F. The life span of yap-1 single mutants should be included in Figure 2F. Further, based on the data, the shorter lifespan of wts-1 mutants cannot be attributed to abnormal TRNs as the lifespan of wts-1; yap-1 double mutants is even shorter. The authors are advised to explain the shorter life span of wts-1 mutants compared to wild-type controls.

      wts-1 is known to be involved in various developmental processes, including the maintenance of apicobasal polarity in the intestine, growth rate control, and dauer formation [10-12]. Since WTS-1 activity is restored in the intestine of the mutant used for lifespan measurement, the shorter lifespan of the wts-1 mutant may result from the loss of WTS-1 in tissues other than the intestine. Although we were unable to include lifespan data for the yap-1 mutant, recent studies indicate that the yap-1(tm1416) mutant or yap-1 RNAi treated worms exhibit a shortened lifespan [13, 14]. Thus, our data showing a slightly shorter lifespan of the wts-1; yap-1 mutant compared with the wts-1 mutant may result from the synergistic action of yap-1 and yap-1-independent downstream factors of wts-1. While this study does not provide an explanation for the shortened lifespan of wts-1 or wts-1; yap-1 mutants, the fact that the wts-1; yap-1 double mutant with restored TRNs still have a shorter lifespan compared with the wts-1 mutant strongly suggests that premature deformation of the wts-1 neurons appear to be a touch neuron-specific event, rather than being associated with whole body, as described in the manuscript..

      Minor comments:

      (1) In the abstract, please provide definitions for LATS and YAP. Authors can mention that LATS is a kinase and YAP a transcriptional co-activator in the Hippo pathway.

      (2) In the last paragraph on page 9, change "these function" to "this function", and change "knock-downed" to "knocked down".

      (3) On page 10, paragraph 2, change "regarding the action mechanism" to "regarding the mechanism of action".

      (4) On page 11, paragraph 1, change "endogenous WTS-1 could inhibits" to "endogenous WTS-1 could inhibit".

      (5) On page 16, paragraph 1, change "consistent to the hypothesis" to "consistent with this hypothesis".

      (6) Overall, the paper is well written. However, there is still room to improve the language and diction used by the authors.

      We have revised all minor comments suggested by the reviewer in the revised manuscript.

      References

      (1) Hamelin M, Scott IM, Way JC, Culotti JG. The mec-7 beta-tubulin gene of Caenorhabditis elegans is expressed primarily in the touch receptor neurons. EMBO J. 1992;11(8):2885-93. Epub 1992/08/01. doi: 10.1002/j.1460-2075.1992.tb05357.x. PubMed PMID: 1639062; PubMed Central PMCID: PMCPMC556769.

      (2) Fukushige T, Siddiqui ZK, Chou M, Culotti JG, Gogonea CB, Siddiqui SS, et al. MEC-12, an alpha-tubulin required for touch sensitivity in C. elegans. J Cell Sci. 1999;112 ( Pt 3):395-403. Epub 1999/01/14. doi: 10.1242/jcs.112.3.395. PubMed PMID: 9885292.

      (3) Chalfie M, Thomson JN. Structural and functional diversity in the neuronal microtubules of Caenorhabditis elegans. J Cell Biol. 1982;93(1):15-23. Epub 1982/04/01. doi: 10.1083/jcb.93.1.15. PubMed PMID: 7068753; PubMed Central PMCID: PMCPMC2112106.

      (4) Qiao Y, Chen J, Lim YB, Finch-Edmondson ML, Seshachalam VP, Qin L, et al. YAP Regulates Actin Dynamics through ARHGAP29 and Promotes Metastasis. Cell Rep. 2017;19(8):1495-502. Epub 2017/05/26. doi: 10.1016/j.celrep.2017.04.075. PubMed PMID: 28538170.

      (5) Kim M, Kim T, Johnson RL, Lim DS. Transcriptional co-repressor function of the hippo pathway transducers YAP and TAZ. Cell Rep. 2015;11(2):270-82. Epub 2015/04/07. doi: 10.1016/j.celrep.2015.03.015. PubMed PMID: 25843714.

      (6) Lee DH, Park JO, Kim TS, Kim SK, Kim TH, Kim MC, et al. LATS-YAP/TAZ controls lineage specification by regulating TGFbeta signaling and Hnf4alpha expression during liver development. Nat Commun. 2016;7:11961. Epub 2016/07/01. doi: 10.1038/ncomms11961. PubMed PMID: 27358050; PubMed Central PMCID: PMCPMC4931324.

      (7) Toth ML, Melentijevic I, Shah L, Bhatia A, Lu K, Talwar A, et al. Neurite sprouting and synapse deterioration in the aging Caenorhabditis elegans nervous system. J Neurosci. 2012;32(26):8778-90. Epub 2012/06/30. doi: 10.1523/JNEUROSCI.1494-11.2012. PubMed PMID: 22745480; PubMed Central PMCID: PMCPMC3427745.

      (8) Tank EM, Rodgers KE, Kenyon C. Spontaneous age-related neurite branching in Caenorhabditis elegans. J Neurosci. 2011;31(25):9279-88. Epub 2011/06/24. doi: 10.1523/JNEUROSCI.6606-10.2011. PubMed PMID: 21697377; PubMed Central PMCID: PMCPMC3148144.

      (9) Maguire SM, Clark CM, Nunnari J, Pirri JK, Alkema MJ. The C. elegans touch response facilitates escape from predacious fungi. Curr Biol. 2011;21(15):1326-30. Epub 2011/08/02. doi: 10.1016/j.cub.2011.06.063. PubMed PMID: 21802299; PubMed Central PMCID: PMCPMC3266163.

      (10) Cai Q, Wang W, Gao Y, Yang Y, Zhu Z, Fan Q. Ce-wts-1 plays important roles in Caenorhabditis elegans development. FEBS Lett. 2009;583(19):3158-64. Epub 2009/09/10. doi: 10.1016/j.febslet.2009.09.002. PubMed PMID: 19737560.

      (11) Kang J, Shin D, Yu JR, Lee J. Lats kinase is involved in the intestinal apical membrane integrity in the nematode Caenorhabditis elegans. Development. 2009;136(16):2705-15. Epub 20090715. doi: 10.1242/dev.035485. PubMed PMID: 19605499.

      (12) Lee H, Kang J, Ahn S, Lee J. The Hippo Pathway Is Essential for Maintenance of Apicobasal Polarity in the Growing Intestine of Caenorhabditis elegans. Genetics. 2019;213(2):501-15. Epub 20190729. doi: 10.1534/genetics.119.302477. PubMed PMID: 31358532; PubMed Central PMCID: PMCPMC6781910.

      (13) Teuscher AC, Statzer C, Goyala A, Domenig SA, Schoen I, Hess M, et al. Longevity interventions modulate mechanotransduction and extracellular matrix homeostasis in C. elegans. Nat Commun. 2024;15(1):276. Epub 2024/01/05. doi: 10.1038/s41467-023-44409-2. PubMed PMID: 38177158; PubMed Central PMCID: PMCPMC10766642.

      (14) Saul N, Dhondt I, Kuokkanen M, Perola M, Verschuuren C, Wouters B, et al. Identification of healthspan-promoting genes in Caenorhabditis elegans based on a human GWAS study. Biogerontology. 2022;23(4):431-52. Epub 2022/06/25. doi: 10.1007/s10522-022-09969-8. PubMed PMID: 35748965; PubMed Central PMCID: PMCPMC9388463.

    1. Author response:

      The following is the authors’ response to the original reviews.

      Reviewer #1 (Recommendations for the authors):

      The biochemical fractionation and use of the term "synaptic" were my biggest issues. I would recommend using a more targeted approach to measure the PSD or compare and contrast synaptic from extrasynaptic. For instance, PMID 16797717 does a PSD purification, whereas other papers have fractionated extrasynaptic from synaptic. Moreover, a PSD95 immunoprecipitation may be of interest as one question that could arise is since you see decreases in PSD95 GluN2B, but not 2A or GluA1, could the association of PSD95 with the different proteins be altered? To evaluate this, proteomics or some other unbiased methodology could enhance an understanding of the full panoply of changes induced by Prosapip1 within the dHP.

      The reviewer makes value points; however, this is a large endeavor, which we will address in future experiments.

      There seems to be a missed opportunity to really determine how Prosapip1 is influencing protein expression and/or phosphorylation at the PSD.

      There is no indication that Prosapip1 is linked to transcription or translation machinery; therefore, we don’t see the value of examining protein expression in this context. Phosphorylation is a broad term, and although this can be answered through phosphoproteomics, this is outside the scope of this study.

      At the very least, additional discussion within this realm would help the reader contextualize the biochemical data.

      Further studies are needed to determine the mechanism by which Prosapip1 controls the localization of PSD95, GlunN2B, and potentially others. It is plausible that posttranslational modifications are responsible for Prosapip1 function. For example, the Prosapip1 sequence contains a potential glycosylation site (Ser622), and several potential phosphorylation sites (https://glygen.org/protein/O60299#Glycosylation, https://www.phosphosite.org/proteinAction.action?id=18395&showAllSites=true#appletMsg). These posttranslational modifications can contribute to the stabilization of the synaptic localization of GluN2B and PSD95.

      We added to the discussion the paragraph above as well as the caveat that proteomic studies are needed for a comprehensive study of the role of Prosapip1 in the PSD.

      Weaknesses:

      (1) Methodological Weaknesses

      a. The synapsin-Cre mice may more broadly express Cre-recombinase than just in neuronal tissues. Specifically, according to Jackson Laboratories, there is a concern with these mice expressing Cre-recombinase germline. As the human protein atlas suggests that Prosapip1 protein is expressed extraneuronally, validation of neuron or at least brain-specific knockout would be helpful in interpreting the data. Having said that, the data demonstrating that the brain region-specific knockout has similar behavioral impacts helps alleviate this concern somewhat; however, there are no biochemical or electrophysiological readouts from these animals, and therefore an alternative mechanism in this adult knockout cannot be excluded.

      This is a valuable insight from the reviewer, especially considering the information from Jackson Laboratories. As mentioned in the paper, we exclusively used female Syn1-Cre carrying breeders to avoid germline recombination. Furthermore, we consistently assessed the prevalence of the Prosapip1 flox sites alongside the presence of Syn1-Cre with our regular litter genotyping, confirming the presence of Prosapip1. Additionally, Prosapip1 protein expression was directly examined in rats in Wendholdt et al., 2006, where this group reported that Prosapip1 is a brain-specific protein, minimizing the potential consequences of a peripheral loss of Prosapip1. In addition, to confirm that Prosapip1 is a brain-specific protein in mice, we performed a western blot analysis on the dorsal hippocampus, liver, and kidney of a C57BL/6 mouse (Author response image 1), and found that Prosapip1 protein is not found in these peripheral organs, aligning with the findings in rats reported by Wendholdt et al.

      Author response image 1. Prosapip1 protein in the dorsal hippocampus, liver, and kidney of C57BL/6 mice.

      b. The use of the word synaptic and the crude fractionation make some of the data difficult to interpret/contextualize. It is unclear how a single centrifugation that eliminates the staining of a nuclear protein can be considered a "synaptic" fraction. This is highlighted by the presence of GAPDH in this fraction which is a cytosolically-enriched protein. While GAPDH may be associated with some membranes it is not a synaptic protein. There is no quantification of GAPDH against total protein to validate that it is not enriched in this fraction over control. Moreover, it should not be used as a loading control in the synaptic fraction. There are multiple different ways to enrich membranes, extrasynaptic fractions, and PSDs and a better discussion on the caveats of the biochemical fractionation is a minimum to help contextualize the changes in PSD95 and GluN2B.

      We apologize for the confusion. As we described in the methods section, the crude synaptosome was isolated by several centrifugations as depicted in the figure which we are now including in the manuscript. As shown in Extended Figure 2, the P2 fraction does contain PSD-95 and synapsin, as well as GluN2B, GluN2A, and GluA1; however, it does not contain the transcription factor CREB, indicating the isolation of the crude synaptosomal fraction. As shown in the figure, a small amount of GAPDH is present in the crude synaptosomal fraction. The presence of GAPDH in the crude synaptosomal fraction has been previously reported in (Atsushi et al., 2003; Lee et al. 2016; Wang et al. 2012). As we have added to the discussion, there remains a caveat that we cannot differentiate the pre- and post-synaptic fraction, and as a result we do not know if Prosapip1 plays a role in the assembly of axonal proteins.

      c. Also, the word synaptosomal on page 7 is not correct. One issue is this is more than synaptosomes and another issue is synaptosomes are exclusively presynaptic terminals. The correct term to use is synaptoneurosome, which includes both pre and postsynaptic components. Moreover, as stated above, this may contain these components but is most likely not a pure or even enriched fraction.

      Since we cannot exclude the possibility that Prosapip1 is also expressed in glia, we do not believe that the term synaptoneurosome is accurate.

      d. The age at which the mice underwent injection of the Cre virus was not mentioned.

      We apologize for the oversight. As now noted in the methods, the mice used for experiments underwent surgery to infect neurons with the AAV-GFP or AAV-Cre viruses between 5 and 6 weeks of age to ensure full viral expression by the experimental window beginning at 8 weeks old.

      (2) Weaknesses of Results

      a. There were no measures of GluN1 or GluA2 in the biochemical assays. As GluN1 is the obligate subunit, how it is impacted by the loss of Prosapip1 may help contextualize the fact that GluN2B, but not GluN2A, is altered. Moreover, as GluA2 has different calcium permeance, alterations in it may be informative.

      Since we detect NMDAR current, which requires the obligatory subunit GluN1 and at least one GluN2 subunit (GluN2A, GluN2B, GluN2C, GluN2D), we did not see the rationale behind examining the level of GluN1 in the Prosapip1 knockout mice.

      b. While there was no difference in GluA1 expression in the "synaptic" fraction, it does not mean that AMPAR function is not impacted by the loss of Prosapip1. This is particularly important as Prosapip1 may interact with kinases or phosphatases or their targeting proteins. Therefore, measuring AMPAR function electrophysiologically or synaptic protein phosphorylation would be informative.

      We agree with the reviewer that the loss of Prosapip1 could potentially impact AMPAR function. To address this, we measured spontaneous excitatory postsynaptic currents (sEPSCs) in hippocampal pyramidal neurons from both Prosapip1(flx/flx);Syn1-Cre(-) and Prosapip1(flx/flx);Syn1-Cre(+) mice. Given that neurons were voltage-clamped at -70 mV and extracellular Mg<sup>2+</sup> was maintained at 1.3 mM, the sEPSCs we recorded were primarily mediated by AMPARs.

      We found no significant differences in either the frequency or amplitude of these AMPA-mediated sEPSCs between Prosapip1(flx/flx);Syn1-Cre(-) and Prosapip1(flx/flx);Syn1-Cre(+) mice, suggesting that AMPAR function in hippocampal pyramidal neurons is not noticeably affected by the loss of Prosapip1 (see Author response image 2 below).

      Author response image 2. Comparison of hippocampal sEPSCs between Prosapip1(flx/flx); Syn1-Cre(-) (Cre(-)) and Prosapip1(flx/flx);Syn1-Cre(+) (Cre(+)) mice. sEPSCs were recorded in the presence of 1.3 mM Mg²⁺ and 0.1 mM picrotoxin, with neurons clamped at -70 mV. (A) Sample sEPSC traces from Prosapip1(flx/flx); Syn1-Cre(-) (top) and Prosapip1(flx/flx); Syn1-Cre(+) (bottom) mice. (B, C) Bar graphs showing no significant differences in sEPSC frequency (B) or amplitude (C) between Prosapip1(flx/flx); Syn1-Cre(-)and Prosapip1(flx/flx); Syn1-Cre(+) mice. Statistical analysis was performed using an unpaired t-test; p > 0.05, n.s. (not significant). Data represent 11 neurons from 3 Prosapip1(flx/flx); Syn1-Cre(-) mice (11/3) and 8 neurons from 3 Prosapip1(flx/flx); Syn1-Cre(+) mice (8/3).

      c. There is a lack of mechanistic data on what specifically and how GluN2B and PSD95 expression is altered. This is due to some of the challenges with interpreting the biochemical fractionation and a lack of results regarding changes in protein posttranslational modifications.

      See response above.

      d. The loss of social novelty measures in both the global and dHP-specific Prosapip1 knockout mice were not very robust. As they were consistently lost in both approaches and as there were other consistent memory deficits, this does not impact the conclusions, but may be important to temper discussion to match these smaller deficits within this domain.

      There is a clear difference between the Prosapip1(flx/flx);Syn1-Cre(-) and Prosapip1(flx/flx);Syn1-Cre(+) mice as well as the AAV-GFP and AAV-Cre mice in the loss of social novelty metric. We have emphasized that the Prosapip1(flx/flx);Syn1-Cre(+) mice and AAV-Cre mice do not recognize social novelty, which is supported by the statistics.

      4E: Two-way ANOVA: Effect of Social Novelty F<sub>(1,20)</sub> = 17.60, p = 0.0002; Post hoc Familiar vs. Novel (Cre(-)) p = 0.0008, Familiar vs. Novel (Cre(+)) p = 0.1451.

      5I: Two-way ANOVA: Effect of Social Novelty F<sub>(1,31)</sub> = 9.777, p = 0.0038; Post hoc Familiar vs. Novel (AAV-GFP) p = 0.0303, Familiar vs. Novel (AAV-Cre) p = 0.1319.

      e. Alterations in presynaptic paired-pulse ratio measures are intriguing and may point to a role for Prosapip1 in synapse development, as discussed in the manuscript. It would be interesting to delineate if these PPR changes also occur in the adult knockout to help detail the specific Prosapip1-induced neuroadaptations that link to the alterations in novelty-induced behaviors.

      This interesting question will be addressed in future studies.

      Reviewer #2 (Recommendations for the authors):

      (1) The test statistics are required for each experiment for completeness. Currently, only p-values, tests used, and N are included.

      The entirety of the statistical information can be found in TYable 1, including test statistics and degrees of freedom (see Column 7, ‘Result’).

      (2) The authors claim that the function of Prosapip1 is not known in vivo, yet detail a study in the NAc where they investigated its function in vivo. The wording or discussion around what is and is not known should be altered to reflect this.

      The reviewer is correct to point to our previous manuscript (Laguesse et al. Neuron. 2017.) in which we found that Prosapip1 is important in mechanisms underlying alcohol-associated molecular, cellular and behavioral adaptations. However, these findings are specific to alcohol-related paradigms. Since the normal physiological role of Prosapip1 has never been delineated, this study was aimed to start addressing this gap in knowledge.

      References

      Wang, M., Li, S., Zhang, H. et al. Direct interaction between GluR2 and GAPDH regulates AMPAR-mediated excitotoxicity. Mol Brain 5, 13 (2012). https://doi.org/10.1186/1756-6606-5-13

      Atsushi Ikemoto, David G. Bole, Tetsufumi Ueda, Glycolysis and Glutamate Accumulation into Synaptic Vesicles: Role of Glyceraldehyde Phosphate Dehydrogenase and 3-Phosphoglycerate Kinase, Journal of Biological Chemistry, 8, 278 (2003). https://doi.org/10.1074/jbc.M211617200.

      Lee, F., Su, P., Xie, YF. et al. Disrupting GluA2-GAPDH Interaction Affects Axon and Dendrite Development. Sci Rep 6, 30458 (2016). https://doi.org/10.1038/srep30458

    1. Author response:

      The following is the authors’ response to the previous reviews.

      Public Reviews:

      Reviewer #1 (Public review):

      Summary:

      In this work, the authors investigate the functional difference between the most commonly expressed form of PTH, and a novel point mutation in PTH identified in a patient with chronic hypocalcemia and hyperphosphatemia. The value of this mutant form of PTH as a potential anabolic agent for bone is investigated alongside PTH(1-84), which is a current anabolic therapy. The authors have achieved the aims of the study.

      Strengths:

      The work is novel, as it describes the function of a novel, naturally occurring, variant of PTH in terms of its ability to dimerise, to lead to cAMP activation, to increase serum calcium, and its pharmacological action compared to normal PTH.

      Recommendations for the authors:

      (1) In your response to the reviewers you included a figure. You said it was for the reviewers only. We are *not* including it here. Is that correct or should it be in the Public Reviews?

      We apologize for any confusion and appreciate your thorough review. The phrase “data only for reviewers” was intended to indicate that the content was included in the revision based on reviewers’ comments, not in the main text (article). However, we acknowledge that this phrasing may be inappropriate. We are agree to make the figure included in the previous author response of the public reviews. Accordingly, we propose to revise the previous author response as follows:

      - Remove "(data only for reviewers)".

      -  Correct the typo from "perosteal" to "periosteal".

      - “Thank you for your comment. First, we ensured that the bones sampled during the experiment showed no defects, and we carefully separated the femur bones from the mice to preserve their integrity. In the 3-point bending test, PTH treatment significantly increased the maximum load of the femur bone compared to the OVX-control group. Additionally, the maximum load in the PTH treatment group was significantly greater than that observed in the PTH dimer group. Furthermore, structural factors influencing bone strength, such as the periosteal perimeter and the endocortical bone perimeter, were also increased in the PTH treatment group compared to the PTH dimer group.”

      (2) Do you mean to always have R<sup>0</sup> (have a superscript) and RG (never have a superscript) or should they be shown in the same way throughout your paper?

      Thank you for your thorough review. Based on previous studies that addressed the conformation of PTH1R, R<sup>0</sup> is typically shown with a superscript, while RG is not (Hoare et al., 2001; Dean et al., 2006; Okazaki et al., 2008). We have followed this notation and will ensure consistency throughout our paper.

      Hoare, S. R., Gardella, T. J., & Usdin, T. B. (2001). Evaluating the signal transduction mechanism of the parathyroid hormone 1 receptor: effect of receptor-G-protein interaction on the ligand binding mechanism and receptor conformation. Journal of Biological Chemistry, 276(11), 7741-7753.

      Dean, T., Linglart, A., Mahon, M. J., Bastepe, M., Jüppner, H., Potts Jr, J. T., & Gardella, T. J. (2006). Mechanisms of ligand binding to the parathyroid hormone (PTH)/PTH-related protein receptor: selectivity of a modified PTH (1–15) radioligand for GαS-coupled receptor conformations. Molecular endocrinology, 20(4), 931-943.

      Okazaki, M., Ferrandon, S., Vilardaga, J. P., Bouxsein, M. L., Potts Jr, J. T., & Gardella, T. J. (2008). Prolonged signaling at the parathyroid hormone receptor by peptide ligands targeted to a specific receptor conformation. Proceedings of the National Academy of Sciences, 105(43), 16525-16530.

      (3) The following grammatical and fact changes and word changes are requested.

      We appreciate the thoughtful review and thank you for pointing out the grammatical, factual, and word changes required. We have carefully reviewed and addressed each of these corrections to ensure the paper's accuracy and readability.

      We appreciate the reviewers' detailed and constructive reviews. We have addressed all the comments to improve the quality of our paper.

    1. Author rsponse:

      Public Reviews:

      Reviewer #1 (Public review):

      Summary:

      In this paper, the authors have performed an antigenic assay for human seasonal N1 neuraminidase using antigens and mouse sera from 2009-2020 (with one avian N1 antigen). This shows two distinct antigen groups. There is poorer reactivity with sera from 2009-2012 against antigens from 2015-2019, and poorer reactivity with sera from 2015-2020 against antigens from 2009-2013. There is a long branch separating these two groups. However, 321 and 423 are the only two positions that are consistently different between the two groups. Therefore these are the most likely cause of these antigenic differences.

      Strengths:

      (1) A sensible rationale was given for the choice of sera, in terms of the genetic diversity.

      (2) There were two independent batches of one of the antigens used for generating sera, which demonstrated the level of heterogeneity in the experimental process.

      (3) Replicate of the Wisconsin/588/2019 antigen (as H1 and H6) is another useful measure of heterogeneity.

      (4) The presentation of the data, e.g. Figure 2, clearly shows two main antigenic groups.

      (5) The most modern sera are more recent than other related papers, which demonstrates that has been no major antigenic change.

      Weaknesses:

      (1) Issues with experimental methods

      As I am not an experimentalist, I cannot comment fully on the experimental methods. However, I note that BALB/c mice sera were used, whereas outbred ferret sera are typically used in influenza antigenic characterisation, so the antigenic difference observed may not be relevant in humans. Similarly, the mice were immunised with an artificial NA immunogen where the typical approach would be to infect the ferret with live virus intra-nasally.

      Indeed, ferrets are the gold standard model for the study of influenza. The main reason for this is the susceptibility of ferrets to infection with primary human influenza virus isolates and their ability to transmit human influenza A and B viruses. Although mouse models often require the use of mouse-adapted influenza virus strains, it is still the most used model to study new developments on influenza vaccine.

      In our previous publication we performed a parallel analysis of sera of ferrets that were primed by infection and boosted by recombinant protein, as well as mice that, like in this study that focuses on N1 NA, were prime-boosted with purified recombinant NA proteins in the presence of an adjuvant. Our data indicate that the NAI responses in immune sera from infected ferrets after infection and after boost enables similar antigenic classification and correlated strongly with those induced in mice that had been prime-boosted with adjuvanted recombinant NA (Catani et al., eLife 2024). To a large extend, the immunogenicity of an antigen relies on epitope accessibility, which may dictate a universal rule of immunogenicity and antigenicity (Altman et al., 2015).

      (2) Five mice sera were generated per immunogen and then pooled, but data was not presented that demonstrated these sera were sufficiently homogenous that this approach is valid.

      Although individual sera was not tested here. Based on previous studies from our group we are confident that a prime-boost schedule with 1 µg of adjuvanted soluble tetrameric NA, induces a highly homogeneous response in mice (Catani et al., 2022).

      (3) There were no homologous antigens for most of the sera. This makes the responses difficult to interpret as the homologous titre is often used to assess the overall reactivity of a serum. The sequence of the antigens used is not described, which again makes it difficult to interpret the results.

      The absence of homologous antigens may indeed make interpretation more difficult. However, we have observed that homologous sera do not always coincide with the highest reactivity, although highest reactivity is always found within an antigenic cluster. A sequence comparison would be appropriate to improve interpretability of the data. Therefore, a sequence alignment and a pairwise comparison will be provided in the revised manuscript as supplement. 

      (4) To be able to untangle the effects of the individual substitutions at 321, 386, and 432, it would have been useful to have included the naturally occurring variants at these positions, or to have generated mutants at these positions. Gao et al clearly show an antigenic difference with ferret sera correlated separately with N386K and I321V/K432E.

      The prevalence of single amino acid substitutions in N1 NA of clinical H1N1 virus strains isolated between 2009 and 2024 is minimal, which may indicate reduced fitness (see Author response image 1) in strains with these substitutions in NA. Nevertheless, we agree that the rescue of single mutants would provide important evidence to untangle those individual impacts on antigenicity. We plan to generate mutants with substitution at these positions in NA of A/Wisconsin/588/2019 H1N1 and determine the NAI against our panel of sera.

      Author response image 1.

      Prevalence of the indicated N1 NA substitutions in all clinical human H1N1 isolates with unique sequences deposited in the GISAID data bank since 2009.

      (5) The challenge experiments in Gao et al showed that NI titre was not a good correlate of protection, so that limits the interpretation of these results.

      On the contrary, challenges experiments confirmed that drift occurred in NA from H1N1 viruses isolated between 2009 (CA/09) and 2015 (MI/15). The dilution of transferred sera to equal inhibitory titers indicate that the homologous ferret sera (shown in figure 5e-f)(Gao et al., 2019) is still effective in protecting against infection while heterologous sera are not. This result emphasises that the nature of the homologous NAI response is well-suited for protection against a homologous challenge, although mechanistic data was not provided.

      Issues with the computational methods

      (6) The NAI titres were normalised using the ELISA results, and the motivation for this is not explained. It would be nice to see the raw values.

      Mice were immunized with different batches of recombinant protein. Each of those batches may have distinct intrinsic immunogenicity, as observed in Figure 1d. For that reason, NAI values were normalized using homologous ELISA titers induced by each respective NA antigen. A table with the raw values will be included in the revised manuscript.

      (7) It is not clear what value the random forest analysis adds here, given that positions 321 and 432 are the only two that consistently differ between the two groups.

      The substitutions at position 321 and 432 are indeed the only 2 consistently differing amino acids among the tested N1s. Although their correlation with antigenic clustering may be obvious after analysis, a random forest analysis would enable to reveal less obvious substitutions that contribute to the antigenic diversity. In the future, we intend to expand this methodology to strains that are not currently included in the panel. A random forest model is a relatively simple and performant method to deal with a new dataset.

      (8) As with the previous N2 paper, the metric for antigenic distance (the root mean square of the difference between the titres for two sera) is not one that would be consistent when different sera are included. More usual metrics of distance are Archetti-Horsfall, fold down from homologous, or fold down from maximum.

      The antigenic distances calculated prior to our random forest does use fold-difference as metrics as log2(max(EC50) / EC50). After having obtained the fold-difference values, a pairwise dissimilarity matrix was calculated to obtain the average antigenic distance between pairs of sera. A more detailed description of the methodology will be included in the methods session, including the R-code.

      (9) Antigenic cartography of these data is fraught. I wonder whether 2 dimensions are required for what seems like a 1-dimensional antigenic difference - certainly, the antigens, excluding the H5N1, are in a line. The map may be skewed by the high reactivity Brisbane/18 antigen. It is not clear if the column bases (normalisation factors for calculating antigenic distance) have been adjusted to account for the lack of homologous antigens. It is typical to present antigenic maps with a 1:1 x:y ratio.

      Antigenic cartography will be repeated excluding H5N1 and/or Brisbane/18 antigen. Data will be provided in the final rebuttal letter.

      Issues with interpretation

      (10) Figure 2 shows the NAI titres split into two groups for the antigens, however, A/Brisbane is an outlier in the second antigenic group with high reactivity.

      Indeed, A/Brisbane/02/2018 has overall higher IC50 values. However, it still falls into the same cluster that we called AG2. Highlighting A/Brisbane/02/2018 may lead to the misinterpretation of a non-existent antigenic group. 

      (11) Following Gao et al, I think you can claim that it is more likely that the antigenic change is due to K432E than I321V, based on a comparison of the amino acid change.

      Indeed, we would expect that substitution of the basic arginine to an acidic glutamate is more likely to impact antigenicity than the isoleucine-to-valine apolar substitution. Testing of mutant reassortants with single mutations may provide the definitive answer for that question.

      Appraisal:

      Taking into account the limitations of the experimental techniques (which I appreciate are due to resource constraints), this paper meets its aim of measuring the antigenic relationships between 2009-2020 seasonal N1s, showing that there were two main groups. The authors discovered that the difference between the two antigenic groups was likely attributable to positions 321 and 432, as these were the only two positions that were consistently different between the two groups. They came to this finding by using a random forest model, but other simpler methods could have been used.

      Impact:

      This paper contributes to the growing literature on the potential benefit of NA in the influenza vaccine.

      Reviewer #2 (Public review):

      Summary:

      In this study, Catani et al. have immunized mice with 17 recombinant N1 neuraminidases (NAs) from human isolates circulating between 2009-2020 to investigate antigenic diversity. NA inhibition (NAI) titers revealed two groups that were antigenically and phylogenetically distinct. Machine learning was used to estimate the antigenic distances between the N1 NAs and mutations at residues K432E and I321V were identified as key determinants of N1 NA antigenicity.

      Strengths:

      Observation of mutations associated with N1 antigenic drift.

      Weaknesses:

      Validation that K432E and I321V are responsible for antigenic drift was not determined in a background strain with native K432 and I321 or the restitution of antibody binding by reversion to K432 and I321 in strains that evaded sera.

      Reassortant A/Wisconsin/588/2019 with E432K, V321I and also K386N single mutations will be rescued and tested against the panel of sera.

    1. Author response:

      The following is the authors’ response to the original reviews.

      Public Reviews:

      Reviewer #1 (Public Review):

      (1) It is a nice study but lacks some functional data required to determine how useful these alleles will be in practice, especially in comparison with the figure line that stimulated their creation.

      We are grateful for this comment. For the usefulness of these alleles, figure 3 shows that specific and efficient genetic manipulation of one cell subpopulation can be achieved by mating across the DreER mouse strain to the rox-Cre mouse strain. In addition, figure 6 shows that R26-loxCre-tdT can effectively ensure Cre-loxP recombination on some gene alleles and for genetic manipulation. The expression of the tdT protein is aligned with the expression of the Cre protein (Alb roxCre-tdT and R26-loxCre-tdT, figure 2 and figure 5), which ensures the accuracy of the tracing experiments. We believe more functional data can be shown in future articles that use mice lines mentioned in this manuscript.

      (2) The data in Figure 5 show strong activity at the Confetti locus, but the design of the newly reported R26-loxCre line lacks a WPRE sequence that was included in the iSure-Cre line to drive very robust protein expression.

      Thank you for bringing up this point in the manuscript. In the R26-loxCre-tdT mice knock-in strategy, the WPRE sequence is added behind the loxCre-P2A-tdT sequence, as shown in Supplementary Figure 9.

      (3) The most valuable experiment for such a new tool would be a head-to-head comparison with iSure (or the latest iSure version from the Benedito lab) using the same CreER and target foxed allele. At the very least a comparison of Cre protein expression between the two lines using identical CreER activators is needed.

      Thank you for your valuable and insightful comment. The comparison results of R26-loxCre-tdT with iSuRe-Cre using Alb-CreER and targeting R26-Confetti can be found in Supplementary Figure 7 C-E, according to the reviewer’s suggestion.

      (4) Why did the authors not use the same driver to compare mCre 1, 4, 7, and 10? The study in Figure 2 uses Alb-roxCre for 1 and 7 and Cdh5-roxCre for 4 and 10, with clearly different levels of activity driven by the two alleles in vivo. Thus whether mCre1 is really better than mCre4 or 10 is not clear.

      Thank you for raising this concern. After screening out four robust versions of mCre, we generated these four roxCre knock-in mice. It is unpredictable for us which is the most robust mCre in vivo. It might be one or two mCre versions that work efficiently. For example, if Alb-mCre1 was competitive with Cdh5-mCre10, we can use them for targeting genes in different cell types, broadening the potential utility of these mice.

      (5) Technical details are lacking. The authors provide little specific information regarding the precise way that the new alleles were generated, i.e. exactly what nucleotide sites were used and what the sequence of the introduced transgenes is. Such valuable information must be gleaned from schematic diagrams that are insufficient to fully explain the approach.

      We appreciate your thoughtful suggestions. The schematic figures, along with the nucleotide sequences for the generation of mice, can be found in the revised Supplementary Figure 9.

      Reviewer #2 (Public Review):

      (1) The scenario where the lines would demonstrate their full potential compared to existing models has not been tested.

      Thank you for your thoughtful and constructive comment. The comparative analysis of R26-loxCre-tdT with iSuRe-Cre, employing Alb-CreER to target R26-Confetti, is provided in Supplementary Figure 7 C-E.

      (2) The challenge lies in performing such experiments, as low doses of tamoxifen needed for inducing mosaic gene deletion may not be sufficient to efficiently recombine multiple alleles in individual cells while at the same time accurately reporting gene deletion. Therefore, a demonstration of the efficient deletion of multiple floxed alleles in a mosaic fashion would be a valuable addition.

      Thank you for your constructive comments. Mosaic analysis using sparse labeling and efficient gene deletion would be our future direction using roxCre and loxCre strategies.

      (3) When combined with the confetti line, the reporter cassette will continue flipping, potentially leading to misleading lineage tracing results.

      Thank you for your professional comments. Indeed, the confetti used in this study can continue flipping, which would lead to potentially misleading lineage tracing results. Our use of R26-Confetti is to demonstrate the robustness of mCre for recombination. Some multiple-color mice lines that don’t flip have been published, for example, R26-Confetti2(10.1038/s41588-019-0346-6) and Rainbow (10.1161/CIRCULATIONAHA.120.045750). These reporters could be used for tracing Cre-expressing cells, without concerns of flipping of reporter cassettes.

      (4) Constitutive expression of Cre is also associated with toxicity, as discussed by the authors in the introduction.

      Thank you for your professional comments. The toxicity of constitutive expression of Cre and the toxicity associated with tamoxifen treatment in CreER mice line (10.1038/s44161-022-00125-6) are known to the field. This study can’t solve the toxicity of the constitutive expression of Cre in this work. Many mouse lines with constitutive Cre driven by different promoters are present across various fields, representing similar toxicity. To solve this issue, it would be possible to construct a new strategy that enables the removal of Cre after its expression.

      Reviewer #3 (Public Review):

      (1) Although leakiness is rather minor according to the original publication and the senior author of the study wrote in a review a few years ago that there is no leakiness(https://doi.org/10.1016/j.jbc.2021.100509).

      Thank you so much for your careful check. In this review (https://doi.org/10.1016/j.jbc.2021.100509), the writer’s comments on iSuRe-Cre are on the reader's side, and all summary words are based on the original published paper (10.1038/s41467-019-10239-4). Currently, we have tested iSuRe-Cre in our hands. We did detect some leakiness in the heart and muscle, but hardly in other tissues as shown in Author response image 1.

      Author response image 1.

      Leakiness in Alb CreER;iSuRe-Cre mouse line Pictures are representative results for 5 mice. Scale bars, white 100 µm.

      (2) I would have preferred to see a study, which uses the wonderful new tools to address a major biological question, rather than a primarily technical report, which describes the ongoing efforts to further improve Cre and Dre recombinase-mediated recombination.

      We gratefully appreciate your valuable comment. The roxCre and loxCre mice mentioned in this study provide more effective methods for inducible genetic manipulation in studying gene function. We hope that the application of our new genetic tools could help address some major biological questions in different biomedical fields in the future.

      (3) Very high levels of Cre expression may cause toxic effects as previously reported for the hearts of Myh6-Cre mice. Thus, it seems sensible to test for unspecific toxic effects, which may be done by bulk RNA-seq analysis, cell viability, and cell proliferation assays. It should also be analyzed whether the combination of R26-roxCre-tdT with the Tnni3-Dre allele causes cardiac dysfunction, although such dysfunctions should be apparent from potential changes in gene expression.

      We are sorry that we mistakenly spelled R26-loxCre-tdT into R26-roxCre-tdT in our manuscript. We have not generated the R26-roxCre-tdT mouse line. We also thank the reviewer for concerns about the toxicity of high Cre expression. The toxicity of constitutive expression of Cre and the toxicity of tamoxifen treatment of CreER mice line (10.1038/s44161-022-00125-6) are known to the field. This study can’t solve the toxicity of the constitutive expression of Cre in this work. Many mouse lines with constitutive Cre driven by different promoters are present across various fields, representing similar toxicity. To solve this issue, it would be possible to construct a new strategy that enables the removal of Cre after its expression.

      (4) Is there any leakiness when the inducible DreER allele is introduced but no tamoxifen treatment is applied? This should be documented. The same also applies to loxCre mice.

      In this study, we come up with new mice tool lines, including Alb roxCre1-tdT, Cdh5 roxCre4-tdT, Alb roxCre7-GFP, Cdh5 roxCre10-GFP and R26-loxCre-tdT. As the data shown in supplementary figure 1, supplementary figure 2, and figure 4D, Alb roxCre1-tdT, Cdh5 roxCre4-tdT, Alb roxCre7-GFP, Cdh5 roxCre10-GFP and R26-loxCre-tdT are not leaky. Therefore, if there is any leakiness driven by the inducible DreER or CreER allele, the leakiness is derived from the DreER or CreER. Additional pertinent experimental data can be referenced in Figure S4C, Figure S7A-B, and Figure S8A.

      (5) It would be very helpful to include a dose-response curve for determining the minimum dosage required in Alb-CreER; R26-loxCre-tdT; Ctnnb1flox/flox mice for efficient recombination.

      Thank you for your suggestion. We value your feedback and have incorporated your suggestion to strengthen our study. Relevant experimental data can be referenced in Figure S8E-G.

      (6) In the liver panel of Figure 4F, tdT signals do not seem to colocalize with the VE-cad signals, which is odd. Is there any compelling explanation?

      The staining in Figure 4F in the revision is intended to deliver optimized and high-resolution images.

      (7) The authors claim that "virtually all tdT+ endothelial cells simultaneously expressed YFP/mCFP" (right panel of Figure 5D). Well, it seems that the abundance of tdT is much lower compared to YFP/mCFP. If the recombination of R26-Confetti was mainly triggered by R26-loxCre-tdT, the expression of tdT and YFP/mCFP should be comparable. This should be clarified.

      Thank you so much for your careful check. We checked these signals carefully and didn't find the “much lower” tdT signal. As the file-loading website has a file size limitation, the compressed image results in some signal unclear. We attached clear high-resolution images here. Author response image 2 shows how we split the tdT signal and compared it with YFP/mCFP.

      Author response image 2.

      (8) In several cases, the authors seem to have mixed up "R26-roxCre-tdT" with "R26-loxCre-tdT". There are errors in #251 and #256.Furthermore, in the passage from line #278 to #301. In the lines #297 and #300 it should probably read "Alb-CreER; R26-loxCretdT;Ctnnb1flox/flox"" rather than "Alb-CreER;R26-tdT2;Ctnnb1flox/flox".

      We are grateful for these careful observations. We have corrected these typos accordingly.

      Recommendations for the authors:

      Reviewer #1:

      (1) However, for it to be useful to investigators a more direct comparison with the Benedito iSure line (or the latest version) is required as that is the crux of the study.

      Thank you for emphasizing this point, which we have now addressed in the revised manuscript and in Figure S7D-G.

      (2) I would like to know how the authors will make these new lines available to outside investigators.

      Please contact the lead author by email to consult about the availability of new mouse lines developed in this study.

      (3) The discussion is overly long and fails to address potential weaknesses. Much of it reiterates what was already said in the results section.

      We are thankful for your critical evaluation, which has helped us improve our discussion.

      Reviewer #2:

      (1) Assessing the efficiency and accuracy of the lines in mosaic deletions of multiple alleles and reporting them in single cells after low-dose tamoxifen exposure would be highly beneficial to demonstrate the full potential of the models.

      We appreciate your careful consideration of this issue. Our future endeavors will focus on mosaic analysis utilizing sparse labeling and efficient gene deletion, employing both roxCre and loxCre strategies.

      (2) Performing FACS analysis to confirm that all targeted (Cre reporter-positive) cells are also tdT-positive would provide more precise data and avoid vague statements like 'virtually all' or 'almost complete' in the results section:

      Line 166: Although mCre efficiently labeled virtually all targeted cells (Figure S3A-E)…

      Line 293: ... and not a single tdT+ hepatocyte 293 expressed Cyp2e1 (Figure 6D)... However, the authors do not provide any quantification. FACS would be ideal here.

      Line 244: ...expression of beta-catenin and GS almost disappeared in the 4W mutant sample... The resolution in the provided PDF is not adequate for assessment.

      Line 296: ... revealed almost complete deletion of Ctnnb1 in the Alb-CreER;R26-tdT2;Ctnnb1flox/flox mice...

      Thank you for suggesting these improvements, which have strengthened the robustness of our conclusions. In the revised version, we have incorporated FACS results that correspond to related sections. Additionally, a quantification statement has been included in the statistical analysis section. We appreciate your meticulous review and comments, which have significantly improved the clarity of our manuscript.

      (3) In the beginning of the results section, it is not clear which results are from this study and which are known background information (like Figure 1A). For example, it is not clear if Figure 1C presents data from R26-iSuRe-Cre. Please revise the text to more clearly present the experimental details and new findings.

      Thank you for this observation. Figure 1C belongs to this study, and the revised version has been modified to the related statement for improved clarity.

      (4) Experimental details regarding the genetic constructs and genotyping of the new knock-in lines are missing. Are R26 constructs driven by the endogenous R26 promoter or were additional enhancers used?

      Thank you for emphasizing this point. The schematic figures and nucleotide sequences for the generation of mice can be found in the revised Supplementary Figure 9, which can help to address this issue.

      (5) The method used to quantify mCre activity in terms of reporter+ target cells is not specified. From images or by FACS?

      Additionally, if images were used for quantification, it would be important to provide details on the number of images analyzed, the number of cells counted per image, and how individual cells were identified.

      Thank you for your comment. We have included the quantification statement in the statistical analysis section. Analyzing R26-Confetti+ target cells using FACS is challenging due to the limitations of the sorting instrument. Consequently, we quantified the related data by images. Each dot on the chart represents one sample, and the quantification for each mouse was conducted by averaging the data from five 10x fields taken from different sections.

      (6) Line 160: These data demonstrate that roxCre was functionally efficient yet non-leaky. Functional efficiency in vivo was not shown in the preceding experiments.

      Functional efficiency in vivo can be referred to in Figures S1-S2 and S4C.

      (7) It would be useful to provide a reference for easy vs low-efficiency recombination of different reporter alleles (lines 56-58).

      We are grateful for this comment, as it has allowed us to improve the clarity of our explanation. Consequently, we have made the necessary modifications.

      (8) Discussion on the potential drawbacks and limitations of the lines would be useful.

      We are thankful for your evaluation, which has significantly contributed to the enhancement of our discourse.

    1. Author response:

      The following is the authors’ response to the previous reviews.

      We would like to sincerely thank the reviewers again for their insightful comments on the previous version of our manuscript. In the last round of review, the reviewers were mostly satisfied with our revision but raised a few suggestions and/or remaining concerns. We have further edited the manuscript to address these concerns.

      Reviewer #1:

      - An explicit, quantitative link between the RNN and fMRI data is perhaps a last point that would integrate the RNN conclusion and analyses in line with the human imaging data.

      Reviewer #2:

      - Few. While more could be perhaps done to understand the RNN-fMRI correspondence, the paper contributes a compelling set of empirical findings and interpretations that can inform future research.

      To better align the RNN and fMRI results qualitatively, we performed an additional representational similarity analysis (RSA) on the data. Specifically, we computed the representational dissimilarity matrices (RDMs) for fMRI and RNN data separately, and calculated the correlation between the RDMs to quantify the similarity between fMRI data and different RNN models. We found that, consistent with our main claims, RNN2 generally demonstrated higher similarity with the fMRI data compared to RNN1. These results provide further support that RNN2 aligns better with human neuroimaging data. We have included this result (lines 496-505) and the corresponding figure (Figure 7) in the manuscript.

      Reviewer #1:

      - As Rev 2 mentions, multiple types of information codes may be present, and the response letter Figure 5 using representational similarity (RSA) gets at this question. It would strengthen the work to, at minimum, include this analysis as an extended or supplemental figure.

      Following this suggestion, we have now included Response Letter Figure 5 from the previous round of review in the manuscript (lines 381-387 and Appendix 1 – figure 7).

      Reviewer #1:

      - To sum up the results, a possible, brief schematic of each cortical area analyzed and its contribution to information coding in WM and successful subsequent behavior may help readers take away important conclusions of the cortical circuitry involved.

      Following this suggestion, we have added a schematic figure illustrating the contribution of each cortical region in our experiment to better summarize our findings (Figure 8).

      We hope that these changes further clarify the issues and strengthen the key claims in our manuscript.

    1. Author response:

      The following is the authors’ response to the original reviews.

      Public Reviews:

      Reviewer #1 (Public review):

      Summary:

      Here, the authors propose that changes in m6A levels may be predictable via a simple model that is based exclusively on mRNA metabolic events. Under this model, m6A mRNAs are "passive" victims of RNA metabolic events with no "active" regulatory events needed to modulate their levels by m6A writers, readers, or erasers; looking at changes in RNA transcription, RNA export, and RNA degradation dynamics is enough to explain how m6A levels change over time.

      The relevance of this study is extremely high at this stage of the epi transcriptome field. This compelling paper is in line with more and more recent studies showing how m6A is a constitutive mark reflecting overall RNA redistribution events. At the same time, it reminds every reader to carefully evaluate changes in m6A levels if observed in their experimental setup. It highlights the importance of performing extensive evaluations on how much RNA metabolic events could explain an observed m6A change.

      Weaknesses:

      It is essential to notice that m6ADyn does not exactly recapitulate the observed m6A changes. First, this can be due to m6ADyn's limitations. The authors do a great job in the Discussion highlighting these limitations. Indeed, they mention how m6ADyn cannot interpret m6A's implications on nuclear degradation or splicing and cannot model more complex scenario predictions (i.e., a scenario in which m6A both impacts export and degradation) or the contribution of single sites within a gene.

      Secondly, since predictions do not exactly recapitulate the observed m6A changes, "active" regulatory events may still play a partial role in regulating m6A changes. The authors themselves highlight situations in which data do not support m6ADyn predictions. Active mechanisms to control m6A degradation levels or mRNA export levels could exist and may still play an essential role.

      We are grateful for the reviewer’s appreciation of our findings and their implications, and are in full agreement with the reviewer regarding the limitations of our model, and the discrepancies in some cases - with our experimental measurements, potentially pointing at more complex biology than is captured by m6ADyn. We certainly cannot dismiss the possibility that active mechanisms may play a role in shaping m6A dynamics at some sites, or in some contexts. Our study aims to broaden the discussion in the field, and to introduce the possibility that passive models can explain a substantial extent of the variability observed in m6A levels.

      (1) "We next sought to assess whether alternative models could readily predict the positive correlation between m6A and nuclear localization and the negative correlations between m6A and mRNA stability. We assessed how nuclear decay might impact these associations by introducing nuclear decay as an additional rate, δ. We found that both associations were robust to this additional rate (Supplementary Figure 2a-c)."

      Based on the data, I would say that model 2 (m6A-dep + nuclear degradation) is better than model 1. The discussion of these findings in the Discussion could help clarify how to interpret this prediction. Is nuclear degradation playing a significant role, more than expected by previous studies?

      This is an important point, which we’ve now clarified in the discussion. Including nonspecific nuclear degradation in the m6ADyn framework provides a model that better aligns with the observed data, particularly by mitigating unrealistic predictions such as excessive nuclear accumulation for genes with very low sampled export rates. This adjustment addresses potential artifacts in nuclear abundance and half-life estimations. However, we continued to use the simpler version of m6ADyn for most analyses, as it captures the key dynamics and relationships effectively without introducing additional complexity. While including nuclear degradation enhances the model's robustness, it does not fundamentally alter the primary conclusions or outcomes. This balance allows for a more straightforward interpretation of the results.

      (2) The authors classify m6A levels as "low" or "high," and it is unclear how "low" differs from unmethylated mRNAs.

      We thank the reviewer for this observation. We analyzed gene methylation levels using the m6A-GI (m6A gene index) metric, which reflects the enrichment of the IP fraction across the entire gene body (CDS + 3UTR). While some genes may have minimal or no methylation, most genes likely exist along a spectrum from low to high methylation levels. Unlike earlier analyses that relied on arbitrary thresholds to classify sites as methylated, GLORI data highlight the presence of many low-stoichiometry sites that are typically overlooked. To capture this spectrum, we binned genes into equal-sized groups based on their m6A-GI values, allowing a more nuanced interpretation of methylation patterns as a continuum rather than a binary or discrete classification (e.g. no- , low- , high methylation).
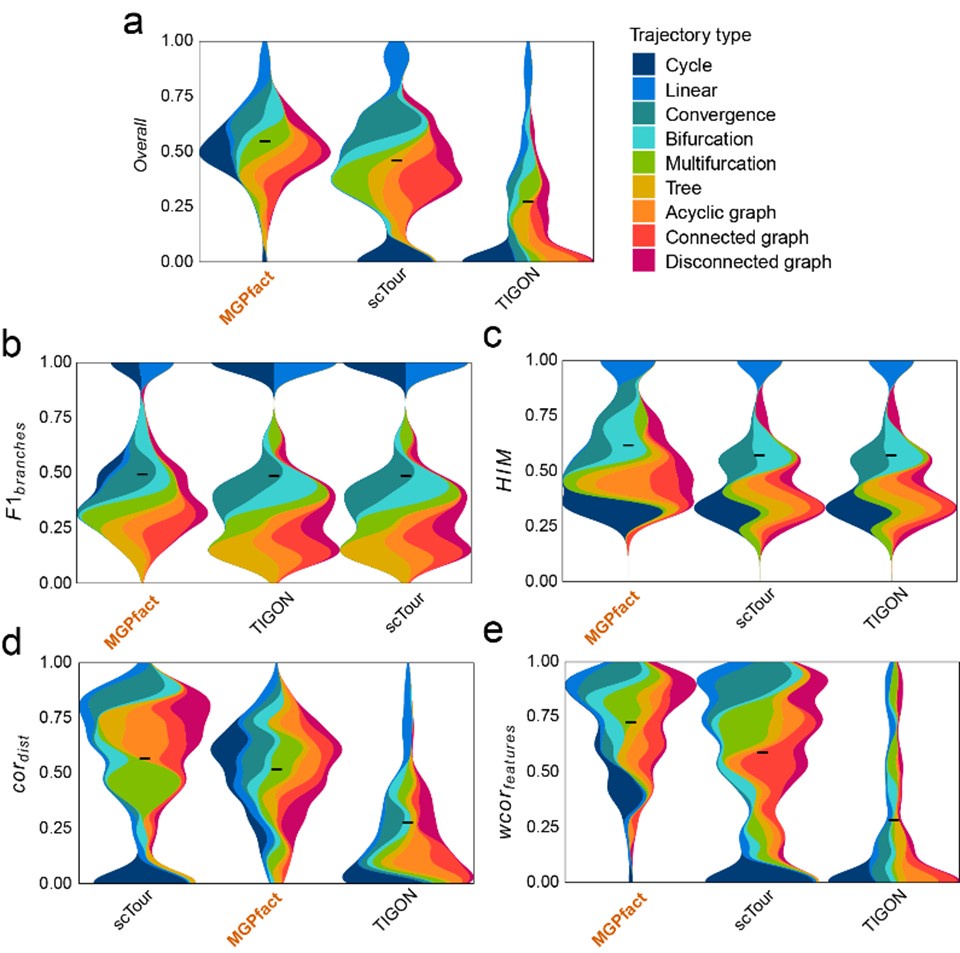
      (3) The authors explore whether m6A changes could be linked with differences in mRNA subcellular localization. They tested this hypothesis by looking at mRNA changes during heat stress, a complex scenario to predict with m6ADyn. According to the collected data, heat shock is not associated with dramatic changes in m6A levels. However, the authors observe a redistribution of m6A mRNAs during the treatment and recovery time, with highly methylated mRNAs getting retained in the nucleus being associated with a shorter half-life, and being transcriptional induced by HSF1. Based on this observation, the authors use m6Adyn to predict the contribution of RNA export, RNA degradation, and RNA transcription to the observed m6A changes. However:

      (a) Do the authors have a comparison of m6ADyn predictions based on the assumption that RNA export and RNA transcription may change at the same time?

      We thank the reviewer for this point. Under the simple framework of m6ADyn in which RNA transcription and RNA export are independent of each other, the effect of simultaneously modulating two rates is additive. In Author response image 1, we simulate some scenarios wherein we simultaneously modulate two rates. For example, transcriptional upregulation and decreased export during heat shock could reinforce m6A increases, whereas transcriptional downregulation might counteract the effects of reduced export. Note that while production and export can act in similar or opposing directions, the former can only lead to temporary changes in m6A levels but without impacting steady-state levels, whereas the latter (changes in export) can alter steady-state levels. We have clarified this in the manuscript results to better contextualize how these dynamics interact.

      Author response image 1.

      m6ADyn predictions of m6A gene levels (left) and Nuc to Cyt ratio (right) upon varying perturbations of a sampled gene. The left panel depicts the simulated dynamics of log2-transformed m6A gene levels under varying conditions. The lines represent the following perturbations: (1) export is reduced to 10% (β), (2) production is increased 10-fold (α) while export is reduced to 10% (β), (3) export is reduced to 10% (β) and production is reduced to 10% (α), and (4) export is only decreased for methylated transcripts (β^m6A) to 10%. The right panel shows the corresponding nuclear:cytoplasmic (log2 Nuc:Cyt) ratios for perturbations 1 and 4.

      (b) They arbitrarily set the global reduction of export to 10%, but I'm not sure we can completely rule out whether m6A mRNAs have an export rate during heat shock similar to the non-methylated mRNAs. What happens if the authors simulate that the block in export could be preferential for m6A mRNAs only?

      We thank the reviewer for this interesting suggestion. While we cannot fully rule out such a scenario, we can identify arguments against it being an exclusive explanation. Specifically, an exclusive reduction in the export rate of methylated transcripts would be expected to increase the relationship between steady-state m6A levels (the ratio of methylated to unmethylated transcripts) and changes in localization, such that genes with higher m6A levels would exhibit a greater relative increase in the nuclear-to-cytoplasmic (Nuc:Cyt) ratio. However, the attached analysis shows only a weak association during heat stress, where genes with higher m6A-GI levels tend to increase just a little more in the Nuc:Cyt ratio, likely due to cytoplasmic depletion. A global reduction of export (β 10%) produces a similar association, while a scenario where only the export of methylated transcripts is reduced (β^m6A 10%) results in a significantly stronger association (Author response image 2). This supports the plausibility of a global export reduction. Additionally, genes with very low methylation levels in control conditions also show a significant increase in the Nuc:Cyt ratio, which is inconsistent with a scenario of preferential export reduction for methylated transcripts (data not shown).

      Author response image 2.

      Wild-type MEFs m6A-GIs (x-axis) vs. fold change nuclear:cytoplasmic localization heat shock 1.5 h and control (y-axis), Pearson’s correlation indicated (left panel). m6ADyn, rates sampled for 100 genes based on gamma distributions and simulation based on reducing the global export rate (β) to 10% (middle panel). m6ADyn simulation for reducing the export rate for m6A methylated transcripts (β^m6A) to 10% (right panel).

      (c) The dramatic increase in the nucleus: cytoplasmic ratio of mRNA upon heat stress may not reflect the overall m6A mRNA distribution upon heat stress. It would be interesting to repeat the same experiment in METTL3 KO cells. Of note, m6A mRNA granules have been observed within 30 minutes of heat shock. Thus, some m6A mRNAs may still be preferentially enriched in these granules for storage rather than being directly degraded. Overall, it would be interesting to understand the authors' position relative to previous studies of m6A during heat stress.

      The reviewer suggests that methylation is actively driving localization during heat shock, rather than being passively regulated. To address this question, we have now knocked down WTAP, an essential component of the methylation machinery, and monitored nuclear:cytoplasmic localization over the course of a heat shock response. Even with reduced m6A levels, high PC1 genes exhibit increased nuclear abundance during heat shock. Notably, the dynamics of this trend are altered, with the peak effect delayed from 1.5h heat shock in siCTRL samples to 4 hours in siWTAP samples (Supplementary Figure 4). This finding underscores that m6A is not the primary driver of these mRNA localization changes but rather reflects broader mRNA metabolic shifts during heat shock. These findings have been added as a panel e) to Supplementary Figure 4.

      (d) Gene Ontology analysis based on the top 1000 PC1 genes shows an enrichment of GOs involved in post-translational protein modification more than GOs involved in cellular response to stress, which is highlighted by the authors and used as justification to study RNA transcriptional events upon heat shock. How do the authors think that GOs involved in post-translational protein modification may contribute to the observed data?

      High PC1 genes exhibit increased methylation and a shift in nuclear-to-cytoplasmic localization during heat stress. While the enriched GO terms for these genes are not exclusively related to stress-response proteins, one could speculate that their nuclear retention reduces translation during heat stress. The heat stress response genes are of particular interest, which are massively transcriptionally induced and display increased methylation. This observation supports m6ADyn predictions that elevated methylation levels in these genes are driven by transcriptional induction rather than solely by decreased export rates.

      (e) Additionally, the authors first mention that there is no dramatic change in m6A levels upon heat shock, "subtle quantitative differences were apparent," but then mention a "systematic increase in m6A levels observed in heat stress". It is unclear to which systematic increase they are referring to. Are the authors referring to previous studies? It is confusing in the field what exactly is going on after heat stress. For instance, in some papers, a preferential increase of 5'UTR m6A has been proposed rather than a systematic and general increase.

      We thank the reviewer for raising this point. In our manuscript, we sought to emphasize, on the one hand, the fact that m6A profiles are - at first approximation - “constitutive”, as indicated by high Pearson correlations between conditions (Supplementary Figure 4a). On the other hand, we sought to emphasize that the above notwithstanding, subtle quantitative differences are apparent in heat shock, encompassing large numbers of genes, and these differences are coherent with time following heat shock (and in this sense ‘systematic’), rather than randomly fluctuating across time points. Based on our analysis, these changes do not appear to be preferentially enriched at 5′UTR sites but occur more broadly across gene bodies (potentially a slight 3’ bias). A quick analysis of the HSF1-induced heat stress response genes, focusing on their relative enrichment of methylation upon heat shock, shows that the 5'UTR regions exhibit a roughly similar increase in methylation after 1.5 hours of heat stress compared to the rest of the gene body (Author response image 3). A prominent previous publication (Zhou et al. 2015) suggested that m6A levels specifically increase in the 5'UTR of HSPA1A in a YTHDF2- and HSF1-dependent manner, and highlighted the role of 5'UTR m6A methylation in regulating cap-independent translation, our findings do not support a 5'UTR-specific enrichment. However, we do observe that the methylation changes are still HSF1-dependent. Off note, the m6A-GI (m6A gene level) as a metric that captures the m6A enrichment of gene body excluding the 5’UTR, due to an overlap of transcription start site associated m6Am derived signal.

      Author response image 3.

      Fold change of m6A enrichment (m6A-IP / input) comparing 1.5 h heat shock and control conditions for 5UTR region and the rest of the gene body (CDS and 3UTR) in the 10 HSF! dependent stress response genes.

      Reviewer #2 (Public review):

      Dierks et al. investigate the impact of m6A RNA modifications on the mRNA life cycle, exploring the links between transcription, cytoplasmic RNA degradation, and subcellular RNA localization. Using transcriptome-wide data and mechanistic modelling of RNA metabolism, the authors demonstrate that a simplified model of m6A primarily affecting cytoplasmic RNA stability is sufficient to explain the nuclear-cytoplasmic distribution of methylated RNAs and the dynamic changes in m6A levels upon perturbation. Based on multiple lines of evidence, they propose that passive mechanisms based on the restricted decay of methylated transcripts in the cytoplasm play a primary role in shaping condition-specific m6A patterns and m6A dynamics. The authors support their hypothesis with multiple large-scale datasets and targeted perturbation experiments. Overall, the authors present compelling evidence for their model which has the potential to explain and consolidate previous observations on different m6A functions, including m6A-mediated RNA export.

      We thank the reviewer for the spot-on suggestions and comments on this manuscript.

      Reviewer #3 (Public review):

      Summary:

      This manuscript works with a hypothesis where the overall m6A methylation levels in cells are influenced by mRNA metabolism (sub-cellular localization and decay). The basic assumption is that m6A causes mRNA decay and this happens in the cytoplasm. They go on to experimentally test their model to confirm its predictions. This is confirmed by sub-cellular fractionation experiments which show high m6A levels in the nuclear RNA. Nuclear localized RNAs have higher methylation. Using a heat shock model, they demonstrate that RNAs with increased nuclear localization or transcription, are methylated at higher levels. Their overall argument is that changes in m6A levels are rather determined by passive processes that are influenced by RNA processing/metabolism. However, it should be considered that erasers have their roles under specific environments (early embryos or germline) and are not modelled by the cell culture systems used here.

      Strengths:

      This is a thought-provoking series of experiments that challenge the idea that active mechanisms of recruitment or erasure are major determinants for m6A distribution and levels.

      We sincerely thank the reviewer for their thoughtful evaluation and constructive feedback.

      Recommendations for the authors:

      Reviewer #1 (Recommendations for the authors):

      (1) Supplementary Figure 5A Data: Please double-check the label of the y-axis and the matching legend.

      We corrected this.

      (2) A better description of how the nuclear: cytoplasmic fractionation is performed.

      We added missing information to the Material & Methods section.

      (3) Rec 1hr or Rec 4hr instead of r1 and r4 to indicate the recovery.

      For brevity in Figure panels, we have chosen to stick with r1 and r4.

      (4) Figure 2D: are hours plotted?

      Plotted is the fold change (FC) of the calculated half-lives in hours (right). For the model (left) hours are the fold change of a dimension-less time-unit of the conditions with m6A facilitated degradation vs without. We have now clarified this in the legend.

      (5) How many genes do we have in each category? How many genes are you investigating each time?

      We thank the reviewer for this question. In all cases where we binned genes, we used equal-sized bins of genes that met the required coverage thresholds. We have reviewed the manuscript to ensure that the number of genes included in each analysis or the specific coverage thresholds used are clearly stated throughout the text.

      (6) Simulations on 1000 genes or 2000 genes?

      We thank the reviewer for this question and went over the text to correct for cases in which this was not clearly stated.

      Reviewer #2 (Recommendations for the authors):

      Specific comments:

      (1) The manuscript is very clear and well-written. However, some arguments are a bit difficult to understand. It would be helpful to clearly discriminate between active and passive events. For example, in the sentence: "For example, increasing the m6A deposition rate (⍺m6A) results in increased nuclear localization of a transcript, due to the increased cytoplasmic decay to which m6A-containing transcripts are subjected", I would directly write "increased relative nuclear localization" or "apparent increase in nuclear localization".

      We thank the reviewer for this careful observation. We have modified the quoted sentence, and also sought to correct additional instances of ambiguity in the text.

      Also, it is important to ensure that all relationships are described correctly. For example, in the sentence: "This model recovers the positive association between m6A and nuclear localization but gives rise to a positive association between m6A and decay", I think "decay" should be replaced with "stability". Similarly, the sentence: "Both the decrease in mRNA production rates and the reduction in export are predicted by m6ADyn to result in increasing m6A levels, ..." should it be "Both the increase in mRNA production and..."?

      We have corrected this.

      This sentence was difficult for me to understand: "Our findings raise the possibility that such changes could, at least in part, also be indirect and be mediated by the redistribution of mRNAs secondary to loss of cytoplasmic m6A-dependent decay." Please consider rephrasing it.

      We rephrased this sentence as suggested.

      (2) Figure 2d: "A final set of predictions of m6ADyn concerns m6A-dependent decay. m6ADyn predicts that (a) cytoplasmic genes will be more susceptible to increased m6A mediated decay, independent of their m6A levels, and (b) more methylated genes will undergo increased decay, independently of their relative localization (Figure 2d left) ... Strikingly, the experimental data supported the dual, independent impact of m6A levels and localization on mRNA stability (Figure 2d, right)."

      I do not understand, either from the text or from the figure, why the authors claim that m6A levels and localization independently affect mRNA stability. It is clear that "cytoplasmic genes will be more susceptible to increased m6A mediated decay", as they always show shorter half-lives (top-to-bottom perspective in Figure 2d). Nonetheless, as I understand it, the effect is not "independent of their m6A levels", as half-lives are clearly the shortest with the highest m6A levels (left-to-right perspective in each row).

      The two-dimensional heatmaps allow for exploring conditional independence between conditions. If an effect (in this case delta half-life) is a function of the X axis (in this case m6A levels), continuous increases should be seen going from one column to another. Conversely, if it is a function of the Y axis (in this case localization), a continuous effect should be observed from one row to another. Given that effects are generally observed both across rows and across columns, we concluded that the two act independently. The fact that half-life is shortest when genes are most cytoplasmic and have the highest m6A levels is therefore not necessarily inconsistent with two effects acting independently, but instead interpreted by us as the additive outcome of two independent effects. Having said this, a close inspection of this plot does reveal a very low impact of localization in contexts where m6A levels are very low, which could point at some degree of synergism between m6A levels and localization. We have therefore now revised the text to avoid describing the effects as "independent."

      (3) The methods part should be extended. For example, the description of the mRNA half-life estimation is far too short and lacks details. Also, information on the PCA analysis (Figure 4e & f) is completely missing. The code should be made available, at least for the differential model.

      We thank the reviewer for this point and expanded the methods section on mRNA stability analysis and PCA. Additionally, we added a supplementary file, providing R code for a basic m6ADyn simulation of m6A depleted to normal conditions (added Source Code 1).

      https://docs.google.com/spreadsheets/d/1Wy42QGDEPdfT-OAnmH01Bzq83hWVrYLsjy_B4n CJGFA/edit?usp=sharing

      (4) Figure 4e, f: The authors use a PCA analysis to achieve an unbiased ranking of genes based on their m6A level changes. From the present text and figures, it is unclear how this PCA was performed. Besides a description in the methods sections, the authors could show additional evidence that the PCA results in a meaningful clustering and that PC1 indeed captures induced/reduced m6A level changes for high/low-PC1 genes.

      We have added passages to the text, hoping to clarify the analysis approach.

      (5) In Figure 4i, I was surprised about the m6A dynamics for the HSF1-independent genes, with two clusters of increasing or decreasing m6A levels across the time course. Can the model explain these changes? Since expression does not seem to be systematically altered, are there differences in subcellular localization between the two clusters after heat shock?

      A general aspect of our manuscript is attributing changes in m6A levels during heat stress to alterations in mRNA metabolism, such as production or export. As shown in Supplementary Figure 4d, even in WT conditions, m6A level changes are not strictly associated with apparent changes in expression, but we try to show that these are a reflection of the decreased export rate. In the specific context of HSF1-dependent stress response genes, we observe a clear co-occurrence of increased m6A levels with increased expression levels, which we propose to be attributed to enhanced production rates during heat stress. This suggests that transcriptional induction can drive the apparent rise in m6A levels. We try to control this with the HSF1 KO cells, in which the m6A level changes, as the increased production rates are absent for the specific cluster of stress-induced genes, further supporting the role of transcriptional activation in shaping m6A levels for these genes. For HSF1-independent genes, the HSF-KO cells mirror the behavior of WT conditions when looking at 500 highest and lowest PC1 (based on the prior analysis in WT cells), suggesting that changes in m6A levels are primarily driven by altered export rates rather than changes in production.

      Among the HSF1 targets, Hspa1a seems to show an inverse behaviour, with the highest methylation in ctrl, even though expression strongly goes up after heat shock. Is this related to the subcellular localization of this particular transcript before and after heat shock?

      Upon reviewing the heat stress target genes, we identified an issue with the proper labeling of the gene symbols, which has now been corrected (Figure 4 panel i). The inverse behavior observed for Hspb1 and partially for Hsp90aa1 is not accounted for by the m6ADyn model, and is indeed an interesting exception with respect to all other induced genes. Further investigation will be required to understand the methylation dynamics of Hspb1 during the response to heat stress.

      Reviewer #3 (Recommendations for the authors):

      Page 4. Indicate reference for "a more recent study finding reduced m6A levels in chromatin-associated RNA.".

      We thank the reviewer for this point and added two publications with a very recent one, both showing that chromatin-associated nascent RNA has less m6A methylation

      The manuscript is perhaps a bit too long. It took me a long time to get to the end. The findings can be clearly presented in a more concise manner and that will ensure that anyone starting to read will finish it. This is not a weakness, but a hope that the authors can reduce the text.

      We have respectfully chosen to maintain the length of the manuscript. The model, its predictions and their relationship to experimental observations are somewhat complex, and we felt that further reduction of the text would come at the expense of clarity.

    1. Author response:

      The following is the authors’ response to the original reviews.

      Life Assessment

      This valuable study builds on previous work by the authors by presenting a potentially key method for correcting optical aberrations in GRIN lens-based micro endoscopes used for imaging deep brain regions. By combining simulations and experiments, the authors show that the obtained field of view is significantly increased with corrected, versus uncorrected microendoscopes. The evidence supporting the claims of the authors is solid, although some aspects of the manuscript should be clarified and missing information provided. Because the approach described in this paper does not require any microscope or software modifications, it can be readily adopted by neuroscientists who wish to image neuronal activity deep in the brain.

      We thank the Referees for their interest in the paper and for the constructive feedback. We have taken the time necessary to address all of their comments, acquiring new data and performing additional analyses. With the inclusion of these new results, we modified four main figures (Figures 1, 6, 7, and 8), added three new Supplementary Figures (Supplementary Figures 1, 2, and 3), and significantly edited the text. Based on the additional work suggested by the Referees, we believe that we have improved our manuscript, provided missing information, and clarified some aspects of the manuscript, which the Referees pointed our attention to.

      Public Reviews:

      Reviewer #1 (Public review):

      Summary:

      Referee’s comment: Sattin, Nardin, and colleagues designed and evaluated corrective microlenses that increase the useable field of view of two long (>6mm) thin (500 um diameter) GRIN lenses used in deep-tissue two-photon imaging. This paper closely follows the thread of earlier work from the same group (e.g. Antonini et al, 2020; eLife), filling out the quiver of available extended-fieldof-view 2P endoscopes with these longer lenses. The lenses are made by a molding process that appears practical and easy to adopt with conventional two-photon microscopes.

      Simulations are used to motivate the benefits of extended field of view, demonstrating that more cells can be recorded, with less mixing of signals in extracted traces, when recorded with higher optical resolution. In vivo tests were performed in the piriform cortex, which is difficult to access, especially in chronic preparations.

      The design, characterization, and simulations are clear and thorough, but not exhaustive (see below), and do not break new ground in optical design or biological application. However, the approach shows much promise, including for applications not mentioned in the present text such as miniaturized GRIN-based microscopes. Readers will largely be interested in this work for practical reasons: to apply the authors' corrected endoscopes.

      Strengths:

      The text is clearly written, the ex vivo analysis is thorough and well-supported, and the figures are clear. The authors achieved their aims, as evidenced by the images presented, and were able to make measurements from large numbers of cells simultaneously in vivo in a difficult preparation.

      Weaknesses:

      Referee’s comment: (1) The novelty of the present work over previous efforts from the same group is not well explained. What needed to be done differently to correct these longer GRIN lenses?

      We thank the Referee for the positive evaluation of our work. The optical properties of GRIN lenses depend on the geometrical and optical features of the specific GRIN lens type considered, i.e. its diameter, length, numerical aperture, pitch, and radial modulation of the refractive index. Our approach is based on the addition of a corrective optical element at the back end of the GRIN lens to compensate for aberrations that light encounters as it travels through the GRIN lens. The corrective optical element must, therefore, be specifically tailored to the specific GRIN lens type we aim to correct the aberrations of. The novelty of the present article lies in the successful execution of the ray-trace simulations and two-photon lithography fabrication of corrective optical elements necessary to achieve aberration correction in the two novel and long GRIN lens types, i.e. NEM-050-25-15-860-S-1.5p and NEM-050-23-15-860-S-2.0p (GRIN length, 6.4 mm and 8.8 mm, respectively). Our previous work (Antonini et al. eLife 2020) demonstrated aberration correction with GRIN lenses shorter than 4.1 mm. The design and fabrication of a single corrective optical element suitable to enlarge the field-of-view (FOV) in these longer GRIN lenses is not obvious, especially because longer GRIN lenses are affected by stronger aberrations. To better clarify this point, we revised the Introduction at page 5 (lines 3-10 from bottom) as follows:

      “Recently, a novel method based on 3D microprinting of polymer optics was developed to correct for GRIN aberrations by placing specifically designed aspherical corrective lenses at the back end of the GRIN lens 7. This approach is attractive because it is built-in on the GRIN lens and corrected microendoscopes are ready-to-use, requiring no change in the optical set-up. However, previous work demonstrated the feasibility of this method only for GRIN lenses of length < 4.1 mm 7, which are too short to reach the most ventral regions of the mouse brain. The applicability of this technology to longer GRIN lenses, which are affected by stronger optical aberrations 19, remained to be proven.”

      (2) Some strong motivations for the method are not presented. For example, the introduction (page 3) focuses on identifying neurons with different coding properties, but this can be done with electrophysiology (albeit with different strengths and weaknesses). Compared to electrophysiology, optical methods more clearly excel at genetic targeting, subcellular measurements, and molecular specificity; these could be mentioned.

      Thank you for the comment. We added a paragraph in the Introduction (page 3, lines 2-8) according to what suggested by the Reviewer:

      “High resolution 2P fluorescence imaging of the awake brain is a fundamental tool to investigate the relationship between the structure and the function of brain circuits 1. Compared to electrophysiological techniques, functional imaging in combination with genetically encoded indicators allows monitoring the activity of genetically targeted cell types, access to subcellular compartments, and tracking the dynamics of many biochemical signals in the brain (2). However, a critical limitation of multiphoton microscopy lies in its limited (< 1 mm) penetration depth in scattering biological media 3”.

      Another example, in comparing microfabricated lenses to other approaches, an unmentioned advantage is miniaturization and potential application to mini-2P microscopes, which use GRIN lenses.

      We added the concept suggested by the Reviewer in the Discussion (page 21, lines 4-7 from bottom). The text now reads:

      “Another advantage of long corrected microendoscopes described here over adaptive optics approaches is the possibility to couple corrected microendoscopes with portable 2P microscopes 42-44, allowing high resolution functional imaging of deep brain circuits on an enlarged FOV during naturalistic behavior in freely moving mice”.

      (3) Some potentially useful information is lacking, leaving critical questions for potential adopters:

      How sensitive is the assembly to decenter between the corrective optic and the GRIN lens?

      Following the Referee’s comment, we conducted new optical simulations to evaluate the decrease in optical performance of the corrected endoscopes as a function of the radial shift of the corrective lens from the optical axis of the GRIN rod (decentering, new Supplementary Figure 3), using light rays passing either off- or on-axis. For off-axis rays, we found that the Strehl ratio remained above 0.8 (Maréchal criterion) for positive translations in the range 6-11.5 microns and 16-50 microns for the 6.4 mm- and the 8.8 mm-long corrected microendoscope, respectively, while the Strehl ratio decreased below 0.8 for negative translations of amplitude ~ 5 microns. Please note that for the most marginal rays, a negative translation produces a mismatch between the corrective microlens and the GRIN lens such that the light rays no longer pass through the corrective lens. In contrast, rays passing near the optical axis were still focused by the corrected probe with Strehl ratio above 0.8 in a range of radial shifts of -40 – 40 microns for both microendoscope types. Altogether, these novel simulations suggest that decentering between the corrective microlens and the GRIN lens < 5 microns do not majorly affect the optical properties of the corrected endoscopes. These new results are now displayed in Supplementary Figure 3 and described on page 7 (lines 3-5 from bottom).

      What is the yield of fabrication and of assembly?

      The fabrication yield using molding was ~ 90% (N > 30 molded lenses). The main limitation of this procedure was the formation of air bubbles between the mold negative and the glass coverslip. Molded lenses were visually inspected with a stereomicrscope and, in case of air bubble formation, they were discarded.

      The assembly yield, i.e. correct positioning of the GRIN lens with respect to the coverslip, was 100 % (N = 27 endoscopes).

      We added this information in the Methods at page 29 (lines 1-12), as follows:

      “After UV curing, the microlens was visually inspected at the stereomicroscope. In case of formation of air bubbles, the microlens was discarded (yield of the molding procedure: ~ 90 %, N > 30 molded lenses). The coverslip with the attached corrective lens was sealed to a customized metal or plastic support ring of appropriate diameter (Fig. 2C). The support ring, the coverslip and the aspherical lens formed the upper part of the corrected microendoscope, to be subsequently coupled to the proper GRIN rod (Table 2) using a custom-built opto-mechanical stage and NOA63 (Fig. 2C) 7. The GRIN rod was positioned perpendicularly to the glass coverslip, on the other side of the coverslip compared to the corrective lens, and aligned to the aspherical lens perimeter (Fig. 2C) under the guidance of a wide field microscope equipped with a camera. The yield of the assembly procedure for the probes used in this work was 100 % (N = 27 endoscopes). For further details on the assembly of corrected microendoscope see(7)”. 

      Supplementary Figure 1: Is this really a good agreement between the design and measured profile? Does the figure error (~10 um in some cases on average) noticeably degrade the image?

      As the Reviewer correctly noticed, the discrepancy between the simulated profile and the experimentally measured profile can be up to 5-10 microns at specific radial positions. This discrepancy could be due to issues with: (i) the fabrication of the microlens; (ii) the experimental measurement of the lens profile with the stylus profilometer. To discriminate among these two possibilities, we asked what would be the expected optical properties of the corrected endoscope should the corrective lens have the experimentally measured (not the simulated) profile. To this aim, we performed new optical simulations of the point spread function (PSF) of the corrected probe using, as corrective microlens profile, the average, experimentally measured, profile of a fabricated corrective lens. For both microendoscope types, we first fitted the mean experimentally measured profile of the fabricated lens with the aspherical function reported in equation (1) of the main text:

      where:

      -                is the radial distance from the optical axis;

      -                is equal to 1⁄ , where R is the radius of curvature;

      -                is the conic constant;

      -                − are asphericity coefficients;

      -                is the height of the microlens profile on-axis.

      The fitting values of the parameters of equation (1) for the two lenses are reported for the Referee’s inspection here below (variables describing distances are expressed in mm):

      Author response table 1.

      Fitting values for the parameters of Equation (1) describing the profile of corrective microlens replicas measured with the stylus profilometer. Distances are expressed in mm.

      We then assumed that the profile of the corrective microlenses were equal to the mean experimentally measured profiles and used the aspherical fitting functions in the optical simulations to compute the performance of corrected microendoscopes. For both microendoscope types, we found that the Strehl ratio was lower than 0.35, well below the theoretical diffractionlimited threshold of 0.8 (Maréchal criterion) at moderate distances from the optical axis (68 μm94 μm and 67 μm-92 μm on the focal plane in the object space, after the front end of the GRIN lens, for the 6.4 mm- and the 8.8 mm-long corrected microendoscope, respectively, Author response image 1A, C), and the PSF was strongly distorted (Author response image 1B, D).

      Author response image 1.

      Simulated optical performance of corrected probes with profiles of corrective microlenses equal to the mean experimentally measured profiles of fabricated corrective lenses. A) The Strehl ratio for the 6.4 mm-long corrected microendoscope with measured microlens profile (black dots) is computed on-axis (distance from the center of the FOV d = 0 µm) and at two radial distances off-axis (d = 68 μm and 94 μm on the focal plane in the object space) and compared to the Strehl ratio of the uncorrected (red line) and corrected (blue line) microendoscopes. B) Lateral (x,y) and axial (x,z) fluorescence intensity (F) profiles of simulated PSFs on-axis (left) and off-axis (right, at the indicated distance d computed on the focal plane in the object space) for the 6.4 mm-long corrected microendoscope with measured microlens profile. C) Same as in (A) for the 8.8 mm-long corrected microendoscope (off-axis d = 67 μm and 92 μm on the focal plane in the object space). D) Same as in (B) for the 8.8 mm-long corrected microendoscope.

      These simulated findings are in contrast with the experimentally measured optical properties of our corrected endoscopes (Figure 3). In other words, these novel simulated results show that experimentally measured profiles of the corrected lenses are incompatible with the experimental measurements of the optical properties of the corrected endoscopes. Therefore, our experimental recording of the lens profile shown in Supplementary Figure 1 of the first submission (now Supplementary Figure 4) should be used only as a coarse measure of the lens shape and cannot be used to precisely compare simulated lens profiles with measured lens profiles.

      How do individual radial profiles compare to the presented means?

      We provide below a modified version of Supplementary Figure 4 (Supplementary Figure 1 in the first submission), where individual profiles measured with the stylus profilometer and the mean profile are displayed for both microendoscope types (Author response image 2). In the manuscript (Supplementary Figure 4), we would suggest to keep showing mean profiles ± standard errors of the mean, as we did in the original submission.

      Author response image 2.

      Characterization of polymeric corrective lens replicas. A) Stylus profilometer measurements were performed along the radius of the corrective polymer microlens replica for the 6.4 mm-long corrected microendoscope. Individual measured profiles (grey solid lines) obtained from n = 3 profile measurements on m = 3 different corrective lens replicas, plus the mean profile (black solid line) are displayed. B) Same as (A) for the 8.8 mm-long microendoscope.

      What is the practical effect of the strong field curvature? Are the edges of the field, which come very close to the lens surface, a practical limitation?

      A first practical effect of the field curvature is that structures at different z coordinates are sampled. The observed field curvature of corrected endoscopes may therefore impact imaging in brain regions characterized by strong axially organized anatomy (e.g., the pyramidal layer of the hippocampus), but would not significantly affect imaging in regions with homogeneous cell density within the axial extension of the field curvature (< 170 µm, see more details below). A second consequence of the field curvature, as the Referee correctly points out, is that cell at the border of the FOV are closer to the front end of the GRIN lens. In measurements of subresolved fluorescent layers (Figure 3A-D), we observed that the field curvature extends in the axial direction to ~ 110 μm and ~170 μm for the 6.4 mm- and the 8.8 mm-long microendoscopes, respectively. Considered that the nominal working distances on the object side of the 6.4 mm- and the 8.8 mm-long microendoscopes were, respectively, 210 μm and 178 μm (Table 3), structures positioned at the very edge of the FOV were ~ 100 μm and ~ 8 μm away from the GRIN front end for the 6.4 mm-long and for the 8.8 mm-long probe, respectively. Previous studies have shown that brain tissue within 50-100 μm from the GRIN front end may show signs of tissue reaction to the implant (Curreli et al. PLOS Biology 2022, Attardo et al. Nature 2015). Therefore, structures at the very edge of the FOV of the 8.8 mm-long endoscopes, but not those at the edge of the 6.4 mm-long endoscopes, may be within the volume showing tissue reaction. We added a paragraph in the text to discuss these points (page 18 lines 10-14).

      The lenses appear to be corrected for monochromatic light; high-performance microscopes are generally achromatic. Is the bandwidth of two-photon excitation sufficient to warrant optimization over multiple wavelengths?

      Thanks for this comment. All optical simulations described in the first submission were performed at a fixed wavelength (λ = 920 nm). Following the Referee’s request, we explored the effect of changing wavelength on the Strehl ratio using new optical simulations. We found that the Strehl ratio remains > 0.8 at least within ± 10 nm from λ = 920 nm (new Supplementary Figure 1A-D, left panels), which covers the limited bandwidth of our femtosecond laser. Moreover, these simulations demonstrate that, on a much wider wavelength range (800 - 1040 nm), high Strehl ratio is obtained, but at different z planes (new Supplementary Figure 1A-D, right panels). This means that the corrective lens is working as expected also for wavelengths which are different from 920 nm, with different wavelengths having the most enlarged FOV located at different working distances. These new results are now described on page 7 (lines 8-10).

      GRIN lenses are often used to access a 3D volume by scanning in z (including in this study). How does the corrective lens affect imaging performance over the 3D field of view?

      The optical simulations we did to design the corrective lenses were performed maximizing aberration correction only in the focal plane of the endoscope. Following the Referee’s comment, we explored the effect of aberration correction outside the focal plane using new optical simulations. In corrected endoscopes, we found that for off-axis rays (radial distance from the optical axis > 40 μm) the Strehl ratio was > 0.8 (Maréchal criterion) in a larger volume compared to uncorrected endoscopes (new Supplementary Figure 2), demonstrating that the aberration correction method developed in this study does extend beyond the focal plane for short distances. For example, at a radial distance of ~ 90 μm from the optical axis, the axial range in which the Strehl ratio was > 0.8 in corrected endoscopes was 28 μm and 19 μm for the 6.4 mm- and the 8.8 mm-long microendoscope, respectively. These new results are now described on page 7 (10-19).

      (4) The in vivo images (Figure 7D) have a less impressive resolution and field than the ex vivo images (Figure 4B), and the reason for this is not clear. Given the difference in performance, how does this compare to an uncorrected endoscope in the same preparation? Is the reduced performance related to uncorrected motion, field curvature, working distance, etc?

      In comparing images in Figure 4B with images shown in Figure 7D, the following points should be considered:

      (1) Figure 4B is a maximum fluorescence intensity projection of multiple axial planes of a z-stack acquired through a thin brain slice (slice thickness: 50 µm) using 8 frame averages for each plane. In contrast, images in Figure 7D are median projection of a t-series acquired on a single plane in the awake mouse at 30 Hz resonant scanning imaging (8 min, 14,400 frames).

      (2) Images of the fixed brain slice in Figure 4B were acquired at 1024 pixels x 1024 pixels resolution, nominal pixel size 0.45 µm/pixel, and with objective NA = 0.50, whereas in vivo images in Figure 7D were acquired at 512 pixels x 512 pixels resolution, nominal pixel size 0.72 - 0.84 µm/pixel, and with objective NA = 0.45.

      (3) In the in vivo preparation (Figure 7D), excitation and emission light travel through > 180 µm of scattering and absorbing brain tissue, reducing spatial resolution and the SNR of the collected fluorescence signal.

      (4) By shifting the sample in the x, y plane, in Figure 4B we could chose a FOV containing homogenously stained cells. x, y shifting and selecting across multiple FOVs was not possible in vivo, as the GRIN lens was cemented on the animal skull.

      (5) Images in Figure 7D were motion corrected, but we cannot exclude that part of the decrease in resolution observed in Figure 7D when compared to images in Figure 4B are due to incomplete correction of motion artifacts.

      For all the reasons listed above, we believe that it is expected to see smaller resolution and contrast in images recorded in vivo (Figure 7D) compared to images acquired in fixed tissue (Figure 4B).

      Regarding the question of how do images from an uncorrected and a corrected endoscopes compared in vivo, we think that this comparison is better performed in fixed tissue (Figure 4) or in simulated calcium data (Figure 5-6), rather than in vivo recordings (Figure 7). In fact, in the brain of living mice motion artifacts, changes in fluorophore expression level, variation in the optical properties of the brain (e.g., the presence of a blood vessel over the FOV) may make the comparison of images acquired with uncorrected and corrected microendoscopes difficult, requiring a large number of animals to cancel out the contributions of these factors. Comparing optical properties in fixed tissue is, in contrast, devoid of these confounding factors. Moreover, the major advantage of quantifying how the optical properties of uncorrected and corrected endoscopes impact on the ability to extract information about neuronal activity in simulated calcium data is that, under simulated conditions, we can count on a known ground truth as reference (e.g., how many neurons are in the FOV, where they are, and which is their electrical activity). This is clearly not possible in the in vivo recordings.

      Regarding Figure 7, there is no analysis of the biological significance of the calcium signals or even a description of where olfactory stimuli were presented.

      We appreciate the Reviewer pointing out the lack of detailed analysis regarding the biological significance of the calcium signals and the presentation of olfactory stimuli in Figure 7. Our initial focus was on demonstrating the effectiveness of the optimized GRIN lenses for imaging deep brain areas like the piriform cortex, with an emphasis on the improved signal-tonoise ratio (SNR) these lenses provide. However, we agree that including more context about the experimental conditions would enhance the manuscript. To address this point, we added a new panel (Figure 7F) showing calcium transients aligned with the onset of olfactory stimulus presentations, which are now indicated by shaded light blue areas. Additionally, we have specified the timing of each stimulus presented in Figure 7E. This revision allows readers to better understand the relationship between the calcium signals and the olfactory stimuli.

      The timescale of jGCaMP8f signals in Figure 7E is uncharacteristically slow for this indicator (compared to Zhang et al 2023 (Nature)), though perhaps this is related to the physiology of these cells or the stimuli.

      Regarding the timescale of the calcium signals observed in Figure 7E, we apologize for the confusion caused by a mislabeling we inserted in the original manuscript. The experiments presented in Figure 7 were conducted using jGCaMP7f, not jGCaMP8f as previously stated (both indicators were used in this study but in separate experiments). We have corrected this error in the Results section (caption of Figure 7D, E). It is important to note that jGCaMP7f has a longer half-decay time compared to jGCaMP8f, which could in part account for the slower decay kinetics observed in our data. Furthermore, the prolonged calcium signals can be attributed to the physiological properties of neurons in the piriform cortex. Upon olfactory stimulation, these neurons often fire multiple action potentials, resulting in extended calcium transients that can last several seconds. This sustained activity has been documented in previous studies, such as Roland et al. (eLife 2017, Figure 1C therein) in anesthetized animals and Wang et al. (Neuron 2020, Figure 1E therein) in awake animals, which report similar durations for calcium signals.

      (5) The claim of unprecedented spatial resolution across the FOV (page 18) is hard to evaluate and is not supported by references to quantitative comparisons. The promises of the method for future studies (pages 18-19) could also be better supported by analysis or experiment, but these are minor and to me, do not detract from the appeal of the work.

      GRIN lens-based imaging of piriform cortex in the awake mouse had already been done in Wang et al., Neuron 2020. The GRIN lens used in that work was NEM-050-50-00920-S-1.5p (GRINTECH, length: 6.4 mm; diameter: 0.5 mm), similar to the one that we used to design the 6.4 mm-long corrected microendoscope. Here we used a microendoscope specifically design to correct off-axis aberrations and enlarge the FOV, in order to maximize the number of neurons recorded with the highest possible spatial resolution, while keeping the tissue invasiveness to the minimum. Following the Referee’s comments, we revised the sentence at page 19 (lines 68 from bottom) as follows:

      “We used long corrected microendoscopes to measure population dynamics in the olfactory cortex of awake head-restrained mice with unprecedented combination of high spatial resolution across the FOV and minimal invasiveness(17)”.

      (6) The text is lengthy and the material is repeated, especially between the introduction and conclusion. Consolidating introductory material to the introduction would avoid diluting interesting points in the discussion.

      We thank the Reviewer for this comment. As suggested, we edited the Introduction and shortened the Discussion.

      Reviewer #2 (Public review):

      In this manuscript, the authors present an approach to correct GRIN lens aberrations, which primarily cause a decrease in signal-to-noise ratio (SNR), particularly in the lateral regions of the field-of-view (FOV), thereby limiting the usable FOV. The authors propose to mitigate these aberrations by designing and fabricating aspherical corrective lenses using ray trace simulations and two-photon lithography, respectively; the corrective lenses are then mounted on the back aperture of the GRIN lens.

      This approach was previously demonstrated by the same lab for GRIN lenses shorter than 4.1 mm (Antonini et al., eLife, 2020). In the current work, the authors extend their method to a new class of GRIN lenses with lengths exceeding 6 mm, enabling access to deeper brain regions as most ventral regions of the mouse brain. Specifically, they designed and characterized corrective lenses for GRIN lenses measuring 6.4 mm and 8.8 mm in length. Finally, they applied these corrected long micro-endoscopes to perform high-precision calcium signal recordings in the olfactory cortex.

      Compared with alternative approaches using adaptive optics, the main strength of this method is that it does not require hardware or software modifications, nor does it limit the system's temporal resolution. The manuscript is well-written, the data are clearly presented, and the experiments convincingly demonstrate the advantages of the corrective lenses.

      The implementation of these long corrected micro-endoscopes, demonstrated here for deep imaging in the mouse olfactory bulb, will also enable deep imaging in larger mammals such as rats or marmosets.

      We thank the Referee for the positive comments on our study. We address the points indicated by the Referee in the “Recommendation to the authors” section below.

      Reviewer #3 (Public review):

      Summary:

      This work presents the development, characterization, and use of new thin microendoscopes (500µm diameter) whose accessible field of view has been extended by the addition of a corrective optical element glued to the entrance face. Two micro endoscopes of different lengths (6.4mm and 8.8mm) have been developed, allowing imaging of neuronal activity in brain regions >4mm deep. An alternative solution to increase the field of view could be to add an adaptive optics loop to the microscope to correct the aberrations of the GRIN lens. The solution presented in this paper does not require any modification of the optical microscope and can therefore be easily accessible to any neuroscience laboratory performing optical imaging of neuronal activity.

      Strengths:

      (1) The paper is generally clear and well-written. The scientific approach is well structured and numerous experiments and simulations are presented to evaluate the performance of corrected microendoscopes. In particular, we can highlight several consistent and convincing pieces of evidence for the improved performance of corrected micro endoscopes:

      a) PSFs measured with corrected micro endoscopes 75µm from the centre of the FOV show a significant reduction in optical aberrations compared to PSFs measured with uncorrected micro endoscopes.

      b) Morphological imaging of fixed brain slices shows that optical resolution is maintained over a larger field of view with corrected micro endoscopes compared to uncorrected ones, allowing neuronal processes to be revealed even close to the edge of the FOV.

      c) Using synthetic calcium data, the authors showed that the signals obtained with the corrected microendoscopes have a significantly stronger correlation with the ground truth signals than those obtained with uncorrected microendoscopes.

      (2) There is a strong need for high-quality micro endoscopes to image deep brain regions in vivo. The solution proposed by the authors is simple, efficient, and potentially easy to disseminate within the neuroscience community.

      Weaknesses:

      (1) Many points need to be clarified/discussed. Here are a few examples:

      a) It is written in the methods: “The uncorrected microendoscopes were assembled either using different optical elements compared to the corrected ones or were obtained from the corrected

      probes after the mechanical removal of the corrective lens.”

      This is not very clear: the uncorrected microendoscopes are not simply the unmodified GRIN lenses?

      We apologize for not been clear enough on this point. Uncorrected microendoscopes are not simply unmodified GRIN lenses, rather they are GRIN lenses attached to a round glass coverslip (thickness: 100 μm). The glass coverslip was included in ray-trace optical simulations of the uncorrected system and this is the reason why commercial GRIN lenses and corresponding uncorrected microendoscopes have different working distances, as reported in Tables 2-3. To make the text clearer, we added the following sentence at page 27 (last 4 lines):

      “To evaluate the impact of corrective microlenses on the optical performance of GRIN-based microendoscopes, we also simulated uncorrected microendoscopes composed of the same optical elements of corrected probes (glass coverslip and GRIN rod), but in the absence of the corrective microlens”.

      b) In the results of the simulation of neuronal activity (Figure 5A, for example), the neurons in the center of the FOV have a very large diameter (of about 30µm). This should be discussed.

      Thanks for this comment. In synthetic calcium imaging t-series, cell radii were randomly sampled from a Gaussian distribution with mean = 10 µm and standard deviation (SD) = 3 µm. Both values were estimated from the literature (ref. no. 28: Suzuki & Bekkers, Journal of Neuroscience, 2011) as described in the Methods (page 35). In the image shown in Figure 5A, neurons near to the center of the FOV have radius of ~ 20 µm corresponding to the right tail of the distribution (mean + 3SD = 19 µm). It is also important to note that, for corrected microendoscopes, neurons in the central portion of the FOV appear larger than cells located near the edges of the FOV, because the magnification depends on the distance from the optical axis (see Figure 3E, F) and near the center the magnification is > 1 for both microendoscope types.

      Also, why is the optical resolution so low on these images?

      Images shown in Figure 5 are median fluorescence intensity projections of 5 minute-long simulated t-series. Simulated calcium data were generated with pixel size 0.8 μm/pixel and frame rate 30 Hz, similarly to in vivo recordings. In the simulations, pixels not belonging to any cell soma were assigned a value of background fluorescence randomly sampled from a normal distribution with mean and standard deviation estimated from experimental data, as described in the Methods section (page 37). To simulate activity, the mean spiking rate of neurons was set to 0.3 Hz, thus in a large fraction of frames neurons do not show calcium transients. Therefore, the median fluorescence intensity value of somata will be close to their baseline fluorescence value (_F_0). Since in simulations F0 values (~ 45-80 a.u.) were not much higher than the background fluorescence level (~ 45 a.u.), this may generate the appearance of low contrast image in Figure 5A. Finally, we suspect that PDF rendering also contributed to degrade the quality of those images. We will now submit high resolution images alongside the PDF file.

      c) It seems that we can't see the same neurons on the left and right panels of Figure 5D. This should be discussed.

      The Referee is correct. When we intersected the simulated 3D volume of ground truth neurons with the focal surface of microendoscopes, the center of the FOV for the 8.8 mmlong corrected microendoscope was located at a larger depth than the FOV of the 8.8 mm uncorrected microendoscope. This effect was due to the larger field curvature of corrected 8.8 mmlong endoscopes compared to 8.8 mm-long uncorrected endoscopes. This is the reason why different neurons were displayed for uncorrected and corrected endoscopes in Figure 5D. We added this explanation in the text at page 37 (lines 1-4). The text reads:

      “Due to the stronger field curvature of the 8.8 mm-long corrected microendoscope (Figure 1C) compared to 8.8 mm-long uncorrected microendoscopes, the center of the corrected imaging focal surface resulted at a larger depth in the simulated volume compared to the center of the uncorrected focal surface(s). Therefore, different simulated neurons were sampled in the two cases”.

      d) It is not very clear to me why in Figure 6A, F the fraction of adjacent cell pairs that are more correlated than expected increases as a function of the threshold on peak SNR. The authors showed in Supplementary Figure 3B that the mean purity index increases as a function of the threshold on peak SNR for all micro endoscopes. Therefore, I would have expected the correlation between adjacent cells to decrease as a function of the threshold on peak SNR. Similarly, the mean purity index for the corrected short microendoscope is close to 1 for high thresholds on peak SNR: therefore, I would have expected the fraction of adjacent cell pairs that are more correlated than expected to be close to 0 under these conditions. It would be interesting to clarify these points.

      Thanks for raising this point. We defined the fraction of adjacent cell pairs more correlated than expected as the number of adjacent cell pairs more correlated than expected divided by the number of adjacent cell pairs. The reason why this fraction raises as a function of the SNR threshold is shown in Supplementary Figure 2 in the first submission (now Supplementary Figure 5). There, we separately plotted the number of adjacent cell pairs more correlated than expected (numerator) and the number of adjacent cell pairs (denominator) as a function of the SNR threshold. For both microendoscope types, we observed that the denominator more rapidly decreased with peak SNR threshold than the numerator. Therefore, the fraction of adjacent cell pairs more correlated than expected increases with the peak SNR threshold.

      To understand why the denominator decreases with SNR threshold, it should be considered that, due to the deterioration of spatial resolution and attenuation of fluorescent signal collection as a function of the radial distance from the optical axis (see for example fluorescent film profiles in Figure 3A, C), increasing the threshold on the peak SNR of extracted calcium traces implies limiting cell detection to those cells located within smaller distance from the center of the FOV. This information is shown in Figure 5C, F.

      In the manuscript text, this point is discussed at page 12 (lines 1-3 from bottom) and page 13 (lines 1-4):

      “The fraction of pairs of adjacent cells (out of the total number of adjacent pairs) whose activity correlated significantly more than expected increased as a function of the SNR threshold for corrected and uncorrected microendoscopes of both lengths (Fig. 6A, F). This effect was due to a larger decrease of the total number of pairs of adjacent cells as a function of the SNR threshold compared to the decrease in the number of pairs of adjacent cells whose activity was more correlated than expected (Supplementary Figure 5)”.

      e) Figures 6C, H: I think it would be fairer to compare the uncorrected and corrected endomicroscopes using the same effective FOV.

      To address the Reviewer’s concern, we repeated the linear regression of purity index as a function of the radial distance using the same range of radial distances for the uncorrected and corrected case of both microendoscope types. Below, we provide an updated version of Figure 6C, H for the referee’s perusal. Please note that the maximum value displayed on the x-axis of both graphs is now corresponding to the minimum value between the two maximum radial distance values obtained in the uncorrected and corrected case (maximum radial distance displayed: 151.6 µm and 142.1 μm for the 6.4 mm- and the 8.8 mm-long GRIN rod, respectively). Using the same effective FOV, we found that the purity index drops significantly more rapidly with the radial distance for uncorrected microendoscopes compared to the corrected ones, similarly to what observed in the original version of Figure 6. The values of the linear regression parameters and statistical significance of the difference between the slopes in the uncorrected and corrected cases are stated in the Author response image 3 caption below for both microendoscope types. In the manuscript, we would suggest to keep showing data corresponding to all detected cells, as we did in the original submission.

      Author response image 3.

      Linear regression of purity index as a function of the radial distance. A) Purity index of extracted traces with peak SNR > 10 was estimated using a GLM of ground truth source contributions and plotted as a function of the radial distance of cell identities from the center of the FOV for n = 13 simulated experiments with the 6.4 mm-long uncorrected (red) and corrected (blue) microendoscope. Black lines represent the linear regression of data ± 95% confidence intervals (shaded colored areas). Maximum value of radial distance displayed: 151.6 μm. Slopes ± standard error (s.e.): uncorrected, (-0.0015 ± 0.0002) µm-1; corrected, (-0.0006 ± 0.0001) μm-1. Uncorrected, n = 991; corrected, n = 1156. Statistical comparison of slopes, p < 10<sup>-10</sup>, permutation test. B) Same as (A) for n = 15 simulated experiments with the 8.8 mm-long uncorrected and corrected microendoscope. Maximum value of radial distance displayed: 142.1 μm. Slopes ± s.e.: uncorrected, (-0.0014 ± 0.0003) μm-1; corrected, (-0.0010 ± 0.0002) µm-1. Uncorrected, n = 718; corrected, n = 1328. Statistical comparison of slopes, p = 0.0082, permutation test.

      f) Figure 7E: Many calcium transients have a strange shape, with a very fast decay following a plateau or a slower decay. Is this the result of motion artefacts or analysis artefacts?

      Thank you for raising this point about the unusual shapes of the calcium transients in Figure 7E. The observed rapid decay following a plateau or a slower decay is indeed a result of how the data were presented in the original submission. Our experimental protocol consisted of 22 s-long trials with an inter-trial interval of 10 s (see Methods section, page 44). In the original figure, data from multiple trials were concatenated, which led to artefactual time courses and apparent discontinuities in the calcium signals. To resolve this issue, we revised Figure 7E to accurately represent individual concatenated trials. We also added a new panel (please see new Figure 7F) showing examples of single cell calcium responses in individual trials without concatenation, with annotations indicating the timing and identity of presented olfactory stimuli.

      Also, the duration of many calcium transients seems to be long (several seconds) for GCaMP8f. These points should be discussed.

      Author response: regarding the timescale of the calcium signals observed in Figure 7E, we apologize for the confusion caused by a mislabeling we inserted in the manuscript. The experiments presented in Figure 7 were conducted using jGCaMP7f, not jGCaMP8f as previously stated (both indicators were used in this study, but in separate experiments). We have corrected this error in the Results section (caption of Figure 7D, E). It is important to note that jGCaMP7f has a longer half-decay time compared to jGCaMP8f, which could in part account for the slower decay kinetics observed in our data. Furthermore, the prolonged calcium signals can be attributed to the physiological properties of neurons in the piriform cortex. Upon olfactory stimulation, these neurons often fire multiple action potentials, resulting in extended calcium transients that can last several seconds. This sustained activity has been documented in previous studies, such as Roland et al. (eLife 2017, Figure 1C therein) in anesthetized animals and Wang et al. (Neuron 2020, Figure 1E therein) in awake animals, which report similar durations for calcium signals. We cite these references in the text. We believe that these revisions and clarifications address the Reviewer's concern and enhance the overall clarity of our manuscript.

      g) The authors do not mention the influence of the neuropil on their data. Did they subtract the neuropil's contribution to the signals from the somata? It is known from the literature that the presence of the neuropil creates artificial correlations between neurons, which decrease with the distance between the neurons (Grødem, S., Nymoen, I., Vatne, G.H. et al. An updated suite of viral vectors for in vivo calcium imaging using intracerebral and retro-orbital injections in male mice. Nat Commun 14, 608 (2023). https://doi.org/10.1038/s41467-023-363243; Keemink SW, Lowe SC, Pakan JMP, Dylda E, van Rossum MCW, Rochefort NL. FISSA: A neuropil decontamination toolbox for calcium imaging signals. Sci Rep. 2018 Feb 22;8(1):3493.

      doi: 10.1038/s41598-018-21640-2. PMID: 29472547; PMCID: PMC5823956)

      This point should be addressed.

      We apologize for not been clear enough in our previous version of the manuscript. The neuropil was subtracted from calcium traces both in simulated and experimental data. Please note that instead of using the term “neuropil”, we used the word “background”. We decided to use the more general term “background” because it also applies to the case of synthetic calcium tseries, where neurons were modeled as spheres devoid of processes. The background subtraction is described in the Methods on page 39:

      F(t) was computed frame-by-frame as the difference between the average signal of pixels in each ROI and the background signal. The background was calculated as the average signal of pixels that: i) did not belong to any bounding box; ii) had intensity values higher than the mean noise value measured in pixels located at the corners of the rectangular image, which do not belong to the circular FOV of the microendoscope; iii) had intensity values lower than the maximum value of pixels within the boxes”.

      h) Also, what are the expected correlations between neurons in the pyriform cortex? Are there measurements in the literature with which the authors could compare their data?

      We appreciate the reviewer's interest in the correlations between neurons in the piriform cortex. The overall low correlations between piriform neurons we observed (Figure 8) are consistent with a published study describing ‘near-zero noise correlations during odor inhalation’ in the anterior piriform cortex of rats, based on extracellular recordings (Miura et al., Neuron 2013). However, to the best of our knowledge, measurements directly comparable to ours have not been described in the literature. Recent analyses of the correlations between piriform neurons were restricted to odor exposure windows, with the goal to quantify odor-specific activation patterns (e.g. Roland et al., eLife 2017; Bolding et al., eLife 2017, Pashkovski et al., Nature 2020; Wang et al., Neuron 2020). Here, we used correlation analyses to characterize the technical advancement of the optimized GRIN lens-based endoscopes. We showed that correlations of pairs of adjacent neurons were independent from radial distance (Figure 8B), highlighting homogeneous spatial resolution in the field of view.

      (2) The way the data is presented doesn't always make it easy to compare the performance of corrected and uncorrected lenses. Here are two examples:

      a) In Figures 4 to 6, it would be easier to compare the FOVs of corrected and uncorrected lenses if the scale bars (at the centre of the FOV) were identical. In this way, the neurons at the centre of the FOV would appear the same size in the two images, and the distances between the neurons at the centre of the FOV would appear similar. Here, the scale bar is significantly larger for the corrected lenses, which may give the illusion of a larger effective FOV.

      We appreciate the Referee’s comment. Below, we explain why we believe that the way we currently present imaging data in the manuscript is preferable:

      (1) current figures show images of the acquired FOV as they are recorded from the microscope (raw data), without rescaling. In this way, we exactly show what potential users will obtain when using a corrected microendoscope.

      (2) In the current version of the figures, the fact that the pixel size is not homogeneous across the FOV, nor equal between uncorrected and corrected microendoscopes, is initially shown in Figure 3E, F and then explicitly stated throughout the manuscript when images acquired with a corrected microendoscope are shown.

      (3) Rescaling images acquired with the corrected endoscopes gives the impression that the acquisition parameters were different between acquisitions with the corrected and uncorrected microendoscopes, which was not the case.

      Importantly, the larger FOV of the corrected microendoscope, which is one of the important technological achievements presented in this study, can be appreciated in the images regardless of the presentation format.

      b) In Figures 3A-D it would be more informative to plot the distances in microns rather than pixels. This would also allow a better comparison of the micro endoscopes (as the pixel sizes seem to be different for the corrected and uncorrected micro endoscopes).

      The Referee is correct that the pixel size is different between the corrected and uncorrected probes. This is because of the different magnification factor introduced by the corrective microlens, as described in Figure 3E, F. The rationale for showing images in Figure 3AD in pixels rather than microns is the following:

      (1) Optical simulations in Figure 1 suggest that a corrective optical element is effective in compensating for some of the optical aberrations in GRIN microendoscopes.

      (2) After fabricating the corrective optical element (Figure 2), in Figure 3A-D we conduct a preliminary analysis of the effect of the corrective optical element on the optical properties of the GRIN lens. We observed that the microfabricated optical element corrected for some aberrations (e.g., astigmatism), but also that the microfabricated optical element was characterized by significant field curvature. This can be appreciated showing distances in pixels.

      (3) The observed field curvature and the aspherical profile of the corrected lens prompted us to characterize the magnification factor of the corrected endoscopes as a function of the radial distance. We found that the magnification factor changed as a function of the radial distance (Figure 3E-F) and that pixel size was different between uncorrected and corrected endoscopes. We also observed that, in corrected endoscopes, pixel size was a function of the radial distance (Figure 3E-F).

      (4) Once all of the above was established and quantified, we assigned precise pixel size to images of uncorrected and corrected endoscopes and we show all following images of the study (Figure 3G on) using a micron (rather than pixel) scale.

      (3) There seems to be a discrepancy between the performance of the long lenses (8.8 mm) in the different experiments, which should be discussed in the article. For example, the results in Figure 4 show a considerable enlargement of the FOV, whereas the results in Figure 6 show a very moderate enlargement of the distance at which the person's correlation with the first ground truth emitter starts to drop.

      Thanks for raising this point and helping us clarifying data presentation. Images in Figure 4B are average z-projections of z-stacks acquired through a mouse fixed brain slice and they were taken with the purpose of showing all the neurons that could be visualized from the same sample using an uncorrected and a corrected microendoscope. In Figure 4B, all illuminated neurons are visible regardless of whether they were imaged with high axial resolution (e.g., < 10 µm as defined in Figure 3J) or poor axial resolution. In contrast, in Figure 6J we evaluated the correlation between the calcium trace extracted from a given ROI and the real activity trace of the first simulated ground truth emitter for that specific ROI. The moderate increase in the correlation for the corrected microendoscope compared to the uncorrected microendoscope (Figure 6J) is consistent with the moderate improvement in the axial resolution of the corrected probe compared to the uncorrected probe at intermediate radial distances (60-100 µm from the optical axis, see Figure 3J). We added a paragraph in the Results section (page 14, lines 8-18) to summarize the points described above.

      a) There is also a significant discrepancy between measured and simulated optical performance, which is not discussed. Optical simulations (Figure 1) show that the useful FOV (defined as the radius for which the size of the PSF along the optical axis remains below 10µm) should be at least 90µm for the corrected microendoscopes of both lengths. However, for the long microendoscopes, Figure 3J shows that the axial resolution at 90µm is 17µm. It would be interesting to discuss the origin of this discrepancy: does it depend on the microendoscope used?

      As the Reviewer correctly pointed out, the size of simulated PSFs at a given radial distance (e.g., 90 µm) tends to be generally smaller than that of the experimentally measured PSFs. This might be due to multiple reasons:

      (1) simulated PSFs are excitation PSFs, i.e. they describe the intensity spatial distribution of focused excitation light. On the contrary, measured PSFs result from the excitation and emission process, thus they are also affected by aberrations of light emitted by fluorescent beads and collected by the microscope.

      (2) in the optical simulations, the Zemax file of the GRIN lenses contained first-order aberrations. High-order aberrations were therefore not included in simulated PSFs.

      (3) intrinsic variability of experimental measurements (e.g., intrinsic variability of the fabrication process, alignment of the microendoscope to the optical axis of the microscope, the distance between the GRIN back end and the objective…) are not considered in the simulations.

      We added a paragraph in the Discussion section (page 17, lines 9-18) summarizing the abovementioned points.

      Are there inaccuracies in the construction of the aspheric corrective lens or in the assembly with the GRIN lens? If there is variability between different lenses, how are the lenses selected for imaging experiments?

      The fabrication yield, i.e. the yield of generating the corrective lenses, using molding was ~ 90% (N > 30 molded lenses). The main limitation of this procedure was the formation of air bubbles between the mold negative and the glass coverslip. Molded lenses were visually inspected with the stereoscope and, in case of air bubble formation, they were discarded.

      The assembly yield, i.e. the yield of correct positioning of the GRIN lens with respect to the coverslip, was 100 % (N = 27 endoscopes).

      We added this information in the Methods at page 29 (lines 1-12), as follows:

      “After UV curing, the microlens was visually inspected at the stereomicroscope. In case of formation of air bubbles, the microlens was discarded (yield of the molding procedure: ~ 90 %, N > 30 molded lenses). The coverslip with the attached corrective lens was sealed to a customized metal or plastic support ring of appropriate diameter (Fig. 2C). The support ring, the coverslip and the aspherical lens formed the upper part of the corrected microendoscope, to be subsequently coupled to the proper GRIN rod (Table 2) using a custom-built opto-mechanical stage and NOA63 (Fig. 2C) 7. The GRIN rod was positioned perpendicularly to the glass coverslip, on the other side of the coverslip compared to the corrective lens, and aligned to the aspherical lens perimeter (Fig. 2C) under the guidance of a wide field microscope equipped with a camera. The yield of the assembly procedure for the probes used in this work was 100 % (N = 27 endoscopes). For further details on the assembly of corrected microendoscope see(7)”.

      Reviewer #1 (Recommendations for the authors):

      (1) Page 4, what is meant by 'ad-hoc" in describing software control?

      With “ad-hoc” we meant “specifically designed”. We revised the text to make this clear.

      (2) It was hard to tell how the PSF was modeled for the simulations (especially on page 34, describing the two spherical shells of the astigmatic PSF and ellipsoids modeled along them). Images or especially videos that show the modeling would make this easier to follow.

      Simulated calcium t-series were generated following previous work by our group (Antonini et al., eLife 2020), as stated in the Methods on page 37 (line 5). In Figure 4A of Antonini et al. eLife 2020, we provided a schematic to visually describe the procedure of simulated data generation. In the present paper, we decided not to include a similar drawing and cite the eLife 2020 article to avoid redundancy.

      (3) Some math symbols are missing from the methods in my version of the text (page 36/37).

      We apologize for the inconvenience. This issue arose in the PDF conversion of our Word document and we did not spot it at the time of submission. We will now make sure the PDF version of our manuscript correctly reports symbols and equations.

      (4) The Z extent of stacks (i.e. number of steps) used to generate images in Figure 4 is missing.

      We thank the Reviewer for the comment and we now revised the caption of Figure 4 and the Methods section as follows:

      “Figure 4. Aberration correction in long GRIN lens-based microendoscopes enables highresolution imaging of biological structures over enlarged FOVs. A) jGCaMP7f-stained neurons in a fixed mouse brain slice were imaged using 2PLSM (λexc = 920 nm) through an uncorrected (left) and a corrected (right) microendoscope based on the 6.4 mm-long GRIN rod. Images are maximum fluorescence intensity (F) projections of a z-stack acquired with a 5 μm step size. Number of steps: 32 and 29 for uncorrected and corrected microendoscope, respectively. Scale bars: 50 μm. Left: the scale applies to the entire FOV. Right, the scale bar refers only to the center of the FOV; off-axis scale bar at any radial distance (x and y axes) is locally determined multiplying the length of the drawn scale bar on-axis by the corresponding normalized magnification factor shown in the horizontal color-coded bar placed below the image (see also Fig. 3, Supplementary Table 3, and Materials and Methods for more details). B) Same results for the microendoscope based on the 8.8 mm-long GRIN rod. Number of steps: 23 and 31 for uncorrected and corrected microendoscope, respectively”.

      We also modified the text in the Methods (page 35, lines 1-2):

      “(1024 pixels x 1024 pixels resolution; nominal pixel size: 0.45 µm/pixel; axial step: 5 µm; number of axial steps: 23-32; frame averaging = 8)”.

      (5) Overall, the text is wordy and a bit repetitive and could be cut down significantly in length without loss of clarity. This is true throughout, but especially when comparing the introduction and discussion.

      We edited the text (Discussion and Introduction), as suggested by the Reviewer.

      (6) Although I don't think it's necessary, I would advise including comparison data with an uncorrected endoscope in the same in vivo preparation.

      We thank the Referee for the suggestion. Below, we list the reasons why we decided not to perform the comparison between the uncorrected and corrected endoscopes in the in vivo preparation:

      (1) We believe that the comparison between uncorrected and corrected endoscopes is better performed in fixed tissue (Figure 4) or in simulated calcium data (Figure 5-6), rather than in vivo recordings (Figure 7). In fact, in the brain of living mice motion artifacts, changes in fluorophore expression level, variation in the optical properties of the brain (e.g., the presence of a blood vessel over the FOV) may make the comparison of images acquired with uncorrected and corrected microendoscopes difficult, requiring a large number of animals to cancel out the contributions of all these factors. Comparing optical properties in fixed tissue is, in contrast, devoid of these confounding factors.

      (2) A major advantage of quantifying how the optical properties of uncorrected and corrected endoscope impact on the ability to extract information about neuronal activity in simulated calcium data is that, under simulated conditions, we can count on a known ground truth as reference (e.g., how many neurons are in the FOV, where they are, and which is their electrical activity). This is clearly not possible under in vivo conditions.

      (3) The proposed experiment requires to perform imaging in the awake mouse with a corrected microendoscope, then anesthetize the animal to carefully remove the corrective microlens using forceps, and finally repeat the optical recordings in awake mice with the uncorrected microendoscope. Although this is feasible (we performed the proposed experiment in Antonini et al. eLife 2020 using a 4.1 mm-long microendoscope), the yield of success of these experiments is low. The low yield is due to the fact that the mechanical force applied on top of the microendoscope to remove the corrective microlens may induce movement of the GRIN lens inside the brain, both in vertical and horizontal directions. This can randomly result in change of the focal plane, death or damage of the cells, tissue inflammation, and bleeding. From our own experience, the number of animals used for this experiment is expected to be high.

      Reviewer #2 (Recommendations for the authors):

      Below, I provide a few minor corrections and suggestions for the authors to consider before final submission.

      (1) Page 5: when referring to Table 1 maybe add "Table 1 and Methods".

      Following the Reviewer’s comment, we revised the text at page 6 (lines 4-5 from bottom) as follows:

      “(see Supplementary Table 1 and Materials and Methods for details on simulation parameters)”.

      (2) Page 8: "We set a threshold of 10 µm on the axial resolution to define the radius of the effective FOV (corresponding to the black triangles in Fig. 3I, J) in uncorrected and corrected microendoscopes. We observed an enlargement of the effective FOV area of 4.7 times and 2.3 times for the 6.4 mm-long micro endoscope and the 8.8 mm-long micro endoscope, respectively (Table 1). These findings were in agreement with the results of the ray-trace simulations (Figure 1) and the measurement of the subresolved fluorescence layers (Figure 3AD)." I could not find the information given in this paragraph, specifically:

      a) Upon examining the black triangles in Figure 3I and J, the enlargement of the effective FOV does not appear to be 4.7 and 2.3 times.

      In Figure 3I, J, black triangles mark the intersections between the curves fitting the data and the threshold of 10 µm on the axial resolution. The values on the x-axis corresponding to the intersections (Table 1, “Effective FOV radius”) represent the estimated radius of the effective FOV of the probes, i.e. the radius within which the microendoscope has spatial resolution below the threshold of 10 μm. The ratios of the effective FOV radii are 2.17 and 1.53 for the 6.4 mm- and the 8.8 mm-long microendoscope, respectively, which correspond to 4.7 and 2.3 times larger FOV (Table 1). To make this point clearer, we modified the indicated sentence as follows (page 10, lines 3-11 from bottom):

      “We set a threshold of 10 µm on the axial resolution to define the radius of the effective FOV (corresponding to the black triangles in Fig. 3I, J) in uncorrected and corrected microendoscopes. We observed a relative increase of the effective FOV radius of 2.17 and 1.53 for the 6.4 mm- and the 8.8 mm-long microendoscope, respectively (Table 1). This corresponded to an enlargement of the effective FOV area of 4.7 times and 2.3 times for the 6.4 mm-long microendoscope and the 8.8

      mm-long microendoscope, respectively (Table 1). These findings were in agreement with the results of the ray-trace simulations (Figure 1) and the measurement of the subresolved fluorescence layers (Figure 3A-D)."

      b) I do not understand how the enlargements in Figure 3I and J align with the ray trace simulations in Figure 1, indicating an enlargement of 5.4 and 5.6.

      In Figure 1C, E of the first submission we showed the Strehl ratio of focal spots focalized after the microendoscope, in the object plane, as a function of radial distance from the optical axis of focal spots focalized in the focal plane at the back end of the GRIN rod (“Objective focal plane” in Figure 1A, B), before the light has traveled along the GRIN lens. After reading the Referee’s comment, we realized this choice does not facilitate the comparison between Figure 1 and Figure 3I, J. We therefore decided to modify Figure 1C, E by showing the Strehl ratio of focal spots focalized after the microendoscope as a function of their radial distance from the optical axis in the objet plane (where the Strehl ratio is computed), after the light has traveled through the GRIN lens (radial distances are still computed on a plane, not along the curved focal surface represented by the “imaging plane” in Figure 1 A, B). Computing radial distances in the object space, we found that the relative increase in the radius of the FOV due to the correction of aberrations was 3.50 and 3.35 for the 6.4 mm- and the 8.8 mm-long microendoscope, respectively. We also revised the manuscript text accordingly (page 7, lines 6-8):

      “The simulated increase in the radius of the diffraction-limited FOV was 3.50 times and 3.35 times for the 6.4 mm-long and 8.8 mm-long probe, respectively (Fig. 1C, E)”. We believe this change should facilitate the comparison of the data presented in Figure 1 and Figure 3.

      Moreover, in comparing results in Figure 1 and Figure 3, it is important to keep in mind that:

      (1) the definitions of the effective FOV radius were different in simulations (Figure 1) and real measurements (Figure 3). In simulations, we considered a theoretical criterion (Maréchal criterion) and set the lower threshold for a diffraction-limited FOV to a Strehl ratio value of 0.8. In real measures, the effective FOV radius obtained from fluorescent bead measurements was defined based on the empirical criterion of setting the upper threshold for the axial resolution to 10 µm.

      (2) the Zemax file of the GRIN lenses contained low-order aberrations and not high-order aberrations.

      (3) the small variability in some of the experimental parameters (e.g., the distance between the GRIN back end and the focusing objective) were not reflected in the simulations.

      Given the reasons listed above, it is expected that the prediction of the simulations do not perfectly match the experimental measurements and tend to predict larger improvements of aberration correction than the experimentally measured ones.

      c) Finally, how can the enlargement in Figure 3I be compared to the measurements of the sub-resolved fluorescence layers in Figures 3A-D? Could the authors please clarify these points?

      When comparing measurements of subresolved fluorescent films and beads it is important to keep in mind that the two measures have different purposes and spatial resolution. We used subresolved fluorescent films to visualize the shape and extent of the focal surface of microendoscopes in a continuous way along the radial dimension (in contrast to bead measurements that are quantized in space). This approach comes at the cost of spatial resolution, as we are using fluorescent layers, which are subresolved in the axial but not in the radial dimension. Therefore, fluorescent film profiles are not used in our study to extract relevant quantitative information about effective FOV enlargement or spatial resolution of corrected microendoscopes. In contrast, to quantitatively characterize axial and lateral resolutions we used measurements of 100 nm-diameter fluorescent beads (therefore subresolved in the x, y, and z dimensions) located at different radial distances from the center of the FOV, using a much smaller nominal pixel size compared to the fluorescent films (beads, lateral resolution: 0.049 µm/pixel, axial resolution: 0.5 µm/pixel; films, lateral resolution: 1.73 µm/pixel, axial resolution: 2 µm/pixel).

      (3) On page 15, the statement "significantly enlarge the FOV" should be more specific by providing the actual values for the increase. It would also be good to mention that this is not a xy lateral increase; rather, as one moves further from the center, more of the imaged cells belong to axially different planes.

      The values of the experimentally determined FOV enlargements (4.7 times and 2.3 times for 6.4 mm- and 8.8 mm-long microendoscope, respectively) are provided in Table 1 and are now referenced on page 10. Following the Referee’s request, we added the following sentence in the discussion (page 18, lines 10-14) to underline that the extended FOV samples on different axial positions because of the field curvature effect:

      “It must be considered, however, that the extended FOV achieved by our aberration correction method was characterized by a curved focal plane. Therefore, cells located in different radial positions within the image were located at different axial positions and cells at the border of the FOV were closer to the front end of the microendoscope”.

      (4) On page 36, most of the formulas appear to be corrupted. This may have occurred during the conversion to the merged PDF. Please verify this and check for similar problems in other equations throughout the text as well.

      We apologize for the inconvenience. This issue arose in the PDF conversion of our Word document and we did not spot it upon submission. We will now make sure the PDF version of our manuscript correctly reports symbols and equations.

      (5) In the discussion, the authors could potentially add comments on how the verified performance of the corrective lenses depends on the wavelength and mention the range within which the wavelength can be changed without the need to redesign a new corrective lens.

      Following this comments and those of other Reviewers, we explored the effect of changing wavelength on the Strehl ratio using new Zemax simulations. We found that the Strehl ratio remains > 0.8 within ± at least 10 nm from λ = 920 nm (new Supplementary Figure 1A-D, left panels), which covers the limited bandwidth of our femtosecond laser. Moreover, these simulations demonstrate that, on a much wider wavelength range (800 - 1040 nm), high Strehl ratio is obtained but at different z planes (new Supplementary Figure 1A-D, right panels). These new results are now described on page 7 (lines 8-10).

      (6) Also, they could discuss if and how the corrective lens could be integrated into fiberscopes for freely moving experiments.

      Following the Referee’s suggestion, we added a short text in the Discussion (page 21, lines 4-7 from bottom). It reads:

      “Another advantage of long corrected microendoscopes described here over adaptive optics approaches is the possibility to couple corrected microendoscopes with portable 2P microscopes(42-44), allowing high resolution functional imaging of deep brain circuits on an enlarged FOV during naturalistic behavior in freely moving mice”.

      (7) Finally, since the main advantage of this approach is its simplicity, the authors should also comment on or outline the steps to follow for potential users who are interested in using the corrective lenses in their systems.

      Thanks for this comment. The Materials and Methods section of this study and that of Antonini et al. eLife 2020 describe in details the experimental steps necessary to reproduce corrective lenses and apply them to their experimental configuration.

      Reviewer #3 (Recommendations for the authors):

      (1) Suggestions for improved or additional experiments, data, or analyses, and Recommendations for improving the writing and presentation:

      See Public Review.

      Please see our point-by-point response above.

      (2) Minor corrections on text and figures: a) Figure 6A: is the fraction of cells expressed in %?

      Author response: yes, that is correct. Thank you for spotting it. We added the “%” symbol to the y label.

      b) Figurer 8A, left: The second line is blue and not red dashed. In addition, it could be interesting to also show a line corresponding to the 0 value.

      Thank you for the suggestions. We modified Figure 8 according to the Referee’s comments.

      c) Some parts of equation (1) and some variables in the Material and Methods section are missing

      We apologize for the inconvenience. This issue arose in the PDF conversion of our Word document and we did not spot it upon submission. We will now make sure the PDF version of our manuscript correctly reports symbols and equations.

      d) In the methods, the authors mention a calibration ruler with ticks spaced every 10 µm along two orthogonal directions and refer to the following product: 4-dot calibration slide, Cat. No. 1101002300142, Motic, Hong Kong. However, this product does not seem to correspond to a calibration ruler.

      We double check. The catalog number 1101002300142 is correct and product details can be found at the following link:

      https://moticmicroscopes.com/products/calibration-slide-4-dots-1101002300142?srsltid=AfmBOorGYx9PcXtAlIMmSs_tEpxS4nX21qIcV8Kfn4qGwizQK3LYOQn3

    1. Author response:

      The following is the authors’ response to the original reviews.

      We thank the reviewers and editors for their careful read of our paper, and appreciate the thoughtful comments.

      Both reviewers agreed that our work had several major strengths: the large dataset collected in collaboration across ten labs, the streamlined processing pipelines, the release of code repositories, the multi-task neural network, and that we definitively determined that electrode placement is an important source of variability between datasets.

      However, a number of key potential improvements were noted: the reviewers felt that a more standard model-based characterization of single neuron responses would benefit our reproducibility analysis, that more detail was needed about the number of cells, sessions, and animals, and that more information was needed to allow users to deploy the RIGOR standards and to understand their relationship to other metrics in the field.

      We agree with these suggestions and have implemented many major updates in our revised manuscript. Some highlights include:

      (1)  A new regression analysis that specifies the response profile of each neuron, allowing a comparison of how similar these are across labs and areas (See Figure 7 in the new section, “Single neuron coefficients from a regression-based analysis are rep oducible across labs”);

      (2) A new decoding analysis (See Figure 9 in the section, “Decodability of task variables is consistent across labs, but varies by brain region”);

      (3) A new RIGOR notebook to ease useability;

      (4) A wealth of additional information about the cells, animals and sessions in each figure;

      (5) Many new additional figure panels in the main text and supplementary material to clarify the specific points raised by the reviewers.

      Again, we are grateful to the reviewers and editors for their helpful comments, which have significantly improved the work. We are hopeful that the many revisions we have implemented will be sufficient to change the “incomplete” designation that was originally assigned to the manuscript.

      Reviewer #1 (Public review):

      Summary:

      The authors explore a large-scale electrophysiological dataset collected in 10 labs while mice performed the same behavioral task, and aim to establish guidelines to aid reproducibility of results collected across labs. They introduce a series of metrics for quality control of electrophysiological data and show that histological verification of recording sites is important for interpreting findings across labs and should be reported in addition to planned coordinates. Furthermore, the authors suggest that although basic electrophysiology features were comparable across labs, task modulation of single neurons can be variable, particularly for some brain regions. The authors then use a multi-task neural network model to examine how neural dynamics relate to multiple interacting task- and experimenter-related variables, and find that lab-specific differences contribute little to the variance observed. Therefore, analysis approaches that account for correlated behavioral variables are important for establishing reproducible results when working with electrophysiological data from animals performing decision-making tasks. This paper is very well-motivated and needed. However, what is missing is a direct comparison of task modulation of neurons across labs using standard analysis practice in the fields, such as generalized linear model (GLM). This can potentially clarify how much behavioral variance contributes to the neural variance across labs; and more accurately estimate the scale of the issues of reproducibility in behavioral systems neuroscience, where conclusions often depend on these standard analysis methods.

      We fully agree that a comparison of task-modulation across labs is essential. To address this, we have performed two new analyses and added new corresponding figures to the main text (Figures 7 and 9). As the reviewer hoped, this analysis did indeed clarify how much behavioral variance contributes to the variance across labs. Critically, these analyses suggested that our results were more robust to reproducibility than the more traditional analyses would indicate.

      Additional details are provided below (See detailed response to R1P1b).

      Strengths:

      (1) This is a well-motivated paper that addresses the critical question of reproducibility in behavioural systems neuroscience. The authors should be commended for their efforts.

      (2) A key strength of this study comes from the large dataset collected in collaboration across ten labs. This allows the authors to assess lab-to-lab reproducibility of electrophysiological data in mice performing the same decision-making task.

      (3) The authors' attempt to streamline preprocessing pipelines and quality metrics is highly relevant in a field that is collecting increasingly large-scale datasets where automation of these steps is increasingly needed.

      (4) Another major strength is the release of code repositories to streamline preprocessing pipelines across labs collecting electrophysiological data.

      (5) Finally, the application of MTNN for characterizing functional modulation of neurons, although not yet widely used in systems neuroscience, seems to have several advantages over traditional methods.

      Thanks very much for noting these strengths of our work.

      Weaknesses:

      (1) In several places the assumptions about standard practices in the field, including preprocessing and analyses of electrophysiology data, seem to be inaccurately presented:

      a) The estimation of how much the histologically verified recording location differs from the intended recording location is valuable information. Importantly, this paper provides citable evidence for why that is important. However, histological verification of recording sites is standard practice in the field, even if not all studies report them. Although we appreciate the authors' effort to further motivate this practice, the current description in the paper may give readers outside the field a false impression of the level of rigor in the field.

      We agree that labs typically do perform histological verification. Still, our methods offer a substantial improvement over standard practice, and this was critical in allowing us to identify errors in targeting. For instance, we used new software, LASAGNA, which is an innovation over the traditional, more informal approach to localizing recording sites. Second, the requirement that two independent reviewers concur on each proposed location for a recording site is also an improvement over standard practice. Importantly, these reviewers use electrophysiological features to more precisely localize electrodes, when needed, which is an improvement over many labs. Finally, most labs use standard 2D atlases to identify recording location (a traditional approach); our use of a 3D atlas and a modern image registration pipeline has improved the accuracy of identifying the true placement of probes in 3D space.

      Importantly, we don’t necessarily advocate that all labs adopt our pipeline; indeed, this would be infeasible for many labs. Instead, our hope is that the variability in probe trajectory that we uncovered will be taken into account in future studies. Here are 3 example ways in which that could happen. First, groups hoping to target a small area for an experiment might elect to use a larger cohort than previously planned, knowing that some insertions will miss their target. Second, our observation that some targeting error arose because experimenters had to move probes due to blood vessels will impact future surgeries: when an experimenter realizes that a blood vessel is in the way, they might still re-position the probe, but they can also adjust its trajectory (e.g., changing the angle) knowing that even little nudges to avoid blood vessels can have a large impact on the resulting insertion trajectory. Third, our observation of a 7 degree deviation between stereotaxic coordinates and Allen Institute coordinates can be used for future trajectory planning steps to improve accuracy of placement. Uncovering this deviation required many insertions and our standardized pipeline, but now that it is known, it can be easily corrected without needing such a pipeline.

      We thank the reviewer for bringing up this issue and have added new text (and modified existing text) in the Discussion to highlight the innovations we introduced that allowed us to carefully quantify probe trajectory across labs (lines 500 - 515):

      “Our ability to detect targeting error benefited from an automated histological pipeline combined with alignment and tracing that required agreement between multiple users, an approach that greatly exceeds the histological analyses done by most individual labs. Our approach, which enables scalability and standardization across labs while minimizing subjective variability, revealed that much of the variance in targeting was due to the probe entry positions at the brain surface, which were randomly displaced across the dataset. … Detecting this offset relied on a large cohort size and an automated histological pipeline, but now that we have identified the offset, it can be easily accounted for by any lab. Specifically, probe angles must be carefully computed from the CCF, as the CCF and stereotaxic coordinate systems do not define the same coronal plane angle. Minimizing variance in probe targeting is another important element in increasing reproducibility, as slight deviations in probe entry position and angle can lead to samples from different populations of neurons. Collecting structural MRI data in advance of implantation could reduce targeting error, although this is infeasible for most labs. A more feasible solution is to rely on stereotaxic coordinates but account for the inevitable off-target measurements by increasing cohort sizes and adjusting probe angles when blood vessels obscure the desired location.”

      b) When identifying which and how neurons encode particular aspects of stimuli or behaviour in behaving animals (when variables are correlated by the nature of the animals behaviour), it has become the standard in behavioral systems neuroscience to use GLMs - indeed many labs participating in the IBL also has a long history of doing this (e.g., Steinmetz et al., 2019; Musall et al., 2023; Orsolic et al., 2021; Park et al., 2014). The reproducibility of results when using GLMs is never explicitly shown, but the supplementary figures to Figure 7 indicate that results may be reproducible across labs when using GLMs (as it has similar prediction performance to the MTNN). This should be introduced as the first analysis method used in a new dedicated figure (i.e., following Figure 3 and showing results of analyses similar to what was shown for the MTNN in Figure 7). This will help put into perspective the degree of reproducibility issues the field is facing when analyzing with appropriate and common methods. The authors can then go on to show how simpler approaches (currently in Figures 4 and 5) - not accounting for a lot of uncontrolled variabilities when working with behaving animals - may cause reproducibility issues.

      We fully agree with the reviewer's suggestion. We have addressed their concern by implementing a Reduced-Rank Regression (RRR) model, which builds upon and extends the principles of Generalized Linear Models (GLMs). The RRR model retains the core regression framework of GLMs while introducing shared, trainable temporal bases across neurons, enhancing the model’s capacity to capture the structure in neural activity (Posani, Wang, et al., bioRxiv, 2024). Importantly, Posani, Wang et al compared the predictive performance of GLMs vs the RRR model, and found that the RRR model provided (slightly) improved performance, so we chose the RRR approach here.

      We highlight this analysis in a new section (lines 350-377) titled, “Single neuron coefficients from a regression-based analysis are reproducible across labs”. This section includes an entirely new Figure (Fig. 7), where this new analysis felt most appropriate, since it is closer in spirit to the MTNN analysis that follows (rather than as a new Figure 3, as the reviewer suggested). As the reviewer hoped, this analysis provides some reassurance that including many variables when characterizing neural activity furnishes results with improved reproducibility. We now state this in the Results and the Discussion (line 456-457), highlighting that these analyses complement the more traditional selectivity analyses, and that using both methods together can be informative.

      When the authors introduce a neural network approach (i.e. MTNN) as an alternative to the analyses in Figures 4 and 5, they suggest: 'generalized linear models (GLMs) are likely too inflexible to capture the nonlinear contributions that many of these variables, including lab identity and spatial positions of neurons, might make to neural activity'). This is despite the comparison between MTNN and GLM prediction performance (Supplement 1 to Figure 7) showing that the MTNN is only slightly better at predicting neural activity compared to standard GLMs. The introduction of new models to capture neural variability is always welcome, but the conclusion that standard analyses in the field are not reproducible can be unfair unless directly compared to GLMs.

      In essence, it is really useful to demonstrate how different analysis methods and preprocessing approaches affect reproducibility. But the authors should highlight what is actually standard in the field, and then provide suggestions to improve from there.

      Thanks again for these comments. We have also edited the MTNN section slightly to accommodate the addition of the previous new RRR section (line 401-402).

      (2) The authors attempt to establish a series of new quality control metrics for the inclusion of recordings and single units. This is much needed, with the goal to standardize unit inclusion across labs that bypasses the manual process while keeping the nuances from manual curation. However, the authors should benchmark these metrics to other automated metrics and to manual curation, which is still a gold standard in the field. The authors did this for whole-session assessment but not for individual clusters. If the authors can find metrics that capture agreed-upon manual cluster labels, without the need for manual intervention, that would be extremely helpful for the field.

      We thank the reviewer for their insightful suggestions regarding benchmarking our quality control metrics against manual curation and other automated methods at the level of individual clusters. We are indeed, as the reviewer notes, publishing results from spike sorting outputs that have been automatically but not manually verified on a neuron-by-neuron basis. To get to the point where we trust these results to be of publishable quality, we manually reviewed hundreds of recordings and thousands of neurons, refining both the preprocessing pipeline and the single-unit quality metrics along the way. All clusters, both those passing QCs and those not passing QCs, are available to review with detailed plots and quantifications at https://viz.internationalbrainlab.org/app (turn on “show advanced metrics” in the upper right, and navigate to the plots furthest down the page, which are at the individual unit level). We would emphasize that these metrics are definitely imperfect (and fully-automated spike sorting remains a work in progress), but so is manual clustering. Our fully automated approach has the advantage of being fully reproducible, which is absolutely critical for the analyses in the present paper. Indeed, if we had actually done manual clustering or curation, one would wonder whether our results were actually reproducible independently. Nevertheless, it is not part of the present manuscript’s objectives to validate or defend these specific choices for automated metrics, which have been described in detail elsewhere (see our Spike Sorting whitepaper, https://figshare.com/articles/online_resource/Spike_sorting_pipeline_for_the_International_Brain_La boratory/19705522?file=49783080). It would be a valuable exercise to thoroughly compare these metrics against a careful, large, manually-curated set, but doing this properly would be a paper in itself and is beyond the scope of the current paper. We also acknowledge that our analyses studying reproducibility across labs could, in principle, result in more or less reproducibility under a different choice of metrics, which we now describe in the Discussion (line 469-470)”:

      “Another significant limitation of the analysis presented here is that we have not been able to assess the extent to which other choices of quality metrics and inclusion criteria might have led to greater or lesser reproducibility.”

      (3) With the goal of improving reproducibility and providing new guidelines for standard practice for data analysis, the authors should report of n of cells, sessions, and animals used in plots and analyses throughout the paper to aid both understanding of the variability in the plots - but also to set a good example.

      We wholeheartedly agree and have added the number of cells, mice and sessions for each figure. This information is included as new tabs in our quality control spreadsheet (https://docs.google.com/spreadsheets/d/1_bJLDG0HNLFx3SOb4GxLxL52H4R2uPRcpUlIw6n4 n-E/). This is referred to in line 158-159 (as well as its original location on line 554 in the section, “Quality control and data inclusion”).

      Other general comments:

      (1) In the discussion (line 383) the authors conclude: 'This is reassuring, but points to the need for large sample sizes of neurons to overcome the inherent variability of single neuron recording'. - Based on what is presented in this paper we would rather say that their results suggest that appropriate analytical choices are needed to ensure reproducibility, rather than large datasets - and they need to show whether using standard GLMs actually allows for reproducible results.

      Thanks. The new GLM-style RRR analysis in Figure 7, following the reviewer’s suggestion, does indeed indicate improved reproducibility across labs. As described above, we see this new analysis as complementary to more traditional analyses of neural selectivity and argue that the two can be used together. The new text (line 461) states:

      “This is reassuring, and points to the need for appropriate analytical choices to ensure reproducibility.”

      (2) A general assumption in the across-lab reproducibility questions in the paper relies on intralab variability vs across-lab variability. An alternative measure that may better reflect experimental noise is across-researcher variability, as well as the amount of experimenter experience (if the latter is a factor, it could suggest researchers may need more training before collecting data for publication). The authors state in the discussion that this is not possible. But maybe certain measures can be used to assess this (e.g. years of conducting surgeries/ephys recordings etc)?

      We agree that understanding experimenter-to-experimenter variability would be very interesting and indeed we had hoped to do this analysis for some time. The problem is that typically, each lab employed one trainee to conduct all the data collection. This prevents us from comparing outcomes from two different experimenters in the same lab. There are exceptions to this, such as the Churchland lab in which 3 personnel (two postdocs and a technician) collected the data. However, even this fortuitous situation did not lend itself well to assessing experimenter-to-experimenter variation: the Churchland lab moved from Cold Spring Harbor to UCLA during the data collection period, which might have caused variability that is totally independent of experimenter (e.g., different animal facilities). Further, once at UCLA, the postdoc and technician worked closely together- alternating roles in animal training, surgery and electrophysiology. We believe that the text in our current Discussion (line 465-468) accurately characterizes the situation:

      “Our experimental design precludes an analysis of whether the reproducibility we observed was driven by person-to-person standardization or lab-to-lab standardization. Most likely, both factors contributed: all lab personnel received standardized instructions for how to implant head bars and train animals, which likely reduced personnel-driven differences.”

      Quantifying the level of experience of each experimenter is an appealing idea and we share the reviewer’s curiosity about its impact on data quality. Unfortunately, quantifying experience is tricky. For instance, years of conducting surgeries is not an unambiguously determinable number. Would we count an experimenter who did surgery every day for a year as having the same experience as an experimenter who did surgery once/month for a year? Would we count a surgeon with expertise in other areas (e.g., windows for imaging) in the same way as surgeons with expertise in ephys-specific surgeries? Because of the ambiguities, we leave this analysis to be the subject of future work; this is now stated in the Discussion (line 476).

      (3) Figure 3b and c: Are these plots before or after the probe depth has been adjusted based on physiological features such as the LFP power? In other words, is the IBL electrophysiological alignment toolbox used here and is the reliability of location before using physiological criteria or after? Beyond clarification, showing both before and after would help the readers to understand how much the additional alignment based on electrophysiological features adjusts probe location. It would also be informative if they sorted these penetrations by which penetrations were closest to the planned trajectory after histological verification.

      The plots in Figure 3b and 3c reflect data after the probe depth has been adjusted based on electrophysiological features. This adjustment incorporates criteria such as LFP power and spiking activity to refine the trajectory and ensure precise alignment with anatomical landmarks. The trajectories have also been reviewed and confirmed by two independent reviewers. We have clarified this in line 180 and in the caption of Figure 3.

      To address this concern, we have added a new panel c in Figure 3 supplementary 1 (also shown below) that shows the LFP features along the probes prior to using the IBL alignment toolbox. We hope the reviewer agrees that a comparison of panels (a) and (c) below make clear the improvement afforded by our alignment tools.

      In Figure 3 and Figure 3 supplementary 1, as suggested, we have also now sorted the probes by those that were closest to the planned trajectory. This way of visualizing the data makes it clear that as the distance from the planned trajectory increases, the power spectral density in the hippocampal regions becomes less pronounced and the number of probes that have a large portion of the channels localized to VISa/am, LP and PO decreases. We have added text to the caption to describe this. We thank the reviewer for this suggestion and agree that it will help readers to understand how much the additional alignment (based on electrophysiological features) adjusts probe location.

      (4) In Figures 4 and 6: If the authors use a 0.05 threshold (alpha) and a cell simply has to be significant on 1/6 tests to be considered task modulated, that means that they have a false positive rate of ~30% (0.05*6=0.3). We ran a simple simulation looking for significant units (from random null distribution) from these criteria which shows that out of 100.000 units, 26500 units would come out significant (false error rate: 26.5%). That is very high (and unlikely to be accepted in most papers), and therefore not surprising that the fraction of task-modulated units across labs is highly variable. This high false error rate may also have implications for the investigation of the spatial position of task-modulated units (as effects of the spatial position may drown in falsely labelled 'task-modulated' cells).

      Thank you for this concern. The different tests were kept separate, so we did not consider a neuron modulated if it was significant in only one out of six tests, but instead we asked whether a neuron was modulated according to test one, whether it was modulated according to test two, etc., and performed further analyses separately for each test. Thus, we are only vulnerable to the ‘typical’ false positive rate of 0.05 for any given test. We made this clearer in the text (lines 232-236) and hope that the 5% false positive rate seems more acceptable.

      (5) The authors state from Figure 5b that the majority of cells could be well described by 2 PCs. The distribution of R2 across neurons is almost uniform, so depending on what R2 value one considers a 'good' description, that is the fraction of 'good' cells. Furthermore, movement onset has now been well-established to be affecting cells widely and in large fractions, so while this analysis may work for something with global influence - like movement - more sparsely encoded variables (as many are in the brain) may not be well approximated with this suggestion. The authors could expand this analysis into other epochs like activity around stimulus presentation, to better understand how this type of analysis reproduces across labs for features that have a less global influence.

      We thank the reviewer for the suggestion and fully agree that the window used in our original analysis would tend to favor movement-driven neurons. To address this, we repeated the analysis, this time using a window centered around stimulus onset (from -0.5 s prior to stimulus onset until 0.1 s after stimulus onset). As the reviewer suspected, far fewer neurons were active in this window and consequently far fewer were modelled well by the first two PCs, as shown in Author response image 1b (below). Similar to our original analysis using the post-movement window, we found mixed results for the stimulus-centered window across labs. Interestingly, regional differences were weaker in this new analysis compared to the original analysis of the post-movement window. We have added a sentence to the results describing this. Because the results are similar to the post-movement window main figure, we would prefer to restrict the new analysis only to this point-by-point response, in the hopes of streamlining the paper.

      Author response image 1.

      PCA analysis applied to a stimulus-aligned window ([-0.5, 0.1] sec relative to stim onset). Figure conventions as in main text Fig 5. Results are comparable to the post-movement window analysis, however regional differences are weaker here, possibly because fewer cells were active in the pre-movement window. We added panel j here and in the main figure, showing cell-number-controlled results. I.e. for each test, the minimum neuron number of the compared classes was sampled from all classes (say labs in a region), this sampling was repeated 1000 times and p-values combined via Fisher’s method, overall resulting in much fewer significant differences across laboratories and, independently, regions.

      (6) Additionally, in Figure 5i: could the finding that one can only distinguish labs when taking cells from all regions, simply be a result of a different number of cells recorded in each region for each lab? It makes more sense to focus on the lab/area pairing as the authors also do, but not to make their main conclusion from it. If the authors wish to do the comparison across regions, they will need to correct for the number of cells recorded in each region for each lab. In general, it was a struggle to fully understand the purpose of Figure 5. While population analysis and dimensionality reduction are commonplace, this seems to be a very unusual use of it.

      We agree that controlling for varying cell numbers is a valuable addition to this analysis. We added panel j in Fig. 5 showing cell-number-controlled test results of panel i. I.e. for a given statistical comparison, we sample the lowest number of cells of compared classes from the others, do the test, and repeat this sampling 1000 times, before combining the p-values using Fisher’s method. This cell-number controlled version of the tests resulted in clearly fewer significant differences across distributions - seen similarly for the pre-movement window shown in j in Author response image 1. We hope this clarified our aim to illustrate that low-dimensional embedding of cells’ trial-averaged activity can show how regional differences compare with laboratory differences.

      As a complementary statistical analysis to the shown KS tests, we fitted a linear-mixed-effects model (statsmodels.formula.api mixedlm), to the first and second PC for both activity windows (“Move”: [-0.5,1] first movement aligned; “Stim”: [-0.5,0.1] stimulus onset aligned), independently. Author response image 2 (in this rebuttal only) is broadly in line with the KS results, showing more regional than lab influences on the distributions of first PCs for the post-movement window.

      Author response image 2:

      Linear mixed effects model results for two PCs and two activity windows. For the post-movement window (“Move”), regional influences are significant (red color in plots) for all but one region while only one lab has a significant model coefficient for PC1. For PC2 more labs and three regions have significant coefficients. For the pre-movement window (“Stim”) one region for PC1 or PC2 has significant coefficients. The variance due to session id was smaller than all other effects (“eids Var”). “Intercept” shows the expected value of the response variable (PC1, PC2) before accounting for any fixed or random effects. All p-values were grouped as one hypothesis family and corrected for multiple comparisons via Benjamini-Hochberg.

      (7) In the discussion the authors state: " Indeed this approach is a more effective and streamlined way of doing it, but it is questionable whether it 'exceeds' what is done in many labs.

      Classically, scientists trace each probe manually with light microscopy and designate each area based on anatomical landmarks identified with nissl or dapi stains together with gross landmarks. When not automated with 2-PI serial tomography and anatomically aligned to a standard atlas, this is a less effective process, but it is not clear that it is less precise, especially in studies before neuropixels where active electrodes were located in a much smaller area. While more effective, transforming into a common atlas does make additional assumptions about warping the brain into the standard atlas - especially in cases where the brain has been damaged/lesioned. Readers can appreciate the effectiveness and streamlining provided by these new tools without the need to invalidate previous approaches.

      We thank the reviewer for highlighting the effectiveness of manual tracing methods used traditionally. Our intention in the statement was not to invalidate the precision or value of these classical methods but rather to emphasize the scalability and streamlining offered by our pipeline. We have revised the language to more accurately reflect this (line 500-504):

      “Our ability to detect targeting error benefited from an automated histological pipeline combined with alignment and tracing that required agreement between multiple users, an approach that greatly exceeds the histological analyses done by most individual labs. Our approach, which enables scalability and standardization across labs while minimizing subjective variability, revealed that much of the variance in targeting was due to the probe entry positions at the brain surface, which were randomly displaced across the dataset.”

      (8) What about across-lab population-level representation of task variables, such as in the coding direction for stimulus or choice? Is the general decodability of task variables from the population comparable across labs?

      Excellent question, thanks! We have added the new section “Decodability of task variables is consistent across labs, but varies by brain region” (line 423-448) and Figure 9 in the revised manuscript to address this question. In short, yes, the general decodability of task variables from the population is comparable across labs, providing additional reassurance of reproducibility.

      Reviewer #2 (Public review):

      Summary:

      The authors sought to evaluate whether observations made in separate individual laboratories are reproducible when they use standardized procedures and quality control measures. This is a key question for the field. If ten systems neuroscience labs try very hard to do the exact same experiment and analyses, do they get the same core results? If the answer is no, this is very bad news for everyone else! Fortunately, they were able to reproduce most of their experimental findings across all labs. Despite attempting to target the same brain areas in each recording, variability in electrode targeting was a source of some differences between datasets.

      Major Comments:

      The paper had two principal goals:

      (1) to assess reproducibility between labs on a carefully coordinated experiment

      (2) distill the knowledge learned into a set of standards that can be applied across the field.

      The manuscript made progress towards both of these goals but leaves room for improvement.

      (1) The first goal of the study was to perform exactly the same experiment and analyses across 10 different labs and see if you got the same results. The rationale for doing this was to test how reproducible large-scale rodent systems neuroscience experiments really are. In this, the study did a great job showing that when a consortium of labs went to great lengths to do everything the same, even decoding algorithms could not discern laboratory identity was not clearly from looking at the raw data. However, the amount of coordination between the labs was so great that these findings are hard to generalize to the situation where similar (or conflicting!) results are generated by two labs working independently.

      Importantly, the study found that electrode placement (and thus likely also errors inherent to the electrode placement reconstruction pipeline) was a key source of variability between datasets. To remedy this, they implemented a very sophisticated electrode reconstruction pipeline (involving two-photon tomography and multiple blinded data validators) in just one lab-and all brains were sliced and reconstructed in this one location. This is a fantastic approach for ensuring similar results within the IBL collaboration, but makes it unclear how much variance would have been observed if each lab had attempted to reconstruct their probe trajectories themselves using a mix of histology techniques from conventional brain slicing, to light sheet microscopy, to MRI imaging.

      This approach also raises a few questions. The use of standard procedures, pipelines, etc. is a great goal, but most labs are trying to do something unique with their setup. Bigger picture, shouldn't highly "significant" biological findings akin to the discovery of place cells or grid cells, be so clear and robust that they can be identified with different recording modalities and analysis pipelines?

      We agree, and hope that this work may help readers understand what effect sizes may be considered “clear and robust” from datasets like these. We certainly support the reviewer’s point that multiple approaches and modalities can help to confirm any biological findings, but we would contend that a clear understanding of the capabilities and limitations of each approach is valuable, and we hope that our paper helps to achieve this.

      Related to this, how many labs outside of the IBL collaboration have implemented the IBL pipeline for their own purposes? In what aspects do these other labs find it challenging to reproduce the approaches presented in the paper? If labs were supposed to perform this same experiment, but without coordinating directly, how much more variance between labs would have been seen? Obviously investigating these topics is beyond the scope of this paper. The current manuscript is well-written and clear as is, and I think it is a valuable contribution to the field. However, some additional discussion of these issues would be helpful.

      We thank the reviewer for raising this important issue. We know of at least 13 labs that have implemented the behavioral task software and hardware that we published in eLife in 2021, and we expect that over the next several years labs will also implement these analysis pipelines (note that it is considerably cheaper and faster to implement software pipelines than hardware). In particular, a major goal of the staff in the coming years is to continue and improve the support for pipeline deployment and use. However, our goal in this work, which we have aimed to state more clearly in the revised manuscript, was not so much to advocate that others adopt our pipeline, but instead to use our standardized approach as a means of assessing reproducibility under the best of circumstances (see lines 48-52): “A high level of reproducibility of results across laboratories when procedures are carefully matched is a prerequisite to reproducibility in the more common scenario in which two investigators approach the same high-level question with slightly different experimental protocols.”

      Further, a number of our findings are relevant to other labs regardless of whether they implement our exact pipeline, a modified version of our pipeline, or something else entirely. For example, we found probe targeting to be a large source of variability. Our ability to detect targeting error benefited from an automated histological pipeline combined with alignment and tracing that required agreement between multiple users, but now that we have identified the offset, it can be easily accounted for by any lab. Specifically, probe angles must be carefully computed from the CCF, as the CCF and stereotaxic coordinate systems do not define the same coronal plane angle. Relatedly, we found that slight deviations in probe entry position can lead to samples from different populations of neurons. Although this took large cohort sizes to discover, knowledge of this discovery means that future experiments can plan for larger cohort sizes to allow for off-target trajectories, and can re-compute probe angle when the presence of blood vessels necessitates moving probes slightly. These points are now highlighted in the Discussion (lines 500-515).

      Second, the proportion of responsive neurons (a quantity often used to determine that a particular area subserves a particular function), sometimes failed to reproduce across labs. For example, for movement-driven activity in PO, UCLA reported an average change of 0 spikes/s, while CCU reported a large and consistent change (Figure 4d, right most panel, compare orange vs. yellow traces). This argues that neuron-to-neuron variability means that comparisons across labs require large cohort sizes. A small number of outlier neurons in a session can heavily bias responses. We anticipate that this problem will be remedied as tools for large scale neural recordings become more widely used. Indeed, the use of 4-shank instead of single-shank Neuropixels (as we used here) would have greatly enhanced the number of PO neurons we measured in each session. We have added new text to Results explaining this (lines 264-268):

      “We anticipate that the feasibility of even larger scale recordings will make lab-to-lab comparisons easier in future experiments; multi-shank probes could be especially beneficial for cortical recordings, which tend to be the most vulnerable to low cell counts since the cortex is thin and is the most superficial structure in the brain and thus the most vulnerable to damage. Analyses that characterize responses to multiple parameters are another possible solution (See Figure 7).”

      (2) The second goal of the study was to present a set of data curation standards (RIGOR) that could be applied widely across the field. This is a great idea, but its implementation needs to be improved if adoption outside of the IBL is to be expected. Here are three issues:

      (a) The GitHub repo for this project (https://github.com/int-brain-lab/paper-reproducible-ephys/) is nicely documented if the reader's goal is to reproduce the figures in the manuscript. Consequently, the code for producing the RIGOR statistics seems mostly designed for re-computing statistics on the existing IBL-formatted datasets. There doesn't appear to be any clear documentation about how to run it on arbitrary outputs from a spike sorter (i.e. the inputs to Phy).

      We agree that clear documentation is key for others to adopt our standards. To address this, we have added a section at the end of the README of the repository that links to a jupyter notebook (https://github.com/int-brain-lab/paper-reproducible-ephys/blob/master/RIGOR_script.ipynb) that runs the RIGOR metrics on a user’s own spike sorted dataset. The notebook also contains a tutorial that walks through how to visually assess the quality of the raw and spike sorted data, and computes the noise level metrics on the raw data as well as the single cell metrics on the spike sorted data.

      (b) Other sets of spike sorting metrics that are more easily computed for labs that are not using the IBL pipeline already exist (e.g. "quality_metrics" from the Allen Institute ecephys pipeline [https://github.com/AllenInstitute/ecephys_spike_sorting/blob/main/ecephys_spike_sorting/m odules/quality_metrics/README.md] and the similar module in the Spike Interface package [https://spikeinterface.readthedocs.io/en/latest/modules/qualitymetrics.html]). The manuscript does not compare these approaches to those proposed here, but some of the same statistics already exist (amplitude cutoff, median spike amplitude, refractory period violation).

      There is a long history of researchers providing analysis algorithms and code for spike sorting quality metrics, and we agree that the Allen Institute’s ecephys code and the Spike Interface package are the current options most widely used (but see also, for example, Fabre et al. https://github.com/Julie-Fabre/bombcell). Our primary goal in the present work is not to advocate for a particular implementation of any quality metrics (or any spike sorting algorithm, for that matter), but instead to assess reproducibility of results, given one specific choice of spike sorting algorithm and quality metrics. That is why, in our comparison of yield across datasets (Fig 1F), we downloaded the raw data from those comparison datasets and re-ran them under our single fixed pipeline, to establish a fair standard of comparison. A full comparison of the analyses presented here under different choices of quality metrics and spike sorting algorithms would undoubtedly be interesting and useful for the field - however, we consider it to be beyond the scope of the present work. It is therefore an important assumption of our work that the result would not differ materially under a different choice of sorting algorithm and quality metrics. We have added text to the Discussion to clarify this limitation:

      “Another significant limitation of the analysis presented here is that we have not been able to assess the extent to which other choices of quality metrics and inclusion criteria might have led to greater or lesser reproducibility.”

      That said, we still intend for external users to be able to easily run our pipelines and quality metrics.

      (c) Some of the RIGOR criteria are qualitative and must be visually assessed manually. Conceptually, these features make sense to include as metrics to examine, but would ideally be applied in a standardized way across the field. The manuscript doesn't appear to contain a detailed protocol for how to assess these features. A procedure for how to apply these criteria for curating non-IBL data (or for implementing an automated classifier) would be helpful.

      We agree. To address this, we have provided a notebook that runs the RIGOR metrics on a user’s own dataset, and contains a tutorial on how to interpret the resulting plots and metrics (https://github.com/int-brain-lab/paper-reproducible-ephys/blob/master/RIGOR_script.ipynb).

      Within this notebook there is a section focused on visually assessing the quality of both the raw data and the spike sorted data. The code in this section can be used to generate plots, such as raw data snippets or the raster map of the spiking activity, which are typically used to visually assess the quality of the data. In Figure 1 Supplement 2 we have provided examples of such plots that show different types of artifactual activity that should be inspected.

      Other Comments:

      (1) How did the authors select the metrics they would use to evaluate reproducibility? Was this selection made before doing the study?

      Our metrics were selected on the basis of our experience and expertise with extracellular electrophysiology. For example: some of us previously published on epileptiform activity and its characteristics in some mice (Steinmetz et al. 2017), so we included detection of that type of artifact here; and, some of us previously published detailed investigations of instability in extracellular electrophysiological recordings and methods for correcting them (Steinmetz et al. 2021, Windolf et al. 2024), so we included assessment of that property here. These metrics therefore represent our best expert knowledge about the kinds of quality issues that can affect this type of dataset, but it is certainly possible that future investigators will discover and characterize other quality issues.

      The selection of metrics was primarily performed before the study (we used these assessments internally before embarking on the extensive quantifications reported here), and in cases where we refined them further during the course of preparing this work, it was done without reference to statistical results on reproducibility but instead on the basis of manual inspection of data quality and metric performance.

      (2) Was reproducibility within-lab dependent on experimenter identity?

      We thank the reviewer for this question. We have addressed it in our response to R1 General comment 2, as follows:

      We agree that understanding experimenter-to-experimenter variability would be very interesting and indeed we had hoped to do this analysis for some time. The problem is that typically, each lab employed one trainee to conduct all the data collection. This prevents us from comparing outcomes from two different experimenters in the same lab. There are exceptions to this, such as the Churchland lab in which 3 personnel (two postdocs and a technician) collected the data. However, even this fortuitous situation did not lend itself well to assessing experimenter-to-experimenter variation: the Churchland lab moved from Cold Spring Harbor to UCLA during the data collection period, which might have caused variability that is totally independent of experimenter (e.g., different animal facilities). Further, once at UCLA, the postdoc and technician worked closely together- alternating roles in animal training, surgery and electrophysiology. We believe that the text in our current Discussion (line 465-468) accurately characterizes the situation:

      “Our experimental design precludes an analysis of whether the reproducibility we observed was driven by person-to-person standardization or lab-to-lab standardization. Most likely, both factors contributed: all lab personnel received standardized instructions for how to implant head bars and train animals, which likely reduced personnel-driven differences.”

      Quantifying the level of experience of each experimenter is an appealing idea and we share the reviewer’s curiosity about its impact on data quality. Unfortunately, quantifying experience is tricky. For instance, years of conducting surgeries is not an unambiguously determinable number. Would we count an experimenter who did surgery every day for a year as having the same experience as an experimenter who did surgery once/month for a year? Would we count a surgeon with expertise in other areas (e.g., windows for imaging) in the same way as surgeons with expertise in ephys-specific surgeries? Because of the ambiguities, we leave this analysis to be the subject of future work; this is now stated in the Discussion (line 476).

      (3) They note that UCLA and UW datasets tended to miss deeper brain region targets (lines 185-188) - they do not speculate why these labs show systematic differences. Were they not following standardized procedures?

      Thank you for raising this point. All researchers across labs were indeed following standardised procedures. We note that our statistical analysis of probe targeting coordinates and angles did not reveal a significant effect of lab identity on targeting error, even though we noted the large number of mis-targeted recordings in UCLA and UW to help draw attention to the appropriate feature in the figure. Given that these differences were not statistically significant, we can see how it was misleading to call out these two labs specifically. While the overall probe placement surface error and angle error both show no such systematic difference, the magnitude of surface error showed a non-significant tendency to be higher for samples in UCLA & UW, which, compounded with the direction of probe angle error, caused these probe insertions to land in a final location outside LP & PO.

      This shows how subtle differences in probe placement & angle accuracy can lead to compounded inaccuracies at the probe tip, especially when targeting deep brain regions, even when following standard procedures. We believe this is driven partly by the accuracy limit or resolution of the stereotaxic system, along with slight deviations in probe angle, occurring during the setup of the stereotaxic coordinate system during these recordings.

      We have updated the relevant text in lines 187-190 as follows, to clarify:

      “Several trajectories missed their targets in deeper brain regions (LP, PO), as indicated by gray blocks, despite the lack of significant lab-dependent effects in targeting as reported above. These off-target trajectories tended to have both a large displacement from the target insertion coordinates and a probe angle that unfavorably drew the insertions away from thalamic nuclei (Figure 2f).”

      (4) The authors suggest that geometrical variance (difference between planned and final identified probe position acquired from reconstructed histology) in probe placement at the brain surface is driven by inaccuracies in defining the stereotaxic coordinate system, including discrepancies between skull landmarks and the underlying brain structures. In this case, the use of skull landmarks (e.g. bregma) to determine locations of brain structures might be unreliable and provide an error of ~360 microns. While it is known that there is indeed variance in the position between skull landmarks and brain areas in different animals, the quantification of this error is a useful value for the field.

      We thank the reviewer for their thoughtful comment and are glad that they found the quantification of variance useful for the field.

      (5) Why are the thalamic recording results particularly hard to reproduce? Does the anatomy of the thalamus simply make it more sensitive to small errors in probe positioning relative to the other recorded areas?

      We thank the reviewer for raising this interesting question. We believe that they are referring to Figure 4: indeed when we analyzed the distribution of firing rate modulations, we saw some failures of reproducibility in area PO (bottom panel, Figure 4h). However, the thalamic nuclei were not, in other analyses, more vulnerable to failures in reproducibility. For example, in the top panel of Figure 4h, VisAM shows failures of reproducibility for modulation by the visual stimulus. In Fig. 5i, area CA1 showed a failure of reproducibility. We fear that the figure legend title in the previous version (which referred to the thalamus specifically) was misleading, and we have revised this. The new title is, “Neural activity is modulated during decision-making in five neural structures and is variable between laboratories.” This new text more accurately reflects that there were a number of small, idiosyncratic failures of reproducibility, but that these were not restricted to a specific structure. The new analysis requested by R1 (now in Figure 7) provides further reassurance of overall reproducibility, including in the thalamus (see Fig. 7a, right panels; lab identity could not be decoded from single neuron metrics, even in the thalamus).

      Reviewer #1 (Recommendations for the authors):

      (1) Figure font sizes and formatting are variable across panels and figures. Please streamline the presentation of results.

      Thank you for your feedback. We have remade all figures with the same standardized font sizes and formatting.

      (2) Please correct the noncontinuous color scales in Figures 3b and 3d.

      Thank you for pointing this out, we fixed the color bar.

      (3) In Figures 5d and g, the error bars are described as: 'Error bands are standard deviation across cells normalised by the square root of the number of sessions in the region'. How does one interpret this error? It seems to be related to the standard error of the mean (std/sqrt(n)) but instead of using the n from which the standard deviation is calculated (in this case across cells), the authors use the number of sessions as n. If they took the standard deviation across sessions this would be the sem across sessions, and interpretable (as sem*1.96 is the 95% parametric confidence interval of the mean). Please justify why these error bands are used here and how they can be interpreted - it also seems like it is the only time these types of error bands are used.

      We agree and for clarity use standard error across cells now, as the error bars do not change dramatically either way.

      (4) It is difficult to understand what is plotted in Figures 5e,h, please unpack this further and clarify.

      Thank you for pointing this out. We have added additional explanation in the figure caption (See caption for Figure 5c) to explain the KS test.

      (5) In lines 198-201 the authors state that they were worried that Bonferroni correction with 5 criteria would be too lenient, and therefore used 0.01 as alpha. I am unsure whether the authors mean that they are correcting for multiple comparisons across features or areas. Either way, 0.01 alpha is exactly what a Bonferroni corrected alpha would be when correcting for either 5 features or 5 areas: 0.05/5=0.01. Or do they mean they apply the Bonferroni correction to the new 0.01 alpha: i.e., 0.01/5=0.002? Please clarify.

      Thank you, that was indeed written confusingly. We considered all tests and regions as whole, so 7 tests * 5 regions = 35 tests, which would result in a very strong Bonferroni correction. Indeed, if one considers the different tests individually, the correction we apply from 0.05 to 0.01 can be considered as correcting for the number of regions, which we now highlight better. We apply no further corrections of any kind to our alpha=0.01. We clarified this in the manuscript in all relevant places (lines 205-208, 246, 297-298, and 726-727).

      (6) Did the authors take into account how many times a probe was used/how clean the probe was before each recording. Was this streamlined between labs? This can have an effect on yield and quality of recording.

      We appreciate the reviewer highlighting the potential impact of probe use and cleanliness on recording quality and yield. While we did not track the number of times each probe was used, we ensured that all probes were cleaned thoroughly after each use using a standardized cleaning protocol (Section 16: Cleaning the electrode after data acquisition in Appendix 2: IBL protocol for electrophysiology recording using Neuropixels probe). We acknowledge that tracking the specific usage history of each probe could provide additional insights, but unfortunately we did not track this information for this project. In prior work the re-usability of probes has been quantified, showing insignificant degradation with use (e.g. Extended Data Fig 7d from Jun et al. 2017).

      (7) Figure 3, Supplement1: DY_013 missed DG entirely? Was this included in the analysis?

      Thank you for this question. We believe the reviewer is referring to the lack of a prominent high-amplitude LFP band in this mouse, and lack of high-quality sorted units in that region. Despite this, our histology did localize the recording trajectory to DG. This recording did pass our quality control criteria overall, as indicated by the green label, and was used in relevant analyses.

      The lack of normal LFP features and neuron yield might reflect the range of biological variability (several other sessions also have relatively weak DG LFP and yield, though DY_013 is the weakest), or could reflect some damage to the tissue, for example as caused by local bleeding. Because we could not conclusively identify the source of this observation, we did not exclude it.

      (8) Given that the authors argue for using the MTNN over GLMs, it would be useful to know exactly how much better the MTNN is at predicting activity in the held-out dataset (shown in Figure 7, Supplement 1). It looks like a very small increase in prediction performance between MTNN and GLMs, is it significantly different?

      The average variance explained on the held-out dataset, as shown in Figure 8–Figure Supplement 1 Panel B, is 0.065 for the GLMs and 0.071 for the MTNN. As the reviewer correctly noted, this difference is not significant. However, one of the key advantages of the MTNN over GLMs lies in its flexibility to easily incorporate covariates, such as electrophysiological characteristics or session/lab IDs, directly into the analysis. This feature is particularly valuable for assessing effect sizes and understanding the contributions of various factors.

      (9) In line 723: why is the threshold for mean firing rate for a unit to be included in the MTNN results so high (>5Hz), and how does it perform on units with lower firing rates?      

      We thank the reviewer for pointing this out. The threshold for including units with a mean firing rate above 5 Hz was set because most units with firing rates below this threshold were silent in many trials, and reducing the number of units helped keep the MTNN training time reasonable. Based on this comment, we ran the MTNN experiments including all units with firing rates above 1 Hz, and the results remained consistent with our previous conclusions (Figure 8). Crucially, the leave-one-out analysis consistently showed that lab and session IDs had effect sizes close to zero, indicating that both within-lab and between-lab random effects are small and comparable.

      Reviewer #2 (Recommendations for the authors):

      (1) Most of the more major issues were already listed in the above comments. The strongest recommendation for additional work would be to improve the description and implementation of the RIGOR statistics such that non-IBL labs that might use Neuropixels probes but not use the entire IBL pipeline might be able to apply the RIGOR framework to their own data.

      We thank the reviewer for highlighting the importance of making the RIGOR statistics more accessible to a broader audience. We agree that improving the description and implementation of the RIGOR framework is essential for facilitation of non-IBL labs using Neuropixels probes. To address this we created a jupyter notebook with step-by-step guidance that is not dependent on the IBL pipeline. This tool (https://github.com/int-brain-lab/paper-reproducible-ephys/blob/develop/RIGOR_script.ipynb) is publicly available through the repository, accompanied by example datasets and usage tutorials.

      (2) Table 1: How are qualitative features like "drift" defined? Some quantitative statistics like "presence ratio" (the fraction of the dataset where spikes are present) already exist in packages like ecephys_spike_sorting. Who measured these qualitative features? What are the best practices for doing these qualitative analyses?

      At the probe level, we compute the estimate of the relative motion of the electrodes to the brain tissue at multiple depths along the electrode. We overlay the drift estimation over a raster plot to detect sharp displacements as a function of time. Quantitatively, the drift is the cumulative absolute electrode motion estimated during spike sorting (µm). We clarified the corresponding text in Table 1.

      The qualitative assessments were carried out by IBL staff and experimentalists. We have now provided code to run the RIGOR metrics along with an embedded tutorial, to complement the supplemental figures we have shown about qualitative metric interpretation.

      (3) Table 1: What are the units for the LFP derivative?

      We thank the reviewer for noting that the unit was missing. The unit (decibel per unit of space) is now in the table.

      (4) Table 1: For "amplitude cutoff", the table says that "each neuron must pass a metric". What is the metric?

      We have revised the table to include this information. This metric was designed to detect potential issues in amplitude distributions caused by thresholding during deconvolution, which could result in missed spikes. There are quantitative thresholds on the distribution of the low tail of the amplitude histogram relative to the high tail, and on the relative magnitude of the bins in the low tail. We now reference the methods text from the table, which includes a more extended description and gives the specific threshold numbers. Also, the metric and thresholds are more easily understood with graphical assistance; see the IBL Spike Sorting Whitepaper for this (Fig. 17 in that document and nearby text; https://doi.org/10.6084/m9.figshare.19705522.v4). This reference is now also cited in the text.

      (5) Figure 2: In panel A, the brain images look corrupted.

      Thanks; in the revised version we have changed the filetype to improve the quality of the panel image.

      (6) Figure 7: In panel D, make R2 into R^2 (with a superscript)

      Panel D y-axis label has been revised to include superscript (note that this figure is now Figure 8).

      Works Cited

      Julie M.J. Fabre, Enny H. van Beest, Andrew J. Peters, Matteo Carandini, and Kenneth D. Harris. Bombcell: automated curation and cell classification of spike-sorted electrophysiology data, July 2023. URL https://doi.org/10.5281/zenodo.8172822.

      James J. Jun, Nicholas A. Steinmetz, Joshua H. Siegle, Daniel J. Denman, Marius Bauza, Brian Barbarits, Albert K. Lee, Costas A. Anastassiou, Alexandru Andrei, C¸ a˘gatayAydın, Mladen Barbic, Timothy J. Blanche, Vincent Bonin, Jo˜ao Couto, Barundeb Dutta, Sergey L. Gratiy, Diego A. Gutnisky, Michael H¨ausser, Bill Karsh, Peter Ledochowitsch, Carolina Mora Lopez, Catalin Mitelut, Silke Musa, Michael Okun, Marius Pachitariu, Jan Putzeys, P. Dylan Rich, Cyrille Rossant, Wei-lung Sun, Karel Svoboda, Matteo Carandini, Kenneth D. Harris, Christof Koch, John O’Keefe, and Timothy D.Harris. Fully integrated silicon probes for high-density recording of neural activity.Nature, 551(7679):232–236, Nov 2017. ISSN 1476-4687. doi: 10.1038/nature24636. URL https://doi.org/10.1038/nature24636.

      Simon Musall, Xiaonan R. Sun, Hemanth Mohan, Xu An, Steven Gluf, Shu-Jing Li, Rhonda Drewes, Emma Cravo, Irene Lenzi, Chaoqun Yin, Bj¨orn M. Kampa, and Anne K. Churchland. Pyramidal cell types drive functionally distinct cortical activity patterns during decision-making. Nature Neuroscience, 26(3):495– 505, Mar 2023. ISSN 1546-1726. doi: 10.1038/s41593-022-01245-9. URL https://doi.org/10.1038/s41593-022-01245-9.

      Ivana Orsolic, Maxime Rio, Thomas D Mrsic-Flogel, and Petr Znamenskiy. Mesoscale cortical dynamics reflect the interaction of sensory evidence and temporal expectation during perceptual decision-making. Neuron, 109(11):1861–1875.e10, April 2021. Hyeong-Dong Park, St´ephanie Correia, Antoine Ducorps, and Catherine Tallon-Baudry.Spontaneous fluctuations in neural responses to heartbeats predict visual detection.Nature Neuroscience, 17(4):612–618, Apr 2014. ISSN 1546-1726. doi: 10.1038/nn.3671. URL https://doi.org/10.1038/nn.3671.

      Lorenzo Posani, Shuqi Wang, Samuel Muscinelli, Liam Paninski, and Stefano Fusi. Rarely categorical, always high-dimensional: how the neural code changes along the cortical hierarchy. bioRxiv, 2024. doi: 10.1101/2024.11.15.623878. URL https://www.biorxiv.org/content/early/2024/12/09/2024.11.15.623878.

      Nicholas A. Steinmetz, Christina Buetfering, Jerome Lecoq, Christian R. Lee, Andrew J. Peters, Elina A. K. Jacobs, Philip Coen, Douglas R. Ollerenshaw, Matthew T. Valley, Saskia E. J. de Vries, Marina Garrett, Jun Zhuang, Peter A. Groblewski, Sahar Manavi, Jesse Miles, Casey White, Eric Lee, Fiona Griffin, Joshua D. Larkin, Kate Roll, Sissy Cross, Thuyanh V. Nguyen, Rachael Larsen, Julie Pendergraft, Tanya Daigle, Bosiljka Tasic, Carol L. Thompson, Jack Waters, Shawn Olsen, David J. Margolis, Hongkui Zeng, Michael Hausser, Matteo Carandini, and Kenneth D. Harris. Aberrant cortical activity in multiple gcamp6-expressing transgenic mouse lines. eNeuro, 4(5), 2017. doi: 10.1523/ENEURO.0207-17.2017. URL https://www.eneuro.org/content/4/5/ENEURO.0207-17.2017.

      Nicholas A. Steinmetz, Peter Zatka-Haas, Matteo Carandini, and Kenneth D. Harris. Distributed coding of choice, action and engagement across the mouse brain. Nature, 576(7786):266–273, Dec 2019. ISSN 1476-4687. doi: 10.1038/s41586-019-1787-x. URL https://doi.org/10.1038/s41586-019-1787-x.

      Nicholas A. Steinmetz, Cagatay Aydin, Anna Lebedeva, Michael Okun, Marius Pachitariu, Marius Bauza, Maxime Beau, Jai Bhagat, Claudia B¨ohm, Martijn Broux, Susu Chen, Jennifer Colonell, Richard J. Gardner, Bill Karsh, Fabian Kloosterman, Dimitar Kostadinov, Carolina Mora-Lopez, John O’Callaghan, Junchol Park, Jan Putzeys, Britton Sauerbrei, Rik J. J. van Daal, Abraham Z. Vollan, Shiwei Wang, Marleen Welkenhuysen, Zhiwen Ye, Joshua T. Dudman, Barundeb Dutta, Adam W. Hantman,Kenneth D. Harris, Albert K. Lee, Edvard I. Moser, John O’Keefe, Alfonso Renart, Karel Svoboda, Michael H¨ausser, Sebastian Haesler, Matteo Carandini, and Timothy D. Harris. Neuropixels 2.0: A miniaturized high-density probe for stable, long-term brain recordings. Science, 372(6539):eabf4588, 2021. doi: 10.1126/science.abf4588.URL https://www.science.org/doi/abs/10.1126/science.abf4588.

      Charlie Windolf, Han Yu, Angelique C. Paulk, Domokos Mesz´ena, William Mu˜noz, Julien Boussard, Richard Hardstone, Irene Caprara, Mohsen Jamali, Yoav Kfir, Duo Xu, Jason E. Chung, Kristin K. Sellers, Zhiwen Ye, Jordan Shaker, Anna Lebedeva, Manu Raghavan, Eric Trautmann, Max Melin, Jo˜ao Couto, Samuel Garcia, Brian Coughlin, Csaba Horv´ath, Rich´ard Fi´ath, Istv´an Ulbert, J. Anthony Movshon, Michael N. Shadlen, Mark M. Churchland, Anne K. Churchland, Nicholas A. Steinmetz, Edward F. Chang, Jeffrey S. Schweitzer, Ziv M. Williams, Sydney S. Cash, Liam Paninski, and Erdem Varol. Dredge: robust motion correction for high-density extracellular recordings across species. bioRxiv, 2023. doi: 10.1101/2023.10.24.563768. URL https://www.biorxiv.org/content/early/2023/10/29/2023.10.24.563768.

    1. Author response:

      The following is the authors’ response to the original reviews.

      Public Reviews: 

      Reviewer #1 (Public review): 

      The manuscript consists of two separate but interlinked investigations: genomic epidemiology and virulence assessment of Salmonella Dublin. ST10 dominates the epidemiological landscape of S. Dublin, while ST74 was uncommonly isolated. Detailed genomic epidemiology of ST10 unfolded the evolutionary history of this common genotype, highlighting clonal expansions linked to each distinct geography. Notably, North American ST10 was associated with more antimicrobial resistance compared to others. The authors also performed long-read sequencing on a subset of isolates (ST10 and ST74) and uncovered a novel recombinant virulence plasmid in ST10 (IncX1/IncFII/IncN). Separately, the authors performed cell invasion and cytotoxicity assays on the two S. Dublin genotypes, showing differential responses between the two STs. ST74 replicates better intracellularly in macrophages compared to ST10, but both STs induced comparable cytotoxicity levels.

      Comparative genomic analyses between the two genotypes showed certain genetic content unique to each genotype, but no further analyses were conducted to investigate which genetic factors were likely associated with the observed differences. The study provides a comprehensive and novel understanding of the evolution and adaptation of two S. Dublin genotypes, which can inform public health measures. 

      The methodology included in both approaches was sound and written in sufficient detail, and data analysis was performed with rigour. Source data were fully presented and accessible to readers. Certain aspects of the manuscript could be clarified and extended to improve the manuscript. 

      (1) For epidemiology purposes, it is not clear which human diseases were associated with the genomes included in this manuscript. This is important since S. Dublin can cause invasive bloodstream infections in humans. While such information may be unavailable for public sequences, this should be detailed for the 53 isolates sequenced for this study, especially for isolates selected to perform experiments in vitro.

      Thank you for the suggestion. We have added the sample type for the 53 isolates sequenced for this study. These additional details have been added to Supplementary Tables 1, 4, 9 and 10.

      (2) The major AMR plasmid in described S. Dublin was the IncC associated with clonal expansion in North America. While this plasmid is not found in the Australian isolates sequenced in this study, the reviewer finds that it is still important to include its characterization, since it carries blaCMY-2 and was sustainedly inherited in ST10 clade 5. If the plasmid structure is already published, the authors should include the accession number in the Main Results.

      We have provided accessions and context for two of the IncC hybrid plasmids that have been previously reported in the literature in the Introduction. The text now reads:

      “These MDR S. Dublin isolates all type as sequence type 10 (ST10), and the AMR determinants have been demonstrated to be carried on an IncC plasmid that has recombined with a virulence plasmid encoding the spvRABCD operon (12,16,18,19).  This has resulted in hybrid virulence and AMR plasmids circulating in North America including a 329kb megaplasmid with IncX1, IncFIA, IncFIB, and IncFII replicons (isolate CVM22429, NCBI accession CP032397.1) (12,16) and a smaller hybrid plasmid 172,265 bases in size with an IncX1 replicon (isolate N13-01125, NCBI accession KX815983.1) (19).”

      Further characterisation of the IncA/C plasmid circulating in North America was beyond the scope of this study.

      (a) The reviewer is concerned that the multiple annotations missing in  plasmid structures in Supplementary Figures 5 & 6, and  genetic content unique to ST10 and ST74 was due to insufficient annotation by Prokka. I would recommend the authors use another annotation tool, such as Bakta (https://www.ncbi.nlm.nih.gov/pmc/articles/PMC8743544/) for plasmid annotation, and reconstruction of the pangenome described in Supplementary Figure 10. Since the recombinant virulence plasmid in ST10 is a novel one, I would recommend putting Supplementary Figure 5 as a main figure, with better annotations to show the virulence region, plasmid maintenance/replication, and possible conjugation cluster.

      In the supplementary figures of the plasmids, we sought to highlight key traits on interest on the plasmids, namely plasmid replicons, antimicrobial resistance and heavy metal resistance (Supplementary Figure 5) and virulence genes (Supplementary Figure 6). The inclusion of the accessions of publicly available isolates provide for characterised plasmids such as the S. Dublin virulence plasmid (NCBI accession: CP001143). 

      For the potentially hybrid plasmid with IncN/IncX1/IncFII reported in Supplementary Figure 6, we have undertaken additional analyses of the two Australian isolates to reannotate these isolates with Bakta which provides for more detailed annotations. 

      We have added new text to the methods which reads as: 

      “The final genome assemblies were confirmed as S. Dublin using SISTR and annotated using both Prokka v1.14.6 (69) for consistency with the draft genome assemblies and  Bakta v1.10.1 (93) which provides for more detailed annotations (Supplementary Table 13). Both Prokka and Bakta annotations were in agreement for AMR, HMR and virulence genes, with Bakta annotating between 3-7 additional CDS which were largely ‘hypothetical protein’.”

      For the pangenome analysis of the seven ST74 and ten ST10 isolates, we have continued to use the Prokka annotated draft genome assemblies for input to Panaroo. 

      (4) The authors are lauded for the use of multiple strains of ST10 and ST74 in the in vitro experiment. While results for ST74 were more consistent, readouts from ST10 were more heterogenous (Figure 5, 6). This is interesting as the tested ST10 were mostly clade 1, so ST10 was, as expected, of lower genetic diversity compared to tested ST74 (partly shown in Figure 1D. Could the authors confirm this by constructing an SNP table separately for tested ST10 and ST74? Additionally, the tested ST10 did not represent the phylogenetic diversity of the global epidemiology, and this limitation should be reflected in the Discussion.

      In response to the reviewer’s comments, we have provided a detailed SNP table (Supplementary Table 12) to further clarify the genetic diversity within the tested ST10 and ST74 strains. 

      Additionally, we have expanded on the limitation regarding the phylogenetic diversity of the ST10 isolates in the Discussion, highlighting how the strains used in the in vitro experiments may not fully represent the global epidemiological diversity of S. Dublin ST10. The new text now reads:

      “This study has limitations, including a focus on ST10 isolates from clade 1, which do not represent global phylogenetic diversity. Nonetheless, our pangenome analysis identified >900 uncharacterised genes unique to ST74, offering potential targets for future research. Another limitation is the geographic bias in available genomes, with underrepresentation from Asia and South America. This reflects broader disparities in genomic research resources but may improve as public health genomics capacity expands globally.”

      (5) The comparative genomics between ST10 and ST74 can be further improved to allow more interpretation of the experiments. Why were only SPI-1, 2, 6, and 19 included in the search for virulome, how about other SPIs? ST74 lacks SPI-19 and has truncated SPI-6, so what would explain the larger genome size of ST74? Have the authors screened for other SPIs using more well-annotated databases or references (S. Typhi CT18 or S. Typhimurium ST313)? The mismatching between in silico prediction of invasiveness and phenotypes also warrants a brief discussion, perhaps linked to bigger ST74 genome size (as intracellular lifestyle is usually linked with genome degradation).

      Systematic screening for SPIs with detailed reporting on individual genes and known effectors is still an area of development in Salmonella comparative genomics. In our characterisation of the virulome in this S. Dublin dataset we decided to focus on SPI1, SPI-2, SPI-6 and SPI-19 as these had been identified in previous studies and were considered to be most likely linked to the invasive phenotype of S. Dublin. We thought the truncation of SPI-6 and lack of SPI-19 in ST74 compared to the ST10 isolates would provide a basis to explore genomic differences in the two genotypes, with the screening for individual genes on each SPIs reported in Supplementary Figure 7 and Supplementary Table 9.  

      We have expanded upon the mismatching of the in silico prediction of invasiveness and phenotypes in the Discussion. We now explore the increased genome size and intracellular replication of the ST74 population. We hypothesise that invasiveness has not been studied as thoroughly in zoonotic iNTS as much as human adapted iNTS and S. Typhi, and the increased genome content may be required for survival in different host species. The new text now reads:

      “Our phenotypic data demonstrated a striking difference in replication dynamics between ST10 and ST74 populations in human macrophages. ST74 isolates replicated significantly over 24 hours, whereas ST10 isolates were rapidly cleared after 9 hours of infection. ST74 induced significantly less host cell death during the early-mid stage of macrophage infection, supported by limited processing and release of IL-1ß at 9 hpi. While NTS are generally potent inflammasome activators (60), most supporting data come from laboratory-adapted S. Typhimurium strains. Our findings suggest that ST74 isolates may employ immune evasion mechanisms to avoid host recognition and activation of cell death signaling in early infection stages. Similar trends have been observed with S. Typhimurium ST313, which induces less inflammasome activation than ST19 during murine macrophage infection (61). This could facilitate increased replication and dissemination at later stages of infection. Consistent with this, we observed comparable cytotoxicity between ST10 and ST74 isolates at 24 hpi, suggesting ST74 induces cell death via alternative mechanisms once intracellular bacterial numbers are unsustainable. Further research is needed to identify genomic factors underpinning these observations.”

      (6) On the epidemiology scale, ST10 is more successful, perhaps due to its ongoing adaptation to replication inside GI epithelial cells, favouring shedding. ST74 may tend to cause more invasive disease and less transmission via fecal shedding. The presence of T6SS in ST10 also can benefit its competition with other gut commensals, overcoming gut colonization resistance. The reviewer thinks that these details should be more clearly rephrased in the Discussion, as the results highly suggested different adaptations of two genotypes of the same serovar, leading to different epidemiological success.

      We thank the reviewer for highlighting that we could rephrase this important point. We have added additional text in the Discussion to better interpret the differences in the two genotypes of S. Dublin and how this relates to difference epidemiological success. The new text now reads:

      “While machine learning predicted lower invasiveness for ST74 compared to ST10, the increased genomic content of ST74 may support higher replication in macrophages. We speculate that increased intracellular replication could enhance systemic dissemination, though this requires in vivo validation. Invasiveness of S. enterica is often linked to genome degradation (4,62–64). However, this is mostly based on studies of human-adapted iNTS (ST313) and S. Typhi, leaving open the possibility that the additional genomic content of ST74 supports survival in diverse host species. An uncharacterised virulence factor may underlie this replication advantage. Collectively, these findings highlight phenotypic differences between S. Dublin populations ST10 and ST74. Enhanced intra-macrophage survival of ST74 could promote invasive disease, whereas the prevalence of ST10 may relate to better intestinal adaptation and enhanced faecal shedding. In vivo models are needed to test this hypothesis. Interestingly, the absence of SPI-19 in ST74, which encodes a T6SS, may reflect adaptation to enhanced replication in macrophages. SPI-19 has been linked to intestinal colonisation in poultry (23,56) and mucosal virulence in mice (56). It’s possible that the efficient replication of ST74 in macrophages might compensate for the absence of SPI-19, relying instead on phagocyte uptake via M cells or dendritic cells. The larger pangenome of ST74 compared to ST10 could further enhance survival within hosts. These findings highlight important knowledge gaps in zoonotic NTS host-pathogen interactions and drivers of emerging invasive NTS lineages with broad host ranges.”

      Reviewer #2 (Public review): 

      This is a comprehensive analysis of Salmonella Dublin genomes that offers insights into the global spread of this pathogen and region-specific traits that are important to understanding its evolution. The phenotyping of isolates of ST10 and ST74 also offers insights into the variability that can be seen in S. Dublin, which is also seen in other Salmonella serovars, and reminds the field that it is important to look beyond lab-adapted strains to truly understand these pathogens. This is a valuable contribution to the field. The only limitation, which the authors also acknowledge, is the bias towards S. Dublin genomes from high-income settings. However, there is no selection bias; this is simply a consequence of publically available sequences.

      Reviewer #1 (Recommendations for the authors): 

      (1) The Abstract did not summarize the main findings of the study. The authors should rewrite to highlight the key findings in genomic epidemiology (low AMR generally, novel plasmid of which Inc type, etc.) and the in vitro experiments. The findings clearly illustrate the differing adaptations of the two genotypes. Suggest to omit 'economic burden' and 'livestock' as this study did not specifically address them.

      We agree with the Reviewer and have re-written the abstract to directly reflect the major outcomes of the research. We have also deleted wording such as ‘livestock’, ‘economic burden’ and ‘One Health’ as we did not specifically address these issues as highlighted by the Reviewer. 

      (2) Figure 2: The MCC tree should include posterior support in major internal nodes. The current colour scheme is also confusing to readers (columns 1, 2). Suggest to revise and include additional key information as columns: major AMR genes (blaCMY-2, strAB, floR) and mer locus, so this info can be visualized in the main figure. 

      Thank you for your valuable feedback. We have revised Figure 2 with the MCC tree to include posterior support on the internal nodes. We have also amended the figure legend to explain the additional coloured internal nodes. We have also amended the heatmap in Figure 2 to include additional white space between the columns to make it easier for the readers to distinguish. We didn’t change the colours in this figure as we have used the same colours throughout for the different traits reported in this study. Further, we chose to keep the AMR profiles reported in Figure 2 at the susceptible, resistant or MDR. This was done to convey the overview of the AMR profiles, and we provide detail in the AMR and HMR determinants in the Supplementary Figures and Tables. 

      (3) The manuscript title is not informative, as it did not study the 'dynamics' of the two genotypes. Suggest to revise the study title along the lines of main results.

      Thank you for the feedback on the title. We have amended this to better reflect the main findings of the study, and it now reads as “Distinct adaptation and epidemiological success of different genotypes within Salmonella enterica serovar Dublin”

      (4) The co-occurrence of AMR and heavy metal resistance genes (like mer) are quite common in Salmonella and E. coli. This is not a novel finding. The reviewer would suggest shortening the details related to heavy metal resistance in Results and Discussion, to make the writing more streamlined. 

      In line with the Reviewer comments, we have shortened the details in the Results and Discussion on the co-occurrence of AMR and HMR.  

      (5) L185: missing info after n=82. 

      This has been revised to now read as “n=82 from Canada”. 

      (6) I think Vi refers to the capsular antigen, not flagelle. Please double-check this.

      Thank you for highlighting this mistake. We have revised all instances.

      (7) L252-253: which statistic was used to state 'no association'. Also, there is no evidence presented to support 'no fitness cost associated with resistance and virulence."

      We have removed this sentence.

      (8) 320: Figure 6F is a scatterplot, not PCA. Please confirm. 

      The reviewer is correct, this is in fact a scatterplot. We have amended the figure legend and text.

      (9) For Discussion, it would be helpful to compare the phenotype findings with that of other invasive Salmonella like Typhi or Typhimurium ST313.

      Thank you for noting this, we had alluded to findings from ST313 but have now expanded include some further comparisons to S. Typhimurium ST313 and added references for these within the Discussion. The additional text now reads:

      “Similar trends have been observed with S. Typhimurium ST313, which induces less inflammasome activation than ST19 during murine macrophage infection (61). This could facilitate increased replication and dissemination at later stages of infection.”

      "Invasiveness of S. enterica is often linked to genome degradation (4,62–64).

      However, this is mostly based on studies of human-adapted iNTS (ST313) and S. Typhi, leaving open the possibility that the additional genomic content of ST74 supports survival in diverse host species. An uncharacterised virulence factor may underlie this replication advantage.”

      (10) L440: no evidence for "successful colonization" of ST74. Actually, the findings suggested otherwise.

      Thank you for picking this up, we have amended the sentence to better reflect the findings. The amended text now reads as:

      “It’s possible that the efficient replication of ST74 in macrophages might compensate for the absence of SPI-19, relying instead on phagocyte uptake via M cells or dendritic cells. The larger pangenome of ST74 compared to ST10 could further enhance survival within hosts.”

      (11) L460-461: The data did not show an increasing trend of iNTS related to S. Dublin.

      Thank you for identifying this. This sentence has been revised accordingly and now reads as:

      “While the data did not indicate an increasing trend of iNTS associated with S. Dublin, the potential public health risk of this pathogen suggests it may still warrant considering it a notifiable disease, similar to typhoid and paratyphoid fever.”

      (12) L465: Data were not analyzed explicitly in the context of animal vs. human. Suggest omitting 'One Health' from the conclusion.

      Thank you for the suggestion. We have omitted “One Health” from the conclusion

      (13) L500: Was the alignment not checked for recombination using Gubbins? The approach here is inconsistent with the method described in the subtree selected for BEAST analysis (L546).

      We have now applied Gubbins to the phylogenetic tree constructed using IQTREE, and the methods and results have been updated accordingly.

      (14) What was the output of Tempest? Correlation or R2 value? 

      We have now included the R2 value from Tempest and reported this in the manuscript. 

      (15) L556: marginal likelihood to allow evaluation of the best-fit model. Please rephrase to state this clearly.

      We have rephrased this in the manuscript to state this clearly.

    1. Author response:

      The following is the authors’ response to the previous reviews.

      Public Reviews:

      Reviewer #1 (Public Review):

      Summary:

      The main observation that the sperm from CRISP proteins 1 and 3 KO lines are postfertilization less developmentally competent is convincing. However, the molecular characterization of the mechanism that leads to these defects and the temporal appearance of the defects requires additional studies.

      We thank the reviewer for the valuable comments. As requested, additional experiments were carried out to analyze both the molecular mechanisms and the temporal appearance of the observed defects. Our results showed that DNA integrity defects appear during epididymal maturation and/or storage (see Figure 5B), that the epididymal fluid contributes to sperm DNA fragmentation defects (See Figure 6A) and that these defects seem not to be due to an increase in oxidative stress (Figure 5C) but rather to a dysregulation in Ca<sup>2+</sup> homeostasis within the epididymis (Figure 6A,B).

      Strengths:

      The generation of these double mutant mice is valuable for the field. Moreover, the fact that the double mutant line of Crisp 1 and 3 is phenotypically different from the Crisp 1 and 4 line suggests different functions of these epididymis proteins. The methods used to demonstrate that developmental defects are largely due to post-fertilization defects are also a considerable strength. The initial characterization of these sperm has altered intracellular Ca<sup>2+</sup> levels, and increased rates of DNA fragmentation are valuable.

      We thank the reviewer for the positive comments on our work.

      Weaknesses:

      The study is mechanistically incomplete because there is no direct demonstration that the absence of these proteins alters the epididymal environment and fluid, wherein during the passage through the epididymis the sperm become affected. Also, a direct demonstration of how the proteins in question cause or lead to DNA damage and increased Ca<sup>2+</sup> requires further characterization.

      The new experiments included in the revised version (see Figure 6A) showed that exposure of control WT sperm to epididymal fluid form mutant mice leads to an increase in sperm DNA fragmentation levels, confirming that the absence of CRISP1 and CRISP3 alters the epididymal fluid wherein the sperm become affected. In addition, new observations showing that WT sperm exposed to WT epididymal fluid in the presence of Ca<sup>2+</sup> also exhibit higher DNA fragmentation levels (Figure 6A) together with the finding that mutant sperm exhibit higher intracellular Ca<sup>2+</sup> levels (Figure 6B) but no higher levels of ROS, strongly support a dysregulation in Ca<sup>2+</sup> homeostasis within the epididymis and sperm as the main responsible for DNA integrity defects.

      Reviewer #2 (Public Review):

      The authors showed that CRISP1 and CRISP3, secreted proteins in the epididymis, are required for early embryogenesis after fertilization through DNA integrity in cauda epididymal sperm. This paper is the first report showing that the epididymal proteins are required for embryogenesis after fertilization. However, some data in this paper (Table 1 and Figure 2A) are overlapped in a published paper (Curci et al., FASEB J, 34,15718-15733, 2020; PMID: 33037689). Furthermore, the authors did not address why the disruption of CRISP1/3 leads to these phenomena (the increased level of the intracellular Ca<sup>2+</sup> level and impaired DNA integrity in sperm) with direct evidence. Therefore, if the authors can address the following comments to improve the paper's novelty and clarification, this paper may be worthwhile to readers.

      We thank the reviewer for the constructive comments. Regarding the data included in Table 1 and Figure 2A, it is important to note that Table 1 includes data on embryo development corresponding to C1/C4 DKO mice not published before in which the data on embryo development corresponding to C1/C3 DKO was used as simultaneous control. Figure 2A showed in vivo fertilization results at short times after mating (4h instead of 18 h) that have been neither reported before.

      Regarding studies to address why the disruption of CRISP1 and CRISP3 leads to defects in DNA integrity and Ca<sup>2+</sup> levels, we have carried out new experiments showing that mutant sperm do not exhibit higher levels of ROS (see Figure 5C), not favoring oxidative stress as the mechanism underlying mutant sperm defects. In addition, we found that DNA integrity defects develop during epididymal transit (Figure 5B) and that exposure of WT sperm to epididymal fluid from mutant mice leads to an increase in sperm DNA fragmentation levels (Figure 6A), confirming that the absence of CRISP1 and CRISP3 alters the epididymal fluid. Finally, our new results showing that WT sperm exposed to WT epididymal fluid in the presence of Ca<sup>2+</sup> also exhibit higher DNA fragmentation levels (Figure 6A) together with the higher intracellular Ca<sup>2+</sup> levels detected in mutant sperm (Figure 6B) strongly support a dysregulation in Ca<sup>2+</sup> homeostasis within the epididymis and sperm as the main responsible for DNA integrity defects.

      Recommendations for the authors:

      Reviewer #1 (Recommendations For The Authors):

      Overall comments:

      This manuscript investigates the mechanisms whereby the absence of the epididymal CRISP proteins 1 and 3 (Cysteine-Rich Secretory Proteins) causes infertility and lower embryo developmental rates. This strain's infertility seems to have a post-fertilization origin because the rates of in vivo fertilization are like the controls, but the development to the blastocyst stage is decreased. The results of this study show that (1) mutant sperm viability, progressive motility, and morphology are normal;

      (2) in vivo fertilization rates are comparable to controls, but embryo development is reduced;

      (3) in vitro fertilization studies found reduced fertilization rates and activation rates even in zona-free studies;

      (4) additional functional studies showed increased rates of DNA fragmentation and elevated Ca<sup>2+</sup> levels in mutant sperm.

      The results presented are credible and hint that the epididymis might play a role before and after fertilization and directly affect embryo development. However, the study is mechanistically incomplete, as there is no direct demonstration that the absence of these proteins alters the epididymal environment and fluid, wherein the passage through the epididymis the sperm become functionally defective, and whether mutant or control epididymal fluid or purified CRISP proteins can change, either reduce or overcome, respectively, the developmental competence of the control or mutant sperm and induce functional changes in the counterpart sperm. In summary, the main observation that the sperm from CRISP proteins 1 and 3 KO lines are post-fertilization less developmentally competent is significant and important, but the molecular characterization of the defects and the temporal appearance of defects requires additional studies.

      Specific comments:

      (1) Introduction.

      It is too long. The description of the function of the epididymis should be reduced. The functional properties of the Crisp genes should also be substantially shortened.

      As requested, the Introduction has been revised and descriptions of the epididymis and CRISP have been shortened

      (2) Results.

      • Lines 140 to 142. Remove these initial lines. Start directly addressing the results of the C1/C3 strain, which is the mutant under consideration here. Referring to the C1/C4 results detracts from the focus of the study.

      As suggested by the reviewer, lines 140 to 142 have been removed.

      • Table 1. Move the two-cell embryo line to the top of the Table and place the Blastocyst line below it. This organization is the conventional method to present this type of data.

      As suggested, the order of the lines in Table 1 has been modified to align with the conventional presentation method.

      • Figures 1 and 2A and B data are solid and support the notion that enough sperm reach the site of fertilization, and that the sperm are defective in their capacity to support embryo development. Figures 2C and D have interesting data, although additional information would strengthen these results. The authors concluded that the sperm were defective in the epididymis. Where in the epididymis? These sperm were all from the cauda. Could the authors collect sperm from the upper portion of the cauda, or midportion, and compare if the defects manifest gradually?

      We appreciate this interesting and appropriate comment from the reviewer. In this regard, all the studies in our work were carried out using sperm from the whole cauda epididymis, the reason why we could not answer where defective sperm appear in the epididymis. In view of this, we have now conducted a comparative DNA fragmentation analysis between caput and cauda sperm from both genotypes. Our findings indicate that while cauda mutant sperm showed once again higher DNA fragmentation levels than controls, caput sperm exhibited levels of DNA damage not significantly different between genotypes. These results confirm that defects in DNA appear following sperm passage through the epididymal caput, supporting the hypothesis that defects in DNA fragmentation manifest during sperm transit through the epididymis and /or during storage in the cauda. These results have been included in the revised version of the manuscript (see lines 235-240/Figure 5B of the revised version)

      • Figure 3 displays the results of in vitro fertilization, either COCs A-C or zona-free fertilization D-F. The results are important and differ from those produced by fertilization in vivo. The authors indicate that these confirm that the in vivo conditions overcome in vitro defects. However, this study never addresses the reason behind it. Is there less expression of proteins related to these functions, or the function of some proteins is compromised? The authors should advance a hypothesis or a rationale to explain these results.

      As indicated by the reviewer, our results showed differences between the fertilization rates observed for mutant mice under in vivo and in vitro conditions, as previously observed for all our single and multiple KO models (Da Ros et al., 2008; PMID: 18571638, Brukman et al., 2016; PMID: 26786179, Weigel Muñoz, 2018; PMID: 29481619, Ernesto et al., 2015; PMID: 26416967, Carvajal et al,. 2018; PMID: 30510210) and also reported by other groups (Okabe et al., 2007; PMID: 17558467). In this regard, it has been well established that, although millions of sperm are ejaculated into the female tract, only a few (approximately one per oocyte) reach the fertilization site (i.e. the ampulla) (Cummins and Yanagimachi, 1982; doi:10.1002/mrd.1120050304). This efficient selection system by the female reproductive tract leads to the arrival of only the best sperm at the fertilization site, even in males with reproductive deficiencies, thereby “masking” sperm defects that can be detected under in vitro conditions due to the competition between good and bad quality sperm for the egg. Thus, although we can not exclude other mechanisms to explain the commonly observed differences between in vivo and in vitro fertilization rates, our rationale is that the natural and efficient sperm selection process that takes place within the female reproductive tract masks sperm defects that can, otherwise, be detected under the competitive in vitro conditions. This explanation is now included in the discussion of the revised version of the manuscript (see lines 320-325).

      • Data in Figures 4 and 5 support the interpretation of the authors. However, it is necessary to establish the level of oxidative stress in the mutant sperm vs. the controls. Also, a question to explore is for how long does the sperm need to reside in that mutant environment to start undergoing the DNA fragmentation reported?

      In response to the valuable request from the reviewer regarding the level of oxidative stress in sperm, we have analyzed reactive oxygen species (ROS) levels in mutant and control epididymal sperm. Our results showed that ROS levels in mutant sperm were not higher than those observed in the control group, supporting the idea that mechanisms other than oxidative stress may be leading to the increased DNA fragmentation observed in mutant sperm. These results are now included in the revised version of the manuscript (see Figure 5C).

      Regarding the question on how long the sperm need to reside in the mutant environment to undergo DNA fragmentation, recent experiments carried out in response to this reviewer in which we analyzed DNA fragmentation in caput sperm led us to conclude that DNA fragmentation develops during epididymal transit and/or storage in the cauda. While these observations do not precisely define the time within the epididymis that sperm require for exhibiting DNA fragmentation, our additional new in vitro experiments analyzing the effect of epididymal fluids on sperm DNA integrity showed that exposure of WT sperm to DKO fluid for only 1 hr already leads to an increase in DNA fragmentation (see Figure 6A of the revised manuscript), suggesting that sperm do not need long periods within the mutant environment to be affected.

      (3) The length of the Discussion section should be shortened, especially by not recapitulating data presented in the Results section.

      As requested by the reviewer, sections recapitulating results have been modified.

      Minor comments:

      (1) The sentence in lines 171 and 172 is unclear, "However, despite the short time after mating, once again, the in vivo fertilized eggs corresponding to the mutant group exhibited clear defects to reach the blastocyst stage in vitro compared to controls." What do the authors mean by short time? It is the expected time, correct?

      It is well established that after copulatory plug formation, most oocytes are fertilized within 2 to 8 hours, with fertilization rates that increase over time: 0–5% at 1.5 hours post-mating; 40% at 4 hours post-mating and more than 90% at 7 hs after mating (Muro et al., 2016; PMID: 26962112, La Spina et al., 2016; PMID: 26872876). In order to examine whether the embryo development defects observed for mutant mice were due to a delayed arrival of sperm to the ampulla, we decided to analyze the percentage of fertilized eggs recovered from the ampulla at “short times” (4 hs) after mating to avoid the possibility that the prolonged stay of sperm within the female tract corresponding to the usual “overnight mating” schedule could be giving defective sperm enough time to reach the ampulla and, finally, fertilize the eggs (i.e. delayed fertilization). Our results showed that, despite the expected lower fertilization rates observed for both control and mutant males when analyzed just 4 hs after mating, the fertilized eggs corresponding to the mutant group were still exhibiting clear defects to develop into blastocysts compared to controls, not favoring the idea that embryo development defects were due to a delayed fertilization. The sentence in lines “171 and 172” has been modified in the revised version of the manuscript to better explain this conclusion (see lines 152-155 of the revised version).

      (2) Line 177. Mutant epididymal sperm already carry defects leading to embryo development failure. Under this subheading, the authors compare within the same female the ability of mutant and control sperm delivered into different horns to support fertilization and embryo development. They show that the embryo development induced by mutant sperm is diminished vs. controls under very similar conditions, confirming the previous results of post-fertilization failure. The data also answers the question raised by the authors of whether the fertilization defects appear during or after epididymal transit; the interpretation of the results is the functional defects in the sperm are present before the transport into the female tract. Important unaddressed questions are, could these defects begin even earlier before arriving at the cauda? Did the authors try to incubate the mutant sperm with the epididymal fluid of WT mice to examine if the sperm defects could be rescued? The opposite experiment could also be performed, where WT sperm are incubated with the epididymal fluid of mutant mice, and the treated sperm examined for altered Ca<sup>2+</sup> levels or DNA fragmentation.

      First of all, we would like to clarify that our question about whether the fertilization defects appear “during or after epididymal transit” was in fact referring to whether defects appear during epididymal maturation or later on, at the moment of ejaculation. In this regard, our in vivo and in vitro fertilization studies allowed us to conclude that defects were already present in epididymal sperm without excluding the possibility that additional defects could appear at the vas deferens or at the moment of ejaculation due to the contribution of seminal plasma secretions.

      Regarding whether sperm defects could appear even earlier before arriving to the cauda, we have now analyzed DNA fragmentation defects in caput vs cauda both mutant and control sperm observing differences between genotypes only for cauda sperm. Based on these observations, we conclude that DNA integrity defects appear within the epididymis after sperm passage through the caput either when sperm reach the corpus or the cauda epididymis, or during their storage within the cauda region.

      Also, as suggested by the reviewer, we incubated in vitro WT sperm with epididymal fluid from DKO mice (and vice versa) and then analyzed DNA fragmentation levels. Results showed that exposure of control sperm to the mutant epididymal fluid for 1 hr significantly increased DNA fragmentation levels. When mutant sperm (exhibiting higher levels of DNA fragmentation than control sperm), were exposed to epididymal fluid from WT mice, no differences between groups were observed. Together, these results confirm both that the epididymal fluid from mutant mice contributes to the higher DNA fragmentation levels detected in mutant sperm, and that normal epididymal fluid would not be able to rescue the DNA fragmentation present in mutant cells. These results are now included in the revised version of the manuscript (see Figure 6A).

      (3) Lines 203 to 216. In these paragraphs the authors indicate "that mutant sperm had a lower percentage of fertilization and lower rates of blastocysts (Figure 3D, E), indicating that defects in egg coat penetration were not responsible for embryo development failure. Later, they indicated that a few eggs fertilized by mutant sperm failed to activate. It is shown that Ca<sup>2+</sup> oscillations are normal, indicating that the defects lie elsewhere. Could the authors propose a mechanism based on their sperm DNA defects?

      As described in the Result and Discussion sections of the original manuscript, we decided to investigate the existence of possible defects in sperm DNA fragmentation based on evidence indicating that delays in early embryo development may result from the time taken by the egg to repair damaged paternal DNA (Esbert et al., 2018; PMID: 30259705, Newman et al., 2022; PMID: 34954800, Nguyen et al., 2023; PMID: 37658763). In this regard, it is known that time is needed before the first embryonic cell division for activation of the egg DNA repairing machinery (Martin et al., 2019; PMID: 30541031, Newman et al., 2022; PMID: 34954800) and that increased sperm DNA damage may necessitate more time for repair by the oocyte (Martin et al., 2019; PMID: 30541031, Newman et al., 2022; PMID: 34954800). Based on this, we decided to examine possible DNA damage in sperm. Our finding that, in fact, sperm DNA fragmentation was clearly increased in mutant sperm led us to propose that delays in early embryo development in our mutant colonies may result from the time required by the egg to repair sperm DNA fragmentation.

      (4) The demonstration that C1/C3 sperm have abnormal rates of DNA fragmentation and Ca<sup>2+</sup> levels is significant. Additional studies would strengthen the findings reported here. For example, what are the levels of oxidative stress in these sperm? Are there other changes related to oxidative stress? Performing a TUNNEL assay will strengthen the notion of DNA damage demonstrated here with the chromatin dispersion assay.

      As mentioned previously, we analyzed oxidative stress by evaluating ROS levels in control and mutant sperm observing no differences between genotypes. These results have been included in the revised version of the manuscript (See Figure 5C). We appreciate the suggestion of performing TUNNEL assay for future studies.

      Reviewer #2 (Recommendations For The Authors):

      Major comments:

      (1) There are some reports small RNAs gained during the epididymal transition of sperm are essential for embryonic development (e.g., Conine et al., Dev Cell, 46, 470480, 2018; PMID: 30057276), suggesting that the luminal changes in Crisp1/3 double KO (dKO) epididymis lead to the phenotype in this study. In fact, there is no evidence whether CRISP1/CRISP3 secreted from an epididymis exists in cauda epididymal sperm and directly controls the observed phenomena. Also, the authors wrote there is no strong evidence to exclude the possible role of small RNA in Crisp1/3 dKO sperm (lines 370-372). Therefore, it is at least necessary to measure small RNA abundance in dKO mice.

      As mentioned by the reviewer and as cited in our manuscript, there is a report indicating that the small RNAs gained during epididymal transit may play a role in embryonic development (Conine et al., 2018; PMID: 30057276). However, the need of small RNAs for embryonic development still remains a topic of debate (Wang et al. 2020; PMCID: PMC7799177). In this regard, clear evidence indicating that sperm DNA fragmentation is associated with embryo development defects together with the increase in sperm DNA fragmentation levels observed in mutant sperm support sperm DNA damage as one of the causes leading to the observed phenotype in our mutant mice. Moreover, recent experiments carried out in response to Reviewer 1 comments revealed that exposure of control sperm to epididymal fluid from mutant mice significantly increases DNA fragmentation levels, confirming that the absence of CRISP1 and CRISP3 proteins in epididymal fluid contributes to sperm DNA damage in mutant sperm. Finally, whereas oxidative stress might also lead to embryo development impairment as mentioned in our original manuscript, recent evaluation of ROS levels in control and mutant sperm carried out in response to Reviewer 1’s comments did not show higher ROS levels in mutant sperm. Thus, although as mentioned in the manuscript, we do not exclude the possibility that small RNAs may also contribute to embryo development defects, our observations support DNA fragmentation and a dysregulation in Ca<sup>2+</sup> homeostasis within the epididymis and sperm as the main responsible for embryo development failure in our mutant males. The experiments using epididymal fluid (Figure 6A) and those evaluating ROS levels (Figure 5C) have been included in the revised version of the manuscript and discussed accordingly.

      (2) Lines 245-248 and 354-374: According to Figure 5C, the intracellular Ca<sup>2+</sup> level significantly increased in Crisp1/3 dKO sperm compared to control. The author hypothesized that this increase could destroy sperm DNA integrity, causing defects in early embryogenesis. However, the authors did not show the direct evidence.

      Specifically, as CRISP1 inhibits CatSper (line 95), the authors believed the increased Ca<sup>2+</sup> level in Crisp1/3 dKO sperm was observed. Crisp1/3 dKO and Crisp1/4 dKO mice share the disruption of Crisp1, but the phenotype is totally different. Thus, the authors should also examine the CatSper activity in Crisp1/3 dKO sperm.

      We appreciate the reviewer's insightful comments. In this regard, whereas C1/C3 and C1/C4 DKO colonies shares the disruption of Crisp1, the intracellular Ca<sup>2+</sup> levels in these two colonies are different as no increase in sperm intracellular Ca<sup>2+</sup> was detected in Crisp C1/C4 DKO mice. Thus, this difference in intracellular Ca<sup>2+</sup> levels might explain the different embryo development phenotype observed in our two DKO colonies. In this regard, our results revealed that sperm intracellular Ca<sup>2+</sup> levels are different depending on the Crisp gene being deleted. Whereas the lack of Crisp1 did not affect intracellular sperm Ca<sup>2+</sup> levels (Weigel Munoz et al, 2018; PMID: 29481619), there was an increase in Ca<sup>2+</sup> levels in CRISP2 KO sperm (Brukman et al., 2016; PMID: 26786179) and a decrease in sperm when Crisp4 was deleted (Carvajal 2019, Ph.D Thesis). Thus, although the ability of CRISP3 to regulate sperm Ca<sup>2+</sup> channels has not yet been reported, the existence of functional compensations between homologous CRISP members (Curci et al., 2020; PMID: 33037689) makes it complicated to draw straightforward conclusions based on the behavior of each individual protein in Ca<sup>2+</sup> regulation. In fact, while the lack of CRISP1 and CRISP4 does not affect sperm Ca<sup>2+</sup> concentration (Carvajal 2019, Ph.D Thesis), the simultaneous lack of CRISP1 and CRISP3 produced an increase in Ca<sup>2+</sup> levels and the lack of the four CRISP proteins showed a decrease in the intracellular levels of the cation after capacitation (Curci et al, 2020). Based on these observations, we conclude that the absence of CRISP1 may or may not lead to altered intracellular Ca<sup>2+</sup> levels depending on the other simultaneously-deleted gene/s.

      The authors make a hypothesis that the increased Ca<sup>2+</sup> level may lead to damaged DNA integrity by citing a published paper (lines 360-363). In the published paper, the authors examined the influence of the luminal fluid of the epididymis and vas deference on sperm chromatin fragmentation (Gawecka et al., 2015). However, they did not mention the increased DNA fragmentation in epididymal sperm when these sperm were incubated with Ca<sup>2+</sup> or Mn2+. So, the authors' hypothesis is over discussion. Thus, the correlation between the intracellular Ca<sup>2+</sup> level and DNA integrity in sperm is still unclear. So, the authors should show why the increased Ca<sup>2+</sup> level leads to DNA fragmentation with direct evidence.

      We appreciate the reviewer’s comment regarding the work by Gawecka et al., (2015), and the opportunity to clarify the proposed mechanism underlying our observations. In the above mentioned paper, the authors reported that when mouse epididymal or vas deferens sperm were incubated with divalent cations (Ca<sup>2+</sup> and Mn<sup>2+</sup>) in the presence of luminal fluid, they were induced to degrade their DNA in a process termed sperm chromatin fragmentation (SCF). The fact that both the ejaculated and epididymal mutant sperm used in our studies had been exposed to epididymal fluid lacking CRISP proteins known to regulate sperm Ca<sup>2+</sup> channels, opened the possibility that changes in Ca<sup>2+</sup> levels within the epididymal fluid and/or sperm could be responsible for the higher DNA fragmentation levels observed in mutant cells. In this regard, it is important to note that, as requested by Reviewer 1, we performed additional in vitro experiments in which WT epididymal sperm were exposed to mutant or WT epididymal fluid in the presence or absence of Ca<sup>2+</sup> and DNA fragmentation analyzed at the end of incubation. Results showed a significant increase in DNA fragmentation in WT sperm exposed to either mutant epididymal fluid or WT fluid in the presence of Ca<sup>2+</sup> (Figure 6A). We believe these observations together with the higher intracellular Ca<sup>2+</sup> levels detected in DKO sperm (Figure 6B) provides strong evidence supporting changes in Ca<sup>2+</sup> homeostasis in the epididymis and sperm as the main responsible for the observed sperm DNA integrity defects. This could be mediated by the activation of Ca<sup>2+</sup>-dependent nucleases present within the epididymal fluid and/or sperm cells as previously suggested (Shaman et al., 2006; PMID: 16914690, Sotolongo et al., 2005; PMID: 15713834, Boaz et al., 2008; PMID: 17879959, Dominguez and Ward, 2009; PMID: 19938954). These observations have now been included and discussed in the revised version of the manuscript (see lines 245-265 and 427-439).

      Minor Comments:

      (3) Standards for measuring rates should be clarified, such as two-cell rates are determined by dividing the number of two-cell embryos by the total number of eggs.

      As requested, standards for measuring rates have now been clarified in the corresponding figure legends

    1. Author response:

      The following is the authors’ response to the previous reviews.

      Public Reviews:

      Reviewer #1 (Public review): 

      Summary: 

      In this manuscript, the authors investigate the role of BEND2, a novel regulator of meiosis, in both male and female fertility. Huang et al have created a mouse model where the full-length BEND2 transcript is depleted but the truncated BEND2 version remains. This mouse model is fertile, and the authors used it to study the role of BEND2 on both male and female meiosis. Overall, the full-length BEND2 appears dispensable for male meiosis. The more interesting phenotype was observed in females. Females exhibit a lower ovarian reserve suggesting that full-length BEND2 is involved in the establishment of the primordial follicle pool. 

      Strengths: 

      The authors generated a mouse model that enabled them to study the role of BEND2 in meiosis. The role of BEND2 in female fertility is novel and enhances our knowledge of genes involved in the establishment of the primordial follicle pool. 

      Weaknesses: 

      The manuscript extensively explores the role of BEND2 in male meiosis; however, a more interesting result was obtained from the study of female mice. 

      We sincerely appreciate the reviewer’s thoughtful evaluation of our work and recognition of the strengths of our study. We are especially grateful for the acknowledgment of the novelty of our findings regarding the role of BEND2 in female fertility. While we extensively characterized the e ects of BEND2 depletion in male meiosis, we agree that the phenotype observed in females provides particularly interesting insights into the establishment of the primordial follicle pool. 

      Reviewer #2 (Public review): 

      In their manuscript entitled "BEND2 is a crucial player in oogenesis and reproductive aging", the authors present their findings that full-length BEND2 is important for repair of meiotic double strand break repair in spermatocytes, regulation of LINE-1 elements in spermatocytes, and proper oocyte meiosis and folliculogenesis in females. The manuscript utilizes an elegant system to specifically ablate the full-length form of BEND2 which has been historically di icult to study due to its location on the X chromosome and male sterility of global knockout animals. 

      The authors have been extremely responsive to reviewer critiques and have presented strong data and appropriate conclusions, making it an excellent addition to the field. 

      We are truly grateful for the reviewer’s thoughtful review and recognition of the key contributions of our study. We appreciate the acknowledgment of how our model overcomes the challenges in studying BEND2 and the importance of our findings in both male and female meiosis. We also value the reviewer’s encouraging comments on our responsiveness to their feedback and the quality of our data and conclusions.

      Reviewer #3 (Public review): 

      Huang et al. investigated the phenotype of Bend2 mutant mice which expressed truncated isoform. Bend2 deletion in male showed fertility and this enabled them to analyze the BEND2 function in females. They showed that Bend2 deletion in females showed decreasing follicle number which may lead to loss of ovarian reserve. 

      Strengths: 

      They found the truncated isoform of Bend2 and the depletion of this isoform showed decreasing follicle number at birth. 

      Weaknesses: 

      The authors showed novel factors that impact ovarian reserve. Although the number of follicles and conception rate are reduced in mutant mice, the in vitro fertilization rate is normal and follicles remain at 40 weeks of age. It is difficult to know how critical this is when applied to the human case. 

      We greatly appreciate the reviewer’s comments and recognition of the strengths of our work. We are grateful for their acknowledgment of our findings related to the truncated isoform of Bend2 and its e ect on ovarian reserve. We also agree that, although our study provides important insights, we are still far from directly applying these results to human clinical scenarios. There is much further research needed before these findings can be translated. 

      Recommendations for the authors:

      Reviewer #1 (Recommendations for the authors):: 

      The authors have addressed all concerns both editorially and experimentally. This is a very nice manuscript, and I congratulate the authors on their work. 

      We sincerely appreciate your kind words and thoughtful review. Your feedback has been invaluable in improving our manuscript, and we are grateful for your time and effort. Thank you for your support and encouragement!

      Reviewer #2 (Recommendations for the authors):: 

      In Figure 3, graphs in panels C & D have typos in the early zygotene column where it reads "zyotene". 

      We appreciate your careful review and for pointing out the typos in Figure 4, which has been corrected in the new version of the manuscript. 

      Reviewer #3 (Recommendations for the authors): 

      ・Since there are two isoforms of Bend2, and the authors depleted one isoform, this is not suitable to use "full length" in the titles and in the manuscripts. 

      We respectfully disagree with the reviewer’s comment. In our mouse model, we specifically remove the full-length isoform of Bend2. Therefore, we consider it appropriate to refer to it as such in the manuscript. Our results indicate that the full-length isoform is not required to complete meiotic prophase in males but is indispensable for setting up the ovarian reserve in females. We appreciate the reviewer’s input and are happy to clarify this point further if needed.

      ・Is there any reason why authors used 7 month old females for in vitro fertilization? It may not be recognized as aged mice but it seems a bit old to perform IVF especially when the ovarian reserve in mutant mice is decreased. If there is any reason, please clarify it. In addition, since the authors added IVF data, which showed similar fertilization ratio between control and mutant, the authors need to discuss why the litter size was decreased in mutant mice. It may be to strong to conclude "subfertility". 

      We used 7-month-old females for IVF because this falls within the age range of the samples analyzed for ovarian reserve, with the oldest females being 8 months old. Regarding the apparent discrepancy between IVF results and litter size, we addressed this in the discussion section of the manuscript: 'Interestingly, our mutant oocyte quality analysis suggests that mature oocytes from mutant females are equally competent to develop into a blastocyst as control ones. These data suggest that the subfertility observed in Bend2 mutants may be due to errors in later developmental stages, such as implantation or organogenesis.' We appreciate the reviewer’s feedback and hope this clarification helps.

    1. Author response:

      The following is the authors’ response to the previous reviews.

      Public Reviews:

      Reviewer #1 (Public review):

      Turi, Teng and the team used state-of-the-art techniques to provide convincing evidence on the infraslow oscillation of DG cells during NREM sleep, and how serotonergic innervation modulates hippocampal activity pattern during sleep and memory. First, they showed that the glutamatergic DG cells become activated following an infraslow rhythm during NREM sleep. In addition, the infraslow oscillation in the DG is correlated with rhythmic serotonin release during sleep. Finally, they found that specific knockdown of 5-HT receptors in the DG impairs the infraslow rhythm and memory, suggesting that serotonergic signaling is crucial for regulating DG activity during sleep. Given that the functional role of infraslow rhythm still remains to be studied, their findings deepen our understanding on the role of DG cells and serotonergic signaling in regulating infraslow rhythm, sleep microarchitecture and memory.

      Reviewer #2 (Public review):

      Summary:

      The authors investigated DG neuronal activity at the population and single cell level across sleep/wake periods. They found an infraslow oscillation (0.01-0.03 Hz) in both granule cells (GC) and mossy cells (MC) during NREM sleep. The important findings are 1) the antiparallel temporal dynamics of DG neuron activities and serotonin neuron activities/extracellular serotonin levels during NREM sleep, and 2) the GC Htr1a-mediated GC infraslow oscillation.

      Strengths:

      (1) The combination of polysomnography, Ca-fiber photometry, two-photon microscopy and gene depletion is technically sound. The coincidence of microarousals and dips in DG population activity is convincing. The dip in activity in upregulated cells is responsible for the dip at the population level.

      (2) DG GCs express excitatory Htr4 and Htr7 in addition to inhibitory Htr1a, but deletion of Htr1a is sufficient to disrupt DG GC infraslow oscillation, supporting the importance of Htr1a in DG activity during NREM sleep.

      Weaknesses:

      (1) The current data set and analysis are insufficient to interpret the observation correctly.<br /> a. In Fig 1A, during NREM, the peaks and troughs of GC population activities seem to gradually decrease over time. Please address this point.

      b. In Fig 1F, about 30% of Ca dips coincided with MA (EMG increase) and 60% of Ca dips did not coincide with EMG increase. If this is true, the readers can find 8 Ca dips which are not associated with MAs from Fig 1E. If MAs were clustered, please describe this properly.<br /> c. In Fig 1F, the legend stated the percentage during NREM. If the authors want to include the percentage of wake and REM, please show the traces with Ca dips during wake and REM. This concern applies to all pie charts provided by the authors.

      d. In Fig 1C, please provide line plots connecting the same session. This request applies to all related figures.

      e. In Fig 2C, the significant increase during REM and the same level during NREM are not convincing. In Fig 2A, the several EMG increasing bouts do not appear to be MA, but rather wakefulness, because the duration of the EMG increase is greater than 15 seconds. Therefore, it is possible that the wake bouts were mixed with NREM bouts, leading to the decrease of Ca activity during NREM. In fact, In Fig 2E, the 4th MA bout seems to be the wake bout because the EMG increase lasts more than 15 seconds.

      f. Fig 5D REM data are interesting because the DRN activity is stably silenced during REM. The varied correlation means the varied DG activity during REM. The authors need to address it.

      g. In Fig 6, the authors should show the impact of DG Htr1a knockdown on sleep/wake structure including the frequency of MAs. I agree with the impact of Htr1a on DG ISO, but possible changes in sleep bout may induce the DG ISO disturbance.

      (2) It is acceptable that DG Htr1a KO induces the reduced freezing in the CFC test (Fig. 6E, F), but it is too much of a stretch that the disruption of DG ISO causes impaired fear memory. There should be a correlation.

      (3) It is necessary to describe the extent of AAV-Cre infection. The authors injected AAV into the dorsal DG (AP -1.9 mm), but the histology shows the ventral DG (Supplementary Fig. 4), which reduces the reliability of this study.

      Responses to weaknesses mentioned above have been addressed in the first revision.

      Comments on revisions:

      In the first revision, I pointed out the inappropriate analysis of the EEG/EMG/photometry data and gave examples. The authors responded only to the points raised and did not seem to see the need to improve the overall analysis and description. In this second revision, I would like to ask the authors to improve them. The biggest problem is that the detection criteria and the quantification of the specific event are not described at all in Methods and it is extremely difficult to follow the statement. All interpretations are made by the inappropriate data analysis; therefore, I have to say that the statement is not supported by the data.

      Please read my following concerns carefully and improve them.

      (1) The definition of the event is critical to the detection of the event and the subsequent analysis. In particular, the authors explicitly describe the definition of MA (microarousal), the trough and peak of the population level of intracellular Ca concentrations, or the onset of the decline and surge of Ca levels.

      (1-1) The authors categorized wake bouts of <15 seconds with high EMG activity as MA (in Methods). What degree of high EMG is relevant to MA and what is the lower limit of high EMG? In Fig 1E, there are some EMG spikes, but it was unclear which spike/wave (amplitude/duration) was detected as MA-relevant spike and which spike was not detected. In Fig 2E, the 3rd MA coincides with the EMG spike, but other EMG spikes have comparable amplitude to the 3rd MA-relevant EMG spike. Correct counting of MA events is critical in Fig 1F, 2F, 4C.

      We have added more information about the MA definition in Methods, including EMG amplitude. Furthermore, we have re-analyzed MA and MA-related calcium signals in Fig1 and Fig2. Fig-S1 shows the traces of EMG aptitude for all MA events show in Fig1G and Fig2G.

      (1-2) Please describe the definition of Ca trough in your experiments. In Fig 1G, the averaged trough time is clear (~2.5 s), so I can acknowledge that MA is followed by Ca trough. However, the authors state on page 4 that "30% of the calcium troughs during NREM sleep were followed by an MA epoch". This discrepancy should be corrected.

      We apologize for the misleading statement. We meant 30% of ISO events during NERM sleep. We have corrected this. To detect the calcium trough of ISO, we first calculated a moving baseline (blue line in Fig-S2 below) by smoothing the calcium signals over 60 s, then set a threshold (0.2 standard deviation from the moving baseline) for events of calcium decrease, and finally detected the minimum point (red dots in Fig-S2) in each event as the calcium trough. We have added these in Methods.

      (1-3) Relating comment 1-2, I agree that the latency is between MA and Ca through in page 4, as the authors explain in the methods, but, in Fig 1G, t (latency) is labeled at incorrect position. Please correct this.

      We are sorry for the mistake in describing the latency in the Methods. The latency was defined as the time difference between the onset of calcium decline (see details below in 1-4) and the onset of the MA. We have corrected this in the revised manuscript. Thus, the labeling in Fig1G was correct.

      (1-4) The authors may want to determine the onset of the decline in population Ca activity and the latency between onset and trough (Fig 1G, latency t). If so, please describe how the onset of the decline is determined. In Fig 1G, 2G, S6, I can find the horizontal dashed line and infer that the intersection of the horizontal line and the Ca curve is considered the onset. However, I have to say that the placement of this horizontal line is super arbitrary. The results (t and Drop) are highly dependent on the position of horizontal line, so the authors need to describe how to set the horizontal line.

      Indeed, we used the onset of calcium decline to calculate the latency as mentioned above. First, we defined the baseline (dashed line in Fig1G) by calculating the average of calcium signals in the10s window before the MA (from -15s to -5s in Fig1G). The onset of calcium decline is defined as the timepoint where calcium decrease was larger than 0.05 SD from this baseline. We have added these in Methods.

      (1-5) In order to follow Fig 1F correctly, the authors need to indicate the detection criteria of "Ca dip (in legend)". Please indicate "each Ca dip" in Fig 1E. As a reader, I would like to agree with the Ca dip detection of this Ca curve based on the criteria. Please also indicate "each Ca dip" in Fig 2E and 2F. In the case of the 2nd and 3rd MAs, do they follow a single Ca dip or does each MA follow each Ca dip? This chart is highly dependent on the detection criteria of Ca dip.

      We have indicated each ca dip in Fig 1 and Fig 2.

      As I mentioned above, most of the quantifications are not based on the clear detection criteria. The authors need to re-analyze the data and fix the quantification. Please interpret data and discuss the cellular mechanism of ISO based on the re-analyzed quantification.

      As suggested, we have re-analyzed the MA and MA-related photometry signals. Accordingly, parts of Fig1 and Fig2 have been revised. Although there are some small changes, the main results and conclusions remain unchanged.

      Reviewer #3 (Public review):

      Summary:

      The authors employ a series of well-conceived and well-executed experiments involving photometric imaging of the dentate gyrus and raphe nucleus, as well as cell-type specific genetic manipulations of serotonergic receptors that together serve to directly implicate serotonergic regulation of dentate gyrus (DG) granule (GC) and mossy cell (MC) activity in association with an infra slow oscillation (ISO) of neural activity has been previously linked to general cortical regulation during NREM sleep and microarousals.

      Strengths:

      There are a number of novel and important results, including the modulation of dentage granule cell activity by the infraslow oscillation during NREM sleep, the selective association of different subpopulations of granule cells to microarousals (MA), the anticorrelation of raphe activity with infraslow dentate activity.

      The discussion includes a general survey of ISOs and recent work relating to their expression in other brain areas and other potential neuromodulatory system involvement, as well as possible connections with infraslow oscillations, micro arousals, and sensory sensitivity.

      Weaknesses:

      - The behavioral results showing contextual memory impairment resulting from 5-HT1a knockdown are fine, but are over-interpreted. The term memory consolidation is used several times, as well as references to sleep-dependence. This is not what was tested. The receptor was knocked down, and then 2 weeks later animals were found to have fear conditioning deficits. They can certainly describe this result as indicating a connection between 5-HT1a receptor function and memory performance, but the connection to sleep and consolidation would just be speculation. The fact that 5-HT1a knockdown also impacted DG ISOs does not establish dependency. Some examples of this are:

      – The final conclusion asserts "Together, our study highlights the role of neuromodulation in organizing neuronal activity during sleep and sleep-dependent brain functions, such as memory.", but the reported memory effects (impairment of fear conditioning) were not shown to be explicitly sleep-dependent.

      – Earlier in the discussion it mentions "Finally, we showed that local genetic ablation of 5-HT1a receptors in GCs impaired the ISO and memory consolidation". The effect shown was on general memory performance - consolidation was not specifically implicated.

      – The assertion on page 9 that the results demonstrate "that the 5-HT is directly acting in the DG to gate the oscillations" is a bit strong given the magnitude of effect shown in Fig. 6D, and the absence of demonstration of negative effect on cortical areas that also show ISO activity and could impact DG activity (see requested cortical sigma power analysis).

      – Recent work has shown that abnormal DG GC activity can result from the use of the specific Ca indicator being used (GCaMP6s). (Teng, S., Wang, W., Wen, J.J.J. et al. Expression of GCaMP6s in the dentate gyrus induces tonic-clonic seizures. Sci Rep 14, 8104 (2024). https://doi.org/10.1038/s41598-024-58819-9). The authors of that study found that the effect seemed to be specific to GCaMP6s and that GCaMP6f did not lead to abnormal excitability. Note this is of particular concern given similar infraslow variation of cortical excitability in epilepsy (cf Vanhatalo et al. PNAS 2004). While I don't think that the experiments need to be repeated with a different indicator to address this concern, you should be able to use the 2p GCaMP7 experiments that have already been done to provide additional validation by repeating the analyses done for the GCaMP6s photometry experiments. This should be done anyway to allow appropriate comparison of the 2p and photometry results.

      – While the discussion mentions previous work that has linked ISOs during sleep with regulation of cortical oscillations in the sigma band, oddly no such analysis is performed in the current work even though it is presumably available and would be highly relevant to the interpretation of a number of primary results including the relationship between the ISOs and MAs observed in the DG and similar results reported in other areas, as well as the selective impact of DG 5-HT1a knockdown on DG ISOs. For example, in the initial results describing the cross correlation of calcium activity and EMG/EEG with MA episodes (paragraph 1, page 4), similar results relating brief arousals to the infraslow fluctuation in sleep spindles (sigma band) have been reported also at .02 Hz associated with variation in sensory arousability (cf. Cardis et al., "Cortico-autonomic local arousals and heightened somatosensory arousability during NREMS of mice in neuropathic pain", eLife 2021). It would be important to know whether the current results show similar cortical sigma band correlations. Also, in the results on ISO attenuation following 5-HT1 knockdown on page 7 (fig. 6), how is cortical EEG affected? is ISO still seen in EEG but attenuated in DG?

      – The illustrations of the effect of 5-HT1a knockdown shown in Figure 6 are somewhat misleading. The examples in panels B and C show an effect that is much more dramatic than the overall effect shown in panel D. Panels B and C do not appear to be representative examples. Which of the sample points in panel D are illustrated in panels B, C? it is not appropriate to arbitrarily select two points from different animals for comparison, or worse, to take points from the extremes of the distributions. If the intent is to illustrate what the effect shown in D looks like in the raw data, then you need to select examples that reflect the means shown in panel D. It is also important to show the effect on cortical EEG, particularly in sigma band to see if the effects are restricted to the DG ISOs. It would also be helpful to show that MAs and their correlations as shown in Fig 1 or G as well as broader sleep architecture are not affected.

      – On page 9 of the results it states that GCs and MCs are upregulated during NREM and their activity is abruptly terminated by MAs through a 5-HT mediated mechanism. I didn't see anything showing the 5-HT dependence of the MA activity correlation. The results indicate a reduction in ISO modulation of GC activity but not the MA correlated activity. I would like to see the equivalent of Fig 1,2 G panels with the 5-HT1a manipulation.

      Responses to Revewer#3 have been addressed in the first revision. 

      Reviewer #1 (Recommendations for the authors):

      Minor comment: Several recent publications from different laboratories have shown rhythmic release of norepinephrine (NE) (~0.03 Hz) in the medial prefrontal cortex, the thalamus, and in the locus coeruleus (LC) of the mouse during sleep-wake cycles-> Please add "preoptic area" here

      We have added the citation.

      Reviewer #2 (Recommendations for the authors):

      Minor

      (1) (abstract, page 2 line 9) what kind of "increased activity" did the authors find?

      Increased activity compared to that during wakefulness. We have added this.

      (2) (result, page 4) please define first, early, and late stage of NREM sleep in the methods.

      We have added these in the Methods.

      (3) (result, page 6) please define "the risetime of the phasic increase".

      It refers to the latency between the increase of 5-HT and the MA onset. We have clarified this in the text.

      (4) (supplement Fig 3 legend) please reword "5-HT events" and "5-HT signals" because these are ambiguous.

      We have defined the events in the legend.

      (5) (Fig 5A) please replace the picture without bubbles.

      We have replaced the image in Fig5A.

    1. Author response:

      Reviewer 1:

      A primary limitation of this study, acknowledged by the authors, is its reliance on self-reports of participants’ emotional states. Although considerable effort was made to minimize expectation effects, further research is needed to confirm that the observed behavioral changes reflect genuine alterations in emotional states.

      Thank you very much for raising this point. We fully agree that self-reported emotional states are inherently subjective and that the ramifications of this need to be clarified in the manuscript. However, we would suggest that the focus on self-report may be a strength rather than a limitation. First, the regularities and rules underlying and determining emotional self-report are of primary importance and interest in their own right, and the work presented here does, we believe, shed light on a rich structure present in multivariate timeseries of subjective self-reports and their response to external inputs. Second, there is no clear definition of what a ”genuine emotion state” might be; particularly if there is a discrepancy with self-reported emotions.

      Additionally, the generalizability of the findings to long-term remediation strategies remains an open question.

      Yes, we agree that what we have described is limited to a short-term intervention and change.

      Whether these changes bear on longer-term changes remains to be assessed. Furthermore, the mechanisms or processes that would support such a maintenance are of substantial interest, and will be the focus of future work.

      Second, the statistical analysis, particularly the computational approach, sometimes lacks sufficient detail and refinement. While I will not elaborate on specific points here, one notable issue is the interpretation of the intrinsic matrix (A). The model-free analysis reveals correlations between emotions at a given time or within an emotional state across time points. However, it does not provide evidence to support lagged interactions across states that would justify non-diagonal elements in A. The other result concerning the dynamics matrix only highlights a trend in the dominant eigenvalue, which is difficult to interpret in isolation. The absence of a statistically significant group x intervention interaction furthermore makes this finding a little compelling. This weakens the study’s conclusions about the importance of intrinsic dynamics, as claimed in the title.

      We appreciate the reviewer’s detailed feedback on the statistical analysis and interpretation of the intrinsic dynamics matrix. It is true that the model-free analysis as presented focuses on within-state correlations and that we have not provided such model-free evidence for lagged interactions across states. We do note that the model comparison suggested that the intervention caused changes in the full A matrix. This would be unlikely if there had not been meaningful cross-emotion lagged effects. Similarly, inference of the A matrix could have revealed a diagonal matrix, and we preferred not to impose such an assumption a priori, as it is very restrictive. Nevertheless, in the absence of a statistically significant group x intervention interaction, the findings regarding the A matrix are less compelling than those related to the control analyses. While this is likely due to a lack of statistical power, these are important points which we will consider in more detail in the revision.

      Finally, to avoid potential misunderstandings of their work, the authors should be more careful about their use of terms pertaining to the control theory and take the time to properly define them. For example, the ”controllability” of emotional states can either denote that those states are more changeable (control theory definition), or, conversely, more tightly regulated (common interpretation, as used in the abstract). This is true for numerous terms (stability, sensitivity, Gramian, etc.) for which no clear definition nor references are provided. Readers unfamiliar with the framework of control theory will likely be at a loss without more guidance.

      Thank you for this point. We recognize the potential for misunderstanding due to the dual usage of terms such as ”controllability” and will improve the clarity to avoid any misunderstanding.

      Reviewer 2:

      Acquiring data online inevitably gives rise to selection and self-selection effects. This needs to be acknowledged clearly. Exacerbating this, participant remuneration seems low at an amount below the minimum or living wage in Western countries (do the authors know where their participants came from?).

      Thank you for this point. We certainly agree that different experimental settings can induce different biases, and this is no different for online settings. However, online tasks such as the one used here, have become accepted, and there is now a substantial literature showing that in-lab effects are often well-replicated in online settings (Gillan and Rutledge, 2021) . For the current study, it is not clear that an inperson setting may not induce comparably complex biases, e.g. to do with differences between experimenters. All participants were from the UK. Remuneration rates were comparable to other experimental settings, in keeping with other online studies, UK living wage recommendations, and ultimately determined according to institutional ethical guidance.

      Another concern is that the intervention does not simply take place before the second block begins but is ongoing during the whole of the second block in that it is integrated into the phrasing of the task on each trial. It is therefore somewhat misleading to speak of a period ’after the intervention’, and it would have been interesting to assess the effect of this by including a third group where the phrasing does not change, but the floating leaves intervention takes place.

      Thank you for this point. We acknowledge that the phrasing of the emotion question in the second block may have influenced the observed effects. Including a third group without the reminder would have provided valuable insights and is an important consideration for future studies. We will acknowledge this limitation.

      As mentioned in the Limitations section, observation noise was assumed and not estimated. While this is understandable in this case, the effect of this assumption could have been assessed by simulation with varying levels of observation (and process) noise.

      Thank you for this comment. We would like to clarify that both observation noise and process noise were estimated in the analyses. We will ensure this is emphasized better in the revised version to avoid future misunderstandings.

      Relatedly, the reliance on formal model comparison is unfortunate since the outcome of such comparisons is easily influenced by slight changes to assumptions such as noise levels. An alternative approach would have been to develop a favoured model based on its suitability to address the research question and its ability, established by simulation, to distill relevant changes of behaviour into reliable parameter estimates.

      We agree that model comparison alone is insufficient. This is why we have also included extensive simulations, including posterior predictive checks, and have followed established best-practice procedures (Wilson and Collins, 2019). We have focused on a relatively simple model space to avoid overfitting to the dataset, and hence reduce the risk of spurious findings. While we agree that outcomes will be influenced by underlying assumptions, this would persist with the suggested approach of relying on a favoured model. Simulations themselves rely on predefined structures and noise specifications, which inherently shape parameter recovery and inference. Relying only on a favoured model might risk model misspecification, whereby the model may not actually capture the data, and the parameters intended to capture the intervention effect could be confounded. We will clarify the reasoning behind our approach in the revised version.

      The statistical analyses clearly show the limitations of classical statistical testing with highly complex models of the kind the authors (commendably) use. Hunting for statistically significant interactions in a multivariate repeated-measures design relying on inputs from time seriesderived point estimates is a difficult proposition. While the authors make the best of the bad situation they create by using null-hypothesis significance testing, a more promising approach would have been to estimate parameters using a sampler like Stan or PyMC and then draw conclusions based on posterior predictive simulations.

      This comment raises several interesting points. First, we agree that the value of classical test on individual parameters within such complex situations is limited. This is why our main focus is on global measures like model comparison. Our use of the classical tests is more to support the understanding of the nature of the data, i.e. they have a more descriptive aim. We will hope to clarify this further in the revision. Second, in terms of sampling, we would like to emphasize that the Kalman filter is both efficient and analytical tractable, making it well-suited to our data and research question. It may have been possible to use sampling to obtain posterior distributions rather than point estimates. However, we did not judge this to be worth the (substantial) additional computational cost.

      Reviewer 3:

      An interesting but perhaps at present slightly confusing aspect of their described results relates to the ’controllability’ of emotions, which they define as their susceptibility to external inputs. Readers should note this definition is (as I understand it) quite distinct from, and sometimes even orthogonal to, concepts of emotional control in the emotion literature, which refer to intentional control of emotions (by emotion regulation strategies such as distancing). The authors also use this second meaning in the discussion. Because of the centrality of control/controllability (in both meanings) to this paper, at present it is key for readers to bear these dual meanings in mind for juxtaposed results that distancing ”reduces controllability” while causing ”enhanced emotional control”.

      We fully agree with the reviewer’s observation that ”controllability” can be interpreted in different ways. we will revise the text to ensure consistent usage and explicitly state the distinction between the control theory definition of controllability and its interpretation in the emotion regulation literature.

      As above the authors use an active control - a relaxation intervention - which is extremely closely matched with their active intervention (and a major strength). However, there was an additional difference between the groups (as I currently understand it): ”in the group allocated to the distancing intervention, the phrasing of the question about their feelings in the second video block reminded participants about the intervention, stating: ”You observed your emotions and let them pass like the leaves floating by on the stream.” I do wonder if the effects of distancing also have been partially driven by some degree of reappraisal (considered a separate emotion regulation strategy) since this reminder might have evoked retrospective changes in ratings.

      We appreciate this substantial point. While our study was designed to isolate the effects of distancing, we acknowledge that elements of reappraisal may also have influenced the results. We will discuss this in the revised version. Additionally, as noted in our response to Reviewer 2, including a third group without the reminder could have provided valuable information, and we consider this to be an important direction for future research.

      Not necessarily a weakness, but an unanswered question is exactly how distancing is producing these effects. As the authors point out, there is a possibility that eye-movement avoidance of the more emotionally salient aspects of scenes could be changing participants’ exposure to the emotions somewhat. Not discussed by the authors, but possibly relevant, is the literature on differences between emotion types on oculomotor avoidance, which could have contributed to differential effects on different emotions.

      Thank you very much for these suggestions. It is very true that different emotions can elicit different patterns of oculomotor avoidance, which could have contributed to our observed effects. Research suggests that emotions such as disgust are associated with visual avoidance (Armstrong et al., 2014; Dalmaijer et al., 2021), whereas anxiety and other negative emotions exhibited increased attentional bias after fear conditioning (Kelly and Forsyth, 2009; Pischek-Simpson et al., 2009). It would be very interesting to repeat the experiment with eye-tracking to examine these possibilities. What would be particularly interesting to examine is whether a distancing intervention induces multiple, emotionally-specific behaviours, or not.

      References

      Armstrong, T., McClenahan, L., Kittle, J., and Olatunji, B. O. (2014). Don’t look now! Oculomotor avoidance as a conditioned disgust response. Emotion (Washington, D.C.), 14(1):95–104.

      Dalmaijer, E. S., Lee, A., Leiter, R., Brown, Z., and Armstrong, T. (2021). Forever yuck: Oculomotor avoidance of disgusting stimuli resists habituation. Journal of Experimental Psychology. General, 150(8):1598– 1611.

      Gillan, C. M. and Rutledge, R. B. (2021). Smartphones and the Neuroscience of Mental Health. Annual Review of Neuroscience, 44(Volume 44, 2021):129–151. Publisher: Annual Reviews.

      Kelly, M. M. and Forsyth, J. P. (2009). Associations between emotional avoidance, anxiety sensitivity, and reactions to an observational fear challenge procedure. Behaviour Research and Therapy, 47(4):331–338. Place: Netherlands Publisher: Elsevier Science.

      Pischek-Simpson, L. K., Boschen, M. J., Neumann, D. L., and Waters, A. M. (2009). The development of an attentional bias for angry faces following Pavlovian fear conditioning. Behaviour Research and Therapy, 47(4):322–330.

      Wilson, R. C. and Collins, A. G. (2019). Ten simple rules for the computational modeling of behavioral data. eLife, 8:e49547. Publisher: eLife Sciences Publications, Ltd.

    1. Author response:

      The following is the authors’ response to the previous reviews.

      Discussion: Could the authors discuss more the findings about Flavobacterium? Has it ever been associated with the urogenital tract?

      Page 13-14, line 252-268:

      ‘The genus Flavobacterium was defined in 1923 to encompass gram-negative, non-spore-forming rods, of yellow pigment (44). The inclusiveness of this definition resulted in a collective of heterogenous species. By 1984 the genus had been restricted to those that were also non-motile and non-gliding (44). More recently, with an increase in genomic profiling, many species previously considered to be of genus Flavobacterium have been reclassified to genus Chryseobacterium, Cytophaga, and Weeksella (45). Increasing numbers of Flavobacterium species are being discovered such as gondwanense, Collinsii, branchiarum, branchiicola, salegens and scophthalmum (46) (47) (48). The allocation of Flavobacterium aquatile to this genus remains controversial due to its motility (49). Flavobacterium species are widely distributed in the environment including soil, fresh water and saltwater habitats (50) (51).  There are many reports of pathogenic infections of Flavobacterium species in fish, however human infections are rare (48).  A handful of case reports have described opportunistic infections to include pneumonia, urinary tract infection, peritonitis and meningitis (52) (53) (54) (55). Flavobacterium lindanitolerans and Flavobacterium ceti have been isolated as causative agents in some (56) (54). Case reports also describe Flavobacterium odoratum as a causative agent in urinary tract infection, most often in the immunocompromised or those with indwelling devices (57) (58) (59). However, this was one of many species previously of genus Flavobacterium reclassified, in this case to genus Myroides (60). Notably in our sample participants were asymptomatic of urinary tract infection’. 

      What is the relative abundance of Flavobacterium in the present study: this type of bacterium has been previously associated with contaminations (PMID: 25387460, 30497919).

      Page 13, line 244-247:

      ‘The Flavobacterium genus taxon we identified as significantly associated with abnormal semen quality and sperm morphology was present in 36.28% of the samples, with a mean relative abundance of 1.15% in those samples. This information and the mention of previous findings of Flavibacterium in contamination studies have been added to the discussion’.

      Figure 1: Increase the size of panel A.

      Amended.

      Figure 3: Can the authors indicate the relative abundance of each genus/species by the size of the node?

      Co-occurrence network figure has been modified to display relative abundance of nodes.

      Supplementary data: I don't see anywhere the decontam plots.

      Decontam plots as suggested in the package vignette https://benjjneb.github.io/decontam/vignettes/decontam_intro.html have been added in the GitHub repository. For practical purposes, the plot corresponding to the frequency testing only display a random subset (n=15) of the total taxa (n=82) flagged by this test as contaminants. The. .csv files with the outputs of each filter are available in the same directory

      Line 12: Check the sentence

      Line 15: Genera in italics

      Line 33: Change "overall quality of the spermatozoa" to "overall semen quality"

      Lines 18-20: Rephrase

      Line 87: 28F-Borrelia

      Line 134: "Seminal microbiota" or "Composition of the seminal microbiota"

      Line 159: "These included ... genera"

      Line 166: "Of note, Flavobacterium genus was..."

      Lines 187-188: Check sentence

      Thank you, these have been amended

    1. Author response:

      The following is the authors’ response to the original reviews.

      Public Reviews

      Reviewer #1:

      The biggest concern in this regard is: that almost all the characterization is performed in cultured dissociated neurons…

      While it is true that most of the characterization done in this paper was in cultured neurons, we verified that PFE3 mediates functional ablation of excitatory synapses in vivo (Fig. 3). Furthermore, the GPHN.FingR-XIAP (GFE3), a protein very similar to the complex formed following activation of paGFE3 and chGFE3, has been extensively tested by us and others in vivo(1-4).

      Reviewer #2:

      For paGFE3 and chGFE3, the E3 ligase (RING domain of Mdm2) is overexpressed throughout cells as a separate construct. Although the authors show that Gephyrin is not significantly reduced without light or chemical activation, it remains possible that other proteins could be ubiquitinated due to the overexpressed E3 domain.

      In our previous paper(1), we tested neurons under 3 conditions: 1. expressing a construct similar to PBP-E3, consisting of a FingR with a randomized binding domain fused to the same XIAP ring domain used in paGFE3 and chGFE3 (RAND-E3). 2. expressing GPHN.FingR. 3. not expressing any exogenous proteins (control neurons). In each case, we found that expression of a variety of excitatory and inhibitory synaptic proteins was not significantly different when exposed to either of these exogenous proteins compared with control neurons.

      Recommendations for the authors:

      (1)  Can the authors use the tools to show the ablation of endogenous PSD95 without FingR overexpression?

      The experiments described in Fig. 3 are an example of this type of experiment. Furthermore, the PSD-95.FingR was extensively tested and has been used in dozens of studies without any indication that its expression alters cellular function or morphology. Note also that the transcriptional regulation system of PSD-95.FingR limits the expression such that there is virtually no background, so it is not really being overexpressed.

      (2) I am missing some control experiments for the excitatory synapses ablator- can the authors show that cells transfected with the plasmid and no DOX, show similar numbers of synapses as neurons without transfection?

      We have added an experiment comparing cells expressing PSD-95.FingR alone, and others expressing PFE3 with no Dox. We found that the two types of cells express amounts of PSD-95 that are not significantly different (Fig. S2L).

      (3) I am not quite sure how they used paired statistics on staining since they could only stain the cell at the end of the experiment. Are the comparisons performed on different cells?

      These experiments were done on the same cells. However, the methods of labeling were different- the initial counting of synapses was done, so we agree with the reviewer that it would be best not to use a paired analysis. Accordingly, we have changed Figs. 1F and 2D.

    1. Author response:

      The following is the authors’ response to the original reviews.

      Public Reviews:

      Reviewer #1 (Public review):

      Summary:

      The paper develops a phase method to obtain the excitatory and inhibitory afferents to certain neuron populations in the brainstem. The inferred contributions are then compared to the results of voltage clamp and current clamp experiments measuring the synaptic contributions to post-I, aug-E, and ramp-I neurons.

      Strengths:

      The electrophysiology part of the paper is sound and reports novel features with respect to earlier work by JC Smith et al 2012, Paton et al 2022 (and others) who have mapped circuits of the respiratory central pattern generator. Measurements on ramp-I neurons, late-I neurons, and two types of post-I neurons in Figure 2 besides measurements of synaptic inputs to these neurons in Figure 5 are to my knowledge new.

      Weaknesses:

      The phase method for inferring synaptic conductances fails to convince. The method rests on many layers of assumptions and the inferred connections in Figure 4 remain speculative. 

      We hope that the additional method justifications now incorporated in the manuscript will make our method more convincing and change this reviewer’s opinion.

      To be convincing, such a method ought to be tested first on a model CPG with known connectivity to assess how good it is at inferring known connections back from the analysis of spatio-temporal oscillations. 

      We respectfully disagree with this critique. Existing respiratory CPG models are based on a conductance-based formalism. Since the neurons recorded using our approach are typically hyperpolarized, in the model at the corresponding values of the membrane potential, all voltage-gated channels will be deactivated. Therefore, the current balance equation used in this study will closely align with the descriptions used in these models. This alignment will result in a near-exact correspondence between the synaptic conductance values inferred by our method and their model counterparts. However, we believe that such a demonstration, while predetermined to be successful, would not be convincing for a computationally savvy audience.

      For biological data, once the network connectivity has been inferred as claimed, the straightforward validation is to reconstruct the experimental oscillations (Figure 2) noting that Rybak et al (Rybak, Paton Schwaber J. Neurophysiol. 77, 1994 (1997)) have already derived models for the respiratory neurons.

      Running such simulations is beyond the scope of this paper, which focuses on our methods for extracting synaptic conductances during network activity cycles from intracellular recordings. However, the existing, largely speculative, respiratory CPG models can be validated against the "ground truth" of the inferences we present here. To illustrate how our circuit connection motifs elaborate on existing respiratory CPG models, we have now included a combinatorial connectivity model in the manuscript derived from the connectivity motifs in the supplemental figures (Figure 4 Supplemental Figure 1) with comparisons to the model schematic utilized by Rybak, Smith et al. in simulation studies to simulate a rhythmic three-phase respiratory pattern. There are conserved mechanistically important connectivity features between these schematics that it is possible to suggest that our more elaborate connectivity scheme would almost certainly generate the three-phase patterns of neuronal firing and network rhythmic activity.

      The transformation from time to phase space, unlike in the Kuramoto model, is not justified here (Line 94) and is wrong. The underpinning idea that "the synaptic conductances depend on the cycle phase and not on time explicitly" is flawed because synapses have characteristic decay times and delays to response which remain fixed when the period of network oscillations increases. Synaptic properties depend on time and not on phase in the network. 

      The primary assumption of our method is that all variables within the system are periodic functions of time. Therefore, the inputs to the recorded neuron, at minimum, are fully defined by the oscillation's phase. While the transduction of the input into postsynaptic conductance may have its own time dependence, the characteristic timescale of synaptic dynamics (10-20 ms, as suggested by the reviewer) is much smaller than the period of network oscillations. This is certainly true for the test system we are using. This valid assumption of our method is now further clarified in the revised manuscript.

      One major consequence relevant to the present identification of excitatory or inhibitory behaviour, is that it cannot account for change in the behaviour of inhibitory synapses - from inhibitory to excitatory action - when the inhibitory decay time becomes commensurable to the period of network oscillations (Wang & Buzsaki Journal of Neuroscience 16, 6402 (1996), van Vreeswijk et al. J. Comp. Neuroscience 1,313 (1994), Borgers and Kopell Neural Comput. 15, 2003). 

      Our method focuses on recovering synaptic conductances rather than directly measuring presynaptic inputs. The conversion of presynaptic inputs (spike trains) into postsynaptic conductances involves its own time scales. This can lead to complex dynamical effects when synaptic delay or decay times are comparable to the oscillation period. In such cases, although our conductance calculation remains accurate, we might misinterpret the phase of the presynaptic input, as it may not align with the phase of the postsynaptic conductance peak. However, this discrepancy is not significant for applications where the synaptic delay/decay times are considerably shorter than the oscillation period.

      In addition, even small delays in the inhibitory synapse response relative to the pre-synaptic action potential also produce in-phase synchronization (Chauhan et al., Sci. Rep. 8, 11431 (2018); Borgers and Kopell, Neural Comput. 15, 509 (2003)). 

      The reviewer is referring to a phenomenon involving interspike synchronization that generates oscillations with very short periods, comparable to synaptic delay times. Our technique, in contrast, is designed for systems of asynchronously firing neurons forming functional populations whose oscillations emerge on a much longer time scale or are driven by periodic stimuli (e.g., sensory input) with a period much longer than the interspike intervals of individual neurons. The time scale difference we are addressing in our test system is two orders of magnitude.

      The present assumptions are way too simplistic because you cannot account for these commensurability effects with a single parameter like the network phase. There is therefore little confidence that this model can reliably distinguish excitatory from inhibitory synapses when their dynamic properties are not properly taken into account.

      As we explained in our previous responses, in our test system, we can reliably resolve post-synaptic conductance variations at 1/100th of the oscillation period. This is due to a >100X time scale difference between the oscillation period and the synaptic/membrane decay time constants. The efficiency of our method in other systems may vary depending on the relationship between the membrane time constant and the oscillation period. The text now provides a clearer discussion of the method's resolution.

      To interpret post-synaptic conductance profiles in terms of presynaptic inputs (e.g., to reconstruct connectivity), one should consider the input-to-conductance transduction processes.We did not aim to provide a general solution for this step in our paper (hence the title) as these processes may differ for different neurotransmitter systems and involve individual dynamics. However, in our test system, as discussed, the oscillation period is much longer than the synaptic decay times of the fast-acting neurotransmitters involved (i.e., glutamate, glycine, and GABA). This means that the possible phase difference between presynaptic neuronal activity and the corresponding postsynaptic conductances is negligible. This allows for a straightforward interpretation of conductance profiles in terms of the functional connectivity of the network. In other systems, the situation may, of course, be different and additional efforts for inferring the presynaptic activity from postsynaptic conductance profiles may be necessary.

      Line 82, Equation 1 makes extremely crude assumptions that the displacement current (CdV/dt) is negligible and that the ion channel currents are all negligible. Vm(t) is also not defined. The assumption that the activation/inactivation times of all ion channels are small compared to the 10-20ms decay time of synaptic currents is not true in general. Same for the displacement current. The leak conductance is typically g~0.05-0.09ms/cm^2 while C~1uF/cm^2. Therefore the ratio C/g leak is in the 10-20ms range - the same as the typical docking neurotransmitter time in synapses.

      We have explicitly included capacitive current in the model formulation and described the time scale separation requirement that justifies our approach. Additionally, we now explain within the text that the current injection protocol involves hyperpolarizing the recorded neuron to ensure voltage-dependent currents remain deactivated during the recording. The remarkable linearity of the current-voltage relationships observed in the vast majority of recorded neurons provides post-hoc evidence supporting this assumption. For further details, please refer to our responses to Reviewer 2 and Figure 1 Supplemental Figure 1 as an example.

      Models of brainstem CPG circuits have been known to exist for decades: JC Smith et al 2012, Paton et al 2022, Bellingham Clin. Exp. Pharm. And Physiol. 25, 847 (1998); Rubin et al., J. Neurophysiol. 101, 2146 (2009) among others. The present paper does not discuss existing knowledge on respiratory networks and gives the impression of reinventing the wheel from scratch. How will this paper add to existing knowledge?

      We appreciate this comment, and in fact, in the original submitted version of this manuscript, we discussed existing knowledge of respiratory networks, but there was editorial concern that this material was above and beyond the technical aspects that we were trying to convey and therefore may detract from the paper as a technical submission. To strike a balance, we have re-incorporated some of this material in abbreviated form into the Discussion section “Implications of reconstructed synaptic conductance profiles for respiratory functional circuit architecture”.

      Reviewer #2 (Public review):

      Summary:

      By measuring intracellular changes in membrane voltage from a single neuron of the medulla the authors describe a method for determining the balance of excitatory and inhibitory synaptic drive onto a single neuron within this important brain region.

      Strengths:

      This approach could be valuable in describing the microcircuits that generate rhythms within this respiratory control centre. This method could more generally be used to enable microcircuits to be studied without the need for time-consuming anatomical tracing or other more involved electrophysiological techniques.

      Weaknesses:

      This approach involves assuming the reversal potential that is associated with the different permeant ions that underlie the excitation and inhibition as well as the application of Ohms law to estimate the contribution of excitation and inhibitory conductance. My first concern is that this approach relies on a linear I-V relationship between the measured voltage and the estimated reversal potential. However, open rectification is a feature of any I-V relationship generated by asymmetric distributions of ions (see the GHK current equation) and will therefore be a particular issue for the inhibition resulting from asymmetrical Cl- ion gradients across GABA-A receptors. The mixed cation conductance that underlies most synaptic excitation will also generate a non-linear I-V relationship due to the inward rectification associated with the polyamine block of AMPA receptors. Could the authors please speculate what impact these non-linearities could have on results obtained using their approach?

      In our Figure 1 Supplemental Figure 1, we illustrated that I-V relationships for each particular phase of the cycle (except for transitions between inspiration and expiration where our error estimates are greatest) are remarkably linear. 

      In Author response iamge 1 we compare the I-V dependence for Cl- as predicted by the GHK equation and its linear approximation using constant conductance and the Cl- Nernst potential. One can see that in the typical range of voltages used (shown by solid black vertical lines), the linear approximation appears quite adequate.

      Author response image 1.

      This approach has similarities to earlier studies undertaken in the visual cortex that estimated the excitatory and inhibitory synaptic conductance changes that contributed to membrane voltage changes during receptive field stimulation. However, these approaches also involved the recording of transmembrane current changes during visual stimulation that were undertaken in voltage-clamp at various command voltages to estimate the underlying conductance changes. Molkov et al have attempted to essentially deconvolve the underlying conductance changes without this information and I am concerned that this simply may not be possible. 

      This was why we compared the results of our reconstructions applied to current- and voltage-clamp recordings from the same neurons and we found, as illustrated, that the synaptic conductance profiles are qualitatively identical with both techniques.

      The current balance equation (1) cited in this study is based on the parallel conductance model developed by Hodgkin & Huxley. However, one key element of the HH equations is the inclusion of an estimate of the capacitive current generated due to the change in voltage across the membrane capacitance. I would always consider this to be the most important motivation for the development of the voltage-clamp technique in the 1930's. Indeed, without subtraction of the membrane capacitance, it is not possible to isolate the transmembrane current in the way that previous studies have done. In the current study, I feel it is important that the voltage change due to capacitive currents is taken into consideration in some way before the contribution of the underlying conductance changes are inferred.

      We have incorporated the capacitive current into the initial model formulation and established explicit requirements for time scale separation. These requirements justify the application of our method. Specifically, the membrane time constant (C/g ~ 10ms in our test system) must be substantially shorter than the period of network oscillations (T ~ 2s in our test system). Under this condition, aggregate variations in synaptic conductances can be considered slow, allowing us to treat membrane voltage as being in instantaneous equilibrium. This defines the time resolution of our method. Please refer to our responses to Reviewer 1 and the revised manuscript text for a more detailed explanation.

      Studies using acute slicing preparations to examine circuit effects have often been limited to the study of small microcircuits - especially feedforward and feedback interneuron circuits. It is widely accepted that any information gained from this approach will always be compromised by the absence of patterned afferent input from outside the brain region being studied. In this study, descending control from the Pons and the neocortex will not be contributing much to the synaptic drive and ascending information from respiratory muscles will also be absent completely. This may not have been such a major concern if this study was limited to demonstrating the feasibility of a methodological approach. However, this limitation does need to be considered when using an approach of this type to speculate on the prevalence of specific circuit motifs within the medulla (Figure 4). Therefore, I would argue that some discussion of this limitation should be included in this manuscript.

      Our experimental brainstem-spinal cord in situ preparation does include important inputs from the pons that are necessary to generate the 3-phase respiratory pattern (e.g., Smith et al. (2013). Brainstem respiratory networks: building blocks and microcircuits. Trends Neurosci, 36(3), 152-162), but we agree that other inputs such as from midbrain and cortex as well as important peripheral afferents are absent, and we have now noted this limitation in the text at the end of the new section “Implications of reconstructed synaptic conductance profiles for respiratory functional circuit architecture“. We show specific circuit motifs simply to illustrate how our readout of synaptic conductances from single neurons and the information on the main neuronal activity patterns in our experimental preparation can be interpreted. We thought that it would be useful to illustrate and interpret inferred connectivity motifs as an output of our methodological approach. As we now discuss in the section “Implications of reconstructed synaptic conductance profiles for respiratory functional circuit architecture” in response to Reviewer #1, our circuit motifs are consistent with some sets of connections that have been speculated in the literature, but they also provide some novel information about connectivity that we have been able to infer for respiratory circuits from the complex sets of synaptic conductances indicated by our approach. 

      Recommendations for the authors:

      Reviewer #1 (Recommendations for the authors):

      Major comments:

      (1) My recommendation is to clarify how each neuron population was identified. Individual populations are very hard to identify based on morphology alone in brain slices such as Supplemental Figure 1. I assume the authors identified each population based on their phase difference relative to the inspiratory pulse in the phrenic nerve. This ought to be clarified. 

      Neuronal populations were classified based on their firing patterns within the respiratory cycle. Immunohistochemistry was only used for post-hoc identification of the transmitter phenotype in select neurons. Specifically, recorded neurons were categorized according to the phase range of the respiratory cycle in which they fired and their firing pattern during that range. For example, neurons firing during inspiration (synchronously with the phrenic nerve) with a progressively increasing firing rate were classified as ramp-I, etc., as illustrated in the figure depicting phase-dependent firing patterns. This classification is detailed in the "Firing patterns of respiratory interneurons" sub-section.

      It would also be beneficial to discuss the benefits and limitations of using this preparation relative to brainstem slices and in-vivo preparations (e.g. Moraes et al. J. Physiol. 599, 3237 (2021)) for measuring live network activity.

      We provided the reference to an important recent review (Paton et al. 2022, Advancing respiratory-cardiovascular physiology with the working heart-brainstem preparation over 25 years. J Physiol, 600(9), 2049-2075) on the benefits and limitations of using the in situ rodent brainstem-spinal cord preparation employed in our study. 

      (2) The background on inference methods is similarly thin. The works in line 47 are mainly experimental characterizations of excitatory and inhibitory cells. Techniques for estimating network conductances/parameters ought to be covered. One reference that comes to mind: Armstrong, E. Statistical data assimilation for estimating electrophysiology simultaneously with connectivity within a biological neuronal network. Physical Review E 101, 012415, 2020.

      Our technique is not intended to estimate synaptic connections between neurons from paired recordings. Instead, we calculate the dynamics of inhibitory and excitatory synaptic conductances that result from many concurrent synaptic inputs representing aggregate activities of the functionally interacting populations. The previous studies that we cited are the ones that have direct or indirect relation to this paradigm. 

      (3) How the "patterns of synaptic conductances" in phase diagrams imply the network connectivity (l.244) is not clear. Are the patterns of "activity patterns" depicted in Figure 2 the only neuron populations driving the postsynaptic neurons in Figure 4? 

      Figure 2 shows all of the basic firing patterns that we have recorded in our experimental preparation. So, yes, assuming that all periodic inputs in this network originate from within the network, those 6 populations are the main sources of the corresponding patterns.

      The methodology for constructing the networks is unclear, 

      This is explained in detail in the section "Synaptic Conductances and Functional Connectome of Respiratory Interneurons". Specifically, when a neuron with a given firing pattern (and thus belonging to a corresponding population, e.g., pre-I/I) exhibits excitatory or inhibitory conductance during a particular phase of the respiratory cycle (e.g., inhibition during the first half of expiration, as in Figure 3A1), we infer that the population with the same firing pattern receives input from a population with an activity pattern matching the postsynaptic conductance profile (e.g., the pre-I/I population receives post-I inhibition, as in Figure 4A1).

      yet 6 lines later (l.251) the narrative jumps to the conclusion that "the information on inhibitory transmitter phenotypes...indeed corroborates that subsets of the presynaptic neurons are inhibitory" and further "conductance profiles, which gives additional confidence in the correlation between pre-synaptic firing patterns and likely post-synaptic interactions". The method also blends in empirical information from immune labelling. It is unclear what method can actually infer on its own.

      The functional connections that we were able to infer implied that neurons with specific firing patterns (e.g., post-I neurons) must include neurons with specific transmitter phenotypes (e.g., inhibitory). Immune labeling results were used to show that there are indeed neurons having corresponding firing patterns and neurotransmitter phenotypes. It has nothing to do with the inference method. It just shows that our assumption about various inhibitory inputs originating from within the network is plausible.

      (4) Figure 3 - why does the Early-I population which is connected by the same mutually inhibitory links as Post-I and Aug-E within the respiratory CPG have the opposite conductance activation sequence as post-I and aug-E. Namely, it receives excitatory input at phases 0,1,2 when post-I and aug-E receive inhibitory input?

      We added the section “Implications of reconstructed synaptic conductance profiles for respiratory functional circuit architecture” discussing the correspondence and inconsistencies between our findings and existing respiratory CPG models (see Figure 4 Supplemenntal Figure 1). For this specific question, phase 0, 1 and 2 represent the same phase of the respiratory cycle corresponding to a transition from expiration to inspiration. According to the Rybak et al. models, the early-I population receives excitation from the pre-I/I population which is active at the E-I transition and throughout the entire inspiratory phase of the cycle. This is largely consistent with our findings shown in Figure 3. Also, according to Rybak et al., post-I and aug-E populations are inhibited by early-I neurons, which is also consistent with inspiratory inhibition in all examples of these neurons that we show in Figure 3. As noted in other responses to the reviewers’ comments, we have now discussed in the “Implications of reconstructed synaptic conductance profiles for respiratory functional circuit architecture” which covers some comparisons to previously inferred connectivity in the respiratory network.

      Minor comments:

      (1) l.39 - The terminology "patterns of inhibitory and excitatory synaptic conductances" used throughout the manuscript (l.66, 241, 244, 259...) is vague.

      We defined this terminology in the updated version.

      (2) Figure 1 what is the integration time of the moving median in Figure 1a?

      0.1s. Now included in the figure legend.

      (3) L.128 "rhythmic inspiratory neuron" which one is this post-I, aug-E, early-I?

      This example demonstrates a pre-I/I firing pattern, as the neuron begins firing slightly before the phrenic burst and continues throughout inspiration (as defined by phrenic nerve activity). However, this is merely an arbitrary example used to illustrate the methodology. The actual firing pattern of the recorded neuron is not considered in any way for synaptic conductance inference.

      (4) Figure 3 What the panel labelling means A1, B1, A2, etc. is not disclosed in the caption.

      These labels are used in the text to refer to specific examples. Now it is explained in the caption that the letter corresponds to the firing phenotype indicated on the top of each column and the digit refers to the example number.

      (5) L.129/ L.133 - the diagram of the medulla in Supplementary Figure 1 ought to be inserted early on in the main text when introducing the respiratory CPG, phrenic and vagal signals.

      This is a good suggestion and we have linked this figure specifically to Figure 2 as Figure 2 Supplemental Figure 1 in the main text to better orient readers.

      (6) L. 457 - Reference needed on reversal potentials.

      We report what we observed, so it is unclear what reference the reviewer means.

    1. Author response:

      The following is the authors’ response to the previous reviews.

      eLife Assessment

      This neuroimaging and electrophysiology study in a small cohort of congenital cataract patients with sight recovery aims to characterize the effects of early visual deprivation on excitatory and inhibitory balance in visual cortex. While contrasting sight-recovery with visually intact controls suggested the existence of persistent alterations in Glx/GABA ratio and aperiodic EEG signals, it provided only incomplete evidence supporting claims about the effects of early deprivation itself. The reported data were considered valuable, given the rare study population. However, the small sample sizes, lack of a specific control cohort and multiple methodological limitations will likely restrict usefulness to scientists working in this particular subfield.

      We thank the reviewing editors for their consideration and updated assessment of our manuscript after its first revision.

      In order to assess the effects of early deprivation, we included an age-matched, normally sighted control group recruited from the same community, measured in the same scanner and laboratory. This study design is analogous to numerous studies in permanently congenitally blind humans, which typically recruited sighted controls, but hardly ever individuals with a different, e.g. late blindness history. In order to improve the specificity of our conclusions, we used a frontal cortex voxel in addition to a visual cortex voxel (MRS). Analogously, we separately analyzed occipital and frontal electrodes (EEG).

      Moreover, we relate our findings in congenital cataract reversal individuals to findings in the literature on permanent congenital blindness. Note, there are, to the best of our knowledge, neither MRS nor resting-state EEG studies in individuals with permanent late blindness.

      Our participants necessarily have nystagmus and low visual acuity due to their congenital deprivation phase, and the existence of nystagmus is a recruitment criterion to diagnose congenital cataracts.

      It might be interesting for future studies to investigate individuals with transient late blindness. However, such a study would be ill-motivated had we not found differences between the most “extreme” of congenital visual deprivation conditions and normally sighted individuals (analogous to why earlier research on permanent blindness investigated permanent congenitally blind humans first, rather than permanently late blind humans, or both in the same study). Any result of these future work would need the reference to our study, and neither results in these additional groups would invalidate our findings.

      Since all our congenital cataract reversal individuals by definition had visual impairments, we included an eyes closed condition, both in the MRS and EEG assessment. Any group effect during the eyes closed condition cannot be due to visual acuity deficits changing the bottom-up driven visual activation.

      As we detail in response to review 3, our EEG analyses followed the standards in the field.

      Public Reviews:

      Reviewer #1 (Public review):

      Summary

      In this human neuroimaging and electrophysiology study, the authors aimed to characterise effects of a period of visual deprivation in the sensitive period on excitatory and inhibitory balance in the visual cortex. They attempted to do so by comparing neurochemistry conditions ('eyes open', 'eyes closed') and resting state, and visually evoked EEG activity between ten congenital cataract patients with recovered sight (CC), and ten age-matched control participants (SC) with normal sight.

      First, they used magnetic resonance spectroscopy to measure in vivo neurochemistry from two locations, the primary location of interest in the visual cortex, and a control location in the frontal cortex. Such voxels are used to provide a control for the spatial specificity of any effects, because the single-voxel MRS method provides a single sampling location. Using MR-visible proxies of excitatory and inhibitory neurotransmission, Glx and GABA+ respectively, the authors report no group effects in GABA+ or Glx, no difference in the functional conditions 'eyes closed' and 'eyes open'. They found an effect of group in the ratio of Glx/GABA+ and no similar effect in the control voxel location. They then perform multiple exploratory correlations between MRS measures and visual acuity, and report a weak positive correlation between the 'eyes open' condition and visual acuity in CC participants.

      The same participants then took part in an EEG experiment. The authors selected two electrodes placed in the visual cortex for analysis and report a group difference in an EEG index of neural activity, the aperiodic intercept, as well as the aperiodic slope, considered a proxy for cortical inhibition. Control electrodes in the frontal region did not present with the same pattern. They report an exploratory correlation between the aperiodic intercept and Glx in one out of three EEG conditions.

      The authors report the difference in E/I ratio, and interpret the lower E/I ratio as representing an adaptation to visual deprivation, which would have initially caused a higher E/I ratio. Although intriguing, the strength of evidence in support of this view is not strong. Amongst the limitations are the low sample size, a critical control cohort that could provide evidence for higher E/I ratio in CC patients without recovered sight for example, and lower data quality in the control voxel. Nevertheless, the study provides a rare and valuable insight into experience-dependent plasticity in the human brain.

      Strengths of study

      How sensitive period experience shapes the developing brain is an enduring and important question in neuroscience. This question has been particularly difficult to investigate in humans. The authors recruited a small number of sight-recovered participants with bilateral congenital cataracts to investigate the effect of sensitive period deprivation on the balance of excitation and inhibition in the visual brain using measures of brain chemistry and brain electrophysiology. The research is novel, and the paper was interesting and well written.

      Limitations

      Low sample size. Ten for CC and ten for SC, and further two SC participants were rejected due to lack of frontal control voxel data. The sample size limits the statistical power of the dataset and increases the likelihood of effect inflation.

      In the updated manuscript, the authors have provided justification for their sample size by pointing to prior studies and the inherent difficulties in recruiting individuals with bilateral congenital cataracts. Importantly, this highlights the value the study brings to the field while also acknowledging the need to replicate the effects in a larger cohort.

      Lack of specific control cohort. The control cohort has normal vision. The control cohort is not specific enough to distinguish between people with sight loss due to different causes and patients with congenital cataracts with co-morbidities. Further data from a more specific populations, such as patients whose cataracts have not been removed, with developmental cataracts, or congenitally blind participants, would greatly improve the interpretability of the main finding. The lack of a more specific control cohort is a major caveat that limits a conclusive interpretation of the results.

      In the updated version, the authors have indicated that future studies can pursue comparisons between congenital cataract participants and cohorts with later sight loss.

      MRS data quality differences. Data quality in the control voxel appears worse than in the visual cortex voxel. The frontal cortex MRS spectrum shows far broader linewidth than the visual cortex (Supplementary Figures). Compared to the visual voxel, the frontal cortex voxel has less defined Glx and GABA+ peaks; lower GABA+ and Glx concentrations, lower NAA SNR values; lower NAA concentrations. If the data quality is a lot worse in the FC, then small effects may not be detectable.

      In the updated version, the authors have added more information that informs the reader of the MRS quality differences between voxel locations. This increases the transparency of their reporting and enhances the assessment of the results.

      Because of the direction of the difference in E/I, the authors interpret their findings as representing signatures of sight improvement after surgery without further evidence, either within the study or from the literature. However, the literature suggests that plasticity and visual deprivation drives the E/I index up rather than down. Decreasing GABA+ is thought to facilitate experience dependent remodelling. What evidence is there that cortical inhibition increases in response to a visual cortex that is over-sensitised to due congenital cataracts? Without further experimental or literature support this interpretation remains very speculative.

      The updated manuscript contains key reference from non-human work to justify their interpretation.

      Heterogeneity in patient group. Congenital cataract (CC) patients experienced a variety of duration of visual impairment and were of different ages. They presented with co-morbidities (absorbed lens, strabismus, nystagmus). Strabismus has been associated with abnormalities in GABAergic inhibition in the visual cortex. The possible interactions with residual vision and confounds of co-morbidities are not experimentally controlled for in the correlations, and not discussed.

      The updated document has addressed this caveat.

      Multiple exploratory correlations were performed to relate MRS measures to visual acuity (shown in Supplementary Materials), and only specific ones shown in the main document. The authors describe the analysis as exploratory in the 'Methods' section. Furthermore, the correlation between visual acuity and E/I metric is weak, not corrected for multiple comparisons. The results should be presented as preliminary, as no strong conclusions can be made from them. They can provide a hypothesis to test in a future study.

      This has now been done throughout the document and increases the transparency of the reporting.

      P.16 Given the correlation of the aperiodic intercept with age ("Age negatively correlated with the aperiodic intercept across CC and SC individuals, that is, a flattening of the intercept was observed with age"), age needs to be controlled for in the correlation between neurochemistry and the aperiodic intercept. Glx has also been shown to negatively correlates with age.

      This caveat has been addressed in the revised manuscript.

      Multiple exploratory correlations were performed to relate MRS to EEG measures (shown in Supplementary Materials), and only specific ones shown in the main document. Given the multiple measures from the MRS, the correlations with the EEG measures were exploratory, as stated in the text, p.16, and in Fig.4. yet the introduction said that there was a prior hypothesis "We further hypothesized that neurotransmitter changes would relate to changes in the slope and intercept of the EEG aperiodic activity in the same subjects." It would be great if the text could be revised for consistency and the analysis described as exploratory.

      This has been done throughout the document and increases the transparency of the reporting.

      The analysis for the EEG needs to take more advantage of the available data. As far as I understand, only two electrodes were used, yet far more were available as seen in their previous study (Ossandon et al., 2023). The spatial specificity is not established. The authors could use the frontal cortex electrode (FP1, FP2) signals as a control for spatial specificity in the group effects, or even better, all available electrodes and correct for multiple comparisons. Furthermore, they could use the aperiodic intercept vs Glx in SC to evaluate the specificity of the correlation to CC.

      This caveat has been addressed. The authors have added frontal electrodes to their analysis, providing an essential regional control for the visual cortex location.

      Comments on the latest version:

      The authors have made reasonable adjustments to their manuscript that addressed most of my comments by adding further justification for their methodology, essential literature support, pointing out exploratory analyses, limitations and adding key control analyses. Their revised manuscript has overall improved, providing valuable information, though the evidence that supports their claims is still incomplete.

      We thank the reviewer for suggesting ways to improve our manuscript and carefully reassessing our revised manuscript.

      Reviewer #2 (Public review):

      Summary:

      The study examined 10 congenitally blind patients who recovered vision through the surgical removal of bilateral dense cataracts, measuring neural activity and neuro chemical profiles from the visual cortex. The declared aim is to test whether restoring visual function after years of complete blindness impacts excitation/inhibition balance in the visual cortex.

      Strengths:

      The findings are undoubtedly useful for the community, as they contribute towards characterising the many ways in which this special population differs from normally sighted individuals. The combination of MRS and EEG measures is a promising strategy to estimate a fundamental physiological parameter - the balance between excitation and inhibition in the visual cortex, which animal studies show to be heavily dependent upon early visual experience. Thus, the reported results pave the way for further studies, which may use a similar approach to evaluate more patients and control groups.

      Weaknesses:

      The main methodological limitation is the lack of an appropriate comparison group or condition to delineate the effect of sight recovery (as opposed to the effect of congenital blindness). Few previous studies suggested that Excitation/Inhibition ratio in the visual cortex is increased in congenitally blind patients; the present study reports that E/I ratio decreases instead. The authors claim that this implies a change of E/I ratio following sight recovery. However, supporting this claim would require showing a shift of E/I after vs. before the sight-recovery surgery, or at least it would require comparing patients who did and did not undergo the sight-recovery surgery (as common in the field).

      We thank the reviewer for suggesting ways to improve our manuscript and carefully reassessing our revised manuscript.

      Since we have not been able to acquire longitudinal data with the experimental design of the present study in congenital cataract reversal individuals, we compared the MRS and EEG results of congenital cataract reversal individuals  to published work in congenitally permanent blind individuals. We consider this as a resource saving approach. We think that the results of our cross-sectional study now justify the costs and enormous efforts (and time for the patients who often have to travel long distances) associated with longitudinal studies in this rare population.

      There are also more technical limitations related to the correlation analyses, which are partly acknowledged in the manuscript. A bland correlation between GLX/GABA and the visual impairment is reported, but this is specific to the patients group (N=10) and would not hold across groups (the correlation is positive, predicting the lowest GLX/GABA ratio values for the sighted controls - opposite of what is found). There is also a strong correlation between GLX concentrations and the EEG power at the lowest temporal frequencies. Although this relation is intriguing, it only holds for a very specific combination of parameters (of the many tested): only with eyes open, only in the patients group.

      Given the exploratory nature of the correlations, we do not base the majority of our conclusions on this analysis. There are no doubts that the reported correlations need replication; however, replication is only possible after a first report. Thus, we hope to motivate corresponding analyses in further studies.

      It has to be noted that in the present study significance testing for correlations were corrected for multiple comparisons, and that some findings replicate earlier reports (e.g. effects on EEG aperiodic slope, alpha power, and correlations with chronological age).

      Conclusions:

      The main claim of the study is that sight recovery impacts the excitation/inhibition balance in the visual cortex, estimated with MRS or through indirect EEG indices. However, due to the weaknesses outlined above, the study cannot distinguish the effects of sight recovery from those of visual deprivation. Moreover, many aspects of the results are interesting but their validation and interpretation require additional experimental work.

      We interpret the group differences between individuals tested years after congenital visual deprivation and normally sighted individuals as supportive of the E/I ratio being impacted by congenital visual deprivation. In the absence of a sensitive period for the development of an E/I ratio, individuals with a transient phase of congenital blindness might have developed a visual system indistinguishable  from normally sighted individuals. As we demonstrate, this is not so. Comparing the results of congenitally blind humans with those of congenitally permanently blind humans (from previous studies) allowed us to identify changes of E/I ratio, which add to those found for congenital blindness.  

      We thank the reviewer for the helpful comments and suggestions related to the first submission and first revision of our manuscript. We are keen to translate some of them into future studies.

      Reviewer #3 (Public review):

      This manuscript examines the impact of congenital visual deprivation on the excitatory/inhibitory (E/I) ratio in the visual cortex using Magnetic Resonance Spectroscopy (MRS) and electroencephalography (EEG) in individuals whose sight was restored. Ten individuals with reversed congenital cataracts were compared to age-matched, normally sighted controls, assessing the cortical E/I balance and its interrelationship and to visual acuity. The study reveals that the Glx/GABA ratio in the visual cortex and the intercept and aperiodic signal are significantly altered in those with a history of early visual deprivation, suggesting persistent neurophysiological changes despite visual restoration.

      First of all, I would like to disclose that I am not an expert in congenital visual deprivation, nor in MRS. My expertise is in EEG (particularly in the decomposition of periodic and aperiodic activity) and statistical methods.

      Although the authors addressed some of the concerns of the previous version, major concerns and flaws remain in terms of methodological and statistical approaches along with the (over)interpretation of the results. Specific concerns include:

      (1 3.1) Response to Variability in Visual Deprivation<br /> Rather than listing the advantages and disadvantages of visual deprivation, I recommend providing at least a descriptive analysis of how the duration of visual deprivation influenced the measures of interest. This would enhance the depth and relevance of the discussion.

      Although Review 2 and Review 3 (see below) pointed out problems in interpreting multiple correlational analyses in small samples, we addressed this request by reporting such correlations between visual deprivation history and measured EEG/MRS outcomes.

      Calculating the correlation between duration of visual deprivation and behavioral or brain measures is, in fact, a common suggestion. The existence of sensitive periods, which are typically assumed to not follow a linear gradual decline of neuroplasticity, does not necessary allow predicting a correlation with duration of blindness. Daphne Maurer has additionally worked on the concept of “sleeper effects” (Maurer et al., 2007), that is, effects on the brain and behavior by early deprivation which are observed only later in life when the function/neural circuits matures.

      In accordance with this reasoning, we did not observe a significant correlation between duration of visual deprivation and any of our dependent variables.

      (2 3.2) Small Sample Size<br /> The issue of small sample size remains problematic. The justification that previous studies employed similar sample sizes does not adequately address the limitation in the current study. I strongly suggest that the correlation analyses should not feature prominently in the main manuscript or the abstract, especially if the discussion does not substantially rely on these correlations. Please also revisit the recommendations made in the section on statistical concerns.

      In the revised manuscript, we explicitly mention that our sample size is not atypical for the special group investigated, but that a replication of our results in larger samples would foster their impact. We only explicitly mention correlations that survived stringent testing for multiple comparisons in the main manuscript.

      Given the exploratory nature of the correlations, we have not based the majority of our claims on this analysis.

      (3 3.3) Statistical Concerns<br /> While I appreciate the effort of conducting an independent statistical check, it merely validates whether the reported statistical parameters, degrees of freedom (df), and p-values are consistent. However, this does not address the appropriateness of the chosen statistical methods.

      We did not intend for the statcheck report to justify the methods used for statistics, which we have done in a separate section with normality and homogeneity testing (Supplementary Material S9), and references to it in the descriptions of the statistical analyses (Methods, Page 13, Lines 326-329 and Page 15, Lines 400-402).

      Several points require clarification or improvement:<br /> (4) Correlation Methods: The manuscript does not specify whether the reported correlation analyses are based on Pearson or Spearman correlation.

      The depicted correlations are Pearson correlations. We will add this information to the Methods.

      (5) Confidence Intervals: Include confidence intervals for correlations to represent the uncertainty associated with these estimates.

      We have added the confidence intervals for all measured correlations to the second revision of our manuscript.

      (6) Permutation Statistics: Given the small sample size, I recommend using permutation statistics, as these are exact tests and more appropriate for small datasets.

      Our study focuses on a rare population, with a sample size limited by the availability of participants. Our findings provide exploratory insights rather than make strong inferential claims. To this end, we have ensured that our analysis adheres to key statistical assumptions (Shapiro-Wilk as well as Levene’s tests, Supplementary Material S9), and reported our findings with effect sizes, appropriate caution and context.

      (7) Adjusted P-Values: Ensure that reported Bonferroni corrected p-values (e.g., p > 0.999) are clearly labeled as adjusted p-values where applicable.

      In the revised manuscript, we have changed Figure 4 to say ‘adjusted p,’  which we indeed reported.

      (8) Figure 2C

      Figure 2C still lacks crucial information that the correlation between Glx/GABA ratio and visual acuity was computed solely in the control group (as described in the rebuttal letter). Why was this analysis restricted to the control group? Please provide a rationale.

      Figure 2C depicts the correlation between Glx/GABA+ ratio and visual acuity in the congenital cataract reversal group, not the control group. This is mentioned in the Figure 2 legend, as well as in the main text where the figure is referred to (Page 18, Line 475).

      The correlation analyses between visual acuity and MRS/EEG measures were only performed in the congenital cataract reversal group since the sighed control group comprised of individuals with vision in the normal range; thus this analyses would not make sense. Table 1 with the individual visual acuities for all participants, including the normally sighted controls, shows the low variance in the latter group.  

      For variables in which no apiori group differences in variance were predicted, we performed the correlation analyses across groups (see Supplementary Material S12, S15).

      We have now highlighted these motivations more clearly in the Methods of the revised manuscript (Page 16, Lines 405-410).

      (9 3.4) Interpretation of Aperiodic Signal

      Relying on previous studies to interpret the aperiodic slope as a proxy for excitation/inhibition (E/I) does not make the interpretation more robust.

      How to interpret aperiodic EEG activity has been subject of extensive investigation. We cite studies which provide evidence from multiple species (monkeys, humans) and measurements (EEG, MEG, ECoG), including studies which pharmacologically manipulated E/I balance.

      Whether our findings are robust, in fact, requires a replication study. Importantly, we analyzed the intercept of the aperiodic activity fit as well, and discuss results related to the intercept.

      Quote:

      “(3.4) Interpretation of aperiodic signal:

      - Several recent papers demonstrated that the aperiodic signal measured in EEG or ECoG is related to various important aspects such as age, skull thickness, electrode impedance, as well as cognition. Thus, currently, very little is known about the underlying effects which influence the aperiodic intercept and slope. The entire interpretation of the aperiodic slope as a proxy for E/I is based on a computational model and simulation (as described in the Gao et al. paper).

      Apart from the modeling work from Gao et al., multiple papers which have also been cited which used ECoG, EEG and MEG and showed concomitant changes in aperiodic activity with pharmacological manipulation of the E/I ratio (Colombo et al., 2019; Molina et al., 2020; Muthukumaraswamy & Liley, 2018). Further, several prior studies have interpreted changes in the aperiodic slope as reflective of changes in the E/I ratio, including studies of developmental groups (Favaro et al., 2023; Hill et al., 2022; McSweeney et al., 2023; Schaworonkow & Voytek, 2021) as well as patient groups (Molina et al., 2020; Ostlund et al., 2021).

      - The authors further wrote: We used the slope of the aperiodic (1/f) component of the EEG spectrum as an estimate of E/I ratio (Gao et al., 2017; Medel et al., 2020; Muthukumaraswamy & Liley, 2018). This is a highly speculative interpretation with very little empirical evidence. These papers were conducted with ECoG data (mostly in animals) and mostly under anesthesia. Thus, these studies only allow an indirect interpretation by what the 1/f slope in EEG measurements is actually influenced.

      Note that Muthukumaraswamy et al. (2018) used different types of pharmacological manipulations and analyzed periodic and aperiodic MEG activity in humans, in addition to monkey ECoG (Muthukumaraswamy & Liley, 2018). Further, Medel et al. (now published as Medel et al., 2023) compared EEG activity in addition to ECoG data after propofol administration. The interpretation of our results are in line with a number of recent studies in developing (Hill et al., 2022; Schaworonkow & Voytek, 2021) and special populations using EEG. As mentioned above, several prior studies have used the slope of the 1/f component/aperiodic activity as an indirect measure of the E/I ratio (Favaro et al., 2023; Hill et al., 2022; McSweeney et al., 2023; Molina et al., 2020; Ostlund et al., 2021; Schaworonkow & Voytek, 2021), including studies using scalp-recorded EEG from humans.

      In the introduction of the revised manuscript, we have made more explicit that this metric is indirect (Page 3, Line 91), (additionally see Discussion, Page 24, Lines 644-645, Page 25, Lines 650-657).

      While a full understanding of aperiodic activity needs to be provided, some convergent ideas have emerged. We think that our results contribute to this enterprise, since our study is, to the best of our knowledge, the first which assessed MRS measured neurotransmitter levels and EEG aperiodic activity. “

      (10) Additionally, the authors state:

      "We cannot think of how any of the exploratory correlations between neurophysiological measures and MRS measures could be accounted for by a difference e.g. in skull thickness."

      (11) This could be addressed directly by including skull thickness as a covariate or visualizing it in scatterplots, for instance, by representing skull thickness as the size of the dots.

      We are not aware of any study that would justify such an analysis.

      Our analyses were based on previous findings in the literature.

      Since to the best of our knowledge, no evidence exists that congenital cataracts go together with changes in skull thickness, and that skull thickness might selectively modulate visual cortex Glx/GABA+ but not NAA measures, we decided against following this suggestion.

      Notably, the neurotransmitter concentration reported here is after tissue segmentation of the voxel region. The tissue fraction was shown to not differ between groups in the MRS voxels (Supplementary Material S4). The EEG electrode impedance was lowered to <10 kOhm in every participant (Methods, Page 13, Line 344), and preparation was identical across groups.

      (12 3.5) Problems with EEG Preprocessing and Analysis

      Downsampling: The decision to downsample the data to 60 Hz "to match the stimulation rate" is problematic. This choice conflates subsequent spectral analyses due to aliasing issues, as explained by the Nyquist theorem. While the authors cite prior studies (Schwenk et al., 2020; VanRullen & MacDonald, 2012) to justify this decision, these studies focused on alpha (8-12 Hz), where aliasing is less of a concern compared of analyzing aperiodic signal. Furthermore, in contrast, the current study analyzes the frequency range from 1-20 Hz, which is too narrow for interpreting the aperiodic signal as E/I. Typically, this analysis should include higher frequencies, spanning at least 1-30 Hz or even 1-45 Hz (not 20-40 Hz).

      As previously mentied in the Methods (Page 15 Line 376) and the previous response, the pop_resample function used by EEGLAB applies an anti-aliasing filter, at half the resampling frequency (as per the Nyquist theorem

      https://eeglab.org/tutorials/05_Preprocess/resampling.html). The upper cut off of the low pass filter set by EEGlab prior to down sampling (30 Hz) is still far above the frequency of interest in the current study  (1-20 Hz), thus allowing us to derive valid results.

      Quote:

      “- The authors downsampled the data to 60Hz to "to match the stimulation rate". What is the intention of this? Because the subsequent spectral analyses are conflated by this choice (see Nyquist theorem).

      This data were collected as part of a study designed to evoke alpha activity with visual white-noise, which ranged in luminance with equal power at all frequencies from 1-60 Hz, restricted by the refresh rate of the monitor on which stimuli were presented (Pant et al., 2023). This paradigm and method was developed by VanRullen and colleagues (Schwenk et al., 2020; Vanrullen & MacDonald, 2012), wherein the analysis requires the same sampling rate between the presented frequencies and the EEG data. The downsampling function used here automatically applies an anti-aliasing filter (EEGLAB 2019) .”

      Moreover, the resting-state data were not resampled to 60 Hz. We have made this clearer in the Methods of the second revision (Page 15, Line 367).

      Our consistent results of group differences across all three EEG conditions, thus, exclude any possibility that they were driven by aliasing artifacts.

      The expected effects of this anti-aliasing filter can be seen in the attached Author response image 1, showing an example participant’s spectrum in the 1-30 Hz range (as opposed to the 1-20 Hz plotted in the manuscript), clearly showing a 30-40 dB drop at 30 Hz. Any aliasing due to, for example, remaining line noise, would additionally be visible in this figure (as well as Figure 3) as a peak.

      Author response image 1.

      Power spectral density of one congenital cataract-reversal (CC) participant in the visual stimulation condition across all channels. The reduced power at 30 Hz shows the effects of the anti-aliasing filter applied by EEGLAB’s pop_resample function.

      As we stated in the manuscript, and in previous reviews, so far there has been no consensus on the exact range of measuring aperiodic activity. We made a principled decision based on the literature (showing a knee in aperiodic fits of this dataset at 20 Hz) (Medel et al., 2023; Ossandón et al., 2023), data quality (possible contamination by line noise at higher frequencies) and the purpose of the visual stimulation experiment (to look at the lower frequency range by stimulating up to 60 Hz, thereby limiting us to quantifying below 30 Hz), that 1-20 Hz would be the fit range in this dataset.

      Quote:

      “(3) What's the underlying idea of analyzing two separate aperiodic slopes (20-40Hz and 1-19Hz). This is very unusual to compute the slope between 20-40 Hz, where the SNR is rather low.

      "Ossandón et al. (2023), however, observed that in addition to the flatter slope of the aperiodic power spectrum in the high frequency range (20-40 Hz), the slope of the low frequency range (1-19 Hz) was steeper in both, congenital cataract-reversal individuals, as well as in permanently congenitally blind humans."

      The present manuscript computed the slope between 1-20 Hz. Ossandón et al. as well as Medel et al. (2023) found a “knee” of the 1/f distribution at 20 Hz and describe further the motivations for computing both slope ranges. For example, Ossandón et al. used a data driven approach and compared single vs. dual fits and found that the latter fitted the data better. Additionally, they found the best fit if a knee at 20 Hz was used. We would like to point out that no standard range exists for the fitting of the 1/f component across the literature and, in fact, very different ranges have been used (Gao et al., 2017; Medel et al., 2023; Muthukumaraswamy & Liley, 2018). “

      (13) Baseline Removal: Subtracting the mean activity across an epoch as a baseline removal step is inappropriate for resting-state EEG data. This preprocessing step undermines the validity of the analysis. The EEG dataset has fundamental flaws, many of which were pointed out in the previous review round but remain unaddressed. In its current form, the manuscript falls short of standards for robust EEG analysis. If I were reviewing for another journal, I would recommend rejection based on these flaws.

      The baseline removal step from each epoch serves to remove the DC component of the recording and detrend the data. This is a standard preprocessing step (included as an option in preprocessing pipelines recommended by the EEGLAB toolbox, FieldTrip toolbox and MNE toolbox), additionally necessary to improve the efficacy of ICA decomposition (Groppe et al., 2009).

      In the previous review round, a clarification of the baseline timing was requested, which we added. Beyond this request, there was no mention of the appropriateness of the baseline removal and/or a request to provide reasons for why it might not undermine the validity of the analysis.

      Quote:

      “- "Subsequently, baseline removal was conducted by subtracting the mean activity across the length of an epoch from every data point." The actual baseline time segment should be specified.

      The time segment was the length of the epoch, that is, 1 second for the resting state conditions and 6.25 seconds for the visual stimulation conditions. This has been explicitly stated in the revised manuscript (Page 13, Line 354).”

      Prior work in the time (not frequency) domain on event-related potential (ERP) analysis has suggested that the baselining step might cause spurious effects (Delorme, 2023) (although see (Tanner et al., 2016)). We did not perform ERP analysis at any stage. One recent study suggests spurious group differences in the 1/f signal might be driven by an inappropriate dB division baselining method (Gyurkovics et al., 2021), which we did not perform.

      Any effect of our baselining procedure on the FFT spectrum would be below the 1 Hz range, which we did not analyze.  

      Each of the preprocessing steps in the manuscript match pipelines described and published in extensive prior work. We document how multiple aspects of our EEG results replicate prior findings (Supplementary Material S15, S18, S19), reports of other experimenters, groups and locations, validating that our results are robust.

      We therefore reject the claim of methodological flaws in our EEG analyses in the strongest possible terms.

      Quote:

      “(3.5) Problems with EEG preprocessing and analysis:

      - It seems that the authors did not identify bad channels nor address the line noise issue (even a problem if a low pass filter of below-the-line noise was applied).

      As pointed out in the methods and Figure 1, we only analyzed data from two occipital channels, O1 and O2 neither of which were rejected for any participant. Channel rejection was performed for the larger dataset, published elsewhere (Ossandón et al., 2023; Pant et al., 2023). As control sites we added the frontal channels FP1 and Fp2 (see Supplementary Material S14)

      Neither Ossandón et al. (2023) nor Pant et al. (2023) considered frequency ranges above 40 Hz to avoid any possible contamination with line noise. Here, we focused on activity between 0 and 20 Hz, definitely excluding line noise contaminations (Methods, Page 14, Lines 365-367). The low pass filter (FIR, 1-45 Hz) guaranteed that any spill-over effects of line noise would be restricted to frequencies just below the upper cutoff frequency.

      Additionally, a prior version of the analysis used spectrum interpolation to remove line noise; the group differences remained stable (Ossandón et al., 2023). We have reported this analysis in the revised manuscript (Page 14, Lines 364-357).

      Further, both groups were measured in the same lab, making line noise (~ 50 Hz) as an account for the observed group effects in the 1-20 Hz frequency range highly unlikely. Finally, any of the exploratory MRS-EEG correlations would be hard to explain if the EEG parameters would be contaminated with line noise.

      - What was the percentage of segments that needed to be rejected due to the 120μV criteria? This should be reported specifically for EO & EC and controls and patients.

      The mean percentage of 1 second segments rejected for each resting state condition and the percentage of 6.25 long segments rejected in each group for the visual stimulation condition have been added to the revised manuscript (Supplementary Material S10), and referred to in the Methods on Page 14, Lines 372-373).

      - The authors downsampled the data to 60Hz to "to match the stimulation rate". What is the intention of this? Because the subsequent spectral analyses are conflated by this choice (see Nyquist theorem).

      This data were collected as part of a study designed to evoke alpha activity with visual white-noise, which changed in luminance with equal power at all frequencies from 1-60 Hz, restricted by the refresh rate of the monitor on which stimuli were presented (Pant et al., 2023). This paradigm and method was developed by VanRullen and colleagues (Schwenk et al., 2020; VanRullen & MacDonald, 2012), wherein the analysis requires the same sampling rate between the presented frequencies and the EEG data. The downsampling function used here automatically applies an anti-aliasing filter (EEGLAB 2019) .

      - "Subsequently, baseline removal was conducted by subtracting the mean activity across the length of an epoch from every data point." The actual baseline time segment should be specified.

      The time segment was the length of the epoch, that is, 1 second for the resting state conditions and 6.25 seconds for the visual stimulation conditions. This has now been explicitly stated in the revised manuscript (Page 14, Lines 379-380).

      - "We excluded the alpha range (8-14 Hz) for this fit to avoid biasing the results due to documented differences in alpha activity between CC and SC individuals (Bottari et al., 2016; Ossandón et al., 2023; Pant et al., 2023)." This does not really make sense, as the FOOOF algorithm first fits the 1/f slope, for which the alpha activity is not relevant.

      We did not use the FOOOF algorithm/toolbox in this manuscript. As stated in the Methods, we used a 1/f fit to the 1-20 Hz spectrum in the log-log space, and subtracted this fit from the original spectrum to obtain the corrected spectrum. Given the pronounced difference in alpha power between groups (Bottari et al., 2016; Ossandón et al., 2023; Pant et al., 2023), we were concerned it might drive differences in the exponent values. Our analysis pipeline had been adapted from previous publications of our group and other labs (Ossandón et al., 2023; Voytek et al., 2015; Waschke et al., 2017).

      We have conducted the analysis with and without the exclusion of the alpha range, as well as using the FOOOF toolbox both in the 1-20 Hz and 20-40 Hz ranges (Ossandón et al., 2023). The findings of a steeper slope in the 1-20 Hz range as well as lower alpha power in CC vs SC individuals remained stable. In Ossandón et al., the comparison between the piecewise fits and FOOOF fits led the authors to use the former, as it outperformed the FOOOF algorithm for their data.

      - The model fits of the 1/f fitting for EO, EC, and both participant groups should be reported.

      In Figure 3 of the manuscript, we depicted the mean spectra and 1/f fits for each group.

      In the revised manuscript, we added the fit quality metrics (average R<sup>2</sup> values > 0.91 for each group and condition) (Methods Page 15, Lines 395-396; Supplementary Material S11) and additionally show individual subjects’ fits (Supplementary Material S11). “

      (14) The authors mention:

      "The EEG data sets reported here were part of data published earlier (Ossandón et al., 2023; Pant et al., 2023)." Thus, the statement "The group differences for the EEG assessments corresponded to those of a larger sample of CC individuals (n=38) " is a circular argument and should be avoided."

      The authors addressed this comment and adjusted the statement. However, I do not understand, why not the full sample published earlier (Ossandón et al., 2023) was used in the current study?

      The recording of EEG resting state data stated in 2013, while MRS testing could only be set up by the second half of 2019. Moreover, not all subjects who qualify for EEG recording qualify for being scanned (e.g. due to MRI safety, claustrophobia)

      References

      Bottari, D., Troje, N. F., Ley, P., Hense, M., Kekunnaya, R., & Röder, B. (2016). Sight restoration after congenital blindness does not reinstate alpha oscillatory activity in humans. Scientific Reports. https://doi.org/10.1038/srep24683

      Colombo, M. A., Napolitani, M., Boly, M., Gosseries, O., Casarotto, S., Rosanova, M., Brichant, J. F., Boveroux, P., Rex, S., Laureys, S., Massimini, M., Chieregato, A., & Sarasso, S. (2019). The spectral exponent of the resting EEG indexes the presence of consciousness during unresponsiveness induced by propofol, xenon, and ketamine. NeuroImage, 189(September 2018), 631–644. https://doi.org/10.1016/j.neuroimage.2019.01.024

      Delorme, A. (2023). EEG is better left alone. Scientific Reports, 13(1), 2372. https://doi.org/10.1038/s41598-023-27528-0

      Favaro, J., Colombo, M. A., Mikulan, E., Sartori, S., Nosadini, M., Pelizza, M. F., Rosanova, M., Sarasso, S., Massimini, M., & Toldo, I. (2023). The maturation of aperiodic EEG activity across development reveals a progressive differentiation of wakefulness from sleep. NeuroImage, 277. https://doi.org/10.1016/J.NEUROIMAGE.2023.120264

      Gao, R., Peterson, E. J., & Voytek, B. (2017). Inferring synaptic excitation/inhibition balance from field potentials. NeuroImage, 158(March), 70–78. https://doi.org/10.1016/j.neuroimage.2017.06.078

      Groppe, D. M., Makeig, S., & Kutas, M. (2009). Identifying reliable independent components via split-half comparisons. NeuroImage, 45(4), 1199–1211. https://doi.org/10.1016/j.neuroimage.2008.12.038

      Gyurkovics, M., Clements, G. M., Low, K. A., Fabiani, M., & Gratton, G. (2021). The impact of 1/f activity and baseline correction on the results and interpretation of time-frequency analyses of EEG/MEG data: A cautionary tale. NeuroImage, 237. https://doi.org/10.1016/j.neuroimage.2021.118192

      Hill, A. T., Clark, G. M., Bigelow, F. J., Lum, J. A. G., & Enticott, P. G. (2022). Periodic and aperiodic neural activity displays age-dependent changes across early-to-middle childhood. Developmental Cognitive Neuroscience, 54, 101076. https://doi.org/10.1016/J.DCN.2022.101076

      Maurer, D., Mondloch, C. J., & Lewis, T. L. (2007). Sleeper effects. In Developmental Science. https://doi.org/10.1111/j.1467-7687.2007.00562.x

      McSweeney, M., Morales, S., Valadez, E. A., Buzzell, G. A., Yoder, L., Fifer, W. P., Pini, N., Shuffrey, L. C., Elliott, A. J., Isler, J. R., & Fox, N. A. (2023). Age-related trends in aperiodic EEG activity and alpha oscillations during early- to middle-childhood. NeuroImage, 269, 119925. https://doi.org/10.1016/j.neuroimage.2023.119925

      Medel, V., Irani, M., Crossley, N., Ossandón, T., & Boncompte, G. (2023). Complexity and 1/f slope jointly reflect brain states. Scientific Reports, 13(1), 21700. https://doi.org/10.1038/s41598-023-47316-0

      Molina, J. L., Voytek, B., Thomas, M. L., Joshi, Y. B., Bhakta, S. G., Talledo, J. A., Swerdlow, N. R., & Light, G. A. (2020). Memantine Effects on Electroencephalographic Measures of Putative Excitatory/Inhibitory Balance in Schizophrenia. Biological Psychiatry: Cognitive Neuroscience and Neuroimaging, 5(6), 562–568. https://doi.org/10.1016/j.bpsc.2020.02.004

      Muthukumaraswamy, S. D., & Liley, D. T. (2018). 1/F electrophysiological spectra in resting and drug-induced states can be explained by the dynamics of multiple oscillatory relaxation processes. NeuroImage, 179(November 2017), 582–595. https://doi.org/10.1016/j.neuroimage.2018.06.068

      Ossandón, J. P., Stange, L., Gudi-Mindermann, H., Rimmele, J. M., Sourav, S., Bottari, D., Kekunnaya, R., & Röder, B. (2023). The development of oscillatory and aperiodic resting state activity is linked to a sensitive period in humans. NeuroImage, 275, 120171. https://doi.org/10.1016/J.NEUROIMAGE.2023.120171

      Ostlund, B. D., Alperin, B. R., Drew, T., & Karalunas, S. L. (2021). Behavioral and cognitive correlates of the aperiodic (1/f-like) exponent of the EEG power spectrum in adolescents with and without ADHD. Developmental Cognitive Neuroscience, 48, 100931. https://doi.org/10.1016/j.dcn.2021.100931

      Pant, R., Ossandón, J., Stange, L., Shareef, I., Kekunnaya, R., & Röder, B. (2023). Stimulus-evoked and resting-state alpha oscillations show a linked dependence on patterned visual experience for development. NeuroImage: Clinical, 103375. https://doi.org/10.1016/J.NICL.2023.103375

      Schaworonkow, N., & Voytek, B. (2021). Longitudinal changes in aperiodic and periodic activity in electrophysiological recordings in the first seven months of life. Developmental Cognitive Neuroscience, 47. https://doi.org/10.1016/j.dcn.2020.100895

      Schwenk, J. C. B., VanRullen, R., & Bremmer, F. (2020). Dynamics of Visual Perceptual Echoes Following Short-Term Visual Deprivation. Cerebral Cortex Communications, 1(1). https://doi.org/10.1093/TEXCOM/TGAA012

      Tanner, D., Norton, J. J. S., Morgan-Short, K., & Luck, S. J. (2016). On high-pass filter artifacts (they’re real) and baseline correction (it’s a good idea) in ERP/ERMF analysis. Journal of Neuroscience Methods, 266, 166–170. https://doi.org/10.1016/j.jneumeth.2016.01.002

      Vanrullen, R., & MacDonald, J. S. P. (2012). Perceptual echoes at 10 Hz in the human brain. Current Biology. https://doi.org/10.1016/j.cub.2012.03.050

      Voytek, B., Kramer, M. A., Case, J., Lepage, K. Q., Tempesta, Z. R., Knight, R. T., & Gazzaley, A. (2015). Age-related changes in 1/f neural electrophysiological noise. Journal of Neuroscience, 35(38). https://doi.org/10.1523/JNEUROSCI.2332-14.2015

      Waschke, L., Wöstmann, M., & Obleser, J. (2017). States and traits of neural irregularity in the age-varying human brain. Scientific Reports 2017 7:1, 7(1), 1–12. https://doi.org/10.1038/s41598-017-17766-4

    1. Author response:

      The following is the authors’ response to the original reviews.

      We thank the reviewers for their efforts. They have pointed out several shortcomings and made very helpful suggestions. Based on their feedback, we have substantially revised the manuscript and feel the paper has been much improved because of it.

      Notable changes are:

      (1) As our model does not contain feed-back connections, the focus of the study is now more clearly communicated to be on feed-forward processes only, with appropriate justifications for this choice added to the Introduction and Discussion sections. Accordingly, the title has been changed to include the term “feed-forward”.

      (2) The old Figure 5 has been removed in favor of reporting correlation scores to the right of the response profiles in other figures.

      (3) We now discuss changes to the network architecture (new Figure 5) and fine-tuning of the hyperparameters (new Figure 6) in the main text instead of only the Supplementary Information.

      (4) The discussion on qualitative versus quantitative analysis has been extended and given its own subsection entitled “On the importance of experimental contrasts and qualitative analysis of the model”.

      Below, we address each point that the reviewers brought up in detail and outline what improvements we have made in the revision to address them.

      Reviewer #1 (Public Review):

      Summary:

      This study trained a CNN for visual word classification and supported a model that can explain key functional effects of the evoked MEG response during visual word recognition, providing an explicit computational account from detection and segmentation of letter shapes to final word-form identification.

      Strengths:

      This paper not only bridges an important gap in modeling visual word recognition, by establishing a direct link between computational processes and key findings in experimental neuroimaging studies, but also provides some conditions to enhance biological realism.

      Weaknesses:

      The interpretation of CNN results, especially the number of layers in the final model and its relationship with the processing of visual words in the human brain, needs to be further strengthened.

      We have experimented with the number of layers and the number of units in each layer. In the previous version of the manuscript, these results could be found in the supplementary information. For the revised version, we have brought some of these results into the main text and discuss them more thoroughly.

      We have added a figure (Figure 5 in the revised manuscript) showing the impact of the number of convolution and fully-connected layers on the response profiles of the layers, as well as the correlation with the three MEG components.

      We discuss the figure in the Results section as follows:

      “Various variations in model architecture and training procedure were evaluated. We found that the number of layers had a large impact on the response patterns produced by the model (Figure 5). The original VGG-11 architecture defines 5 convolution layers and 3 fully connected layers (including the output layer). Removing a convolution layer (Figure 5, top row), or removing one of the fully connected layers (Figure 5, second row), resulted in a model that did exhibit an enlarged response to noisy stimuli in the early layers that mimics the Type-I response. However, such models failed to show a sufficiently diminished response to noisy stimuli in the later layers, hence failing to produce responses that mimic the Type-II or N400m, a failure which also showed as low correlation scores.

      Adding an additional convolution layer (Figure 5, third row) resulted in a model where none of the layer response profiles mimics that of the Type-II response. The Type-II response is characterized by a reduced response to both noise and symbols, but an equally large response to consonant strings, real and pseudo words. However, in the model with an additional convolution layer, the consonant strings evoked a reduced response already in the first fully connected layer, which is a feature of the N400m rather than the Type-II. These kind of subtleties in the response pattern, which are important for the qualitative analysis, generally did not show quantitatively in the correlation scores, as the fully connected layers in this model correlate as well with the Type-II response as models that did show a response pattern that mimics the Type-II.

      Adding an additional fully connected layer (Figure 5, fourth row) resulted in a model with similar response profiles and correlation with the MEG components as the original VGG-11 architecture (Figure 5, bottom row) The N400m-like response profile is now observed in the third fully connected layer rather than the output layer. However, the decrease in response to consonant strings versus real and pseudo words, which is typical of the N400m, is less distinct than in the original VGG-11 architecture.”

      And in the Discussion section:

      “In the model, convolution units are followed by pooling units, which serve the purpose of stratifying the response across changes in position, size and rotation within the receptive field of the pooling unit. Hence, the effect of small differences in letter shape, such as the usage of different fonts, was only present in the early convolution layers, in line with findings in the EEG literature (Chauncey et al., 2008; Grainger & Holcomb, 2009; Hauk & Pulvermüller, 2004). However, the ability of pooling units to stratify such differences depends on the size of their receptive field, which is determined by the number of convolution-and-pooling layers. As a consequence, the response profiles of the subsequent fully connected layers was also very sensitive to the number of convolution-and-pooling layers. The optimal number of such layers is likely dependent on the input size and pooling strategy. Given the VGG-11 design of doubling the receptive field after each layer, combined with an input size of 225×225 pixels, the optimal number of convolution-andpooling layers for our model was five, or the model would struggle to produce response profiles mimicking those of the Type-II component in the subsequent fully connected layers (Figure 5).”

      Reviewer #1 (Recommendations For The Authors):

      (1) The similarity between CNNs and human MEG responses, including type-I (100ms), type-II (150ms), and N400 (400ms) components, looks like separately, lacking the sequential properties among these three components. Is the recurrent neural network (RNN), which can be trained to process and convert a sequential data input into a specific sequential data output, a better choice?

      When modeling sequential effects, meaning that the processing of the current word is influenced by the word that came before it, such as priming and top-down modulations, we agree that such a model would indeed require recurrency in its architecture. However, we feel that the focus of modeling efforts in reading has been overwhelmingly on the N400 and such priming effects, usually skipping over the pixel-to-letter process. So, for this paper, we were keen on exploring more basic effects such as noise and symbols versus letters on the type-I and type-II responses. And for these effects, a feed-forward model turns out to be sufficient, so we can keep the focus of this particular paper on bottom-up processes during single word reading, on which there is already a lot to say.

      To clarify our focus on feed-forward process, we have modified the title of the paper to be:

      “Convolutional networks can model the functional modulation of the MEG responses associated with feed-forward processes during visual word recognition” furthermore, we have revised the Introduction to highlight this choice, noting:

      “Another limitation is that these models have primarily focused on feed-back lexicosemantic effects while oversimplifying the initial feed-forward processing of the visual input.

      […]

      For this study, we chose to focus on modeling the early feed-forward processing occurring during visual word recognition, as the experimental setup in Vartiainen et al. (2011) was designed to demonstrate.

      […]

      By doing so, we restrict ourselves to an investigation of how well the three evoked components can be explained by a feed-forward CNN in an experimental setting designed to demonstrate feed-forward effects. As such, the goal is not to present a complete model of all aspects of reading, which should include feed-back effects, but rather to demonstrate the effectiveness of using a model that has a realistic form of input when the aim is to align the model with the evoked responses observed during visual word recognition.”

      And in the Discussion section:

      “In this paper we have restricted our simulations to feed-forward processes. Now, the way is open to incorporate convolution-and-pooling principles in models of reading that simulate feed-back processes as well, which should allow the model to capture more nuance in the Type-II and N400m components, as well as extend the simulation to encompass a realistic semantic representation.”

      (2) There is no clear relationship between the layers that signal needs to traverse in the model and the relative duration of the three components in the brain.

      While some models offer a tentative mapping between layers and locations in the brain, none of the models we are aware of actually simulate time accurately and our model is no exception.

      While we provide some evidence that the three MEG components are best modeled with different types of layers, and the type-I becomes somewhere before type-II and N400m is last in our model, the lack of timing information is a weakness of our model we have not been able to address. In our previous version, this already was the main topic of our “Limitations of the model” section, but since this weakness was pointed out by all reviewers, we have decided to widen our discussion of it:

      “One important limitation of the current model is the lack of an explicit mapping from the units inside its layers to specific locations in the brain at specific times. The temporal ordering of the components is simulated correctly, with the response profile matching that of the type-I occurring the layers before those matching the type-II, followed by the N400m. Furthermore, every component is best modeled by a different type of layer, with the type-I best described by convolution-and-pooling, the type-II by fully-connected linear layers and the N400m by a one-hot encoded layer. However, there is no clear relationship between the number of layers the signal needs to traverse in the model to the processing time in the brain. Even if one considers that the operations performed by the initial two convolution layers happen in the retina rather than the brain, the signal needs to propagate through three more convolution layers to reach the point where it matches the type-II component at 140-200 ms, but only through one more additional layer to reach the point where it starts to match the N400m component at 300-500 ms. Still, cutting down on the number of times convolution is performed in the model seems to make it unable to achieve the desired suppression of noise (Figure 5). It also raises the question what the brain is doing during the time between the type-II and N400m component that seems to take so long. It is possible that the timings of the MEG components are not indicative solely of when the feed-forward signal first reaches a certain location, but are rather dictated by the resolution of feed-forward and feedback signals (Nour Eddine et al., 2024).”

      See also our response to the next comment of the Reviewer, in which we dive more into the effect of the number of layers, which could be seen as a manipulation of time.

      (3) I am impressed by the CNN that authors modified to match the human brain pattern for the visual word recognition process, by the increase and decrease of the number of layers. The result of this part was a little different from the author’s expectation; however, the author didn’t explain or address this issue.

      We are glad to hear that the reviewer found these results interesting. Accordingly, we now discuss these results more thoroughly in the main text.

      We have moved the figure from the supplementary information to the main text (Figure 5 in the revised manuscript). And describe the results in the Results section:

      “Various variations in model architecture and training procedure were evaluated. We found that the number of layers had a large impact on the response patterns produced by the model (Figure 5). The original VGG-11 architecture defines 5 convolution layers and 3 fully connected layers (including the output layer). Removing a convolution layer (Figure 5, top row), or removing one of the fully connected layers (Figure 5, second row), resulted in a model that did exhibit an enlarged response to noisy stimuli in the early layers that mimics the Type-I response. However, such models failed to show a sufficiently diminished response to noisy stimuli in the later layers, hence failing to produce responses that mimic the Type-II or N400m, a failure which also showed as low correlation scores.

      Adding an additional convolution layer (Figure 5, third row) resulted in a model where none of the layer response profiles mimics that of the Type-II response. The Type-II response is characterized by a reduced response to both noise and symbols, but an equally large response to consonant strings, real and pseudo words. However, in the model with an additional convolution layer, the consonant strings evoked a reduced response already in the first fully connected layer, which is a feature of the N400m rather than the Type-II. These kind of subtleties in the response pattern, which are important for the qualitative analysis, generally did not show quantitatively in the correlation scores, as the fully connected layers in this model correlate as well with the Type-II response as models that did show a response pattern that mimics the Type-II.

      Adding an additional fully connected layer (Figure 5, fourth row) resulted in a model with similar response profiles and correlation with the MEG components as the original VGG-11 architecture (Figure 5, bottom row) The N400m-like response profile is now observed in the third fully connected layer rather than the output layer. However, the decrease in response to consonant strings versus real and pseudo words, which is typical of the N400m, is less distinct than in the original VGG-11 architecture.”

      We also incorporated these results in the Discussion:

      “However, the ability of pooling units to stratify such differences depends on the size of their receptive field, which is determined by the number of convolution-andpooling layers. This might also explain why, in later layers, we observed a decreased response to stimuli where text was rendered with a font size exceeding the receptive field of the pooling units (Figure 8). Hence, the response profiles of the subsequent fully connected layers was very sensitive to the number of convolution-and-pooling layers. This number is probably dependent on the input size and pooling strategy. Given the VGG11 design of doubling the receptive field after each layer, combined with an input size of 225x225 pixels, the optimal number of convolution-and-pooling layers for our model was five, or the model would struggle to produce response profiles mimicking those of the type-II component in the subsequent fully connected layers (Figure 5).

      […]

      A minimum of two fully connected layers was needed to achieve this in our case, and adding more fully connected layers would make them behave more like the component (Figure 5).”

      (4) Can the author explain why the number of layers in the final model is optimal by benchmarking the brain hierarchy?

      We have incorporated the figure describing the correlation between each model and the MEG components (previously Figure 5) with the figures describing the response profiles (Figures 4 and 5 in the revised manuscript and Supplementary Figures 2-6). This way, we (and the reader) can now benchmark every model qualitatively and quantitatively.

      As we stated in our response to the previous comment, we have added a more thorough discussion on the number of layers, which includes the justification for our choice for the final model. The benchmark we used was primarily whether the model shows the same response patterns as the Type I, Type II and N400 responses, which disqualifies all models with fewer than 5 convolution and 3 fully connected layers. Models with more layers also show the proper response patterns, however we see that there is actually very little difference in the correlation scores between different models. Hence, our justification for sticking with the original VGG11 architecture is that it produces the qualitative best response profiles, while having roughly the same (decently high) correlation with the MEG components. Furthermore, by sticking to the standard architecture, we make it slightly easier to replicate our results as one can use readily available pre-trained ImageNet weights.

      As well as always discussing the correlation scores in tandem with the qualitative analysis, we have added the following statement to the Results:

      “Based on our qualitative and quantitative analysis, the model variant that performed best overall was the model that had the original VGG11 architecture and was preinitialized from earlier training on ImageNet, as depicted in the bottom rows of Figure 4 and Figure 5.”

      Reviewer #2 (Public Review):

      As has been shown over many decades, many potential computational algorithms, with varied model architectures, can perform the task of text recognition from an image. However, there is no evidence presented here that this particular algorithm has comparable performance to human behavior (i.e. similar accuracy with a comparable pattern of mistakes). This is a fundamental prerequisite before attempting to meaningfully correlate these layer activations to human neural activations. Therefore, it is unlikely that correlating these derived layer weights to neural activity provides meaningful novel insights into neural computation beyond what is seen using traditional experimental methods.

      We very much agree with the reviewer that a qualitative analysis of whether the model can explain experimental effects needs to happen before a quantitative analysis, such as evaluating model-brain correlation scores. In fact, this is one of the intended key points we wished to make.

      As we discuss at length in the Introduction, “traditional” models of reading (those that do not rely on deep learning) are not able to recognize a word regardless of exact letter shape, size, and (up to a point) rotation. In this study, our focus is on these low-level visual tasks rather than high-level tasks concerning semantics. As the Reviewer correctly states, there are many potential computational algorithms able to perform these visual task at a human level and so we need to evaluate the model not only on its ability to mimic human accuracy but also on generating a comparable pattern of mistakes. In our case, we need a pattern of behavior that is indicative of the visual processes at the beginning of the reading pipeline. Hence, rather than relying on behavioral responses that are produced at the very end, we chose the evaluate the model based on three MEG components that provide “snapshots” of the reading process at various stages. These components are known to manifest a distinct pattern of “behavior” in the way they respond to different experimental conditions (Figure 2), akin to what to Reviewer refers to as a “pattern of mistakes”. The model was first evaluated on its ability to replicate the behavior of the MEG components in a qualitative manner (Figure 4). Only then do we move on to a quantitative correlation analysis. In this manner, we feel we are in agreement with the approach advocated by the Reviewer.

      In the Introduction, we now clarify:

      “Another limitation is that these models have primarily focused on feed-back lexicosemantic effects while oversimplifying the initial feed-forward processing of the visual input.

      […]

      We sought to construct a model that is able to recognize words regardless of length, size, typeface and rotation, as well as humans can, so essentially perfectly, whilst producing activity that mimics the type-I, type-II, and N400m components which serve as snapshots of this process unfolding in the brain.

      […]

      These variations were first evaluated on their ability to replicate the experimental effects in that study, namely that the type-I response is larger for noise embedded words than all other stimuli, the type-II response is larger for all letter strings than symbols, and that the N400m is larger for real and pseudowords than consonant strings. Once a variation was found that could reproduce these effects satisfactorily, it was further evaluated based on the correlation between the amount of activation of the units in the model and MEG response amplitude.”

      To make this prerequisite more clear, we have removed what was previously Figure 5, which showed the correlation between the various models the MEG components out of the context of their response patterns. Instead, these correlation values are now always presented next to the response patterns (Figures 4 and 5, and Supplementary Figures 2-6 in the revised manuscript). This invites the reader to always consider these metrics in relation to one another.

      One example of a substantial discrepancy between this model and neural activations is that, while incorporating frequency weighting into the training data is shown to slightly increase neural correlation with the model, Figure 7 shows that no layer of the model appears directly sensitive to word frequency. This is in stark contrast to the strong neural sensitivity to word frequency seen in EEG (e.g. Dambacher et al 2006 Brain Research), fMRI (e.g. Kronbichler et al 2004 NeuroImage), MEG (e.g. Huizeling et al 2021 Neurobio. Lang.), and intracranial (e.g. Woolnough et al 2022 J. Neurosci.) recordings. Figure 7 also demonstrates that the late stages of the model show a strong negative correlation with font size, whereas later stages of neural visual word processing are typically insensitive to differences in visual features, instead showing sensitivity to lexical factors.

      We are glad the reviewer brought up the topic of frequency balancing, as it is a good example of the importance of the qualitative analysis. Frequency balancing during training only had a moderate impact on correlation scores and from that point of view does not seem impactful. However, when we look at the qualitative evaluation, we see that with a large vocabulary, a model without frequency balancing fails to properly distinguish between consonant strings and (pseudo)words (Figure 4, 5th row). Hence, from the point of view of being able to reproduce experimental effects, frequency balancing had a large impact. We now discuss this more explicitly in the revised Discussion section:

      “Overall, we found that a qualitative evaluation of the response profiles was more helpful than correlation scores. Often, a deficit in the response profile of a layer that would cause a decrease in correlation on one condition would be masked by an increased correlation in another condition. A notable example is the necessity for frequency-balancing the training data when building models with a vocabulary of 10 000. Going by correlation score alone, there does not seem to be much difference between the model trained with and without frequency balancing (Figure 4A, fifth row versus bottom row). However, without frequency balancing, we found that the model did not show a response profile where consonant strings were distinguished from words and pseudowords (Figure 4A, fifth row), which is an important behavioral trait that sets the N400m component apart from the Type-II component (Figure 2D). This underlines the importance of the qualitative evaluation in this study, which was only possible because of a straightforward link between the activity simulated within a model to measurements obtained from the brain, combined with the presence of clear experimental conditions.”

      It is true that the model, even with frequency balancing, only captures letter- and bigramfrequency effects and not the word-frequency effects that we know the N400m is sensitive to. Since our model is restricted to feed-forward processes, this finding adds to the evidence that frequency-modulated effects are driven by feed-back effects as modeled by Nour Eddine et al. (2024, doi:10.1016/j.cognition.2024.105755). See also our response to the next comment by the Reviewer where we discuss feed-back connections. We have added the following to the section about model limitations in the revised Discussion:

      “The fact that the model failed to simulate the effects of word-frequency on the N400m (Figure 8), even after frequency-balancing of the training data, is additional evidence that this effect may be driven by feed-back activity, as for example modeled by Nour Eddine et al. (2024).”

      Like the Reviewer, we initially thought that later stages of neural visual word processing would be insensitive to differences in font size. When diving into the literature to find support for this claim, we found only a few works directly studying the effect of font size on evoked responses, but, surprisingly, what we did find seemed to align with our model. We have added the following to our revised Discussion:

      “The fully connected linear layers in the model show a negative correlation with font size. While the N400 has been shown to be unaffected by font size during repetition priming (Chauncey et al., 2008), it has been shown that in the absence of priming, larger font sizes decrease the evoked activity in the 300–500 ms window (Bayer et al., 2012; Schindler et al., 2018). Those studies refer to the activity within this time window, which seems to encompass the N400, as early posterior negativity (EPN). What possibly happens in the model is that an increase in font size causes an initial stronger activation in the first layers, due to more convolution units receiving input. This leads to a better signal-to-noise ratio (SNR) later on, as the noise added to the activation of the units remains constant whilst the amplitude of the input signal increases. A better SNR translates ultimately in less co-activation of units corresponding to orthographic neighbours in the final layers, hence to a decrease in overall layer activity.”

      Another example of the mismatch between this model and the visual cortex is the lack of feedback connections in the model. Within the visual cortex, there are extensive feedback connections, with later processing stages providing recursive feedback to earlier stages. This is especially evident in reading, where feedback from lexical-level processes feeds back to letter-level processes (e.g. Heilbron et al 2020 Nature Comms.). This feedback is especially relevant for the reading of words in noisy conditions, as tested in the current manuscript, as lexical knowledge enhances letter representation in the visual cortex (the word superiority effect). This results in neural activity in multiple cortical areas varying over time, changing selectivity within a region at different measured time points (e.g. Woolnough et al 2021 Nature Human Behav.), which in the current study is simplified down to three discrete time windows, each attributed to different spatial locations.

      We agree with the Reviewer that a full model of reading in the brain must include feed-back connections and share their sentiment that these feed-back processes play an important role and are a fascinating topic to study. The intent for the model presented in our study is very much to be a stepping stone towards extending the capabilities of models that do include such connections.

      However, there is a problem of scale that cannot be ignored.

      Current models of reading that do include feedback connections fall into the category we refer to in the paper as “traditional models” and all only a few layers deep and operate on very simplified inputs, such as pre-defined line segments, a few pixels, or even a list of prerecognized letters. The Heilbron et al. 2020 study that the Reviewer refers to is a good example of such a model. (This excellent and relevant work was somehow overlooked in our literature discussion in the Introduction. We thank the Reviewer for pointing it out to us.) Models incorporating realistic feed-back activity need these simplifications, because they have a tendency to no longer converge when there are too many layers and units. However, in order for models of reading to be able to simulate cognitive behavior such as resolving variations in font size or typeface, or distinguish text from non-text, they need to operate on something close to the pixel-level data, which means they need many layers and units.

      Hence, as a stepping stone, it is reasonable to evaluate a model that has the necessary scale, but lacks the feed-back connections that would be problematic at this scale, to see what it can and cannot do in terms of explaining experimental effects in neuroimaging studies. This was the intended scope of our study. For the revision, we have attempted to make this more clear.

      We have changed the title to be:

      “Convolutional networks can model the functional modulation of the MEG responses associated with feed-forward processes during visual word recognition” and added the following to the Introduction:

      “The simulated environments in these models are extremely simplified, partly due to computational limitations and partly due to the complex interaction of feed-forward and feed-back connectivity that causes problems with convergence when the model grows too large. Consequently, these models have primarily focused on feed-back lexico-semantic effects while oversimplifying the initial feed-forward processing of the visual input. 

      […]

      This rather high level of visual representation sidesteps having to deal with issues such as visual noise, letters with different scales, rotations and fonts, segmentation of the individual letters, and so on. More importantly, it makes it impossible to create the visual noise and symbol string conditions used in the MEG study to modulate the type-I and type-II components. In order to model the process of visual word recognition to the extent where one may reproduce neuroimaging studies such as Vartiainen et al. (2011), we need to start with a model of vision that is able to directly operate on the pixels of a stimulus. We sought to construct a model that is able to recognize words regardless of length, size, typeface and rotation with very high accuracy, whilst producing activity that mimics the type-I, type-II, and N400m components which serve as snapshots of this process unfolding in the brain. For this model, we chose to focus on the early feed-forward processing occurring during visual word recognition, as the experimental setup in the MEG study was designed to demonstrate, rather than feed-back effects

      […]

      By doing so, we restrict ourselves to an investigation of how well the three evoked components can be explained by a feed-forward CNN in an experimental setting designed to demonstrate feed-forward effects. > As such, the goal is not to present a complete model of all aspects of reading, which should include feed-back effects, but rather to demonstrate the effectiveness of using a model that has a realistic form of input when the aim is to align the model with the evoked responses observed during visual word recognition.”

      And we have added the following to the Discussion section:

      “In this paper we have restricted our simulations to feed-forward processes. Now, the way is open to incorporate convolution-and-pooling principles in models of reading that simulate feed-back processes as well, which should allow the model to capture more nuance in the Type-II and N400m components, as well as extend the simulation to encompass a realistic semantic representation. A promising way forward may be to use a network architecture like CORNet (Kubilius et al., 2019), that performs convolution multiple times in a recurrent fashion, yet simultaneously propagates activity forward after each pass. The introduction of recursion into the model will furthermore align it better with traditional-style models, since it can cause a model to exhibit attractor behavior (McLeod et al., 2000), which will be especially important when extending the model into the semantic domain.

      Furthermore, convolution-and-pooling has recently been explored in the domain of predictive coding models (Ororbia & Mali, 2023), a type of model that seems particularly well suited to model feed-back processes during reading (Gagl et al., 2020; Heilbron et al., 2020; Nour Eddine et al., 2024).”

      We also would like to point out to the Reviewer that we did in fact perform a correlation between the model and the MNE-dSPM source estimate of all cortical locations and timepoints (Figure 7B). Such a brain-wide correlation map confirms that the three dipole groups are excellent summaries of when and where interesting effects occur within this dataset.

      The presented model needs substantial further development to be able to replicate, both behaviorally and neurally, many of the well-characterized phenomena seen in human behavior and neural recordings that are fundamental hallmarks of human visual word processing. Until that point, it is unclear what novel contributions can be gleaned from correlating low-dimensional model weights from these computational models with human neural data.

      We hope that our revisions have clarified the goals and scope of this study. The CNN model we present in this study is a small but, we feel, essential piece in a bigger effort to employ deep learning techniques to further enhance already existing models of reading. In our revision, we have extended our discussion where to go from here and outline our vision on how these techniques could help us better model the phenomena the reviewer speaks of. We agree with the reviewer that there is a long way to go, and we are excited to be a part of it.

      In addition to the changes described above, we now end the Discussion section as follows: 

      “Despite its limitations, our model is an important milestone for computational models of reading that leverages deep learning techniques to encompass the entire computational process starting from raw pixels values to representations of wordforms in the mental lexicon. The overall goal is to work towards models that can reproduce the dynamics observed in brain activity observed during the large number of neuroimaging experiments performed with human volunteers that have been performed over the last few decades. To achieve this, models need to be able to operate on more realistic inputs than a collection of predefined lines or letter banks (for example: Coltheart et al., 2001; Heilbron et al., 2020; Laszlo & Armstrong, 2014; McClelland & Rumelhart, 1981; Nour Eddine et al., 2024). We have shown that even without feed-back connections, a CNN can simulate the behavior of three important MEG evoked components across a range of experimental conditions, but only if unit activations are noisy and the frequency of occurrence of words in the training dataset mimics their frequency of use in actual language.”

      Reviewer #3 (Public Review):

      The paper is rather qualitative in nature. In particular, the authors show that some resemblance exists between the behavior of some layers and some parts of the brain, but it is hard to quantitively understand how strong the resemblances are in each layer, and the exact impact of experimental settings such as the frequency balancing (which seems to only have a very moderate effect according to Figure 5).

      The large focus on a qualitative evaluation of the model is intentional. The ability of the model to reproduce experimental effects (Figure 4) is a pre-requisite for any subsequent quantitative metrics (such as correlation) to be valid. The introduction of frequency balancing is a good example of this. As the reviewer points out, frequency balancing during training has only a moderate impact on correlation scores and from that point of view does not seem impactful. However, when we look at the qualitative evaluation, we see that with a large vocabulary, a model without frequency balancing fails to properly distinguish between consonant strings and (pseudo)words (Figure 4, 5th row). Hence, from the point of view of being able to reproduce experimental effects, frequency balancing has a large impact.

      That said, the reviewer is right to highlight the value of quantitative analysis. An important limitation of the “traditional” models of reading that do not employ deep learning is that they operate in unrealistically simplified environments (e.g. input as predefined line segments, words of a fixed length), which makes a quantitative comparison with brain data problematic. The main benefit that deep learning brings may very well be the increase in scale that makes more direct comparisons with brain data possible. In our revision we attempt to capitalize on this benefit more. The reviewer has provided some helpful suggestions for doing so in their recommendations, which we discuss in detail below.

      We have added the following discussion on the topic of qualitative versus quantitative analysis to the Introduction:

      “We sought to construct a model that is able to recognize words regardless of length, size, typeface and rotation, as well as humans can, so essentially perfectly, whilst producing activity that mimics the type-I, type-II, and N400m components which serve as snapshots of this process unfolding in the brain.

      […]

      These variations were first evaluated on their ability to replicate the experimental effects in that study, namely that the type-I response is larger for noise embedded words than all other stimuli, the type-II response is larger for all letter strings than symbols, and that the N400m is larger for real and pseudowords than consonant strings. Once a variation was found that could reproduce these effects satisfactorily, it was further evaluated based on the correlation between the amount of activation of the units in the model and MEG response amplitude.”

      And follow this up in the Discussion with a new sub-section entitled “On the importance of experimental contrasts and qualitative analysis of the model”

      The experiments only consider a rather outdated vision model (VGG).

      VGG was designed to use a minimal number of operations (convolution-and-pooling, fullyconnected linear steps, ReLU activations, and batch normalization) and rely mostly on scale to solve the classification task. This makes VGG a good place to start our explorations and see how far a basic CNN can take us in terms of explaining experimental MEG effects in visual word recognition. However, we agree with the reviewer that it is easy to envision more advanced models that could potentially explain more. In our revision, we expand on the question of where to go from here and outline our vision on what types of models would be worth investigating and how one may go about doing that in a way that provides insights beyond higher correlation values.

      We have included the following in our Discussion sub-sections on “Limitations of the current model and the path forward”:

      “The VGG-11 architecture was originally designed to achieve high image classification accuracy on the ImageNet challenge (Simonyan & Zisserman, 2015). Although we have introduced some modifications that make the model more biologically plausible, the final model is still incomplete in many ways as a complete model of brain function during reading.

      […]

      In this paper we have restricted our simulations to feed-forward processes. Now, the way is open to incorporate convolution-and-pooling principles in models of reading that simulate feed-back processes as well, which should allow the model to capture more nuance in the Type-II and N400m components, as well as extend the simulation to encompass a realistic semantic representation. A promising way forward may be to use a network architecture like CORNet (Kubilius et al., 2019), that performs convolution multiple times in a recurrent fashion, yet simultaneously propagates activity forward after each pass. The introduction of recursion into the model will furthermore align it better with traditional-style models, since it can cause a model to exhibit attractor behavior (McLeod et al., 2000), which will be especially important when extending the model into the semantic domain. Furthermore, convolution-and-pooling has recently been explored in the domain of predictive coding models (Ororbia & Mali, 2023), a type of model that seems particularly well suited to model feed-back processes during reading (Gagl et al., 2020; Heilbron et al., 2020; Nour Eddine et al., 2024).”

      Reviewer #3 (Recommendations For The Authors):

      (1) The method used to select the experimental conditions under which the behavior of the CNN is the most brain-like is rather qualitative (Figure 4). It would have been nice to have a plot where the noisyness of the activations, the vocab size and the amount of frequency balancing are varied continuously, and show how these three parameters impact the correlation of the model layers with the MEG responses.

      We now include this analysis (Figure 6 in the revised manuscript, Supplementary Figures 47) and discuss these factors in the revised Results section:

      “Various other aspects of the model architecture were evaluated which ultimately did not lead to any improvements of the model. The response profiles can be found in the supplementary information (Supplementary Figures 4–7) and the correlations between the models and the MEG components are presented in Figure 6. The vocabulary of the final model (10 000) exceeds the number of units in its fullyconnected layers, which means that a bottleneck is created in which a sub-lexical representation is formed. The number of units in the fully-connected layers, i.e. the width of the bottleneck, has some effect on the correlation between model and brain (Figure 6A), and the amount of noise added to the unit activations less so (Figure 6B). We already saw that the size of the vocabulary, i.e. the number of wordforms in the training data and number of units in the output layer of the model, had a large effect on the response profiles (Figure 4). Having a large vocabulary is of course desirable from a functional point of view, but also modestly improves correlation between model and brain (Figure 6C). For large vocabularies, we found it beneficial to apply frequency-balancing of the training data, meaning that the number of times a word-form appears in the training data is scaled according to its frequency in a large text corpus. However, this cannot be a one-to-one scaling, since the most frequent words occur so much more often than other words that the training data would consist of mostly the top-ten most common words, with less common words only occurring once or not at all. Therefore, we decided to scale not by the frequency 𝑓 directly, but by 𝑓𝑠, where 0 < 𝑠 < 1, opting for 𝑠 = 0.2 for the final model (Figure 6D).”

      (2) It is not clear which layers exactly correspond to which of the three response components. For this to be clearer, it would have been nice to have a plot with all the layers of VGG on the x-axis and three curves corresponding to the correlation of each layer with each of the three response components.

      This is a great suggestion that we were happy to incorporate in the revised version of the manuscript. Every figure comparing the response patterns of the model and brain now includes a panel depicting the correlation between each layer of the model and each of the three MEG components (Figures 4 & 5, Supplementary Figures 2-5). This has given us (and now also the reader) the ability to better benchmark the different models quantitatively, adding to our discussion on qualitative to quantitative analysis.

      (3) It is not clear to me why the authors report the correlation of all layers with the MEG responses in Figure 5: why not only report the correlation of the final layers for N400, and that of the first layers for type-I?

      We agree with the reviewer that it would have been better to compare the correlation scores for those layers which response profile matches the MEG component. While the old Figure 5 has been merged with Figure 4, and now provides the correlations between all the layers and all MEG components, we have taken the Reviewer’s advice and marked the layers which qualitatively best correspond to each MEG component, so the reader can take that into account when interpreting the correlation scores.

      (4) The authors mention that the reason that they did not reproduce the protocol with more advanced vision models is that they needed the minimal setup capable of yielding the desired experiment effect. I am not fully convinced by this and think the paper could be significantly strengthened by reporting results for a vision transformer, in particular to study the role of attention layers which are expected to play an important role in processing higher-level features.

      We appreciate and share the Reviewer’s enthusiasm in seeing how other model architectures would fare when it comes to modeling MEG components. However, we regard modifying the core model architecture (i.e., a series of convolution-and-pooling followed by fully-connected layers) to be out of scope for the current paper.

      One of the key points of our study is to create a model that reproduces the experimental effects of an existing MEG study, which necessitates modeling the initial feed-forward processing from pixel to word-form. For this purpose, a convolution-and-pooling model was the obvious choice, because these operations play a big role in cognitive models of vision in general. In order to properly capture all experimental contrasts in the MEG study, many variations of the CNN were trained and evaluated. This iterative design process concluded when all experimental contrasts could be faithfully reproduced.

      If we were to explore different model architectures, such as a transformer architecture, reproducing the experimental contrasts of the MEG study would no longer be the end goal, and it would be unclear what the end goal should be. Maximizing correlation scores has no end, and there are a nearly endless number of model architectures one could try. We could bring in a second MEG study with experimental contrasts that the CNN cannot explain and a transformer architecture potentially could and set the end goal to explain all experimental effects in both MEG studies. But even if we had access to such a dataset, this would almost double the length of the paper, which is already too long.

    1. Author response:

      The following is the authors’ response to the previous reviews.

      Public Reviews:

      Reviewer #1 (Public review):

      Summary:

      Insects and their relatives are commonly infected with microbes that are transmitted from mothers to their offspring. A number of these microbes have independently evolved the ability to kill the sons of infected females very early in their development; this male killing strategy has evolved because males are transmission dead-ends for the microbe. A major question in the field has been to identify the genes that cause male killing and to understand how they work. This has been especially challenging because most male-killing microbes cannot be genetically manipulated. This study focuses on a male-killing bacterium called Wolbachia. Different Wolbachia strains kill male embryos in beetles, flies, moths, and other arthropods. This is remarkable because how sex is determined differs widely in these hosts. Two Wolbachia genes have been previously implicated in male-killing by Wolbachia: oscar (in moth male-killing) and wmk (in fly male-killing). The genomes of some male-killing Wolbachia contain both of these genes, so it is a challenge to disentangle the two.

      This paper provides strong evidence that oscar is responsible for male-killing in moths. Here, the authors study a strain of Wolbachia that kills males in a pest of tea, Homona magnanima. Overexpressing oscar, but not wmk, kills male moth embryos. This is because oscar interferes with masculinizer, the master gene that controls sex determination in moths and butterflies. Interfering with the masculinizer gene in this way leads the (male) embryo down a path of female development, which causes problems in regulating the expression of genes that are found on the sex chromosomes.

      We would like to thank you for evaluating our manuscript.

      Strengths:

      The authors use a broad number of approaches to implicate oscar, and to dissect its mechanism of male lethality. These approaches include: a) overexpressing oscar (and wmk) by injecting RNA into moth eggs, b) determining the sex of embryos by staining female sex chromosomes, c) determining the consequences of oscar expression by assaying sex-specific splice variants of doublesex, a key sex determination gene, and by quantifying gene expression and dosage of sex chromosomes, using RNASeq, and d) expressing oscar along with masculinizer from various moth and butterfly species, in a silkmoth cell line. This extends recently published studies implicating oscar in male-killing by Wolbachia in Ostrinia corn borer moths, although the Homona and Ostrinia oscar proteins are quite divergent. Combined with other studies, there is now broad support for oscar as the male-killing gene in moths and butterflies (i.e. order Lepidoptera). So an outstanding question is to understand the role of wmk. Is it the master male-killing gene in insects other than Lepidoptera and if so, how does it operate?

      We would like to thank you for evaluating our manuscript. Our data demonstrated that Oscar homologs play important roles in male-killing phenotypes in moths and butterflies; however, the functional relevance of wmk remains uncertain. As you noted, whether wmk acts as a male-killing gene in insects such as flies and beetles—or even in certain lepidopteran species—requires further investigation using diverse insect models, which we are eager to explore in future research.

      Weaknesses:

      I found the transfection assays of oscar and masculinizer in the silkworm cell line (Figure 4) to be difficult to follow. There are also places in the text where more explanation would be helpful for non-experts.

      Thank you for your suggestion. We have revised the section on the cell-based experiment. Further, we revised the manuscript to make it accessible to a broader audience. We believe these revisions have significantly improved the clarity and comprehensiveness of our manuscript.

      Reviewer #2 (Public review):

      Summary:

      Wolbachia are maternally transmitted bacteria that can manipulate host reproduction in various ways. Some Wolbachia induce male killing (MK), where the sons of infected mothers are killed during development. Several MK-associated genes have been identified in Homona magnanima, including Hm-oscar and wmk-1-4, but the mechanistic links between these Wolbachia genes and MK in the native host are still unclear.

      In this manuscript, Arai et al. show that Hm-oscar is the gene responsible for Wolbachia-induced MK in Homona magnanima. They provide evidence that Hm-Oscar functions through interactions with the sex determination system. They also found that Hm-Oscar disrupts sex determination in male embryos by inducing female-type dsx splicing and impairing dosage compensation. Additionally, Hm-Oscar suppresses the function of Masc. The manuscript is well-written and presents intriguing findings. The results support their conclusions regarding the diversity and commonality of MK mechanisms, contributing to our understanding of the mechanisms and evolutionary aspects of Wolbachia-induced MK.

      We would like to thank you for evaluating our manuscript.

      Comments on revisions:

      The authors have already addressed the reviewer's concerns.

      We would like to thank you for evaluating our manuscript.

      Reviewer #3 (Public review):

      Summary:

      Overall, this is a clearly written manuscript with nice hypothesis testing in a non-model organism that addresses the mechanism of Wolbachia-mediated male killing. The authors aim to determine how five previously identified male-killing genes (encoded in the prophage region of the wHm Wolbachia strain) impact the native host, Homona magnanima moths. This work builds on the authors' previous studies in which

      (1) they tested the impact of these same wHm genes via heterologous expression in Drosophila melanogaster

      (2) also examined the activity of other male-killing genes (e.g., from the wFur Wolbachia strain in its native host: Ostrinia furnacalis moths).

      Advances here include identifying which wHm gene most strongly recapitulates the male-killing phenotype in the native host (rather than in Drosophila), and the finding that the Hm-Oscar protein has the potential for male-killing in a diverse set of lepidopterans, as inferred by the cell-culture assays.

      We would like to thank you for evaluating our manuscript.

      Strengths:

      Strengths of the manuscript include the reverse genetics approaches to dissect the impact of specific male-killing loci, and use of a "masculinization" assay in Lepidopteran cell lines to determine the impact of interactions between specific masc and oscar homologs.

      We would like to thank you for evaluating our manuscript.

      Weaknesses:

      It is clear from Figure 1 that the combinations of wmk homologs do not cause male killing on their own here. While I largely agree with the author's conclusions that oscar is the primary MK factor in this system, I don't think we can yet rule out that wmk(s) may work synergistically or interactively with oscar in vivo. This might be worth a small note in the discussion. (eg at line 294 'indicating that wmk likely targets factors other than masc." - this could be downstream of the impacts of oscar; perhaps dependent on oscar-mediated impacts on masc first).

      We sincerely appreciate your suggestion. Whilst wmk genes themselves did not exhibit apparent lethal effects on the native host, as you noted, we cannot entirely rule out the possibility that wmk may be involved in male-killing actions, either directly or indirectly assisting the function of Hb-oscar. Following your suggestion, we have added a brief note in the discussion section regarding the interpretation of wmk functions.

      “In addition, Katsuma et al. (2022) reported that the wmk homologs encoded by wFur did not affect the masculinizing function of masc in vitro, indicating that wmk likely targets factors other than masc. Whilst we cannot rule out the possibility that wmk may work synergistically or interactively with oscar in vivo—potentially acting downstream of oscar’s impact—our results strongly suggested that Wolbachia strains have acquired multiple MK genes through evolution.” (lines 287-292)

      Regarding the perceived male-bias in Figure 2a: I think readers might be interpreting "unhatched" as "total before hatching". You could eliminate ambiguity by perhaps splitting the bars into male and female, and then within a bar, coloring by hatched versus unhatched. But this is a minor point, and I think the updated text helps clarify this.

      Thank you for your suggestion. We have accordingly revised the figure 2a. In addition, we have included more detailed information in the first sentence of the section Males are killed mainly at the embryonic stage.

      “The sex of hatched larvae (neonates) and the remaining unhatched embryos was determined by the presence or absence of W chromatin, a condensed structure of the female-specific W chromosome observed during interphase.” (lines 171-173)

      The new Figure 4b looks to be largely redundant with the oscar information in Figure 1a.

      Thank you for your suggestion. We have removed Figure 4b due to its overlap with Figure 1a and have incorporated relevant figure legends into the Figure 1a legend.

      Updated statistical comparisons for the RNA-seq analysis are helpful. However these analyses are based on single libraries (albeit each a pool of many individuals), so this is still a weaker aspect of the manuscript.

      Thank you for your suggestion. As you noted, the use of single libraries (due to the limited number of available individuals, though each includes approximately 50 males and females) may be a potential limitation of this study. However, as demonstrated in the qPCR assay for the Z-linked gene provided in the previous revision, we believe that our data and conclusion—that Wolbachia/ Hb-oscar disrupts dosage compensation by causing the overexpression of Z-linked genes—are well-supported and robust.

      The new information on masc similarity is useful (Fig 4d) - if the authors could please include a heatmap legend for the colors, that would be helpful. Also, please avoid green and red in the same figure when key for interpretation.

      Thank you for your suggestion. We have accordingly included a heatmap legend and revised the colors.

      Figure 1A "helix-turn-helix" is misspelled. ("tern").

      We have revised.

      Recommendations for the authors:

      Comments from the reviewing editor: I would suggest you address the comments of the reviewer on the revised version.

      We have further revised the manuscript to address all the questions, comments and suggestions provided by the reviewers. We believe that the resulting revisions have significantly enhanced the quality and comprehensiveness of our manuscript.

      Reviewer #1 (Recommendations for the authors):

      Thank you for revising this manuscript. I have a few last recommendations:

      - Line 214: re: 'Statistical data are available in the supplementary data file', it would be more helpful to add a few words here that actually summarize the statistical results

      We would like to thank you for your suggestion. We have revised the sentence to describe the overview of the statistical results.

      “RNA-seq analysis revealed that, in Hm-oscar-injected embryos, Z-linked genes (homologs on the B. mori chromosomes 1 and 15) were more expressed in males than in females (Fig. 3a), which was not observed in the GFP-injected group (Fig. 3b). Similarly, as previously reported by Arai et al. (2023a), high levels of Z-linked gene expression were also observed in wHm-t-infected males, but not in NSR males (Fig. 3c,d). The high (i.e., doubled) Z-linked gene expression in both Hm-oscar-expressed and wHm-t-infected males was further confirmed by quantification of the Z-linked Hmtpi gene (Fig. 3e). These trends were statistically supported, with all data available in the supplementary data file.” (lines 205-213)

      - Figure 1 legend: do you mean 'bridged' instead of 'brigged'?

      We have accordingly revise, thank you for the suggestion.

    1. Author response:

      The following is the authors’ response to the previous reviews.

      Reviewer 1:

      (1) The results do not support the conclusions. The main "selling point" as summarized in the title is that the apoptotic rate of zebrafish motorneurons during development is strikingly low (~2% ) as compared to the much higher estimate (~50%) by previous studies in other systems. The results used to support the conclusion are that only a small percentage (under 2%) of apoptotic cells were found over a large population at a variety of stages 24-120hpf. This is fundamentally flawed logic, as a short-time window measure of percentage cannot represent the percentage on the long-term. For example, at any year under 1% of human population die, but over 100 years >99% of the starting group will have died. To find the real percentage of motorneurons that died, the motorneurons born at different times must be tracked over long term, or the new motorneuron birth rate must be estimated. Similar argument can be applied to the macrophage results.<br />

      In the revised manuscript (revised Figure 4), we extended the observation time window as long as possible, from 24 hpf to 240 hpf. After 240 hpf, the transparency of zebrafish body decreased dramatically, which made optical imaging quite difficult.

      We are confident that this 24-240 hpf time window covers the major time window during which motor neurons undergo programmed cell death during zebrafish early development. We chose the observation time window based on the following two reasons: 1) Previous studies showed that although the time windows of motor neuron death vary in chick (E5-E10), mouse (E11.5-E15.5), rat (E15-E18), and human (11-25 weeks of gestation), the common feature of these time windows is that they are all the developmental periods when motor neurons contact with muscle cells. The contact between zebrafish motor neurons and muscle cells occurs before 72 hpf, which is included in our observation time window. 2) Most organs of zebrafish form before 48-72 hpf, and they complete hatching during 48-72 hpf. Food-seeking and active avoidance behaviors also start at 72 hpf, indicating that motor neurons are fully functional at 72 hpf.

      Previous studies in zebrafish have shown that the production of spinal cord motor neurons largely ceases before 48 hpf, and then the motor neurons remain largely constant until adulthood (doi: 10.1016/j.celrep.2015.09.050; 10.1016/j.devcel.2013.04.012; 10.1007/BF00304606; 10.3389/fcell.2021.640414). Our observation time window covers the major motor neuron production process. Therefore, we believe that neurogenesis will not affect our findings and conclusions.

      Although we are confident that 240 h tracking is long enough to measure the motor neuron death rate, several sentences have been added in the discussion part, “In our manuscript, we tracked the motor neuron death in live zebrafish until 240 hpf, which was the longest time window we could achieve. But there was still a possibility that zebrafish motor neurons might die after 240 hpf.”

      We agreed that the “2%” description might not be very accurate. Thus, we have revised our title to “Zebrafish live imaging reveals a surprisingly small percentage of spinal cord motor neurons die during early development.”

      (2) The conclusion regarding timing of axon and cell body caspase activation and apoptosis timing also has clear issues. The ~minutes measurement are too long as compared to the transport/diffusion timescale between the cell body and the axon, caspase activity could have been activated in the cell body and either caspase or the cleaved sensor move to the axon in several seconds. The authors' results are not high frequency enough to resolve these dynamics. Many statements suggest oversight of literature, for example, in abstract "however, there is still no real-time observation showing this dying process in live animals.".

      Real-time imaging of live animals is quite challenging in the field. Currently, using confocal microscopy, we can only achieve minute-scale tracking. In the future, with more advanced imaging techniques, the sensor fish in the present study may provide us with more detailed information on motor neuron death. We have removed “real-time” from our revised manuscript. We also revised the mentioned sentence in the abstract.

      (3) Many statements should use more scholarly terms and descriptions from the spinal cord or motorneuron, neuromuscular development fields, such as line 87 "their axons converged into one bundle to extend into individual somite, which serves as a functional unit for the development and contraction of muscle cells"

      We have removed this sentence.

      (4) The transgenic line is perhaps the most meaningful contribution to the field as the work stands. However, mnx1 promoter is well known for its non-specific activation - while the images do suggest the authors' line is good, motorneuron markers should be used to validate the line. This is especially important for assessing this population later as mnx1 may be turned off in mature neurons. The author's response regarding mnx1 specificity does not mitigate the original concern.

      The mnx1 promoter has been widely used to label motor neurons in transgenic zebrafish. Previous studies have shown that most of the cells labeled in the mnx1 transgenic zebrafish are motor neurons. In this study, we observed that the neuronal cells in our sensor zebrafish formed green cell bodies inside of the spinal cord and extended to the muscle region, which is an important morphological feature of the motor neurons.

      Furthermore, a few of those green cell bodies turned into blue apoptotic bodies inside the spinal cord and changed to blue axons in the muscle regions at the same time, which strongly suggests that those apoptotic neurons are not interneurons.

      In fact, no matter what method is used, such as using antibodies to stain specific markers to label motor neurons, 100% specificity cannot be achieved. More importantly, although the mnx1 promoter might have labeled some interneurons, this will not affect our major finding that only a small percentage of spinal cord motor neurons die during the early development of zebrafish.

      Reviewer 2:

      (1) Title: The 50% figure of motor neurons dying through apoptosis during early vertebrate development is not precisely accurate. In papers referenced by the authors, there is a wide distribution of percentages of motor neurons that die depending on the species and the spinal cord region. In addition, the authors did not examine limb-innervating motor neurons, which are the ones best studied in motor neuron programmed cell death in other species. Thus, a better title that reflects what they actually show would be something like "A surprisingly small percentage of early developing zebrafish motor neurons die through apoptosis in non-limb innervating regions of the spinal cord."

      In fish, there are no such structures as limbs, although fins may be evolutionarily related to limbs. In our manuscript, we studied the naturally occurring motor neuron death in the whole spinal cord during the early stage of zebrafish development. The death of motor neurons in limb-innervating motor neurons has been extensively studied in chicks and rodents, as it is easy to undergo operations such as amputation. However, previous studies have shown this dramatic motor neuron death occurs not only in limb-innervating motor neurons but also in other spinal cord motor neurons (doi: 10.1006/dbio.1999.9413).

      We have revised our title to “Zebrafish live imaging reveals a surprisingly small percentage of spinal cord motor neurons die during early development.”

      (2) lines 18-19: "embryonic stage of vertebrates" is very broad, since zebrafish are also vertebrates; it would be better to be more specific

      lines 25-26: The authors should be more specific about which animals have widespread neuronal cell death.

      We have revised our manuscript accordingly.

      (3) lines 98-99; 110-111; 113; 122-123; 140-141: A cell can undergo apoptosis. But an axon, which is only part of a cell, cannot undergo apoptosis. Especially since the axon doesn't have a separate nucleus, and the definition of apoptosis usually includes nuclear fragmentation. A better subheading would describe the result, which is that caspase activation is seen in both the cell body and the axon.

      We have revised the subheadings and related words in the manuscript accordingly. In the introduction, we also revised the expression of the third aim from “Which part of a neuron (cell body vs. axon) will die first?” to “Which part of a neuron (cell body vs. axon) will degrade first?”.

      (4) lines 159-160; 178-179: This is an oversimplification of the literature. The authors should spell out which populations of motor neuron have been examined and say something about the similarities and difference in motor neuron death.

      We have revised it accordingly.

      (5) lines 200; 216: The authors did not observe macrophages engulfing motor neurons. But that does not mean that they cannot. Making the conclusion stated in this subheading would require some kind of experiment, not just observations.

      We did observe few colocalizations of macrophages and dead motor neurons.  To more accurately express these data, in the revised manuscript, we used “colocalization” to replace “engulfment.” The subheading has been revised to “Most dead motor neurons were not colocalized with macrophages.” Accordingly, panel C of Figure 5 has also been revised.

      (6) lines 234-246: The authors seem to have missed the point about VaP motor neuron death, which was two-fold. First, VaP death has been previously described, thus it could serve as a control for the work in this paper, especially since the conditions underlying VaP death and survival have been experimentally tested. Second, they should acknowledge that previous work showed that at least some motor neuron death in zebrafish differs from that described in chick and rodents. This conclusion came from work showing that death of VaP is independent of limitations in muscle innervation area, suggesting it is not coupled to muscle-derived neurotrophic factors.

      Figures: The authors should say which level of the spinal cord they examined in each figure.

      We have compared our findings with previous findings in the revised manuscript. The death of VaP motor neurons is not related to neurotrophic factors, but the death of other motor neurons may be related to neurotrophic factors, which needs further study and evidence. Our study examined the overall motor neuron apoptosis regardless of the causes and locations. To avoid misunderstanding, in the revised manuscript, we removed the data and words related to neurotrophic factors.

      We also extended the observation time window as long as possible, from 24 hpf to 240 hpf (revised Figure 4). After 240 hpf, the transparency of zebrafish body decreased dramatically, which made the optical imaging quite difficult.

    1. Author response:

      The following is the authors’ response to the original reviews.

      Public Reviews:

      Reviewer #1 (Public Review):

      Experiments in model organisms have revealed that the effects of genes on heritable traits are often mediated by environmental factors---so-called gene-by-environment (or GxE) interactions. In human genetics, however, where indirect statistical approaches must be taken to detect GxE, limited evidence has been found for pervasive GxE interactions. The present manuscript argues that the failure of statistical methods to detect GxE may be due to how GxE is modelled (or not modelled) by these methods.

      The authors show, via re-analysis of an existing dataset in Drosophila, that a polygenic ‘amplification’ model can parsimoniously explain patterns of differential genetic effects across environments. (Work from the same lab had previously shown that the amplification model is consistent with differential genetic effects across the sexes for several traits in humans.) The parsimony of the amplification model allows for powerful detection of GxE in scenarios in which it pertains, as the authors show via simulation.

      Before the authors consider polygenic models of GxE, however, they present a very clear analysis of a related question around GxE: When one wants to estimate the effect of an individual allele in a particular environment, when is it better to stratify one’s sample by environment (reducing sample size, and therefore increasing the variance of the estimator) versus using the entire sample (including individuals not in the environment of interest, and therefore biasing the estimator away from the true effect specific to the environment of interest)? Intuitively, the sample-size cost of stratification is worth paying if true allelic effects differ substantially between the environment of interest and other environments (i.e., GxE interactions are large), but not worth paying if effects are similar across environments. The authors quantify this trade-off in a way that is both mathematically precise and conveys the above intuition very clearly. They argue on its basis that, when allelic effects are small (as in highly polygenic traits), single-locus tests for GxE may be substantially underpowered.

      The paper is an important further demonstration of the plausibility of the amplification model of GxE, which, given its parsimony, holds substantial promise for the detection and characterization of GxE in genomic datasets. However, the empirical and simulation examples considered in the paper (and previous work from the same lab) are somewhat “best-case” scenarios for the amplification model, with only two environments, and with these environments amplifying equally the effects of only a single set of genes. It would be an important step forward to demonstrate the possibility of detecting amplification in more complex scenarios, with multiple environments each differentially modulating the effects of multiple sets of genes. This could be achieved via simulations similar to those presented in the current manuscript.

      Reviewer #2 (Public Review):

      Summary:

      Wine et al. describe a framework to view the estimation of gene-context interaction analysis through the lens of bias-variance tradeoff. They show that, depending on trait variance and context-specific effect sizes, effect estimates may be estimated more accurately in context-combined analysis rather than in context-specific analysis. They proceed by investigating, primarily via simulations, implications for the study or utilization of gene-context interaction, for testing and prediction, in traits with polygenic architecture. First, the authors describe an assessment of the identification of context-specificity (or context differences) focusing on “top hits” from association analyses. Next, they describe an assessment of polygenic scores (PGSs) that account for context-specific effect sizes, showing, in simulations, that often the PGSs that do not attempt to estimate context-specific effect sizes have superior prediction performance. An exception is a PGS approach that utilizes information across contexts. Strengths:

      The bias-variance tradeoff framing of GxE is useful, interesting, and rigorous. The PGS analysis under pervasive amplification is also interesting and demonstrates the bias-variance tradeoff.

      Weaknesses:

      The weakness of this paper is that the first part -- the bias-variance tradeoff analysis -- is not tightly connected to, i.e. not sufficiently informing, the later parts, that focus on polygenic architecture. For example, the analysis of “top hits” focuses on the question of testing, rather than estimation, and testing was not discussed within the bias-variance tradeoff framework. Similarly, while the PGS analysis does demonstrate (well) the bias-variance tradeoff, the reader is left to wonder whether a bias-variance deviation rule (discussed in the first part of the manuscript) should or could be utilized for PGS construction.

      We thank the editors and the reviewers for their thoughtful critique and helpful suggestions throughout. In our revision, we focused on tightening the relationship between the analytical single variant bias-variance tradeoff derivation and the various empirical analyses that follow.

      We improved discussion of our scope and what is beyond our scope. For example, our language was insufficiently clear if it suggested to the editor and reviewers that we are developing a method to characterize polygenic GxE. Developing a new method that does so (let alone evaluating performance across various scenarios) is beyond the scope of this manuscript.

      Similarly, we clarify that we use amplification only as an example of a mode of GxE that is not adequately characterized by current approaches. We do not wish to argue it is an omnibus explanation for all GxE in complex traits. In many cases, a mixture of polygenic GxE relationships seems most fitting (as observed, for example, in Zhu et al., 2023, for GxSex in human physiology).

      Recommendations for the authors:

      Reviewer #1 (Recommendations For The Authors):

      MAJOR COMMENT

      The amplification model is based on an understanding of gene networks in which environmental variables concertedly alter the effects of clusters of genes, or modules, in the network (e.g., if an environmental variable alters the effect of some gene, it indirectly and proportionately alters the effects of genes downstream of that gene in the network---or upstream if the gene acts as a bottleneck in some pathway). It is clear in this model that (i) multiple environmental variables could amplify distinct modules, and (ii) a single environmental variable could itself amplify multiple separate modules, with a separate amplification factor for each module.

      However, perhaps inspired by their previous work on GxSex interactions in humans, the authors’ focus in the present manuscript is on cases where there are only two environments (“control” and “high-sugar diet” in the Drosophila dataset that they reanalyze, and “A” and “B” in their simulations [and single-locus mathematical analysis]), and they consider models where these environments amplify only a single set of genes, i.e., with a single amplification factor. While it is of course interesting that a single-amplification-factor model can generate data that resemble those in the Drosophila dataset that the authors re-analyze, most scenarios of amplification GxE will presumably be more complex. It seems that detecting amplification in these more complex scenarios using methods such as the authors do in their final section will be correspondingly more difficult. Indeed, in the limit of sufficiently many environmental variables amplifying sufficiently many modules, the scenario would resemble one of idiosyncratic single-locus GxE which, as the authors argue, is very difficult to detect. That more complex scenarios of amplification, with multiple environments separately amplifying multiple modules each, might be difficult to detect statistically is potentially an important limitation to the authors’ approach, and should be tested in their simulations.

      We agree that characterizing GxE when there is a mixture of drivers of context-dependency is difficult. Developing a method that does so across multiple (and perhaps not pre-defined) contexts is of high interest to us but beyond the scope of the current manuscript

      We note that for GxSex, modeling this mixture does generally improve phenotypic prediction, and more so in traits where we infer amplification as a major mode of GxE.

      MINOR COMMENTS

      Lines 88-90: “This estimation model is equivalent to a linear model with a term for the interaction between context and reference allele count, in the sense that context-specific allelic effect estimators have the same distributions in the two models.”

      Does this equivalence require the model with the interaction term also to have an interaction term for the intercept, i.e., the slope on a binary variable for context (since the generative model in Eq. 1 allows for context-specific intercepts)?

      It does require an interaction term for the intercept. This is e_i (and its effect beta_E) in Eq. S2 (line 70 of the supplement).

      Lines 94-96: Perhaps just a language thing, but in what sense does the estimation model described in lines 92-94 “assume” a particular distribution of trait values in the combined sample? It’s just an OLS regression, and one can analyze its expected coefficients with reference to the generative model in Eq. 1, or any other model. To say that it “assumes” something presupposes its purpose, which is not clear from its description in lines 92-94.

      We corrected “assume” to “posit”.

      Lines 115-116: It should perhaps be noted that the weights wA and wB need not sum to 1.

      Indeed; it is now explicitly stated.

      Lines 154-160: I think the role of r could be made even clearer by also discussing why, when VA>>VB, it is better to use the whole-sample estimate of betaA than the sample-A-specific estimate (since this is a more counterintuitive case than the case of VA<<VB discussed by the authors).

      This is addressed in lines 153-154, stating: “Typically, this (VA<<VB) will also imply that the additive estimator is greatly preferable for estimating β_B , as β_B will be extremely noisy”

      Line 243 and Figure 4 caption: The text states that the simulated effects in the high-sugar environment are 1.1x greater than those in the control environment, while the caption states that they are 1.4x greater.

      We have corrected the text to be consistent with our simulations.

      TYPOS/WORDING

      Line 14: “harder to interpret” --> “harder-to-interpret”

      Line 22: We --> we

      Line 40: “as average effect” -> “as the average effect”?

      Line 57: “context specific” --> “context-specific”

      Line 139: “re-parmaterization” --> “re-parameterization”

      Lines 140, 158, 412: “signal to noise” --> “signal-to-noise”

      Figure 3C,D: “pule rate” --> “pulse rate”

      The caption of Figure 3: “conutinous” --> “continuous”

      Line 227: “a variant may fall” --> “a variant may fall into”

      Line 295: “conferring to more GxE” --> “conferring more GxE” or “corresponding to more GxE”? This is very pedantic, but I think “bias-variance” should be “bias--variance” throughout, i.e., with an en-dash rather than a hyphen.

      We have corrected all of the above typos.

      Reviewer #2 (Recommendations For The Authors):

      (This section repeats some of what I wrote earlier).

      - First polygenic architecture part: the manuscript focuses on “top hits” in trying to identify sets of variants that are context-specific. This “top hits” approach seems somewhat esoteric and, as written, not connected tightly enough to the bias-variance tradeoff issue. The first section of the paper which focuses on bias-variance trade-off mostly deals with estimation. The “top hits” section deals with testing, which introduces additional issues that are due to thresholding. Perhaps the authors can think of ways to make the connection stronger between the bias-variance tradeoff part to the “top hits” part, e.g., by introducing testing earlier on and/or discussion estimation in addition to testing in the “top hits” part of the manuscript. The second polygenic architecture part: polygenic scores that account for interaction terms. Here the authors focused (well, also here) on pervasive amplification in simulations. This part combines estimation and testing (both the choice of variants and their estimated effects are important). In pervasive amplification the idea is that causal variants are shared, the results may be different than in a model with context-specific effects and variant selection may have a large impact. Still, I think that these simulations demonstrate the idea developed in the bias-variance tradeoff part of the paper, though the reader is left to wonder whether a bias-variance decision rule should or could be utilized for PGS construction.

      In both of these sections we discuss how the consideration of polygenic GxE patterns alters the conclusions based on the single-variant tradeoff. In the “top hits” section, we show that single-variant classification itself, based on a series of marginal hypothesis tests alone, can be misleading. The PGS prediction accuracy analysis shows that both approaches are beaten by the polygenic GxE estimation approach. Intuitively, this is because the consideration of polygenic GxE can mitigate both the bias and variance, as it leverages signals from many variants.

      We agree that the links between these sections of the paper were not sufficiently clear, and have added signposting to help clarify them (lines 176-180; lines 275-277; lines 316-321).

      - Simulation of GxDiet effects on longevity: the methods of the simulation are strange, or communicated unclearly. The authors’ report (page 17) poses a joint distribution of genetic effects (line 439), but then, they simulated effect estimates standard errors by sampling from summary statistics (line 445) rather than simulated data and then estimating effect and effect SE. Why pose a true underlying multivariate distribution if it isn’t used?

      We rewrote the Methods section “Simulation of GxDiet effects on longevity in Drosophila to make our simulation approach clearer (lines 427-449). We are indeed simulating the true effects from the joint distribution proposed. However, in order to mimic the noisiness of the experiment in our simulations, we sample estimated effects from the true simulated effects, with estimation noise conferring to that estimated in the Pallares et al. dataset (i.e., sampling estimation variances from the squares of empirical SEs).

      - How were the “most significantly associated variants” selected into the PGS in the polygenic prediction part? Based on a context-specific test? A combined-context test of effect size estimates?

      For the “Additive” and “Additive ascertainment, GxE estimation” models (red and orange in Fig. 5, respectively), we ascertain the combined-context set. For the “GxE” and “polygenic GxE” (green and blue in Fig. 5, respectively) models, we ascertain in a context-specific test. We now state this explicitly in lines 280-288 and lines 507-526.

      - As stated, I find the conclusion statement not specific enough in light of the rest of the manuscript. “the consideration of polygenic GxE trends is key” - this is very vague. What does it mean “to consider polygenic GxE trends” in the context of this paper? I can’t tell. “The notion that complex trait analyses should combine observations at top associated loci” - I don’t think the authors really refer to combining “observations”, rather perhaps combine information from top associated loci. But this does not represent the “top hits” approach that merely counts loci by their testing patterns. “It may be a similarly important missing piece...” What does “it” refer to? The top loci? What makes it an important missing piece?

      We rewrote the conclusion paragraph to address these concerns (lines 316-321).

    1. Author response:

      The following is the authors’ response to the original reviews.

      Public Reviews:

      Reviewer #1 (Public Review):

      […] Overall, this is an important paper that demonstrates that one model for transgenerational inheritance in C. elegans is not reproducible. This is important because it is not clear how many of the reported models of transgenerational inheritance reported in C. elegans are reproducible. The authors do demonstrate a memory for F1 embryos that could be a maternal effect, and the authors confirm that this is mediated by a systemic small RNA response. There are several points in the manuscript where a more positive tone might be helpful.

      We would like to correct the statement made in the second to last sentence. The demonstration of an F1 response to PA14 was first reported by Moore et al., (2019) and then by Pereira et al., (2020) using a different behavioral assay. We merely confirmed these results in our hands, and confirmed the observation, first reported by Kaletsky et al., (2020), that sid-1 and sid-2 are required for this F1 response; although we did find that sid-1 and sid-2 are not required for the PA14-induced increase in daf-7p::gfp expression in ASI neurons in the F1 progeny of trained adults, which had not been addressed in the published work.

      Yes, the intergenerational F1 response could be a maternal effect, but the in utero F1 embryos and their precursor germ cells were directly exposed to PA14 metabolites and toxins (non-maternal effect) as well as any parental response, whether mediated by small RNAs, prions, hormones, or other unknown information carriers. While the F1 aversion response does require sid-1 and sid-2, we would not presume that the substrate is therefore an RNA molecule, particularly because the systemic RNAi response supported by sid-1 and sid-2 is via long double-stranded RNA. To date, no evidence suggests that either protein transports small RNAs, particularly single-stranded RNAs.

      Strengths:

      The authors note that the high copy number daf-7::GFP transgene used by the Murphy group displayed variable expression and evidence for somatic silencing or transgene breakdown in the Hunter lab, as confirmed by the Murphy group. The authors nicely use single copy daf-7::GFP to show that neuronal daf-7::GFP is elevated in F1 but not F2 progeny with regards to the memory of PA14 avoidance, speaking to an intergenerational phenotype.

      The authors nicely confirm that sid-1 and sid-2 are generally required for intergenerational avoidance of F1 embryos of moms exposed to PA14. However, these small RNA proteins did not affect daf-7::GFP elevation in the F1 progeny. This result is unexpected given previous reports that single copy daf-7::GFP is not elevated in F1 progeny of sid mutants. Because the Murphy group reported that daf-7 mutation abolishes avoidance for F1 progeny, this means that the sid genes function downstream of daf-7 or in parallel, rather than upstream as previously suggested.

      The published report (Moore et al., 2019) shows only multicopy daf-7p::gfp results and does not address the daf-7p::gfp response in sid-1 or sid-2 mutants. Thus, our discovery that systemic RNAi, exogenous RNAi, and heritable RNAi mutants don’t disrupt elevated daf-7p::gfp in ASI neurons in the F1 progeny of PA14 trained P0’s is only unexpected with respect to the published models (Moore et al., 2019, Kaletsky et al., 2020).

      The authors studied antisense small RNAs that change in Murphy data sets, identifying 116 mRNAs that might be regulated by sRNAs in response to PA14. Importantly, the authors show that the maco-1 gene, putatively targeted by piRNAs according to the Kaletsky 2020 paper, displays few siRNAs that change in response to PA14. The authors conclude that the P11 ncRNA of PA14, which was proposed to promote interkingdom RNA communication by the Murphy group, is unlikely to affect maco-1 expression by generating sRNAs that target maco-1 in C. elegans. The authors define 8 genes based on their analysis of sRNAs and mRNAs that might promote resistance to PA14, but they do not further characterize these genes' role in pathogen avoidance. The Murphy group might wish to consider following up on these genes and their possible relationship with P11.

      Weaknesses:

      This very thorough and interesting manuscript is at times pugnacious.

      We reiterate that we never claimed that Moore et al., (2019) did not obtain their reported results. We simply stated that we could not replicate their results using the published methods and then failed in our search to identify variable(s) that might account for our results. In revising the manuscript, we have striven to make clear, unmuddied statements of facts and state that future investigations may provide independent evidence that supports the original claims and explains our divergent results.

      Please explain more clearly what is High Growth media for E. coli in the text and methods, conveying why it was used by the Murphy lab, and if Normal Growth or High Growth is better for intergenerational heritability assays.

      We added the standard recipes and the following explanations in the methods section to the revised text.

      “NG plates minimally support OP50 growth, resulting in a thin lawn that facilitates visualization of larvae and embryos. HG plates (8X more peptone) support much higher OP50 growth, resulting in a thick bacterial lawn that supports larger worm populations.”

      We have also included the following text in our presentation and discussion of the effects of growth conditions on worm choice in PA14 vs OP50 choice assays.

      “Furthermore, because OP50 pathogenicity is enhanced by increased E. coli nutritive conditions (Garsin et al., 2003, Shi et al., 2006), the growth of F1-F4 progeny on High Growth (HG) plates (Moore et al., 2019; 2021b), which contain 8X more peptone than NG plates and therefore support much higher OP50 growth levels, immediately prior to the F1-F4 choice assays may further contribute to OP50 aversion among the control animals.”

      We don’t know enough to claim that HG or NG media is better than the other for intergenerational assays, but they are different. Thus, switching between the two in a multigenerational experiment likely introduces unknown variability.

      Reviewer #2 (Public Review):

      This paper examines the reproducibility of results reported by the Murphy lab regarding transgenerational inheritance of a learned avoidance behavior in C. elegans. It has been well established by multiple labs that worms can learn to avoid the pathogen pseudomonas aeruginosa (PA14) after a single exposure. The Murphy lab has reported that learned avoidance is transmittable to 4 generations and dependent on a small RNA expressed by PA14 that elicits the transgenerational silencing of a gene in C. elegans. The Hunter lab now reports that although they can reproduce inheritance of the learned behavior by the first generation (F1), they cannot reproduce inheritance in subsequent generations.

      This is an important study that will be useful for the community. Although they fail to identify a "smoking gun", the study examines several possible sources for the discrepancy, and their findings will be useful to others interested in using these assays. The preference assay appears to work in their hands in as much as they are able to detect the learned behavior in the P0 and F1 generations, suggesting that the failure to reproduce the transgenerational effect is not due to trivial mistakes in the protocol. An obvious reason, however, to account for the differing results is that the culture conditions used by the authors are not permissive for the expression of the small RNA by PA14 that the MUrphy lab identified as required for transgenerational inheritance. It would seem prudent for the authors to determine whether this small RNA is present in their cultures, or at least acknowledge this possibility.

      We thank the reviewer for raising this issue and have added the following statement to this effect in the revised manuscript.

      “We note that previous bacterial RNA sequence analysis identified a small non-coding RNA called P11 whose expression correlates with bacterial growth conditions that induce heritable avoidance (Kaletsky et al., 2020). Critically, C. elegans trained on a PA14 ΔP11 strain (which lacks this small RNA) still learn to avoid PA14, but their F1 and F2-F4 progeny fail to show an intergenerational or transgenerational response (Figure 3L in Kaletsky et al., 2020). The fact that we observed an intergenerational (F1) avoidance response is evidence that our PA14 growth conditions induce P11 expression.”

      We believe that this addresses the concern raised here.

      The authors should also note that their protocol was significantly different from the Murphy protocol (see comments below) and therefore it remains possible that protocol differences cumulatively account for the different results.

      As suggested below, we have added to the supplemental documents the protocol we followed for the aversion assay. In our view, this document shows that our adjustments to the core protocol were minor. Furthermore, where possible, these adjustments were explicitly tested in side-by-side experiments for both the aversion assay and the daf-7p::gfp expression assay and presented in the manuscript.

      To discover the source(s) of discrepancy between our results and the published results we subsequently introduced variations to this core protocol to exclude likely variables (worm and bacteria growth temperatures, assay conditions, worm handling methods, bacterial culture and storage conditions, and some minor developmental timing issues). Again, where possible, the effect of variations was tested in side-by-side experiments for both the aversion assay and the daf-7p::gfp expression assay and were presented in or have now been added to the manuscript.

      It remains possible that we misunderstood the published Murphy lab protocols, but we were highly motivated to replicate the results so we could use these assays to investigate the reported RNAi-pathway dependent steps, thus we read every published version with extreme care.

      Reviewer #3 (Public Review):

      […] Strengths:

      (1) The authors provide a thorough description of their methods, and a marked-up version of a published protocol that describes how they adapted the protocol to their lab conditions. It should be easy to replicate the experiments.

      As noted above in response to a suggestion by reviewer #2, we have replaced the annotated published protocol with the protocol that we followed. This will aid other groups' attempts to replicate our experimental conditions.

      (2) The authors test the source of bacteria, growth temperature (of both C. elegans and bacteria), and light/dark husbandry conditions. They also supply all their raw data, so that the sample size for each testing plate can be easily seen (in the supplementary data). None of these variations appears to have a measurable effect on pathogen avoidance in the F2 generation, with all but one of the experiments failing to exhibit learned pathogen avoidance.

      We note that the parallel analysis of daf-7p::gfp expression in ASI neurons was also tested for several of these conditions and also failed to replicate the published findings.

      (3) The small RNA seq and mRNA seq analysis is well performed and extends the results shown in the original paper. The original paper did not give many details of the small RNA analysis, which was an oversight. Although not a major focus of this paper, it is a worthwhile extension of the previous work.

      (4) It is rare that negative results such as these are accessible. Although the authors were unable to determine the reason that their results differ from those previously published, it is important to document these attempts in detail, as has been done here. Behavioral assays are notoriously difficult to perform and public discourse around these attempts may give clarity to the difficulties faced by a controversial field.

      Thank you for your support. Choosing to pursue publication of these negative results was not an easy decision, and we thank members of the community for their support and encouragement.

      Weaknesses:

      (1) Although the "standard" conditions have been tested over multiple biological replicates, many of the potential confounders that may have altered the results have been tested only once or twice. For example, changing the incubation temperature to 25{degree sign}C was tested in only two biological replicates (Exp 5.1 and 5.2) - and one of these experiments actually resulted in apparent pathogen avoidance inheritance in the F2 generation (but not in the F1). An alternative pathogen source was tested in only one biological replicate (Exp 3). Given the variability observed in the F2 generation, increasing biological replicates would have added to the strengths of the report.

      We agree that our study was not exhaustive in our exploration of variables that might be interfering with our ability to detect F2 avoidance. We also note that some of these variables also failed (with many more independent experiments) to induce elevated daf-7p::gfp expression in ASI neurons in F2 progeny. Our goal was not to show that variation in some growth or assay condition would generate reproducible negative results, but the exploration was designed to tweak conditions to enable detection of a robust F2 response. Given the strength of the data presented in Moore et al., (2019) we expected that adjustment of the problematic variable would produce positive results apparent in a single replicate, which could then be followed up. If we had succeeded, then we would have documented the conditions that enabled robust F2 inheritance and would have explored molecular mechanisms that support this important but mysterious process.

      (2) A key difference between the methods used here and those published previously, is an increase in the age of the animals used for training - from mostly L4 to mostly young adults. I was unable to find a clear example of an experiment when these two conditions were compared, although the authors state that it made no difference to their results.

      We can state firmly that the apparent time delay did not affect P0 learned avoidance (new Figure S1) or, as documented in Table S1, daf-7p::gfp expression in ASI neurons. In our experience, training mostly L4’s on PA14 frequently failed to produce sufficient F1 embryos for both F1 avoidance assays or daf-7p::gfp measurements in ASI neurons and collection of F2 progeny. Indeed, in early attempts to detect heritable PA14 aversion, trained P0 and F1 progeny were not assayed in order to obtain sufficient F2’s for a choice assay. These animals failed to display aversion, but without evidence of successful P0 training or an F1 intergenerational response this was deemed a non-fruitful trouble-shooting approach. We have added supplemental Figure S1 which presents P0 choice assay results from experiments using younger trained animals that failed to produce sufficient F1’s to continue the inheritance experiments.

      The different timing at the start of training between the two protocols may reflect the age of the recovered bleached P0 embryos. It is reasonable to assume that bleaching day 1 adults vs day 2 or 3 adults from the P-1 population could shift the average age of recovered P0 embryos by several hours. The Murphy protocol only states that P0 embryos were obtained by bleaching healthy adults. Regardless, if the hypothesis entertained here is true, that a several hour difference in larval/adult age during 24 hours of training affects F2 inheritance of learned aversion but does not affect P0 learned avoidance, then we would argue that this paradigm for heritable learned avoidance, as described in Moore et al., (2019, 2021), is not sufficiently robust for mechanistic investigations.

      (3) The original paper reports a transgenerational avoidance effect up to the F5 generation. Although in this work the authors failed to see avoidance in the F2 generation, it would have been prudent to extend their tests for more generations in at least a couple of their experiments to ensure that the F2 generation was not an aberration (although this reviewer acknowledges that this seems unlikely to be the case).

      We would point out that we also failed to robustly replicate the F2 response in the daf-7p::gfp expression assays. An F2-specific aberration that affects two different assays seems quite unlikely, and it remains unclear how we would interpret a positive result in F3 and F4 generations without a positive result in the F2 generation. Were we to further extend these investigations, we believe that exploration of additional culture conditions would warrant higher priority than extension of our results to the F3 and F4 generations.

      Reviewing Editor Comments:

      The reviewers' suggestions for improving the manuscript were mostly minor, to change the wording in some places and to add some more explanation regarding the methods.

      What should be highlighted in the section on OP50 growth conditions is that the initial preference for PA14 in the Murphy lab has also been observed by multiple other labs (Bargmann, Kim, Zhang, Abbalay). The fact that this preference was not observed by the Hunter lab is one of several indicators of subtle differences in the environment that might add up to explain the differences in results.

      We agree that subtle known and unknown differences in OP50 and PA14 culture conditions can have measurable effects on the detection of PA14 attraction/aversion relative to OP50 attraction/aversion that could obscure or create the appearance of heritable effects between generations. We have added (see below) to the text a fuller description of the variability in the initial or naive preference observed in different laboratories using similar or variant 2-choice assays and culture conditions. It is worth emphasizing that direct comparison of the OP50 growth conditions specified in Moore et al., (2021) frequently revealed a much larger effect on the naïve choice index than is reported between labs (Figure 4).  

      “Naïve (OP50 grown) worms often show a bias towards PA14 in choice assays (Zhang et al., 2005; Ha et al., 2010; Moore et al., 2019; Pereira et al., 2020; Lalsiamthara and Aballay, 2022). This response, rather than representing an innate attraction to PA14, likely reflects the context of the worm's recent growth on OP50, a mild C. elegans pathogen (Garigan et al., 2002; Garsin et al., 2003; Shi et al., 2006). Thus, the naïve worms presented with a choice between a recently experienced mild pathogen (OP50) and a novel food choice (PA14) initially choose the novel food instead of the known mild pathogen (OP50 aversion).

      In line with our results, some other groups have also reported higher naïve choice index scores (Lee et al., 2017). This variability in naïve choice may reflect differences in growth conditions of either the OP50 or PA14 bacteria. In addition, we note that among the studies that show naïve worm attraction to Pseudomonas (OP50 aversion) there are extensive methodological differences from the methods in Moore et al., (2019; 2021b), including differences in bacterial growth temperature, incubation time, whether the bacteria is diluted or concentrated prior to placement on the choice plates, the concentration of peptone in the choice plates, the length of the choice assay, and the inclusion of sodium azide in the choice assays (Zhang et al., 2005; Ha et al., 2010; Moore et al., 2019; Pereira et al 2020; Lalsiamthara and Aballay, 2022). Thus, the cause of the variability across published reports is not clear.”

      Overall, an emphasis on the absence of robustness of the reported results, rather than failure to reproduce them (which can always have many reasons), is appropriate.

      We agree that an emphasis on robustness is appropriate and have modified the text throughout the manuscript to shift the emphasis to absence of robustness. This includes a change to the manuscript title, which is now, “Reported transgenerational responses to Pseudomonas aeruginosa in C. elegans are not robust”

      A significant experimental addition would be some attempts to determine whether the bacterial PA14 pathogen in the authors' lab produces the P11 small RNA, which has been proposed to have a causal role in initiating the previously reported transgenerational inheritance.

      We acknowledge in the revised manuscript that a subsequent publication (Kaletsky et al., 2020) identified a correlation between PA14 training conditions that induced transgenerational memory and the expression of P11, a P. aeruginosa small non-coding RNA (see our response above to Reviewer #2’s similar query). While testing for the presence of P11 in Harvard culture conditions would be an important assay in any study whose purpose was to investigate the proposed P11-mediated mechanism underlying the transgenerational responses reported by the Murphy Lab, our goal was rather to replicate the robust transgenerational (F2) responses to PA14 training and then to investigate in more detail how sid-1 and sid-2 contribute to transgenerational epigenetic inheritance. Neither sid-1 nor sid-2 are predicted to transport small RNAs or single-stranded RNAs, thus testing for the presence of P11 is less relevant to our goals. Regardless, we note that Figure 3L in Kaletsky et al., (2020) showed that PA14 ΔP11 bacteria failed to induce an F1 avoidance response. Thus, the fact that we observed F1 avoidance implies that our culture conditions successfully induced P11 expression.

      Reviewer #1 (Recommendations For The Authors):

      The abstract could be more positive by concluding that 'We conclude that this example of transgenerational inheritance lacks robustness but instead reflects an example of small RNA-mediated intergenerational inheritance.'

      As recommended, we have added additional clarifying information to the abstract and moderated the conclusion sentence.

      “We did confirm that the dsRNA transport proteins SID-1 and SID-2 are required for the intergenerational (F1) inheritance of pathogen avoidance, but not for the F1 inheritance of elevated daf-7 expression. Furthermore, our reanalysis of RNA seq data provides additional evidence that this intergenerational inherited PA14 response may be mediated by small RNAs.”

      “We conclude that this example of transgenerational inheritance lacks robustness, confirm that the intergenerational avoidance response, but not the elevated daf-7p::gfp expression in F1 progeny, requires sid-1 and sid-2, and identify candidate siRNAs and target genes that may mediate this intergenerational response.”

      Differential expression of sRNAs or mRNAs might be better understood quantitatively by presenting data in scatterplots (Reed and Montgomery 2020) rather than in volcano plots.

      We agree and have modified Figure 6A and 6B.

      This statement in the main text might be unnecessary, as it affects the tenor of the conclusion of this significant manuscript. 'We note that none of the raw data for the published figures and unpublished replicate experiments . . . this hampered our ability to fully compare'.

      We have rewritten this paragraph to focus on our goal: to identify the source of the discrepancy between our results and the published results. We considered discarding this statement but ultimately decided that our inability to directly compare our data to that of previously published work is a shortcoming of our study that deserves to be acknowledged and explained.

      “Ideally, we would have compared our results with the published results (Moore et al., 2019), to possibly identify additional experimental parameters for further investigation; for example, a quantitative comparison of naïve choice in the P0 and F1 generations could help to determine the role of bacterial growth in the choice assay response. However, none of the raw data for the published figures and unpublished replicate experiments (Moore et al., 2019) were available on the publisher’s website or provided upon request to the corresponding author. In the absence of a quantitative comparison, it remains possible that an explanation for the discrepancies between our results and those of Moore et al., (2019) has been overlooked.”

      The final sentence of the Discussion could be tempered and more positive by stating 'Thus independent reproducibility is of paramount concern, and we have tried to be completely transparent as a model for how heritability research should be conducted within the C. elegans community'.

      Thank you. The suggested sentence nicely captures our intention. We now use it, almost verbatim, as our final sentence.

      “Thus, independent reproducibility is of paramount concern, and we have tried to be completely transparent as a model for how heritability research should be presented within the C. elegans community.”

      Reviewer #2 (Recommendations For The Authors):

      Specific comments:

      (1) Protocol: It is difficult to assess from the Methods the exact protocol used by the authors to assay food preference. The annotated Murphy protocol is not sufficient. The authors should provide their own protocol - a detailed lab-ready protocol where every step is outlined, and any steps that deviate from the Murphy lab protocol are called out.

      Thank you for this excellent suggestion. We now include a protocol that documents the precise steps, timings, and controls that we followed (S1_aversion_protocol). We also include footnotes to both explain the reasons behind particular steps and to document known differences to the published protocol. Given the thoroughness of this suggested approach, we have thus removed the annotated version of Moore et al., (2021) from the revised submission.

      (2) The authors imply in the methods that, unlike the Murphy lab, they did NOT use azide in the assay, and instead used 4oC to "freeze" the worms in place - It is not clear whether this method was used throughout all their assays and whether this could be a source of the difference. This change is NOT indicated in the annotated Murphy lab STAR Protocol they provide in the supplement.

      We apologize for the lack of clarity. Concerned that azide may be interfering with our ability to detect heritable silencing we tested and then used cold-induced rigor to preserve worm choice in some choice assay results. This was not a change to the core protocol, but a variation used in some assays to determine whether azide could reduce our ability to detect heritable behavioral responses to PA14 exposure. As Moore et al., (2021) show, too much azide can affect measurement of worm choice. Too little or ineffective azide also can affect measurement of worm choice. Azide also affects bacteria (both OP50 and PA14), which could affect the production of molecules that attract or repel worms, much like performing the assay in light vs dark conditions can influence the measured choice index.

      In our hands, cold-induced rigor worked well and within biological replicates was indistinguishable from azide (Figure S10). Thus, we include those results in our analysis and now indicate in Tables 2 and S2 and in Figures 1 and 3 which experiments used which method. As suggested, we now provide a detailed protocol that includes a note describing our precise method for cold-induced rigor.

      Also, the number of worms used in each assay needs to be specified (same or different from Murphy protocol?), and whether any worms were "censored" as in the Murphy protocol, and if so on what basis.

      While we published the exact number of worms scored in each assay (on each plate) it is unknown how this might compare to the results published in Moore et al., (2019), as the number of animals in the presented choice assays (either per plate or per choice) were not reported. Details on censoring, when to exclude data, and additional criteria to abandon an in-progress experiment are now detailed in the protocol (S1_aversion_protocol)

      (3) Several instances in the text cite changes in the protocol as producing "no meaningful differences" without referring to a specific experiment that supports that statement (for example, line 399 regarding azide).

      We now include data and methods comparing azide and cold-induced rigor (Supplemental document S1_aversion_protocol, Supplemental Figure S10), and data showing the P0 choice index for 48-52 hour post-bleach L4/young adults (Supplemental Figure S1), in addition to the previously noted absence of effects due to differences in embryo bleaching protocols (Figures 2, 3 and Tables 1, 2, S1, and S2).

      (4) If the authors want to claim the irreproducibility of the Murphy lab results, they should use the exact protocol used by the Murphy lab in its entirety. It is not sufficient to show that individual changes do not affect the outcome, since the protocol they use appears to include SEVERAL changes which could cumulatively affect the results. If the authors do not want to do this, they should at least acknowledge and summarize in their discussion ALL their protocol changes.

      We acknowledge these minor differences between the protocols we followed and the published methods but disagree that they invalidate our results. We transparently present the effect of known minimal protocol changes. We also present analysis of possible invalidating variations (number of animals in a choice assay). We emphasize that in our hands both measures of TEI, the choice assay and measurement of daf-7p::gfp in ASI neurons, failed to replicate the published transgenerational results.

      If the protocol is sensitive to how animals are counted, whether bleached embryos are mixed gently or vigorously or a few hours difference in age at training, then in our view this TEI paradigm is not robust.

      See also our response to reviewer #3’s public reviews above.

      (5) The authors acknowledge that "non-obvious growth culture differences" could account for the different results. In this respect, the Murphy lab has proposed that the transgenerational effect requires a small RNA expressed in PA14. The authors should check that this RNA is expressed in the cultures they grow in their lab and use for their experiments. This could potentially identify where the two protocols diverge.

      The bacterial culture conditions and worm training procedures described in Moore et al., (2019) successfully produced trained P0 animals that transmitted a PA14 aversion response to their F1 progeny. In a subsequent publication (Kaletsky et al., 2020), the Murphy lab showed a correlation between the culture conditions that induce heritable avoidance and the expression of P11, a P. aeruginosa small non-coding RNA. As mentioned above in response to Reviewer #2’s public review and the Reviewing Editor’s comments to authors, the Murphy lab showed that PA14 ΔP11 bacteria fail to induce an F1 avoidance response (Figure 3L in Kaletsky et al., (2020)). Thus, the fact that we observed F1 avoidance implies that our culture conditions successfully induced P11 expression. We believe that this addresses the concern raised here. Furthermore, if P11 is not reliably expressed in pathogenic PA14, then the published model is unlikely to be relevant in a natural environment. Again, we thank the reviewer for raising this issue and have added this information to the revised manuscript (see above response to Reviewer #2’s Public Reviews).

      (6) Legend to Figure 1: please clarify which experiments were done with which PA14 isolates especially for A-C. What is the origin of the N2 strain used here?

      These details from Tables 2 and S2 have been added to Figure 1 panels A-C and Figure 3. Bristol N2, obtained from the CGC (reference 257), was used for aversion experiments.

      (7) Growth conditions: "These young adults produced comparable P0 and F1 results (Figure 1, Figure 2, and Figure 3)." It is not clear from the text what specific figure panels need to be compared to examine the effect of the variables described in the text. Please indicate which figure panels should be compared (lines 70-95).

      The information for the daf-7p::gfp expression experiments displayed in Figure 1 and Figure 2 is presented in Table 1 and Table S1. The data for P0 aversion training using younger animals is now presented in Figure S1.

      Reviewer #3 (Recommendations For The Authors):

      While overall I found this easy to follow and well-written, I think the clarity of the figures could be improved by incorporating some of the information from S2 into Figure 3. Besides the figure label listing the experiment (Exp1, Exp2, etc) it would be helpful to add pertinent information about the experiment. For example Exp 1.1 (light, 20{degree sign}C), Exp1.2 (dark, 20{degree sign}C), Exp 5 (25{degree sign}C, light), etc.

      Thank you for the suggestion. These details from Tables 2 and S2 have been added to Figures 1 A-C, and 3.

      Citations

      • Moore, R.S., Kaletsky, R., and Murphy, C.T. (2019). Piwi/PRG-1 Argonaute and TGF-beta Mediate Transgenerational Learned Pathogenic Avoidance. Cell 177, 1827-1841 e1812.

      • Moore, R.S., Kaletsky, R., and Murphy, C.T. (2021). Protocol for transgenerational learned pathogen avoidance behavior assays in Caenorhabditis elegans. STAR Protoc 2, 100384.

      • Kaletsky, R., Moore, R.S., Vrla, G.D., Parsons, L.R., Gitai, Z., and Murphy, C.T. (2020). C. elegans interprets bacterial non-coding RNAs to learn pathogenic avoidance. Nature 586, 445-451.

      • Pereira, A.G., Gracida, X., Kagias, K., and Zhang, Y. (2020). C. elegans aversive olfactory learning generates diverse intergenerational effects. J Neurogenet 34, 378-388.

    1. Author response:

      The following is the authors’ response to the original reviews.

      Reviewer #1 (Public Review):

      Chen and colleagues investigated ZC3H11A as a potential cause of high myopia (HM) in humans through the analysis of exome sequencing in 1,015 adolescents and experiments involving Zc3h11a knock-out mice. The authors showed four possibly pathogenic missense variants in four adolescents with HM. After that, the authors presented the phenotypic features of Zc3h11a knock-out mice, the result of RNA-sequencing, and a comparison of mRNA and protein levels of the functional candidates between wild-type and Zc3h11a knock-out mice. Based on their observations, the authors concluded that ZC3H11A protein contributes to the early onset of myopia.

      The strengths of this manuscript include: (1) successful identification of characteristic ophthalmic phenotypes in Zc3h11a knock-out mice, (2) demonstration of biological features related to myopia, such as PI3K-AKT and NF-kB pathways, and (3) inclusion of supporting human genetic data in individuals with HM. On the other hand, the weaknesses of this paper appear to be: (1) the lack of robust evidence from their genomic analysis, and (2) insufficient evidence to support phenotypic similarity between humans with ZC3H11A mutations and Zc3h11a knock-out mice. Given that the biological mechanisms of high myopia are not fully understood, the identification of a novel gene is valuable. As described in the manuscript, it is worth noting that the previous study using myopic mouse model has implicated the role of ZC3H11A in the etiology of myopia (Fan et al. Plos Genet 2012).

      Thank you very much for your valuable suggestions.

      Specific comments:

      (1) I am concerned about the certainty of similarity in phenotypes between individuals with ZC3H11A mutation and Zc3h11a knock-out mice. A crucial point would be that there are no statistical differences in axial lengths (ALs) between wild-type and Zc3h11a knock-out mice at 8W and 10W, even though ALs in the individuals with ZC3H11A mutation were long. I would also like to note that the phenotypic information of these individuals is not available in the manuscript, although the authors indicated the suppressed b-wave amplitude in Zc3h11a knock-out mice. Considering that the authors described that "Detailed ophthalmic examinations were performed (lines: 321-323)", the detailed clinical features of these individuals should be included in the manuscript.

      Thank you for your valuable comments. The axial length in Zc3h11a Het-KO mice were found to be significantly greater than in WT littermates at weeks 4 and 6 (Independent samples t-test, p<0.05; Figure 2A and B). Although no significant differences were observed at other time points, there was still some degree of increase in these parameters. We continued to measure corneal curvature and found no significant differences between the two groups. Therefore, the difference in refraction may be due to the small size of the mouse eye. A 1 D change in refraction corresponds to only a 5-6 μm change in AL(1). However, the SD-OCT resolution used in this study is relatively low (theoretical resolution of 6 μm)(2, 3), so the small changes measured in vitreous cavity depth and AL may not be statistically significant. Additionally, some studies have shown that axial lengths reported in frozen sections are longer than those measured in vivo for age-matched mice(1, 4). Another possible explanation is that the curvature and refractive power of the lens have changed. These hypotheses provide a reasonable explanation for the mismatch between changes in refraction and ocular length parameters.

      Reference

      (1) Schmucker C, Schaeffel F. A paraxial schematic eye model for the growing C57BL/6 mouse. Vision research 44, 1857-1867 (2004).

      (2) Yuan Y, Chen F, Shen M, Lu F, Wang J. Repeated measurements of the anterior segment during accommodation using long scan depth optical coherence tomography. Eye & contact lens 38, 102-108 (2012).

      (3) Shen M, et al. SD-OCT with prolonged scan depth for imaging the anterior segment of the eye. Ophthalmic Surgery, Lasers and Imaging Retina 41, S65-S69 (2010).

      (4) Schmucker C, Schaeffel F. In vivo biometry in the mouse eye with low coherence interferometry. Vision research 44, 2445-2456 (2004).

      Additionally, regarding the “detailed ophthalmic examinations”, due to our patients were selected from a myopia screening cohort of over one million (children and adolescents myopia survey [CAMS] program), and ophthalmic examination only includes semi-annual refractive error measurements (a total of 5 times, with refractive error being the average of the three maximum values) and only one axial length measurement. The inappropriate description of “Detailed clinical features” has been removed.

      (2) The term "pathogenic variant" should be used cautiously. Please clarify the pathogenicity of the reported variants in accordance with the ACMG guideline.

      Thank you for your valuable comments. Four missense mutations in the ZC3H11A gene (c.412G>A, p.V138I; c.128G>A, p.G43E; c.461C>T, p.P154L; and c.2239T>A, p.S747T) were identified in the 1015 HM patients aged from 15 to 18 years. All of the identified mutations exhibited very low frequencies or does not exist in the Genome Aggregation Database (gnomAD) and Clinvar, and using pathogenicity prediction software SIFT, PolyPhen2, and CADD, most of them display high pathogenicity levels. Among them, c.412G>A, c.128G>A and c.461C>T were located in or around a domain named zf-CCCH_3 (Figure 1A and B). Furthermore, all of the mutation sites were located in highly conserved amino acids across different species (Figure 1C). Four mutations resulted in a higher degree of conformational flexibility and altered the negative charge at the corresponding sites (Figure 1D and E). Meanwhile, through transfection of overexpression mutant plasmids, it was found that compared to the wild-type, the mRNA expression levels of IκBα in the nucleus of all four mutant types (ZC3H11A<sup>V138I</sup>, ZC3H11A<sup>G43E</sup>, ZC3H11A<sup>P154L</sup> and ZC3H11A<sup>S747T</sup>) were significantly reduced (Supplement Figure 3). According to the ACMG guidelines, the above mutations can be classified as “Pathogenic Moderate”.

      (3) The genetic analysis does not fully support the claim that ZC3H11A is causative for HM. While the authors showed the rare allele frequencies and high CADD scores (> 20) of the identified variants, these were insufficient to establish causality. A helpful way to assess the causality would be performing a segregation analysis. An alternative approach is to show significant association by performing a gene-level association test. Assessing the pathogenicity of the variants using various prediction software, such as SIFT, PolyPhen2, and REVEL may also provide additional supportive evidence.

      Thank you for your valuable comments. We have addad the pathogenicity of the variants using various prediction software, such as SIFT, PolyPhen2, CADD, and the population variation databases, such as Genome Aggregation Database (gnomAD_AF) and ClinVar. Meanwhile, through transfection of overexpression mutant plasmids, it was found that compared to the wild-type, the mRNA expression levels of IκBα in the nucleus of all four mutant types (ZC3H11A<sup>V138I</sup>, ZC3H11A<sup>G43E</sup>, ZC3H11A<sup>P154L</sup> and ZC3H11A<sup>S747T</sup>) were significantly reduced (Supplement Figure 3).

      (4) As shown in Figure 2, significant differences in refraction were observed from 4 weeks to 10 weeks. Nevertheless, no differences were observed in AL, anterior/vitreous chamber depth, and lens depth. The author should experimentally clarify what factors contribute to the observed difference in refraction.

      Thank you for your valuable comments. The existing data show significant differences in refraction between 4 and 10 weeks, with the AL and vitreous cavity depth of Het mice being longer than those of WT mice at 4 and 6 weeks. Although no significant differences were observed at other time points, there was still some degree of increase in these parameters. We continued to measure corneal curvature and found no significant differences between the two groups. Therefore, the difference in refraction may be due to the small size of the mouse eye. A 1 D change in refraction corresponds to only a 5-6 μm change in AL(1). However, the SD-OCT resolution used in this study is relatively low (theoretical resolution of 6 μm)(2, 3), so the small changes measured in vitreous cavity depth and AL may not be statistically significant. Additionally, some studies have shown that axial lengths reported in frozen sections are longer than those measured in vivo for age-matched mice(1, 4). Another possible explanation is that the curvature and refractive power of the lens have changed. These hypotheses provide a reasonable explanation for the mismatch between changes in refraction and ocular length parameters.

      Reference

      (1) Schmucker C, Schaeffel F. A paraxial schematic eye model for the growing C57BL/6 mouse. Vision research 44, 1857-1867 (2004).

      (2) Yuan Y, Chen F, Shen M, Lu F, Wang J. Repeated measurements of the anterior segment during accommodation using long scan depth optical coherence tomography. Eye & contact lens 38, 102-108 (2012).

      (3) Shen M, et al. SD-OCT with prolonged scan depth for imaging the anterior segment of the eye. Ophthalmic Surgery, Lasers and Imaging Retina 41, S65-S69 (2010).

      (4) Schmucker C, Schaeffel F. In vivo biometry in the mouse eye with low coherence interferometry. Vision research 44, 2445-2456 (2004).

      (5) The gene names should be italicized throughout the manuscript.

      Thank you for your valuable comments. The gene names have been italicized throughout the manuscript.

      (6) Table 1: providing chromosomal positions and rs numbers (if available) would be helpful for readers.

      Thank you for your valuable comments. We have provided the chromosome positions and rs number (if available) of each mutation in Table 1.

      (7) Figure 5b, c, and d: the results of pathway analysis and GO enrichment analysis are difficult to interpret due to the small font size. It would be preferable to present these results in tables. Moreover, the authors should set a significant threshold in the enrichment analyses.

      Thank you for your valuable comments. We have adjusted the font size of the image. In the retina transcriptome analysis, we have set Fold change (FC) of at least two and a P value < 0.05 as thresholds to analyze differentially expressed genes (DEGs). The GO terms and KEGG pathways enrichment analysis selected the top 20 with the most significant differences or the highest number of enriched genes for display.

      Reviewer #2 (Public Review):

      Summary: Chong Chen and colleagues reported that mutations were identified in the ZC3H11A gene in four adolescents from 1015 high myopia subjects in their myopia cohort. They further generated Zc3h11a knockout mice utilizing the CRISPR/Cas9 technology. They analyzed the heterozygotes knockout mice compared to control littermates and found refractive error changes, electrophysiological differences, and retinal inflammation-related gene expression differences. They concluded that ZC3H11A may play a role in the early onset of myopia by regulating inflammatory responses.

      Strengths:

      Data were shown from both clinical cohort and animal models.

      Weaknesses:

      Their findings are interesting and important, however; they need to resolve several points to make the current conclusion.

      (1) They described the ZC3H11A gene as a pathogenic variant for high myopia. It should be classified as pathogenic according to the guidelines of the American College of Medical Genetics and Genomics (Richards et al., Genet Med 17(5):405-24, 2015). The modes of inheritance for the families need to be shown. They also described identifying the gene as a "new" candidate. It should be checked in databases such as gnomAD and ClinVar, and any previous publications and be declared as a novel variant.

      Thank you for your valuable comments. Four missense mutations in the ZC3H11A gene (c.412G>A, p.V138I; c.128G>A, p.G43E; c.461C>T, p.P154L; and c.2239T>A, p.S747T) were identified in the 1015 HM patients aged from 15 to 18 years. All of the identified mutations exhibited very low frequencies or does not exist in the Genome Aggregation Database (gnomAD) and Clinvar, and using pathogenicity prediction software SIFT, PolyPhen2, and CADD, most of them display high pathogenicity levels. Among them, c.412G>A, c.128G>A and c.461C>T were located in or around a domain named zf-CCCH_3 (Figure 1A and B). Furthermore, all of the mutation sites were located in highly conserved amino acids across different species (Figure 1C). Four mutations resulted in a higher degree of conformational flexibility and altered the negative charge at the corresponding sites (Figure 1D and E). Meanwhile, through transfection of overexpression mutant plasmids, it was found that compared to the wild-type, the mRNA expression levels of IκBα in the nucleus of all four mutant types (ZC3H11A<sup>V138I</sup>, ZC3H11A<sup>G43E</sup>, ZC3H11A<sup>P154L</sup> and ZC3H11A<sup>S747T</sup>) were significantly reduced (Supplement Figure 3). According to the ACMG guidelines, the above mutations can be classified as “Pathogenic Moderate”.

      Unfortunately, our patients are part of the MAGIC project (aged 15 years or older), a cohort consists of thousands of individuals with HM (patients from the children and adolescents myopia survey [CAMS] program) who have undergone WES, and their parents' relevant information was not collected for performing a segregation analysis.

      (2) The phenotypes of the heterozygote mice are weak overall. The het mice showed mild to moderate myopic refractive shifts from 4 to 10 weeks of age. However, this cannot be explained by other ocular biometrics such as anterior chamber depth or lens thickness. Some differences are found between het and WT littermates in axial length and vitreous chamber depth but disappear after 8 weeks old. Furthermore, the early differences are not enough to explain the refractive error changes. They mentioned that they did not use homozygotes because of the embryonic lethality. I would strongly suggest employing conditional knockout systems to analyze homozygotes. This will also be able to identify the causative tissues/cells because they assume bipolar cells are functional. The cells in the retinal pigment epithelium and choroid are also important to contribute to myopia development.

      Thank you for your valuable comments. The existing data show significant differences in refraction between 4 and 10 weeks, with the AL and vitreous cavity depth of Het mice being longer than those of WT mice at 4 and 6 weeks. Although no significant differences were observed at other time points, there was still some degree of increase in these parameters. We continued to measure corneal curvature and found no significant differences between the two groups. Therefore, the difference in refraction may be due to the small size of the mouse eye. A 1 D change in refraction corresponds to only a 5-6 μm change in AL(1). However, the SD-OCT resolution used in this study is relatively low (theoretical resolution of 6 μm)(2, 3), so the small changes measured in vitreous cavity depth and AL may not be statistically significant. Additionally, some studies have shown that axial lengths reported in frozen sections are longer than those measured in vivo for age-matched mice(1, 4). Another possible explanation is that the curvature and refractive power of the lens have changed. These hypotheses provide a reasonable explanation for the mismatch between changes in refraction and ocular length parameters.

      Reference

      (1) Schmucker C, Schaeffel F. A paraxial schematic eye model for the growing C57BL/6 mouse. Vision research 44, 1857-1867 (2004).

      (2) Yuan Y, Chen F, Shen M, Lu F, Wang J. Repeated measurements of the anterior segment during accommodation using long scan depth optical coherence tomography. Eye & contact lens 38, 102-108 (2012).

      (3) Shen M, et al. SD-OCT with prolonged scan depth for imaging the anterior segment of the eye. Ophthalmic Surgery, Lasers and Imaging Retina 41, S65-S69 (2010).

      (4) Schmucker C, Schaeffel F. In vivo biometry in the mouse eye with low coherence interferometry. Vision research 44, 2445-2456 (2004).

      The drawback is that, we did not conduct relevant research on homozygous knockout mice. The first reason is that our patient's mutation pattern is heterozygous mutation (Heterozygous knockout mice can better simulate human phenotypes). The second reason is that homozygous knockout mice are lethal, and we did not use the conditional knockout mouse model for further research. At the same time, we limited the pathway of myopia to the recognized and classical retina-sclera pathway, and did not study other pathways such as retinal pigment epithelium and choroid.

      (3) Their hypothesis regarding inflammatory gene changes and myopic development is not logical. Are the inflammatory responses evoked from bipolar cells? Did the mice show an accumulation of inflammatory cells in the inner retina? Visible retinal inflammation is not generally seen in either early-onset or high-myopia human subjects. Can this be seen in the actual subjects in the cohort? To me, this is difficult to adapt the retina-to-sclera signaling they mentioned in the discussion so far. Egr-1 may be examined as described.

      Thank you for your valuable comments. We have removed the hypothesis regarding inflammatory gene changes and myopic development. At present, the explanation is based solely on the correlation of signal pathways, the theoretical basis comes from the reference literature:

      “Lin et al., Role of Chronic Inflammation in Myopia Progression: Clinical Evidence and Experimental Validation. EBioMedicine, 2016 Aug:10:269-81, Figure 7.”

      Reviewer #3 (Public Review):

      Chen et al have identified a new candidate gene for high myopia, ZC3H11A, and using a knock-out mouse model, have attempted to validate it as a myopia gene and explain a potential mechanism. They identified 4 heterozygous missense variants in highly myopic teenagers. These variants are in conserved regions of the protein, but the authors provide no evidence that these specific variants affect protein function. They then created a knock-out mouse. Heterozygotes show myopia at all ages examined but increased axial length only at very early ages. Unfortunately, the authors do not address this point or examine corneal structure in these animals. They show that the mice have decreased B-wave amplitude on electroretinogram (a sign of retinal dysfunction associated with bipolar cells), and decreased expression of a bipolar cell marker, PKCa. They do not address, however, whether there are fewer bipolar cells, or simply decreased expression of the marker protein. On electron microscopy, there are morphologic differences in the outer nuclear layer (where bipolar, amacrine, and horizontal cell bodies reside). Transcriptome analysis identified over 700 differentially expressed genes. The authors chose to focus on the PI3K-AKT and NF-kB signaling pathways and show changes in the expression of genes and proteins in those pathways, including PI3K, AKT, IkBa, NF-kB, TGF-b1, MMP-2, and IL-6, although there is very high variability between animals. They propose that myopia may develop in these animals either as a result of visual abnormality (decreased bipolar cell function in the retina) or by alteration of NF-kB signaling. These data provide an interesting new candidate variant for the development of high myopia, and provide additional data that MMP2 and IL6 have a role in myopia development, but do not support the claim of the title that myopia is caused by an inflammatory reaction.

      Thank you for your valuable comments. Four missense mutations in the ZC3H11A gene (c.412G>A, p.V138I; c.128G>A, p.G43E; c.461C>T, p.P154L; and c.2239T>A, p.S747T) were identified in the 1015 HM patients aged from 15 to 18 years. All of the identified mutations exhibited very low frequencies or does not exist in the Genome Aggregation Database (gnomAD) and Clinvar, and using pathogenicity prediction software SIFT, PolyPhen2, and CADD, most of them display high pathogenicity levels. Among them, c.412G>A, c.128G>A and c.461C>T were located in or around a domain named zf-CCCH_3 (Figure 1A and B). Furthermore, all of the mutation sites were located in highly conserved amino acids across different species (Figure 1C). Four mutations resulted in a higher degree of conformational flexibility and altered the negative charge at the corresponding sites (Figure 1D and E). Meanwhile, through transfection of overexpression mutant plasmids, it was found that compared to the wild-type, the mRNA expression levels of IκBα in the nucleus of all four mutant types (ZC3H11A<sup>V138I</sup>, ZC3H11A<sup>G43E</sup>, ZC3H11A<sup>P154L</sup> and ZC3H11A<sup>S747T</sup>) were significantly reduced (Supplement Figure 3). According to the ACMG guidelines, the above mutations can be classified as “Pathogenic Moderate”.

      The existing data show significant differences in refraction between 4 and 10 weeks, with the AL and vitreous cavity depth of Het mice being longer than those of WT mice at 4 and 6 weeks. Although no significant differences were observed at other time points, there was still some degree of increase in these parameters. We continued to measure corneal curvature and found no significant differences between the two groups. Therefore, the difference in refraction may be due to the small size of the mouse eye. A 1 D change in refraction corresponds to only a 5-6 μm change in AL(1). However, the SD-OCT resolution used in this study is relatively low (theoretical resolution of 6 μm)(2, 3), so the small changes measured in vitreous cavity depth and AL may not be statistically significant. Additionally, some studies have shown that axial lengths reported in frozen sections are longer than those measured in vivo for age-matched mice(1, 4). Another possible explanation is that the curvature and refractive power of the lens have changed. These hypotheses provide a reasonable explanation for the mismatch between changes in refraction and ocular length parameters.

      To evaluate the change in the number of a specific type of retinal cells, the most commonly used experimental method involves staining with antibodies specific to the target cell type, followed by fluorescence microscopy. The fluorescence intensity or the number of cells can be analyzed semi-quantitatively to assess the changes in the specific cell type in the retina. For example, in retinal degenerative models, rhodopsin-specific staining is used to identify the loss of rod cells. In our study, we selected PCK-α as a marker protein for bipolar cells to assess their number. Additionally, transmission electron microscopy (TEM) was used to observe damage to the cell morphology in the inner nuclear layer (INL) of Het mice, where bipolar cell bodies are located. Based on both sets of data, we conclude that bipolar cells have indeed undergone structural damage and a reduction in number.

      Reference

      (1) Schmucker C, Schaeffel F. A paraxial schematic eye model for the growing C57BL/6 mouse. Vision research 44, 1857-1867 (2004).

      (2) Yuan Y, Chen F, Shen M, Lu F, Wang J. Repeated measurements of the anterior segment during accommodation using long scan depth optical coherence tomography. Eye & contact lens 38, 102-108 (2012).

      (3) Shen M, et al. SD-OCT with prolonged scan depth for imaging the anterior segment of the eye. Ophthalmic Surgery, Lasers and Imaging Retina 41, S65-S69 (2010).

      (4) Schmucker C, Schaeffel F. In vivo biometry in the mouse eye with low coherence interferometry. Vision research 44, 2445-2456 (2004).

      We have removed the hypothesis regarding inflammatory gene changes and myopic development. At present, the explanation is based solely on the correlation of signal pathways, the theoretical basis comes from the reference literature:

      “Lin et al., Role of Chronic Inflammation in Myopia Progression: Clinical Evidence and Experimental Validation. EBioMedicine, 2016 Aug:10:269-81, Figure 7.”

    1. Author response:

      The following is the authors’ response to the original reviews.

      Reviewer #1 (Public review):

      Summary:

      In this manuscript, Arimura et al describe MagIC-Cryo-EM, an innovative method for immune-selective concentrating of native molecules and macromolecular complexes for Cryo-EM imaging and single-particle analysis. Typically, Cryo-EM imaging requires much larger concentrations of biomolecules than that are feasible to achieve by conventional biochemical fractionation. Overall, this manuscript is meticulously and clearly written and may become a great asset to other electron microscopists and chromatin researchers.

      Strengths:

      Previously, Arimura et al. (Mol. Cell 2021) isolated from Xenopus extract and resolved by Cryo-EM a sub-class of native nucleosomes conjugated containing histone H1.8 at the on-dyad position, similar to that previously observed by other researchers with reconstituted nucleosomes. Here they sought to analyze immuno-selected nucleosomes aiming to observe specific modes of H1.8 positioning (e.g. on-dyad and off-dyad) and potentially reveal structural motifs responsible for the decreased affinity of H1.8 for the interphase chromatin compared to metaphase chromosomes. The main strength of this work is a clever and novel methodological design, in particular the engineered protein spacers to separate captured nucleosomes from streptavidin beads for a clear imaging. The authors provide a detailed step-by-step description of MagIC-Cryo-EM procedure including nucleosome isolation, preparation of GFP nanobody attached magnetic beads, optimization of the spacer length, concentration of the nucleosomes on graphene grids, data collection and analysis, including their new DUSTER method to filter-out low signal particles. This tour de force methodology should facilitate considering of MagIC-CryoEM by other electron microscopists especially for analysis of native nucleosome complexes.

      In pursue of biologically important new structures, the immune-selected H1.8-containing nucleosomes were solved at about 4A resolution; their structure appears to be very similar to the previously determined structure of H1.8-reconstituted nucleosomes. There were no apparent differences between the metaphase and interphase complexes suggesting that the on-dyad and off-dyad positioning does not explain the differences in H1.8 - nucleosome binding. However, they were able to identify and solve complexes of H1.8-GFP with histone chaperone NPM2 in a closed and open conformation providing mechanistic insights for H1-NPM2 binding and the reduced affinity of H1.8 to interphase chromatin as compared to metaphase chromosomes.

      Weaknesses:

      Still, I feel that there are certain limitations and potential artifacts resulting from formaldehyde fixation, use of bacterial-expressed recombinant H1.8-GFP, and potential effects of magnetic beads and/or spacer on protein structure, that should be more explicitly discussed. 

      We thank the reviewer for recognizing the significance of our methods and for constructive comments. To respond to the reviewer's criticism, we revised the “Limitation of the study” section (page 12, line 420) as indicated by the underlines below.

      “While MagIC-cryo-EM is envisioned as a versatile approach suitable for various biomolecules from diverse sources, including cultured cells and tissues, it has thus far been tested only with H1.8-bound nucleosome and H1.8-bound NPM2, both using antiGFP nanobodies to isolate GFP-tagged H1.8 from chromosomes assembled in Xenopus egg extracts after pre-fractionation of chromatin. To apply MagIC-cryo-EM for the other targets, the following factors must be considered: 1) Pre-fractionation. This step (e.g., density gradient or gel filtration) may be necessary to enrich the target protein in a specific complex from other diverse forms (such as monomeric forms, subcomplexes, and protein aggregates). 2) Avoiding bead aggregation. Beads may be clustered by targets (if the target complex contains multiple affinity tags or is aggregated), nonspecific binders, and the target capture modules. To directly apply antibodies that recognize the native targets and specific modifications, optimization to avoid bead aggregation will be important. 3) Stabilizing complexes. The target complexes must be stable during the sample preparation. Crosslink was necessary for the H1.8-GFP-bound nucleosome. 4) Loading the optimum number of targets on the bead. The optimal number of particles per bead differs depending on target sizes, as larger targets are more likely to overlap. For H1.8-GFP-bound nucleosomes, 500 to 2,000 particles per bead were optimal. We expect that fewer particles should be coated for larger targets.”

      We would like to note that while the use of bacterially expressed GFP-tagged H1.8 and MagIC-cryo-EM may potentially influence the structure of the H1.8-bound nucleosome, the structures of GFP-tagged H1.8-bound nucleosomes isolated from chromosomes assembled in Xenopus egg extract are essentially identical to the endogenous H1.8bound nucleosome structure we previously determined. In addition, we have shown that GFP-H1.8 was able to replace the function of endogenous H1.8 to support the proper mitotic chromosome length (Fig. S3), which is based on the capacity of H1.8 to compete with condensin as we have previously demonstrated (PMID 34406118). Therefore, we believe that the effects of GFP-tagging to be minimal. This point incorporated into the main result section (page 6, line 215) to read as “The structures of GFP-tagged H1.8bound nucleosomes isolated from Xenopus egg extract chromosomes are essentially identical to the endogenous H1.8-bound nucleosome structure we previously determined. Therefore, although the usage of GFP-tagged H1.8 and MagIC-cryo-EM potentially influence the structure of the H1.8-bound nucleosome, we consider these influences to be minimal.”

      Also, the GFP-pulled down H1.8 nucleosomes should be better characterized biochemically to determine the actual linker DNA lengths (which are known to have a strong effect of linker histone affinity) and presence or absence of other factors such as HMG proteins that may compete with linker histones and cause the multiplicity of nucleosome structural classes (such as shown on Fig. 3F) for which the association with H1.8 is uncertain.

      We addressed the concerns brought by the reviewer as following:

      (1) DNA length

      As the reviewer correctly pointed out, linker DNA length is critical for linker histone binding, and conventional ChIP protocols often result in DNA over-digestion to lengths of 140–150 bp. To minimize DNA over-digestion and structural damage, we have optimized a gentle chromosomal nucleosome purification protocol that enabled the cryoEM analysis of chromosomal nucleosomes (PMID: 34478647). This protocol involves DNA digestion with a minimal amount of MNase at 4ºC, producing nucleosomal DNA fragments of 180–200 bp. Additionally, before each chromatin extraction, we performed small-scale MNase assays to ensure that the DNA lengths consistently fell within the 180–200 bp range (Fig. S4B). These DNA lengths are sufficient for linker histone H1 binding, in agreement with previous findings indicating that >170 bp is adequate for linker histone association (PMID: 26212454). 

      This information has been incorporated into the main text and Methods section; 

      On page 5, line 178, the sentence was added to read, “To prevent dissociation of H1.8 from nucleosomes during DNA fragmentation, the MNase concentration and the reaction time were optimized to generate DNA fragment lengths with 180–200 bp (Fig. S4B), which is adequate for linker histone association (PMID 26212454).”

      On page 32, line 1192, the sentence was added to read, “To digest chromatin, MNase concentration and reaction time were tested on a small scale and optimized to the condition that produces 180-200 bp DNA fragments.”

      (2) Co-associated proteins with H1-GFP nucleosome.

      We now include mass spectrometry (MS) data for the proteins in the sucrose density gradient fraction 5 used for MagIC-cryo-EM analysis of GFP-H1.8-bound chromatin proteins as well as MS of proteins isolated with the corresponding MagIC-cryo-EM beads (Table S2 and updated Table S5). As the reviewer expected, HMG proteins (hmga2.L and hmga2.S in Table S2) were present in interphase sucrose gradient fraction 5, but their levels were less than 2% of H1.8. Accordingly, none of the known chromatin proteins besides histones and the nucleoplasmin were detected by MS in the GFP-nanobody MagIC-cryo-EM beads, including the FACT complex and PCNA, whose levels in the sucrose fraction were comparable to H1.8 (Table S2), suggesting that our MagIC-cryo-EM analysis was not meaningfully affected by HMG proteins and other chromatin proteins. Consistent with our interpretation, the structural features of H1.8bound nucleosomes isolated from interphase and metaphase chromosomes were essentially identical.

      Reviewer #2 (Public review):

      Summary:

      The authors present a straightforward and convincing demonstration of a reagent and workflow that they collectively term "MagIC-cryo-EM", in which magnetic nanobeads combined with affinity linkers are used to specifically immobilize and locally concentrate complexes that contain a protein-of-interest. As a proof of concept, they localize, image, and reconstruct H1.8-bound nucleosomes reconstructed from frog egg extracts. The authors additionally devised an image-processing workflow termed "DuSTER", which increases the true positive detections of the partially ordered NPM2 complex. The analysis of the NPM2 complex {plus minus} H1.8 was challenging because only ~60 kDa of protein mass was ordered. Overall, single-particle cryo-EM practitioners should find this study useful.

      Strengths:

      The rationale is very logical and the data are convincing.

      Weaknesses:

      I have seen an earlier version of this study at a conference. The conference presentation was much easier to follow than the current manuscript. It is as if this manuscript had undergone review at another journal and includes additional experiments to satisfy previous reviewers. Specifically, the NPM2 results don't seem to add much to the main story (MagIC-cryo-EM), and read more like an addendum. The authors could probably publish the NPM2 results separately, which would make the core MagIC results (sans DusTER) easier to read.

      We thank the reviewer for constructive comments. We regret to realize that the last portion of the result section, where we have described a detailed analysis of NPM2 structures, was erroneously omitted from the submission due to MS Word's formatting error. We hope that the inclusion of this section will justify the inclusion of the NPM2 analysis. Specifically, we decided to include NPM2 structures to demonstrate that our method successfully determined the structure that had never been reported. Conformational changes in the NPM family have been proposed in previous studies using techniques such as NMR, negative stain EM, and simulations, and these changes are thought to play a critical role in regulating NPM function (PMID: 25772360, 36220893, 38571760), but there has been a confusion in the literature, for example, on the substrate binding site and on whether NPM2 recognizes the substrate as a pentamer or decamer. Despite their low resolution, our new cryo-EM structures of NPM2 suggest that NPM2 recognizes the substrate as a pentamer, identifies potential substrate-binding sites, and indicates the mechanisms underlying NPM2 conformational changes. We believe that publishing these results will provide valuable insights into the NPM research field and help guide and inspire further investigations.

      Reviewer #3 (Public review):

      Summary:

      In this paper, Arimura et al report a new method, termed MagIC-Cryo-EM, which refers to the method of using magnetic beads to capture specific proteins out of a lysate via, followed immunoprecipitation and deposition on EM grids. The so-enriched proteins can be analzyed structurally. Importantly, the nanoparticles are further functionalized with protein-based spacers, to avoid a distorted halo around the particles. This is a very elegant approach and allows the resolution of the stucture of small amounts of native proteins at atomistic resolution.

      Here, the authors apply this method to study the chromatosome formation from nucleosomes and the oocyte-specific linker histone H1.8. This allows them to resolve H1.8-containing chromatomosomes from oocyte extract in both interphase and metaphase conditions at 4.3 A resolution, which reveal a common structure with H1 placed right at the dyad and contacting both entry-and exit linker DNA.

      They then investigate the origin of H1.8 loss during interphase. They identify a nonnucleosomal H1.8-containing complex from interphase preparations. To resolve its structure, the authors develop a protocol (DuSTER) to exclude particles with ambiguous center, revealing particles with five-fold symmetry, that matches the chaperone NPM2. MS and WB confirms that the protein is present in interphase samples but not metaphase. The authors further separate two isoforms, an open and closed form that coexist. Additional densities in the open form suggest that this might be bound H1.8.

      Strengths:

      Together this is an important addition to the suite of cryoEM methods, with broad applications. The authors demonstrate the method using interesting applications, showing that the methods work and they can get high resolution structures from nucleosomes in complex with H1 from native environments.

      Weaknesses:

      The structures of the NPM2 chaperone is less well resolved, and some of the interpretation in this part seems only weakly justified.

      We thank the reviewer for recognizing the significance of our methods and for constructive comments. We regret to realize that the last portion of the result section where we have described detailed analysis of NPM2 structures was erroneously omitted from the submission due to the MS word's formatting error. We hope that inclusion of this section will justify the inclusion of NPM2 analysis. Specifically, we agree that our NPM2 structures are low-resolution and that our interpretations may be revised as higher-resolution structures become available, although we believe that publishing these results will provide valuable insights into the NPM research field and also will illustrate the power of MagIC-cryo-EM and DuSTER. To respond to this criticism, the revised manuscript now clearly describes the limitations of our NPM2 structures while highlighting the key insights. In page 12 line 452, the sentence was added to read, “While DuSTER enables the structural analysis of NPM2 co-isolated with H1.8-GFP, the resulting map quality is modest, and the reported numerical resolution may be overestimated. Furthermore, only partial density for H1.8 is observed. Although structural analysis of small proteins is inherently challenging, it is possible that halo-like scattering further hinder high-resolution structural determination by reducing the S/N ratio. More detailed structural analyses of the NPM2-substrate complex will be addressed in future studies.

      Reviewer #1 (Recommendations for the authors): 

      (1) To assess the advantage provided by the new technique for imaging of isolated pure or enriched fractions of native chromatin, the nucleosome structure analysis should be matched by a proper biochemical characterization of the isolated nucleosomes. Nucleosome DNA size is known to greatly affect linker histone affinity and additional proteins like HMG may compete with linker histone for binding. SDS-PAGE of the sucrose gradient fractions (Fig. 3E) shows many nonhistone proteins where H1-GFP appears to be a minor component. However, the gradient fractions contain both bound and unbound proteins. I would suggest that a larger-scale pull-down using the same GFP antibodies and streptavidin beads should be conducted and the captured nucleosome DNA and proteins characterized. 

      We addressed the concerns brought by the reviewer as following:

      (1) DNA length

      As the reviewer correctly pointed out, linker DNA length is critical for linker histone binding, and conventional ChIP protocols often result in DNA over-digestion to lengths of 140–150 bp. To minimize DNA over-digestion and structural damage, we have optimized a gentle chromosomal nucleosome purification protocol that enabled the cryoEM analysis of chromosomal nucleosomes (PMID: 34478647). This protocol involves DNA digestion with a minimal amount of MNase at 4ºC, producing nucleosomal DNA fragments of 180–200 bp. Additionally, before each chromatin extraction, we performed small-scale MNase assays to ensure that the DNA lengths consistently fell within the 180–200 bp range (Fig. S4B). These DNA lengths are sufficient for linker histone H1 binding, in agreement with previous findings indicating that >170 bp is adequate for linker histone association (PMID: 26212454). 

      This information has been incorporated into the main text and Methods section. 

      On page 5, line 178, the sentence was added to read, “To prevent dissociation of H1.8 from nucleosomes during DNA fragmentation, the MNase concentration and the reaction time were optimized to generate DNA fragment lengths with 180–200 bp (Fig. S4B), which is adequate for linker histone association (PMID 26212454).”

      On page 32, line 1192, the sentence was added to read, “To digest chromatin, MNase concentration and reaction time were tested on a small scale and optimized to the condition that produces 180-200 bp DNA fragments.”

      (2) Co-associated proteins with H1-GFP nucleosome.

      We now include mass spectrometry (MS) data for the proteins in the sucrose density gradient fraction 5 used for MagIC-cryo-EM analysis of GFP-H1.8-bound chromatin proteins as well as MS of proteins isolated with the corresponding MagIC-cryo-EM beads (Table S2 and updated Table S5). As the reviewer expected, HMG proteins (hmga2.L and hmga2.S in Table S2) were present in interphase sucrose gradient fraction 5, but their levels were less than 2% of H1.8. Accordingly, none of known chromatin proteins besides histones and the nucleoplasmin were detected by MS in the GFP-nanobody MagIC-cryo-EM beads, including the FACT complex and PCNA, whose levels in the sucrose fraction were comparable to H1.8 (Table S2), suggesting that our MagIC-cryo-EM analysis was not meaningfully affected by HMG proteins and other chromatin proteins. Consistent with our interpretation, the structural features of H1.8bound nucleosomes isolated from interphase and metaphase chromosomes were essentially identical.

      (2) A similar pull-down analysis with quantitation of NPM2 and GFP (in addition to analysis of sucrose gradient fractions) should be conducted to show whether the immune-selected particles do indeed contains a stoichiometric complex of H1.8 with NPM2.  

      Proteins isolated using MagIC-cryo-EM beads were identified through mass spectrometry (Fig. 4D). The MS signal suggests that the molar ratio of NPM2 is higher than that of H1.8 or sfGFP. This observation is consistent with the idea that an NPM2 pentamer can bind between one and five H1.8-GFP molecules.

      (3) The use of recombinant, bacterial produced H1.8- GFP and just one type of antibodies (GFP) are certain limitations of this work. These limitations as well as future steps needed to use antibodies specific for native antigens, such as histone variants and epigenetic modifications should be discussed.  

      We clarified these points in the “Limitation of the study” section (page 12, line 420). The revised sections are indicated by the underlines below.

      “While MagIC-cryo-EM is envisioned as a versatile approach suitable for various biomolecules from diverse sources, including cultured cells and tissues, it has thus far been tested only with H1.8-bound nucleosome and H1.8-bound NPM2, both using antiGFP nanobodies to isolate GFP-tagged H1.8 from chromosomes assembled in

      Xenopus egg extracts after pre-fractionation of chromatin. To apply MagIC-cryo-EM for the other targets, the following factors must be considered: 1) Pre-fractionation. This step (e.g., density gradient or gel filtration) may be necessary to enrich the target protein in a specific complex from other diverse forms (such as monomeric forms, subcomplexes, and protein aggregates). 2) Avoiding bead aggregation. Beads may be clustered by targets (if the target complex contains multiple affinity tags or is aggregated), nonspecific binders, and the target capture modules. To directly apply antibodies that recognize the native targets and specific modifications, optimization to avoid bead aggregation will be important. 3) Stabilizing complexes. The target complexes must be stable during the sample preparation. Crosslink was necessary for the H1.8-GFP-bound nucleosome. 4) Loading the optimum number of targets on the bead. The optimal number of particles per bead differs depending on target sizes, as larger targets are more likely to overlap. For H1.8-GFP-bound nucleosomes, 500 to 2,000 particles per bead were optimal. We expect that fewer particles should be coated for larger targets.”

      Reviewer #2 (Recommendations for the authors):  

      General: 

      Figures: Most of the figures have tiny text and schematic items (like Fig. 2B). To save readers from having to enlarge the paper on their computer screen, consider enlarging the smallest text & figure panels. 

      We enlarged the text in the main figures.

      Is it possible that the MagIC method also keeps more particles "submerged", i.e., away from the air:water interface? Does MagIC change the orientation distribution?  

      In theory, the preferred orientation bias should be reduced in MagIC-cryo-EM, as particles are submerged, and the bias is thought to arise from particle accumulation at the air-water interface. However, while the preferred orientation appears to be mitigated, the issue is not completely resolved, as demonstrated in Author response image 1.

      Author response image 1.

      A possible explanation for the remaining preferred orientation bias in MagIC-cryo-EM data is that many particles are localized on graphene-water interfaces.

      Consider adding a safety note to warn about possible pinching injuries when handling neodymium magnets. 

      This is a good idea. We added a sentence in the method section (page 24, line 878), “The two pieces of strong neodymium magnets have to be handled carefully as magnets can leap and slam together from several feet apart.”

      In the methods section, the authors state that the grids were incubated on magnets, followed by blotting and plunge freezing in the Vitrobot. Presumably, the blotting was performed in the absence of magnets. The authors may want to clarify this in the text. If so, can the authors speculate how the magnet-treated beads are better retained on the grids during blotting? Is it due to the induced aggregation and/or deposition of the nanobeads on the grid surface? 

      In the limitation section (page 12 line 446), the sentence was added to read:

      “The efficiency of magnetic bead capture can be further improved. In the current MagICcryo-EM workflow, the cryo-EM grid is incubated on a magnet before being transferred to the Vitrobot for vitrification. However, since the Vitrobot cannot accommodate a strong magnet, the vitrification step occurs without the magnetic force, potentially resulting in bead loss. This limitation could be addressed by developing a new plunge freezer capable of maintaining magnetic force during vitrification.”

      In the method section (page 27 line 993), the sentence was modified. The revised sections are indicated by underlines.

      “The grid was then incubated on the 40 x 20 mm N52 neodymium disc magnets for 5 min within an in-house high-humidity chamber to facilitate magnetic bead capture. Once the capture was complete, the tweezers anchoring the grid were transferred and attached to the Vitrobot Mark IV (FEI), and the grid was vitrified by employing a 2second blotting time at room temperature under conditions of 100% humidity.”

      Do you see an extra density corresponding to the GFP in your averages?  

      Since GFP is connected to H1.8 via a flexible linker, the GFP structure was observed in complex with the anti-GFP nanobody, separate from the H1.8-nucleosome and H1.8NPM2 complexes, as shown in Fig. S10.

      Fig. 5 & Fig. S11: The reported resolutions for NPM2 averages were ~5Å but the densities appear - to my eyes - to resemble a lower-resolution averages.  

      Although DuSTER enables the 3D structural determination of NPM2 co-isolated with H1-GFP, we recognize that the quality of the NPM2 map falls short of the standard expected for a typical 5 Å-resolution map. To appropriately convey the quality of the NPM2 maps, we have included the 3D FSC and local resolution map of the NPM2 structure (new Fig. S12). Furthermore, we have revised the manuscript to deemphasize the resolution of the NPM2 structure to avoid any potential misinterpretation.

      Fig. 5D: The cartoon says: "less H1.8 on interphase nucleosome" and "more H1.8 on metaphase nucleosome". Please help the readers understand this conclusion with the gel in Fig. 3C and the population histograms in Fig. 3F. 

      As depicted in Fig. 3A, we previously identified the preferential binding of H1.8 to metaphase nucleosomes (PMID: 34478647). In this study, to obtain sufficient H1.8bound nucleosomes for MagIC-cryo-EM, we used 2.5 times more starting material for interphase samples compared to M-phase samples. This discrepancy complicates the comparison of H1-GFP binding ratios in western blots. However, in GelCode<sup>TM</sup> Blue staining (Fig. S4A), where both H1-GFP and histone bands are visible, the preferential binding of H1.8 to metaphase nucleosomes can be observed (See fractions 11 in interphase and metaphase).

      Abstract - that removes low signal-to-noise ratio particles -> to exclude low signal-tonoise ratio particles; The term "exclude" is more accurate and is in the DuSTER acronym itself. 

      We edited it accordingly. 

      P1 - to reduce sample volume/concentration -> to lower the sample volume/concentration needed 

      We edited it accordingly.

      P1 - Flow from 1st to 2nd paragraph could be improved. It's abrupt. Maybe say that some forms of nucleoprotein complexes are rare, with one example being H1.8-bound nucleosomes in interphase chromatin? 

      We have revised the text to address the challenges involved in the structural characterization of native chromatin-associated protein complexes. The revised text reads, “Structural characterization of native chromatin-associated protein complexes is particularly challenging due to their heterogeneity and scarcity: more than 300 proteins directly bind to the histone core surface, while each of these proteins is targeted to only a fraction of nucleosomes in chromatin.”

      P2 - interacts both sides of the linker DNA -> interacts with both the entry and exit linker DNA 

      We have edited it accordingly.

      P2 - "from the chromatin sample isolated from metaphase chromosomes but not from interphase chromosomes" - meaning that the interphase nucleosomes don't have H1.8 densities at all, or that they do, but the H1.8 only interacts with one of the two linker DNAs? 

      In our original attempt to analyze nucleosome structures assembled in Xenopus egg extracts without MagIC-cryo-EM, we were not able to detect the density confidently assigned to H1.8 in interphase chromatin samples. To avoid potential confusion, the revised text reads, “We were able to resolve the 3D structure of the H1.8-bound nucleosome isolated from metaphase chromosomes but not from interphase chromosomes(3). The resolved structure indicated that H1.8 in metaphase is most stably bound to the nucleosome at the on-dyad position, in which H1 interacts with both the entry and exit linker DNAs(21–24). This stable H1 association to the nucleosome in metaphase likely reflects its role in controlling the size and the shape of mitotic chromosomes through limiting chromatin accessibility of condensins(25), but it remains unclear why H1.8 binding to the nucleosome in interphase is less stable. Since the low abundance of H1.8-bound nucleosomes in interphase chromatin might have prevented us from determining their structure, we sought to solve this issue by enriching H1.8bound nucleoprotein complexes through adapting ChIP-based methods.”

      P1, P2 - The logical leap from "by adapting ChIP-based methods" to MagIC is not clear. 

      We addressed this point by revising the text as shown above.

      P2 - "Intense halo-like noise" - This is an awkward term. These are probably the Fresnel fringes that arise from underfocus. I wouldn't call this phenomenon "noise". https://www.jeol.com/words/emterms/20121023.093457.php  

      We re-phrased it as “halo-like scattering”.

      P3 -It may help readers to explain how cryo-EM structures of the H1.8-associated interphase nucleosomes would differentiate from the two models in Fig. 3A.  

      We have revised the introduction section (lines 43~75), including the corresponding paragraph to address the comments above, highlighting the motivation behind determining the structures of interphase and metaphase H1.8-associated nucleosomes. We hope the revisions are now clear.

      P6 - "they were masked by background noise from the ice, graphene". I thought that graphene would be contribute minimal noise because it is only one-carbon-layer thick? 

      That is a valid point. We have removed the term ‘graphene’ from the sentence.

      P6 - What was the rationale to focus on particles with 60 - 80Å dimensions? 

      We observed that 60–80 Å particles were captured by MagIC-cryo-EM beads, as numerous particles of this size were clearly visible in the motion-corrected micrographs surrounding the beads. To clarify this, we revised the sentence to read: 'Topaz successfully picked most of the 60–80 Å particles visible in the motion-corrected micrographs and enriched around the MagIC-cryo-EM beads (Figure S6A).

      P7 - Please explain a technical detail about DuSTER: do independent runs of Topaz picks give particle centers than differ by up to ~40Å or is it that 2D classification gives particle centers that differ by up to ~40Å? Is it possible to distinguish these two possibilities by initializing CryoSPARC on two independent 2D classification jobs on the same set of Topaz picks?  

      Due to the small particle size of NPM2, the former type is predominantly generated when Topaz fails to pick the particles reproducibly. The first cycle of DuSTER removes both former-type particles (irreproducibly picked particles) and latter-type particles (irreproducibly centered particles), while subsequent cycles specifically target and remove the latter type. We have added the following sentence to clarify this (page 7, line 249). The revised sections are indicated by underlines below: “To assess the reproducibility of the particle recentering during 2D classification, two independent particle pickings were conducted by Topaz so that each particle on the grid has up to two picked points (Figure 4A, second left panel). Some particles that only have one picked point will be removed in a later step. These picked points were independently subjected to 2D classification. After recentering the picked points by 2D classification, distances (D) between recentered points from the first picking process and other recentered points from the second picking process were measured. DuSTER keeps recentered points whose D are shorter than a threshold distance (D<sub>TH</sub>). By setting D<sub>TH</sub> = 20 Å, 2D classification results were dramatically improved in this sample; a five-petal flower-shaped 2D class was reconstructed (Figure 4B). This step also removes the particles that only have one picked point.“

      P8 - NPM2 was introduced rather abruptly (it was used as an initial model for 3D refinement). I see NPM2 appear in the supplemental figures cited before the text in P8, but the significance of NPM2 was not discussed there. The authors seem to have made a logical leap that is not explained. 

      We have removed the term NPM2 in P8.

      P9 - "extra cryo-EM densities, which likely represent H1." This statement would be better supported if the resolution of the reconstruction was high enough to resolve H1specific amino acids in the "extra densities" protruding from the petals. 

      We concurred and softened the statement to read “extra cryo-EM densities, which may represent H1.8,”

      P9 - "Notably, extra cryo-EM densities, which likely represent H1.8, are clearly observed in the open form but much less in the closed form near the acidic surface regions proximal to the N terminus of beta-1 and the C terminus of beta-8 (Fig. 5A and 5B)."  It would be helpful to point out where the "extra densities" are in the figure for the open and closed form. Some readers may not be able to extrapolate from the single red arrow to the other extra densities. 

      Thank you for your comment. We have pointed out the density in the Fig 5A as well.

      P9 - "Supporting this idea, the acidic tract A1 (aa 36-40) and A2 (aa 120-140) are both implicated in the recognition of basic substrates such as core histones..."  Did this sentence get cut off in the next column?  

      We apologize for our oversight on this error. Due to an MS Word formatting error, the sentences (lines 316–343) were hidden beneath a figure. We have retrieved the missing sentences:

      “Supporting this idea, the acidic tract A1 (aa 36-40) and A2 (aa 120-140), which are both implicated in recognition of basic substrates such as core histones(43,50), respectively interact with and are adjacent to the putative H1.8 density (Figure 5B). In addition, the NPM2 surface that is in direct contact with the putative H1.8 density is accessible in the open form while it is internalized in the closed form (Figure 5C). This structural change of NPM2 may support more rigid binding of H1.8 to the open NPM2, whereas H1.8 binding to the closed form is less stable and likely occurs through interactions with the C-terminal A2 and A3 tracts, which are not visible in our cryo-EM structures.

      In the aforementioned NPM2-H1.8 structures, for which we applied C5 symmetry during the 3D structure reconstruction, only a partial H1.8 density could be seen (Figure 5B). One possibility is that H1.8 structure in NPM2-H1.8 does not follow C5 symmetry. As the size of the NPM2-H1.8 complex estimated from sucrose gradient elution volume is consistent with pentameric NPM2 binding to a single H1.8 (Figure 3C and Table S3), applying C5 symmetry during structural reconstruction likely blurred the density of the monomeric H1.8 that binds to the NPM2 pentamer. The structural determination of NPM2-H1.8 without applying C5 symmetry lowered the overall resolution but visualized multiple structural variants of the NPM2 protomer with different degrees of openness coexisting within a NPM2-H1.8 complex (Figure S14), raising a possibility that opening of a portion of the NPM2 pentamer may affect modes of H1.8 binding. Although more detailed structural analyses of the NPM2-substrate complex are subject of future studies, MagIC-cryo-EM and DuSTER revealed structural changes of NPM2 that was co-isolated H1.8 on interphase chromosomes.

      Discussion 

      MagIC-cryo-EM offers sub-nanometer resolution structural determination using a heterogeneous sample that contains the target molecule at 1~2 nM, which is approximately 100 to 1000 times lower than the concentration required for conventional cryo-EM methods, including affinity grid approach(9–11).”

      Reviewer #3 (Recommendations for the authors):  

      All with regards to the NPM2 part: 

      It would be great if the authors could provide micrographs where the particles are visible, in addition to the classes. 

      The particles on the motion-corrected micrographs are available in Fig S9.

      Also, the angular distribution in the SI looks very uniform. 

      I also wonder, if the authors could indicate the local resolution for all structures. 

      Could the authors provide the 3D FSC for NPM2?  

      Although DuSTER enables the 3D structural determination of NPM2 co-isolated with H1-GFP, we recognize that the quality of the NPM2 map falls short of the standard expected for a typical 5 Å resolution map. To appropriately convey the quality of the NPM2 maps, we have included the 3D FSC and local resolution map of the NPM2 structure (new Fig. S12).

      I really cannot see a difference between the open and closed forms. Looking at the models, I am skeptical that the authors can differentiate the two forms with the available resolution. Could they provide statistics that support their assignments? 

      To better highlight the structural differences between the two forms, we added a new figure to compare the maps between open and closed forms (Fig S12J-K).

      Also, the 'additional density' representing H1.8 in the NPM2 structures - I cannot see it. 

      We pointed out the density with the red arrow in the revised Fig 5A.

      Minor comments: 

      Something is missing at the end of Results, just before the beginning of the Discussion.  The figure legend for Fig. S12 is truncated, so it is unclear what is going on 

      We apologize for our oversight on this error. Due to an MS Word formatting error, the sentences (lines 316–343) were hidden beneath a figure. We have retrieved the missing sentences:

      “Supporting this idea, the acidic tract A1 (aa 36-40) and A2 (aa 120-140), which are both implicated in recognition of basic substrates such as core histones(43,50), respectively interact with and are adjacent to the putative H1.8 density (Figure 5B). In addition, the NPM2 surface that is in direct contact with the putative H1.8 density is accessible in the open form while it is internalized in the closed form (Figure 5C). This structural change of NPM2 may support more rigid binding of H1.8 to the open NPM2, whereas H1.8 binding to the closed form is less stable and likely occurs through interactions with the C-terminal A2 and A3 tracts, which are not visible in our cryo-EM structures.

      In the aforementioned NPM2-H1.8 structures, for which we applied C5 symmetry during the 3D structure reconstruction, only a partial H1.8 density could be seen (Figure 5B). One possibility is that H1.8 structure in NPM2-H1.8 does not follow C5 symmetry. As the size of the NPM2-H1.8 complex estimated from sucrose gradient elution volume is consistent with pentameric NPM2 binding to a single H1.8 (Figure 3C and Table S2), applying C5 symmetry during structural reconstruction likely blurred the density of the monomeric H1.8 that binds to the NPM2 pentamer. The structural determination of NPM2-H1.8 without applying C5 symmetry lowered the overall resolution but visualized multiple structural variants of the NPM2 protomer with different degrees of openness coexisting within a NPM2-H1.8 complex (Figure S14), raising a possibility that opening of a portion of the NPM2 pentamer may affect modes of H1.8 binding. Although more detailed structural analyses of the NPM2-substrate complex are subject of future studies, MagIC-cryo-EM and DuSTER revealed structural changes of NPM2 that was co-isolated H1.8 on interphase chromosomes.

      Discussion 

      MagIC-cryo-EM offers sub-nanometer resolution structural determination using a heterogeneous sample that contains the target molecule at 1~2 nM, which is approximately 100 to 1000 times lower than the concentration required for conventional cryo-EM methods, including affinity grid approach(9–11).”

      Figure S13: I am not sure how robust these assignments are at this low resolution. Are these real structures or classification artifacts? It feels very optimistic to interpret these structures  

      We agree that our NPM2 structures are low-resolution and that our interpretations may be revised as higher-resolution structures become available, although we believe that publishing these results will provide valuable insights into the NPM research field and also will illustrate the power of MagIC-cryo-EM and DuSTER. Conformational changes in the NPM family have been proposed in previous studies using techniques such as NMR, negative stain EM, and simulations, and these changes are thought to play a critical role in regulating NPM function (PMID: 25772360, 36220893, 38571760), but there has been a confusion in the literature, for example, on the substrate binding site and on whether NPM2 recognizes the substrate as a pentamer or decamer. Despite their low resolution, our new cryo-EM structures of NPM2 suggest that NPM2 recognizes the substrate as a pentamer, identify potential substrate-binding sites, and indicate the mechanisms underlying NPM2 conformational changes. We believe that publishing these results will provide valuable insights into the NPM research field and help guide and inspire further investigations. 

      To respond to this criticism, we have revised the manuscript to clearly describe the limitations of our NPM2 structures while highlighting the key insights. On page 12, line 452, the sentence was added to read, “While DuSTER enables the structural analysis of NPM2 co-isolated with H1.8-GFP, the resulting map quality is modest, and the reported numerical resolution may be overestimated. Furthermore, only partial density for H1.8 is observed. Although structural analysis of small proteins is inherently challenging, it is possible that halo-like scattering further hinders high-resolution structural determination by reducing the S/N ratio. More detailed structural analyses of the NPM2-substrate complex will be addressed in future studies.”

    1. Author response:

      The following is the authors’ response to the original reviews.

      Public Reviews:

      Reviewer #1 (Public Review):

      Summary:

      The major result in the manuscript is the observation of the higher order structures in a cryoET reconstruction that could be used for understanding the assembly of toroid structures. The crosslinking ability of ZapD dimers result in bending of FtsZ filaments to a constant curvature. Many such short filaments are stitched together to form a toroid like structure. The geometry of assembly of filaments - whether they form straight bundles or toroid like structures - depends on the relative concentrations of FtsZ and ZapD.

      Strengths:

      In addition to a clear picture of the FtsZ assembly into ring-like structures, the authors have carried out basic biochemistry and biophysical techniques to assay the GTPase activity, the kinetics of assembly, and the ZapD to FtsZ ratio.

      Weaknesses:

      The discussion does not provide an overall perspective that correlates the cryoET structural organisation of filaments with the biophysical data.

      The crosslinking nature of ZapD is already established in the field. The work carried out is important to understand the ring assembly of FtsZ. However, the availability of the cryoET observations can be further analysed in detail to derive many measurements that will help validate the model, and obtain new insights.

      We thank the reviewer for these insightful comments on our work. We have edited the manuscript to resolve and clarify most of the issues raised during the review process.

      Reviewer #2 (Public Review):

      Summary:

      In this paper, the authors set out to better understand the mechanism by which the FtsZ-associated protein ZapD crosslinks FtsZ filaments to assemble a large-scale cytoskeletal assembly. For this aim, they use purified proteins in solution and a combination of biochemical, biophysical experiments and cryo-EM. The most significant finding of this study is the observation of FtsZ toroids that form at equimolar concentrations of the two proteins.

      Strengths:

      Many experiments in this paper confirm previous knowledge about ZapD. For example, it shows that ZapD promotes the assembly of FtsZ polymers, that ZapD bundles FtsZ filaments, that ZapD forms dimers and that it reduces FtsZ's GTPase activity. The most novel discovery is the observation of different assemblies as a function of ZapD:FtsZ ratio. In addition, using CryoEM to describe the structure of toroids and bundles, the paper provides some information about the orientation of ZapD in relation to FtsZ filaments. For example, they found that the organization of ZapD in relation to FtsZ filaments is "intrinsic heterogeneous" and that FtsZ filaments were crosslinked by ZapD dimers pointing in all directions. The authors conclude that it is this plasticity that allows for the formation of toroids and its stabilization. Unfortunately, a high-resolution structure of the protein organization was not possible. These are interesting findings that in principle deserve publication.

      We thank the reviewer for this valuable assessment. We have made several changes to the manuscript to improve its readability and comprehensibility. In addition, we have addressed the reviewer’s main concerns in the point-by-point response below.

      Weaknesses:

      While the data is convincing, their interpretation has some substantial weaknesses that the authors should address for the final version of this paper.

      We have addressed most of the aspects highlighted by the reviewer to improve the quality and comprehensibility of our results.

      For example, as the authors are the first to describe FtsZ-ZapD toroids, a discussion why this has not been observed in previous studies would be very interesting, i.e. is it due to buffer conditions, sample preparation?

      Several factors may explain the absence of observed toroidal structures in other studies. FtsZ is a highly dynamic protein, and its behavior varies significantly with different environmental conditions, as detailed in the literature. These environmental factors include pH, salt concentration, protein type, GTP levels, and the purification strategy used. Previous research has employed negative stain electron microscopy (EM) to visualize ZapD-FtsZ structures. It is important to note that FtsZ is sensitive to surface effects when it is bound to or adsorbed onto membranes (Mateos-Gil et al. 2019 FEMS Microbiol Rev - DOI: 10.1093/femsre/fuy039). Therefore, the adsorption of FtsZ and ZapD onto the EM grid may influence the formation of higher order structures. In this study, we used cryo-electron microscopy (cryo-EM) and cryo-electron tomography (cryo-ET) to visualize the 3D organization of ZapD-mediated structures. This approach allows us to avoid staining artifacts and the distortion of structures caused by adsorption or drying of the grid. In addition, we can resolve single filaments. Our buffer conditions also differ slightly from those in previous studies, which may significantly impact the behavior of FtsZ, as illustrated in Supplementary Fig. 3.

      At parts of the manuscript, the authors try a bit too hard to argue for the physiological significance of these toroids. This, however, is at least very questionable, because: The typical diameter is in the range of 0.25-1.0 μm, which requires some flexibility of the filaments to be able to accommodate this. It's difficult to see how a FtsZ-ZapD toroid, which appears to be quite rigid with a narrow size distribution of 502 nm {plus minus} 55 nm could support cell division rather than stalling it at that cell diameter. which the authors say is similar to the E. coli cell.

      The toroidal structures formed by FtsZ and ZapD, with their characteristics similar to those of the bacterial division system, are significant in physiological contexts and warrant further study. The connections mediated by Zaps are expected to play a crucial role in filament organization, which is vital for the machinery enabling cellular constriction. Therefore, characterizing these structures in vitro can provide insight into divisome stabilization, assembly and constriction mechanisms. While we acknowledge the limitations of in vitro systems and do not expect to see the same toroidal structures in vivo, the way ZapD decorates and connects FtsZ filaments in vitro may resemble the processes that occur in the division ring formed inside the cell. This study represents an initial effort to characterize these toroidal structures, which could inspire further research and potentially reveal their physiological relevance.

      Regarding flexibility, it has been previously reported that an arrangement of loosely connected filaments forms the FtsZ ring. Our model is consistent with this observation despite the heterogeneity and density observed in the toroidal structures. We anticipate differences in vivo due to the high complexity of the cytoplasm, interactions with other cellular components, and attachment to the cell membrane, all of which would influence structural outcomes. However, our novel in vitro approach, which allows us to study FtsZ filament organization and connectivity – features that are challenging to explore in vivo and have not been thoroughly investigated before – has the potential to significantly advance our understanding of these structures. Consequently, these structures can aid our understanding of complex macrostructures in vivo, even if we have merely begun to scratch the surface of their characterization.

      Regarding the size of the toroids, we hypothesize that it reflects an optimal condition based on our experimental setup in solution. In vivo, these conditions are altered by interactions with various division partners, attachment to the plasma membrane, and system contraction. 

      We have better reformulated and edited the manuscript to discuss the potential physiological relevance of our toroidal structures.

      For cell division, FtsZ filaments are recruited to the membrane surface via an interaction of FtsA or ZipA the C-terminal peptide of FtsZ. As ZapD also binds to this peptide, the question arises who wins this competition or where is ZapD when FtsZ is recruited to the membrane surface? Can such a toroidal structure of FtsZ filaments form on the membrane surface? Additional experiments would be helpful, but a more detailed discussion on how the authors think ZapD could act on membrane-bound filaments would be essential.

      We appreciate this comment, which was indeed one of our main questions. The complexity of the division system raises many questions about the interaction of FtsZ with the plasma membrane. The competition between division components to interact with FtsZ and thus modulate its behavior is still largely unknown. FtsA and ZipA appear to have a greater affinity for the C-terminal domain (CTD) of FtsZ than ZapD. However, considering all FtsZ monomers forming a filament, we expect FtsZ filaments to interact with many different division partners. The ability of FtsZ to interact with many components is necessary to explain the current model of the system. According to this model, FtsZ filaments would be decorated by many different proteins, anchoring them to the membrane while crosslinking or promoting their disassembly in a spatiotemporally controlled manner. 

      We tried experiments combining FtsA, ZipA, and ZapD on supported lipid membranes and liposomes. However, they proved difficult to perform. We expect similar results to those observed for ZapA (Caldas et al. 2019 Nat Commun - DOI: 10.1038/s41467-019-13702-4). However, competition between proteins for interaction with the CTD of FtsZ adds an extra layer of complexity, making exploring this issue attractive in the future. However, as remarkably pointed out by Reviewer 3, our cryo-ET data of straight bundles provide new insights into how ZapD-FtsZ structures can bind to the plasma membrane. In these straight bundles, the CTDs of two parallel FtsZ filaments are oriented upwards. They can bind the plasma membrane directly or the ZapDs, which decorate the FtsZ filaments from above instead of from the side, as suggested previously (Schumacher et al. 2017 J Biol Chem - DOI: 10.1074/jbc.M116.773192), allowing ZapDs to interact with the membrane.

      The authors conclude that the FtsZ filaments are dynamic, which is essential for cell division. But the evidence for dynamic FtsZ filaments within these toroids seems rather weak, as it is solely the partial reassembly after addition of GTP. As ZapD significantly slows down GTP hydrolysis, I am not sure it's obvious to make this conclusion.

      FtsZ filaments are dynamic, as they can reassemble into macrostructures relatively quickly. Decreased GTPase activity is a good indicator of the formation of lateral interactions between filaments. For instance, under crowding conditions, FtsZ also reduces its GTPase activity, although the bundles disassemble very slowly over time (González et al. 2003 J. Biol. Chem - DOI: 10.1074/jbc.M305230200). We measured the GTPase activity during the first 5 minutes after GTP addition, conditions under which toroidal structures and bundles remain fully assembled. However, we expect GTPase activity to recover as the macrostructures disassemble, considering the reassembly of macrostructures after GTP resupply, which suggests that FtsZ filaments remain active and dynamic.

      On a similar note, on page 5 the authors claim that ZapD would transiently interact with FtsZ filaments. What is the evidence for this? They also say that this transient interaction could have a "mechanistic role in the functionality of FtsZ macrostructures." Could they elaborate?

      We have rephrased the whole paragraph in the revised version to clarify matters (page 10, lines 2434):

      “These results are consistent with the observation that ZapD interacts with FtsZ through its central hub, which provides additional spatial freedom to connect other filaments in different conformations. This flexibility allows different filament organizations and contributes to structural heterogeneity. In addition, these results suggest that these crosslinkers can act as modulators of the dynamics of the ring structure, spacing filaments apart and allowing them to slide in an organized manner. The ability of FtsZ to treadmill directionally, together with the parallel or antiparallel arrangement of short, transiently crosslinked filaments, is considered essential for the functionality of the Z ring and its ability to exert constrictive force34,36–38,50. Thus, Zap proteins can play a critical role in ensuring correct filament placement and stabilization, which is consistent with the toroidal structure formed by ZapD.”

      The author should also improve in putting their findings into the context of existing knowledge. For example:

      The authors observe a straightening of filament bundles with increasing ZapD concentration. This seems consistent with what was found for ZapA, but this is not explicitly discussed (Caldas et al 2019)

      We have discussed this similarity in the revised version of this manuscript (page 12, line 40 - page 13, line 8):

      “Understanding how the associative states of ZapA (as tetramers) and ZapD (as dimers), together with membrane tethering, influence the predominant structures formed in both systems is essential. The complexity of the division system raises important questions about the interaction dynamics between FtsZ and the plasma membrane. The competitive nature of the division components to engage with FtsZ and modulate its functionality remains to be thoroughly elucidated. It is important to note that FtsA and ZipA have a greater affinity for the C-terminal domain of FtsZ than ZapD. Our cryo-ET data on straight bundles provide new perspectives on how ZapD-FtsZ structures can effectively bind to the plasma membrane; in particular, the C-terminal domains of parallel FtsZ filaments are oriented upward, allowing direct membrane binding or interaction with ZapDs that reinforce these filaments from above, rather than from the side, as previously suggested.”

      A paragraph summarizing what is known about the properties of ZapD in vivo would be essential: i.e., what has been found regarding its intracellular copy number, location and dynamics?

      We thank the reviewer for this valuable suggestion. We describe the role of Zap proteins in vivo and the previous studies of ZapD in the introduction (page 2, lines 34 - page 3, line 17). Additionally, we added the estimated number of ZapD copies in the cell in the discussion (page 11, lines 2-7).

      In the introduction, the authors write that "GTP binding and hydrolysis induce a conformational change in each monomer that modifies its binding potential, enabling them to follow a treadmilling behavior". This seems inaccurate, as shown by Wagstaff et al. 2022, the conformational change of FtsZ is not associated with the nucleotide state. In addition, they write that FtsZ polymerization depends on the GTPase activity. It would be more accurate to write that polymerization depends on GTP, and disassembly on GTPase activity.”

      Following the reviewer's suggestions, we have adapted and corrected these text elements as follows (page 2, lines 7-9): 

      “FtsZ undergoes treadmilling due to polymerization-dependent GTP hydrolysis, allowing the ring to exhibit its dynamic behavior.”

      On page 2 they also write that "the mechanism underlying bundling of FtsZ filaments is unknown". I would disagree, the underlying mechanism is very well known (see for example Schumacher, MA JBC 2017), but how this relates to the large-scale organization of FtsZ filaments was not clear.

      We thank the reviewer for this comment. We have corrected and clarified the related text accordingly (page 3, lines 11-12):

      “…the link between FtsZ bundling, promoted by ZapD, and the large-scale organization of FtsZ filaments remains unresolved.”

      The authors describe the toroid as a dense 3D mesh, how would this be compatible with the Z-ring and its role for cell division? I don't think this corresponds to the current model of the Z-ring (McQuillen & Xiao, 2020). Apart from the fact it's a ring, I don't think the organization of FtsZ obviously similar to the current of the Z-ring in the bacterial cell, in particular because it's not obvious how FtsZ filaments can bind ZapD and membrane anchors simultaneously.

      We consider that the intrinsic characteristics of toroidal structures and the bacterial division ring have points in common. As indicated in the answer above, despite the differences and limitations that might result from an in vitro approach, the structures shown after ZapD crosslinking of FtsZ filaments can demonstrate intrinsic features occurring in vivo. The current model of the division ring consists of an arrangement of filaments loosely connected by crosslinkers in the center of the cell, forming a ring. This model is compatible with our findings, although many questions remain about the structural organization of the Z-ring in the cell.

      Reviewer 3 has brought a compelling new perspective to interpreting our cryo-ET data: ZapD decorates FtsZ from above, allowing ZapD or FtsZ to bind to the plasma membrane. We have discussed this point in more detail below. In the case of straight bundles, this favors the stacking of straight FtsZ filaments, whereas in the case of toroids, ZapD can also bind FtsZ filaments laterally and diagonally, and it is this less compact arrangement that could enable FtsZ bending and toroid size adjustment. 

      We have revised the text accordingly to incorporate the interpretation proposed by Reviewer 3 (page 12, lines 24-31):

      “The current model of the division ring consists of an array of filaments loosely connected by crosslinkers at the center of the cell, forming a ring. This model is consistent with our findings, although many questions remain regarding the structural organization of the Z ring within the cell. ZapD binds to FtsZ from above, allowing either ZapD or FtsZ to interact with the plasma membrane. In straight bundles, this facilitates the stacking of straight FtsZ filaments, while for toroids, ZapD can also bind FtsZ filaments diagonally. This less compact arrangement could allow bending of the FtsZ filaments and adjustment of toroid size.”

      The authors write that "most of these modulators" interact with FtsZ's CTP, but then later that ZapD is the only Zap protein that binds CTP. This seems to be inconsistent. Why not write that membrane anchors usually bind the CTP, most Zaps do not, but ZapD is the exception?

      We thank the reviewer for this pertinent suggestion, which we have followed in the revised version of the manuscript (page 2, lines 19-22):

      “Most of these modulators interact with FtsZ through its carboxy-terminal end, which modulates division assembly as a central hub.  ZapD is the only Zap protein known to crosslink FtsZ by binding its C-terminal domain, suggesting a critical Z ring structure stabilizing function.”

      I also have some comments regarding the experiments and their analysis:

      Regarding cryoET: the filaments appear like flat bands, even in the absence of ZapD, which further elongates these bands. Is this due to an anisotropic resolution? This distortion makes the conclusion that ZapD forms bi-spherical dimers unconvincing.

      The missing wedge caused by the limited angular range of the tomography data generates an elongation of the structures by a factor of 2 along the Z axis. This feature is visible in the undecorated FtsZ filament data (Supplementary Fig. 10). The more pronounced elongation along the Z-axis observed in the presence of ZapD indicates the presence of ZapD to connect two parallel FtsZ filaments along the Z-axis (see Supplementary Figs. 8, 9 and 10). We do not have sufficient resolution to precisely resolve ZapD proteins from the FtsZ filaments in the Z-axis, but we also observed bispherical ZapDs in the XY plane (Fig. 4b-d). Unfortunately, our data do not allow for a more detailed characterization.

      The authors say that the cryoET visualization provides crucial information on the length of the filaments within this toroid. How long are they? Could the authors measure it?

      Measuring the length of single filaments is not trivial, given the dense, heterogeneous mesh promoted by ZapD crosslinking. We tried to identify and track them, but the density of filaments and connections made precise measurement very difficult. Nevertheless, we could identify the formation of these toroids by an arrangement of short filaments (Supplementary Fig. 11) instead of continuous circular filaments.

      We have removed the following sentence text in the revised manuscript: “Visualization of ZapDmediated FtsZ toroidal structures by cryo-ET provided crucial information on the 3D organization, connectivity and length of filaments within the toroid.”

      Regarding the dimerization mutant of ZapD: there is actually no direct confirmation that mZapD is monomeric. Did the authors try SEC MALS or AUC? Accordingly, the statement that dimerization is "essential" seems exaggerated (although likely true).

      Unlike the wild-type ZapD protein, the mZapD mutant exists as a mixture of monomers (~15%) and dimers, as AUC assays performed at similar protein concentrations revealed. These results demonstrate that the mutant protein has a lower tendency to form dimers than the native ZapD protein. We have included the AUC data for mZapD in the supplementary material (Supp. Fig. 15a).

      What do the authors mean that toroid formation is compatible with robust persistence length? I.e. What does robust mean? It was recently shown that FtsZ filaments are actually surprisingly flexible, which matches well the fact that the diameter of the Z-ring must continuously decrease during cell division (Dunajova et al Nature Physics 2023).

      We have corrected this sentence in the revised version of the manuscript to improve clarity (page 11, lines 9-10): 

      “The persistence length and curvature of FtsZ filaments are optimized for forming bacterial-sized ring structures.”

      The authors claim that their observations suggest „that crosslinkers ... allows filament sliding in an organized fashion". As far as I know there is no evidence of filament sliding, as FtsZ monomers in living cells and in vitro are static.

      Filament sliding may be one of the factors contributing to the force generation mechanisms involved in cell division (Nguyen et al. 2021 J Bacteriol - DOI: 10.1128/JB.00576-20). Our results indicate that ZapD can separate filaments, creating space between them and facilitating their organization.

      Although the molecular dynamics of cell constriction are not yet fully understood, it is possible that filament sliding plays a role. If this is the case, the crosslinking of short FtsZ filaments in multiple directions by ZapD could provide the necessary flexibility to adjust the diameter of the constriction ring during bacterial division.

      What is the „proto-ring FtsA protein"?

      The proto-ring denotes the first molecular assembly of the Z-ring, which in E. coli consists of FtsZ, FtsA and ZipA (see, for example, Ortiz et al. 2016 FEMS Microbiol Rev - DOI: 10.1093/femsre/fuv040). To simplify matters, we have deleted the term “proto-ring” in the revised version of the MS.

      The authors refer to „increasing evidence" for „alternative network remodeling mechanisms that do not rely on chemical energy consumption as those in which entropic forces act through diffusible crosslinkers, similar to ZapD and FtsZ polymers." A reference should be given, I assume the authors refer to the study by Lansky et al 2015 of PRC on microtubules. However, I am not sure how the authors made the conclusion that this applies to FtsZ and ZapD, on which evidence is this assumption based?

      We refer to cytoskeletal network remodeling mechanisms independent of chemical energy consumption (Braun et al. 2016 Bioessays - DOI: 10.1002/bies.201500183) driven by entropic forces induced by macromolecular crowding agents or diffusible crosslinkers. The latter mechanism leads to an increase in filament overlap length and the contraction of filament networks. These mechanisms complement and act in synergy with energy-consuming processes (such as those involving nucleotide hydrolysis) to modulate actin- and microtubule-based cytoskeleton remodeling. Similarly, crosslinking proteins such as ZapD may contribute to remodeling the FtsZ division ring in the cell. 

      We have revised the corresponding text of the manuscript accordingly (page 13, lines 16-24):  “In addition, our findings could greatly enhance the understanding of how polymeric cytoskeletal networks are remodeled during essential cellular processes such as cell motility and morphogenesis. Although conventional wisdom points to molecular motors as the primary drivers of filament remodeling through energy consumption, there is increasing evidence that there are alternative mechanisms that do not rely on such energy, instead harnessing entropic forces via diffusible crosslinkers. This approach may also be applicable to ZapD and FtsZ polymers, suggesting a promising avenue for optimizing conditions in the reverse engineering of the division ring to enhance force generation in minimally reconstituted systems aimed at achieving autonomous cell division.”

      Some inconsistencies in supplementary figure 3: The normalized absorbances in panel a do not seem to agree with the absolute absorbance shown in panel e, i.e. compare maximum intensity for ZapD = 20 µM and 5 µM in both panels.

      We have corrected these inconsistencies in the revised version.

      It's not obvious to me why the structure formed by ZapD and FtsZ disassembles after some time even before GTP is exhausted, can the authors explain? As the structures disassemble, how is the "steadystate turbidity" defined? Do the structures also disassemble when they use a non-hydrolyzable analog of GTP?

      In the presence of ZapD, FtsZ rapidly forms higher order polymers after the addition of GTP, as shown by turbidity assays at 320 nm (the formation of single- or double-stranded FtsZ filaments in the absence of ZapD does not produce a significant increase in turbidity). Macrostructures formed by FtsZ in the presence of ZapD, while more stable than FtsZ filaments (which rapidly disassemble following GTP consumption), are also dynamic. These assembly reactions are GTP-dependent and considerably modify polymer dynamics. In agreement with our results, previous studies have shown that high concentrations of macromolecular crowders (such as Ficoll or dextran) promote the formation of dynamic FtsZ polymer networks (González et al. 2003 J. Biol. Chem - DOI: 10.1074/jbc.M305230200). In this case, FtsZ GTPase activity was significantly retarded compared with FtsZ filaments, resulting in a decrease in GTPase turnover. Similar mechanisms may apply to assembly reactions in the presence of ZapD.

      Parallel assembly studies replacing GTP with a slowly hydrolyzable GTP analog remain pending. We expect ZapD-containing FtsZ macrostructures to last assembled for longer but still disassemble upon GTP consumption, as occurs with the crowding-induced FtsZ polymer networks formed in the presence of nucleotide analogs.

      Accordingly, we have revised the corresponding text to clarify matters (page 4, line 37 – page 5 line 7). 

      Conclusion: Despite some weaknesses in the interpretation of their findings, I think this paper will likely motivate other structural studies on large scale assemblies of FtsZ filaments and its associated proteins. A systematic comparison of the effects of ZapA, ZapC and ZapD and how their different modes of filament crosslinking can result in different filament networks will be very useful to understand their individual roles and possible synergistic behavior.

      We appreciate the reviewer's remarks and comments, which provided us with valuable information and helped us considerably improve the revised manuscript.

      Reviewer #3 (Public Review):

      Summary:

      The authors provide the first image analysis by cryoET of toroids assembled by FtsZ crosslinked by ZapD. Previously toroids of FtsZ alone have been imaged only in projection by negative stain EM. The authors attempt to distinguish ZapD crosslinks from the underlying FtsZ filaments. I did not find this distinction convincing, especially because it seems inconsistent with the 1:1 stoichiometry demonstrated by pelleting. I was intrigued by one image showing straight filament pairs, which may suggest a new model for how ZapD crosslinks FtsZ filaments.

      We thank the reviewer for these valuable comments, to which we have responded in detail below. 

      Strengths:

      (1) The first image analysis of FtsZ toroids by cryoET.

      (2) The images are accompanied by pelleting assays that convincingly establish a 1:1 stoichiometry of FtsZ:ZapD subunits.

      (3) Fig. 5 shows an image of a pair of FtsZ filaments crosslinked by ZapD. This seems to have higher resolution than the toroids. Importantly, it suggests a new model for the structure of FtsZ-ZapD that resolves previously unrecognized conflicts. (This is discussed below under weaknesses, because it is so far only supported by a single image.)

      We thank the reviewer for this assessment and, in particular, for raising point 3, which provided a new perspective on the interpretation of our data. We have also included a new example of a straight bundle in Supplementary Fig. 13.

      Weaknesses:

      This paper reports a study by cryoEM of polymers and bundles assembled from FtsZ plus ZapD. Although previous studies by other labs have focused on straight bundles of filaments, the present study found toroids mixed with these straight bundles, and they focused most of their study on the toroids. In the toroids they attempt to delineate FtsZ filaments and ZapD crosslinks. A major problem here is with the stoichiometry. Their pelleting assays convincingly established a stoichiometry of 1:1, while the mass densities identified as ZapD are sparse and apparently well below the number of FtsZ (FtsZ subunits are not resolved in the reconstructions, but the continuous sheets or belts seem to have a lot more mass than the identified crosslinks.)  

      Apart from the stoichiometry I don't find the identification of crosslinks to be convincing. It is missing an important control - cryoET of toroids assembled from pure FtsZ, without ZapD.

      However, if I ignore these and jump to Fig. 5, I think there is an important discovery that resolves controversies in the present study as well as previous ones, controversies that were not even recognized. The controversy is illustrated by the Schumacher 2017 model (their Fig. 7), which is repeated in a simplified version in Fig. 1a of the present mss. That model has a two FtsZ filaments in a plane facing ZapD dimers which bridge them. In this planar model the C-terminal linker, and the ctd of FtsZ that binds ZapD facing each other and the ZapD in the middle, with. The contradiction arises because the C-terminus needs to face the membrane in order to attach and generate a bending force. The two FtsZ filaments in the planar model are facing 90{degree sign} away from the membrane. A related contradiction is that Houseman et al 2016 showed that curved FtsZ filaments have the C terminus on the outside of the curve. In a toroid the C termini should all be facing the outside. If the paired filaments had the C termini facing each other, they could not form a toroid because the two FtsZ filaments would be bending in opposite directions.

      Fig. 5 of the present ms seems to resolve this by showing that the two FtsZ filaments and ZapD are not planar, but stacked. The two FtsZ filaments have their C termini facing the same direction, let's say up, toward the membrane, and ZapD binds on top, bridging the two. The spacing of the ctd binding sites on the Zap D dimer is 6.5 nm, which would fit the ~8 nm width of the paired filament complex observed in the present cryoEM (Fig S13). In the Schumacher model the width would be about 20 nm. Importantly, the stack model has the ctd of each filament facing the same direction, so the paired filaments could attach to the membrane and bend together (using ctd's not bound by ZapD). Finally, the new arrangement would also provide an easy way for the complex to extend from a pair of filaments to a sheet of three or four or more. A problem with this new model from Fig. 5 is that it is supported by only a single example of the paired FtsZ-ZapD complex. If this is to be the basis of the interpretation, more examples should be shown. Maybe examples could be found with three or four FtsZ filaments in a sheet.

      We thank the reviewer for asking interesting questions and suggesting a compelling model for how ZapD could bind FtsZ filaments. Cryo-ET of straight bundles revealed that high ZapD density promotes vertical stacking of FtsZ filaments and decoration of FtsZ filaments by ZapD from above. In toroids, FtsZ filaments are vertically decorated by ZapD, which explains the high elongation of the filament structures observed, consisting of FtsZ-ZapD(-FtsZ) units. In addition, we observed a high abundance of diagonal connections between FtsZ filaments of different heights, revealing a certain flexibility/malleability of ZapD to link filaments that are not perfectly aligned vertically. This configuration could give rise to curved filaments and the overall toroid structure.

      The manuscript proposes that ZapD can bind FtsZ filaments in different directions. However, it seems to have a certain tendency to bind to the upper part of FtsZ filaments, stacking them vertically or vertically with a lateral shift (Supplementary Fig. 9). We also observe lateral connections, although the features of the toroidal structures limit their visualization. This enables both the binding to the membrane by ZapD or FtsZ and the formation of higher order FtsZ polymer structures. 

      In summary, ZapD is capable of linking FtsZ filaments in multiple directions, including from the upper part of the filaments as well as laterally or diagonally. At high concentrations of ZapD, the filaments become more compactly arranged, primarily stacking vertically, which results in the loss of curvature. In contrast, at lower concentrations of ZapD, the FtsZ filaments are less tightly packed, leading to curved filaments and an overall toroidal structure that may resemble the in vivo ring structures.

      We have edited our manuscript to accommodate this hypothesis, including the abstract and the cryoET section (page 7, lines 5-16): 

      “The isosurface confirmed the presence of extended structures along the Z-axis, well beyond the elongation expected from the missing wedge effect for single FtsZ filaments (for comparison, see Supplementary Fig. 10). The vertically extended structures appeared to correspond to filaments that were connected or decorated by additional densities along the Z-axis (Supplementary Fig. 9b). Importantly, these densities were only observed in the presence of ZapD (Supplementary Fig. 10b), suggesting that they represent ZapD connections (Fig. 3e and Supplementary Figs. 8e and 9b). We note that the resolution of the data is not sufficient to precisely resolve ZapD proteins from the FtsZ filaments in the Z-axis.

      These results suggest that the toroids are constructed and stabilized by interactions between ZapD and FtsZ, which are mainly formed along the Z-axis but also laterally and diagonally.”

      Page 7, lines 40-42: 

      “Cryo-ET imaging of ZapD-mediated FtsZ toroidal structures revealed a preferential vertical stacking and crosslinking of short ZapD filaments, which are also crosslinked laterally and diagonally, allowing for filament curvature.”

      And in the discussion (page 12, lines 27-31): 

      “ZapD binds to FtsZ from above, allowing either ZapD or FtsZ to interact with the plasma membrane. In straight bundles, this facilitates the stacking of straight FtsZ filaments, while for toroids, ZapD can also bind FtsZ filaments diagonally. This less compact arrangement could allow bending of the FtsZ filaments and adjustment of the toroid size.”

      What then should be done with the toroids? I am not convinced by the identification of ZapD as "connectors." I think it is likely that the ZapD is part of the belts that I discuss below, although the relative location of ZapD in the belts is not resolved. It is likely that the resolution in the toroid reconstructions of Fig. 4, S8,9 is less than that of the isolated pf pair in Fig. 5c.

      We agree with the reviewer's interpretation that ZapD can attach to FtsZ filaments from both above and laterally. The data from the straight bundles, which are more clearly resolved due to their thinner structure, demonstrate that ZapD can decorate FtsZ filaments vertically. Additionally, the toroidal data supports the notion that ZapD can act as a crosslinker between filaments that are not perfectly vertical, allowing for lateral offsets (see, for example, Fig. 4d) or lateral connections (Fig. 4b). 

      We recognize that the resolution and high density of structures in our cryo-ET data make it challenging to accurately annotate proteins or connectors. Despite this difficulty, we have made efforts to label and identify the ZapD proteins and connectors. We employed an arbitrary labeling method to assist with visual interpretation. However, we acknowledge that some errors may exist and that ZapD proteins were not labeled, particularly along the Z-axis, where the missing wedge limits our ability to distinguish between ZapD and FtsZ proteins (page 7, lines 8-13):

      “The vertically extended structures appeared to correspond to filaments that were connected or decorated by additional densities along the Z-axis (Supplementary Fig. 9b). Importantly, these densities were only observed in the presence of ZapD (Supplementary Fig. 10b), suggesting that they represent ZapD connections (Fig. 3e and Supplementary Figs. 8e and 9b). We note that the resolution of the data is not sufficient to precisely resolve ZapD proteins from the FtsZ filaments in the Z-axis. We note that the resolution of the data is not sufficient to precisely resolve ZapD proteins from the FtsZ filaments in the Z-axis.”

      We draw attention to the limitation of our manual segmentation in the text as follows (page 7, lines 20-24):

      “We manually labeled the connecting densities in the toroid isosurfaces to analyze their arrangement and connectivity with the FtsZ filaments. The high density of the toroids and the wide variety of conformations of these densities prevented the use of subtomogram averaging to resolve their structure and spatial arrangement within the toroids.”

      Importantly, If the authors want to pursue the location of ZapD in toroids, I suggest they need to compare their ZapD-containing toroids with toroids lacking ZapD. Popp et al 2009 have determined a variety of solution conditions that favor the assembly of toroids by FtsZ with no added protein crosslinker. It would be very interesting to investigate the structure of these toroids by the present cryoEM methods, and compare them to the FtsZ-ZapD toroids. I suspect that the belts seen in the ZapD toroids will not be found in the pure FtsZ toroids, confirming that their structure is generated by ZapD.

      The only reported toroidal structure of E. coli FtsZ can be found in the literature by Popp et al. (2009 Biopolymers – DOI: 10.1002/bip.21136). It is important to note that methylcellulose (MC) must be added to the working solution to induce the formation of these structures, as FtsZ toroids do not form in the absence of MC. The mechanisms by which MC promotes this assembly process go beyond mere excluded volume effects due to crowding, as the concentration of MC used is very low (less than 1 mg/ml), which is below the typical crowding regime. This suggests that there are additional interactions between MC and FtsZ. Such complexities and secondary interactions prevent the use of this system as a reliable control for the FtsZ toroidal structures reported here. Alternatively, we also considered the toroidal structures of FtsZ from Bacillus subtilis (Huecas et al. 2017 Biophys J - DOI: 10.1016/j.bpj.2017.08.046) and Cyanobacterium synechocystis (Wang et al. 2019 J Biol Chem – DOI: 10.1074/jbc.RA118.005200). However, these structures do not serve as appropriate controls due to the structural and molecular differences between these FtsZ proteins.

      Recommendations for the authors:  

      Reviewing Editor:

      While the three referees recognize and appreciate the importance of this work several technical and interpretational questions have been raised. There was a prolonged discussion amongst the three expert referees, and it was felt that the current version suffers from a number of problems that the authors need to consider. These are to do with 1. Stoichiometry of ZapD-FtsZ 2. the evidence for crosslinks 3. how the cryo-ET data correlates with the biophysical data 4. Physiological relevance of the elucidated structures. Please take note of the public reviews (strengths and weaknesses) as well as "Recommendations to the authors" sections below, if you choose to prepare a revision.

      In reading the reviews very carefully (as well as while following the ensuing robust discussion between the referees) I noticed that all points raised are extremely important to be addressed / reconciled (with experiments and / or discussion) for this study to become an outstanding contribution to bacterial cell biology field. I would therefore urge you to consider these carefully and revise the manuscript accordingly.

      We thank the editorial board and reviewers for their excellent work evaluating and reviewing our manuscript. Their constructive suggestions and comments have been taken into account in preparing the revised version. We have paid particular attention to the four points mentioned above by the reviewing editor. We hope that the new version and this point-by-point rebuttal letter will answer most of the questions and weaknesses raised by the reviewers.

      Reviewer #1 (Recommendations for the authors):

      Suggestions for improvement of the manuscript:

      (1) ZapD to FtsZ ratio:

      i) Page 3: Results section, paragraph 1:

      FtsZ to ZapD shows a 1:2 ratio. How does this explain cross linking by a dimeric species, as this will be equivalent to a 1:1 ratio of FtsZ and ZapD? The crystal structure in the reference cited has FtsZ peptide bound only to one side of the dimer, however a crosslinking effect can happen only if FtsZ binds to both protomers of ZapD dimer. If the decoration is not uniform as given in the toroid model based on cryoET, this should lead to a model with excess of FtsZ in the toroid?

      On page 3 of the original manuscript, we stated that the binding stoichiometry of ZapD to FtsZ was 2:1, based on estimates derived from sedimentation velocity experiments involving the unassembled GDP form of FtsZ. However, upon reanalyzing these experiments, we found that the previous characterization of the association mode was overly simplistic. We determined that there are two predominant molecular species of ZapD:FtsZ complexes in solution, which correspond to ZapD dimers bound to either one or two FtsZ monomers, resulting in stoichiometries of 2:1 and 1:1, respectively. The revised binding stoichiometry data for ZapD and GDP-FtsZ suggests the presence of 1:1 ZapD-FtsZ complexes which aligns with the idea that FtsZ polymers can be crosslinked by dimeric ZapD species. In mixtures where ZapD is present in excess over FtsZ, the crosslinking corresponds to 1:1 binding stoichiometries, leading to the formation of straight macrostructures. Conversely, when the concentration of ZapD is reduced in the reaction mixture, the resulting macrostructures take the form of toroids. In this scenario, there is an excess of FtsZ because only some of the FtsZ molecules within the polymers are crosslinked by ZapD dimers, resulting in a binding stoichiometry of approximately 0.4 ZapD molecules per FtsZ, as quantified by differential sedimentation experiments.

      We have rewritten the corresponding texts in the revised version to explain these matters (page 4 lines 14-18):

      “Sedimentation velocity analysis of mixtures of the two proteins revealed the presence of two predominant molecular species of ZapD:FtsZ complexes in solution. These complexes are compatible with ZapD dimers bound to one or two FtsZ monomers, corresponding to ZapD:FtsZ stoichiometries of 2:1 and 1:1, respectively (Supplementary Fig. 1a (III-IV)). This observation is consistent with the proposed interaction model.”

      ii) How does 40 - 80 uM of ZapD correspond to a molar ratio of approximately 6?

      It was a typo from previous versions. We have corrected it in the revised version. 

      iii) The ratios of ZapD to FtsZ are different when described later in page 4 in the context of the toroid. Are these ratios relevant compared to the contradicting ratios mentioned later in page 4?

      To clarify issues related to the binding of ZapD to FtsZ, we have rewritten the sections on ZapD binding stoichiometries to both FtsZ-GDP and FtsZ polymers in the presence of GTP (see page 4 lines 14-18 and page 5 lines 15-26).

      iv) Supplementary Figure 5:

      In the representative gel shown, the amount of ZapD in the pellet does not appear to be double compared to 10 and 30 uM concentrations. However, the estimated amount in the plot shown in panel (c) appears to indicate that that ZapD has approximately doubled at 30 uM compared to 10 uM. Please re-check the quantification.

      Without prior staining calibration of the gels, there is no simple quantitative relationship between gel band intensities after Coomassie staining and the amount of protein in a band (Darawshe et al. 1993 Anal Biochem - DOI: 10.1006/abio.1993.1581). The latter point precludes a quantitative comparison of pelleting / SDS-PAGE data and analytical sedimentation measurements.

      v) How can a consistent ratio being maintained be explained in an irregular structure of the toroid? The number of ZapD should be much less compared to FtsZ according to the model.

      See answers to points i) and iii)

      (2) GTPase activity and assembly/disassembly of toroids:

      i) Page 3, Results section: last paragraph:

      What is the explanation or hypothesis for decrease in GTPase activity upon ZapD binding? Given that FtsZ core is not involved in the interaction of the higher order assemblies, what is the probable reason on decrease in GTPase activity upon ZapA binding?

      Excluded volume effects caused by macromolecular crowding, such as high concentrations of Ficoll or dextran, promote the formation of dynamic FtsZ polymer networks (González et al. 2003 J. Biol. Chem - DOI: 10.1074/jbc.M305230200). In these conditions, FtsZ GTPase activity is significantly slowed down compared to the activity observed in FtsZ filaments formed without crowding, leading to a decreased GTPase turnover rate. Similar mechanisms may also apply to assembly reactions in the presence of ZapD (see, for example, Durand-Heredia et al. 2012 J Bacteriol - DOI: 10.1128/JB.0017612).

      ii) How is the decrease in GTPase activity compatible with dynamics of disassembly? Please substantiate on why disassembly is linked to transient interaction with ZapD. Shouldn't disassembly and transient interaction be linked to recovery of GTPase activity rates? 

      iii) Does the decrease in GTPase activity imply a reduced turnover of disassembly of FtsZ to monomers? Hence, how is the reduction in turbidity related to the decrease in GTPase activity? How does the GTPase activity change with time? iv) How can the decrease in GTPase activity with increasing ZapD be explained?

      We conducted GTPase activity assays within the first two minutes following GTP addition, a timeframe that promotes bundle formation. Previous studies, such as those by Durand-Heredia et al. (2012 J Bacteriol - DOI: 10.1128/JB.00176-12), have also indicated a reduction in GTPase activity during the initial moments of bundling. The reviewer’s suggestion that GTPase activity should recover after the disassembly of toroids is valid and warrants further investigation. To test this hypothesis, measuring GTPase activity over extended periods would be necessary. When comparing FtsZ filaments observed in vitro, we found that ZapD-containing FtsZ bundles exhibit decreased GTPase activity. Although we did not measure it directly, we anticipate a reduction in the rate of GTP exchange within the polymer, similar to the behavior of FtsZ bundles formed in the presence of crowders (González et al. 2003 J. Biol. Chem - DOI: 10.1074/jbc.M305230200), which also display a delay in GTPase activity. High levels of ZapD enhance bundling, which may explain the decrease in GTPase activity as ZapD levels increase.

      (3) Treadmilling and FtsZ filament organisation:

      If the FtsZ filaments are cross linked antiparallel, how can tread milling behaviour be explained? Doesn't tread milling imply a directionality of filament orientations in the FtsZ bundles?

      Our model can only suggest filament alignment. The latter is compatible with parallel and antiparallel filament organization.

      The correlation between observed effects on GTPase activity, treadmilling and ZapD interaction will provide an interesting insight to the model.

      Establishing a detailed correlation among these three factors could yield valuable insights into the mechanisms and potential physiological implications of the structural organization of FtsZ polymers influenced by crosslinking proteins and ZapD. To precisely characterize these interactions, further time-resolved assays in solution and reconstituted systems would be necessary, which is beyond the scope of this study.

      (4) Toroid dimensions and intrinsic curvature:

      i) Page 4: What is the correlation between the toroid dimensions and the intrinsic curvature of the FtsZ filaments? Given the thickness of ~ 127 nm, please provide an explanation of how the intrinsic curvature of FtsZ is compatible with both the inner and outer diameters of 500 nm and 380 nm.

      We added a paragraph for clarification (page 6, lines 20-24):

      “Previous studies have shown different FtsZ structures at different concentrations and buffer conditions. FtsZ filaments are flexible and can generate different curvatures ranging from mini rings of ~24 nm to intermediate circular filaments of ~300 nm or toroids of ~500 nm in diameter (reviewed in Erickson and Osawa 2017 Subcell Biochem - DOI: 10.1007/978-3-319-53047-5_5, and Wang et al. 2019 J Biol Chem - DOI: 10.1074/jbc.RA119.009621). It is reasonable to assume that FtsZ filaments can accommodate the toroid shape promoted by ZapD crosslinking.”

      ii) For the curvature of FtsZ filaments to be similar, the length of the filaments in the inner circles of the toroid have to be smaller than those in the outer circles? Is this true? Or are the FtsZ filaments of uniform length throughout?

      Due to the limitations in the resolution of the toroidal structure, we could not accurately measure the length or curvature of the filaments. Considering the FtsZ flexibility, these filaments may exhibit various curvatures and lengths, as previously mentioned.

      iii) Is the ZapD density uniform thought the inner and outer regions of the toroid?

      The heterogeneity found in the structures suggests a difference in ZapD binding densities; however, we lack quantitative data to confirm this. The outer regions are likely more exposed to the attachment of free ZapDs in the surrounding environment, which leads to the recruitment of more ZapDs and the formation of straight bundles. Supplementary Fig. 7b (right) features a zoomed-in image of a toroid adorned with globular densities in the outer areas, which may correspond to ZapD oligomers. Similar characteristics appear in the straight filaments illustrated in the panels of this figure. However, these features are absent or present in significantly lower quantities in toroids with a 1:1 ratio and toroids formed under a 1:6 ratio, suggesting that the external decoration is due to ZapD saturation. Unfortunately, we cannot provide further details on the characteristics of these protein associations.

      (5) Regular arrangement and toroid structure:

      i) Page 4: last section, first sentence: What is meant by 'regular' arrangement here? The word regular will imply a periodicity, which is not a feature of the bundles.

      We have rephrased the sentence in the revised manuscript as follows (page 5, lines 35-36): “Previous studies have visualized bundles with similar features using negative-stain transmission electron microscopy.”

      ii) Similarly, page 6 first sentence mentions about a conserved toroid structure. Which aspects of the toroid structure are conserved and what are the other toroids that are compared with?

      We noted several features that are conserved in the ZapD-mediated toroidal structures, including their diameter, thickness, height, and roundness, as shown in Fig. 2d-e and Supplementary Fig. 6b-c. However, the internal organization of the toroid does not exhibit a periodic or regular structure. We have rephrased this to say: “…resulting in a toroidal structure observed for the first time following the interaction between FtsZ and one of its natural partners in vitro.” (page 7, lines 42-43):

      iii) Discussion, para 1, last sentence: How is the toroid structural correlated with the bacterial cell FtsZ ring? What do the authors mean by 'structural compatibility' with the ring?

      The toroidal structures described in this work are consistent with the intermediate curved conformation of FtsZ polymers observed more generally across bacterial species and are likely to be part of the FtsZ structure responsible for constriction-force generation (Erickson and Osawa 2017 Subcell Biochem - DOI: 10.1007/978-3-319-53047-5_5). In the case of E. coli, if we assume an average of around 5000 FtsZ monomers in the polymeric form (two-thirds of the total found in dividing cells), this number of FtsZ molecules would be enough to encircle the cell around 6-8 times (considering the axial spacing between FtsZ monomers and the cell perimeter), which would be compatible with the structure adopting the form of a discontinuous toroidal assembly. 

      The term “structural compatibility” could be confusing, so we have removed it from the revised text. 

      iv) Discussion, para 2:

      Resemblance with the division ring in bacterial cells is mentioned in paragraph 2, however the features that are compared to claim resemblance comes later in the discussion. It will be helpful to rearrange the sections so that these are presented together.

      We have reorganized the sections following the reviewer’s suggestion.

      (6) CryoET of toroid and interpretation of the tomogram:

      i) Supplementary figure 10: It is not convincing that the indicated densities correspond to ZapD. Is the resolution and the quality of the tomogram sufficient to comment on the localisation of ZapD? It is challenging to see any interpretable difference between FtsZ filament dimers in 10a vs FtsZ+ZapD in panel (b).

      We acknowledge that localizing ZapDs in the structure is a challenge due to the limited resolution of the cryo-ET data (page 7, lines 11-13, 21-24). We have manually labeled putative ZapDs in the data and have done our best to identify the structures reasonably while recognizing the limitations of the segmentation. We use different colors to guide the eye without clearly stating what is or is not a ZapD. However, filaments found in 1:1 and 1:6 ratio toroids have a clear difference in thickness to those observed in the absence of ZapD. The filaments in 1:0 ratio toroids provide a reasonable control for elongation due to the missing wedge and allow us to attribute the extra filament thickness to ZapD densities confidently (page 7, lines 5-12).

      ii) How is it quantified that the elongation in Z is beyond the missing wedge effect? Please include the explanation for this in the methods or the relevant data as Supplementary figure panels.

      The missing wedge effect causes an elongation by a factor of 2 along the Z-axis. This elongation is evident in the filaments of the 1:0 ratio toroids. Consequently, the elongation in the filaments of the 1:1 and 1:6 ratio toroids exceed that observed due to the missing wedge effect. We have also added this information to the methods section (page 17, lines 31-33).

      iii) Segmentation analysis of the tomogram and many method details of analysis and interpretation of the tomography data has not been described. This is essential to understand the reliability of the interpretation of the tomography data.

      We provided thresholds for volume extraction as isosurfaces and clarified how the putative ZapDs are colored in the revised methods section (page 17, line 24-30). However, we could not perform quantitative analysis of the segmented structures.

      (7) Quantification of structural features of the toroid:

      i) Page 5 last sentence mentions that it provides crucial information on the connectivity and length of the filaments. Is it possible to show a quantification of these features in the toroid models?

      Based on our data, we hypothesize that ZapD crosslinks filaments by creating a network of short filaments rather than long ones. These short filaments assemble to form a complete ring. However, the current resolution of the data precludes precise quantification of this process.

      In the revised version, we have changed this last sentence to put the emphasis on the crosslinking geometry instead (page 7, lines 40-43):

      “Cryo-ET imaging of ZapD-mediated FtsZ toroidal structures revealed a preferential vertical stacking and crosslinking of short ZapD filaments, which are also crosslinked laterally and diagonally, allowing for filament curvature and resulting in a toroidal structure observed for the first time following the interaction between FtsZ and one of its natural partners in vitro.”

      ii) In toroids with increasing concentrations, will it be possible to quantify the number of blobs which have been interpreted as ZapD? Is this consistent with the data of FtsZ to ZapD ratios?

      These quantifications would assist in interpreting the data. However, due to the limited resolution of the data, we are reluctant to provide estimates.

      iii) What is the average length of the filaments in the toroid? Can this be quantified from the tomography data? Similarly, can there be an estimation of curvature of the filaments from the data?

      Unfortunately, the complexity of the toroidal structure and the limited resolution we achieved prevent us from providing accurate quantification. We attempted to track and measure the length of the filaments, but this proved challenging due to the high concentration of connections. Regarding curvature, the arrangement of the filaments into toroids makes it difficult to measure the curvature of each filament. Additionally, the filaments are not perfectly aligned, which suggests that there may be various curvatures present.

      iv) What is the average distance between the FtsZ filaments in the toroid? Does this correlate with the ZapD dimensions, when a model has been interpreted as ZapD?

      We measured the spacing (not the center-to-center distance) between filaments in the toroids and showed this in Supplementary Fig. 14b (sky blue). We observed that the distances are very similar to those found for straight bundles (light blue), with a slightly greater variability. We should point out here that the distances were measured in the XY plane to simplify the measurements.

      v) What is the estimate of average inter-filament distances within the toroid? (Similar data as in Figure 13 for bundles?) When the distance between filaments is less, is the angle between ZapD and FtsZ filament axis different from 90 degrees? This might help in validation of interpretation of some of the blobs as ZapD.

      The distances between the filaments presented in Supplementary Figure 14b include those for toroids (1:1 ratio, represented in sky blue) and straight bundles (1:6 ratio, shown in light blue). We focused solely on the distance between filaments in the XY plane and did not differentiate based on the connection angle. Although the distance may vary with changes in the angles between filaments, our data does not permit us to make any quantitative measurements regarding these variations.

      vi) How does the inter filament distance in the toroids compare with the dimensions of ZapD dimers, in the toroids and bundles? Is there a role played by the FtsZ linker in deciding the spacing?

      The dimension of a ZapD dimer is ~7 nm along the longest axis. Huecas et al. (2017 Biophys J - DOI: 10.1016/j.bpj.2017.08.046) estimated an interfilament distance of ~6.5-6.7 nm for toroids of FtsZ from Bacillus subtilis. These authors also observed a difference in this spacing as a function of the linker, assuming that linker length would modulate FtsZ-FtsZ interactions. We observe a similar spacing for double filaments (5.9 ± 0.8 nm) and a longer spacing in the presence of ZapD (7.88 ± 2.1 nm). Previous studies with ZapD did not measure the distance between filaments but hypothesized that distances of 6-12 nm are allowed based on the structure of the protein (Schumacher M. 2017 J Biol Chem - DOI: 10.1074/jbc.M116.773192). Longer linkers may also provide additional freedom to spread the filaments further apart and facilitate a higher degree of variability in the connections by ZapD. This discussion has been included in the revised text (page 6, line 10-18).

      (8) Crosslinking by ZapD and toroid reorganisation by transient interactions:

      i) Page 5, paragraph 2: Presence of putative ZapD decorating a single FtsZ': When ZapD is interacting with 2 FtsZ monomers within the same protofilament, it does not have any more valency to crosslink filaments. How do the authors propose that this can connect nearby filaments?

      We thank the reviewer for raising this interesting question. We see examples of ZapD dimers binding a filament through only one of the monomers, occupying one valency of the interaction and leaving one of the monomers available for another binding. We expect to see higher densities of ZapD in the outer regions of toroids simply because there are no longer (or not as frequent) FtsZ filaments available to be attached and join the overall toroid structure. Assuming that a ZapD dimer could bind the same FtsZ filament, this region would not be able to connect to other nearby filaments via these interactions.

      ii) Page 5: How are the authors coming up with the proposal of a reorganisation of toroid structures to a bundle? Given the extensive cross linking, a transition from a toroid to a bundle has to be a cooperative process and may not be driven by transient interactions. I would imagine that the higher concentration of ZapD will directly result in straight bundles because of the increased binding events of a dimer to one filament.

      Theoretically, this is correct. A certain degree of cooperativity linked to multivalent interactions would also favor the establishment of other ZapD connections. Furthermore, the formation of these structures occurs relatively quickly, within the first two minutes following the addition of GTP. We observed various intermediate structures, ranging from sparse filament bundles to toroids and straight filaments. However, the limited data prevents us from proposing a model that eventually explains the formation of higher-order structures over time.

      iii) Given such a highly cross-linked mesh, how can you justify transient interactions and loss of ZapD leading to disassembly? The possibility that ZapD can diffuse out of such a network seems impossible. Hence, what is the significance of a transient interaction? What is the basis of calling the interactions transient?

      We have noted that the term “transient” used to define the interaction between ZapD and FtsZ seems to generate confusion. Therefore, we have decided to replace this term to improve the readability of our manuscript, which has been edited accordingly.

      iv) Does the spacing between ZapD connections decide the curvature of the toroid?

      The FtsZ linker connected to ZapD molecules could modulate filament spacing and curvature, as previously suggested (Huecas et al. 2017 Biophys J - DOI: 10.1016/j.bpj.2017.08.046; Sundararajan and Goley 2017 J Biol Chem - DOI: 10.1074/jbc.M117.809939, and Sundararajan et al. 2018 Mol Microbiol - DOI: 10.1111/mmi.14081). In our structures, we observe a mixture of curvatures in the internal organization of the toroid. Despite the flexibility of FtsZ, filaments have a preferred curvature that FtsZ would initially determine. However, the amount of ZapD connections will eventually force the filament structure to adapt and align with neighboring filaments, facilitating connections with more ZapDs. Thus, the binding density of ZapD molecules significantly impacts FtsZ curvature rather than the ZapD connections themselves. However, the molecular mechanism describing the link between ZapD binding and polymer curvature remains unsolved.

      v) What is the difference in conditions between supplementary figure 6 and 12? Why is it that toroids are not observed in 12, for the same ratios?

      Both figures show images of samples under the same conditions. At high ZapD concentrations in the sample, we observe a mixture of structures ranging from single filaments, bundles, toroids, and straight bundles. In Supplementary Fig. 6, we have selected images of toroids, while in Supplementary Fig. 12, we have focused on single and double filaments. We aim to compare similar structures at different ZapD concentrations.

      (9) Correlation with in vivo observations:

      What is the approximate ratio of ZapD to FtsZ concentrations in the cell? In this context, within a cell which one - a toroid or bundle - will be preferred?

      Previous studies have estimated that E. coli cells contain approximately 5,000 to 15,000 FtsZ protein molecules, resulting in a concentration of around 3 to 10 µM (Rueda et al. 2003 J Bacteriol - DOI: 10.1128/JB.185.11.3344-3351.2003). Furthermore, only about two-thirds of these FtsZ molecules participate in forming the division ring (Stricker et al. 2002 PNAS - DOI: 10.1073/pnas.052595099). In contrast, ZapD is a low-abundance protein, with only around 500 molecules per cell (DurandHeredia et al. 2012 J Bacteriol - DOI: 10.1128/JB.00176-12), making it a relatively small fraction compared to the FtsZ molecules. Under these circumstances, toroidal structures are more likely to form than straight bundles, as the latter would require significantly higher concentrations of ZapD for proper assembly. We have added these considerations in the revised text (page 11, lines 1-7).

      (10) Interpretation of mZapD results:

      i) What is the experimental proof for weakened stability of the dimer? Rather than weakened stability, does this form a population of only monomeric ZapD or a proportion of non-functional or unfolded dimer? This requires to be shown by AUC or SEC to substantiate the claim of a weakened interface.

      We have provided new AUC results indicating that mZapD is partially monomeric, which suggests a weakened dimerization interface (page 9, line 15-16 and Supp. Fig. 15a). The assays revealed no signs of protein aggregation.

      ii) How does a weaker dimer result in thinner bundles and not toroids? A weaker dimer would imply that the number of ZapD linked to FtsZ will be less than the wild type, leading to less cross linking, which should lead to toroid formation rather than thinner bundles.

      This observation provides the most plausible explanation. However, we did not detect any toroidal structures, even at high concentrations of mZapD. This finding indicates that a more potent dimerization interface is essential for promoting the formation of toroidal structures rather than merely the number of ZapD-FtsZ connections. mZapD presumably has a reduced affinity for FtsZ, which, along with a weaker binding interface, may explain mZapD's inability to facilitate toroid formation.

      iii) This observation would imply that the geometry of the dimeric interaction plays a role in the bending of the FtsZ filaments into toroids? Please comment.

      Our data suggest that the binding density of ZapD to FtsZ polymers is a crucial factor governing the transition from toroidal structures to straight bundles. Toroids form when the polymers have excess free FtsZ (that ZapD does not crosslink). Additional factors, such as the orientation of the interactions, the length of the flexible linker, and the strength of the ZapD dimerization interface, are likely to contribute to these structural reorganizations. However, our current data do not allow for further analysis, and future experiments will be necessary to address these questions.

      (11) Curvature and plasticity of toroid:

      i) What are the factors that stabilise curved protofilaments/toroid structures in the absence of a cross linker, based on earlier studies from B. subtilis. A comparison will be insightful. ii) What is the effect of the linker length between FtsZ globular domain and CTP in the toroid spacing?

      Huecas et al. 2017 (Biophys J - DOI: 10.1016/j.bpj.2017.08.046) concluded that the disordered CTL of FtsZ serves as a spacer that modulates the self-organization of FtsZ polymers. They proposed that this intrinsically disordered CTL, which spans the gap between protofilament cores, provides approximately 70 Å of lateral spacing between the curved Bacillus subtilis FtsZ (BsFtsZ), forming toroidal structures. In contrast, the parallel filaments of tailless BsFtsZ mutants, which have a reduced spacing of 50 Å, will likely stick together, resulting in the straight bundles observed. In the full-length BsFtsZ filament, the flexibility allowed by the lateral association favors the coalescence of these curved protofilaments, leading to the formation of toroidal structures. 

      The role of the C-terminal tail of FtsZ in E. coli is critical for its functionality (Buske and Levin 2012 J Biol Chem - DOI: 10.1074/jbc.M111.330324). However, its structural involvement in complex formations remains unclear. Research indicates that any disordered peptide between 43 and 95 amino acids in length can function as a viable linker, while peptides that are significantly shorter or longer impede cell division (Gardner et al. 2013 Mol Microbiol - DOI: 10.1111/mmi.12279). Studies in E. coli and B. subtilis suggest that intrinsically disordered CTLs play a role in determining FtsZ assembly and function in vivo, and this role is dependent on the length, flexibility, and disorder of the tails. These aspects still require further exploration.

      iii) How is it concluded that the concentration of ZapD is modulating the behaviour of the toroid structure? ZapD as a molecule does not have much room for conformational flexibility beyond a few angstroms, in the absence of long flexible regions. Rather, shouldn't the linker length of FtsZ to the CTP decide the plasticity of the toroid?

      The length and flexibility of the linker can significantly influence structural interactions. As previously mentioned, a longer linker will likely enhance the range of interaction distances and orientations. However, specific interaction of ZapD and FtsZ is stronger than non-specific electrostatic FtsZ-FtsZ interactions, and this is not solely due to the flexibility of the linker. Instead, it can modulate the formation of either a toroidal structure or straight bundles.

      iv) "a minor free energy perturbation to bring about significant changes in the geometry of the fibers due to modifications in environmental conditions" - this sentence is not clear to me. How did the data described in the paper relate to minor free energy perturbations and how do environmental conditions affect this?

      This sentence aimed to convey the notion of polymorphism in FtsZ polymers. We acknowledge that the original version may have been unclear, so we have removed it in the new version of the manuscript (page 12, lines 1-2).

      (12) Missing controls:

      i) Supplementary Figure 2a: Interaction between ZapD and FtsZ: what was the negative control used in this experiment? Use of FtsZ with the CTP deletion or ZapD specific mutations will help in confirming that the Kd estimation is indeed driven by a specific interaction.

      Negative controls correspond to FtsZ and ZapD alone.

      ii) In a turbidity measurement, how will you distinguish between ZapD mediated bundling, ZapD independent bundling and FtsZ filaments alone? Here again, having a data with non-interacting mutational partners will make the data more reliable.

      The turbidity signal of individual proteins in the absence and presence of GTP is indistinguishable from that of the buffer. We have indicated this in the figure legend.

      iii) Control experiments to show that mZapD is folded (see point below) and to indeed prove that it is monomeric is missing.

      We have included the missing AUC data in the supplementary information (Supp Fig 15a).

      Minor points:

      -  Page 2, para 4: beta-sheet domain (instead of beta-strand)

      Done.

      -  Fig 2a and b: Why is a ratio mentioned in Figure 2a legend? I understood these images as individual proteins at 10 uM concentrations.

      That was a typing error; it corresponds to two individual proteins at 10 µM concentrations. 

      -  Fig 2. Y-axis - spelling of frequency (change in all figures where applicable)

      Corrected.

      -  Supplementary Figure 5: FtsZ 5 uM - change u to micro symbol. FtsZ - t is missing

      Corrected. 

      -  Molecular weight marker is xx. What does xx stand for?

      Corrected. 

      -  Fig 1: Units for GTPase activity on the y-axis is missing.

      Done.

      -  Suppl Fig 3: How was the normalisation carried out for the turbidity data?

      We have explained it the revised methods section. 

      -  Page 4, line 5: p missing in ZapD

      Done. 

      -  Page 5: paragraph 1, last sentence: stabilised or established?

      Done.

      -  Page 6: 3rd sentence from last: correct the sentence (one ZapD two FtsZ)

      Corrected. 

      -  Page 14: Fluorescence microscopy and FRAP experiments have not been described in the manuscript. Hence, these are not required in the methods.

      Corrected. 

      -  Please include representative gels of purified protein samples used in the assay for sample quality control.

      Controls for each protein are shown in Supplementary Fig. 5a as “control samples” corresponding to 5 µM of each protein before centrifugation.

      Reviewer #3 (Recommendations for the authors):

      Fig. S2a confirms and quantitates the interaction of ZapD with FtsZ-GDP monomers by F.A. It shows a surprisingly high Kd of ~10 µM. This seems important but it is ignored in the overall interpretation. Fig. S2b (FCS) suggests an even weaker interaction, but this may reflect higher order aggregates.

      As the reviewer points out, the interaction between ZapD and FtsZ in the GDP form is weak, consistent with the need for high concentrations of ZapD to form FtsZ macrostructures in the presence of GTP.

      We did not observe the formation of ZapD aggregates, even at higher protein (Author response image 1A) and salt (Author response image 1B) concentrations.

      Author response image 1.

      A) Sedimentation velocity (SV) profiles of ZapD over a concentration range of 2 to 30 µM in 50 mM KCl, 5 mM MgCl2, Tris-HCl pH 7. B) SV profiles of ZapD at 10 µM in different ionic strength concentrations in buffer 50-500 mM KCl, 5 mM MgCl2, 50 mM Tris-HCl pH 7. Abs280 measurements were collected at 48,000 rpm and 20 ºC. 

      Describing their assembly of toroids the authors state "Upon adding equimolar amounts of ZapD, corresponding to the subsaturating ZapD binding densities described in the previous section". My reading of Fig. 1b and S5 is that FtsZ is almost fully saturated at 1:1 concentration; In S5a at 5:5 µM about 25% of each is in the pellet, which is near 1:1 saturation. It is certainly >50% saturated. Shouldn't this be clarified to read "slightly substoichiometric. Of course, that undermines the identification of ZapD as such a substoichiometric number.

      We have rephrased the sentence following the reviewer’s suggestions to clarify matters (page 5, lines 39-40).

      The cryoET images in Fig. 3 are an average of five slices with a total thickness of 32 nm. The circular "short filaments..almost parallel" are therefore not single 5 nm diameter FtsZ filaments but must be alignment of filaments axially into sheets (or belts, the axial structure shown in Fig. S8e, discussed next). Importantly, the authors indicate "connections between filaments" by red arrows. This seems wrong for two reasons. (1) The "connections" are very sparse, and therefore not consistent with the near saturation of FtsZ by ZapD. (2) To show up in the 32 nm averaged slice, connections from multiple filaments would have to be aligned. Fig. 3e is a "view of the segmented toroidal structure." I think it shows sheets of filaments as noted above, and the suggested "crosslinks" are again very sparse and no more convincing.

      We thank the reviewer for pointing this out. This was an error on our part, which we have corrected in the figure legend of the revised version of the manuscript. The tomographic slice shown in Fig. 3a is an average of 5 slices, each with a pixel size of 0.86 nm, corresponding to a pixel size of 4.31 nm. It therefore corresponds to the thickness of a single FtsZ filament. The few red arrows indicate lateral connections between filaments, and as discussed earlier, ZapDs also crosslinks FtsZ filaments vertically, giving rise to the elongated structures observed in the Z-direction.

      All 3-D reconstructions and segmented renditions should have a scale bar. The axial cylindrical sheets seem to be confirmed and qualified in Fig. S8e. The cylindrical sheets are not continuous, but seem to consist of belt-like filaments that are ~8-10 nm wide in the axial direction. Adjacent belts are separated axially by ~5 nm gaps, and radially by 4-20 nm. The densest filaments in the projection image Fig. 3b are probably an axial superposition of 2-3 belts, while the lighter filaments may be individual belts.

      Fig. 4 shows a higher number of crosslinks but nowhere near a 1:1 stoichiometry. Most importantly to me, the identification of crosslinks vs filaments seems completely arbitrary. For example, if one colored grey all of the densities I 4a right panel, I would have no way to duplicate the distinctions shown in red and blue. Even if we accept the authors' distinction, it does not provide much structural insight. Continuous bands or sheets are identified as FtsZ, without any resolution of substructure, and any density outside these bands is ZapD. The spots identified as ZapD seem randomly dispersed and much too sparse to include all the ~1:1 ZapD.

      We appreciate the reviewer's comments. Scale bars are present in the tomographic slices but not in the 3D views, as these are perspective views, and it would be inappropriate to include scale bars. To provide context for the images, we added the dimensions of the toroids and toroid sections to the figure legends. 

      As previously mentioned, the resolution of our data limits our ability to accurately segment ZapD densities, especially in the Z direction. In Fig. 4, we have done our best to segment the ZapD densities at the top and sides of the FtsZ filaments, but many densities have been missed. We have clarified this point in the text and in the figure legend. We have clarified this point in both the text and the figure legends. This preliminary annotated view is meant to help illustrate the formation of the toroids. In Fig. 3, we have labeled only a few arrows to highlight the lateral connections between the FtsZ filaments; however, there are many more connections than those indicated.

      Fig. S12 explores the effect of increasing ZapD to 1:6, and the authors conclude "the high concentration of ZapD molecules increased the number of links between filaments and ultimately promoted the formation of straight bundles." However, the binding sites on FtsZ are already nearly saturated at 10:10.

      We cannot assume that all FtsZ binding sites are present at a 1:1 ratio. Our pelleting assay confirms the presence of both proteins in the pellet, but we should be cautious about quantification due to the limitations of this technique. Based on our cryo-EM experiments, the amount of ZapD associated with these structures is much lower. We hypothesize that ZapD proteins sediment with the large FtsZ structures, acting as an external decoration for the toroids. A single ZapD monomer may be bound to multiple outer filaments of the structures, which could effectively increase the total µM concentration observed in the pelleting assay. This situation may explain the enrichment of ZapD in the pellet at high concentrations, when theoretically only a 1:1 ratio should be possible. We have observed external decorations of ZapD at high concentrations (see Supplementary Fig. 6). We believe that the pelleting assay simplifies the system and should be used to complement the cryo-EM images.

      Minor points.

      In the Intro "..to follow a treadmilling behavior, similar to that of actin filaments.9-13." These refs have little to do with treadmilling. I suggest: Wagstaff..Lowe mBio 2017; Du..Lutkenhaus PNAS 2018; Corbin Erickson BJ 2020; Ruis..Fernandez-Tornero Plos Biol 2022.

      Following the reviewer’s suggestions, we have modified the references in the revised version. 

      The authors responded to a query during review stating that the concentration of ZapD always refers to the monomer subunit. That seems certainly the case for Fig. S1, but the caption to Fig. 1a confuses the stoichiometry issue: "expecting (sic) at around 2:1 FtsZ:ZapD." Perhaps it could be clarified by stating that the Fig. shows only half the FtsZ's occupied. But in Fig. 1b the absorbance reaches its maximum at equimolar FtsZ and ZapD. That means that all FtsZ's are bound to a ZapD monomer. Why not draw the model in 1A show that? Fig. S5 is also consistent with this 1:1 stoichiometry. And this might be the place to contrast the planar model with the stacked model suggested by Fig. 5 where the two FtsZ filaments are ~8 nm apart, and the ZapD bridging them is on top.

      We have revised the legend for Fig. 1a to improve its readability. In Fig. 1b, the absorbance data indicate that most FtsZ proteins form macrostructures; however, this does not imply that all FtsZ proteins are bound to ZapDs. Our findings demonstrate that this binding only occurs in the case of straight bundles.

      It may help to note that some previous studies have expressed the concentration of ZapD as the dimer. E.g., Roach..Khursigara 2016 found maximal pelleting at FtsZ:ZapD(dimer) of 2:1 (their Fig. 3), completely consistent with the 1:1 FtsZ:ZapD(monomer) in the present study.

      We recognize this discrepancy in the literature. Therefore, throughout the manuscript, the molar concentrations of both proteins are expressed in terms of the FtsZ and ZapD monomer species.

    1. Author response:

      The following is the authors’ response to the original reviews.

      Reviewer #2 (Public Review):

      The authors make a compelling case for the biological need to exquisitely control RecB levels, which they suggest is achieved by the pathway they have uncovered and described in this work. However, this conclusion is largely inferred as the authors only investigate the effect on cell survival in response to (high levels of) DNA damage and in response to two perturbations - genetic knock-out or over-expression, both of which are likely more dramatic than the range of expression levels observed in unstimulated and DNA damage conditions.

      In the discussion of the updated version of the manuscript, we have clarified the limits of our interpretation of the role of the uncovered regulation.

      Lines 411-417: “It is worth noting that the observed decrease in cell viability upon DNA damage was detected for relatively drastic perturbations such as recB deletion and RecBCD overexpression. Verifying these observations in the context of more subtle changes in RecB levels would be important for further investigation of the biological role of the uncovered regulation mechanism. However, the extremely low numbers of RecB proteins make altering its abundance in a refined, controlled, and homogeneous across cells manner extremely challenging and would require the development of novel synthetic biology tools.”

      Reviewer #3 (Public Review):

      The major weaknesses include a lack of mechanistic depth, and part of the conclusions are not fully supported by the data.

      (1) Mechanistically, it is still unclear why upon DNA damage, translation level of recB mRNA increases, which makes the story less complete. The authors mention in the Discussion that a moderate (30%) decrease in Hfq protein was observed in previous study, which may explain the loss of translation repression on recB. However, given that this mRNA exists in very low copy number (a few per cell) and that Hfq copy number is on the order of a few hundred to a few thousand, it's unclear how 30% decrease in the protein level should resides a significant change in its regulation of recB mRNA.

      We agree that the entire mechanistic pathway controlling recB expression may be not limited to just Hfq involvement. We have performed additional experiments, proposed by the reviewer, suggesting that a small RNA might be involved (see below, response to comments 3&4). However, we consider that the full characterisation of all players is beyond the scope of this manuscript. In addition to describing the new data (see below), we expanded the discussion to explain more precisely why changes in Hfq abundance upon DNA damage may impact RecB translation. 

      Lines 384-391: “A modest decrease (~30%) in Hfq protein abundance has been seen in a proteomic study in E. coli upon DSB induction with ciprofloxacin (DOI: 10.1016/j.jprot.2018.03.002). While Hfq is a highly abundant protein, it has many mRNA and sRNA targets, some of which are also present in large amounts (DOI: 10.1046/j.1365-2958.2003.03734.x). As recently shown, the competition among the targets over Hfq proteins results in unequal (across various targets) outcomes, where the targets with higher Hfq binding affinity have an advantage over the ones with less efficient binding (DOI: 10.1016/j.celrep.2020.02.016). In line with these findings, it is conceivable that even modest changes in Hfq availability could result in significant changes in gene expression, and this could explain the increased translational efficiency of RecB under DNA damage conditions. “

      (2) Based on the experiment and the model, Hfq regulates translation of recB gene through binding to the RBS of the upstream ptrA gene through translation coupling. In this case, one would expect that the behavior of ptrA gene expression and its response to Hfq regulation would be quite similar to recB. Performing the same measurement on ptrA gene expression in the presence and absence of Hfq would strengthen the conclusion and model.

      Indeed, based on our model, we expect PtrA expression to be regulated by Hfq in a similar manner to RecB. However, the product encoded by the ptrA gene, Protease III, (i) has been poorly characterised; (ii) unlike RecB, is located in the periplasm (DOI: 10.1128/jb.149.3.1027-1033.1982); and (iii) is not involved in any DNA repair pathway. Therefore, analysing PtrA expression would take us away from the key questions of our study.

      (3) The authors agree that they cannot exclude the possibility of sRNA being involved in the translation regulation. However, this can be tested by performing the imaging experiments in the presence of Hfq proximal face mutations, which largely disrupt binding of sRNAs.

      (4) The data on construct with a long region of Hfq binding site on recB mRNA deleted is less convincing. There is no control to show that removing this sequence region itself has no effect on translation, and the effect is solely due to the lack of Hfq binding. A better experiment would be using a Hfq distal face mutant that is deficient in binding to the ARN motifs.

      We performed the requested experiments. We included this data in the manuscript in the supplementary figure (Figure S11), and our interpretation in the discussion.

      Lines 354-378: “While a few recent studies have shown evidence for direct gene regulation by Hfq in a sRNA-independent manner (DOI: 10.1101/gad.302547.117; DOI: 10.1111/mmi.14799; DOI: 10.1371/journal.pgen.1004440; DOI: 10.1111/mmi.12961; DOI: 10.1038/emboj.2013.205), we attempted to investigate whether a small RNA could be involved in the Hfq-mediated regulation of RecB expression. We tested Hfq mutants containing point mutations in the proximal and distal sides of the protein, which were shown to disrupt either binding with sRNAs or with ARN motifs of mRNA targets, respectively [DOI: 10.1016/j.jmb.2013.01.006, DOI: 10.3389/fcimb.2023.1282258]. Hfq mutated in either proximal (K56A) or distal (Y25D) faces were expressed from a plasmid in a ∆hfq background. In both cases, Hfq expression was confirmed with qPCR and did not affect recB mRNA levels (Supplementary Figure S11b). When the proximal Hfq binding side (K56A) was disrupted, RecB protein concentration was nearly similar to that obtained in a ∆hfq mutant (Supplementary Figure S11a, top panel). This observation suggests that the repression of RecB translation requires the proximal side of Hfq, and that a small RNA is likely to be involved as small RNAs (Class I and Class II) were shown to predominantly interact with the proximal face of Hfq [DOI: 10.15252/embj.201591569]. When we expressed Hfq mutated in the distal face (Y25D) which is deficient in binding to mRNAs, less efficient repression of RecB translation was detected (Supplementary Figure S11a, bottom panel). This suggests that RecB mRNA interacts with Hfq at this position. We did not observe full de-repression to the ∆hfq level, which might be explained by residual capacity of Hfq to bind its recB mRNA target in the point mutant (Y25D) (either via the distal face with less affinity or via the lateral rim Hfq interface).”

      Taken together, these results suggest that Hfq binds to recB mRNA and that a small RNA might contribute to the regulation although this sRNA has not been identified.

      (5) Ln 249-251: The authors claim that the stability of recB mRNA is not changed in ∆hfq simply based on the steady-state mRNA level. To claim so, the lifetime needs to be measured in the absence of Hfq.

      We measured recB lifetime in the absence of Hfq in a time-course experiment where transcription initiation was inhibited with rifampicin and mRNA abundance was quantified with RT-qPCR. The results confirmed that recB mRNA lifetime in hfq mutants is similar to the one in the wild type (Figure S7d, referred to the line 263 of the manuscript).

      (6) What's the labeling efficiency of Halo-tag? If not 100% labeled, is it considered in the protein number quantification? Is the protein copy number quantification through imaging calibrated by an independent method? Does Halo tag affect the protein translation or degradation?

      Our previous study (DOI: 10.1038/s41598-019-44278-0) described a detailed characterization of the HaloTag labelling technique for quantifying low-copy proteins in single E. coli cells using RecB as a test case. 

      In that study, we showed complete quantitative agreement of RecB quantification between two fully independent methods: HaloTag-based labelling with cell fixation and RecB-sfGFP combined with a microfluidic device that lowers protein diffusion in the bacterial cytoplasm. This second method had previously been validated for protein quantification (DOI: 10.1038/ncomms11641) and provides detection of 80-90% of the labelled protein. Additionally, in our protocol, immediate chemical fixation of cells after the labelling and quick washing steps ensure that new, unlabelled RecB proteins are not produced. We, therefore, conclude that our approach to RecB detection is highly reliable and sufficient for comparing RecB production in different conditions and mutants.

      The RecB-HaloTag construct has been designed for minimal impact on RecB production and function. The HaloTag is translationally fused to RecB in a loop positioned after the serine present at position 47 where it is unlikely to interfere with (i) the formation of RecBCD complex (based on RecBCD structure, DOI: 10.1038/nature02988), (ii) the initiation of translation (as it is far away from the 5’UTR and the beginning of the open reading frame) and (iii) conventional C-terminalassociated mechanisms of protein degradation (DOI: 10.15252/msb.20199208). In our manuscript, we showed that the RecB-HaloTag degradation rate is similar to the dilution rate due to bacterial growth. This is in line with a recent study on unlabelled proteins, which shows that RecB’s lifetime is set by the cellular growth rate (DOI: 10.1101/2022.08.01.502339).

      Furthermore, we have demonstrated (DOI: 10.1038/s41598-019-44278-0) that (i) bacterial growth is not affected by replacing the native RecB with RecB-HaloTag, (ii) RecB-HaloTag is fully functional upon DNA damage, and (iii) no proteolytic processing of the RecB-HaloTag is detected by Western blot. 

      These results suggest that RecB expression and functionality are unlikely to be affected by the translational HaloTag insertion at Ser-47 in RecB.

      In the revised version of the manuscript, we have added information about the construct and discuss the reliability of the quantification.

      Lines 141-152: “To determine whether the mRNA fluctuations we observed are transmitted to the protein level, we quantified RecB protein abundance with singlemolecule accuracy in fixed individual cells using the Halo self-labelling tag (Fig. 2A&B).

      The HaloTag is translationally fused to RecB in a loop after Ser47(DOI: 10.1038/s41598-019-44278-0) where it is unlikely to interfere with the formation of RecBCD complex (DOI: 10.1038/nature02988), the initiation of translation and conventional C-terminal-associated mechanisms of protein degradation (DOI: 10.15252/msb.20199208). Consistent with minimal impact on RecB production and function, bacterial growth was not affected by replacing the native RecB with RecBHaloTag, the fusion was fully functional upon DNA damage and no proteolytic processing of the construct was detected (DOI: 10.1038/s41598-019-44278-0). To ensure reliable quantification in bacteria with HaloTag labelling, the technique was previously verified with an independent imaging method and resulted in > 80% labelling efficiency (DOI: 10.1038/s41598-019-44278-0, DOI: 10.1038/ncomms11641). In order to minimize the number of newly produced unlabelled RecB proteins, labelling and quick washing steps were followed by immediate chemical fixation of cells.”

      Lines 164-168: “Comparison to the population growth rate [in these conditions (0.017 1/min)] suggests that RecB protein is stable and effectively removed only as a result of dilution and molecule partitioning between daughter cells. This result is consistent with a recent high-throughput study on protein turnover rates in E. coli, where the lifetime of RecB proteins was shown to be set by the doubling time (DOI: 10.1038/s41467-024-49920-8).”

      (7) Upper panel of Fig S8a is redundant as in Fig 5B. Seems that Fig S8d is not described in the text.

      We have now stated in the legend of Fig S8a that the data in the upper panel were taken from Fig 5B to visually facilitate the comparison with the results given in the lower panel. We also noticed that we did not specify that in the upper panel in Fig S9a (the data in the upper panel of Fig S9a was taken from Fig 5C for the same reason). We added this clarification to the legend of the Fig S9 as well.

      We referred to the Fig S8d in the main text. 

      Lines 283-284: “We confirmed the functionality of the Hfq protein expressed from the pQE-Hfq plasmid in our experimental conditions (Fig. S8d).”

      Reviewer #1 (Recommendations For The Authors):

      (1) Experimental regime to measure protein and mRNA levels.

      (a) Authors expose cells to ciprofloxacin for 2 hrs. They provide a justification via a mathematical model. However, in the absence of a measurement of protein and mRNA across time, it is unclear whether this single time point is sufficient to make the conclusion on RecB induction under double-strand break.

      In our experiments, we only aimed to compare recB mRNA and RecB protein levels in two steady-state conditions: no DNA damage and DNA damage caused by sublethal levels of ciprofloxacin. We did not aim to look at RecB dynamic regulation from nondamaged to damaged conditions – this would indeed require additional measurements at different time points. We revised this part of the results to ensure that our conclusions are stated as steady-state measurements and not as dynamic changes.

      Line 203-205: “We used mathematical modelling to verify that two hours of antibiotic exposure was sufficient to detect changes in mRNA and protein levels and for RecB mRNA and protein levels to reach a new steady state in the presence of DNA damage.”

      (b) Authors use cell area to account for the elongation under damage conditions. However, it is unclear whether the number of copies of the recB gene are similar across these elongated cells. Hence, authors should report mRNA and protein levels with respect to the number of gene copies of RecB or chromosome number as well.

      Based on the experiments in DNA damaging conditions, our main conclusion is that the average translational efficiency of RecB is increased in perturbed conditions. We believe that this conclusion is well supported by our measurements and that it does not require information about the copy number of the recB gene but only the concentration of mRNA and protein. We did observe lower recB mRNA concentration upon DNA damage in comparison to the untreated conditions, which may be due to a lower concentration of genomic DNA in elongated cells upon DNA damage, as we mention in lines (221-223).

      Our calculation of translation efficiency could be affected by variations of mRNA concentration across cells in the dataset. For example, longer cells that are potentially more affected by DNA damage could have lower concentrations of mRNA. We verified that this is not the case, as recB mRNA concentration is constant across cell size distribution (see the figure below or Figure S5a from Supplementary Information).

      Therefore, we do not think that the measurements of recB gene copy would change our conclusions. We agree that measuring recB gene copies could help to investigate the reason behind the lower recB mRNA concentration under the perturbed conditions as this could be due to lower DNA content or due to shortage of resources (such as RNA polymerases). However, this is a side observation we made rather than a critical result, whose investigation is beyond the scope of this manuscript.

      Author response image 1.

      (2) RecB as a proxy for RecBCD. Authors suggest that RecB levels are regulated by hfq. However, how does this regulatory circuit affect the levels of RecC and RecD? Ratio of the three proteins has been shown to be important for the function of the complex.

      A full discussion of RecBCD complex formation regulation would require a complete quantitative model based on precise information on the dynamic of the complex formation, which is currently lacking. 

      We can however offer the following (speculative) suggestions assuming that all three subunits are present in similar abundance in native conditions (DOI: 10.1038/s41598019-44278-0 for RecB and RecC). As the complex is formed in 1:1:1 ratio (DOI: 10.1038/nature02988), we propose that the regulation mechanism of RecB expression affects complex formation in the following way. If the RecB abundance becomes lower than the level of RecC and RecD subunits, the complex formation would be limited by the number of available RecB subunits and hence the number of functional RecBCDs will be decreased. On the contrary, if the number of RecB is higher than the baseline, then, especially in the context of low numbers, we would expect that the probability of forming a complex RecBC (and then RecBCD) will be increased. Based on this simple explanation, we might speculate that regulation of RecB expression may be sufficient to regulate RecB levels and RecBCD complex formation. However, we feel that this argument is too speculative to be added to the manuscript. 

      (3) Role of Hfq in RecB regulation. While authors show the role of hfq in recB translation regulation in non-damage conditions, it is unclear as to how this regulation occurs under damage conditions.

      (a) Have the author carried out recB mRNA and protein measurement in hfqdeleted cells under ciprofloxacin treatment?

      We attempted to perform experiments in hfq mutants under ciprofloxacin treatment. However, the cells exhibited a very strong and pleiotropic phenotype: they had large size variability and shape changes and were also frequently lysing. Therefore, we did not proceed with mRNA and protein quantification because the data would not have been reliable. 

      (b) How do the authors propose that Hfq regulation is alleviated under conditions of DNA damage, when RecB translation efficiency increases?

      We propose that Hfq could be involved in a more global response to DNA damage as follows. 

      Based on a proteomic study where Hfq protein abundance has been found to decrease (~ 30%) upon DSB induction with ciprofloxacin (DOI: 10.1016/j.jprot.2018.03.002), we suggest that this could explain the increased translational efficiency of RecB. While Hfq is a highly abundant protein, it has many targets (mRNA and sRNA), some of which are also highly abundant. Therefore the competition among the targets over Hfq proteins results in unequal (across various targets) outcomes (DOI: 10.1046/j.13652958.2003.03734.x), where the targets with higher Hfq binding affinity have an advantage over the ones with less efficient binding. We reason that upon DNA damage, a moderate decrease in the Hfq protein abundance (30%) can lead to a similar competition among Hfq targets where high-affinity targets outcompete low-affinity ones as well as low-abundant ones (such as recB mRNAs). Thus, the regulation of lowabundant targets of Hfq by moderate perturbations of Hfq protein level is a potential explanation for the change in RecB translation that we have observed. Potential reasons behind the changes of Hfq levels upon DNA damage would be interesting to explore, however this would require a completely different approach and is beyond the scope of this manuscript.

      We have modified the text of the discussion to explain our reasoning:

      Lines 384-391: “A modest decrease (~30%) in Hfq protein abundance has been seen in a proteomic study in E. coli upon DSB induction with ciprofloxacin (DOI: 10.1016/j.jprot.2018.03.002). While Hfq is a highly abundant protein, it has many mRNA and sRNA targets, some of which are also present in large amounts (DOI: 10.1046/j.1365-2958.2003.03734.x). As recently shown, the competition among the targets over Hfq proteins results in unequal (across various targets) outcomes, where the targets with higher Hfq binding affinity have an advantage over the ones with less efficient binding (DOI: 10.1016/j.celrep.2020.02.016). In line with these findings, it is conceivable that even modest changes in Hfq availability could result in significant changes in gene expression, and this could explain the increased translational efficiency of RecB under DNA damage conditions.”

      (c) Is there any growth phenotype associated with recB mutant where hfq binding is disrupted in damage and non-damage conditions? Does this mutation affect cell viability when over-expressed or under conditions of ciprofloxacin exposure?

      We checked the phenotype and did not detect any difference in growth or cell viability affecting the recB-5 UTR* mutants either in normal conditions or upon exposure to ciprofloxacin. However, this is expected because the repair capacity is associated with RecB protein abundance and in this mutant, while translational efficiency of recB mRNA increases, the level of RecB proteins remains similar to the wild-type (Figure 5E).

      Minor points:

      (1) Introduction - authors should also discuss the role of RecFOR at sites of fork stalling, a likely predominant pathway for break generated at such sites.

      The manuscript focuses on the repair of DNA double-strand breaks (DSBs). RecFOR plays a very important role in the repair of stalled forks because of single-strand gaps but is not involved in the repair of DSBs (DOI: 10.1038/35003501). We have modified the beginning of the introduction to mention the role of RecFOR. 

      Lines 35-39: “For instance, replication forks often encounter obstacles leading to fork reversal, accumulation of gaps that are repaired by the RecFOR pathway (DOI: 10.1038/35003501) or breakage which has been shown to result in spontaneous DSBs in 18% of wild-type Escherichia coli cells in each generation (DOI: 10.1371/journal.pgen.1007256), underscoring the crucial need to repair these breaks to ensure faithful DNA replication.”

      (2) Methods: The authors refer to previous papers for the method used for single RNA molecule detection. More information needs to be provided in the present manuscript to explain how single molecule detection was achieved.

      We added additional information in the method section on the fitting procedure allowing quantifying the number of mRNAs per detected focus.

      Lines 515-530: “Based on the peak height and spot intensity, computed from the fitting output, the specific signal was separated from false positive spots (Fig. S1a). To identify the number of co-localized mRNAs, the integrated spot intensity profile was analyzed as previously described (DOI: 10.1038/nprot.2013.066). Assuming that (i) probe hybridization is a probabilistic process, (ii) binding each RNA FISH probe happens independently, and (iii) in the majority of cases, due to low-abundance, there is one mRNA per spot, it is expected that the integrated intensities of FISH probes bound to one mRNA are Gaussian distributed. In the case of two co-localized mRNAs, there are two independent binding processes and, therefore, a wider Gaussian distribution with twice higher mean and twice larger variance is expected. In fact, the integrated spot intensity profile had a main mode corresponding to a single mRNA per focus, and a second one representing a population of spots with two co-localized mRNAs (Fig. S1b). Based on this model, the integrated spot intensity histograms were fitted to the sum of two Gaussian distributions (see equation below where a, b, c, and d are the fitting parameters), corresponding to one and two mRNA molecules per focus. An intensity equivalent corresponding to the integrated intensity of FISH probes in average bound to one mRNA was computed as a result of multiple-Gaussian fitting procedure (Fig. S1b), and all identified spots were normalized by the one-mRNA equivalent.

      Reviewer #2 (Recommendations For The Authors):

      Overall the work is carefully executed and highly compelling, providing strong support for the conclusions put forth by the authors.

      One point: the potential biological consequences of the post-transcriptional mechanism uncovered in the work would be enhanced if the authors could 1) tune RecB protein levels and 2) directly monitor the role that RecB plays in generating single-standed DNA at DSBs.

      We agree that testing viability of cells in case of tunable changes in RecB levels would be important to further investigate the biological role of the uncovered regulation mechanism. However, this is a very challenging experiment as it is technically difficult to alter the low number of RecB proteins in a controlled and homogeneous across-cell manner, and it would require the development of precisely tunable and very lowabundant synthetic designs. 

      We did monitor real-time RecB dynamics by tracking single molecules in live E. coli cells in a different study (DOI: 10.1101/2023.12.22.573010) that is currently under revision. There, reduced motility of RecB proteins was observed upon DSB induction indicating that RecB is recruited to DNA to start the repair process.

    1. Author response:

      Public Reviews:

      Reviewer #1 (Public review):

      Summary:

      In this detailed study, Cohen and Ben-Shaul characterized the AOB cell responses to various conspecific urine samples in female mice across the estrous cycle. The authors found that AOB cell responses vary with the strains and sexes of the samples. Between estrous and non-estrous females, no clear or consistent difference in responses was found. The cell response patterns, as measured by the distance between pairs of stimuli, are largely stable. When some changes do occur, they are not consistent across strains or male status. The authors concluded that AOB detects the signals without interpreting them. Overall, this study will provide useful information for scientists in the field of olfaction.

      Strengths:

      The study uses electrophysiological recording to characterize the responses of AOB cells to various urines in female mice. AOB recording is not trivial as it requires activation of VNO pump. The team uses a unique preparation to activate the VNO pump with electric stimulation, allowing them to record AOB cell responses to urines in anesthetized animals. The study comprehensively described the AOB cell responses to social stimuli and how the responses vary (or not) with features of the urine source and the reproductive state of the recording females. The dataset could be a valuable resource for scientists in the field of olfaction.

      Weaknesses:

      (1) The figures could be better labeled.

      Figures will be revised to provide more detailed labeling.

      (2) For Figure 2E, please plot the error bar. Are there any statistics performed to compare the mean responses?

      We did not perform statistical comparisons (between the mean rates across the population). We will add this analysis and the corresponding error bars. 

      (3) For Figure 2D, it will be more informative to plot the percentage of responsive units.

      We will do it.

      (4) Could the similarity in response be explained by the similarity in urine composition? The study will be significantly strengthened by understanding the "distance" of chemical composition in different urine.

      We agree. As we wrote in the Discussion: “Ultimately, lacking knowledge of the chemical space associated with each of the stimuli, this and all the other ideas developed here remain speculative.”

      A better understanding of the chemical distance is an important aspect that we aim to include in our future studies. However, this is far from trivial, as it is not chemical distance per se (which in itself is hard to define), but rather the “projection” of chemical space on the vomeronasal receptor neurons array. That is, knowledge of the chemical composition of the stimuli, lacking full knowledge of which molecules are vomeronasal system ligands, will only provide a partial picture. Despite these limitations, this is an important analysis which we would have done had we access to this data.

      (5) If it is not possible for the authors to obtain these data first-hand, published data on MUPs and chemicals found in these urines may provide some clues.

      Measurements about some classes of molecules may be found for some of the stimuli that we used here, but not for all. We are not aware of any single dataset that contains this information for any type of molecules (e.g., MUPs) across the entire stimulus set that we have used. More generally, pooling results from different studies has limited validity because of the biological and technical variability across studies. In order to reliably interpret our current recordings, it would be necessary to measure the urinary content of the very same samples that were used for stimulation. Unfortunately, we are not able to conduct this analysis at this stage.

      (6) It is not very clear to me whether the female overrepresentation is because there are truly more AOB cells that respond to females than males or because there are only two female samples but 9 male samples.

      It is true that the number of neurons fulfilling each of the patterns depends on the number of individual stimuli that define it. However, our measure of “over-representation” aims to overcome this bias, by using bootstrapping to reveal if the observed number of patterns is larger than expected by chance. We also note that more generally, the higher frequency of responses to female, as compared to male stimuli, is obtained in other studies by others and by us, also when the number of male and female stimuli is matched (e.g., Bansal et al BMC Biol 2021, Ben-Shaul et al, PNAS 2010, Hendrickson et al, JNS, 2008).

      (7) If the authors only select two male samples, let's say ICR Naïve and ICR DOM, combine them with responses to two female samples, and do the same analysis as in Figure 3, will the female response still be overrepresented?

      We believe that the answer is positive, but we can, and will perform this analysis to check.

      (8) In Figure 4B and 4C, the pairwise distance during non-estrus is generally higher than that during estrus, although they are highly correlated. Does it mean that the cells respond to different urines more distinctively during diestrus than in estrus?

      This is an important observation. For the Euclidean distance there might be a simple explanation as the distance depends on the number of units (and there are more units recorded in non-estrus females). However, this simple explanation does not hold for the correlation distance. A higher distance implies higher discrimination during the non-estrus stage, but our other analyses of sparseness and the selectivity indices do not support this idea. We note that absolute values of distance measures should generally be interpreted cautiously, as they may depend on multiple factors including sample size. Also, a small number of non-selective units could increase the correlation in responses among stimuli, and thus globally shift the distances. For these reasons, we focus on comparisons, rather than the absolute values of the correlation distances. In the revised manuscript, we will note and discuss this important observation.

      (9) The correlation analysis is not entirely intuitive when just looking at the figures. Some sample heatmaps showing the response differences between estrous states will be helpful.

      If we understand correctly, the idea is to show the correlation matrices from which the values in 4B and 4C are taken. We can and will do this, probably as a supplementary figure.

      Reviewer #2 (Public review):

      Summary:

      Many aspects of the study are carefully done, and in the grand scheme this is a solid contribution. I have no "big-picture" concerns about the approach or methodology. However, in numerous places the manuscript is unnecessarily vague, ambiguous, or confusing. Tightening up the presentation will magnify their impact.

      We will revise the text with the aim of tightening the presentation.

      Strengths:

      (1) The study includes urine donors from males of three strains each with three social states, as well as females in two states. This diversity significantly enhances their ability to interpret their results.

      (2) Several distinct analyses are used to explore the question of whether AOB MCs are biased towards specific states or different between estrus and non-estrus females. The results of these different analyses are self-reinforcing about the main conclusions of the study.

      (3) The presentation maintains a neutral perspective throughout while touching on topics of widespread interest.

      Weaknesses:

      (1) Introduction:

      The discussion of the role of the VNS and preferences for different male stimuli should perhaps include Wysocki and Lepri 1991

      Agreed. we will refer to this work in our discussion.

      (2) Results:

      a) Given the 20s gap between them, the distinction between sample application and sympathetic nerve trunk stimulation needs to be made crystal clear; in many places, "stimulus application" is used in places where this reviewer suspects they actually mean sympathetic nerve trunk stimulation.

      In this study, we have considered both responses that are triggered by sympathetic trunk activation, and those that occur (as happens in some preparations) immediately following stimulus application (and prior to nerve trunk stimulation). An example of the latter Is provided in the second unit shown in Figure 1D (and this is indicated also in the figure legend). In our revision, we will further clarify this confusing point.

      b) There appears to be a mismatch between the discussion of Figure 3 and its contents. Specifically, there is an example of an "adjusted" pattern in 3A, not 3B.

      True. Thanks for catching this error. We will correct this.

      c) The discussion of patterns neglects to mention whether it's possible for a neuron to belong to more than one pattern. For example, it would seem possible for a neuron to simultaneously fit the "ICR pattern" and the "dominant adjusted pattern" if, e.g., all ICR responses are stronger than all others, but if simultaneously within each strain the dominant male causes the largest response.

      This is true. In the legend to Figure 3B, we actually write: “A neuron may fulfill more than one pattern and thus may appear in more than one row.”, but we will discuss this point in the main text as well.

      (3) Discussion:

      a) The discussion of chemical specificity in urine focuses on volatiles and MUPs (citation #47), but many important molecules for the VNS are small, nonvolatile ligands. For such molecules, the corresponding study is Fu et al 2015.

      We fully agree. We will expand our discussion and refer to Fu et al.

      b) "Following our line of reasoning, this scarcity may represent an optimal allocation of resources to separate dominant from naïve males": 1 unit out of 215 is roughly consistent with a single receptor. Surely little would be lost if there could be more computational capacity devoted to this important axis than that? It seems more likely that dominance is computed from multiple neuronal types with mixed encoding.

      We agree, and we are not claiming that dominance, nor any other feature, is derived using dedicated feature selective neurons.  Our discussion of resource allocation is inevitably speculative. Our main point in this context is that a lack of overrepresentation does not imply that a feature is not important. We will revise our discussion to better clarify our view of this issue.

      (4) Methods:

      a) Male status, "were unambiguous in most cases": is it possible to put numerical estimates on this? 55% and 99% are both "most," yet they differ substantially in interpretive uncertainty.

      This sentence is actually misleading and irrelevant. Ambiguous cases were not considered as dominant for urine collection. We only classified mice as dominant if they were “won” in the tube test and exhibited dominant behavior in the subsequent observation period in the cage. We will correct the wording in the revised manuscript.

      b) Surgical procedures and electrode positioning: important details of probes are missing (electrode recording area, spacing, etc).

      True. We will add these details.

      c) Stimulus presentation procedure: Are stimuli manually pipetted or delivered by apparatus with precise timing?

      They are delivered manually. We will clarify this as well.

      d) Data analysis, "we applied more permissive criteria involving response magnitude": it's not clear whether this is what's spelled out in the next paragraph, or whether that's left unspecified. In either case, the next paragraph appears to be about establishing a noise floor on pattern membership, not a "permissive criterion."

      True, the next paragraph is not the explanation for the more permissive criteria. The more permissive criteria involving response magnitude are actually those described in Figure 3A and 3B. The sentence that was quoted above merely states that before applying those criteria, we had also searched for patterns defined by binary designation of neurons as responsive, or not responsive, to each of the stimuli (this is directly related to the next comment below). Using those binary definitions, we obtained a very small number of neurons for each pattern and thus decided to apply the approach actually used and described in the manuscript.

      e) Data analysis, method for assessing significance: there's a lot to like about the use of pooling to estimate the baseline and the use of an ANOVA-like test to assess unit responsiveness.

      But:

      i) for a specific stimulus, at 4 trials (the minimum specified in "Stimulus presentation procedure") kruskalwallis is questionable. They state that most trials use 5, however, and that should be okay.

      The number of cases with 4 trials is truly a minority, and we will provide the exact numbers in our revision.

      ii) the methods statement suggests they are running kruskalwallis individually for each neuron/stimulus, rather than once per neuron across all stimuli. With 11 stimuli, there is a substantial chance of a false-positive if they used p < 0.05 to assess significance. (The actual threshold was unstated.) Were there any multiple comparison corrections performed? Or did they run kruskalwallis on the neuron, and then if significant assess individual stimuli? (Which is a form of multiple-comparisons correction.)

      First, we indeed failed to mention that our criterion was 0.05. We will correct that in our revision. We did not apply any multiple comparison measures. We consider each neuron-stimulus pair as an independent entity, and we are aware that this leads to a higher false positive rate. On the other hand, applying multiple comparisons would be problematic, as we do not always use the same number of stimuli in different studies. Applying multiple comparison corrections would lead to different response criteria across different studies. Notably, most, if not all, of our conclusions involve comparisons across conditions, and for this purpose we think that our procedure is valid. We do not attach any special meaning to the significance threshold, but rather think of it as a basic criterion that allows us to exclude non-responsive neurons, and to compare frequencies of neurons that fulfill this criterion.

    1. Author response:

      Reviewer #1 (Public review):

      Summary:

      The study by Pinho et al. presents a novel behavioral paradigm for investigating higher-order conditioning in mice. The authors developed a task that creates associations between light and tone sensory cues, driving mediated learning. They observed sex differences in task acquisition, with females demonstrating faster-mediated learning compared to males. Using fiber photometry and chemogenetic tools, the study reveals that the dorsal hippocampus (dHPC) plays a central role in encoding mediated learning. These findings are crucial for understanding how environmental cues, which are not directly linked to positive/negative outcomes, contribute to associative learning. Overall, the study is well-designed, with robust results, and the experimental approach aligns with the study's objectives.

      Strengths:

      (1) The authors develop a robust behavioral paradigm to examine higher-order associative learning in mice.

      (2) They discover a sex-specific component influencing mediated learning, with females exhibiting enhanced learning abilities.

      (3) Using fiber photometry and chemogenetic techniques, the authors identify the dorsal hippocampus but not the ventral hippocampus, which plays a crucial for encoding mediated learning.

      Weaknesses:

      (1) The study would be strengthened by further elaboration on the rationale for investigating specific cell types within the hippocampus.

      We will add more information to better explain the rationale of our experiments and/or manipulations.

      (2) The analysis of photometry data could be improved by distinguishing between early and late responses, as well as enhancing the overall presentation of the data.

      We will provide new photometry analysis to differentiate between early and late responses during stimuli presentations.

      (3) The manuscript would benefit from revisions to improve clarity and readability.

      We will improve the clarity and readability of our manuscript.

      Reviewer #2 (Public review):

      Summary:

      Pinho et al. developed a new auditory-visual sensory preconditioning procedure in mice and examined the contribution of the dorsal and ventral hippocampus to learning in this task. Using photometry they observed activation of the dorsal and ventral hippocampus during sensory preconditioning and conditioning. Finally, the authors combined their sensory preconditioning task with DREADDs to examine the effect of inhibiting specific cell populations (CaMKII and PV) in the DH on the formation and retrieval/expression of mediated learning.

      Strengths:

      The authors provide one of the first demonstrations of auditory-visual sensory preconditioning in male mice. Research on the neurobiology of sensory preconditioning has primarily used rats as subjects. The development of a robust protocol in mice will be beneficial to the field, allowing researchers to take advantage of the many transgenic mouse lines. Indeed, in this study, the authors take advantage of a PV-Cre mouse line to examine the role of hippocampal PV cells in sensory preconditioning.

      Weaknesses:

      (1) The authors report that sensory preconditioning was observed in both male and female mice. However, their data only supports sensory preconditioning in male mice. In female mice, both paired and unpaired presentations of the light and tone in stage 1 led to increased freezing to the tone at test. In this case, fear to the tone could be attributed to factors other than sensory preconditioning, for example, generalization of fear between the auditory and visual stimulus.

      To address the pertinent doubt raised by the reviewer, we will perform new experiments to generate a new unpaired group in female mice through the increase of the temporal interval between light and tone exposure during the preconditioning phase. We believe this new results will bring additional information to better understand the performance of female mice in sensory preconditioning.

      (2) In the photometry experiment, the authors report an increase in neural activity in the hippocampus during both phase 1 (sensory preconditioning) and phase 2 (conditioning). In the subsequent experiment, they inhibit neural activity in the DH during phase 1 (sensory preconditioning) and the probe test, but do not include inhibition during phase 2 (conditioning). It was not clear why they didn't carry forward investigating the role of the hippocampus during phase 2 conditioning. Sensory preconditioning could occur due to the integration of the tone and shock during phase two, or retrieval and chaining of the tone-light-shock memories at test. These two possibilities cannot be differentiated based on the data. Given that we do not know at which stage the mediate learning is occurring, it would have been beneficial to additionally include inhibition of the DH during phase 2.

      We will perform new experiments to generate novel data by inhibiting the CamK-positive neurons of the dorsal hippocampus during the conditioning phase.

      (3) In the final experiment, the authors report that inhibition of the dorsal hippocampus during the sensory preconditioning phase blocked mediated learning. While this may be the case, the failure to observe sensory preconditioning at test appears to be due more to an increase in baseline freezing (during the stimulus off period), rather than a decrease in freezing to the conditioned stimulus. Given the small effect, this study would benefit from an experiment validating that administration of J60 inhibited DH cells. Further, given that the authors did not observe any effect of DREADD inhibition in PV cells, it would also be important to validate successful cellular silencing in this protocol.

      By combining chemogenetic and fiber photometry approaches, we will perform a control experiments to demonstrate that our chemogenetic experiments are decreasing CAMK- or PV-dependent activity in dorsal and ventral hippocampus.

      Reviewer #3 (Public review):

      Summary:

      Pinho et al. investigated the role of the dorsal vs ventral hippocampus and the gender differences in mediated learning. While previous studies already established the engagement of the hippocampus in sensory preconditioning, the authors here took advantage of freely-moving fiber photometry recording and chemogenetics to observe and manipulate sub-regions of the hippocampus (dorsal vs. ventral) in a cell-specific manner. The authors first found sex differences in the preconditioning phase of a sensory preconditioning procedure, where males required more preconditioning training than females for mediating learning to manifest, and where females displayed evidence of mediated learning even when neutral stimuli were never presented together within the session.

      After validation of a sensory preconditioning procedure in mice using light and tone neutral stimuli and a mild foot shock as the unconditioned stimulus, the authors used fiber photometry to record from all neurons vs. parvalbumin_positive_only neurons in the dorsal hippocampus or ventral hippocampus of male mice during both preconditioning and conditioning phases. They found increased activity of all neurons, as well as PV+_only neurons in both sub-regions of the hippocampus during both preconditioning and conditioning phases. Finally, the authors found that chemogenetic inhibition of CaMKII+ neurons in the dorsal, but not ventral, hippocampus specifically prevented the formation of an association between the two neutral stimuli (i.e., light and tone cues), but not the direct association between the light cue and the mild foot shock. This set of data: (1) validates the mediated learning in mice using a sensory preconditioning protocol, and stresses the importance of taking sex effect into account; (2) validates the recruitment of dorsal and ventral hippocampi during preconditioning and conditioning phases; and (3) further establishes the specific role of CaMKII+ neurons in the dorsal but not ventral hippocampus in the formation of an association between two neutral stimuli, but not between a neutral-stimulus and a mild foot shock.

      Strengths:

      The authors developed a sensory preconditioning procedure in mice to investigate mediated learning using light and tone cues as neutral stimuli, and a mild foot shock as the unconditioned stimulus. They provide evidence of a sex effect in the formation of light-cue association. The authors took advantage of fiber-photometry and chemogenetics to target sub-regions of the hippocampus, in a cell-specific manner and investigate their role during different phases of a sensory conditioning procedure.

      Weaknesses:

      The authors went further than previous studies by investigating the role of sub-regions of the hippocampus in mediated learning, however, there are several weaknesses that should be noted:

      (1) This work first validates mediated learning in a sensory preconditioning procedure using light and tone cues as neutral stimuli and a mild foot shock as the unconditioned stimulus, in both males and females. They found interesting sex differences at the behavioral level, but then only focused on male mice when recording and manipulating the hippocampus. The authors do not address sex differences at the neural level.

      As discussed above, we will perform additional experiment to evaluate the presence of a reliable sensory preconditioning in female mice. In addition, although observing sex differences at the neural level can be very interesting, we think that it is out of the scope of the present work. However, we will mention this issue/limitation in the Discussion in the new version of the manuscript.

      (2) As expected in fear conditioning, the range of inter-individual differences is quite high. Mice that didn't develop a strong light-->shock association, as evidenced by a lower percentage of freezing during the Probe Test Light phase, should manifest a low percentage of freezing during the Probe Test Tone phase. It would interesting to test for a correlation between the level of freezing during mediated vs test phases.

      We will provide correlations between the behavioral responses in both probe tests.

      (3) The use of a synapsin promoter to transfect neurons in a non-specific manner does not bring much information. The authors applied a more specific approach to target PV+ neurons only, and it would have been more informative to keep with this cell-specific approach, for example by looking also at somatostatin+ inter-neurons.

      We will better justify the use of specific promoters and the targeting of PV-positive neurons. We will also add discussion on potential interesting future experiments such as the targeting of other GABAergic subtypes.

      (4) The authors observed event-related Ca2+ transients on hippocampal pan-neurons and PV+ inter-neurons using fiber photometry. They then used chemogenetics to inhibit CaMKII+ hippocampal neurons, which does not logically follow. It does not undermine the main finding of CaMKII+ neurons of the dorsal, but not ventral, hippocampus being involved in the preconditioning, but not conditioning, phase. However, observing CaMKII+ neurons (using fiber photometry) in mice running the same task would be more informative, as it would indicate when these neurons are recruited during different phases of sensory preconditioning. Applying then optogenetics to cancel the observed event-related transients (e.g., during the presentation of light and tone cues, or during the foot shock presentation) would be more appropriate.

      We will perform new experiments to analyze the activity of CAMK-positive neurons during light-tone associations during the preconditioning phase in male mice.

      (5) Probe tests always start with the "Probe Test Tone", followed by the "Probe Test Light". "Probe Test Tone" consists of an extinction session, which could affect the freezing response during "Probe Test Light" (e.g., Polack et al. (http://dx.doi.org/10.3758/s13420-013-0119-5)). Preferably, adding a group of mice with a Probe Test Light with no Probe Test Tone could help clarify this potential issue. The authors should at least discuss the possibility that the tone extinction session prior to the "Probe Test Light" could have affected the freezing response to the light cue.

      We will add discussion on this issue raised by the reviewer.

      Reviewer #4 (Public review):

      Summary

      Pinho et al use in vivo calcium imaging and chemogenetic approaches to examine the involvement of hippocampal sub-regions across the different stages of a sensory preconditioning task in mice. They find clear evidence for sensory preconditioning in male but not female mice. They also find that, in the male mice, CaMKII-positive neurons in the dorsal hippocampus: (1) encode the audio-visual association that forms in stage 1 of the task, and (2) retrieve/express sensory preconditioned fear to the auditory stimulus at test. These findings are supported by evidence that ranges from incomplete to convincing. They will be valuable to researchers in the field of learning and memory.

      Abstract

      Please note that sensory preconditioning doesn't require the stage 1 stimuli to be presented repeatedly or simultaneously.

      We will correct this wrong sentence in the abstract.

      "Finally, we combined our sensory preconditioning task with chemogenetic approaches to assess the role of these two hippocampal subregions in mediated learning."

      This implies some form of inhibition of hippocampal neurons in stage 2 of the protocol, as this is the only stage of the protocol that permits one to make statements about mediated learning. However, it is clear from what follows that the authors interrogate the involvement of hippocampal sub-regions in stages 1 and 3 of the protocol - not stage 2. As such, most statements about mediated learning throughout the paper are potentially misleading (see below for a further elaboration of this point). If the authors persist in using the term mediated learning to describe the response to a sensory preconditioned stimulus, they should clarify what they mean by mediated learning at some point in the introduction. Alternatively, they might consider using a different phrase such as "sensory preconditioned responding".

      Through the text, we will avoid the term “mediated learning” and we will replace it with more accurate terms. In addition, we will interrogate the role of dHPC in Stage 2 as commented above.

      Introduction

      "Low-salience" is used to describe stimuli such as tone, light, or odour that do not typically elicit responses that are of interest to experimenters. However, a tone, light, or odour can be very salient even though they don't elicit these particular responses. As such, it would be worth redescribing the "low-salience" stimuli in some other terms.

      We will substitute “low-salience” for “innocuous”.

      "These higher-order conditioning processes, also known as mediated learning, can be captured in laboratory settings through sensory preconditioning procedures2,6-11."

      Higher-order conditioning and mediated learning are not interchangeable terms: e.g., some forms of second-order conditioning are not due to mediated learning. More generally, the use of mediated learning is not necessary for the story that the authors develop in the paper and could be replaced for accuracy and clarity. E.g., "These higher-order conditioning processes can be studied in the laboratory using sensory preconditioning procedures2,6-11."

      Through the text, we will avoid the term “mediated learning” and we will replace it with more accurate terms.

      In reference to Experiment 2, it is stated that: "However, when light and tone were separated on time (Unpaired group), male mice were not able to exhibit mediated learning response (Figure 2B) whereas their response to the light (direct learning) was not affected (Figure 2D). On the other hand, female mice still present a lower but significant mediated learning response (Figure 2C) and normal direct learning (Figure 2E). Finally, in the No-Shock group, both male (Figure 2B and 2D) and female mice (Figure 2C and 2E) did not present either mediated or direct learning, which also confirmed that the exposure to the tone or light during Probe Tests do not elicit any behavioral change by themselves as the presence of the electric footshock is required to obtain a reliable mediated and direct learning responses."<br /> The absence of a difference between the paired and unpaired female mice should not be described as "significant mediated learning" in the latter. It should be taken to indicate that performance in the females is due to generalization between the tone and light. That is, there is no sensory preconditioning in the female mice. The description of performance in the No-shock group really shouldn't be in terms of mediated or direct learning: that is, this group is another control for assessing the presence of sensory preconditioning in the group of interest. As a control, there is no potential for them to exhibit sensory preconditioning, so their performance should not be described in a way that suggests this potential.

      We will re-write the text to clarify the right comments raised by the Reviewer.

      Methods - Behavior

      I appreciate the reasons for testing the animals in a new context. This does, however, raise other issues that complicate the interpretation of any hippocampal engagement: e.g., exposure to a novel context may engage the hippocampus for exploration/encoding of its features - hence, it is engaged for retrieving/expressing sensory preconditioned fear to the tone. This should be noted somewhere in the paper given that one of its aims is to shed light on the broader functioning of the hippocampus in associative processes.

      We will further discuss this aspect on the manuscript.

      This general issue - that the conditions of testing were such as to force engagement of the hippocampus - is amplified by two further features of testing with the tone. The first is the presence of background noise in the training context and its absence in the test context. The second is the fact that the tone was presented for 30 s in stage 1 and then continuously for 180s at test. Both changes could have contributed to the engagement of the hippocampus as they introduce the potential for discrimination between the tone that was trained and tested.

      We will consider the aspect raised by the reviewer on the manuscript.

      Results - Behavior

      The suggestion of sex differences based on differences in the parameters needed to generate sensory preconditioning is interesting. Perhaps it could be supported through some set of formal analyses. That is, the data in supplementary materials may well show that the parameters needed to generate sensory preconditioning in males and females are not the same. However, there needs to be some form of statistical comparison to support this point. As part of this comparison, it would be neat if the authors included body weight as a covariate to determine whether any interactions with sex are moderated by body weight.

      We will add statistical comparisons between male and female mice.

      What is the value of the data shown in Figure 1 given that there are no controls for unpaired presentations of the sound and light? In the absence of these controls, the experiment cannot have shown that "Female and male mice show mediated learning using an auditory-visual sensory preconditioning task" as implied by its title. Minimally, this experiment should be relabelled.

      We will relabel Figure 1.

      "Altogether, this data confirmed that we successfully set up an LTSPC protocol in mice and that this behavioral paradigm can be used to further study the brain circuits involved in higher-order conditioning."

      Please insert the qualifier that LTSPC was successfully established in male mice. There is no evidence of LTSPC in female mice.

      We will generate new experiments to try to demonstrate that SPC can be also observed in female mice.

      Results - Brain

      "Notably, the inhibition of CaMKII-positive neurons in the dHPC (i.e. J60 administration in DREADD-Gi mice) during preconditioning (Figure 4B), but not before the Probe Test 1 (Figure 4B), fully blocked mediated, but not direct learning (Figure 4D)."

      The right panel of Figure 4B indicates no difference between the controls and Group DPC in the percent change in freezing from OFF to ON periods of the tone. How does this fit with the claim that CaMKII-positive neurons in the dorsal hippocampus regulate associative formation during the session of tone-light exposures in stage 1 of sensory preconditioning?

      We will rephrase and add more Discussion regarding this section of the results to stick to what the graphs are showing. We will clarify that the group where dHPC activity is inhibited during preconditioning is the only one where the % of change is not significantly different from 0 (compared to the control or the group where the dHPC activity was modulated during the test).

      Discussion

      "When low salience stimuli were presented separated on time or when the electric footshock was absent, mediated and direct learning were abolished in male mice. In female mice, although light and tone were presented separately during the preconditioning phase, mediated learning was reduced but still present, which implies that female mice are still able to associate the two low-salience stimuli."

      This doesn't quite follow from the results. The failure of the female unpaired mice to withhold their freezing to the tone should not be taken to indicate the formation of a light-tone association across the very long interval that was interpolated between these stimulus presentations. It could and should be taken to indicate that, in female mice, freezing conditioned to the light simply generalized to the tone (i.e., these mice could not discriminate well between the tone and light).

      We will rewrite this part depending on the results observed in female mice.

      "Indeed, our data suggests that when hippocampal activity is modulated by the specific manipulation of hippocampal subregions, this brain region is not involved during retrieval."

      Does this relate to the results that are shown in the right panel of Figure 4B, where there is no significant difference between the different groups? If so, how does it fit with the results shown in the left panel of this figure, where differences between the groups are observed?

      We will re-write it to clearly describe our results and we will also revise all the statistical analysis.

      "In line with this, the inhibition of CaMKII-positive neurons from the dorsal hippocampus, which has been shown to project to the restrosplenial cortex56, blocked the formation of mediated learning."

      Is this a reference to the findings shown in Figure 4B and, if so, which of the panels exactly? That is, one panel appears to support the claim made here while the other doesn't. In general, what should the reader make of data showing the percent change in freezing from stimulus OFF to stimulus ON periods?

      We will rewrite the text to clearly describe our results, and we will also revise all the statistical analysis. In addition, we will better explain the data showing the % of change.

    1. Author response:

      Many thanks for assessing our submission. We are grateful for the reviews and recommendations that will inform a revised version of the paper, which will include additional data and modified text to take into account the reviewers’ comments.

      We appreciate Reviewer #1’s suggestion regarding the use of mutational work to demonstrate that collagen binding is indeed dependent on the T-shaped fold. However, we believe that this approach is neither feasible nor necessary for our study. Instead, we propose to measure collagen binding to a monomeric form of M3, which preserves all residues including the ones involved in binding, but cannot form the T-shaped structure. This will achieve the same as unravelling the T fold through mutations, but at the same time removes the risk of directly affecting binding through altering residues that are involved in both binding and definition of the T fold.

      Structural biology is by its nature observational, which is not a limitation but the very purpose of this approach. Our study goes beyond observing structures. We identify a critical residue within a previously mapped binding site, and demonstrate through mutagenesis a causal link between presence of this residue on a tertiary fold and collagen binding activity. We will firm up our mutational experiments with a characterisation of the M3 Tyr96 variants to confirm that these mutations did not affect the overall fold. We further demonstrate that the interaction between M3 and collagen promotes biofilm formation as observed in patient biopsies and a tissue model of infection. We show that other streptococci, that do not possess a surface protein presenting collagen binding sites like M3, do not form collagen-dependent biofilm. We therefore do not think that criticising our study for being almost entirely observational is justified. 

      We thank Reviewer #2 for the thorough analysis of our reported findings. The main criticism here concerns the question if binding of emm3 streptococci would differ for different types of collagen. We will address this point in the revised manuscript. Our collagen peptide binding assays together with the structural data identify the collagen triple helix as the binding site for M3. While collagen types differ in their functions and morphology in various tissues, they all have in common triple-helical tropocollagen regions (with very high sequence similarity) that are non-specifically recognised by M3. Therefore, our data in conjunction with the body of published work showing binding of M3 to collagens I, II, III and IV suggest it is highly likely that emm3 streptococci will indeed bind to many if not all types of collagen in the same manner. Whether this means all collagen types, in the various tissues where they occur, are targeted by emm3 streptococci is a very interesting question, however one that goes beyond the scope of our study.

    1. Author response:

      Reviewer #1 (Public review):

      Summary:

      This work considers the biases introduced into pathogen surveillance due to congregation effects, and also models homophily and variants/clades. The results are primarily quantitative assessments of this bias but some qualitative insights are gained e.g. that initial variant transmission tends to be biased upwards due to this effect, which is closely related to classical founder effects.

      Strengths:

      The model considered involves a simplification of the process of congregation using multinomial sampling that allows for a simpler and more easily interpretable analysis.

      Weaknesses:

      This simplification removes some realism, for example, detailed temporal transmission dynamics of congregations.

      We appreciate Reviewer #1's comments. We hope our framework, like the classic SIR model, can be adapted in the future to build more complex and realistic models.

      Reviewer #2 (Public review):

      Summary:

      In "Founder effects arising from gathering dynamics systematically bias emerging pathogen surveillance" Bradford and Hang present an extension to the SIR model to account for the role of larger than pairwise interactions in infectious disease dynamics. They explore the impact of accounting for group interactions on the progression of infection through the various sub-populations that make up the population as a whole. Further, they explore the extent to which interaction heterogeneity can bias epidemiological inference from surveillance data in the form of IFR and variant growth rate dynamics. This work advances the theoretical formulation of the SIR model and may allow for more realistic modeling of infectious disease outbreaks in the future.

      Strengths:

      (1) This work addresses an important limitation of standard SIR models. While this limitation has been addressed previously in the form of network-based models, those are, as the authors argue, difficult to parameterize to real-world scenarios. Further, this work highlights critical biases that may appear in real-world epidemiological surveillance data. Particularly, over-estimation of variant growth rates shortly after emergence has led to a number of "false alarms" about new variants over the past five years (although also to some true alarms).

      (2) While the results presented here generally confirm my intuitions on this topic, I think it is really useful for the field to have it presented in such a clear manner with a corresponding mathematical framework. This will be a helpful piece of work to point to to temper concerns about rapid increases in the frequency of rare variants.

      (3) The authors provide a succinct derivation of their model that helps the reader understand how they arrived at their formulation starting from the standard SIR model.

      (4) The visualizations throughout are generally easy to interpret and communicate the key points of the authors' work.

      (5) I thank the authors for providing detailed code to reproduce manuscript figures in the associated GitHub repo.

      Weaknesses:

      (1) The authors argue that network-based SIR models are difficult to parameterize (line 66), however, the model presented here also has a key parameter, mainly P_n, or the distribution of risk groups in the population. I think it is important to explore the extent to which this parameter can be inferred from real-world data to assess whether this model is, in practice, any easier to parameterize.

      (2) The authors explore only up to four different risk groups, accounting for only four-wise interactions. But, clearly, in real-world settings, there can be much larger gatherings that promote transmission. What was the justification for setting such a low limit on the maximum group size? I presume it's due to computational efficiency, which is understandable, but it should be discussed as a limitation.

      (3) Another key limitation that isn't addressed by the authors is that there may be population structure beyond just risk heterogeneity. For example, there may be two separate (or, weakly connected) high-risk sub-groups. This will introduce temporal correlation in interactions that are not (and can not easily be) captured in this model. My instinct is that this would dampen the difference between risk groups shown in Figure 2A. While I appreciate the authors's desire to keep their model relatively simple, I think this limitation should be explicitly discussed as it is, in my opinion, relatively significant.

      We appreciate Reviewer 2's thoughtful comments and wish to address some of the weaknesses:

      We agree that inferring P_n from real data will be challenging, but think this is an important direction for future research. Further, we’d like to reframe our claim that our approach is "easier to parameterize" than network models. Rather, P_n has fewer degrees of freedom than analogous network models, just as many different networks can share the same degree distribution. Fewer degrees of freedom mean that we expect our model to suffer from fewer identifiability issues when fitting to data, though non-identifiability is often inescapable in models of this nature (e.g., \beta and \gamma in the SIR model are not uniquely identifiable during exponential growth). Whether this is more or less accurate is another question. Classic bias-variance tradeoffs argue that a model with a moderate complexity trained on one data set can better fit future data than overly simple or overly complex models.

      We chose four risk groups for purposes of illustration, but this can be increased arbitrarily. It should be noted that the simulation bottleneck when increasing the numbers of risk groups is numerical due the stiffness of the ODEs. This arises because the nonlinearity of infection terms scales with the number of risk groups (e.g., ~ \beta * S * I^3 for 4 risk groups). As such, a careful choice of numerical solvers may be required when integrating the ODEs. Meanwhile, this is not an issue for stochastic, individual based implementation (e.g., Gillespie). As for how well this captures super-spreading, we believe choosing smaller risk groups does not hinder modeling disease spread at large gatherings. Consider a statistical interpretation, where individuals at a large gathering engage in a series of smaller interactions over time (e.g., 2/3/4/etc person conversations). The key determinants of the resulting gathering size distribution at any one large gathering are the number of individuals within some shared proximity over time and the infectiousness/dispersal of the pathogen. Of course, whether this interpretation is a sufficient approximation for classic super-spreading events (e.g., funerals during 2014-2015 West Africa Ebola outbreak) is a matter of debate. Our framework is best interpreted at a population level where the effects of any single gathering are washed out by the overall gathering distribution, P_n. As the prior weakness highlighted, establishing P_n is challenging, but we believe empirically measuring proxies of it may provide future insight in how behavior impacts disease spread. For example, prior work has combined contact tracing and co-location data from connection to WiFi networks to estimate the distribution of contacts per individual, and its degree of overdispersion (Petros et al. Med 2022).

      We chose to introduce our framework in a simple SIR context familiar to many readers. This decision does not in any way limit applying it to settings with more population structure. Rather, we believe our framework is easily adaptable and that our presentation (hopefully) makes it clear how to do this. For example, two weakly connected groups could be easily achieved by (for each gathering) first sampling the preferred group and then sampling from the population in a biased manner. The biased sampling could even be a function of gathering sizes, time, etc. The resulting infection terms are still (sums of) multinomials. More generally, the sampling probabilities for an individual of some type need not be its frequency (e.g., S/N, I/N). Indeed, we believe generating models with complex social interactions is both simplified and made more robust by focusing on modeling the generative process of attending gatherings.

    1. Author response:

      Public Reviews:

      Reviewer #1 (Public review):

      This paper describes technically-impressive measurements of calcium signals near synaptic ribbons in goldfish bipolar cells. The data presented provides high spatial and temporal resolution information about calcium concentrations along the ribbon at various distances from the site of entry at the plasma membrane. This is important information. Important gaps in the data presented mean that the evidence for the main conclusions is currently inadequate.

      Strengths

      (1) The technical aspects of the measurements are impressive. The authors use calcium indicators bound to the ribbon and high-speed line scans to resolve changes with a spatial resolution of ~250 nm and a temporal resolution of less than 10 ms. These spatial and temporal scales are much closer to those relevant for vesicle release than previous measurements.

      (2) The use of calcium indicators with very different affinities and different intracellular calcium buffers helps provide confirmation of key results.

      Thank you very much for this positive evaluation of our work.

      Weaknesses

      (1) Multiple key points of the paper lack statistical tests or summary data from populations of cells. For example, the text states that the proximal and distal calcium kinetics in Figure 2A differ. This is not clear from the inset to Figure 2A - where the traces look like scaled versions of each other. Values for time to half-maximal peak fluorescence are given for one example cell but no statistics or summary are provided. Figure 8 shows examples from one cell with no summary data. This issue comes up in other places as well.

      Thank you for this feedback. We will address this in our revised manuscript.

      (2) Figure 5 is confusing. The figure caption describes red, green, and blue traces, but the figure itself has only two traces in each panel and none are red, green, or blue. It's not possible currently to evaluate this figure.

      Thank you for pointing out this oversight. The figure indeed only shows the proximal and distal calcium signals, but not the cytoplasmic ones. The figure will be corrected in our revised manuscript.

      (3) The rise time measurements in Figure 2 are very different for low and high-affinity indicators, but no explanation is given for this difference. Similarly, the measurements of peak calcium concentration in Figure 4 are very different from the two indicators. That might suggest that the high-affinity indicator is strongly saturated, which raises concerns about whether that is impacting the kinetic measurements.

      As we had mentioned in the text, we do believe that the high-affinity version is partially saturated. This will be a problem for strong depolarizations and signals near the membrane. The higher affinity indicators are more useful for reporting calcium levels on the ribbon after the depolarization when the signal from the low affinity indicators is small. We will address this in the discussion of the revision.

      Reviewer #2 (Public review):

      Summary:

      The study introduces new tools for measuring intracellular Ca2+ concentration gradients around retinal rod bipolar cell (rbc) synaptic ribbons. This is done by comparing the Ca2+ profiles measured with mobile Ca2+ indicator dyes versus ribbon-tethered (immobile) Ca2+ indicator dyes. The Ca2+ imaging results provide a straightforward demonstration of Ca2+ gradients around the ribbon and validate their experimental strategy. This experimental work is complemented by a coherent, open-source, computational model that successfully describes changes in Ca2+ domains as a function of Ca2+ buffering. In addition, the authors try to demonstrate that there is heterogeneity among synaptic ribbons within an individual rbc terminal.

      Strengths:

      The study introduces a new set of tools for estimating Ca2+ concentration gradients at ribbon AZs, and the experimental results are accompanied by an open-source, computational model that nicely describes Ca2+ buffering at the rbc synaptic ribbon. In addition, the dissociated retinal preparation remains a valuable approach for studying ribbon synapses. Lastly, excellent EM.

      Thank you very much for this appreciation.

      Weaknesses:

      Heterogeneity in the spatiotemporal dynamics of Ca2+ influx was not convincingly related to ribbon size, nor was the functional relevance of Ca2+ dynamics to rod bipolars demonstrated (e.g., exocytosis to different postsynaptic targets). In addition, the study would benefit from the inclusion of the Ca2+ currents that were recorded in parallel with the Ca2+ imaging.

      Thank you for this critique. We agree that the relationship between size and Ca2+ signal is not established by our recordings. By analogy to the hair cell literature, we believe that it is a reasonable hypothesis, but more studies will be necessary to definitively determine whether the signal relates to the ribbon size or synaptic signaling. This will be addressed in future experiments.

      We will include the Ca<sup>2+</sup> currents in the revision.

      Reviewer #3 (Public review):

      Summary:

      In this study, the authors have developed a new Ca indicator conjugated to the peptide, which likely recognizes synaptic ribbons, and have measured microdomain Ca near synaptic ribbons at retinal bipolar cells. This interesting approach allows one to measure Ca close to transmitter release sites, which may be relevant for synaptic vesicle fusion and replenishment. Though microdomain Ca at the active zone of ribbon synapses has been measured by Hudspeth and Moser, the new study uses the peptide recognizing synaptic ribbons, potentially measuring the Ca concentration relatively proximal to the release sites.

      Strengths:

      The study is in principle technically well done, and the peptide approach is technically interesting, which allows one to image Ca near the particular protein complexes. The approach is potentially applicable to other types of imaging.

      Thank you very much for this appreciation.

      Weaknesses:

      Peptides may not be entirely specific, and the genetic approach tagging particular active zone proteins with fluorescent Ca indicator proteins may well be more specific. I also feel that "Nano-physiology" is overselling, because the measured Ca is most likely the local average surrounding synaptic ribbons. With this approach, nobody knows about the real release site Ca or the Ca relevant for synaptic vesicle replenishment. It is rather "microdomain physiology" which measures the local Ca near synaptic ribbons, relatively large structures responsible for fusion, replenishment, and recycling of synaptic vesicles.

      The peptide approach has been used fairly extensively in the ribbon synapse field and the evidence that it efficiently labels the ribbon is well established, however, we do acknowledge that the peptide is in equilibrium with a cytoplasmic pool. Thus, some of the signal arises from this cytoplasmic pool. The alternative of a genetically encoded Ca-indicator concatenated to a ribbon protein would not have this problem, but would be more limited in flexibility in changing calcium indicators. We believe both approaches have their merits, each with separate advantages and disadvantages.

      As for the nano vs. micro argument, we certainly do not want to suggest that we are measuring the same nano-domains, in the 10s of nanometers, that drive neurotransmitter release, but we do believe we are in the sub-micrometer--100s of nm—range. We chose the term based on the usage by other authors to describe similar measurements (Neef et al., 2018; https://doi.org/10.1038/s41467-017-02612-y), but we see the reviewer’s point. To avoid confusion, we will change the title in the revision.

    1. Author response:

      Public Reviews:

      Reviewer #1 (Public review):

      Summary:

      This retrospective study provides new data regarding the prevalence of pain in women with PCOS and its relationship with health outcomes. Using data from electronic health records (EHR), the authors found a significantly higher prevalence of pain among women with PCOS compared to those without the condition: 19.21% of women with PCOS versus 15.8% in non-PCOS women. The highest prevalence of pain was conducted among Black or African American (32.11%) and White (30.75%) populations. Besides, women with PCOS and pain have at least a 2-fold increased prevalence of obesity (34.68%) at baseline compared to women with PCOS in general (16.11%). Also, women with PCOS had the highest risk for infertility and T2D, but women with PCOS and pain had higher risks for ovarian cysts and liver disease. Regarding these results, the authors suggested the critical need to address pain in the diagnosis and management of PCOS due to its significant impact on patient health outcomes.

      Strengths:

      (1) The problem of pain assessment in PCOS patients is well described and the authors provided a clear rationale selection of the retrospective design to investigate this problem.(2) A large number of analyzed patient records (76,859,666 women) and their uniformity increases the power of the study. Using the Propensity Score Matching makes it possible to reduce the heterogeneity of the compared cohorts and the influence of comorbid conditions.(3) Analysis in different ethnic cohorts provides actual and necessary data regarding the prevalence of pain and its relationship with different health conditions that will be helpful for clinicians to make a diagnosis and manage PCOS in women of different ethnicities. (4) Assessment of the risk of different health conditions including PCOS-associated pathology as other common groups of diseases in PCOS women with or without pain allows to differentiate the risk of comorbid conditions depending on the presence of one symptom (pelvic or abdominal pain, dysmenorrhea).

      We appreciate the positive feedback on this manuscript. Pain assessment in women with PCOS is of paramount interest and because of a gap in this research area, we are trying to address it.

      Weaknesses:

      (1) Although the paper has strengths in methodology and data analysis, it also has some weaknesses.

      The lack of a hypothesis doesn't allow us to evaluate the aim and significance of this study.

      We would like to thank the Reviewer for their valuable feedback regarding the hypothesis of this study. We understand that the hypothesis may not have been written clearly under the objectives and we will correct this in the formal revision.

      The primary hypothesis of this study is that women with PCOS experience a higher prevalence to pain (including dysmenorrhea, abdominal pain and pelvic pain) compared to women without PCOS, and this prevalence varies by racial groups. Our hypothesis aims to explore the relationship between PCOS and pain, the associated health risks, and the potential racial disparities in pain prevalence and long-term health outcomes. Additionally, we seek to assess the effect of treatment on reducing pain symptoms in women with PCOS. This study not only examines the immediate burden of pain but also investigates its long-term consequences, including risks of infertility, obesity, and type 2 diabetes.

      To enhance clarity for readers, we will explicitly state this hypothesis in the revised manuscript and ensure that its connection to the study’s objectives is clearly articulated. We appreciate the Reviewer’s insights and will incorporate these refinements to strengthen the manuscript.

      (2) The exclusion criteria don't include conditions, that can lead to symptoms similar to PCOS: thyroid diseases, hyperprolactinemia, and congenital adrenal hyperplasia. Thyroid status is not being taken into account in the criteria for matching. All these conditions could occur as on prevalence results as on risk assessment.

      We would like to thank the Reviewer for highlighting the need to include these additional conditions that mimic PCOS. After excluding hypothyroidism, hyperprolactinemia, and adrenal hyperplasia from the PCOS and PCOS and pain cohorts, we observed that 7,690 patients (1.65%) with PCOS and 1,854 patients (1.36%) with PCOS were removed. Based on this observation, we plan to add these three conditions to our exclusion criteria and rerun our analysis for disease prevalence and relative risk for our resubmission.

      We will update the manuscript accordingly to reflect these exclusions and ensure clarity in our methodology. Additionally, we will discuss the rationale for excluding these conditions to improve transparency and provide a more precise interpretation of our findings.

      (3) The significant weakness of the study is the absence of a Latin American cohort. Probably the White cohort includes Latin Americans or others, but the results of the study cannot be extrapolated to particular White ethnicities.

      We appreciate the Reviewer’s suggestion to include Latin American cohorts in studies. In this paper we only used race as a variable and did not incorporate ethnicity. However, for our resubmission we plan to include self-reported ethnicity in our analysis which will capture the Latin American cohort stratified by self-reported race groups. This addition will provide a more comprehensive understanding of racial and ethnic differences in our study population, and we will update the manuscript accordingly to reflect this expansion.

      (4) The authors didn't provide sufficient rationale for future health outcomes and this list didn't include diseases of the digestive system or disorders of thyroid glands, which can also cause abdominal pain.

      We appreciate the Reviewer comment and understand their concern. Our current results highlight the prevalence of disorders of the digestive system in Figure 2 and in the results section. To further strengthen our analysis, we plan to include disorders of the digestive system in our relative risk (RR) assessment. However, we will not be able to include the same analysis for thyroid dysfunctions as they will be considered as an exclusion criterion. These updates will be incorporated into the revised manuscript to ensure clarity and completeness.

      Reviewer #2 (Public review):

      Summary:

      The study offers a thorough analysis of the prevalence of pain in women with polycystic ovary syndrome (PCOS) and its associations with health outcomes across various racial groups. Furthermore, the research investigates the prevalence of PCOS and pain among different racial demographics, as well as the increased risk of developing various conditions in comparison to individuals who have PCOS alone.

      Strengths:

      The study emphasizes pain as a significant comorbidity of PCOS, an area that is critically underexplored in existing literature. The findings regarding the increased prevalence of some of the diseases in the PCOS + pain group provide valuable direction for future research and clinical care. I believe physicians should incorporate pain score assessments into their clinical practice to improve patient's quality of life and raise awareness about pain management. If future research focuses on the mechanisms of pain, it would provide a better understanding of pain and allow for a focus on the underlying causes rather than just symptomatic management. The study also highlights the association between PCOS+pain and various comorbidities, such as obesity, hypertension, and type 2 diabetes, as well as conditions like infertility and ovarian cysts, offering a holistic view of the burden of PCOS.

      We sincerely appreciate the Reviewer’s insightful comments. We hope that our findings will encourage further research on the occurrence of pain in women with PCOS and that others will replicate our results to strengthen the evidence in this area. As noted in our introduction, there are currently no standardized abdominal pain score assessments specifically for women with PCOS. We hope that the findings from this study will contribute to efforts toward developing a standardized pain assessment for the PCOS community. In the meantime, further research across more diverse populations will be essential to build a more comprehensive understanding of this issue.

      Weaknesses:

      Due to the nature of the retrospective study, some data may not be readily available in the system. Instead of simply categorizing participants based on whether they experience pain, it would be more useful to employ a pain scale or questionnaire to better understand the severity and type of patients' pain. This approach would allow for a more thorough analysis of pain improvement following treatment with the three widely used medications for PCOS. Additionally, it would be beneficial for the authors to specify subtypes of the disease rather than generalizing conditions, such as mentioning specific digestive system disorders or mental health disorders. The lack of detailed analysis of specific disorders limits the depth of the findings. This may cause authors to make incorrect conclusions.

      We appreciate the Reviewer for highlighting the importance of categorizing pain levels experienced by women with PCOS. However, there is currently no standardized pain assessment for abdominal pain, and therefore more research is required before such a classification can be made. Additionally, the electronic health record data we leveraged via the TriNextX platform does not include any pain scale data from unstructured notes. Despite these limitations, this study is an important step toward recognizing abdominal and pelvic pain in women with PCOS. Our findings indicate that women with PCOS report abdominal pain independent of digestive conditions such as irritable bowel syndrome— a condition often associated with pain in this population.

      We would like to thank the Reviewer for their thoughtful comment with respect to subtyping the future health outcomes. To address this, we plan to include the most common diseases associated with PCOS for each general disease group as a supplemental figure in the revised manuscript.

    1. Author response:

      The following is the authors’ response to the original reviews.

      Reviewer #1(Public review):

      comment 1: Lu et al. use their workflow to visualize RNA expression of five enzymes that are each involved in the biosynthetic pathway of different neurotransmitters/modulators, namely chat (cholinergeric), gad (GABAergic), tbh (octopaminergic), th (dopaminergic), and tph (serotonergic). In this way, they generate an anatomical atlas of neurons that produce these molecules. Collectively these markers are referred to as the "neuronpool." They overstate when they write, "The combination of these five types of neurons constitutes a neuron pool that enables the labeling of all neurons throughout the entire body." This statement does not accurately represent the state of our knowledge about the diversity of neurons in S. mediterranea. There are several lines of evidence that support the presence of glutamatergic and glycinergic neurons, including the following. The glutamate receptor agonists NMDA and AMPA both produce seizure-like behaviors in S. mediterranea that are blocked by the application of glutamate receptor antagonists MK-801 and DNQX (which antagonize NMDA and AMPA glutamate receptors, respectively; Rawls et al., 2009). scRNA-Seq data indicates that neurons in S. mediterranea express a vesicular glutamate transporter, a kainite-type glutamate receptor, a glycine receptor, and a glycine transporter (Brunet Avalos and Sprecher, 2021; Wyss et al., 2022). Two AMPA glutamate receptors, GluR1 and GluR2, are known to be expressed in the CNS of another planarian species, D. japonica (Cebria et al., 2002). Likewise, there is abundant evidence for the presence of peptidergic neurons in S. mediterranea (Collins et al., 2010; Fraguas et al., 2012; Ong et al., 2016; Wyss et al., 2022; among others) and in D. japonica (Shimoyama et al., 2016). For these reasons, the authors should not assume that all neurons can be assayed using the five markers that they selected. The situation is made more complex by the fact that many neurons in S. mediterranea appear to produce more than one neurotransmitter/modulator/peptide (Brunet Avalos and Sprecher, 2021; Wyss et al., 2022), which is common among animals (Vaaga et al., 2014; Brunet Avalos and Sprecher, 2021). However the published literature indicates that there are substantial populations of glutamatergic, glycinergic, and peptidergic neurons in S. mediterranea that do not produce other classes of neurotransmission molecule (Brunet Avalos and Sprecher, 2021; Wyss et al., 2022). Thus it seems likely that the neuronpool will miss many neurons that only produce glutamate, glycine or a neuropeptide.

      In response to your comments, we agree that our initial statement regarding the "neuron pool" overstated the extent of neuronal coverage provided by the five selected markers. We have revised the sentence as “The combination of these five types of neurons constitutes a neuron pool that enables the labeling of most of the neurons throughout the entire body, including the eyes, brain, and pharynx”.

      Furthermore, we chose the five neurotransmitter systems (cholinergic, GABAergic, octopaminergic, dopaminergic, and serotonergic) based on their well-characterized roles in planarian neurobiology and the availability of reliable markers. However, we acknowledge the limitations of this approach and recognize that it does not encompass all neuron types, particularly those involved in glutamatergic, glycinergic, and peptidergic signaling, which have been documented in S. mediterranea. We have also added the content about other neuron types in our revised results section “Additionally, the neuron system of S. mediterranea is complex which characterized by considerable diversity among glutamatergic, glycinergic, and peptidergic neurons in planarians and many neurons in S. mediterranea express more than one neurotransmitter or neuropeptide, which adds further complexity to the system. We used five markers for a proof of concept illustration. By employing Fluorescence in Situ Hybridization (FISH), we successfully visualized a variety of planarian neurons, including cholinergic (chat<sup>+</sup>), serotonergic (tph<sup>+</sup>), octopaminergic (tbh<sup>+</sup>), GABAergic (gad<sup>+</sup>), and dopaminergic (th<sup>+</sup>) neurons based on their well-characterized roles in planarian neurobiology and the availability of reliable markers. (Figure S2A, Supplemental video 2) (Currie et al., 2016). The combination of these five types of neurons constitutes a neuron pool that enables the labeling of most of the neurons throughout the entire body, including the eyes, brain, and pharynx (Figure 1B).”

      comment 2: The authors use their technique to image the neural network of the CNS using antibodies raised vs. Arrestin, Synaptotagmin, and phospho-Ser/Thr. They document examples of both contralateral and ipsilateral projections from the eyes to the brain in the optic chiasma (Figure 1C-F). These data all seem to be drawn from a single animal in which there appears to be a greater than normal number of nerve fiber defasciculatations. It isn't clear how well their technique works for fibers that remain within a nerve tract or the brain. The markers used to image neural networks are broadly expressed, and it's possible that most nerve fibers are too densely packed (even after expansion) to allow for image segmentation. The authors also show a close association between estrella-positive glial cells and nerve fibers in the optic chiasma.

      Thank you for your detailed feedback. While we did not perform segmentation of all neuron fibers, we were able to segment more isolated fibers that were not densely packed within the neural tracts. We use 120 nm resolution to segment neurons along the three axes. Our data show the presence of both contralateral and ipsilateral projections of visual neurons. Although Figure 1C-F shows data from one planarian, we imaged three independent specimens to confirm the consistency of these observations. In the revised manuscript, we have included a discussion on the limitations of TLSM in reconstructing neural networks. In the discussion part, we added “It should be noted that the current resolution for our segmentation may be limited when resolving fibers within densely packed regions of the nerve tracts”.

      comment 3: The authors count all cell types, neuron pool neurons, and neurons of each class assayed. They find that the cell number to body volume ratio remains stable during homeostasis (Figure S3C), and that the brain volume steadily increases with increasing body volume (Figure S3E). They also observe that the proportion of neurons to total body cells is higher in worms 2-6 mm in length than in worms 7-9 mm in length (Figure 2D, S3F). They find that the rate at which four classes of neurons (GABAergic, octopaminergic, dopaminergic, serotonergic) increase relative to the total body cell number is constant (Figure S3G-J). They write: "Since the pattern of cholinergic neurons is the major cell population in the brain, these results suggest that the above observation of the non-linear dynamics between neurons and cell numbers is likely from the cholinergic neurons." This conclusion should not be reached without first directly counting the number of cholinergic neurons and total body cells. Given that glutamatergic, glycinergic, and peptidergic neurons were not counted, it also remains possible that the non-linear dynamics are due (in part or in whole) to one or more of these populations.

      We have revised the statement into “These results suggest that the above observation of the non-linear dynamics between neuron and total cell number is not likely from the octopaminergic, GABAergic, dopaminergic, and serotonergic neurons. Since our neuron pool may not include glutamatergic, glycinergic, and peptidergic neurons, the non-linear dynamics may be from cholinergic neurons or other neurons not included in our staining.”

      Reviewer #2 (Public review):

      Weaknesses:

      (1) The proprietary nature of the microscope, protected by a patent, limits the technical details provided, making the method hard to reproduce in other labs.

      Thank you for your comment. We understand the importance of reproducibility and transparency in scientific research. We would like to point out that the detailed design and technical specifications of the TLSM are publicly available in our published work: Chen et al., Cell Reports, 2020. Additionally, the protocol for C-MAP, including the specific experimental steps, is comprehensively described in the methods section of this paper. We believe that these resources should provide sufficient information for other labs to replicate the method.

      (2) The resolution of the analyses is mostly limited to the cellular level, which does not fully leverage the advantages of expansion microscopy. Previous applications of expansion microscopy have revealed finer nanostructures in the planarian nervous system (see Fan et al. Methods in Cell Biology 2021; Wang et al. eLife 2021). It is unclear whether the current protocol can achieve a comparable resolution.

      Thank you for raising this important point. The strength of our C-MAP protocol lies in its fluorescence-protective nature and user convenience. Notably, the sample can be expanded up to 4.5-fold linearly without the need for heating or proteinase digestion, which helps preserve fluorescence signals. In addition, the entire expansion process can be completed within 48 hours. While our current analysis focused on cellular-level structures, our method can achieve comparable or better resolution and we will add this information in the revised manuscript as “It is important to point out that the strength of our C-MAP protocol lies in its fluorescence-protective nature and user convenience. Notably, the sample can be expanded up to 4.5-fold linearly without the need for heating or proteinase digestion, which helps preserve fluorescence signals. In addition, the entire expansion process can be completed within 48 hours. Based on our research requirement, two spatial resolutions were adopted to image expanded planarians, 2×2×5 μm<sup>3</sup> and 0.5×0.5×1.6 μm<sup>3</sup>. The resolution can be further improved to 500 nm and 120 nm, respectively.”

      (3) The data largely corroborate past observations, while the novel claims are insufficiently substantiated.

      A few major issues with the claims:

      Line 303-304: While 6G10 is a widely used antibody to label muscle fibers in the planarian, it doesn't uniformly mark all muscle types (Scimone at al. Nature 2017). For a more complete view of muscle fibers, it is important to use a combination of antibodies targeting different fiber types or a generic marker such as phalloidin. This raises fundamental concerns about all the conclusions drawn from Figures 4 and 6 about differences between various muscle types. Additionally, the authors should cite the original paper that developed the 6G10 antibody (Ross et al. BMC Developmental Biology 2015).

      We appreciate the reviewer’s insightful comments and acknowledge that 6G10 does not uniformly label all muscle fiber types. We agree that this limitation should be recognized in the interpretation of our results. We have revised the manuscript to explicitly state the limitations of using 6G10 alone for muscle fiber labeling and highlight the need for additional markers. We have included the following statement in the Results section: “It is noted that previous studies reported that 6G10 does not label all body wall muscles equivalently with the limitation of predominantly labeling circular and diagonal fibers (Scimone et al., 2017; Ross et al., 2015). Our observation may be limited by this preference”. We would also clarify that the primary objective of our study was to demonstrate the application of our 3D tissue reconstruction method in addressing traditional research questions. Nonetheless, we agree that expanding the labeling strategy in future studies would allow for a more thorough investigation of muscle fiber diversity. Relevant citations have been properly revised and updated.

      (4) Lines 371-379: The claim that DV muscles regenerate into longitudinal fibers lacks evidence. Furthermore, previous studies have shown that TFs specifying different muscle types (DV, circular, longitudinal, and intestinal) both during regeneration and homeostasis are completely different (Scimone et al., Nature 2017 and Scimone et al., Current Biology 2018). Single-cell RNAseq data further establishes the existence of divergent muscle progenitors giving rise to different muscle fibers. These observations directly contradict the authors' claim, which is only based on images of fixed samples at a coarse time resolution.

      Thank you for your valuable feedback. Our intent was not to suggest that DV muscles regenerate into longitudinal fibers. Our observations focused on the wound site, where DV muscle fibers appear to reconnect, and longitudinal fibers, along with other muscle types, gradually regenerate to restore the structure of the injured area. We have revised the our statement as:“During the regeneration process, DV muscle fibers reconnect at the wound site, with longitudinal fibers and other muscle types gradually restoring the structure at the anterior tip and later integrating with circular and diagonal fibers through small DV fiber branches (Figure S5O1-O3).”

      (5) Line 423: The manuscript lacks evidence to claim glia guide muscle fiber branching.

      We agree with your concerns that our statement may be overestimated. We have removed this statement from the revised version. Instead, we focused on describing our observations of the connections between glial cells and muscle fibers. We have revised the section as follows: “Considering the interaction between glial and muscle cells, the localization of estrella<sup>+</sup> glia and muscle fibers is further investigated. By dual-staining of anti-Phospho (Ser/Thr) and 6G10 in inr-1 RNAi and β-catenin-1 RNAi planarians, we found that the morphologies of neurons are normal, and they have close contact with muscle fibers (Figure 6D, E). However, by dual staining of estrella and 6G10, we found that the structure of glial cells is star-shaped in egfp RNAi planarian, however, glial cells in inr-1 RNAi and β-catenin-1 RNAi planarians have shorter cytoplasmic projections, and their sizes are smaller, lacking the major projection onto the muscles (Figure 6D, E, Figure S6E-K). Especially, in the posterior head of β-catenin-1 RNAi planarians, the glial cell has few axons and can hardly connect with muscle fibers (Figure 6E). These results indicated that proper neuronal guidance and muscle fiber distribution could potentially contribute to facilitating accurate glial-to-muscle projections.

      (6) Lines 432/478: The conclusion about neuronal and muscle guidance on glial projections is similarly speculative, lacking functional evidence. It is possible that the morphological defects of estrella+ cells after bcat1 RNAi are caused by Wnt signaling directly acting on estrella+ cells independent of muscles or neurons.

      We understand that this approach is insufficient and we have revised the this section as follows: “Further investigation is required to distinguish the cell-autonomous and non-autonomous effects of inr-1 RNAi and β-catenin-1 RNAi on muscle and glial cells.”

      (7) Finally, several technical issues make the results difficult to interpret. For example, in line 125, cell boundaries appear to be determined using nucleus images; in line 136, the current resolution seems insufficient to reliably trace neural connections, at least based on the images presented.

      We use two setups for imaging cells and neuron projections. For cellular resolution imaging, we utilized a 1× air objective with a numerical aperture (NA) of 0.25 and a working distance of 60 mm (OLYMPUS MV PLAPO). The voxel size used was 0.8×0.8×2.5 μm<sup>3</sup>. This configuration resulted in a resolution of 2×2×5 μm<sup>3</sup> and a spatial resolution of 0.5×0.5×1.25 μm<sup>3</sup> with 4.5× isotropic expansion. Alternatively, for sub-cellular imaging, we employed a 10×0.6 SV MP water immersion objective with 0.8 NA and a working distance of 8 mm (OLYMPUS). The voxel size used in this configuration was 0.26×0.26×0.8 μm<sup>3</sup>. As a result of this configuration, we achieved a resolution of 0.5×0.5×1.6 μm<sup>3</sup> and a spatial resolution of 0.12×0.12×0.4 μm<sup>3</sup> with a 4.5× isotropic expansion. The higher resolution achieved with sub-cellular imaging allows us to observe finer structures and trace neural connections.

      Regarding your question about cell boundaries, we have revised the manuscript to specify that the boundaries we identified are those of each nucleus.

      Reviewer #3 (Public review):

      Weaknesses:

      (1) The work would have been strengthened by a more careful consideration of previous literature. Many papers directly relevant to this work were not cited. Such omissions do the authors a disservice because in some cases, they fail to consider relevant information that impacts the choice of reagents they have used or the conclusions they are drawing.

      For example, when describing the antibody they use to label muscles (monoclonal 6G10), they do not cite the paper that generated this reagent (Ross et al PMCID: PMC4307677), and instead, one of the papers they do cite (Cebria 2016) that does not mention this antibody. Ross et al reported that 6G10 does not label all body wall muscles equivalently, but rather "predominantly labels circular and diagonal fibers" (which is apparent in Figure S5A-D of the manuscript being reviewed here). For this reason, the authors of the paper showing different body wall muscle populations play different roles in body patterning (Scimone et al 2017, PMCID: PMC6263039, also not cited in this paper) used this monoclonal in combination with a polyclonal antibody to label all body wall muscle types. Because their "pan-muscle" reagent does not label all muscle types equivalently, it calls into question their quantification of the different body wall muscle populations throughout the manuscript. It does not help matters that their initial description of the body wall muscle types fails to mention the layer of thin (inner) longitudinal muscles between the circular and diagonal muscles (Cebria 2016 and citations therein).

      Ipsilateral and contralateral projections of the visual axons were beautifully shown by dye-tracing experiments (Okamoto et al 2005, PMID: 15930826). This paper should be cited when the authors report that they are corroborating the existence of ipsilateral and contralateral projections.

      Thank you for your feedback. We have incorporated these citations and clarifications into the revised manuscript. We acknowledge the limitations of this approach and have added a statement for this limitation in the revised manuscript “It is noted that previous studies reported that 6G10 does not label all body wall muscles equivalently with the limitation of predominantly labeling circular and diagonal fibers (Scimone et al., 2017; Ross et al., 2015). Our observation may be limited by this preference.”

      (2) The proportional decrease of neurons with growth in S. mediterranea was shown by counting different cell types in macerated planarians (Baguna and Romero, 1981; https://link.springer.com/article/10.1007/BF00026179) and earlier histological observations cited there. These results have also been validated by single-cell sequencing (Emili et al, bioRxiv 2023, https://www.biorxiv.org/content/10.1101/2023.11.01.565140v). Allometric growth of the planaria tail (the tail is proportionately longer in large vs small planaria) can explain this decrease in animal size. The authors never really discuss allometric growth in a way that would help readers unfamiliar with the system understand this.

      Thank you for your feedback. We have incorporated these citations and clarifications into the revised manuscript “These findings provide evidence to support the previous prediction and consistency between different planarian species (Baguñà et al., 1981; Emili et al.,2023). Because the tail is proportionately longer in large than in small planarians, the allometric growth of the planarians can be one possibility for this decrease along with the increase in animal size. The phenomenon may also suggest the existence of a threshold in the increase of planarian neuron numbers, which may ultimately contribute to some physiological changes, such as planarian fission.”

      (3) In some cases, the authors draw stronger conclusions than their results warrant. The authors claim that they are showing glial-muscle interactions, however, they do not provide any images of triple-stained samples labeling muscle, neurons, and glia, so it is impossible for the reader to judge whether the glial cells are interacting directly with body wall muscles or instead with the well-described submuscular nerve plexus. Their conclusion that neurons are unaffected by beta-cat or inr-1 RNAi based on anti-phospho-Ser/Thr staining (Fig. 6E) is unconvincing. They claim that during regeneration "DV muscles initially regenerate into longitudinal fibers at the anterior tip" (line 373). They provide no evidence for such switching of muscle cell types, so it is unclear why they say this.

      We acknowledge that some of our conclusions were overclaimed given the current data, and we appreciate the opportunity to clarify and refine these claims in the revised manuscript. Due the technique reason, we have not achieved the triple-staining to address this concern. We hope to make a progress in our future studies. Regarding the statement that "DV muscles initially regenerate into longitudinal fibers at the anterior tip" (line 373), as addressed in our previous response, this statement was unclear. Our intent was not to imply that DV muscles switch into longitudinal fibers. Instead, we observed that muscle fibers reconnect at the wound site, with longitudinal fibers and other muscle types gradually restoring the structure. We have revised this section: “During the regeneration process, DV muscle fibers reconnect at the wound site, with longitudinal fibers and other muscle types gradually restoring the structure at the anterior tip and later integrating with circular and diagonal fibers through small DV fiber branches (Figure S5O1-O3).”

      (4) The authors show how their automated workflow compares to manual counts using PI-stained specimens (Figure S1T). I may have missed it, but I do not recall seeing a similar ground truth comparison for their muscle fiber counting workflow. I mention this because the segmented image of the posterior muscles in Figure 4I seems to be missing the vast majority of circular fibers visible to the naked eye in the original image.

      Thank you for raising this important point. We have included a ground truth comparison of our automated muscle fiber segmentation with the original image in the revised Figure S6. The original Figure S6 has been changed as Figure S7. Regarding the observation of missing circular fibers in Figure 4I, we agree that the segmentation appears to have missed a significant number of circular fibers in this particular image. This may have been due to limitations in the current parameters of the segmentation algorithm, especially in distinguishing fibers in regions of varying intensity or overlap.

      (5) It is unclear why the abstract says, "We found the rate of neuron cell proliferation tends to lag..." (line 25). The authors did not measure proliferation in this work and neurons do not proliferate in planaria.

      Thank you for pointing out this mistake. What we intended to convey was the increase in neuron number during homeostasis. We have revised the abstract “We found that the increase in neuron cell number tends to lag behind the rapid expansion of somatic cells during the later phase of homeostasis.”

      (6) It is unclear what readers are to make of the measurements of brain lobe angles. Why is this a useful measurement and what does it tell us?

      The measurement of brain lobe angles is intended to provide a quantitative assessment of the growth and morphological changes of the planarian brain during regeneration. Additionally, the relevance of brain lobe angles has been explored in previous studies, such as Arnold et al., Nature, 2016, further supporting its use as a meaningful parameter.

      (7) The authors repeatedly say that this work lets them investigate planarians at the single-cell level, but they don't really make the case that they are seeing things that haven't already been described at the single-cell level using standard confocal microscopy.

      Thank you for your comment. We agree that single-cell level imaging has been previously achieved in planarians using conventional confocal microscopy. However, our goal was to extend the application of expansion microscopy by combining C-MAP with tiling light sheet microscopy (TLSM), which allows for faster and high-resolution 3D imaging of whole-mount planarians. We have added in the discussion section: “This combination offers several key advantages over standard techniques. For example, it enables high-throughput imaging across entire organisms with a level of detail and speed that is not easily achieved using confocal methods. This approach allows us to investigate the planarian nervous system at multiple developmental and regenerative stages in a more comprehensive manner, capturing large-scale structures while preserving fine cellular details. The ability to rapidly image whole planarians in 3D with this resolution provides a more efficient workflow for studying complex biological processes.”

    1. Author response:

      In view of the suggestions of the referees, we wish to underline that a user can interact with celldetective at two levels: a non-coder can analyse data and train models without coding, but is necessarily offered pre-determined choices and flexibility. An advanced user however has practically limitless flexibility to extend the fully-open source celldetective, aided by its modularity and detailed manual.

      Public Reviews:

      Reviewer #1 (Public review):

      Summary:

      In this manuscript, Torro et al. presented CellDetective, an open-source software designed for a user-friendly execution of single-cell segmentation, tracking, and analysis of time-lapse microscopy data. The authors demonstrated the applications of the software by measuring NK cell spreading events acquired with reflection interference contrast microscopy (RICM), as well as detecting target cell death events and their interaction with neighboring NK cells in a multichannel widefield microscopy dataset.

      Strengths:

      The segmentation (StarDist, Cellpose) and tracking (bTrack) modules implemented were based on existing and published software packages. The authors added the event detection, classification, and analysis modules to enable an end-to-end time-lapse microscopy data processing and analysis pipeline, complete with a graphical user interface (GUI). This minimizes the coding experience required from the user. The documentation that accompanies CellDetective is also adequate.

      Weaknesses:

      Given that the software was designed to improve user experience, such an approach also limits its scope and functionality and is currently capable of handling very specific types of experiments. Additionally, this reviewer has also encountered many technical difficulties (see documented bugs/crashes below) that have prevented an extensive exploration of all the functionality of CellDetective.

      We apologize for the technical difficulties and bugs; the ones mentioned have been already corrected. New users have also tested the installation and reported it to be bug-free.

      We fully agree on the compromise that has to be found between user experience and versatility. We have already tested celldetective in other biological contexts, such as microbiology, but made a choice to showcase it in the article for immunological applications. We invite the reader to consult the software documentation and online examples to learn about more options.

      Specifics:

      (1) The software can only handle 2D 'widefield' time-lapse imaging datasets. It should be noted that many studies that examine cell-cell interactions in vitro also used confocal microscopy and acquired the time-lapse images in 3D z-stacks to enable the reconstruction of entire cell volumes from multiple optical sections along the z-axis.

      Given that almost all of the implemented segmentation (StarDist, Cellpose) and tracking (bTrack) packages already support the handling of 3D datasets, it is unclear why CellDetective was designed to only work with 2D datasets.

      As noted above, extending the support for 3D images would allow the scope and utility of this software to be further extended for imaging studies acquired in z-stacks. As an example, the dense clustering of effector cells in Figure 4 had prevented accurate segmentation due to the 2D nature of the experimental dataset. More importantly, support for a 3D dataset could also allow for the tracking of fluorescent protein-based sub-cellular as well as membrane protein localization during cell-cell interactions.

      Furthermore, it also widens the potential applicability for analyzing datasets from 3D organoid imaging and perhaps even intravital two-photon microscopy.

      We thank the reviewer for this suggestion. Indeed, extension to 3-dimensions is a natural development, since we have chosen segmentation and tracking methods which are compatible with 3D. However, two important strengths of celldetective are: harnessing statistical power of cell populations together with multiplexing biological conditions, and dynamic analysis of fast events.

      For both, 2D is advantageous. Our own focus is on analyzing cellular events with minute time resolution, relevant in immunology. By our estimate (experience and literature), 3D timelapse acquisition would reduce the time resolution, as well as throughput (in terms of events and conditions) to below acceptable level. While we don’t envisage this upgrade in the immediate future, we encourage advanced users to contribute to further develop the open-source code in this direction. As a mitigation solution, a 2.5D approach on a flat sample by combining two z planes (in order to address issues of cell superposition for example), could be readily implemented with minimal change.

      (2) The software in its current form only allows the broad demarcation of the cells examined into two populations: targets and effectors. This limits the number of cell populations that can be examined for their interactions. It might be more useful to just allow multiple user-defined populations instead of restricting the populations to target and effector cells only.

      We thank the reviewer for this suggestion. There is little architectural limitation to its implementation; this will be proposed in the future version. This updated version will allow more than two user-defined populations, labelled directly by the user, which will also facilitate the natural extension to more varied biological applications. Three-way interactions are much more complex, and, to our knowledge, not currently addressed by biologists. The interactions will for the moment be limited to 2 populations interactions, as multipartite ones involve a higher level of code modifications, not immediately envisaged.

      (3) Similarly, subsetting of each of the populations could be made more intuitive. Although it is possible to define subsets of cells using the "Custom classification" function under the "Measure" module with user-defined parameters, visualization of multiple groups remains unintuitive and it appears that only one custom classified group can be selected and visualized at any given time in the Signal Annotator under Measurement instead of allowing visualization of multiple (custom defined) groups of cells in different colors. It is also unclear how, if possible at all, to visualize a custom group of cells in the Signal Annotator under the Detect Events module.

      The simultaneous visualization of several classes poses problems in the choice of colors and symbols, and may render the tool difficult to use. The time propagation option in the classification tool allows to define event classes as opposed to groups, that are compatible with the Signal Annotator. For more complex classifications, a simple solution is to work with composite classifications, which are already supported by using logical AND/OR operators on the condition defining the class. We believe that this feature is sufficient to address this issue.

      Software issues:

      (4) When initially tested on v1.3.9, the Segment module could not be initiated (with the error message AttributeError: 'WindowsPath' object has no attribute 'endswith' when attempting to run segmentation).

      Update: this has been fixed in v1.3.9.post4 dated February 7th, 2025.

      (5) Further testing was then performed by downgrading the software to v1.3.1. While testing the ADCC demo experiment (https://celldetective.readthedocs.io/en/latest/adcc-example.html), the workflow was stuck at attempts to initiate the Detect Events step:

      AssertionError: No signal matches with the requirements of the model ['dead_nuclei_channel_mean', 'area']. Please pass the signals manually with the argument selected_signals or add measurements. Abort.

      (Update: fixed in the latest v1.3.9.post4 version dated February 7th, 2025)

      (6) Random bugs causing the software to crash. Example: switching characteristic to 'status_color' in the Signal Annotator under Measurement caused the software to crash (v1.3.9.post4):

      TypeError: ufunc 'isnan' is not supported for the input types, and the inputs could not be safely coerced to any supported types according to the casting rule 'safe'

      (7) Overall, when exploring the functionality of the software, there have been multiple instances of software crashes when clicking/switching around to show different parameters, etc.

      This reviewer understands the difficulties and time involved in bug fixing and hopes that the experience could have been much smoother and that the software behaves much more stably in order to maximize its useability.

      We apologize again for the various technical issues encountered during the review process, and thank the reviewer for mentioning that several bugs were already fixed in the last software release. The open source and software maintenance protocol enabled by github should help to resolve any further emerging issue.

      Reviewer #2 (Public review):

      Summary:

      Immune assays enable the analysis of immune responses in vitro. These assays generate time series image data across several experimental conditions. The imaging parameters such as the imaging modality and the number of channels can vary across experiments. A challenge in the field is the lack of (open source) tools to process and analyze these data. R. Torro, et. al. developed an open source end-to-end pipeline for the analysis of image data from these immune assays. The pipeline is designed with a GUI and is suited for experimental biologists with no coding experience. The authors have incorporated several existing methods and tools for individual tasks such as for segmentation and cell tracking, and incorporated them with custom methods where necessary such as for tracking cell state transitions.

      Strengths:

      (1) The tool is extremely well-documented and easy to install.

      (2) Applicable to a wide variety of imaging modalities and analysis.

      (3) There are several different options for each step, such as segmentation using traditional methods or deep learning methods, and all the analysis steps are integrated in one place with a GUI. The no-coding requirement makes this a very powerful tool for biologists and has the potential to enable a wide variety of analyses.

      Weakness:

      (1) It would be good to provide documentation on how to make the tool applicable for applications and analysis other than for immune profiling since most methods integrated here are applicable well beyond immune profiling. For example, a user might want to use the tool just for the segmentation of their IF microscopy-images.

      This is an important suggestion that we will implement as short demonstrations using data from the public domain. These will be proposed as examples in the online documentation.

      (2) They applied Celldetective to two immune assays. The authors present the results from these assays and use the results to validate their assay. However, they have not included data that demonstrates results obtained via this pipeline are comparable to results obtained with other pipelines and/or if these results are consistent with what is expected in the literature.

      In the final version of the article, we shall compare celldetective with existing literature, including our previous work, when possible. However, we emphasize that most of the presented data are original and don’t have any published equivalent in the literature. Concerning the immunotherapy assays, data presented already show expected trends (see for example Fig. 2 and Fig. 5). We reserve for future publications the systematic comparison with traditional (non microscopy-based) methods, as we consider it out-of-scope here. Additionally, there is, to our knowledge no existing open pipeline performing the full end-to-end analysis.

    1. Author response:

      The following is the authors’ response to the original reviews.

      Reviewer #1 (Public Review):

      Summary:

      This paper uses single-molecule FRET to investigate the molecular basis for the distinct activation mechanisms between 2 GPCR responding to the chemokine CXCL12 : CXCR4, that couples to G-proteins, and ACKR3, which is G-protein independent and displays a higher basal activity.

      Strengths:

      It nicely combines the state-of-the-art techniques used in the studies of the structural dynamics of GPCR. The receptors are produced from eukaryotic cells, mutated, and labeled with single molecule compatible fluorescent dyes. They are reconstituted in nanodiscs, which maintain an environment as close as possible to the cell membrane, and immobilized through the nanodisc MSP protein, to avoid perturbing the receptor's structural dynamics by the use of an antibody for example.

      The smFRET data are analysed using the HHMI technique, and the number of states to be taken into account is evaluated using a Bayesian Information Criterion, which constitutes the state-of-the-art for this task.

      The data show convincingly that the activation of the CXCR4 and ACKR3 by an agonist leads to a shift from an ensemble of high FRET states to an ensemble of lower FRET states, consistent with an increase in distance between the TM4 and TM6. The two receptors also appear to explore a different conformational space. A wider distribution of states is observed for ACKR3 as compared to CXCR4, and it shifts in the presence of agonists toward the active states, which correlates well with ACKR3's tendency to be constitutively active. This interpretation is confirmed by the use of the mutation of Y254 to leucine (the corresponding residue in CXCR4), which leads to a conformational distribution that resembles the one observed with CXCR4. It is correlated with a decrease in constitutive activity of ACKR3.

      Weaknesses:

      Although the data overall support the claims of the authors, there are however some details in the data analysis and interpretation that should be modified, clarified, or discussed in my opinion

      Concerning the amplitude of the changes in FRET efficiency: the authors do not provide any structural information on the amplitude of the FRET changes that are expected. To me, it looks like a FRET change from ~0.9 to ~0.1 is very important, for a distance change that is expected to be only a few angstroms concerning the movement of the TM6. Can the authors give an explanation for that? How does this FRET change relate to those observed with other GPCRs modified at the same or equivalent positions on TM4 and TM6?

      The large FRET change in our system was initially unexpected. However, the reviewer is mistaken that the expected distance change is only a few angstroms. Crystal structures of the homologous beta2 adrenergic receptor (β<sub>2</sub>AR) in inactive and active conformations reveal that the cytoplasmic end of TM6 moves outwards by 16 angstroms during activation (Rasmussen et al., 2011, ref 47).  Consistent with this, smFRET studies of β<sub>2</sub>AR labeled in TM4 and TM6 (as here) showed that the donor-acceptor (D-A) distance was 14 angstroms longer in the active conformation (Gregorio et al., ref 38).  Surprisingly, the apparent distance change in our system (calculated for our FRET probes, A555/Cy5, using FPbase.com) is almost 30 angstroms. A possible explanation is that the fluorophore attached to TM6 interacts with lipids within the nanodisc when TM6 moves outwards, which could stretch the fluorophore linker and thereby increase the D-A distance (lipids were absent in the β<sub>2</sub>AR study). Such an interaction could also constrain the fluorophore in an unfavorable orientation for energy transfer, also leading to lower than expected FRET efficiencies and inflated distance calculations. Regardless, it is important to emphasize that none of the interpretations or conclusions of our study are based on computed D-A distances. Rather, we resolved different receptor conformations and quantified their relative populations based on the measured FRET efficiency distributions.

      Finally, we note that a recent smFRET study of the glucagon receptor (labeled in TM4 and TM6, as here) also revealed a large difference in apparent FRET efficiencies between inactive (E<sub>app</sub> = 0.83) and active (E<sub>app</sub> = 0.32) conformations (Kumar et al., ref. 39). Thus, the large change in FRET efficiency observed in our study is not unprecedented.

      Concerning the intermediate states: the authors observe several intermediate states.

      (1) First I am surprised, looking at the time traces, by the dwell times of the transitions between the states, which often last several seconds. Is such a long transition time compatible with what is known about the kinetic activation of these receptors?

      We too were surprised by the apparent kinetics of the receptors in our system. However, it was previously noted that purified systems, including nanodiscs, lead to slower activation times for GPCRs compared to cellular membrane systems (Lohse et al, Curr. Opin. Cell Biology, 27, 8792, 2014). Indeed, slow transitions among different FRET states (dwell times in the seconds range) were also observed in recent smFRET studies of the mu opioid receptor (Zhao et al., 2024, ref. 41) and the glucagon receptor (Kumar et al., 2023, ref. 39). These studies are consistent with the observed time scale of the FRET transitions reported here.

      (2) Second is it possible that these “intermediate” states correspond to differences in FRET efficiencies, that arise from different photophysical states of the dyes? Alexa555 and Cy5 are Cyanines, that are known to be very sensitive to their local environment. This could lead to different quantum yields and therefore different FRET efficiencies for a similar distance. In addition, the authors use statistical labeling of two cysteines, and have therefore in their experiment a mixture of receptors where the donor and acceptor are switched, and can therefore experience different environments. The authors do not speculate structurally on what these intermediate states could be, which is appreciated, but I think they should nevertheless discuss the potential issue of fluorophore photophysics effects.

      The reviewer is correct that the intermediate FRET states could, in principle, arise from a conformational change of the receptor that alters the local environment of the donor and/or acceptor fluorophores, rather than a change in donor-acceptor distance. This caveat is now included in the discussion on Pg. 10:

      “In principle, the intermediates in CXCR4 and ACKR3 could represent partial movements of TM6 from the inactive to active conformation or more subtle conformational changes altering the photophysical characteristics of the probes without drastically altering the donor-acceptor distance. Either possibility leads to detectable changes in apparent FRET efficiency and reflect discrete conformational steps on the activation pathway; however, it is not possible to resolve specific structural changes from the data.”

      Regarding the second possibility, it is true that our labeling methodology leads to a statistical mixture of labeled species (D on TM6 and A on TM4, D on TM4 and A on TM6). If the photophysical properties of the fluorophores were markedly different for the two labeling orientations, this would produce two different FRET efficiencies for a given receptor conformation. Assuming two receptor conformations, this scenario would produce four distinct FRET states: E<sub>1</sub> (inactive receptor, labeling configuration 1), E<sub>2</sub> (active receptor, labeling configuration 1), E<sub>3</sub> (inactive receptor, labeling configuration 2) and E<sub>4</sub> (active receptor, labeling configuration 2), with two cross peaks in the TDP plots, corresponding to E<sub>1</sub> ↔ E<sub>2</sub> and E<sub>3</sub> ↔ E<sub>4</sub> transitions. Notably, E<sub>2</sub> ↔ E<sub>3</sub> cross peaks would not be present, since states E<sub>2</sub> and E<sub>3</sub> exist on separate molecules. Instead, we see all states inter-connected sequentially, R ↔ R’ ↔ R* in CXCR4 and R ↔ R’ ↔ R*’ ↔ R* in ACKR3 (Fig. 2), suggesting that the resolved FRET states represent interconnected conformational states.

      We added the following text to the Results section on Pg. 6:

      “Two-dimensional transition density probability (TDP) plots revealed that the three FRET states were connected in a sequential fashion (Figs. 2A & B), indicating that the transitions occurred within the same molecules. Notably, these observations exclude the possibility that the midFRET state arises from different local fluorophore environments (hence FRET efficiencies) for the two possible labeling orientations of the introduced cysteines: assuming two receptor conformations, this model would produce four distinct FRET states, but only two cross peaks in the TDP plot.”

      (3) It would also have been nice to discuss whether these types of intermediate states have been observed in other studies by smFRET on GPCR labeled at similar positions.

      Intermediate states have also been reported in previous smFRET studies of other GPCRs. For example, in the glucagon receptor (also labeled in TM4 and TM6), a third FRET state (E<sub>app</sub> =  0.63) was resolved between the inactive (E<sub>app</sub>  = 0.85) and active (E<sub>app</sub>  = 0.32) states (Kumar et al., Ref. 39).  Discrete intermediate receptor conformations were also observed in the A<sub>2A</sub>R labeled in TM4 and TM6 (Fernandes et al., Ref 40). These examples are now cited in the Discussion.

      On line 239: the authors talk about the R↔R' transitions that are more probable. In fact it is more striking that the R'↔R* transition appears in the plot. This transition is a signature of the behavior observed in the presence of an agonist, although IT1t is supposed to be an inverse agonist. This observation is consistent with the unexpected (for an inverse agonist) shift in the FRET histogram distribution. In fact, it appears that all CXCR4 antagonists or inverse agonists have a similar (although smaller) effect than the agonist. Is this related to the fact that these (antagonist or inverse agonist) ligands lead to a conformation that is similar to the agonists, but cannot interact with the G-protein ?? Maybe a very interesting experiment would be here to repeat these measurements in the presence of purified G-protein. G-protein has been shown to lead to a shift of the conformational space explored by GPCR toward the active state (using smFRET on class A and class C GPCR). It would be interesting to explore its role on CXCR4 in the presence of these various ligands. Although I am aware that this experiment might go beyond the scope of this study, I think this point should be discussed nevertheless.

      We thank the reviewer for this observation and the possible explanation offered.  In response, we have added the following text to the Results section on Pg. 7:

      “The small-molecule ligand IT1t is reported to act as an inverse agonist of CXCR4 (54-56). However, the conformational distribution of CXCR4 showed little change to the overall apparent

      FRET profile, although R’ ↔ R* transitions appeared in the TDP plot (Figs. 3A & B, Fig. S8). This suggests that the small molecule does not suppress CXCR4 basal signaling by changing the conformational equilibrium. Instead IT1t appears to increase transition probabilities which may impair G protein coupling by CXCR4.”

      We have also added the following text to the Results on Pg. 8:

      “Despite the ability of CXCL12<sub>P2G</sub> and CXCL12<sub>LRHQ</sub> to stabilize the active R* conformation of CXCR4, both variants are known to act as antagonists (20). This suggests that the CXCL12 mutants inhibit CXCR4 coupling to G proteins not by suppressing the active receptor population but rather by increasing the dynamics of the receptor state transitions. Our results suggest that the helical movements considered classic signatures of the active state may not be sufficient for CXCR4 to engage productively with G proteins.”

      In addition, we have added the following text to the Discussion on Pg. 11:

      “The chemokine variants CXCL12<sub>P2G</sub> and CXCL12<sub>LRHQ</sub> are reported to act as antagonists of CXCR4 (19, 20), and the small molecule IT1t acts as an inverse agonist (54-56). Surprisingly, none of these ligands inhibit formation of the active R* conformation of CXCR4. In fact, the chemokine variants both stabilize and increase this state to some degree, although less effectively than CXCL12<sub>WT</sub>. Thus, the antagonism and inverse agonism of these ligands does not appear to be linked exclusively to receptor conformation, suggesting that the ligands inhibit coupling of G proteins to CXCR4 or disrupt the ligand-receptor-G protein interaction network required for signaling (Fig. S10) (21, 23).  Interestingly, these ligands also increase the probabilities of state-to-state transitions (Figs. 3B & 4B), suggesting that enhanced conformational exchange prevents the receptor from productively engaging G proteins. Similarly, ACKR3 is naturally dynamic and lacks G protein coupling, suggesting a common mechanism of G protein antagonism.”

      Finally, we also agree that experiments with G proteins could be informative. In fact, we initiated such experiments during the course of this study.  However, it soon became apparent that significant optimization would be required to identify fluorophore labeling positions that report receptor conformation without inhibiting G protein coupling. Accordingly, we decided that G protein experiments would be the subject of future studies.

      However, we added the following text to the Discussion on Pg. 12:

      “Future smFRET studies performed in the presence of G proteins should be informative in this regard”.

      The authors also mentioned in Figure 6 that the energetic landscape of the receptors is relatively flat ... I do not really agree with this statement. For me, a flat conformational landscape would be one where the receptors are able to switch very rapidly between the states (typically in the submillisecond timescale, which is the timescale of protein domain dynamics). Here, the authors observed that the transition between states is in the second timescale, which for me implies that the transition barrier between the states is relatively high to preclude the fast transitions.

      We thank the reviewer for the comment. We have modified the description of the energy landscapes of ACKR3 and CXCR4 in the discussion on Pg. 10 as follows:

      “These observations imply that ACKR3 has a relatively flat energy landscape, with similar energy minima for the different conformations, whereas the energy landscape of CXCR4 is more rugged (Fig. 6). For both receptors, the energy barriers between states are sufficiently high that transitions occur relatively slowly with seconds long dwell times (Figs. 1C and S2).”

      Reviewer #2 (Public Review):

      Summary:

      his manuscript uses single-molecule fluorescence resonance energy transfer (smFRET) to identify differences in the molecular mechanisms of CXCR4 and ACKR3, two 7transmembrane receptors that both respond to the chemokine CXCL12 but otherwise have very different signaling profiles. CXCR4 is highly selective for CXCL12 and activates heterotrimeric G proteins. In contrast, ACKR3 is quite promiscuous and does not couple to G proteins, but like most G protein-coupled receptors (GPCRs), it is phosphorylated by GPCR kinases and recruits arrestins. By monitoring FRET between two positions on the intracellular face of the receptor (which highlights the movement of transmembrane helix 6 [TM6], a key hallmark of GPCR activation), the authors show that CXCR4 remains mostly in an inactive-like state until CXCL12 binds and stabilizes a single active-like state. ACKR3 rapidly exchanges among four different conformations even in the absence of ligands, and agonists stabilize multiple activated states.

      Strengths:

      The core method employed in this paper, smFRET, can reveal dynamic aspects of these receptors (the breadth of conformations explored and the rate of exchange among them) that are not evident from static structures or many other biophysical methods. smFRET has not been broadly employed in studies of GPCRs. Therefore, this manuscript makes important conceptual advances in our understanding of how related GPCRs can vary in their conformational dynamics.

      Weaknesses:

      (1) The cysteine mutations in ACKR3 required to site-specifically install fluorophores substantially increase its basal and ligand-induced activity. If, as the authors posit, basal activity correlates with conformational heterogeneity, the smFRET data could greatly overestimate the conformational heterogeneity of ACKR3.

      The change in basal ACKR3 activity with the Cys introductions are modest in comparison and insignificantly different as determined by extra-sum-of-squares F test (P=0.14).

      (2) The probes used cannot reveal conformational changes in other positions besides TM6. GPCRs are known to exhibit loose allosteric coupling, so the conformational distribution observed at TM6 may not fully reflect the global conformational distribution of receptors. This could mask important differences that determine the ability of intracellular transducers to couple to specific receptor conformations.

      We agree that the overall conformational landscape of the receptors has not been investigated and we have added this caveat to the discussion on Pg. 12.

      “An important caveat is that our study does not report on the dynamics of the other TM helices and H8, some of which are known to participate in arrestin interactions.”

      (3) While it is clear that CXCR4 and ACKR3 have very different conformational dynamics, the data do not definitively show that this is the main or only mechanism that contributes to their functional differences. There is little discussion of alternative potential mechanisms.

      The main functional difference between CXCR4 and ACRK3 is their effector coupling: CXCR4 couples to G proteins, whereas ACKR3 only couples to arrestins (following phosphorylation of the C-terminal tail by GRKs). As currently noted in the discussion, ACKR3 has many features that may contribute to its lack of G protein coupling, including lack of a well-ordered intracellular pocket due to conformational dynamics, lack of an N-term-ECL3 disulfide, different chemokine binding mode, and the presence of Y257. Steric interference due to different ICL loop structures may also interfere with G protein activation. No one thing has proven to confer ACKR3 with G protein activity including swapping all of the ICLs to those of canonical chemokine receptor, suggesting it is a combination of these different factors. The following has been added to the discussion on Pg. 13 to clearly note that any one feature is unlikely to drive the atypical behavior of ACKR3:

      “The atypical activation of ACKR3 does not appear to be dependent on any singular receptor feature and is likely a combination of several factors.”

      (4) The extent to which conformational heterogeneity is a characteristic feature of ACKRs that contributes to their promiscuity and arrestin bias is unclear. The key residue the authors find promotes ACKR3 conformational heterogeneity is not conserved in most other ACKRs, but alternative mechanisms could generate similar heterogeneity.

      Despite the commonalities in the roles of the ACKRs, they all appear to have evolved independently. Thus, we do not believe that all features observed and described for one ACKR will explain the behavior of another. We have carefully avoided expanding our observations to other ACKRs to avoid suggesting common mechanisms.

      (5) There are no data to confirm that the two receptors retain the same functional profiles observed in cell-based systems following in vitro manipulations (purification, labeling, nanodisc reconstitution).

      We agree this is an important point. All labeled receptors responded to agonist stimulation as expected. As only properly folded receptors are able to make the extensive interactions with ligands necessary for conformational changes (for instance, CXCL12 interacts with all TMs and ECLs), this suggests that the proteins are folded correctly and functional following all manipulations.

      Reviewer #3 (Public Review):

      Summary:

      This is a well-designed and rigorous comparative study of the conformational dynamics of two chemokine receptors, the canonical CXCR4 and the atypical ACKR3, using single-molecule fluorescence spectroscopy. These receptors play a role in cell migration and may be relevant for developing drugs targeting tumor growth in cancers. The authors use single-molecule FRET to obtain distributions of a specific intermolecular distance that changes upon activation of the receptor and track differences between the two receptors in the apo state, and in response to ligands and mutations. The picture emerging is that more dynamic conformations promote more basal activity and more promiscuous coupling of the receptor to effectors.

      Strengths:

      The study is well designed to test the main hypothesis, the sample preparation and the experiments conducted are sound and the data analysis is rigorous. The technique, smFRET, allows for the detection of several substates, even those that are rarely sampled, and it can provide a "connectivity map" by looking at the transition probabilities between states. The receptors are reconstituted in nanodiscs to create a native-like environment. The examples of raw donor/acceptor intensity traces and FRET traces look convincing and the data analysis is reliable to extract the sub-states of the ensemble. The role of specific residues in creating a more flat conformational landscape in ACKR3 (e.g., Y257 and the C34-C287 bridge) is well documented in the paper.

      Weaknesses:

      The kinetics side of the analysis is mentioned, but not described and discussed. I am not sure why since the data contains that information. For instance, it is not clear if greater conformational flexibility is accompanied by faster transitions between states or not.

      The reviewer is correct that kinetic information is available, in principle, from smFRET experiments. However, a detailed kinetic analysis will require a much larger data set than we currently possess, to adequately sample all possible transitions and the dwell times of each FRET state. We intend to perform such an analysis in the future as more data becomes available. The purpose of this initial study was to explore the conformational landscapes of CXCR4 and ACKR3 and to reveal differences between them. To this end, we have documented major differences in conformational preferences and response to ligands of the two receptors that are likely relevant to their different biological behavior. Future kinetic information will add further detail, but is not expected to alter the conclusions drawn here.

      The method to choose the number of states seems reasonable, but the "similarity" of states argument (Figures S4 and S6) is not that clear.

      We thank the reviewer for noting a need for further clarification. We qualitatively compared the positions of the various FRET peaks across treatments to gain insight into the consistency of the conformations and avoid splitting real states by overfitting the data. For instance, fitting the ACKR3 treatments with three states leads to three distinct FRET populations for the R’ intermediate. Adding a fourth state results in two intermediates that are fairly well overlapping. In contrast, the two-intermediate model for CXCR4 appears to split the R* state of the CXCL12 treated sample and causes a general shift in both intermediate states to lower FRET values when CXCL12 is present. As we assume that the conformations are consistent throughout the treatments, we conclude that this represents an overfitting artifact and not a novel CXCL12CXCR4 R*’ state. Additional sentences have been added to the supplemental figure legend to better describe the comparative analysis.

      “(Top) With the 3-state model, the R’ states for apo-CXCR4 and for CXCL12- and IT1t-bound receptor overlapped well with similar apparent FRET values across all of the tested conditions. In the case of the four-state model, the R*’ (Middle) and R’ (Bottom) states were substantially different across the ligand treatments. In particular, the R*’ state with CXCL12 treatment appears to arise from a splitting of the R* conformation, indicating that the model was overfitting the data.”

      Also, the "dynamics" explanation offered for ACKR3's failure to couple and activate G proteins is not very convincing. In other studies, it was shown that activation of GPCRs by agonists leads to an increase in local dynamics around the TM6 labelling site, but that did not prevent G protein coupling and activation.

      We agree with the reviewer that any single explanation for ACKR3 bias, including the dynamics argument presented here, is insufficient to fully characterize the ACKR3 responses. As noted by the reviewer, the TM6 movement and dynamics is generally correlated with G protein coupling, whereas other dynamics studies (Wingler et al. Cell 2019) have noted that arrestinbiased ligands do not lead to the same degree of TM6 movement. We have added the following statement to the discussion on Pg. 13:

      “The atypical activation of ACKR3 does not appear to be dependent on any singular receptor feature and is likely a combination of several factors.” 

      Recommendations for the authors:  

      Reviewer #1 (Recommendations For The Authors):

      I would like to raise a technical point about the calculation and reporting of the FRET efficiency. The authors report the FRET efficiency as E=IA/(IA+ID). There is now a strong recommendation from the FRET community (https://doi.org/10.1038/s41592-018-0085-0) to use the term “FRET efficiency” only when a proper correction procedure of all correction factors has been applied, which is not the case here (gamma factor has not been calculated). The authors should therefore use the term “Apparent FRET Efficiency” and  E<sub>app</sub> in all the manuscripts.

      Also, it would be nice to indicate directly on the figures whether a ligand that is used is an agonist, antagonist, inverse agonist, etc...

      We thank the reviewer for suggesting this clarification in terminology. We now refer to apparent FRET efficiency (or E<sub>app</sub>) throughout the manuscript and in the figures. In addition, we have added ligand descriptions to the relevant figures.

      Reviewer #2 (Recommendations For The Authors):

      (1) M159(4.40)C/Q245(6.28)C ACKR3 appears to have higher constitutive activity than ACKR3 Wt (Fig. S1). While the vehicle point itself is likely not significant due to the error in the Wt, the overall trend is clear and arguably even stronger than the effect of Y257(6.40)L (Fig. S9). While this is an inherent limitation of the method used, it should be clearly acknowledged; the comment in lines 162-164 seems to skirt the issue by only saying that arrestin recruitment is retained. It would be helpful and more rigorous to report the curve fit parameters (basal, E<sub>max</sub>, EC50) for the arrestin recruitment experiments and the associated errors/significance (see https://www.graphpad.com/guides/prism/latest/statistics/stat_qa_multiple_comparisons_ after_.htm for a discussion).

      The Emin, E<sub>max</sub>, and EC50 for M159<sup>4</sup>.<sup>40</sup>C/Q245<sup>6</sup>.<sup>28</sup>C ACKR3 were compared against the values for WT ACKR3 from Fig. S1 and only the E<sub>max</sub> was determined to be significantly different by the extra sum of squares F test. A note has been added to the text to reflect these results on Pg. 5.

      “Only the E<sub>max</sub> for arrestin recruitment to CXCL12-stimulated ACKR3 was significantly altered by the mutations, while all other pharmacological parameters were the same as for WT receptors.”

      (2) The methods do not specify the reactive group of the dyes used for labeling (i.e., AlexaFluor 555-maleimide and Cy5-maleimide?).

      We regret the omission and have added the necessary details to the materials and methods.

      (3) Were any of the native Cys residues removed from ACKR3 and CXCR4 in the constructs used for smFRET? ACKR3 appears to have two additional Cys residues in the N-terminus besides the one involved in the second disulfide bridge, and these would presumably be solvent-exposed. If so, please specify in the Methods and clarify whether the constructs tested in functional assays included these. (Also, please specify if the human receptors were used.)

      No additional cysteine residues were mutated in either receptor. All exposed cysteines are predicted to form disulfides. The residues in the N-terminus that the reviewer alludes to, C21 and C26, form a disulfide (Gustavsson et al. Nature Communications 2017) and are thus protected from our probes. Consistent with these expectations, neither WT CXCR4 nor ACKR3 exhibited significant fluorophore labeling (now mentioned in the text on Pg. 5). The species of origin has been added to the material and methods.

      (4) There are a few instances where the data seem to slightly diverge from the proposed models that may be helpful to comment on explicitly in the text:

      - Figure 4E (ACKR3/CXCL12(P2G)): As noted in the legend, despite stabilizing R*/R*', CXCL12(P2G) reduces transitions between these states compared to Apo. This is more similar to the effects of VUF16840 (Figure 3D) than the other ACKR3 agonists. The authors note the difference between CXCL12(LHRQ) and CXCL12(P2G) (but not vs Apo) in this regard. There might be some other information here regarding the relative importance of the conformational equilibrium vs transition rates for receptor activity.

      Although the TDPs for CXCL12<sub>P2G</sub> and VUF16840 are similar, as noted by the reviewer, the overall FRET envelopes are drastically different.

      The differences in transition probabilities for R ↔ R’ and R*’ « R* transitions observed in the presence of CXCL12<sub>P2G</sub> or CXCL12<sub>LRHQ</sub> relative to the apo receptor are now explicitly noted in the Results.

      - The conformational distributions of ACKR3 apo and ACKR3 Y257L CXCL12 are very similar (Figure 5A,D). However, there is a substantial difference in the basal activity of WT vs CXCL12stimulated Y257L (Figure S9).

      The mutation Y257L appears to promote the highest and lowest FRET states at the expense of the intermediates. Although the distribution appears similar between Apo-WT and CXCL12Y257L, the depopulation of the R’ state may lead to the observed activation in cells.

      (5) There are inconsistent statements regarding the compatibility of G protein binding to the "active-like" ACKR3 conformation observed in the authors' previous structures (Yen et al, Sci Adv 2022). In the introduction, the authors seem to be making the case that steric clashes cannot account for its lack of coupling; in the discussion, they seem to consider it a possibility.

      The introduction to previous research on the molecular mechanisms governing the lack of ACKR3-G protein coupling was not intended to be all encompassing, but rather to highlight previous efforts to elucidate this process and justify our study of the role  of dynamics. Due to the positions of the probes, we can only comment on the impact on TM6 movements and not other conformational changes. The steric clash reported in Yen et al. was in ICL2 and not directly tested here, so our observations do not preclude changes occurring in this region. We also do not claim that the active-like state resolved in our previous structures matches any specific state isolated here by smFRET.

      (6) Line 83-85: "Having excluded other mechanisms we therefore surmised that the inability of ACKR3 to activate G proteins may be due to differences in receptor dynamics."

      Line 400-402: "It is possible that the active receptor conformation clashes sterically with the G protein as suggested by docking of G proteins to structures of ACKR3."

      As mentioned above, we suspect the mechanisms governing the inability of  ACKR3 to couple to G proteins may be more complex than one particular feature but instead due to a combination of several factors. Accordingly, we have not completely eliminated a contribution of steric hindrance as we described in Yen et al. Sci Adv 2022 and instead include it as a possibility. Following the line highlighted here, we list several alternatives: 

      “Alternatively, the receptor dynamics and conformational transitions revealed here may prevent formation of productive contacts between ACKR3 and G protein that are required for coupling, even though G proteins appear to constitutively associate with the receptor.”

      And, at the end of the paragraph, we have added the following sentence: 

      “The atypical activation of ACKR3 does not appear to be dependent on any singular receptor feature and is likely a combination of several factors.”

      (7) If the authors believe that the various ligands/mutations are only altering the distribution/dynamics of the same 3/4 conformations of CXCR4/ACKR3, respectively, is there a reason each FRET efficiency histogram is fit independently instead of constraining the individual components to Gaussian components with the same centroids, and/or globally fitting all datasets for the same receptor?

      We performed global analysis across all data sets for each sample and condition. Since the peak positions of the various FRET states recovered in this way were consistent across treatments (Fig. S4,S6), we did not feel it was necessary to perform a further global analysis across all samples for a given receptor.

      Reviewer #3 (Recommendations For The Authors):

      The manuscript is well-written, the arguments are easy to follow and the figures are helpful and clear. Here are a few questions/suggestions that the authors might want to address before the paper will be published:

      (1) Include a table with kinetic rates between states in SI and have a brief discussion in the main text to support the trends observed in transition probabilities.

      As noted above, determining rate constants for each of the state-to-state transitions will require a much larger set of experimental smFRET data than is currently available and will be the subject of future studies.

      (2) The argument of state similarity (Figure S4 and S6)... why are the profiles not Gaussian, like in the fits on Figures S3 and S5, repectively? I would also suggest that once the number of states is chosen to do a global fit, where the FRET values of a certain sub-state across different conditions for one receptor are shared.

      The state distributions presented in Figs. S4 and S6 (as well as throughout the rest of the paper) are derived from HMM fitting of the time traces themselves, and are not constrained to be Gaussian, whereas the GMM analysis in Figs. S3 and S5 are Gaussian fits to the final apparent FRET efficiency histograms.

      Similar to our response to Review 2 above, due to the consistency of the fitted peak positions obtained across different conditions for a given sample, we did not feel that further global analysis was necessary.

      (3) It is shown FRET changes from ~0.85 in the inactive (closed) state to ~0.25 in the active (open) state. How do these values match the expectations based on crystal structure and dye properties?

      As noted in our response to Reviewer 1, translating the apparent FRET values using the assumed Förster distances for A555/Cy5 (per FPbase) suggest a change in D-A distance of ~30 angstroms, whereas the expected change from structures is ~16 Å. We suspect this discrepancy is due to the lipids immediately adjacent to the fluorophores, which may lead to the probes being constrained in an extended position when TM6 moves outwards, thus also reporting the linker length in the distance change. Additionally, such interactions may constrain the donor and acceptor in unfavorable orientations for energy transfer, which would also reduce the FRET efficiency in the active state. Since the calculated D-A distance changes appear too large for GPCR activation, we have opted to not make any structural interpretations. Instead, all of our conclusions are based on resolving individual conformational states and quantifying their relative populations, which is based directly on the measured FRET efficiency distributions, not computed distances.

      (4) The results on the effect of CXCL12-P2G on CXCR4 are confusing...despite being an antagonist, this ligand stabilizes the "active state"...I am not sure if the explanation offered is sufficient that the opening of the intracellular cleft is not sufficient to drive the G protein coupling/activation.

      We agree that the explanation related to the opening of the intracellular cleft being insufficient to drive G protein coupling/activation is speculative and we have removed that text. We now simply propose that the CXCL12 variants inhibit coupling of G proteins to CXCR4 or disrupt interactions necessary for signaling, as stated in the following text to the results on Pg. 8:

      “Despite the ability of CXCL12<sub>P2G</sub> and CXCL12<sub>LRHQ</sub> to stabilize the active R* conformation of CXCR4, both variants are known to act as antagonists (20). This suggests that the CXCL12 mutants inhibit CXCR4 coupling to G proteins not by suppressing the active receptor population but rather by increasing the dynamics of the receptor state-to-state transitions. Our results suggest that the helical movements considered classic signatures of the active state may not be sufficient for CXCR4 to engage productively with G proteins.”

    1. Author response:

      The following is the authors’ response to the original reviews.

      Reviewer #1:

      We thank the Reviewer for being very supportive of the work and acknowledging how important it is to understand allosteric modulation in the spike and the potential of this knowledge to contribute to the design of novel therapeutic strategies (for example, disrupting or altering the allosteric networks within the spike can be a novel strategy for drug development against COVID-19). We address their comments below: 

      (1) The Reviewer states that although the strategy used to extract the responses has been "previously validated", the complexity of the interactions investigated requires "a robust statistical analysis, which is not shown quantitatively". 

      As the Reviewer points out, the D-NEMD approach has been previously validated in various protein systems ranging from soluble enzymes to integral membrane proteins, including the spike (e.g. [Kamsri et al. (2024) Biochem; Beer et al. (2024) Chem Sci; Oliveira et al. (2023) J Mol Cell Biol; Chan et al. (2023) JACS Au; Castelli et al. (2023) JACS; Castelli et al. (2023) Protein Sci; Oliveira et al. (2022) Comput Struct Biotechnol J; Gupta et al. (2022) Nat Comm; Oliveira et al. (2021) JACS; Galdadas et al. (2021) eLife; Abreu et al. (2019) Proteins; Oliveira et al. (2019) JACS; Oliveira et al. (2019) Structure]. The Kubo-Onsager relation is used to extract the evolution of the protein's response to a perturbation by comparing the equilibrium and nonequilibrium trajectories at equivalent points in time. The calculated responses at individual times are then averaged over all the repeats (210 repeats in the current work), and the standard error of the mean (SEM) is used to assess the significance of the average response. The SEM indicates how much the calculated mean deviates from the true population mean. Calculating the SEM allows us to determine how accurate the measured response is as an estimate of the population response and assess the convergence of our calculations. The evolution of the average C<sub>α</sub> displacement and corresponding SEM values for each individual monomer can be visualised in detail in Figures S7-S9. We have added a new sentence to the Materials and Methods section in the Supporting Information, explicitly stating how the convergence and statistical significance of the responses were assessed.

      (2) The Reviewer considers that the evidence presented in the paper "is compelling" but suggests performing a sequence analysis to facilitate the understanding of the results by the scientific community. 

      We thank the Reviewer for their excellent suggestion to perform a sequence analysis of the FA site region and its allosteric connections. Indeed, this analysis (Figure S24) clearly shows that several of the mutations, deletions and insertions in the Alpha, Beta, Gamma, Delta, and Omicron variants are located either in or near the regions of the protein shown to respond to the removal of linoleate from the FA site. These sequence changes affect the protein's responses, and are responsible for the differences in allosteric behaviour observed between variants, as described previously for the non-glycosylated spike [Oliveira et al. (2023) J Mol Cell Biol]. Furthermore, some variants, such as Beta, Gamma, and Omicron, contain residue substitutions at the FA site. For example, the lysine in position 417 in the ancestral spike is mutated to asparagine in Beta and Omicron and threonine in the Gamma variant. Another example is arginine 408 in the original protein, which has been replaced by asparagine in several Omicron sub-variants. 

      To summarise, the sequence analysis (Figure S24) supports our initial 3D analysis (Figure S25), indicating that many of the changes observed in the variants of concern are indeed in or close to the allosteric networks involving the FA site. We have now included the sequence analysis results in the current paper and added a new figure to Supporting Information showing the sequence alignments between the ancestral spike and different variants (Figure S24). 

      (3) The Reviewer also has "minor considerations": first, they point to a discrepancy in the presentation of residue values S325 in the plots of Chains A, B, and C of Figure S3; second, they ask why several regions, such as RBM and Furin Site in figures S6, S7, and S8 show significant changes.

      To answer both points raised by the Reviewer, we need to start by explaining that the spike typically features 22 N-glycosylation and at least two O-glycans sites per monomer. These sites have been found to be heterogeneously populated in different experimental studies (e.g. [Watanabe et al. (2020) Science; Shajahan et al. (2020) Glycobiology; Zhang et al. (2021) Mol Cell Proteomics]). Given this, the spike model used as the starting point for this work reflects this heterogeneity, with asymmetric site-specific glycosylation profiles derived from the glycoanalytic data reported by Watanable et al. for N-glycans [Watanabe et al. (2020) Science] and Shajahan et al. for O-glycans [Shajahan et al. (2020) Glycobiology]. This means that the glycan occupancy and composition for each site differ between the three monomers. For example, while monomer A contains the two O-glycans sites (linked to T323 and S325, respectively) fully occupied, monomers B and C only contain the T323 O-glycan. A detailed description of the glycosylation of the spike model is given in the supporting information of [Casalino et al. (2020) ACS Cent Sci].

      Regarding the Reviewer's first minor point, the discrepancy in behaviour observed in Figure S3 for S325 is related to the fact that this glycosylation site is only occupied in monomer A, with no glycans present in this site in monomers B and C. 

      Regarding the second point, the differences observed in the responses between the three monomers in Figures S7-S9 are probably due to asymmetries in the protein dynamics introduced by the different glycosylation patterns in the monomers. 

      We have now added a new paragraph to the materials and methods section in the Supporting Information describing the asymmetric site-specific glycosylation profiles of the monomers.

      (4) Due to the complexity of the allosteric interactions observed, the Reviewer suggests including in the paper a "diagram showing the flow of allosteric interactions" or a "vector showing how the perturbation done in the FA Active site takes contact with other relevant regions". 

      This is an excellent suggestion to facilitate the visualisation of the allosteric networks. We have added a new figure to Supporting Information highlighting the allosteric pathways identified from the DNEMD simulations and the direction of the propagation of the structural changes (Figure S26).

      Reviewer #2:

      We thank the Reviewer for their time in evaluating our manuscript and providing suggestions for improving it and ideas for further work. We are happy that the Reviewer found this to be a "nice paper" with the calculations "well done" and interesting results. We address their comments below: 

      (1) The Reviewer suggests improving the paper by adding a more detailed explanation of the DNEMD simulations approach, a method that, although proposed decades ago, is still generally unfamiliar to the community. They also asked for "information on the convergence of the observables".

      As stated by the Reviewer, a dynamical approach to nonequilibrium molecular dynamics (D-NEMD) was first proposed in the seventies by Ciccotti et al. [Ciccotti et al. (1975) Phys Rev Lett; Ciccotti et al. (1979) J Stat Phys]. This approach combines MD simulations in equilibrium and nonequilibrium conditions. The rationale for the D-NEMD approach is simple and can be described as follows: if an external perturbation (e.g. binding/unbinding of a ligand) is added to a simulation sampling an equilibrium state and, by doing so, a parallel nonequilibrium simulation is started, the structural response of the protein to the perturbation can be directly measured by comparing the equilibrium and nonequilibrium trajectories at equivalent points in time by using the Kubo-Onsager relation as long as enough sapling is gathered (for more details, please see the reviews [Balega et al. (2024) Mol Phys; Oliveira et al. (2021) Eur Phys J B; Ciccotti et al. (2016) Mol Simul]). This approach, although conceptually simple, is very powerful as it allows for computing the evolution of the dynamic response of the protein to the external perturbation, while assessing the convergence and statistical significance of that response. This approach also has the advantage that the convergence and significance of the response can be easily evaluated, and the associated errors can be computed and made as small as desirable by increasing the number of nonequilibrium trajectories. Determining the statistical errors associated with the responses (through, e.g., the determination of the standard error of the mean, SEM) is essential to test if the sampling gathered is sufficient. In this paper, the SEM was calculated for each average C<sub>α</sub> displacement value at times 0.1, 1 and 10 ns after the removal of linoleate, LA (see Figures S7-S9). The SEM indicates how accurate the measured response is as an estimate of the population response and allows us to assess the convergence of the results. 

      Generally, multiple (tens to hundreds) D-NEMD simulations are needed to achieve statistically significant results for biomolecular systems (for examples, see [Balega et al. (2024) Mol Phys; Oliveira et al. (2021) Eur Phys J B]). As such, the length of the D-NEMD simulations (typically 5 to 10 ns) reflects the balance between the computational resources available and the number of replicates needed to achieve statistically significant responses from the system. Following the Reviewer's suggestion, we have now added a brief description of the D-NEMD approach to the main manuscript and expanded the D-NEMD section in the Supporting Information with a more detailed description of the method, including adding a new figure showing a schematic representation of the D-NEMD approach (Figure S5) as well as explicitly stating the settings used in these simulations and how the statistical significance of the responses was assessed. 

      (2) The Reviewer suggests comparing the D-NEMD results with "more traditional analysis, such as correlation analysis, or community network analysis". 

      We agree with the Reviewer that this is an important comparison, which can provide a broader, more articulate and coherent picture of spike allostery and have, therefore, performed additional analysis. The dynamic cross-correlation analysis suggested by the Reviewer is a valuable tool for identifying the regions in the protein influenced by the FA site in equilibrium conditions. However, such an approach is not straightforwardly applicable to D-NEMD simulations, as these simulations are not in equilibrium. Nevertheless, as suggested by the Reviewer, we have determined the cross-correlation matrices for both the equilibrium and D-NEMD simulations (Figure S22), similar to those in our previous work [Galdadas et al. (2021) eLife] and [Oliveira et al. (2022) J Mol Cell Biol]. The analysis of these matrices can provide information about possible allosteric networks. In Figure S22, the cyan and blue regions represent moderate and high negative correlations between C<sub>α</sub> atoms, while orange and red regions correspond to moderate and high positive correlations. Negative correlations indicate residues moving in opposite directions (moving toward or away from each other). In contrast, positive values imply that the residues are moving in similar directions. We also note that, with collaborators, we have compared D-NEMD and other nonequilibrium and equilibrium MD analysis methods for allostery [Castelli et al.  (2023) JACS].

      The cross-correlation maps depicted in Figure S22 show moderate to high positive correlations between the FA sites and two of the three RBDs in the protein. This happens because each FA site sits at the interface between two neighbouring RBDs. Low to moderate negative and mildly positive correlated motions can also be observed between the FA site and the NTDs and fusion peptide surrounding regions, respectively. To facilitate the visualisation of the above-described motions, we have also mapped the statistical correlations for R408 and K417 (two FA site residues able to directly form salt-bridge interactions with the carboxylate head group of LA) on the protein's three-dimensional structure (Figure S23). Figure S23 highlights the patterns of movement described above and allows us to identify the regions whose motions are coupled to the FA site.

      Interestingly, some segments forming the signal propagation pathways, such as R454-K458 in all three monomers, and C525-K537 in monomers B and C, can also be identified from the cross-correlation matrices, showing moderate to high correlations with the FA site (Figures S22-S23). The crosscorrelation maps computed from the equilibrium trajectories (with FA sites occupied with LA) show a slight increase in the dynamic correlations, mainly for the RBDs, compared to the maps obtained from the nonequilibrium trajectories (Figure S22). This indicates that the presence of LA in the FA strengthens the connections between the FA site and other parts of the protein. 

      We have updated the manuscript to include the cross-correlation analysis, with two new figures added to Supporting Information: one depicting the cross-correlation maps for the D-NEMD and equilibrium simulations (Figure S22), and the other showing the statistical correlations for R408 and K417 (Figure S23). 

      (3) The Reviewer considers the observed connection between the fatty acid site and the heme/biliverdin site "interesting" and suggests "exploring the impact of ligand removal on this secondary site on the protein".

      Similarly to the Reviewer, we find the connection between the FA and the heme/biliverdin site fascinating and worthy of further investigation. The observed connection between these two sites shows the complexity of the allosteric effects in the spike. It would be interesting and informative to perform new equilibrium simulations of the heme/biliverdin spike complex and a new set of D-NEMD simulations in which this site is perturbed (e.g. through the removal of the heme group) to map the networks connecting this allosteric site to other functionally important regions of the spike, including the FA site and potentially other allosteric sites. These new simulations would allow us to assess the reversibility of the connection between the FA and heme/biliverdin sites and enhance our understanding of allosteric modulation in the spike and the role of the heme/biliverdin site in this process. However, due to the large size of the system and the associated computational demands, such simulations are not possible within the timeframe of the revision of this paper. These simulations would take many months to complete using our HPC resources. We also note that an experimental structure of the spike containing both heme and linoleate is not available. Further simulation analysis of the communication pathways involving the heme/biliverdin site is an excellent idea for future work.

      (4) The Reviewer "liked the mapping of existing mutations on the communication pathway" and suggested a more detailed study focusing on the effect of the mutations. 

      We fully agree with the Reviewer and consider that a detailed study focusing on the effect of the mutations, insertions, and deletions in the different glycosylated variants of concern (including new emerging ones) would be of great interest. Our previous work using D-NEMD on the non-glycosylated ancestral, Alpha, Delta, Delta plus and Omicron BA.1 spikes revealed significant differences in the allosteric responses to LA removal, with the changes in the variants affecting both the amplitude of the structural responses and the rates at which these rearrangements propagate within the protein [Oliveira et al. (2023) J Mol Cell Biol]. 

      Using the D-NEMD approach to systematically investigate the impact of each individual mutation and their contribution to the overall allosteric response of the glycosylated variants (similar to what we have done previously for the D614G mutation in the non-glycosylated protein [Oliveira et al. (2021) Comput Struct Biotechnol J]) would provide insights into the functional modulation of the spike. However, as noted above in point 3, spike simulations are highly computationally expensive, both in terms of processing and data storage requirements, because of the large size of the protein and the need for equilibrium and D-NEMD simulations. This makes the suggested mutational study unfeasible within the timeframe of the current revisions. It is, however, an excellent idea for future research.

      Reviewer #3:

      We thank the Reviewer for carefully reading and critically reviewing this work and recognising that the findings reported are "based on an impressive amount of sampling" and "meticulous" analysis. We address their comments below: 

      (1) The Reviewer considers that this work "does not clearly show any new findings" as it shows that the glycans do not significantly impact the internal networks in the protein.

      We respectfully disagree with the Reviewer. This work identifies new allosteric effects in the spike, specifically, the connection of the FA site with the heme binding site. The equilibrium simulations alone provide the first analysis of the effects of linoleate binding in the fully glycosylated spike. The finding that glycosylation does not significantly affect the allosteric pathways in the spike is in itself an important finding. Previous D-NEMD simulations investigated only the non-glycosylated spike ([Oliveira et al. (2021) Comput Struct Biotechnol J; Oliveira et al. (2022) J Mol Cell Biol] ) leading to questions of whether the allosteric effects pathways were changed by glycosylation; our results here show that the main conclusions are reinforced, but glycosylation does have some effect on networks, and also on the speed of the dynamical response. To the best of our knowledge, our work represents the first investigation to analyse the impact of glycosylation on the allosteric networks in the spike. We show that even though the presence of glycans in the exterior of the spike does not significantly alter the internal communication pathways in the protein, in some cases (for example, the glycans linked to N234, T373 and S375), they create direct connections between different regions, which may facilitate the propagation of the structural changes. 

      (2) The Reviewer suggests adding a "clear and concise description" of the D-NEMD approach to the manuscript.

      We appreciate that the use of the D-NEMD method to study biomolecular systems is relatively new, and so may be unfamiliar. As explained above in our response to Reviewer 2 (point 1), a brief description of the D-NEMD approach was now included in the main manuscript. A detailed description of the method was also added to Supporting Information, including a new figure representing the rationale for the approach (Figure S5). The interested reader is directed to previous applications and reviews for more details of the method (e.g. [Balega et al. (2024) Mol Phys; Oliveira et al. (2021) Eur Phys J B; Ciccotti et al. (2016) Mol Simul; Kamsri et al. (2024) Biochem; Beer et al. (2024) Chem Sci; Oliveira et al. (2023) J Mol Cell Biol; Chan et al. (2023) JACS Au; Castelli et al. (2023) JACS; Castelli et al. (2023) Protein Sci; Oliveira et al. (2022) Comput Struct Biotechnol J; Gupta et al. (2022) Nat Comm; Oliveira et al. (2021) JACS; Galdadas et al. (2021) eLife; Abreu et al. (2019) Proteins; Oliveira et al. (2019) JACS; Oliveira et al. (2019) Structure]). 

      (3) The Reviewer invites us to "discuss the robustness of the findings with respect to forcefield choices".

      The Reviewer raises an important but rather complex question, and one which can, of course, be posed for any molecular dynamics simulation study. The short answer is that we have chosen state-of-the-art forcefields, which have been shown to give results for the spike that are in good agreement with experiments; glycosylated spike simulations are rather computationally expensive, and constructing the models also requires significant human time and effort. Thus, while in principle interesting, it is not practical to repeat the current simulations with different forcefields. However, as detailed below, comparison of our simulations of the glycosylated and non-glycosylated [Oliveira et al. (2022) Comput Struct Biotechnol J] spike using different forcefields indicates that our conclusions are robust and are not dependent on the choice of forcefield. 

      Comparing the performance and accuracy of different force fields is not straightforward, as the results depend on the system of interest, properties simulated and sampling. In this work, the CHARMM36m all-atom additive force field was used to describe the protein and glycans. CHARMM36m is a widely used force field that has previously been validated for the simulations of biological systems [Huang et al. (2013) J Comput Chem; Guvench et al. (2009) J Chem Theory Comput], including proteins, lipids and glycans, with many of studies adopting it in the literature. Additionally, the glycosylated models of the spike used in this work have also been successfully applied and tested before (e.g. [Dommer et al. (2023) Int J High Perform Comput Appl; Sztain et al. (2021) Nat Chem; Casalino et al. (2021) Int J High Perform Comput Appl; Casalino et al. (2020) ACS Cent Sci]), with their dynamics shown to correlate well with experimental data.   

      It is also worth pointing out that, despite differences in the amplitude of the responses, the allosteric networks identified using the D-NEMD approach for the non-glycosylated [Oliveira et al. (2022) Comput Struct Biotechnol J] and glycosylated spikes are generally similar (Figure S13). While the responses for the non-glycosylated protein were extracted from simulations using the AMBER99SBILDN forcefield [Oliveira et al. (2022) Comput Struct Biotechnol J], those reported in this work were obtained from trajectories using the CHARMM36m forcefield. The similarity between the responses for the two systems (which were simulated using different forcefields) is a good indication that our findings are forcefield independent. 

      (4) The Reviewer suggests comparing our findings with "alternative methods of analysing allostery". 

      As stated above in our response to Reviewer 2 point 2, we consider the suggested comparison an excellent idea. We have therefore performed a dynamic cross-correlation analysis to identify the regions in the protein coupled to the FA site in both equilibrium and nonequilibrium conditions (see Figures S22-S23). Overall, this analysis shows that the FA site motions are strongly coupled to the RBDs and moderately to weakly connected to the NTDs and fusion peptide surrounding regions (please see a detailed description of the results of the correlation analysis in our response to Reviewer 2 point 2). The cross-correlation analysis performed was added to the manuscript, and two new figures were included in the Supporting Information (Figures S22-S23): the first, showing the cross-correlation maps for the D-NEMD and equilibrium simulations; the second, showing the statistical correlations for R408 and K417 (two residues forming the FA site and that can directly interact with the carboxylate head group of LA). 

      We agree that comparing different allosteric analysis methods is interesting, informative and important. As noted above, we have compared D-NEMD and other nonequilibrium and equilibrium MD analysis methods for allostery in the well-characterised K-Ras system [Castelli et al.  (2023) JACS].

    1. Author response:

      The following is the authors’ response to the previous reviews.

      Public Reviews:  

      Reviewer # 1 (Public Review): 

      Summary:

      The authors use an innovative behavior assay (chamber preference test) and standard calcium imaging experiments on cultured dorsal root ganglion (DRG) neurons to evaluate the consequences of global knockout of TRPV1 and TRPM2, and overexpression of TRPV1, on warmth detection. They find a profound effect of TRPM2 elimination in the behavioral assay, whereas the elimination of TRPV1 has the largest effect on the neuronal responses. These findings are very important, as there is substantial ongoing discussion in the field regarding the contribution of TRP channels to different aspects of thermosensation.

      Strengths:

      The chamber preference test is an important innovation compared to the standard two-plate test, as it depends on thermal information sampled from the entire skin, as opposed to only the plantar side of the paws. With this assay, and the detailed analysis, the authors provide strong supporting evidence for a role of TRPM2 in warmth avoidance. The conceptual framework using the Drift Diffusion Model provides a first glimpse of how this decision of a mouse to change between temperatures can be interpreted and may form the basis for further analysis of thermosensory behavior.

      Weaknesses:

      The authors juxtapose these behavioral data with calcium imaging data using isolated DRG neurons. As the authors acknowledge, it remains unclear whether the clear behavioral effect seen in the TRPM2 knockout animals is directly related to TRPM2 functioning as a warmth sensor in sensory neurons. The effects of the TRPM2 KO on the proportion of warmth sensing neurons are very subtle, and TRPM2 may also play a role in the behavioral assay through its expression in thermoregulatory processes in the brain. Future behavioral experiments on sensory-neuron specific TRPM2 knockout animals will be required to clarify this important point.

      Reviewer # 1 (Recommendations for the authors):

      (1) I have no further suggestions for the authors, and congratulate them with their excellent study.

      For the authors information, ref. 42 does contain behavioral data from both male (Fig. 4 and Extended Figure 7) and female (Extended Figure 8) mice.

      We thank the referee for pointing out that both males and female mice were tested in the Vandewauw et al. 2018 study. We deliberated whether to include this at the appropriate section of our manuscript (“Limitations of the Study”). But since Vandewauw et al. assessed noxious heat temperatures and we here assess innocuous warmth temperature, we felt that this reference would not add to the clarification whether there are sex differences in Trp channelbased warmth temperature sensing. In particular, we did not want to “use” the argument and to suggest that there are no sex temperature differences in the warmth range just because Vandewauw et al. did not observe major sex differences in the noxious temperature range. 

      Reviewer #3 (Public Review):  

      Summary and strengths:

      In the manuscript, Abd El Hay et al investigate the role of thermally sensitive ion channels TRPM2 and TRPV1 in warm preference and their dynamic response features to thermal stimulation. They develop a novel thermal preference task, where both the floor and air temperature are controlled, and conclude that mice likely integrate floor with air temperature to form a thermal preference. They go on to use knockout mice and show that TRPM2-/- mice play a role in the avoidance of warmer temperatures. Using a new approach for culturing DRG neurons they show the involvement of both channels in warm responsiveness and dynamics. This is an interesting study with novel methods that generate important new information on the different roles of TRPV1 and TRPM2 on thermal behavior.

      Comments on revisions:

      Thanks to the authors for addressing all the points raised. They now include more details about the classifier, better place their work in context of the literature, corrected the FOVs, and explained the model a bit further. The new analysis in Figure 2 has thrown up some surprising results about cellular responses that seem to reduce the connection between the cellular and behavioral data and there are a few things to address because of this:

      (1) TRPM2 deficient responses: The differences in the proportion of TRPM2 deficient responders compared to WT are only observed at one amplitude (39C), and even at this amplitude the effect is subtle. Most surprisingly, TRPM2 deficient cells have an enhanced response to warm compared to WT mice to 33C, but the same response amplitude as WT at 36C and 39C. The authors discuss why this disconnect might be the case, but together with the lack of differences between WT and TRPM2 deficient mice in Fig 3, the data seem in good agreement with ref 7 that there is little effect of TRPM2 on DRG responses to warm in contrast to a larger effect of TRPV1. This doesn't take away from the fact there is a behavioral phenotype in the TRPM2 deficient mice, but the impact of TRPM2 on DRG cellular warm responses is weak and the authors should tone down or remove statements about the strength of TRPM2's impact throughout the manuscript, for example:

      "Trpv1 and Trpm2 knockouts have decreased proportions of WSNs."

      "this is the first cellular evidence for the involvement of TRPM2 on the response of DRG sensory neurons to warm-temperature stimuli"

      "we demonstrate that TRPV1 and TRPM2 channels contribute differently to temperature detection, supported by behavioural and cellular data"

      "TRPV1 and TRPM2 affect the abundance of WSNs, with TRPV1 mediating the rapid, dynamic response to warmth and TRPM2 affecting the population response of WSNs."

      "Lack of TRPV1 or TRPM2 led to a significant reduction in the proportion of WSNs, compared to wildtype cultures".

      We agree with the referee that the somewhat surprising result of the subtle phenotype in Trpm2 knock-out DRG culture experiments, that became detectable in the course of the new analysis, was overemphasized in the previous version of the manuscript. Per suggestion, we have toned down or removed the statements in the revised manuscript (for the referee to find those changes easily, they are indicated in “track-changes mode” in the submitted document).  

      (2) The new analysis also shows that the removal of TRPV1 leads to cellular responses with smaller responses at low stimulus levels but larger responses with longer latencies at higher stimulus levels. Authors should discuss this further and how it fits with the behavioral data.

      Because these changes shown in Fig. 2E are also subtle (similar to the cellular Trpm2 phenotype discussed above), and because both the “% Responders” (Fig 2.D) and The AUC analysis (Fig. 2F) show a reduction in Trpv1 knock out cultures ––both, at lower and at higher stimulus levels–– we did not want to overstate this difference too much and therefore did not further discuss this aspect in the context of the behavioral differences observed in the Trpv1 knock-out animals.  

      (3) Analysis clarification: authors state that TRPM2 deficient WSNs show "Their response to the second and third stimulus, however, are similar to wildtype WSNs, suggesting that tuning of the response magnitude to different warmth stimuli is degraded in Trpm2-/- animals." but is there a graded response in WT mice? It looks like there is in terms of the %responders but not in terms of response amplitude or AUC. Authors could show stats on the figure showing differences in response amplitude/AUC/responders% to different stimulus amplitudes within the WT group.

      We have added the statistics in the main text, you find them on page 7 (also in “track changes mode”).

      (4) New discussion point: sex differences are "similar to what has been shown for an operant-based thermal choice assay (11,56)", but in their rebuttal, they mention that ref 11 did not report sex differences. 56 does. Check this.

      Thank you for pointing out this mishap. We have now corrected this in the “Limitations of the study” section of the discussion and have removed the Paricio-Montesions et al study from that section and slightly revised the text (see “track-changes” on page 16).

      (5) The authors added in new text about the drift diffusion model in the results, however it's still not completely clear whether the "noise" is due to a perceptual deficit or some other underlying cause. Perhaps authors could discuss this further in the discussion.

      We have now included more discussion concerning this (page 14):

      “However, the increased noise in the drift-di3usion model points to a less reliable temperature detection mechanism. Although noise in drift di3usion models can encompass various sources of variability—ranging from peripheral sensory processing to central mechanisms like attention or motor initiation—the most parsimonious interpretation in our study aligns with a perceptual deficit, given the altered temperatureresponsive neuronal populations we observed. This implies that, despite the substantial loss of WSNs, the remaining neuronal population provides su3icient information for the detection of warmer temperatures, albeit with reduced precision”

      Within the limits of the data that is available, we hope the referee agrees with us that we have now adequately discussed this aspect; we feel that any further discussion would be too speculative.

    1. Author response:

      The following is the authors’ response to the original reviews.

      Public Reviews:

      Reviewer #1 (Public review):

      Summary:

      Authors of this article have previously shown the involvement of the transcription factor Zinc finger homeobox-3 (ZFHX3) in the function of the circadian clock and the development/differentiation of the central circadian clock in the suprachiasmatic nucleus (SCN) of the hypothalamus. Here, they show that ZFHX3 plays a critical role in the transcriptional regulation of numerous genes in the SCN. Using inducible knockout mice, they further demonstrate that the deletion Of Zfhx3 induces a phase advance of the circadian clock, both at the molecular and behavioral levels.

      Strengths:

      - Inducible deletion of Zfhx3 in adults

      - Behavioral analysis

      - Properly designed and analyzed ChIP-Seq and RNA-Seq supporting the conclusion of the behavioral analysis

      Weaknesses:

      - Further characterization of the disruption of the activity of the SCN is required.

      (1) We thank the reviewer for their valuable inputs. Indeed, a comprehensive behavioral assessment of mice of this genotype was executed in Wilcox et al. ;2017 study. In Wilcox et al.; 2017, Figure 4, 6-h phase advance (jetlag) clearly showed faster reentrainment in ZFHX3-KO mice when compared to the controls.

      - The description of the controls needs some clarification.

      (2) We agree with the reviewer and have modified the text at line 211-212 to clearly describe the controls.

      Reviewer #2 (Public review):

      Summary:

      ZFHX3 is a transcription factor expressed in discrete populations of adult SCN and was shown by the authors previously to control circadian behavioral rhythms using either a dominant missense mutation in Zfhx3 or conditional null Zfhx3 mutation using the Ubc-Cre line (Wilcox et al., 2017). In the current manuscript, the authors assess the function of ZFHX3 by using a multi-omics approach including ChIPSeq in wildtype SCNs and RNAseq of SCN tissues from both wildtype and conditional null mice. RNAseq analysis showed a loss of oscillation in Bmal1 and changes in expression levels of other clock output genes. Moreover, a phase advance gene transcriptional profile using the TimeTeller algorithm suggests the presence of a regulatory network that could underlie the observed pattern of advanced activity onset in locomotor behavior in knockout mice.

      In figure1, the authors identified the ZFHX3 bound sites using ChIPseq and compared the loci with other histone marks that occur at promoters, TSS, enhancers and intergenic regions. And the analysis broadly points to a role for ZFHX3 in transcriptional regulation. The vast majority of nearly 40000 peaks overlapped H3K4me3 and K27ac marks, active promoters which also included genes falling under the GO category circadian rhythms. However, no significant differential ZFHX3 bound peaks were detected between ZT3 and ZT15. In these experiments, it is not clear if and how the different ChIP samples (ZFHX3 and histone PTM ChIPs) were normalized/downsampled for analysis. Moreover, it seems that ZFHX3 binding or recruitment has little to do with whether the promoters are active.

      (3) We thank the reviewer for their valuable comment. Different ChIP samples (ZFHX3 and histone PTM ChIPs) were treated in the same manner from preprocessing (quality control by FastQC, adapter trimming, alignment to mm10 genome) and peak calling was performed using respective input samples as control using MACS2 as mentioned in Methods. The data was normalized using bamCoverage tools and bigwig files were generated for visual inspection using UCSC Genome Browser. These additional details are added to Methods at line 592. Finally, BEDTools was employed to study overlapping peaks between ZFHX3 and histone PTMs.

      We agree that, alone, the current data does not make any claim for ZFHX3 being crucial for promoter to be active. Our data clearly suggests that a vast majority of ZFHX3 genomic binding in the SCN was observed at active promoters marked by H3K4me3 and H3K27ac and potentially regulating gene transcription.

      Based on a enrichment of ARNT domains next to K4Me3 and K27ac PTMs, the authors propose a model where the core-clock TFs and ZFHX3 interact. If the authors develop other assays beyond just predictions to test their hypothesis, it would strengthen the argument for role in circadian transcription in the SCN. It would be important in this context to perform a ChIP-seq experiment for ZFHX3 in the knockout animal (described from Figure 2 onwards) to eliminate the possibility of non-specific enrichment of signal from "open chromatin'. Alternatively, a ChIPseq analysis for BMAL1 or CLOCK could also strengthen this argument to identify the sites co-occupied by ZFHX3 and core-clock TFs.

      (4a) We agree that follow-up experiments such as BMAL1/CLOCK ChIPseq suggested by the reviewer will further confirm the proposed interaction of ZFHX3 with core-clock TFs. However, this is beyond the scope of the current study. 

      (4b) Again, conducting complementary ChIPseq in ZFHX3 knockout mice will strengthen the findings, but conducting TF-ChIPseq in a specific brain tissue such as the SCN (unlike peripheral tissues such as liver) does not only warrant use of multiple animals per sample but is also technically challenging and time-consuming to ensure specificity of the sample. For these reasons, datasets such as ours on the SCN are uncommon. Furthermore, in this particular context, we are certain that, based on current dataset, the ZFHX3 peaks (narrow) we observed were well-defined and met the specified statistical criteria mitigating any risk of signal arising from non-specific enrichment from open-chromatin regions.

      Next, they compared locomotor activity rhythms in floxed mice with or without tamoxifen treatment. As reported before in Wilcox et al 2017, the loss of ZFHX3 led to a shorter free running period and reduced amplitude and earlier onset of activity. Overall, the behavioral data in Figure 2 and supplementary figure 2 has been reported before and are not novel.

      (5) We recognise that a detailed circadian behavior assessment from adult mice lacking ZFHX3 has been conducted previously by Nolan lab (Wilcox et al; 2017). In the current study, however, we used a separate cohort of mice, to focus on the behavioral advance noted in 24-h LD cycle and generated a more refined assessment. Importantly, these mice were also used for transcriptomic studies as detailed in Figure 3, which we consider to be a positive feature of our experimental design: behavior and molecular analyses were performed on the same animals.

      Next, the authors performed RNAseq at 4hr intervals on wildtype and knockout animals maintained in light/dark cycles to determine the impact of loss of ZFHX3. Overall transcriptomic analysis indicated changes in gene expression in nearly 36% of expressed genes, with nearly half being upregulated while an equal fraction was downregulated. Pathways affected included mostly neureopeptide neurotransmitter pathways. Surprisingly, there was no correlation between the direction in change in expression and TF binding since nearly all the sites were bound by ZFHX3 and the active histone PTMs. The ChIP-seq experiment for ZFHX3 in the UBC-Cre+Tam mice again could help resolve the real targets of ZFHX3 and the transcriptional state in knockout animals.

      (6) We agree with the reviewer that most of the differentially expressed genes showed ZFHX3 binding at active promoter sites. That said, the current dataset is in line with recently published ZFHX3-CHIPseq data by Baca et al; 2024 [PMID: 38412861] in human neural stem cells and Hu et al; 2024 [PMID: 38871709] in human prostate cancer cells that clearly suggests ZFHX3 binds at active promoters and act as chromatin remodellers/mediators that modulate gene transcription depending on the accessory TFs assembled at target genes. Therefore, finding no correlation in the direction of change in expression is not striking. 

      To determine the fraction of rhythmic transcripts, Using dryR, the authors categorise the rhythmic transcriptome into modules that include genes that lose rhythmicity in the KO, gain rhythmicity in the KO or remain unaffected or partially affected. The analysis indicates that a large fraction of the rhythmic transcriptome is affected in the KO model. However, among core-clock genes only Bmal1 expression is affected showing a complete loss of rhythm. The authors state a decrease in Clock mRNA expression (line 294) but the panel figure 4A does not show this data. Instead it depicts the loss in Avp expression - {{ misstated in line 321 ( we noted severe loss in 24-h rhythm for crucial SCN neuropeptides such as Avp (Fig. 3a).}}

      (7a) Indeed, among the core-clock genes rhythmic expression is lost after ZFHX3 knockout only for Bmal1. However, given the mice were rhythmic (as assessed by wheel-running activity) in LD conditions, the observed 24-h gene expression rhythm in the majority of core-clock genes (Pers and Crys) is consistent with behavior data, and suggests towards an altered molecular clock with plausible scenarios as explained at line 439. That said, the unique and well-defined changes (amplitude and phase) observed as demonstrated in Figure 5 highlights a model in which ZFHX3 exerts differential control, for example in case of Per2 noted advance in molecular rhythm (~2-h), but no such change in Cry, presents an opportunity to delineate further the regulation of TTFL genes.

      (7b) Line 294 revised as – “Bmal1 demonstrating a complete loss of 24-h rhythm (Fig. 4A), and its counterpart Clock mRNA showing overall reduced expression levels (Supplementary Table 3)”.

      7c) Line 321 is referring to loss of Avp expression and the typo has been corrected from “Figure 3a to 4a”. Thank you. 

      However, core-clock genes such as Pers and Crys show minor or no change in expression patterns while Per2 and Per3 show a ~2hr phase advance. While these could only weakly account for the behavioral phase advance, the authors used TimeTeller to assess circadian phase in wildtype and ZFHX3 deficient mice. This approach clearly indicated that while the clock is not disrupted in the knockout animals, the phase advance can be correctly predicted from a network of gene expression patterns.

      Strengths:

      The authors use a multiomic strategy in order to reveal the role of the ZFHX3 transcription factor with a combination of TF and histone PTM ChIPseq, time-resolved RNAseq from wildtype and knockout mice and modeling the transcriptomic data using TimeTeller. The RNAseq experiments are nicely controlled and the analysis of the data indicates a clear impact on gene-expression levels in the knockout mice and the presence of a regulatory network that could underlie the advanced activity onset behavior.

      Weaknesses:

      It is not clear whether ZFHX3 has a direct role in any of the processes and seems to be a general factor that marks H3K4me3 and K27ac marked chromatin. Why it would specifically impact the core-clock TTFL clock gene expression or indeed daily gene expression rhythms is not clear either. Details for treatment of different ChIP samples (ZFHX3 and histone PTM ChIPs) on data normalization for analysis are needed. The loss of complete rhythmicity of Avp and other neuropeptides or indeed other TFs could instead account for the transcriptional deregulation noted in the knockout mice.

      (8) We thank the reviewer for the constructive feedback.  The current data suggests ZFHX3 acts as a mediating factor, occupying targeted active promoter sites and regulating gene expression by partnering with other key TFs in the SCN. Please see point 6 for clarification. The binding sites of ZFHX3 clearly showed enrichment for E-box(CACGTG) motif bound by CLOCK/BMAL1 along with binding sites for key SCN-specific TFs such as RFX (please see Supplementary Fig1). Our data thereby shows that it affects both core-clock and clock output genes (at varied levels) thereby exercising a pervasive control over the SCN transcriptome.

      For treatment of ChIP samples please see point 3. We followed ENCODE guidelines strictly. 

      Recommendations for the authors:

      Reviewer #1 (Recommendations for the authors):

      - The early activity onset associated with a short photoperiod is a phenotype found in mice with a perturbed function of the SCN like Per2 mutant (PMID: 17218255), or Clock KO (PMID: 22431615). Such disruption of the SCN function also leads to a faster synchronization to day feeding (PMID: 23824542) or jetlag (PMID: 25063847; PMID: 24092737). Therefore, authors should study the synchronizing function of these mice to day feeding and/or jetlag.

      (9) Please see our response to point 1.

      - The description of the negative controls needs clarification. While the "Method" suggests that both Cre- and Cre+ mice are treated with Tamoxifen, the text rather suggest that the controls are Cre- and Cre+ animals non-treated by Tamoxifen. Because of the potential effect of Tamoxifen on gene expression, Cre- treated animals are a required control.

      (10) We thank the reviewer. As detailed in Methods, both Cre- and Cre+ mice were treated with Tamoxifen and compared. The text had been revised at line 212. In addition to this, another genetic control (-Tamoxifen) was also used (Figure 2 and 3).

      - On line 486, authors wrote "It is important to note that although in the present study we used adult-specific Zfhx3 null mutants resulting in global loss of ZFHX3, the effects observed both at molecular and behavioural levels are independent of its functional role(s) in other tissues." On what evidence is this statement based? Using global KO rather suggest a potential role of other tissues.

      (11) We agree with the reviewer, but at line 486 we refer to the effects observed at circadian behavior and daily gene expression in the SCN to be independent of pleiotropic roles of ZFHX3 such as involvement in angiogenesis, spinocerebellar ataxia etc. We have revised the text.

      Reviewer #2 (Recommendations for the authors):

      It is not clear whether the behavioral experiments presented in this study were performed on a new set of animals - different from the cohort used in the Wilcox et al 2017 paper. For example, the proportion of total activity graphed in Figure 2C look strikingly similar to activity counts in Figure 3A in the prior publication (doi: 10.1177/0748730417722631)- down to the small burst in activity after ZT20 in the control (-Tam) group.

      (12) The behavioral experiments presented in this study were performed on a completely new cohort of mice to those used in Wilcox et al.; 2017. The mice used for behavioral assessment. In the current study were later used for molecular experiments. Please see point 5.

      Information on ChIP-seq such as read length, PE or SE seq, number of reads/replicate/condition/sample is missing. Versions of the softwares used should be indicated if known.

      (13) The details are added as:

      (13a) “Briefly, SCN punches were pooled from 80 mice at each. designated times (ZT3, ZT15) corresponding to one biological replicate per timepoint” at line 567.

      (13b) “24 ug sheared chromatin sample collected from each time point (ZT3, ZT15)” at line 571.

      (13c) “75-bp single end sequencing : 30 million reads/sample” at line 577.  

      (13d) “At line 584 – MACS algorithm v2.1.0 added”

      Versions of other softwares used were already mentioned.

    1. Author response:

      We thank the reviewers for their appreciation of our work and the recommendations to improve the manuscript. We have included a point-by-point response below. To summarize, for revision we plan to:

      • Clarify the manuscript to improve readability and coherence,

      • Ensure that all figures are thoroughly discussed in the text,

      • Tone down biological claims based on RNA velocity where applicable.

      While we agree with the reviewer that functional validation and/or spatial proteomics data accompanying this study could provide additional insights and broader contextualization, this is unfortunately beyond the scope of the study.

      Reviewer #1 (Public review):

      Summary:

      The authors conducted a spatial analysis of dysplastic colon tissue using the Slide-seq method. Their main objective is to build a detailed spatial atlas that identifies distinct cellular programs and microenvironments within dysplastic lesions. Next, they correlated this observation with clinical outcomes in human colorectal cancer.

      Strengths:

      The work is a good example of utilising spatial methods to study different tumour models. The authors identified a unique stem cell program to understand tumours gently and improve patient stratification strategies.

      Weaknesses:

      However, the study's predominantly descriptive nature is a significant limitation. Although the spatial maps and correlations between cell states are interesting observations, the lack of functional validation-primarily through experiments in mouse models-weakens the causal inferences regarding the roles these cellular programs play in tumour progression and therapy resistance.

      We thank the reviewer for this comment. Indeed, functional validation to pin down causal dependencies and a more thorough investigation of tumor progression and therapy resistance both in mouse model as well as human patients and/or patient derived samples would broaden the insights to be gained from this work. Unfortunately, this is beyond the scope of this study.

      The authors also missed an opportunity to link the mutational status of malignant cells with the cellular neighbourhoods.

      The data reported in this study only contains spatial data for one mouse model (AV). As spatial data for the other model (AKPV) is missing, it is not possible to link the mutational type of the model with the cellular neighborhoods. We did investigate whether there is extra "somatic" mutational heterogeneity in the AV data, both regarding single nucleotide variations (SNVs) and copy number variations (CNVs). But at the time when the mice were sacrificed (after 3 weeks) there was no significant mutational heterogeneity discoverable.

      Overall, the study contributes to profiling the dysplastic colon landscape. The methodologies and data will benefit the research community, but further functional validation is crucial to validate the biological and clinical implications of the described cellular interactions.

      Reviewer #2 (Public review):

      In their study, Avraham-Davidi et al. combined scRNA-seq and spatial mapping studies to profile two preclinical mouse models of colorectal cancer: Apcfl/fl VilincreERT2 (AV) and Apcfl/fl LSL-KrasG12D Trp53fl/fl Rosa26LSL-tdTomato/+ VillinCreERT2 (AKPV). In the first part of the manuscript, the authors describe the analysis of the normal colon and dysplastic lesions induced in these models following tamoxifen injection. They highlight broad variations in immune and stromal cell composition within dysplastic lesions, emphasizing the infiltration of monocytes and granulocytes, the accumulation of IL-17+gdT cells, and the presence of a distinct group of endothelial cells. A major focus of the study is the remodeling of the epithelial compartment, where the most significant changes are observed. Using non-negative matrix factorization, the authors identify molecular programs of epithelial cell functions, emphasizing stemness, Wnt signaling, angiogenesis, and inflammation as major features associated with dysplastic cells. They conclude that findings from scRNA-seq analyses in mouse models are transposable to human CRC. In the second part of the manuscript, the authors aim to provide the spatial context for their scRNA-seq findings using Slide-seq and TACCO. They demonstrate that dysplastic lesions are disorganized and contain tumor-specific regions, which contextualize the spatial proximity between specific cell states and gene programs. Finally, they claim that these spatial organizations are conserved in human tumors and associate region-based gene signatures with patient outcomes in public datasets. Overall, the data were collected and analyzed using solid and validated methodology to offer a useful resource to the community.

      Main comments:

      (1) Clarity

      The manuscript would benefit from a substantial reorganization to improve clarity and accessibility for a broad readership. The text could be shortened and the number of figure panels reduced to emphasize the novel contributions of this work while minimizing extensive discussions on general and expected findings, such as tissue disorganization in dysplastic lesions. Additionally, figure panels are not consistently introduced in the correct order, and some are not discussed at all (e.g., Figure S1D; Figure 3C is introduced before Figure 3A; several panels in Figure 4 are not discussed). The annotation of scRNA-seq cell states is insufficiently explained, with no corresponding information about associated genes provided in the figures or tables. Multiple annotations are used to describe cell groups (e.g., TKN01 = γδ T and CD8 T, TKN05 = γδT_IL17+), but these are not jointly accessible in the figures, making the manuscript challenging to follow. It is also not clear what is the respective value of the two mouse models and time points of tissue collection in the analysis.

      We thank the reviewer for this suggestion. For the revision we plan to clarify the manuscript to improve readability and coherence in text and figures, and expand on the cell type nomenclature.

      (2) Novelty

      While the study is of interest, it does not present major findings that significantly advance the field or motivate new directions and hypotheses. Many conclusions related to tissue composition and patient outcomes, such as the epithelial programs of Wnt signaling, angiogenesis, and stem cells, are well-established and not particularly novel. Greater exploration of the scRNA-seq data beyond cell type composition could enhance the novelty of the findings. For instance, several tumor microenvironment clusters uniquely detected in dysplastic lesions (e.g., Mono2, Mono3, Gran01, Gran02) are identified, but no further investigation is conducted to understand their biological programs, such as applying nNMF as was done for epithelial cells. Additional efforts to explore precise tissue localization and cellular interactions within tissue niches would provide deeper insights and go beyond the limited analyses currently displayed in the manuscript.

      We thank the reviewer for this comment. Our study aimed to spatially characterize the tumor microenvironment, with scRNA-seq analysis serving to support this spatial characterization.<br /> Due to technical limitations—such as the number of samples and the limited capture efficiency of Slide-seq—the resolution of immune cell identification in our spatial analysis is constrained. Additionally, while immune and stromal cells formed distinct clusters, epithelial cells exhibited a continuum that was better captured using nNMF.

      Lastly, our manuscript provides a general characterization of monocyte and granulocyte populations in scRNA-seq (line 142) and their spatial microenvironments (line 390). We believe that additional analyses of these populations would be beyond the scope of this study and could place an unnecessary burden on the reader. Instead, we suggest that such analyses be explored in future studies.

      We remark that we analyzed tissue localization for two entirely different spatial transcriptomics assays (Slide-seq and Cartana) to the resolution of cell types and programs, which was feasible within the constraints of the sparsity and gene panel and sample size in the experiments. A path to further increase the resolution of investigation in this dataset is to include other datasets, e.g. by the emerging transformer-based spatial transcriptomics integration methods, which unfortunately is outside the scope of the current study.

      We also remark that the current manuscript already includes an investigation of cellular interactions within tissue niches based on COMMOT (Fig 4k, Fig S8i, Supp Item 4).

      (3) Validation

      Several statements made by the authors are insufficiently supported by the data presented in the manuscript and should be nuanced in the absence of proper validation. For example:<br /> (a) RNA velocity analyses: The conclusions drawn from these analyses are speculative and need further support.

      We thank the reviewer for this comment. We will clarify that our conclusions from the RNA velocity analysis need further support by experimental validation, which is out of the scope of the study.

      (b) Annotations of epithelial clusters as dysplastic: These annotations could have been validated through morphological analyses and staining on FFPE slides.

      We thank the reviewer for this comment. While this could have been a possible approach, our study primarily relies on scRNA-seq, which does not preserve tissue morphology, and Slide-seq of fresh tissue, where such an analysis is particularly challenging.

      (c) Conservation of mouse epithelial programs in human tumors: The data in Figure S5B does not convincingly demonstrate the enrichment of stem cell program 16 in human samples. This should be more explicitly stated in the text, given the emphasis placed on this program by the authors.

      We thank the reviewer for pointing this out. Indeed, Figure S5B does not demonstrate the program 16 enrichment in human samples. We will clarify this in the manuscript.

      (d) Figure S6E: Cluster Epi06 is significantly overrepresented in spatial data compared to scRNA-seq, yet the authors claim that cell type composition is largely recapitulated without further discussion, which reduces confidence in other conclusions drawn.

      We thank the reviewer for this remark. Indeed, Epi06 was a cluster which drew our attention during early analyses for its mixed expression profiles with contributions of vastly different cell types. We concluded that this is best explained by doublets and excluded it from further analysis. In the current manuscript we only briefly hinted at this in figure legend 2A ("Cluster Epi06: doublets (not called by Scrublet)"), and we will expand on this in the revised manuscript. The observation that this cluster is significantly overrepresented in the annotation of the spatial data is not surprising in this context as this annotation comes from the decomposition of compositional data which contains contributions of multiple cells per Slide-seq bead which are structurally very similar to doublets. We will add this point as well to the revised manuscript.

      Furthermore, stronger validation of key dysplastic regions (regions 6, 8, and 11) in mouse and human tissues using antibody-based imaging with markers identified in the analyses would have considerably strengthened the study. Such validation would better contextualize the distribution, composition, and relative abundance of these regions within human tumors, increasing the significance of the findings and aiding the generation of new pathophysiological hypotheses.

      We agree with the reviewer with their assessment that validation by antibody-based imaging (or other spatial proteomics data) would have been useful follow-up experiments to the experiments and results presented in our manuscript, yet these are beyond the scope of the current study.

    1. Author response:

      We thank the editor and reviewers for recognizing the value of studying neural dynamics and behavior in naturalistic, task-free conditions and the importance of linking olfactory bulb activity to movement and place.  We appreciate the suggestions for analyses and edits to further quantify these relationships and clarify our interpretation.

      The primary sticking point regards our result that olfactory bulb neurons are selective for place:

      “analysis supporting the potentially exciting result on the encoding of place is currently incomplete”

      In this paper, we report evidence for spatial selectivity in the olfactory bulb, make relative comparisons with canonical “place cells” in the hippocampus, and control for alternative hypotheses such as odor- or behavior-driven sources, to motivate future experiments which can more precisely identify the mechanistic basis of these responses. Throughout the reviews, our result on the correlation of OB activity with place is not questioned, but rather whether we can better determine how much behavior or odor explain this result. Regarding the concern about behavior, we are confident that the spatial non-uniformities of breathing rhythms do not explain OB spatial selectivity based on the analyses included in the paper. We thank the reviewers for suggestions of additional analyses with which we can further test this claim and will incorporate several, as we will detail below.

      Regarding the points about odor, indeed we do not claim that we have entirely ruled out odors as an explanation of place selectivity in the bulb. Rather, our claim is that our analyses show that scent marks on the floor, the most obvious olfactory place cue, cannot fully explain place selectivity.  We acknowledge that our experiments do not exclude the possibility that other odors in the environment may also contribute. Odors are invisible and difficult to measure, and the odor sensitivity of rodents vastly outstrips that of any device known to humanity. Indeed, no study of which we are aware can fully rule out odor as a cue to the animal’s internal model of place. However, encoding of place, even if explained by odor, is still encoding of place. We will clarify our interpretation of the data, and we thank the reviewers for proposing ideas for further analysis, some of which we are implementing. However, experiments such as effects of distal cues on spatially selective olfactory bulb neurons are beyond the scope of this paper.

      We will further test whether neurons in the olfactory bulb are spatially selective by reporting additional statistical analyses including:

      - More completely quantifying the spatial distribution of sniffing patterns (visualized in Figure 8 - Sup 1) by plotting sniff-frequency distributions across locations in the arena.

      - Demonstrating independent contribution of place over speed in GLMs

      - Characterizing the temporal stability of spatially selective cells across a session (1st half vs second half)

      - reporting mean decoding errors for olfactory bulb and hippocampal decoders (visualized in Fig 7C)

      We will add to the analyses of behavioral state models by:

      - Comparing the performance of hidden Markov models fit to breathing frequency alone with those fit to breathing frequency and movement speed

      - Quantifying individual differences in state-transition matrices

      Further, we address the question around the use of “grooming” as a descriptor of the intermediate sniff frequency state. We used the term ‘grooming’ based on extensive video observation. During this state, ‘Speed’ is significantly non-zero because we defined speed as the movement of the head keypoint which moves substantially during grooming. We will make this point more explicit in the figures and text, and we will provide additional video documentation of these and the other behavioral states.

      Lastly, we will further discuss the fact stated in the first paragraph of the Results section that mice are placed in “head-fixation on a stationary platform” and thus inhibited from running. While different breathing states than those observed in our stationary platform may occur during head-fixation with a treadmill, we believe the differences between head-fixed running and free moving running are beyond the scope of this paper. Nevertheless, it’s an important point that we will more explicitly discuss in our revision.

      We appreciate these constructive comments and hope these additional analyses and textual edits will help clarify our interpretations and motivate future experiments to further test and refine them.

    1. Author response:

      The following is the authors’ response to the previous reviews.

      Public Reviews:

      Reviewer #1 (Public review):

      Summary:

      This paper investigates the effects of the explicit recognition of statistical structure and sleep consolidation on the transfer of learned structure to novel stimuli. The results show a striking dissociation in transfer ability between explicit and implicit learning of structure, finding that only explicit learners transfer structure immediately. Implicit learners, on the other hand, show an intriguing immediate structural interference effect (better learning of novel structure) followed by successful transfer only after a period of sleep.

      Strengths:

      This paper is very well written and motivated, and the data are presented clearly with a logical flow. There are several replications and control experiments and analyses that make the pattern of results very compelling. The results are novel and intriguing, providing important constraints on theories of consolidation. The discussion of relevant literature is thorough. In sum, this work makes an exciting and important contribution to the literature.

      Weaknesses:

      There have been several recent papers which have identified issues with alternative forced choice (AFC) tests as a method of assessing statistical learning (e.g. Isbilen et al. 2020, Cognitive Science). A key argument is that while statistical learning is typically implicit, AFC involves explicit deliberation and therefore does not match the learning process well. The use of AFC in this study thus leaves open the question of whether the AFC measure benefits the explicit learners in particular, given the congruence between knowledge and testing format, and whether, more generally, the results would have been different had the method of assessing generalization been implicit. Prior work has shown that explicit and implicit measures of statistical learning do not always produce the same results (eg. Kiai & Melloni, 2021, bioRxiv; Liu et al. 2023, Cognition).

      The authors argued in their response to this point that this issue could have quantitative but not qualitative impacts on the results, but we see no reason that the impact could not be qualitative. In other words, it should be acknowledged that an implicit test could potentially result in the implicit group exhibiting immediate structure transfer.

      We thank the reviewer for their feedback and added a statement in our discussion section acknowledging the possible effects of alternative measures of learning.

      Given that the explicit/implicit classification was based on an exit survey, it is unclear when participants who are labeled "explicit" gained that explicit knowledge. This might have occurred during or after either of the sessions, which could impact the interpretation of the effects and deserves discussion.

      We agree with the mentioned shortcoming in principle, although there are good methodological reasons for this, as discussed in our previous response. We added a statement on this topic to our discussion to make the potential issues and our reasoning in the design decision more transparent for the reader.

      Reviewer #2 (Public review):

      Summary:

      Sleep has not only been shown to support the strengthening of memory traces, but also their transformation. A special form of such transformation is the abstraction of general rules from the presentation of individual exemplars. The current work used large online experiments with hundreds of participants to shed further light on this question. In the training phase participants saw composite items (scenes) that were made up of pairs of spatially coupled (i.e., they were next to each other) abstract shapes. In the initial training, they saw scenes made up of six horizontally structured pairs and in the second training phase, which took place after a retention phase (2 min awake, 12 hour incl. sleep, 12 h only wake, 24 h incl. sleep), they saw pairs that were horizontally or vertically coupled. After the second training phase, a two-alternativesforced-choice (2-AFC) paradigm, where participants had to identify true pairs versus randomly assembled foils, was used to measure performance on all pairs. Finally, participants were asked five questions to identify, if they had insight into the pair structure and post-hoc groups were assigned based on this. Mainly the authors find that participants in the 2 minute retention experiment without explicit knowledge of the task structure were at chance level performance for the same structure in the second training phase, but had above chance performance for the vertical structure. The opposite was true for both sleep conditions. In the 12 h wake condition these participants showed no ability to discriminate the pairs from the second training phase at all.

      Strengths:

      All in all, the study was performed to a high standard and the sample size in the implicit condition was large enough to draw robust conclusions. The authors make several important statistical comparisons and also report an interesting resampling approach. There is also a lot of supplemental data regarding robustness.

      Weaknesses:

      My main concern regards the small sample size in the explicit group and the lack of experimental control.

      We thank the reviewer for the valuable feedback throughout the review process. The issues mentioned here have been addressed in our previous response.

      Reviewer #3 (Public review):

      In this project, Garber and Fiser examined how the structure of incidentally learned regularities influences subsequent learning of regularities, that either have the same structure or a different one. Over a series of six online experiments, it was found that the structure (spatial arrangement) of the first set of regularities affected learning of the second set, indicating that it has indeed been abstracted away from the specific items that have been learned. The effect was found to depend on the explicitness of the original learning: Participants who noticed regularities in the stimuli were better at learning subsequent regularities of the same structure than of a different one. On the other hand, participants whose learning was only implicit had an opposite pattern: they were better in learning regularities of a novel structure than of the same one. However, when an overnight sleep separated the first and second learning phases, this opposite effect was reversed and came to match the pattern of the explicit group, suggesting that the abstraction and transfer in the implicit case were aided by memory consolidation.

      In their revision the authors addressed my major comments successfully and I commend them for that.

      Recommendations for the authors:

      Reviewer #1 (Recommendations for the authors):

      We would encourage the authors to add text to the manuscript that acknowledges/discusses the two issues pointed out in our review.

      We added relevant passages to the discussion section of the manuscript.

      Reviewer #2 (Recommendations for the authors):

      The authors have improved some sections of the manuscript and this is reflected in my assessment. The major weaknesses remain unchanged. Since my review is published alongside the paper, readers can make up their own mind regarding their severity.

      My only hard ask would be to add that the study was not preregistered into the main manuscript as I asked before! I am surprised that the authors are so reluctant to honestly state this fact....

      We have not stated this fact in our manuscript until now since our understanding is that papers that report preregistered studies state and cite their preregistration in their method section, while any omission of such a statement by default conveys that no preregistration occurred. In fact, we cannot recall encountering papers with statements of no-preregistration in the literature. Nevertheless, we have no issue stating that our study was not preregistered and per the reviewer's request, we have added such an explicit statement in our manuscript.

      Reviewer #3 (Recommendations for the authors):

      *  I strongly urge the authors to remove the Results sub-sections from Methods.

      We thank the reviewer for highlighting this issue arising from our previous layout, which we decided to handle the following way. We re-labeledl the subsections in question as “Additional Analyses” to avoid confusion, we removed any redundant findings already reported in Results of the main text, and we moved a small number of more substantial findings from the Methods Section to the main text Results as requested. We believe that this solution constitutes the most readable option, as we do not clutter the main results with extensive sanity checks and results

      of minor interest, while we also do not need to establish experiment-wise result sections in the Supplementary Materials, which would further disperse information interested readers might look for.

      *  Authors report that in Experiment 4 "Participants with explicit knowledge (n=23) show the same pattern of results as they did in Experiment 1", but that seems inaccurate, as they did learn novel pairs in Exp4 whereas they did not in Exp1. This can be seen in the figure and also in Methods-Results: "performing above chance for ... pairs of a novel structure (M=69.6, SE=5.9, d=0.69, t(22)=3.33 p=0.012, BF=13.6) in the second training phase"

      We thank the reviewer for pointing out this error in our interpretation of the results and adjusted the section in question to better align with what our result actually shows.

    1. Author response:

      The following is the authors’ response to the original reviews.

      Reviewer #1 (Public review):

      Summary:

      Multiple compounds that inhibit ATP-sensitive potassium (KATP) channels also chaperone channels to the surface membrane. The authors used an artificial intelligence (AI)-based virtual screening (AtomNet) to identify novel compounds that exhibit chaperoning effects on trafficking-deficient disease-causing mutant channels. One compound, which they named Aekatperone, acts as a low affinity, reversible inhibitor and effective chaperone. A cryoEM structure of KATP bound to Aekatperone showed that the molecule binds at the canonical inhibitory site.

      Strengths and weaknesses:

      The details of the AI screening itself are inevitably opaque, but appear to differ from classical virtual screening in not involving any physical docking of test compounds into the target site. The authors mention criteria that were used to limit the number of compounds, so that those with high similarity to known binders and 'sequence identity' (does this mean structural identity) were excluded. The identified molecules contain sulfonylurea-like moieties. How different are they from other sulfonylure4as?

      We thank the reviewers for the questions. As part of the library preparation, molecules with greater than 0.5 Tanimoto similarity in ECFP4 space to any known binders of the target protein and its homologs within 70% sequence identity were excluded to increase the possibility of identifying novel hits. After scoring and ranking the molecules by the AtomNet® technology, a diversity clustering was performed using the Butina algorithm (Butina D. Unsupervised Data Base Clustering Based on Daylight’s Fingerprint and Tanimoto Similarity: A Fast and Automated Way To Cluster Small and Large Data Sets, J. Chem. Inf. Comput. Sci. 1999, 39, 747–750) with a Tanimoto similarity cutoff of 0.35 in ECFP4 space to minimize selection of structurally similar scaffolds for the final compound buy-list. We have revised the results and methods sections to make this clear.

      Sulfonylureas are defined by their core structure comprising a sulfonyl group (–S(=O)<sub>2</sub>) and a urea moiety (–NH–CO–NH–). While some compounds identified in our study contain a sulfonamide group (R-S(=O) <sub>2</sub>-NR<sub>2</sub>), they differ structurally from sulfonylureas by lacking the key urea group and by incorporating unique R-group substitutions (we have now added this to Figure 1A legend). For example, compound C27 (Z2068224500) includes a sulfonamide group but not a urea moiety. Likewise, C45 (Aekatperone, Z1620764636) contains a sulfonamide group along with an aromatic, nitrogen-rich heterocyclic ring, but no urea group. Additionally, the R-groups in these compounds are more complex than the simple aromatic or alkyl chains typical of sulfonylureas. They include heterocyclic aromatic systems and nitrogen-rich structures, which likely influence their binding properties and lipophilicity. These structural differences suggest distinct functional and pharmacological profiles as supported by our biochemical and functional studies.

      The experimental work confirming that Aekatperone acts to traffic mutant KATP channels to the surface and acts as a low affinity, reversible, inhibitor is comprehensive and clear, with very convincing cell biological and patch-clamp data, as is the cryoEM structural analysis, for which the group are leading experts. In addition to the three positive chaperone-effective molecules, the authors identified a large number of compounds that are predicted binders but apparently have no chaperoning effect. Did any of them have inhibitory action on channels? If so, does this give clues to separating chaperoning from inhibitory effects?

      This is an interesting question. Evidence from cryo-EM, biochemical and electrophysiology studies reveal a critical role of Kir6.2 N-terminus in K<sub>ATP</sub> channel assembly and gating, and that pharmacological chaperones like glibenclamide, repaglinide, carbamazepine, and now aekatperone exert their chaperoning and inhibitory effects by stabilizing the interaction between Kir6.2 N-terminus and the SUR1-ABC core. This stabilization, while promoting the assembly of Kir6.2 and SUR1 to “chaperone” trafficking-impaired mutant channels to the cell surface, also inhibits the channel by restricting the Kir6.2 C-terminal domain from rotating to an open state. An additional mechanism by which these compounds inhibit channel activity is by preventing SUR1-NBD dimerization, which mediates physiological activation of the channel by MgADP (see review: Driggers CM, Shyng SL. Mechanistic insights on K<sub>ATP</sub> channel regulation from cryo-EM structures. J Gen Physiol. 2023 Jan 2;155(1): e202113046, PMID: 36441147). From our compound screening, we did find some compounds that showed mild inhibition of the channel by electrophysiology but no obvious chaperone effects by western blots. It is possible that small chaperoning effects of some compounds showing mild channel inhibition effects were missed due to the lower sensitivity of the western blot assay compared to electrophysiology. Alternatively, these compounds could inhibit channels by preventing SUR1NBD dimerization without stabilizing the Kir6.2 N-terminus, which is required for the chaperone effect based on our model. Unfortunately, we did not find any compounds that show chaperone effects but no channel inhibition effects, which is consistent with our understanding of how this type of K<sub>ATP</sub> chaperones work (i.e. by stabilizing Kir6.2 N-terminus interaction with SUR1’s ABC core).

      The authors suggest that the novel compound may be a promising therapeutic for treatment of congenital hyperinsulinism due to trafficking defective KATP mutations. Because they are low affinity, reversible, inhibitors. This is a very interesting concept, and perhaps a pulsed dosing regimen would allow trafficking without constant channel inhibition (which otherwise defeats the therapeutic purpose), although it is unclear whether the new compound will offer advantages over earlier low-affinity sulfonylurea inhibitor chaperones. These include tolbutamide which has very similar affinity and effect to Aekatperone. As the authors point out this (as well as other sulfonlyureas) are currently out of favor because of potential adverse cardiovascular effects, but again, it is unclear why Aekatperone should not have the same concerns.

      We thank the reviewer for the comments. This is clearly an important question to address in the future. While we have not directly tested the effects of Aekatperone on cardiac functions, we did assess its inhibitory effect on cells expressing the cardiac K<sub>ATP</sub> channel isoform (SUR2A/Kir6.2). Our results indicate that Aekatperone exhibits higher sensitivity toward the pancreatic K<sub>ATP</sub> channel isoform (SUR1/Kir6.2) compared to the cardiac isoform. However, we acknowledge that Aekatperone could still have cardiotoxic effects through its potential action on other channels, such as the hERG channel.

      It is worth noting that tolbutamide, despite its known cardiotoxic effects, does not exert these effects through cardiac K<sub>ATP</sub> channel inhibition. This has been demonstrated in studies showing no inhibitory effect of tolbutamide on SUR2A/Kir6.2 channels and on channels formed by Kir6.2 and SUR1 harboring the S1238Y mutation (also shown as S1237Y in some studies using a different SUR1 isoform)--the amino acid substitution found in SUR2A at the corresponding position (Ashfield R, Gribble FM, Ashcroft SJ, Ashcroft FM. Identification of the high-affinity tolbutamide site on the SUR1 subunit of the K<sub>ATP</sub> channel. Diabetes. 1999 Jun;48(6):1341-7, PMID: 10342826). This suggests that tolbutamide’s cardiotoxic effects might involve other targets like the hERG channel. Interestingly, tolbutamide contains a hydrophobic tail and aromatic rings that align well with the structural features for hERG interaction (Garrido A, Lepailleur A, Mignani SM, Dallemagne P, Rochais C. hERG toxicity assessment: Useful guidelines for drug design. Eur J Med Chem. 2020 Jun 1;195:112290, PMID: 32283295). In contrast, highaffinity sulfonylureas such as glibenclamide and glimepiride, which have additional benzamide moieties, are associated with lower cardiovascular risks (Douros A, Yin H, Yu OHY, Filion KB, Azoulay L, Suissa S. Pharmacologic Differences of Sulfonylureas and the Risk of Adverse Cardiovascular and Hypoglycemic Events. Diabetes Care. 2017, 40:1506-1513, PMID:

      28864502). Given these considerations, a comprehensive assessment of Aekatperone’s potential cardiotoxicity is crucial. Future studies involving in silico modeling, in vitro, and in vivo experiments will be essential to evaluate Aekatperone’s interaction with hERG and other offtarget effects. These efforts will help clarify its safety profile. This point has now been added to the Discussion.

      Reviewer #2 (Public review):

      Summary:

      In their study 'AI-Based Discovery and CryoEM Structural Elucidation of a KATP Channel Pharmacochaperone', ElSheikh and colleagues undertake a computational screening approach to identify candidate drugs that may bind to an identified binding pocket in the SUR1 subunit of

      KATP channels. Other KATP channel inhibitors such as glibenclamide have been previously shown to bind in this pocket, and in addition to inhibition KATP channel function, these inhibitors can very effectively rescue cell surface expression of trafficking deficient KATP mutations that cause excessive insulin secretion (Congenital Hyperinsulinism). However, a challenge for their utility for treatment of hyperinsulinism has been that they are powerful inhibitors of the channels that are rescued to the channel surface. In contrast, successful therapeutic pharmacochaperones (eg. CFTR chaperones) permit function of the channels rescued to the cell membrane. Thus, a key criteria for the authors' approach in this case was to identify relatively low affinity compounds that target the glibenclamide binding site (and be washed off) - these could potentially rescue KATP surface expression, but also permit KATP function.

      Strengths:

      The main findings of the manuscript include:

      (1) Computational screening of a large virtual compound library, followed by functional screening of cell surface expression, which identified several potential candidate pharmacochaperones that target the glibenclamide binding site.

      (2) Prioritization and functional characterization of Aekatperone as a low affinity KATP inhibitor which can be readily 'washed off' in patch clamp, and cell based efflux assays. Thus the drug clearly rescues cell surface expression, but can be manipulated experimentally to permit function of rescued channels.

      (3) Determination of the binding site and dynamics of this candidate drug by cryo-EM, and functional validation of several residues involved in drug sensitivity using mutagenesis and patch clamp.

      The experiments are well-conceived and executed, and the study is clearly described. The results of the experiments are very straightforward and clearly support the conclusions drawn by the authors. I found the study to provide important new information about KATP chaperone effects of certain drugs, with interesting considerations in terms of ion channel biology and human disease.

      Weaknesses:

      I don't have any major criticisms of the study as described, but I had some remaining questions that could be addressed in a revision.

      (1) The chaperones can effectively rescue KATP trafficking mutants, but clearly not as strongly as the higher affinity inhibitor glibenclamide. Is this relationship between inhibitory potency, and efficacy of trafficking an intrinsic challenge of the approach? I suspect that it may be an intractable problem in the sense that the inhibitor bound conformation that underlies the chaperone effect cannot be uncoupled from the inhibited gating state. But this might not be true (many partial agonist drugs with low efficacy can be strongly potent, for example). In this case, the approach is really to find a 'happy medium' of a drug that is a weak enough inhibitor to be washed away, but still strong enough to exert some satisfactory chaperone effect. Could some additional clarity be added in the discussion on whether the chaperone and gating effects can be 'uncoupled'.

      Thank you for the suggestion. A similar question was raised by Reviewer 1, which was addressed above (public review, point 2). We have now added more discussion to clarify this point.

      (2) Based on the western blots in Figure 2B, the rescue of cell surface expression appears to require a higher concentration of AKP compared to the concentration response of channel inhibition (~9 microM in Figure 3, perhaps even more potent in patch clamp in Figure 2C). Could the authors clarify/quantify the concentration response for trafficking rescue?

      Thank you for bringing up this observation. Indeed, the pharmacochaperone effects of Aekatperone as well as other previously published K<sub>ATP</sub> pharmacochaperones require higher concentrations compared to their inhibitory effects on surface-expressed channels. This difference likely stems from the necessity for these compounds to cross the cell membrane and interact with newly synthesized channels in the endoplasmic reticulum, where the trafficking rescue occurs. We estimate that effective pharmacochaperone activity for Aekatperone can be achieved at concentrations ranging from 50 to 100 µM in cells expressing trafficking-deficient K<sub>ATP</sub> channel mutants, higher than that required for inhibition of surface-expressed channels (~9 µM IC50). Future work could focus on medicinal chemistry modifications, for example esterification of Aekatperone (Zhou G. Exploring Ester Prodrugs: A Comprehensive Review of Approaches, Applications, and Methods. Pharmacology & Pharmacy, 2024, 15, 269-284). Once inside the cell, the esters would be cleaved by endogenous esterases to release the active compound, ensuring efficient intracellular delivery. This strategy could potentially improve membrane permeability and bioavailability of the compound, which would lower the required concentrations to achieve desired chaperoning effects.

      (3) A future challenge in the application of pharmacochaperones of this type in hyperinsulinism may be the manipulation of chaperone concentration in order to permit function. In experiments it is straightforward to wash off the chaperone, but this would not be the case in an organism. I wondered if the authors had attempted to rescue channel function with diazoxide ine presence of AKP, rather than after washing off (ie. is AKP inhibition insurmountable, or can it be overcome by sufficient diazoxide).

      Thank you for raising this important point. We have previously shown (Martin GM et al. Pharmacological Correction of Trafficking Defects in ATP-sensitive Potassium Channels Caused by Sulfonylurea Receptor 1 Mutations. J Biol Chem. 2016, 291: 21971-21983, PMID: 27573238) that diazoxide, which stabilizes K<sub>ATP</sub> channels in an open conformation, also reduces physical association between Kir6.2 N-terminus and SUR1 as demonstrated by reduced crosslinking of engineered azido-phenylalanine (an unnatural amino acid) at Kir6.2 N-terminal amino acid 12 position to SUR1. Incubating cells with diazoxide did not rescue the trafficking mutants but actually further reduced the maturation efficiency of trafficking mutants. For this reason, we did not include diazoxide during Aekatperone incubation and instead added diazoxide after Aekatperone washout to potentiate the activity of mutant channels rescued to the cell surface. In vivo, we envision testing alternating Aekatperone and diazoxide dosing to maximize functional rescue of K<sub>ATP</sub> trafficking mutants.

      (4) Do the authors have any information about the turnover time of KATP after washoff of the chaperone (how stable are the rescued channels at the cell surface)? This is a difficult question to probe when glibenclamide is used as a chaperone, but maybe much simpler to address with a lower affinity chaperone like AKP.

      Thank you for your thoughtful comment. While we have not yet tested the duration of rescued K<sub>ATP</sub> channels at the cell surface following Aekatperone washout, we have conducted similar studies with carbamazepine (Chen PC et al. Carbamazepine as a novel small molecule corrector of trafficking-impaired ATP-sensitive potassium channels identified in congenital hyperinsulinism. J Biol Chem. 2013, 288: 20942-20954, PMID: 23744072), another compound exhibiting reversible inhibitory and chaperone effects (apparent affinity between glibenclamide and Aekatperone). Our previous findings with carbamazepine showed that in cultured cells its chaperone effects were detectable as early as 1 hour and peaked around 6 hours after treatment. Furthermore, when carbamazepine was removed following a 16-hour treatment, the rescue effect persisted for up to 6 hours post-drug removal. These results provide a potential duration of the surface expression rescue effects of reversible pharmacochaperones.

      Reviewer #1 (Recommendations for the authors):

      The paper is well-written and comprehensive with only very minor essentially copy-editing needed. That said, it would be good if the authors could answer the main points raised above:

      (1) What is the relevant Tanimoto parameters and sequence identity (does this mean structural identity) for the identified compounds?

      As we answered above in response to the overall assessment, to facilitate the identification of novel hits, molecules with greater than 0.5 Tanimoto similarity in ECFP4 space to any known binders of the target protein and its homologs within 70% amino acid sequence identity were excluded from the commercial library. Additionally, after scoring and ranking the molecules by the AtomNet® technology, a diversity clustering was performed on the top 30,000 molecules using the Butina algorithm with a Tanimoto similarity cutoff of 0.35 in ECFP4 space to minimize selection of structurally similar scaffolds for the final compound buy-list.

      (2) Did any of the identified putative binders have inhibitory action on channels? If so, does this give clues to separating chaperoning from inhibitory effects?

      Please see response to the same question in the overall assessment above.

      (3) Acknowledge that the identified compounds contain sulfonylurea-like moieties, and address why Aekatperone should (or perhaps does not) offer anything advantage over low affinity sulfonrylureas such as tolbutamide?

      Please see response to the same question in the overall assessment above.

      Reviewer #2 (Recommendations for the authors):

      Thank you for assembling the interesting study, which I felt was well designed and communicated. The diverse approaches used in the study, with consistent findings, were definitely a strength. The core findings are also well distilled in the main body of the text, and although there is quite a lot of supplementary information, I felt that it was presented appropriately and well selected in terms of what would be important for readers hoping to learn more. In addition to the questions described above, I only had a few minor editorial issues that could be fixed related to presentation.

      (1) Figure 1B. The colours and resolution of the chemical structures are difficult to see clearly and could be improved.

      We have revised the figure accordingly.

      (2) This is a minor wording point... first sentence of the discussion describes the drugs as pancreatic-selective, when it would be more clear to describe them as selective for the pancreatic isoform of KATP (Kir6.2/SUR1), or perhaps better as 'exhibiting ~4-5 fold selective for SUR1-containing KATP channels vs. SUR2A or SUR2B'.

      We have changed the wording as suggested.

      (3) As a curiosity (not necessary to do more experiments), but I am curious if the authors know whether there is any meaningful enhancement of trafficking of WT channels by AKP.

      All pharmacochaperones we have identified to date including Aekatperone also slightly enhance WT channel surface expression (10-20%).

      Reviewing editor recommendations:

      (1) Given the modest resolution of the EM reconstruction, it is perhaps not entirely clear how AKP was assigned to the density observed. Specifically, it would be helpful to include a comparison of an AKP-free map and the current AKP map (filtered to a similar resolution) showing slice views of densities in the region around the inferred binding site. This would be very helpful in ascertaining whether the cryoEM reconstruction is an independent validation of the computational and functional experiments or whether the density inference depends on the additional knowledge.

      We appreciate the editor’s suggestion. We have now added a Supplemental Figure (Supplementary Figure 7 in the revised manuscript) that compares our AKP-free cryoEM density deposited previously to the EMDB (EMD-26320) and the AKP-bound cryoEM density from this study, with cryoEM density (filtered to the same resolution) superimposed on the structural model.

      (2) It could help to mention in brief what is a probable mechanism of AKP inhibition - that is how after binding of AKP, channel opening is restricted. Is it similar to that of other site A ligands?

      Based on the strong Kir6.2 N-terminal cryoEM density observed in our AKP map, AKP most likely inhibits K<sub>ATP</sub> channels by trapping the Kir6.2 N-terminus in the central cavity of SUR1’s ABC core thus preventing Kir6.2-C-terminal domain from rotating to an open conformation, similar to other ligands that stabilize the Kir6.2 N-terminus-SUR1 interface by binding to site A (such as tolbutamide and AKP), site B (such as repaglinide), or both site A and site B (such as glibenclamide). We have now included this in the revised Results and Discussion sections.

      (3) In the context of the MD simulations, do other site A ligands (which from my understanding bind at a similar site) also exhibit similar flexibility as AKP? If there is information available on the flexibility of ligands of varying affinities, bound to the same site, maybe some correlative inferences can be drawn? However, in MD simulation trajectories it is not entirely uncommon for a ligand to simply get trapped in a local energy well. Since the authors have performed significant analysis of their MD results it could be worth mentioning/discussing such phenomena.

      Previously published MD data addressing ligand dynamics, such as glibenclamide in the SUR1 pocket (Walczewska-Szewc K, Nowak W. Photo-Switchable Sulfonylureas Binding to ATPSensitive Potassium Channel Reveal the Mechanism of Light-Controlled Insulin Release. J Phys Chem B. 2021, 125: 13111-13121, PMID: 34825567), indicate a certain degree of flexibility. Unfortunately, we cannot directly compare these results, as the simulations were performed without the KNtp domain in the SUR1 cavity, which partially contributes to ligand stabilization. This is an issue we plan to investigate in the future.

      In this study, we ran five independent MD simulations, each 500 ns long, resulting in a total of 2.5 μs of simulation time. Across all replicates, the ligand stayed in the same position, with variations mainly in the dynamics of the blurred segment. Considering the length of the simulations and the consistency across the runs, we believe this binding pose is stable and represents a global (or at least highly stable) energy minimum, consistent with the cryo-EM data.

      (4) In electrophysiological assays, 10 uM AKP seems to inhibit all currents (Figure 2), but in the Rb+ flux assay ~10 uM appears to be the IC50. The reason for this difference is not entirely clear and it would help to comment on this.

      Thank you for noticing the difference. The initial electrophysiological experiments were conducted using the very small amount of AKP provided to us from Atomwise. We estimated the concentration of the reconstituted AKP the best we could, but the concentration was likely to not be very accurate due to difficulty in handling the very small amount of the AKP powder. Subsequent Rb<sup>+>/sup> efflux experiments were conducted using a different, larger batch of AKP we purchased from Enamine. We have now stated this in the Methods section.

    1. Author response:

      The following is the authors’ response to the original reviews.

      Reviewer #1 (Public review):

      Summary:

      As reported above, this paper by Xu et al reports on a new method to combine the analysis of coevolutionary patterns with dynamic profiles to identify functionally important residues and reveal correlations between binding sites.

      Strengths:

      In general, coevolutionary analysis and MD analysis are carried out separately and while there have been attempts to compare the information provided by the two, no unified framework exists. Here, the authors convincingly demonstrate that integrating signals from Dynamics and coevolution gives information that substantially overcomes the one provided by either method in isolation. While other methods are useful, they do not capture how dynamics is fundamental to define function and thus sculpts coevolution, via the 3D structure of the protein. At the same time, the authors demonstrate how coevolution in turn also influences internal dynamics. The Networks they rebuild unveil information at an even higher level: the model starts pairwise but through network representation the authors arrive to community analysis, reporting on interaction patterns that are larger than simple couples.

      Weaknesses:

      The authors should

      - Make an effort in suggesting/commenting the limits of applicability of their method;

      We have added a sentence on Page 17, line 15 that describes the limitation of our method.

      - Expand discussion on how DyNoPy compares to other methods;

      A paragraph has been added to explain the comparison with other models (Page 3, line 18)

      - Dynamic is not essential in all systems (structural proteins): The authors may want to comment on possible strategies they would use for other systems where their framework may not be suitable/applicable.

      We agree with the reviewer that dynamics is not essential in all systems. In systems where there is limited role of dynamics in the function, the analysis done with DyNoPy is equivalent to conventional coevolution analysis, which can be consider one limitation of our method. Conversely, for dynamic proteins, combining functional dynamics descriptors with coevolution analysis using DyNoPy, helps in denoising information by deconvolution of communities. We have included this in the manuscript to highlight the suitability/applicability of the method.

      Further, we have added a paragraph in the Introduction and conclusions highlighting the main difference between DyNoPy and existing computational tools like DCCM, KIN, and SPM and for your convenience it is provided below:

      “Functional sites are often regulated by both, local and global interactions. Changes in these interactions are instrumental for functional events like substrate binding, catalysis, and conformational changes (18). The development of physical models of protein dynamics and the increase in available computational power has stimulated the adoption of computational techniques (19, 20) to investigate the conformational dynamics of proteins, an essential component of the many biological functions (21, 22). Different models have been proposed to describe the interactions between residues during simulations and network models have been particularly popular,  including methods on single structures and MD simulations data built by analysing the response to external forces on residue networks (23), by estimating the prevalence of non-covalent energy interaction networks in homologous proteins (24), or by analysing linear or non-linear correlation in atomic fluctuations (25, 26). These techniques have demonstrated their usefulness in extracting allosteric networks from structural data with applications in enzyme design (26).”

      Reviewer #2 (Public review):

      Summary:

      Authors introduced a computational framework, DyNoPy, that integrates residue coevolution analysis with molecular dynamics (MD) simulations to identify functionally important residues in proteins. DyNoPy identifies key residues and residue-residue coupling to generate an interaction graph and attempts to validate using two clinically relevant β-lactamases (SHV-1 and PDC-3).

      Strengths:

      DyNoPy could not only show clinically relevance of mutations but also predict new potential evolutionary mutations. Authors have provided biologically relevant insights into protein dynamics which can have potential applications in drug discovery and understanding molecular evolution.

      Weaknesses:

      Although DyNoPy could show the relevance of key residues in active and non-active site residues, no experiments have been performed to validate their predictions.

      We thank the reviewer for highlighting this point. We acknowledge that direct experimental validation of our predictions for DyNoPy has not yet been performed. However, we have provided explanations and evidence from experiments conducted on closely related homologs to support the relevance of key residues. These homologs share significant structural and functional similarity, which strengthens the reliability of our predictions.

      In addition, they should compare their method with conventional techniques and show how their method could be different.

      We thank all the reviewers for highlighting this oversight on our behalf. In Introduction and conclusion, we have added the following paragraphs:

      “Functional sites are often regulated by both, local and global interactions. Changes in these interactions are instrumental for functional events like substrate binding, catalysis, and conformational changes (18). The development of physical models of protein dynamics and the increase in available computational power has stimulated the adoption of computational techniques (19, 20) to investigate the conformational dynamics of proteins, an essential component of the many biological functions (21, 22). Different models have been proposed to describe the interactions between residues during simulations and network models have been particularly popular,  including methods on single structures and MD simulations data built by analysing the response to external forces on residue networks (23), by estimating the prevalence of non-covalent energy interaction networks in homologous proteins (24), or by analysing linear or non-linear correlation in atomic fluctuations (25, 26). These techniques have demonstrated their usefulness in extracting allosteric networks from structural data with applications in enzyme design (26). ”

      An explanation of "communities" divided in the work and how these communities are relevant to the article should be provided. In addition, choice of collective variables and their relevance in residue coupling movement is also not very well explained. Dynamics cross correlation map can also be a good method for understanding the residue movements and can explain the residue-residue coupling, it is not explained how DyNoPy is different from the conventional methods or can perform better.

      The following sentences have been included in the manuscript to address the questions raised by the reviewer:

      On Community Definition and relevance

      DyNoPy identified coevolving residue pairs (scaled coevolution score >1) with interactions strongly correlated with protein functional motions (i.e., J values larger than zero). Applying network analysis on the combined dynamics-coevolution matrix helps us extracting higher-order interactions beyond pairwise coupling and detecting critical residues, which show multiple interactions with each other. Moreover, indirect long-range relationships, which would be hard to identify from numerical data, could be detected through community clustering. Community-based analysis offers a more comprehensive understanding of residue relationships and enables the visualization of residue couplings on the protein structure.

      On Choice of collective variables:

      DyNoPy works on the assumption that time-dependent interactions between critical residues, either having significant structural change or not will correlate with functional conformational motions. Since MD simulation data is high-dimensional, a time-dependent dynamic descriptor is required to extract the most relevant information for the process under study. A good collective variable (CV) should appropriately describe protein functional motions. Thus, a CV that detects the highest number of residue couplings is expected to be the most suitable descriptor (Mentioned in Page 22 Line 14). In our study, we tested 12 CVs, either focusing on the entire protein or on selected regions. And the best performed CV (the one identified the most residue couplings) was selected for further analysis. In practical applications, users can decide whether to focus on the most relevant global or local dynamics descriptor  depending on the dynamics of their specific system.

      We have added a paragraph in the Introduction differentiating DyNoPy with other methods including DCCM. DCCM differs from DyNoPy in two aspects 1) it does not account for inter-residue coevolution 2) the correlation matrix captures correlations of atomic/residue movements associated with the whole intrinsic dynamics of the system, without filtering for the contributions to the important motions involved in the biological function. Additionally, any residue pair contributing to functional motion without itself undergoing any structural change will not be visible in this approach.

      In the sentence "DyNoPy identified eight significant communities of strongly coupled residues within SHV-1 (Supporting Fig. S4A)" I could not find a clear description of eight significant communities.

      The following sentences have been included in the results, methods and figure legends that define ‘significant community’:

      ‘DyNoPy identified eight meaningful communities, each consisting of at least three strongly coupled residues within SHV-1 (Supplementary Fig. S4A). All crucial catalytic residues and critical substitution sites previously mentioned participating in one of these communities with the exceptions of R<sub>43</sub>, R<sub>202</sub>, and S<sub>130</sub>.’ (Page 8 Line 28)

      ‘A meaningful community should contain at least three residues.’ (Page 21 Line 2)

      ‘A reasonable residue community should contain at least three residues.’ (SI Page 11)

      Again the description of communities is not clear to me in the following sentence "Detailed description of the other three communities is provided in the supporting information (Fig. S6)."

      This following sentence has been rewritten.

      ‘Detailed description of communities with secondary importance for protein function (community 3, 8, and 9) is provided in the supplementary information (Supplementary Fig. S6).’ (Page 9, line 8)

      In the sentence "N170 acts as an intermediary between N136 and E166". Kindly cite the reference figure to show N179 as intermediate residue.

      This sentence has been rewritten to avoid any confusion.

      ‘Although DyNoPy did not detect this direct interaction between N136 and E166, the established relationship between N136 and N170 highlights the role of N136 in influencing E166.’ (Page 10 Line 8)

      Please be careful with the numbers. In the sentence "These residues not only interact with each other directly but are also indirectly coupled via 21 other residues." I could count 22 other residues and not 21.

      We thank the reviewer for spotting this error. This has now been corrected. All the communities are counted again.

      ‘These residues not only interact with each other directly but are also indirectly coupled via 22 other residues.’ (Page 12 Line 14)

      In the sentence "Unlike other substitution sites that are adjacent to the active site, R<sub>205</sub> is situated more than 16 Å away from catalytic serine S<sub>70</sub>". Please add this label somewhere in the figure.

      The figure legends have been updated to include this. Distances have been added to community 4 Fig. 3 and community 6 Fig. 4. Residue index in the legend of Fig.3 has been included as subscript. Distance in the main text has been changed to be more accurate.

      ‘G<sub>156</sub> and A<sub>146</sub> are two functional important residues distant from the active site. G<sub>156</sub> is 21.3Å away from the catalytic S<sub>70</sub>. A<sub>146</sub> is 16.8Å away from S<sub>70</sub>.’ (Page 12 Line 2)

      ‘R<sub>205</sub> is a functional important residue that is 20.6Å away from the active site S<sub>70</sub>.’ (Page 13 Line 10)

      Please cite a reference in the sentence "This indicates that mutations on G238 would result in an alteration on protein catalytic function, as well as an increased flexibility of the protein, which strongly aligns with previous finding."

      The citation has been added

      ‘This indicates that mutations on G238 would result in an alteration on protein catalytic function, as well as an increased flexibility of the protein, which strongly aligns with previous finding (62).’ (Page 15 Line 2)

      Reviewer #3 (Public review):

      Summary:

      In this paper, Xu, Dantu and coworkers report a protocol for analyzing coevolutionary and dynamical information to identify a subset of communities that capture functionally relevant sites in beta-lactamases.

      Strengths:

      The combination of coevolutionary information and metrics from MD simulations is interesting for capturing functionally relevant sites, which can have implications in the fields of drug discovery but also in protein design.

      Weaknesses:

      The combination of coevolutionary information and metrics from MD simulations is not new as other protocols have been proposed along the years (the current version of the paper neglects some of them, see below), and there are a few parameters of the protocol that, in my opinion, should be better analyzed and discussed.

      (1) As mentioned, the introduction of the paper lacks some important publications in the field of using graph theory to represent important interaction networks extracted from MD simulations (DOI: 10.1002/pro.4911), and also combining MD data with MSA to identify functionally relevant sites for enzyme design (doi: 10.1021/acscatal.4c04587, 10.1093/protein/gzae005).

      We are very grateful for pointing us to these references. We have added a paragraph in the Introduction mentioning these and other computational tools similar to DyNoPy. Further, in conclusion we have highlighted the differences between DyNoPy and existing tools.

      (2) The matrix used to apply graph theory (J_ij) is built from summing the scaled coevolution and degree of correlation values. The alpha and beta weights are defined, and the authors mention that alpha is set to 0.5, thus beta as well to fulfil with the alpha + beta = 1. Why a value of 0.5 has been selected? How this affects the overall results and conclusions extracted? The finding that many catalytically relevant residues are identified in the communities is not surprising given that such sites usually present a high conservation score.

      This is an excellent question. Our present formulation allows the user to easily assess the influence of coevolution and dynamic couplings on the output. Setting alpha to 0.5, weights both evolutionary and dynamics information equally and has shown promising results in SHV-1 and PDC-3. As it has been presented in the manuscript, setting alpha to 1, i.e., purely utilising coevolution data does not let us identify critical residues effectively as all residues are included in the set (Supplementary Fig. S4 and S5). In future work, we would like to investigate the effect of scanning alpha from 0 to 1 on the final residue list, possibly on a larger set of proteins and protein families.

      We would also like to point out that some of the residue pairs with coevolution scores in the top 1% have J-scores set to 0, as they lacked significant coupling to the functional dynamics.

      (3) Another important point that needs further explanation is the selection of the relevant descriptor of protein dynamics. In this study two different strategies have been used (one more global the other more local), but more details should be provided regarding their choice. What is the best strategy according to the authors? Why not using the same strategy for both related systems? The obtained results using one methodology or the other will have a large impact on the dynamical score. Another related point is: what is the impact of the MD simulation length, how the MSA is generated and number of sequences used for MSA construction?

      As in the case of many complex proteins, the flow of information occurs in β-lactamases via structural interactions (https://doi.org/10.7554/eLife.66567). These interactions occur both on a local level, as in the case of binding site residues or residues immediately surrounding the binding site; however, there are interactions far away (>20Å) from the binding site that have the ability to alter function. We have obtained this information from extensive surveys of clinical isolates and experimental data. To account for such interactions, a more global approach has to be taken. To answer the reviewer’s question: each system is unique and there is no one-fixed strategy. In short, the method used should be able to denoise information and the user is advised to fine-tune their findings by corroborating with experimental and clinical information.

      The length of MD simulations is also system specific. Some systems effectively sample the functional dynamics within a shorter simulation time, while others take a long timescale MD simulation to converge. The results won’t change as long as the simulation has effectively sampled the functional dynamics associated with biological function.

      The MSA is generated by the HH-Suite package as mentioned on Page 19 Line 19. More specifically, the MSA is constructed based on the UniRef30 database, where sequences are clustered, and each cluster contains sequences with at least 30% sequence identity. This provides a non-redundant set of protein sequences. Our package allows the automatic generation of MSAs from the database. For SHV-1, the alignment contains 18,175 protein sequences and for PDC-3, the alignment consists of 27,892 protein sequences. Full details of this protocol are published in Bibik et al. (https://doi.org/10.1093/bioinformatics/btae166). We have revised the methods section to include these details.

      Other Minor Alterations

      ‘Fig. S1 and S2’ has been changed to ‘Supplementary Fig. S1 and S2’ for consistency (Page 6 Line 12)

      (1) ‘Figure 5B’ has been changed to ‘Fig. 5B’ for consistency (Page 16 Line 11)

      (2) All the ‘Figure’ has been changed to ‘Fig.’ in the SI for consistency

      (3) Just as the suggestion, an alteration has been made on the Step 1 of Fig.1.

    1. Author response:

      Reviewer #1 (Evidence, reproducibility and clarity):

      Summary:

      In this manuscript, Hammond et al. study robustness of the vertebrate segmentation clock against morphogenetic processes such as cell ingression, cell movement and cell division to ask whether the segmentation clock and morphogenesis are modular or not. The modularity of these two would be important for evolvability of the segmenting system. The authors adopt a previously proposed 3D model of the presomitic mesoderm (Uriu et al. 2021 eLife) and include new elements; different types of cell ingression, tissue compaction and cell cycles. Based on the results of numerical simulations that synchrony of the segmentation clock is robust, the authors conclude that there is a modularity in the segmentation clock and morphogenetic processes. The presented results support the conclusion. The manuscript is clearly written. I have several comments that could help the authors further strengthen their arguments.

      Major comment: 

      [Optional] In both the current model and Uriu et al. 2021, coupling delay in phase oscillator model is not considered. Given that several previous studies (e.g. Lewis 2003, Herrgen et al. 2010, Yoshioka-Kobayashi et al. 2020) suggested the presence of coupling delays in DeltaNotch signaling, could the authors analyze the effect of coupling delay on robustness of the segmentation clock against morphogenetic processes?

      We thank the reviewer for the suggestion. Owing to the computational demands of including such a delay in the model, we cannot feasibly repeat every simulation analysed here in the presence of delay, and would like to note that the increased computational demand that delays put on the simulations is also the reason why Uriu et al 2021 did not include it, as stated in their published exchange with reviewers. However, analogous to our analysis in figure 7, we can analyse how varying the position of progenitor cell ingression affects synchrony in the presence of the coupling delay measured in zebrafish by Herrgen et al. (2010). We show this analysis in a new figure 8 (8B, specifically), on page 21, and discuss its implications in the text on pages 2022. Our analysis reveals that the model cannot recover synchrony using the default parameters used by Uriu et al. (2021) and reveal a much stronger dependence on the rate of cell mixing (vs) than shown in the instantaneous coupling case (cf. figure 7). However, by systematically varying the value of the delay we find that a relatively minor increase in the delay is sufficient to recover synchrony using the parameter set of Uriu et al. (see figure 8C). Repeating this across the three scenarios of cell ingression we see that the combination of coupling strength and delay determine the robustness of synchrony to varying position of cell ingression. This suggests that the combination of these two parameters constrain the evolution of morphogenesis.

      Minor comments: 

      -  PSM radius and oscillation synchrony are both denoted by the same alphabet r. The authors should use different alphabets for these two to avoid confusion.

      We thank the reviewer for spotting this. This has now been changed throughout to rT, as shorthand for ‘radius of tissue’.

      -  page 5 Figure 1 caption: (x-x_a/L) should be (x-x_a)/L.

      We thank the reviewer for spotting this. This has now been corrected.

      -  Figure 3C: Description of black crosses in the panels is required in the figure legend.

      Thank you for spotting this. The legend has now been corrected.

      -  Figure 3C another comment: In this panel, synchrony r at the anterior PSM is shown. It is true that synchrony at anterior PSM is most relevant for normal segment formation. However, in this case, the mobility profile is changed, so it may be appropriate to show how synchrony at mid and posterior PSM would depend on changes in mobility profile. Is synchrony improved by cell mobility at the region where cell ingression happens?

      We thank the reviewer for the suggestion. We have now plotted the synchrony along the AP axis for varying motility profiles, and this can be seen in figure 3 supplement 1, and is briefly discussed in the text on page 11. We show that while the synchrony varies with x-position (as already expected, see figure 2), there is no trend associated with the shape of the motility profile.

      -  In page 12, the authors state that "the results for the DP and DP+LV cases are exactly equal for L = 185 um, as .... and the two ingression methods are numerically equivalent in the model". I understood that in this case two ingression methods are equivalent, but I do not understand why the results are "exactly" equal, given the presence of stochasticity in the model.

      These results can be exactly equal despite the simulations being stochastic because they were both initialised using the same ‘seed’ in the source code. However, we now see that this might be confusing to the reader, and we have re-generated this figure but this time initialising the simulations for each ingression scenario using a different seed value. This is now reflected in the text on page 12 and in figure 4.

      -  The authors analyze the effect of cell density on oscillation synchrony in Fig. 4 and they mention that higher density increases robustness of the clock by increasing the average number of interacting neighbours. I think it would be helpful to plot the average number of neighbouring cells in simulations as a function of density to quantitatively support the claim.

      We thank the reviewer for their suggestion. Distributions of neighbour numbers for exemplar simulations with varying density can now be found in  figure 4 supplementary figure 1 and are referred to in the text on page 11.

      -  The authors analyze the effect of PSM length on synchrony in Fig. 4. I think kymographs of synchrony r as shown in Fig. 2D would also be helpful to show that indeed cells get synchronized while advecting through a longer PSM.

      We thank the reviewer for their suggestion and agree that visualising the data in this way is an excellent idea. We have generated the suggested kymographs and added them to figure 4 as supplements 2 and 4, and discussed these results in the text on page 12.

      -  I understand that cells in M phase can interact with neighboring cells with the same coupling strength kappa in the model, although their clocks are arrested. If so, this aspect should be also mentioned in the main text in page 16, as this coupling can be another noise source for synchrony.

      We agree this is an important clarification. We explicitly state this, and briefly justify our choice, in the text on page 16.

      -  Figure 5-figure supplement 2: panel labels A, B, C are missing. 

      Thank you for bringing this to our attention. These have now been added.

      – Figure 5-figure supplement 3: panel labels A, B, C are missing.

      Thank you for bringing this to our attention. These have now been added.

      Reviewer #1 (Significance):

      Synchronization of the segmentation clock has been studied by mathematical modeling, but most previous studies considered cells in a static tissue without morphogenesis. In the previous study by Uriu et al. 2021, morphogenetic processes such as cell advection due to tissue elongation, tissue shortening, and cell mobility were considered in synchronization. The current manuscript provides methodological advances in this aspect by newly including cell ingression, tissue compaction and cell cycle. In addition, the authors bring a concept of modularity and evolvability to the field of the vertebrate segmentation clock, which is new. On the other hand, the manuscript confirms that the synchronization of the segmentation clock is robust by careful simulations, but it does not propose or reveal new mechanisms for making it robust or modular. The main targets of the manuscript will be researchers working on somitogenesis and evolutionary biologists who are interested in evolution of developmental systems. The manuscript will also be interested by broader audiences, like developmental biologists, biophysicists, and physicists and computer scientists who are working on dynamical systems.

      We thank the reviewer for their interest in our manuscript and for acknowledging us as one of the first to address the modularity and evolvability of somitogenesis. We hope that this work will encourage others to think about these concepts in this system too.  

      In the original submission, we identified a high enough coupling strength as the main mechanism underlying the identified modularity in somitogenesis. Since, we have included an analysis of the coupling delay and find that it is the interplay between coupling strength and coupling delay that mediate the identified modularity, allowing PSM morphogenesis and the segmentation clock to evolve independently in regions of parameter space that are constrained and determined by the interplay between these two parameters. We have now added an extra figure (figure 8) where we explore this interplay and have discussed it at length in the last section of the results and in the discussion. We again thank the reviewer for encouraging us to include delays in our analysis.

      Reviewer #2 (Evidence, reproducibility and clarity):

      SUMMARY 

      The manuscript from Hammond et al., investigates the modularity of the segmentation clock and morphogenesis in early vertebrate development, focusing on how these processes might independently evolve to influence the diversity of segment numbers across vertebrates.

      Methodology: The study uses a previously published computational model, parameterized for zebrafish, to simulate and analyse the interactions between the segmentation clock and the morphogenesis of the pre-somitic mesoderm (PSM). Their model integrates cell advection, motility, compaction, cell division, and the synchronization of the embryo clock. Three alternative scenarios of PSM morphogenesis were modeled to examine how these changes affect the segmentation clock.

      Model System: The computational model system combines a representation of cell movements and the phase oscillator dynamics of the segmentation clock within a three-dimensional horseshoe-shaped domain mimicking the geometry of the vertebrate embryo PSM. The parameters used for the mathematical model are mostly estimated from previously published experimental findings.

      Key Findings and Conclusions: (1) The segmentation clock was found to be broadly robust against variations in morphogenetic processes such as cell ingression and motility; (2) Changes in the length of the PSM and the strength of phase coupling within the clock significantly influenced the system's robustness; (3) The authors conclude that the segmentation clock and PSM morphogenesis exhibited developmental modularity (i.e. relative independence), allowing these two phenomena to evolve independently, and therefore possibly contributing to the diverse segment numbers observed in vertebrates.

      MAJOR COMMENTS

      (1) The key conclusion drawn by the authors (that there is robustness, and therefore modularity, between the morphogenetic cellular processes modeled and the embryo clock synchronization) stems directly from the modeling results appropriately presented and discussed in the manuscript. The model comprises some strong assumptions, however all have been clearly explained and the parameterization choices are supported by experimental findings, providing biological meaning to the model. Estimated parameters are well explained and seem reasonable assumptions (from the embryology perspective).

      We thank the reviewer for their positive comments about our work

      (2) This study, as is, achieves its proposed goal of evaluating the potential robustness of the embryo clock to changes in (some) morphogenetic processes. The authors do not claim that the model used is complete, and they properly identify some limitations, including the lack of cellcell interactions. Given the recognized importance of cellular physical interactions for successful embryo development, including them in the model would be a significant addition in future studies.

      We would like to clarify that the model does include cell-cell interactions as cells interact with their neighbours’ clock phase to synchronise and to avoid occupying the same physical space. 

      (3) The authors have deposited all the code used for analysis in a public GitHub repository that is updated and available for the research community.

      We support open source coding practices.

      (4) In page 6, the authors justify their choice of clock parameters for cells ingressing the PSM: "As ingressing cells do not appear to express segmentation clock genes (Mara et al. (2007)), the position at which cells ingress into the PSM can create challenges for clock patterning, as only in the 'off' phase of the clock will ingressing cells be in-phase with their neighbours."  However, there are several lines of evidence (in chick and mouse), that some oscillatory clock genes are already being expressed as early as in the gastrulation phase (so prior to PSM ingression) (Feitas et al, 2001 [10.1242/dev.128.24.5139]; Jouve et al, 2002 [10.1242/dev.129.5.1107]; Maia-Fernandes at al, 2024 [10.1371/journal.pone.0297853]) Question: Is this also true in zebrafish? (I.e. is there any recent experimental evidence that the clock genes are not expressed at ingression, since the paper cited to support this assumption is from 2007). If they are expressed in zebrafish (as they are in mouse and chick), then the cell addition should have random clock gene periods when they enter the PSM and not start all with a constant initial phase of zero. Probably this will not impact the results since the cells will also be out of phase with their neighbours when they "ingress", however, it will model more closely the biological scenario (and avoid such criticism).

      We thank the reviewer for their comments. While it is known that in zebrafish the clock begins oscillating during epiboly and before the onset of segmentation (Riedel-Kruse et al., 2007), to our knowledge no-one has examined whether posteriorly or laterally ingressing progenitor cells express clock genes prior to their ingression into the PSM, which occurs later in development than the first oscillations which give rise to the first somites. We have not found any published evidence of her/hes gene expression in the dorsal donor tissues or lateral tissues surrounding the PSM, however we acknowledge that this has not been actively studied before and our assumption relies on an absence of evidence, rather than evidence of absence. 

      However, we agree with the reviewer that one should include such an analysis for completeness, and we have now generated additional simulations where progenitor cells ingress with a random clock phase. This data is presented in figure 2 supplement 1 and mentioned in the main text on page 9.

      MINOR COMMENTS 

      (1) The citations are appropriate and cover the major labs that have published work related to this study (although with some overrepresentation of the lab that published the model used).

      We have cited the vast literature on somitogenesis to the best of our ability and do recognise that the work of the Oates lab appears prominently, but this is probably because their experimental data were originally used to parametrise the model in Uriu et al. 2021.

      (2) The text is clear, carefully written, and both the methods and the reasoning behind them are clearly explained and supported by proper citations.

      We are very glad to see that the reviewer found that the manuscript was clearly presented.

      (3) The figures are comprehensive, properly annotated, with explanatory self-contained legends. I have no comments regarding the presentation of the results.

      Thank you

      (4) Minor suggestions: 

      a. Page 26: In the Cell addition sub-section of the Methods section, correct all instances where the word domain is used, but subdomain should be used (for clarity and coherence with the description of the model, stated as having a single domain comprising 3 subdomains).

      We thank the reviewer for raising this, this is a good point. We have now corrected to ‘subdomain’ where appropriate.

      b. Page 32: Table 1. Parameter values used in our work, unless otherwise stated -> Suggestion: Add a column with the individual citations used for each parameter (to facilitate the confirmation of each corresponding reference).

      Thank you for the suggstion, we have now done this (see table 1 page 36).

      Reviewer #2 (Significance):

      GENERAL ASSESSMENT 

      This study uses a previously published model to simulate alternative scenarios of morphogenetic parameters to infer the potential independence (termed here modularity) between the segmentation clock and a set of morphogenetic processes, arguing that such modularity could allow the evolution of more flexible body plans, therefore partially explaining the variability in the number of segments observed in the vertebrates. This question is fundamental and relevant, yet still poorly researched. This work provides a comprehensive simulation with a model that tries to simplify the many morphogenetic processes described in the literature, reducing it to a few core fundamental processes that allow drawing the conclusions seeked. It provides theoretical insight to support a conceptual advance in the field of evolutionary vertebrate embryology.

      ADVANCE

      This study builds on a model recently published by Uriu et al. (eLife, 2021) that incorporates quantitative experimental data within a modeling framework including cell and tissue-level parameters, allowing the study of multiscale phenomena active during zebrafish embryo segmentation. Uriu's publication reports many relevant and often non-intuitive insights uncovered by the model, most notably the description of phase vortices formed by the synchronizing genetic oscillators interfering with the traveling-wave front pattern.  However, this model can be further explored to ask additional questions beyond those described in the original paper. A good example is the present study, which uses this mathematical framework to investigate the potential independence between two of the modeled processes, thereby extracting extra knowledge from it. Accordingly, the present study represents a step forward in the direction of using relevant theoretical frameworks to quantitatively explore the landscape of complex molecular hypotheses in silico, and with it shed some light on fundamental open questions or inform the design of future experiments in the lab.

      The study incorporates a wide range of existing literature on the developmental biology of vertebrates. It comprehensively cites prior work, such as the foundational studies by Cooke and Zeeman on the segmentation clock and the role of FGF signaling in PSM development as discussed by Gomez et al. The literature properly covers the breadth of knowledge in this field.

      AUDIENCE

      Target audience | This study is relevant for fundamental research in developmental biology, specifically targeting researchers who focus on early embryo development and morphogenesis from both experimental and theoretical perspectives. It is also relevant for evolutionary biologists investigating the genetic factors that influence vertebrate evolution, as well as to computational biologists and bioinformatics researchers studying developmental processes and embryology.

      Developmental researchers studying the segmentation clock in other vertebrate model organisms (namely mouse and chick), will find this publication especially valuable since it provides insights that can help them formulate new hypotheses to elucidate the molecular mechanisms of the clock (for example finding a set of evolutionarily divergent genes that might interfere with PSM length). Additionally, this study provides a set of cellular parameters that have yet to be measured in mouse and chick, therefore guiding the design of future experiments to measure them, allowing the simulation of the same model with sets of parameters from different vertebrate model organisms, therefore testing the robustness of the findings reported for zebrafish.

      Reviewer #3 (Evidence, reproducibility and clarity): 

      In this manuscript, Verd and colleagues explored how various biologically relevant factors influence the robustness of clock dynamics synchronization among neighboring cells within the context of somatogenesis, adapting a mathematical model presented by Urio et. al in 2021 in a similar context. Specifically they show that clock dynamics is robust to different biological mechanisms such as cell infusion, cellular motility, compaction-extension and cell-division. On the other hand , the length of Presomitic Mesoderm (PSM) and density of cells in it has a significant role in the robustness of clock dynamics. While the manuscript is well-written and provides clear descriptions of methods and technical details, it tends to be somewhat lengthy.

      Below are the comments I would like the authors to address:

      (1) The authors mention that "...the model is three dimensional and so can quantitatively recapture the rates of cell mixing that we observe in the PSM". I am not convinced with this justification of using a 3D model. None of the effects the authors explore in this manuscript requires a three dimensional model or full physical description of the cellular mechanics such as excluded volume interaction etc. A one-dimensional model characterized by cell position along the arclength of PSM and somatic region and segmentation clock phase θ can incorporate all the physics authors described in this manuscript as well as significantly computationally cheap allowing the authors to explore the effect of different parameters in greater detail.

      One of the main objectives of the work we present in this manuscript is to assess how the evolution of PSM morphogenesis affects, or does not affect, segment patterning. The PSM is a three-dimensional tissue with differing cell rearrangement dynamics along its anterior-posterior axis. In addition, PSM dimension, density, the rearrangement rate, and patterns of cell ingression all vary across vertebrate species, and they are functional, especially cell mixing as it promotes synchronisation and drives elongation. In order to answer questions on the modularity of somitogenesis we therefore consider it absolutely necessary to include a three-dimensional representation of the PSM that captures single cells and their movements. In addition, this will allow us, as Reviewer #2 also pointed out, to reparametrize our model using species-specific data as it becomes available. 

      While the reviewer is right in that lower dimensional representations would be computationally more efficient, and are generally more tractable, it would not be possible to represent cell mixing in one dimension, as this happens in three dimensions. One could perhaps encode the synchrony-promoting effect of cell mixing via some coupling function κ(x) that increases towards the posterior, however it is unclear what existing biological data one could use to parameterise this function or determine its form. Cell mixing can be modelled in a two-dimensional framework, however this cannot quantitatively recapture the rate of cell mixing observed in vivo, which is an advantage of this model. 

      Furthermore, it is unclear how one would simulate processes such as compactionextension using a one-dimensional model. The two different scenarios of cell ingression which we consider can also not be replicated in a one-dimensional model, as having a population of cells re-acquiring synchrony on the dorsal surface of the tissue while new material is added to the ventral side, creating asynchrony, is qualitatively different than a one-dimensional scenario where cells are introduced continuously along the spatial axis.

      (2) I am not sure about the justification for limiting the quantification of phase synchrony in a very limited (one cell diameter wide) region at one end of the somatic part (Page 33 below Fig. 9). From my understanding of the manuscript, the segments appear in significant length anterior to this region. Wouldn't an ensemble average of multiple such one cell diameter wide regions in the somatic region be a more accurate metric for quantifying synchrony?

      Indeed, such a metric (e.g. as that used by Uriu et al. to quantify synchrony along the xaxis) would be more accurate for determining synchrony within the PSM. However, as per the clock and wavefront model of somitogenesis, only synchrony at the very anterior of the PSM (or at the wavefront, equivalently) is functional for somitogenesis and thus evolution. Therefore, we restrict our analysis to the anterior-most region of the PSM. We now further justify this in the main text on page 9.

      (3) While studying the effect of cellular ingression, the authors study three discrete modes- random, DP and DP+LV and show that in the DP+LV mode the clock synchrony becomes affected. I would like the authors to explore this in a continuous fashion from a pure DP ingression to Pure LV ingression and intermediates.

      We thank the reviewer for this suggestion; this is a very interesting question. We are currently working on a related computational and experimental project to address the question of how PSM morphogenesis can change over evolutionary time to evolve the different modes that we see across species. As part of this work, we are running precisely the simulations suggested by the reviewer to find regions of parameter space in which all the relevant morphogenetic processes can freely evolve.  While interesting, this work is however outside the scope of the current manuscript.

      (4) While studying the effect of length and density of cells in PSM on cellular synchrony, the authors restrict to 3 values of density and 6 values of PSM length keeping the other parameter constant. I would be interested to see a phase diagram similar to Fig. 7 in the two-dimensional parameter space of L and ρ0. I am curious if a scaling relation exists for the parameter values that partition the parameter space with and without synchrony.

      We thank the reviewer for their suggestion and agree that this would constitute an interesting addition to the manuscript. We have now generated these data, which are shown in figure 4 supplement 5 and mentioned on page 13. We see no clear relationship between these two variables when co-varying in the presence of random ingression. 

      (5) Both in the abstract and introduction, the authors discuss at a great length about the variability in the number of segments. I am curious how the number and width of the segments observed depend on different parameters related to cellular mechanics and the segmentation clock ?

      We thank the reviewer for this question. It was not clear to us if this was something the reviewer wants us to address in the study’s background and introduction, or an analysis we should include in the results. Therefore, we have responded to both comprehensively below:

      The prevailing conceptual framework for understanding this is the clock and wavefront model (Cooke and Zeeman, 1976), which posits that the somite length is inversely proportional to the frequency of the clock relative to the speed of the wavefront, and that the total number of segments is the relative frequency multiplied by the total duration of somitogenesis.

      Experimentally we know that the frequency is determined in part by the coupling strength (Liao, Jorg, and Oates, 2016), and from comparative embryological studies (Gomez et al., 2008; Steventon et al., 2016) we know that changes in the elongation dynamics of the PSM correlate with changes in somite number, presumably by altering the total duration of somitogenesis (Gomez et al., 2009). These changes in elongation are thought to be driven by the changes in cell and tissue mechanics we test in our manuscript. 

      Within our model, we cannot in general predict how the number of segments responds to changes in either clock parameters or cell mechanical parameters, as we lack understanding of what causes somitogenesis to cease; this is thus not encoded in our model and segmentation can in principle proceed indefinitely. Therefore, we have not performed this analysis.

      Similarly, we have not included an analysis of somite length. This is for two reasons: 1) as per the clock and wavefront model, the frequency at the PSM anterior (which we analyse) is equivalent to this measurement, as we assume (in general) the wavefront ($x = x_{a}$) is inertial. 2) the length of the nascent somite is not thought to be of much relevance to the adult phenotype, and by extension evolution. Somites undergo cell division and growth soon after their patterning by the segmentation clock, therefore their final size does not majorly depend on the dynamics of the segmentation clock. Rather, the main function of the clock is to control their number (and polarity).

      (6) The authors assume that the phase dynamics of the chemical network may be described by an oscillator with constant frequency. For the completeness of the manuscript, the author should discuss in detail, for which chemical networks this is a good assumption.

      We thank the reviewer for their suggestion and now justify this assumption in the methods on page 31. 

      Such an assumption is appropriate for the segmentation clock, as the clock in the posterior of the PSM is thought to oscillate with a constant frequency, at least for the majority of somitogenesis although the frequency of somite formation slows towards the end of this process in zebrafish (Giudicelli et al., 2007, PLoS Biol.). In addition, PSM cells isolated and cultured in the presence of FGF (thus replicating the signalling environment of the posterior PSM) will continue to exhibit her1 oscillations with an apparently constant frequency (Webb et al., 2016). 

      We note that such formulations are widely used within the segmentation clock literature (e.g. Riedel-Kruse et al., 2007, Morelli et al., 2009).

      (7) Figure 3 and the associated text shows no effect of the cellular motility profile in the synchrony of the segmentation clock. This may be moved to the supplementary considering the length of this manuscript.

      Thank you for the suggestion. However, we would argue that the lack of effect is a crucial result when discussing modularity. Reviewer #2 agrees with this assessment.

      Reviewer #3 (Significance): 

      The manuscript answers some important questions in the synchrony of segmentation clock in the vertebrates utilizing a model published earlier. However, the presented result is incomplete in some aspects (points 2 to 5 of section A) and that could be overcome by a more detailed analysis using a simpler one dimensional (point 1 of section A). I believe this manuscript could be of interest to an intersecting audience of developmental biologists, systems biologists, and physicists/engineers interested in dynamical systems.

    1. Author response:

      Public Reviews:

      Reviewer #1 (Public review):

      Summary

      Farkas and colleagues conducted a comparative neuroimaging study with domestic dogs and humans to explore whether social perception in both species is underpinned by an analogous distinction between animate and inanimate entities an established functional organizing principle in the primate and human brain. Presenting domestic dogs and humans with clips of three animate classes (dogs, humans, cats) and one inanimate control (cars), the authors also set out to compare how dogs and humans perceive their own vs other species. Both research questions have been previously studied in dogs, but the authors used novel dynamic stimuli and added animate and inanimate classes, which have not been investigated before (i.e., cats and cars). Combining univariate and multivariate analysis approaches, they identified functionally analogous areas in the dog and human occipitotemporal cortex involved in the perception of animate entities, largely replicating previous observations. This further emphasizes a potentially shared functional organizing principle of social perception in the two species. The authors also describe between- species divergencies in the perception of the different animate classes, arguing for a less generalized perception of animate entities in dogs, but this conclusion is not convincingly supported by the applied analyses and reported findings.

      Strengths

      Domestic dogs represent a compelling model species to study the neural bases of social perception and potentially shared functional organizing principles with humans and primates. The field of comparative neuroimaging with dogs is still young, with a growing but still small number of studies, and the present study exemplifies the reproducibility of previous research. Using dynamic instead of static stimuli and adding new stimuli classes, Farkas and colleagues successfully replicated and expanded previous findings, adding to the growing body of evidence that social perception is underpinned by a shared functional organizing principle in the dog and human occipito-temporal cortex.

      Weaknesses

      The study design is imbalanced, with only one category of inanimate objects vs. three animate entities. Moreover, based on the example videos, it appears that the animate stimuli also differed in the complexity of the content from the car stimuli, with often multiple agents interacting or performing goal-directed actions. Moreover, while dogs are familiar with cars, they are definitely of lower relevance and interest to them than the animate stimuli. Thus, to a certain extent, the results might also reflect differences in attention towards/salience of the stimuli.

      We agree with the Reviewer and were aware that using only one class of inanimate objects but three classes of animate entities, along with the differences in complexity and relevance between the animate and the inanimate stimuli potentially elicited more attention to the inanimate condition and may have thus introduced a confound. We are revising the related limitation in the discussion to acknowledge this and to emphasize why we believe these differences do not compromise our main findings.

      The methods section and rationale behind the chosen approaches were often difficult to follow and lacked a lot of information, which makes it difficult to judge the evidence and the drawn conclusions, and it weakens the potential for reproducibility of this work. For example, for many preprocessing and analysis steps, parameters were missing or descriptions of the tools used, no information on anatomical masks and atlas used in humans was provided, and it is often not clear if the authors are referring to the univariate or multivariate analysis.

      We acknowledge the concerns regarding the clarity and completeness of the methods section and are significantly revising the descriptions of the methods. Of note, in humans, the Harvard-Oxford Cortical Structural Atlas (Frazier et al., 2005; Makris et al., 2006; Desikan et al., 2006; Goldstein et al., 2007), implemented within the FSL software package, was used for anatomical masks, while the Automated Anatomical Labeling atlas (Tzourio-Mazoyer et al., 2002) was used for assigning labels.

      In regard to the chosen approaches and rationale, the authors generally binarize a lot of rich information. Instead of directly testing potential differences in the neural representations of the different animate entities, they binarize dissimilarity maps for, e.g. animate entity > inanimate cars and then calculate the overlap between the maps.

      We thank the Reviewer for these comments and ideas. We also appreciate the second Reviewer for their related concerns and suggestions about the overlap calculation. Since the neural processing of different animate entities in the dog brain is largely unexplored, in some of our analyses we aimed to provide a straightforward and directly comparable characterization of animacy perception in the two species. We believe that a measure of how overlapping the neural representations of different animate classes are in the dog vs. the human visual cortex is a simple but meaningful and insightful characterization of how animacy perception is structured in the two species, despite the lack of spatial detail. Our decision to use binarization was based on these considerations. In response to this Reviewer’s request for providing richer information, in our revised manuscript, we will present more details and additional non-binarized calculations. Specifically, we are going to use nonbinarized data to present the response profiles of a broad, anatomically defined set of regions that have been related in other works to visual functions, to thus show where there is significant difference and overlap between the neural responses for the three animate classes in each species.

      The comparison of the overlap of these three maps between species is also problematic, considering that the human RSA was constricted to the occipital and temporal cortex (there is now information on how they defined it) vs. whole-brain in dogs.

      We thank this Reviewer for raising yet another relevant point about overlap calculation. We note that the overlap calculation for univariate results used the visually responsive cortex in both dogs and humans. The decision to restrict the multivariate analysis to the occipital and temporal lobes in humans, where the visual areas are, was to reduce computational load. Since RSA in dogs yielded significant voxels almost exclusively in the occipital and temporal cortices, we believe this decision did not introduce major bias in our results. This concern will also be discussed in our revised submission.

      Of note, in the category- and class-boundary test, as for the other multivariate tests, the occipital and temporal cortex of humans was delineated based on the MNI atlas.

      Considering that the stimuli do differ based on low-level visual properties (just not significantly within a run), the RSA would also allow the authors to directly test if some of the (dis)similarities might be driven by low-level visual features like they, e.g. did with the early visual cortex model. I do think RSA is generally an excellent choice to investigate the neural representation of animate (and inanimate) stimuli, but the authors should apply it more appropriately and use its full potential.

      We thank the Reviewer for this suggestion. While this study did not aim to investigate the correlation between low-level visual features and animacy, the data is available, and the suggested analysis can be conducted in the future. This issue will also be discussed in our revised submission.

      The authors localized some of the "animate areas" also with the early visual cortex model (e.g. ectomarginal gyrus, mid suprasylvian); in humans, it only included the known early visual cortex - what does this mean for the animate areas in dogs?

      We thank the Reviewer for raising this point. Although the labels are the same, both EMG and mSSG are relatively large gyri, and the clusters revealed by each of the two analyses hardly overlap, with peak coordinates more than 12 mm apart for R EMG, and in different hemispheres for mSSG (but more than 11 mm apart even if projected on the same hemisphere). We will detail the differences and the overlaps in the revised submission.

      The results section also lacks information and statistical evidence; for example, for the univariate region-of-interest (ROI) analysis (called response profiles) comparing activation strength towards each stimulus type, it is not reported if comparisons were significant or not, but the authors state they conducted t-tests. The authors describe that they created spheres on all peaks reported for the contrast animate > inanimate, but they only report results for the mid suprasylvian and occipital gyrus (e.g. caudal suprasylvian gyrus is missing).

      We thank this Reviewer for catching these errors. The missing statistics will be provided in the revised manuscript. Also, we mistakenly named the peak in caudal suprasylvian gyrus occipital gyrus on the figure depicting the response profiles. This will also be corrected.

      Furthermore, considering that the ROIs were chosen based on the contrast animate > inanimate stimuli, activation strength should only be compared between animate entities (i.e., dogs, humans, cats), while cars should not be reported (as this would be double dipping, after selecting voxels showing lower activation for that category).

      We thank both Reviewers for raising this relevant point about potential double dipping. The aim of this analysis was to describe the relationship between the neural response elicited by the three animate stimulus classes, to show that the animacy-sensitive peaks are not the results of the standalone greater response to a single animate class. We conducted t-tests only to assess significant difference between these three animate conditions and no stats were performed or reported for any animate class vs. inanimate comparisons in these ROIs. In addition to providing the missing t-tests (comparing animate classes), we will present response profiles and corresponding statistics for a broad set of additional, independent ROIs, defined either anatomically or functionally by other studies in the revised version.

      The descriptive data in Figure 3B (pending statistical evidence) suggests there were no strong differences in activation for the three species in dog and human animate areas. Thus, the ROI analysis appears to contradict findings from the binary analysis approach to investigate species preference, but the authors only discuss the results of the latter in support of their narrative for conspecific preference in dogs and do not discuss research from other labs investigating own-species preference.

      Studying conspecific-preference was not the primary aim of this study. We only used our data to characterize the animate-sensitive regions from this aspect. The species-preference test provides an overall characterization of the entire animate-sensitive region, revealing a higher number of voxels with a maximal response to conspecific than other stimuli in dogs (and a similar tendency in humans), confirming previous evidence on neural conspecific preference in visual areas in both species. The response profiles presented so far describe only the ROIs around the main animate-sensitive peaks and, as the Reviewer points out, in most cases reveal no significant conspecific bias. We believe there is no contradiction here: the entire animate-sensitive region may weakly but still be conspecific-preferring, whereas the main animate-sensitive peaks are not; the centers of conspecific preference may be located elsewhere in the visual cortex and may be supported by mechanisms other than animacy-sensitivity. In the revised manuscript, we will elaborate more on this. Additionally, in response to other comments, and for a better and more coherent characterization of species preference (and animacy sensitivity) across the visual cortex, we will present response profiles for other, independently defined regions and explore conspecific-sensitivity in those additional regions as well. Furthermore, we will discuss related own-species preference literature in greater detail.

      The authors also unnecessarily exaggerate novelty claims. Animate vs inanimate and own vs other species perceptions have both been investigated before in dogs (and humans), so any claims in that direction seem unsubstantiated - and also not needed, as novelty itself is not a sign of quality; what is novel, and a sign of theoretical advance besides the novelty, are as said the conceptual extension and replication of previous work.

      We agree with this Reviewer regarding novelty claims in general, and we confirm that we had no intention to overstate the uniqueness of our results. We also did not mean to imply that this work would be the first one on animacy perception in dogs, which it obviously is not. But we understand that we could have been more explicit presenting our work as a conceptual extension and replication of previous works, and we are revising the wording of the discussion from this aspect.

      Overall, more analyses and appropriate tests are needed to support the conclusions drawn by the authors, as well as a more comprehensive discussion of all findings.

      We are thankful for all comments. We will revise the methods section to provide sufficient detail and ensure replicability; conduct additional analyses as detailed above; and provide a more comprehensive discussion of all findings.

      Reviewer #2 (Public review):

      Summary:

      The manuscript reports an fMRI study looking at whether there is animacy organization in a non-primate, mammal, the domestic dog, that is similar to that observed in humans and non-human primates (NHPs). A simple experiment was carried out with four kinds of stimulus videos (dogs, humans, cats, and cars), and univariate contrasts and RSA searchlight analysis was performed. Previous studies have looked at this question or closely associated questions (e.g. whether there is face selectivity in dogs). The import of the present study is that it looks at multiple types of animate objects, dogs, humans, and cats, and tests whether there was overlapping/similar topography (or magnitude) of responses when these stimuli were compared to the inanimate reference class of cars. The main finding was of some selectivity for animacy though this was primarily driven by the dog stimuli, which did overlap with the other animate stimulus types, but far less so than in humans.

      Strengths:

      I believe that this is an interesting study in so far as it builds on other recent work looking at category-selectivity in the domestic dog. Given the limited number of such studies, I think it is a natural step to consider a number of different animate stimuli and look at their overlap. While some of the results were not wholly surprising (e.g. dog brains respond more selectively for dogs than humans or cats), that does not take away from their novelty, such as it is. The findings of this study are useful as a point of comparison with other recent work on the organization of high-level visual function in the brain of the domestic dog.

      Weaknesses:

      (1) One challenge for all studies like this is a lack of clarity when we say there is organization for "animacy" in the human and NHP brains. The challenge is by no means unique to the present study, but I do think it brings up two more specific topics.

      First, one property associated with animate things is "capable of self-movement". While cognitively we know that cars require a driver, and are otherwise inanimate, can we really assume that dogs think of cars in the same way? After all, just think of some dogs that chase cars. If dogs represent moving cars as another kind of selfmoving thing, then it is not clear we can say from this study that we have a contrast between animate vs inanimate. This would not mean that there are no real differences in neural organization being found.

      It was unclear whether all or some of the car videos showed them moving. But if many/most do, then I think this is a concern.

      We thank this Reviewer for raising this relevant point about the potential animacy of cars for dogs and its implication for our results. Of note, two-thirds of our car stimuli showed a car moving (slow, accelerating, or fast). We acknowledge that these stimuli contained motionbased animacy cues, and in this regard, there was no clear difference between our animate and inanimate conditions, and possibly between some of the representations they elicited. However, our animate and inanimate stimuli differed in other key factors accounting for animacy organization, such as visual features including the presence of faces, bodies, body parts, postures, and certain aspects of biological motion. So we believe that this limitation does not compromise our main conclusions. We will elaborate on this point further in the revised discussion, also considering how dogs’ differential behavioral responses to cars and animate entities may provide additional insights in this regard.

      Second, there is quite a lot of potential complexity in the human case that is worth considering when interpreting the results of this study. In the human case, some evidence suggests that animacy may be more of a continuum (Sha et al. 2015), which may reflect taxonomy (Connolly et al. 2012, 2016). However moving videos seem to be dominated more by signals relevant to threat or predation relative to taxonomy (Nastase et al. 2017). Some evidence suggests that this purported taxonomic organization might be driven by gradation in representing faces and bodies of animals based on their relative similarity to humans (Ritchie et al. 2021). Also, it may be that animacy organization reflects a number of (partially correlated) dimensions (Thorat et al. 2019, Jozwik et al. 2022). One may wonder whether the regions of (partial) overlap in animate responses in the dog brain might have some of these properties as well (or not).

      We agree that it would be interesting to dissect which animacy-related factor(s) contribute to the observed animacy sensitivity in different regions, and although this was not the original aim of the study, we agree that we could have made better use of the variation in our stimuli to discuss this aspect. Specifically, some animacy features are shared by all three animate stimulus classes, namely the presence of biological motions, faces, and bodies. In contrast, animate classes differed in some other aspects, for example in how dogs perceived dogs, humans, and cats as social agents and in their potential behavioral goals towards them. It can therefore be argued that regions with two- and especially three-way overlapping activations are more probably involved in processing biological motion, face and body aspects, and non-overlapping ones the social agency- and behavioural goal-related aspects. In line with this, the shared animacy features are indeed ones that have been reported to be central in human animacy representation and that may have made the overlaps in human brain responses greater. We will provide a more detailed discussion of the results from this viewpoint in the revised manuscript.

      (2) It is stated that previous studies provide evidence that the dog brain shows selectivity to "certain aspects of animacy". One of these already looked at selectivity for dog and human faces and bodies and identified similar regions of activity (Boch et al. 2023). An earlier study by Dilks et al. (2015), not cited in the present work (as far as I can tell), also used dynamic stimuli and did not suffer from the above limitations in choosing inanimate stimuli (e.g. using toy and scene objects for inanimate stimuli). But it only included human faces as the dynamic animate stimulus. So, as far as stimulus design, it seems the import of the present study is that it included a *third* animate stimulus (cats) and that the stimuli were dynamic.

      We agree with this Reviewer that the findings of Dilks et al. (2015) are relevant to our study and have therefore cited them. However, the citation itself was imprecise and will be corrected in the revised manuscript.

      (3) I am concerned that the univariate results, especially those depicted in Figure 3B, include double dipping (Kriegesorte et al. 2009). The analysis uses the response peak for the A > iA contrast to then look at the magnitude of the D, H, C vs iA contrasts. This means the same data is being used for feature selection and then to estimate the responses. So, the estimates are going to be inflated. For example, the high magnitudes for the three animate stimuli above the inanimate stimuli are going to inherently be inflated by this analysis and cannot be taken at face value. I have the same concern with the selectivity preference results in Figure 3E.

      I think the authors have two options here. Either they drop these analyses entirely (so that the total set of analyses really mirrors those in Figure 4), or they modify them to address this concern. I think this could be done in one of two ways. One would be to do a within- subject standard split-half analysis and use one-half of the data for feature selection and the other for magnitude estimation. The other would be to do a between-subject design of some kind, like using one subject for magnitude estimation based on an ROI defined using the data for the other subjects.

      We thank both Reviewers again for raising this important point about potential double dipping. We also thank this Reviewer for specific suggestions for split-half analyses – we agree that, had our original analyses involved double dipping, such a modification would be necessary. But, as we explained in our response above, this was not the case. Indeed, whereas we do visualize all four conditions in Fig. 3B, we only conducted t-tests to assess differences between the three animate conditions (the corresponding stats have been missing from the original manuscript but will be added during revision). So, importantly, we did not evaluate the magnitude of the D, H, C vs iA contrasts in any of the ROIs defined by animate-sensitive peaks; therefore, we believe that these analyses do not involve double dipping. This holds for the species preference results in Fig. 3E as well. We will clarify this in the revised manuscript. Of note, in response to a request by the other reviewer and to provide richer information about the univariate results, we will also provide response profiles and corresponding stats for a broad set of additional ROIs, defined either anatomically or functionally by other studies (e.g., Boch et al., 2023).

      (4) There are two concerns with how the overlap analyses were carried out. First, as typically carried out to look at overlap in humans, the proportion is of overlapping results of the contrasts of interest, e.g, for face and body selectivity overlap (Schwarlose et al. 2006), hand and tool overlap (Bracci et al. 2012), or more recently, tool and food overlap (Ritchie et al. 2024). There are a number of ways of then calculating the overlap, with their own strengths and weaknesses (see Tarr et al. 2007). Of these, I think the Jaccard index is the most intuitive, which is just the intersection of two sets as a proportion of their union. So, for example, the N of overlapping D > iA and H > iA active voxels is divided by the total number of unique active voxels for the two contrasts. Such an overlap analysis is more standard and interpretable relative to previous findings. I would strongly encourage the authors to carry out such an analysis or use a similar metric of overlap, in place of what they have currently performed (to the extent the analysis makes sense to me).

      We agree with this Reviewer that the Jaccard index is an intuitive and straightforward overlap measure. Importantly, for our overlap calculations we already use this measure (and a very similar one) – but we acknowledge that this was not clear from the original description. Specifically, for the multivariate overlap test, we used the Jaccard index exactly as described by this Reviewer. For the univariate overlap test, we use a very similar measure, with the only difference that there, to reference the search space, the intersection of specific animate-inanimate contrasts was divided by the total voxel number of animate-sensitive areas (which is highly similar to the union of the specific animate-inanimate contrasts). In the revised submission we will provide a more detailed explanation of the overlap calculations, making it explicit that we used the Jaccard index (and a variant of it).

      Second, the results summarized in Figure 3A suggest multiple distinct regions of animacy selectivity. Other studies have also identified similar networks of regions (e.g. Boch et al. 2023). These regions may serve different functions, but the overlap analysis does not tell us whether there is overlap in some of these portions of the cortex and not in others. The overlap is only looked at in a very general sense. There may be more overlap locally in some portions of the cortex and not in others.

      We thank this Reviewer for this comment, we agree that adding spatial specificity to these results will improve the manuscript. Therefore, during revision, we will assess the anatomical distribution of the overlap results, making use of a broad set of ROIs potentially relevant for animacy perception, defined either anatomically or functionally by other studies (e.g., Boch et al., 2023 for dogs).

      (5) Two comments about the RSA analyses. First, I am not quite sure why the authors used HMAX rather than layers of a standardly trained ImageNet deep convolutional neural network. This strikes me also as a missed opportunity since many labs have looked at whether later layers of DNNs trained on object categorization show similar dissimilarity structures as category-selective regions in humans and NHPs. In so far as cross-species comparisons are the motivation here, it would be genuinely interesting to see what would happen if one did a correlation searchlight with the dog brain and layers of a DNN, a la Cichy et al. (2016).

      We thank the Reviewer for this comment and suggestion. At the start of the project, HMAX was the most feasible model to implement given our time and expertise constrains. Additionally, the biologically motivated HMAX was also an appropriate choice, as it simulates the selective tuning of neurons in the primary visual cortex (V1) of primates, which is considered homologous with V1 in carnivores (Boch et al., 2024).

      Although we agree that using DNNs have recently been extensively and successfully used to explore object representations and could provide valuable additional insights for dogs’ visual perception as well, we believe that adding a large set of additional analyses would stretch the frames of this manuscript, disproportionately shifting its focus from our original research question. Also, our experiment, designed with a different, more specific aim in mind, did not provide a large enough stimulus variety of animate stimuli for a general comparison of the cortical hierarchy underlying object representations in dog and human brains and thus our data are not an optimal starting point for such extensive explorations. Having said that, we are thankful for this Reviewer for the idea and will consider using a DNN to uncover dog’ visual cortical hierarchy in future studies with a better suited stimulus set. Furthermore, in accordance with eLife’s data-sharing policies, we will make the current dataset publicly available so further hypothesis and models can be tested.

      Second, from the text is hard to tell what the models for the class- and categoryboundary effects were. Are there RDMs that can be depicted here? I am very familiar with RSA searchlight and I found the description of the methods to be rather opaque. The same point about overlap earlier regarding the univariate results also applies to the RSA results. Also, this is again a reason to potentially compare DNN RDMs to both the categorical models and the brains of both species.

      In the revised manuscript we will provide a more detailed explanation of the methods used to determine class- and category-boundary effects. In short, the analysis we performed here followed Kriegeskorte et al. (2008), and the searchlight test looked for regions in which between-class/category differences were greater than within-class/category differences. We will also include RDMs. Additionally, we will provide anatomical details for the overlap results for RSA, just as for the univariate results, using the same independently defined broad set of ROIs, defined either anatomically or functionally by other studies (e.g., Boch et al., 2023 for dogs).

      (6) There has been emphasis of late on the role of face and body selective regions and social cognition (Pitcher and Ungerleider, 2021, Puce, 2024), and also on whether these regions are more specialized for representing whole bodies/persons (Hu et al. 2020, Taubert, et al. 2022). It may be that the supposed animacy organization is more about how we socialize and interact with other organisms than anything about animacy as such (see again the earlier comments about animacy, taxonomy, and threat/predation). The result, of a great deal of selectivity for dogs, some for humans, and little for cats, seems to readily make sense if we assume it is driven by the social value of the three animate objects that are presented. This might be something worth reflecting on in relation to the present findings.

      We thank the Reviewer for this suggestion. The original manuscript already discussed how motion-related animacy cues involved in social cognition may explain that animacysensitive regions reported in our study extend beyond those reported previously and also the role of biological motion in the observed across-species differences. This discussion of the role of visual diagnostic features and features that involved in perceiving social agents will be extended in the revised discussion, also in response to the first comment of this Reviewer, to reflect on how social cognition-related animacy cues may have affected our results in dogs.

    1. Author response:

      Public Reviews:

      Reviewer #1 (Public review):

      Summary:

      Dad et al. explored the roles of cytosolic carboxypeptidase 5(CCP5)in the development of ependymal multicilia in the brain. CCP family are erasers of polyglutamylation of ciliary-axoneme microtubules. The authors generated a new mutant mouse of Agbl5 gene, which encodes CCP5, with deletion of its N-terminus and partial carboxypeptidase (CP) domain (named AGBL5M1/M1).

      Strengths:

      The mutant mice revealed lethal hydrocephalus due to degeneration of ependymal multicilia. Interestingly, this is in contrast with the phenotype of Agbl5 mutants with disruption solely in the CP domain of CCP5 (named AGBL5M2/M2) that did not develop hydrocephalus despite increased glutamylation levels in ependymal cilia as observed for AGBL5M1/M1 mutants. The study has been well-performed and the findings suggest a unique function of the N-domain of CCP5 in ependymal multicilia stability.

      Weaknesses:

      The content of this article is relatively descriptive and lacks molecular insights.

      We thank the Reviewer’s positive comments. To address the molecular insights of the dysregulated planar cell polarity (PCP) in Agbl5<sup>M1/M1</sup> ependyma, we are planning to further assess the microtubule polarization and the expression/localization of PCP core proteins in ependymal cells. We also plan to quantify the intensity of actin networks around BB patches to better understand to which extent it is affected in the ependyma of the mutants and contributes to the impaired stability of BBs (Please see below).

      We will also assess whether Agbl5 commonly functions in multiciliated cells of other organs.

      Reviewer #2 (Public review):

      Summary:

      This study analyzed the consequences of Agbl5 mutation on ependymal cell development and function. The authors first characterize their mutant mouse line reporting a reduced lifespand and severe hydrocephalus. Next, they report a defect in ependymal cell cilia number and motility. They provide evidence for impaired basal body organisation and cilia glutamylation.

      Strengths:

      Description of a mutant mouse which implicates Cytosolic Carboxypeptidase 5 (the product of Agbl5 gene) for proper ependymal cells.

      Weaknesses:

      Description of phenotype is incomplete:

      We thank the Reviewer’s constructive comments. We agree that more quantitative analysis of the phenotypes in Agbl5<sup>M1/M1</sup> will strengthen this study.

      - Figure 3G - the sequence from the movie is not really informative. Providing beating frequencies as quantification of the data would be more informative.

      We agree that quantification of the cilia beating frequencies and directions in these experiments will be more informative.

      - Figure 3 - the quantification of actin network would strengthen the message.

      We agree with the Reviewers. We will quantify the total intensity of actin around BB patch and the total intensity of actin per BB to determine to which extent the actin networks are affected in Agbl5<sup>M1/M1</sup> ependymal cells.

      - Lines 219 -220 - the authors conclude “Taken together, in Agbl5<sup>M1/M1</sup> ependymal cells, the expression of genes promoting multiciliogenesis were not impaired but certain proteins associated with differentiated ependymal cells are not properly expressed”. However, they do not assess gene but protein expression (IF). In addition, their quantification shows differences in the number of FoxJ1 positive cells which indeed is an impaired expression.

      We will clarify this statement.

      - Microtubules are involved in the local organization of ciliary basal bodies (see Werner et al., Vladar et al.,2011; Boutin et al., 2014). It would be interesting for the authors to check whether the subapical network of microtubules is glutamylated or not during ependymal cell differentiation and how this network is affected in their mutants.

      We thank the Reviewer’s suggestion. We agree this is an interesting point to look at. We will assess the glutamylation status of the subapical microtubule networks in differentiating ependymal cells and whether they are affected in the mutants.

      - Showing the data mentioned in the discussion on Cep110 would be a nice addition to the paper.

      These results will be provided.

      - Line 354: "The latter serves as a component of tissue polarity that is required for asymmetric PCP protein localization in each cell (Boutin et al., 2014; Vladar et al., 2012)." The cited reference did not demonstrate that this microtubule network is required for asymmetric PCP localization.

      We thank the Reviewer for critical reading. We will correct the citation.

      Reviewer #3 (Public review):

      Summary:

      The authors developed a new Agbl5 KO allele, extending the deletion to the N-terminus of CCP5 to explore its function in mouse ependymal cells.

      Strengths:

      They show that the KO mice exhibit severe hydrocephalus due to disorganized and mislocated basal bodies. Additionally, they present evidence of both impaired beating coordination and a reduction in ciliary beating.

      Weaknesses:

      The manuscript is well-written but lacks specific interpretations of the results presented. Further experiments are needed to be fully convincing.

      We thank the Reviewer’s comments. We plan to conduct the following experiments to strengthen this study.

      (1) Quantify the intensity of actin staining around BB patches and its intensity relative to the number of BBs to assess to which extent the actin networks in Agbl5<sup>M1/M1</sup> ependymal cells are affected (please refer to the above response to the comments of Reviewer 2#).

      (2) Co-stain tdTomato with cell specific markers to strengthen the spatial expression of tdTomato.

      (3) Seek proper antibodies to determine the correlation between signals of GT335 and Ac-Tub in ependymal multicilia of Agbl5<sup>M1/M1</sup> mice.

      (4) Quantitatively compare the size of ependymal cells in the wild-type and Agbl5<sup>M1/M1</sup> mice to address whether there is a consequence of possible dysfunction of primary cilia in the precursors of ependymal cells in the mutants. If so, we will further analyze how the primary cilia in the precursors of ependymal cells are affected in the mutants.

      (5) Address whether the rotational polarity is affected in the Agbl5<sup>M1/M1</sup> mutant mice.

    1. Author response:

      To address Reviewer 1’s concerns, we will implement the following changes:

      Comment 1: We will clarify that, even without direct comparisons within or across species, whether vertically transmitted microbes act as pioneering colonizers or integrate into an existing community is an important factor influencing their effect on community composition.

      Comment 2: We will provide additional details on the biology of the surrogate frog Oophaga sylvatica, explain how tadpole manipulation might influence adhesion to the caregiver, and acknowledge that the lack of knowledge on the physiological mechanisms underlying tadpole attachment currently limits our discussion to speculation.

      We will further clarify in the “Methods” section that SourceTracker’s ability to accurately estimate source proportions was assessed by evaluating how well it assigned training samples to their correct source environments. We will provide the predictions for the training set and describe how they informed our data preprocessing and analysis approach.

      Comment 3: While we predicted that community distances between tadpoles and adults would be smaller in species with parental transport, we explicitly state that our results did not confirm this expectation. We thus see no contradiction in our discussion but will ensure that this point is more clearly communicated. In response to the reviewer’s suggestion, we will incorporate additional literature on how tadpoles’ skin microbial communities change over time and adapt to their environment. We will also expand on how the life history of L. longirostris—specifically, the frequent presence of adults in tadpole habitats—may facilitate horizontal microbiota transmission, potentially contributing to shorter community distances.

      Comment 4: We will remove the network visualization to prevent any misinterpretation.

      Additionally, following Reviewer 2’s suggestion, we will include data on the absolute abundance of ASVs shared between parent and offspring after one month of development to further support the manuscript.

    1. Author response:

      The following is the authors’ response to the original reviews.

      Reviewer #1 (Public Review):

      Weaknesses:

      INTRODUCTION & THEORY

      (1) Can the authors please clarify why the first trial of extinction in a standard protocol does NOT produce the retrieval-extinction effect? Particularly as the results section states: "Importantly, such a short-term effect is also retrieval dependent, suggesting the labile state of memory is necessary for the short-term memory update to take effect (Fig. 1e)." The importance of this point comes through at several places in the paper:

      1A. "In the current study, fear recovery was tested 30 minutes after extinction training, whereas the effect of memory reconsolidation was generally evident only several hours later and possibly with the help of sleep, leaving open the possibility of a different cognitive mechanism for the short-term fear dementia related to the retrieval-extinction procedure." ***What does this mean? The two groups in study 1 experienced a different interval between the first and second CS extinction trials; and the results varied with this interval: a longer interval (10 min) ultimately resulted in less reinstatement of fear than a shorter interval. Even if the different pattern of results in these two groups was shown/known to imply two different processes, there is absolutely no reason to reference any sort of cognitive mechanism or dementia - that is quite far removed from the details of the present study.

      Indeed, the only difference between the standard extinction paradigm and the retrieval-extinction paradigm is the difference between the first and second CS extinction trials. It has been shown before that a second CS+ presented 1 hour after the initial retrieval CS+ resulted in the dephosphorylation of GluR1 in rats, which was indicative of memory destabilization. The second CS+ presented only 3 minutes after the initial retrieval CS+, as in the standard extinction training, did not cause the GluR1 dephosphorylation effect (Monfils et al., 2009). Therefore, an isolated presentation of the CS+ seems to be important in preventing the return of fear expression. Behaviorally, when the CSs were presented in a more temporally spaced (vs. mass presentation) or a more gradual manner in the extinction training, the fear amnesia effects were more salient (Cain et al., 2003, Gershman et al., 2013). It has also been suggested that only when the old memory and new experience (through extinction) can be inferred to have been generated from the same underlying latent cause, the old memory can be successfully modified (Gershman et al., 2017). On the other hand, if the new experiences are believed to be generated by a different latent cause, then the old memory is less likely to be subject to modification. Therefore, the way the first and 2nd CS are temporally organized (retrieval-extinction or standard extinction) might affect how the latent cause is inferred and lead to different levels of fear expression from a theoretical perspective. These findings, together with studies in both fear and drug memories using the retrieval-extinction paradigm (Liu et al., 2014, Luo et al., 2015, Schiller et al., 2010, Xue et al., 2012), seem to suggest that the retrieval-extinction and the standard extinction procedures engage different cognitive and molecular mechanisms that lead to significant different behavioral outcomes. 

      In our study, we focus on the short-term and long-term amnesia effects of the retrieval-extinction procedure but also point out the critical role of retrieval in eliciting the short-term effect.

      1B. "Importantly, such a short-term effect is also retrieval dependent, suggesting the labile state of memory is necessary for the short-term memory update to take effect (Fig. 1e)." ***As above, what is "the short-term memory update"? At this point in the text, it would be appropriate for the authors to discuss why the retrieval-extinction procedure produces less recovery than a standard extinction procedure as the two protocols only differ in the interval between the first and second extinction trials. References to a "short-term memory update" process do not help the reader to understand what is happening in the protocol.

      Sorry for the lack of clarity here. By short-term memory update we meant the short-term amnesia in fear expression.

      (2) "Indeed, through a series of experiments, we identified a short-term fear amnesia effect following memory retrieval, in addition to the fear reconsolidation effect that appeared much later."

      ***The only reason for supposing two effects is because of the differences in responding to the CS2, which was subjected to STANDARD extinction, in the short- and long-term tests. More needs to be said about how and why the performance of CS2 is affected in the short-term test and recovers in the long-term test. That is, if the loss of performance to CS1 and CS2 is going to be attributed to some type of memory updating process across the retrieval-extinction procedure, one needs to explain the selective recovery of performance to CS2 when the extinction-to-testing interval extends to 24 hours. Instead of explaining this recovery, the authors note that performance to CS1 remains low when the extinction-to-testing interval is 24 hours and invoke something to do with memory reconsolidation as an explanation for their results: that is, they imply (I think) that reconsolidation of the CS1-US memory is disrupted across the 24-hour interval between extinction and testing even though CS1 evokes negligible responding just minutes after extinction.

      In our results, we did not only focus on the fear expression related to CS2. In fact, we also demonstrated that the CS1 related fear expression diminished in the short-term memory test but re-appeared in the long-term memory after the CS1 retrieval-extinction training.

      The “…recovery of performance to CS2 when the extinction-to-testing interval extends to 24 hours…” is a result that has been demonstrated in various previous studies (Kindt and Soeter, 2018, Kindt et al., 2009, Nader et al., 2000, Schiller et al., 2013, Schiller et al., 2010, Xue et al., 2012). That is, the reconsolidation framework stipulates that the pharmacological or behavioral intervention during the labile states of the reconsolidation window only modifies the fear memory linked to the reminded retrieval cue, but not for the non-reminded CS-US memory expression (but also see (Liu et al., 2014, Luo et al., 2015) for using the unconditioned stimulus as the reminder cue and the retrieval-extinction paradigm to prevent the return of fear memory associated with different CS).  In fact, we hypothesized the temporal dynamics of CS1 and CS2 related fear expressions were due to the interplay between the short-term and long-term (reconsolidation) effects of the retrieval-extinction paradigm in the last figure (Fig. 6). 

      (3) The discussion of memory suppression is potentially interesting but, in its present form, raises more questions than it answers. That is, memory suppression is invoked to explain a particular pattern of results but I, as the reader, have no sense of why a fear memory would be better suppressed shortly after the retrieval-extinction protocol compared to the standard extinction protocol; and why this suppression is NOT specific to the cue that had been subjected to the retrieval-extinction protocol.

      We discussed memory suppression as one of the potential mechanisms to account for the three characteristics of the short-term amnesia effects: cue-independence, temporal dynamics (short-term) and thought-control-ability relevance. According to the memory suppression theory, the memory suppression effect is NOT specific to the cue and this effect was demonstrated via the independent cue test in a variety of studies (Anderson and Floresco, 2022, Anderson and Green, 2001, Gagnepain et al., 2014, Zhu et al., 2022). Therefore, we suggest in the discussion that it might be possible the CS1 retrieval cue prompted an automatic suppression mechanism and yielded the short-term fear amnesia consistent with various predictions from the memory suppression theory:

      “In our experiments, subjects were not explicitly instructed to suppress their fear expression, yet the retrieval-extinction training significantly decreased short-term fear expression. These results are consistent with the short-term amnesia induced with the more explicit suppression intervention (Anderson et al., 1994; Kindt and Soeter, 2018; Speer et al., 2021; Wang et al., 2021; Wells and Davies, 1994). It is worth noting that although consciously repelling unwanted memory is a standard approach in memory suppression paradigm, it is possible that the engagement of the suppression mechanism can be unconscious. For example, in the retrieval-induced forgetting (RIF) paradigm, recall of a stored memory impairs the retention of related target memory and this forgetting effect emerges as early as 20 minutes after the retrieval procedure, suggesting memory suppression or inhibition can occur in a more spontaneous and automatic manner (Imai et al., 2014). Moreover, subjects with trauma histories exhibited more suppression-induced forgetting for both negative and neutral memories than those with little or no trauma (Hulbert and Anderson, 2018). Similarly, people with higher self-reported thought-control capabilities showed more severe cue-independent memory recall deficit, suggesting that suppression mechanism is associated with individual differences in spontaneous control abilities over intrusive thoughts (Küpper et al., 2014). It has also been suggested that similar automatic mechanisms might be involved in organic retrograde amnesia of traumatic childhood memories (Schacter et al., 2012; Schacter et al., 1996).”

      3A. Relatedly, how does the retrieval-induced forgetting (which is referred to at various points throughout the paper) relate to the retrieval-extinction effect? The appeal to retrieval-induced forgetting as an apparent justification for aspects of the present study reinforces points 2 and 3 above. It is not uninteresting but needs some clarification/elaboration.

      We introduced the retrieval-induced forgetting (RIF) to make the point that RIF was believed to be related to the memory suppression mechanism and the RIF effect can appear relatively early, consistent with what we observed in the short-term amnesia effect. We have re-written the manuscript to make this point clearer:

      “It is worth noting that although consciously repelling unwanted memory is a standard approach in memory suppression paradigm, it is possible that the engagement of the suppression mechanism can be unconscious. For example, in the retrieval-induced forgetting (RIF) paradigm, recall of a stored memory impairs the retention of related target memory and this forgetting effect emerges as early as 20 minutes after the retrieval procedure, suggesting memory suppression or inhibition can occur in a more spontaneous and automatic manner (Imai et al., 2014). Moreover, subjects with trauma histories exhibited more suppression-induced forgetting for both negative and neutral memories than those with little or no trauma (Hulbert and Anderson, 2018). Similarly, people with higher self-reported thought-control capabilities showed more severe cue-independent memory recall deficit, suggesting that suppression mechanism is associated with individual differences in spontaneous control abilities over intrusive thoughts (Küpper et al., 2014).”

      (4) Given the reports by Chalkia, van Oudenhove & Beckers (2020) and Chalkia et al (2020), some qualification needs to be inserted in relation to reference 6. That is, reference 6 is used to support the statement that "during the reconsolidation window, old fear memory can be updated via extinction training following fear memory retrieval". This needs a qualifying statement like "[but see Chalkia et al (2020a and 2020b) for failures to reproduce the results of 6]."

      https://pubmed.ncbi.nlm.nih.gov/32580869/

      https://www.ncbi.nlm.nih.gov/pmc/articles/PMC7115860/

      We have incorporated the reviewer’s suggestion into the revised manuscript in both the introduction:

      “Pharmacological blockade of protein synthesis and behavioral interventions can both eliminate the original fear memory expression in the long-term (24 hours later) memory test ( Lee, 2008; Lee et al., 2017; Schiller et al., 2013; Schiller et al., 2010), resulting in the cue-specific fear memory deficit (Debiec et al., 2002; Lee, 2008; Nader, Schafe, & LeDoux, 2000). For example, during the reconsolidation window, retrieving a fear memory allows it to be updated through extinction training (i.e., the retrieval-extinction paradigm (Lee, 2008; Lee et al., 2017; Schiller et al., 2013; Schiller et al., 2010), but also see (Chalkia, Schroyens, et al., 2020; Chalkia, Van Oudenhove, et al., 2020; D. Schiller, LeDoux, & Phelps, 2020)”

      And in the discussion:

      “It should be noted that while our long-term amnesia results were consistent with the fear memory reconsolidation literatures, there were also studies that failed to observe fear prevention (Chalkia, Schroyens, et al., 2020; Chalkia, Van Oudenhove, et al., 2020; Schroyens et al., 2023). Although the memory reconsolidation framework provides a viable explanation for the long-term amnesia, more evidence is required to validate the presence of reconsolidation, especially at the neurobiological level (Elsey et al., 2018). While it is beyond the scope of the current study to discuss the discrepancies between these studies, one possibility to reconcile these results concerns the procedure for the retrieval-extinction training. It has been shown that the eligibility for old memory to be updated is contingent on whether the old memory and new observations can be inferred to have been generated by the same latent cause (Gershman et al., 2017; Gershman and Niv, 2012). For example, prevention of the return of fear memory can be achieved through gradual extinction paradigm, which is thought to reduce the size of prediction errors to inhibit the formation of new latent causes (Gershman, Jones, et al., 2013). Therefore, the effectiveness of the retrieval-extinction paradigm might depend on the reliability of such paradigm in inferring the same underlying latent cause. Furthermore, other studies highlighted the importance of memory storage per se and suggested that memory retention was encoded in the memory engram cell ensemble connectivity whereas the engram cell synaptic plasticity is crucial for memory retrieval (Ryan et al., 2015; Tonegawa, Liu, et al., 2015; Tonegawa, Pignatelli, et al., 2015). It remains to be tested how the cue-independent short-term and cue-dependent long-term amnesia effects we observed could correspond to the engram cell synaptic plasticity and functional connectivity among engram cell ensembles (Figure 6). This is particularly important, since the cue-independent characteristic of the short-term amnesia suggest that either different memory cues fail to evoke engram cell activities, or the retrieval-extinction training transiently inhibits connectivity among engram cell ensembles. Finally, SCR is only one aspect of the fear expression, how the retrieval-extinction paradigm might affect subjects’ other emotional (such as the startle response) and cognitive fear expressions such as reported fear expectancy needs to be tested in future studies since they do not always align with each other (Kindt et al., 2009; Sevenster et al., 2012, 2013).”

      5A. What does it mean to ask: "whether memory retrieval facilitates update mechanisms other than memory reconsolidation"? That is, in what sense could or would memory retrieval be thought to facilitate a memory update mechanism?

      It is widely documented in the literatures that memory retrieval renders the old memory into a labile state susceptible for the memory reconsolidation process. However, as we mentioned in the manuscript, studies have shown that memory reconsolidation requires the de novo protein synthesis and usually takes hours to complete. What remains unknown is whether old memories are subject to modifications other than the reconsolidation process. Our task specifically tested the short-term effect of the retrieval-extinction paradigm and found that fear expression diminished 30mins after the retrieval-extinction training. Such an effect cannot be accounted for by the memory reconsolidation effect.

      5B. "First, we demonstrate that memory reactivation prevents the return of fear shortly after extinction training in contrast to the memory reconsolidation effect which takes several hours to emerge and such a short-term amnesia effect is cue independent (Study 1, N = 57 adults)."

      ***The phrasing here could be improved for clarity: "First, we demonstrate that the retrieval-extinction protocol prevents the return of fear shortly after extinction training (i.e., when testing occurs just min after the end of extinction)." Also, cue-dependence of the retrieval-extinction effect was assessed in study 2.

      We thank the reviewer and have modified the phrasing of the sentence:

      “First, we demonstrate that memory retrieval-extinction protocol prevents the return of fear expression shortly after extinction training and this short-term effect is memory reactivation dependent (Study 1, N = 57 adults).”

      5C. "Furthermore, memory reactivation also triggers fear memory reconsolidation and produces cue-specific amnesia at a longer and separable timescale (Study 2, N = 79 adults)." ***In study 2, the retrieval-extinction protocol produced a cue-specific disruption in responding when testing occurred 24 hours after the end of extinction. This result is interesting but cannot be easily inferred from the statement that begins "Furthermore..." That is, the results should be described in terms of the combined effects of retrieval and extinction, not in terms of memory reactivation alone; and the statement about memory reconsolidation is unnecessary. One can simply state that the retrieval-extinction protocol produced a cue-specific disruption in responding when testing occurred 24 hours after the end of extinction.

      We have revised the text according to the reviewer’s comment.

      “Furthermore, across different timescales, the memory retrieval-extinction paradigm triggers distinct types of fear amnesia in terms of cue-specificity and cognitive control dependence, suggesting that the short-term fear amnesia might be caused by different mechanisms from the cue-specific amnesia at a longer and separable timescale (Study 2, N = 79 adults).”

      5D. "...we directly manipulated brain activities in the dorsolateral prefrontal cortex and found that both memory retrieval and intact prefrontal cortex functions were necessary for the short-term fear amnesia."

      ***This could be edited to better describe what was shown: E.g., "...we directly manipulated brain activities in the dorsolateral prefrontal cortex and found that intact prefrontal cortex functions were necessary for the short-term fear amnesia after the retrieval-extinction protocol."

      Edited:

      “Finally, using continuous theta-burst stimulation (Study 3, N = 75 adults), we directly manipulated brain activity in the dorsolateral prefrontal cortex, and found that both memory reactivation and intact prefrontal cortex function were necessary for the short-term fear amnesia after the retrieval-extinction protocol.”

      5E. "The temporal scale and cue-specificity results of the short-term fear amnesia are clearly dissociable from the amnesia related to memory reconsolidation, and suggest that memory retrieval and extinction training trigger distinct underlying memory update mechanisms."

      ***The pattern of results when testing occurred just minutes after the retrieval-extinction protocol was different from that obtained when testing occurred 24 hours after the protocol. Describing this in terms of temporal scale is unnecessary, and suggesting that memory retrieval and extinction trigger different memory update mechanisms is not obviously warranted. The results of interest are due to the combined effects of retrieval+extinction and there is no sense in which different memory update mechanisms should be identified with retrieval (mechanism 1) and extinction (mechanism 2).

      We did not argue for different memory update mechanisms for the “retrieval (mechanism 1) and extinction (mechanism 2)” in our manuscript. Instead, we proposed that the retrieval-extinction procedure, which was mainly documented in the previous literatures for its association with the reconsolidation-related fear memory retention (the long-term effect), also had a much faster effect (the short-term effect). These two effects differed in many aspects, suggesting that different memory update mechanisms might be involved.

      5F. "These findings raise the possibility of concerted memory modulation processes related to memory retrieval..."

      ***What does this mean?

      As we mentioned in our response to the previous comment, we believe that the retrieval-extinction procedure triggers different types of memory update mechanisms working on different temporal scales.

      (6) "...suggesting that the fear memory might be amenable to a more immediate effect, in addition to what the memory reconsolidation theory prescribes..."

      ***What does it mean to say that the fear memory might be amenable to a more immediate effect?

      We intended to state that the retrieval-extinction procedure can produce a short-term amnesia effect and have thus revised the text.

      (7) "Parallel to the behavioral manifestation of long- and short-term memory deficits, concurrent neural evidence supporting memory reconsolidation theory emphasizes the long-term effect of memory retrieval by hypothesizing that synapse degradation and de novo protein synthesis are required for reconsolidation."

      ***This sentence needs to be edited for clarity.

      We have rewritten this sentence:

      “Corresponding to the long-term behavioral manifestation, concurrent neural evidence supporting memory reconsolidation hypothesis emphasizes that synapse degradation and de novo protein synthesis are required for reconsolidation.”

      (8) "previous behavioral manipulations engendering the short-term declarative memory effect..."

      ***What is the declarative memory effect? It should be defined.

      We meant the amnesia on declarative memory research, such as the memory deficit caused by the think/no-think paradigms. Texts have been modified for clarity:

      “On the contrary, previous behavioral manipulations engendering the short-term amnesia on declarative memory, such as the think/no-think paradigm, hinges on the intact activities in brain areas such as dorsolateral prefrontal cortex (cognitive control) and its functional coupling with specific brain regions such as hippocampus (memory retrieval) (Anderson and Green, 2001; Wimber et al., 2015).”

      (9) "The declarative amnesia effect emerges much earlier due to the online functional activity modulation..."

      ***Even if the declarative memory amnesia effect had been defined, the reference to online functional activity modulation is not clear.

      We have rephrased the sentence:

      “The declarative amnesia effect arises much earlier due to the more instant modulation of functional connectivity, rather than the slower processes of new protein synthesis in these brain regions.”

      (10) "However, it remains unclear whether memory retrieval might also precipitate a short-term amnesia effect for the fear memory, in addition to the long-term prevention orchestrated by memory consolidation."

      ***I found this sentence difficult to understand on my first pass through the paper. I think it is because of the phrasing of memory retrieval. That is, memory retrieval does NOT precipitate any type of short-term amnesia for the fear memory: it is the retrieval-extinction protocol that produces something like short-term amnesia. Perhaps this sentence should also be edited for clarity.

      We have changed “memory retrieval” to “retrieval-extinction” where applicable.

      I will also note that the usage of "short-term" at this point in the paper is quite confusing: Does the retrieval-extinction protocol produce a short-term amnesia effect, which would be evidenced by some recovery of responding to the CS when tested after a sufficiently long delay? I don't believe that this is the intended meaning of "short-term" as used throughout the majority of the paper, right?

      By “short-term”, we meant the lack of fear expression in the test phase (measured by skin conductance responses) shortly after the retrieval-extinction procedure (30 mins in studies 1 & 2 and 1 hour in study 3). It does not indicate that the effect is by itself “short-lived”.

      (11) "To fully comprehend the temporal dynamics of the memory retrieval effect..."<br /> ***What memory retrieval effect? This needs some elaboration.

      We’ve changed the phrase “memory retrieval effect” to “retrieval-extinction effect” to refer to the effect of retrieval-extinction on fear amnesia.

      (12) "We hypothesize that the labile state triggered by the memory retrieval may facilitate different memory update mechanisms following extinction training, and these mechanisms can be further disentangled through the lens of temporal dynamics and cue-specificities."

      ***What does this mean? The first part of the sentence is confusing around the usage of the term "facilitate"; and the second part of the sentence that references a "lens of temporal dynamics and cue-specificities" is mysterious. Indeed, as all rats received the same retrieval-extinction exposures in Study 2, it is not clear how or why any differences between the groups are attributed to "different memory update mechanisms following extinction".

      As the reviewer mentioned, if only one time point data were collected, we cannot differentiate whether different memory update mechanisms are involved. In study 2, however, the 3 groups only differed on the time onsets the reinstatement test was conducted. Accordingly, our results showed that the fear amnesia effects for CS1 and CS2 cannot be simply explained by forgetting: different memory update mechanisms must be at work to explain the characteristics of the SCR related to both CS1 and CS2 at three different time scales (30min, 6h and 24h). It was based on these results, together with the results from the TMS study (study 3), that we proposed the involvement of a short-term memory update mechanism in addition to the reconsolidation related fear amnesia (which should become evident much later) induced by the retrieval-extinction protocol.

      (13) "In the first study, we aimed to test whether there is a short-term amnesia effect of fear memory retrieval following the fear retrieval-extinction paradigm."

      ***Again, the language is confusing. The phrase, "a short-term amnesia effect" implies that the amnesia itself is temporary; but I don't think that this implication is intended. The problem is specifically in the use of the phrase "a short-term amnesia effect of fear memory retrieval." To the extent that short-term amnesia is evident in the data, it is not due to retrieval per se but, rather, the retrieval-extinction protocol.

      We have changed the wordings and replaced “memory retrieval” with “retrieval-extinction” where applicable.

      (14) The authors repeatedly describe the case where there was a 24-hour interval between extinction and testing as consistent with previous research on fear memory reconsolidation. Which research exactly? That is, in studies where a CS re-exposure was combined with a drug injection, responding to the CS was disrupted in a final test of retrieval from long-term memory which typically occurred 24 hours after the treatment. Is that what the authors are referring to as consistent? If so, which aspect of the results are consistent with those previous findings? Perhaps the authors mean to say that, in the case where there was a 24-hour interval between extinction and testing, the results obtained here are consistent with previous research that has used the retrieval-extinction protocol. This would clarify the intended meaning greatly.

      Our 24 hour test results after the retrieval-extinction protocol was consistent with both pharmacological and behavioral intervention studies in fear memory reconsolidation studies (Kindt and Soeter, 2018, Kindt et al., 2009, Liu et al., 2014, Luo et al., 2015, Monfils et al., 2009, Nader et al., 2000, Schiller et al., 2013, Schiller et al., 2010, Xue et al., 2012) since the final test phase typically occurred 24 hours after the treatment. At the 24-hour interval, the memory reconsolidation effect would become evident either via drug administration or behavioral intervention (extinction training).

      DATA

      (15) Points about data:

      5A. The eight participants who were discontinued after Day 1 in study 1 were all from the no-reminder group. Can the authors please comment on how participants were allocated to the two groups in this experiment so that the reader can better understand why the distribution of non-responders was non-random (as it appears to be)?

      15B. Similarly, in study 2, of the 37 participants that were discontinued after Day 2, 19 were from Group 30 min, and 5 were from Group 6 hours. Can the authors comment on how likely these numbers are to have been by chance alone? I presume that they reflect something about the way that participants were allocated to groups, but I could be wrong.

      We went back and checked out data. As we mentioned in the supplementary materials, we categorized subjects as non-responders if their SCR response to any CS was less than 0.02  in Day 1 (fear acquisition). Most of the discontinued participants (non-responders) in the no-reminder group (study 1) and the 30min & 24 h groups (study 2) were when the heating seasons just ended or were yet to start, respectively. It has been documented that human body thermal conditions were related to the quality of the skin conductance response (SCR) measurements (Bauer et al., 2022, Vila, 2004). We suspect that the non-responders might be related to the body thermal conditions caused by the lack of central heating.

      15C. "Post hoc t-tests showed that fear memories were resilient after regular extinction training, as demonstrated by the significant difference between fear recovery indexes of the CS+ and CS- for the no-reminder group (t26 = 7.441, P < 0.001; Fig. 1e), while subjects in the reminder group showed no difference of fear recovery between CS+ and CS- (t29 = 0.797, P = 0.432, Fig. 1e)."

      ***Is the fear recovery index shown in Figure 1E based on the results of the first test trial only? How can there have been a "significant difference between fear recovery indexes of the CS+ and CS- for the no-reminder group" when the difference in responding to the CS+ and CS- is used to calculate the fear recovery index shown in 1E? What are the t-tests comparing exactly, and what correction is used to account for the fact that they are applied post-hoc?

      As we mentioned in the results section of the manuscript, the fear recovery index was defined as “the SCR difference between the first test trial and the last extinction trial of a specific CS”. We then calculated the “differential fear recovery index” (figure legends of Fig. 1e) between CS+ and CS- for both the reminder and no-reminder groups. The post-hoc t-tests were used to examine whether there were significant fear recoveries (compare to 0) in both the reminder (t<sub>29</sub> = 0.797, P = 0.432, Fig. 1e) and no-reminder (t<sub>26</sub> = 7.441, P  < 0.001; Fig. 1e) groups. We realize that the description of Bonferroni correction was not specified in the original manuscript and hence added in the revision where applicable.

      15D. "Finally, there is no statistical difference between the differential fear recovery indexes between CS+ in the reminder and no reminder groups (t55 = -2.022, P = 0.048; Fig. 1c, also see Supplemental Material for direct test for the test phase)."

      ***Is this statement correct - i.e., that there is no statistically significant difference in fear recovery to the CS+ in the reminder and no reminder groups? I'm sure that the authors would like to claim that there IS such a difference; but if such a difference is claimed, one would be concerned by the fact that it is coming through in an uncorrected t-test, which is the third one of its kind in this paragraph. What correction (for the Type 1 error rate) is used to account for the fact that the t-tests are applied post-hoc? And if no correction, why not?

      We are sorry about the typo.  The reviewer was correct that we meant to claim here that “… there is a significant difference between the differential fear recovery indexes between CS+ in the reminder and no-reminder groups (t<sub>55</sub> =- 2.022, P = 0.048; Fig. 1e)”.  Note that the t-test performed here was a confirmatory test following our two-way ANOVA with main effects of group (reminder vs. no-reminder) and time (last extinction trial vs. first test trial) on the differential CS SCR response (CS+ minus CS-) and we found a significant group x time interaction effect (F<sub>1.55</sub> = 4.087, P = 0.048, η<sup>2</sup> = 0.069). The significant difference between the differential fear recovery indexes was simply a re-plot of the interaction effect mentioned above and therefore no multiple correction is needed. We have reorganized the sequence of the sentences such that this t-test now directly follows the results of the ANOVA:

      “The interaction effect was confirmed by the significant difference between the differential fear recovery indexes between CS1+ and CS2+ in the reminder and no-reminder groups (t<sub>55</sub> \= -2.022, P \= 0.048; Figure 1E, also see Supplemental Material for the direct test of the test phase).”

      15E. In study 2, why is responding to the CS- so high on the first test trial in Group 30 min? Is the change in responding to the CS- from the last extinction trial to the first test trial different across the three groups in this study? Inspection of the figure suggests that it is higher in Group 30 min relative to Groups 6 hours and 24 hours. If this is confirmed by the analysis, it has implications for the fear recovery index which is partly based on responses to the CS-. If not for differences in the CS- responses, Groups 30 minutes and 6 hours are otherwise identical.

      Following the reviewer’s comments, we went back and calculated the mean SCR difference of CS- between the first test trial and the last extinction trial for all three studies (see Author response image 1 below). In study 1, there was no difference in the mean CS- SCR (between the first test trial and last extinction trial) between the reminder and no-reminder groups (Kruskal-Wallis test , panel a), though both groups showed significant fear recovery even in the CS- condition (Wilcoxon signed rank test, reminder: P = 0.0043, no-reminder: P = 0.0037). Next, we examined the mean SCR for CS- for the 30min, 6h and 24h groups in study 2 and found that there was indeed a group difference (one-way ANOVA,F<sub>2.76</sub> = 5.3462, P = 0.0067, panel b), suggesting that the CS- related SCR was influenced by the test time (30min, 6h or 24h). We also tested the CS- related SCR for the 4 groups in study 3 (where test was conducted 1 hour after the retrieval-extinction training) and found that across TMS stimulation types (PFC vs. VER) and reminder types (reminder vs. no-reminder) the ANOVA analysis did not yield main effect of TMS stimulation type (F<sub>1.71</sub> = 0.322, P = 0.572) nor main effect of reminder type (F<sub>1.71</sub> = 0.0499, P = 0.824, panel c). We added the R-VER group results in study 3 (see panel c) to panel b and plotted the CS- SCR difference across 4 different test time points and found that CS- SCR decreased as the test-extinction delay increased (Jonckheere-Terpstra test, P = 0.00028). These results suggest a natural “forgetting” tendency for CS- related SCR and highlight the importance of having the CS- as a control condition to which the CS+ related SCR was compared with.

      Author response image 1.

      15F. Was the 6-hour group tested at a different time of day compared to the 30-minute and 24-hour groups; and could this have influenced the SCRs in this group?

      For the 30min and 24h groups, the test phase can be arranged in the morning, in the afternoon or at night. However, for the 6h group, the test phase was inevitably in the afternoon or at night since we wanted to exclude the potential influence of night sleep on the expression of fear memory (see Author response table 1 below). If we restricted the test time in the afternoon or at night for all three groups, then the timing of their extinction training was not matched.

      Author response table 1.

      Nevertheless, we also went back and examined the data for the subjects only tested in the afternoon or at nights in the 30min and 24h groups to match with the 6h group where all the subjects were tested either in the afternoon or at night. According to Author response table 1 above, we have 17 subjects for the 30min group (9+8),18 subjects for the 24h group (9 + 9) and 26 subjects for the 6h group (12 + 14). As Author response image 2 shows, the SCR patterns in the fear acquisition, extinction and test phases were similar to the results presented in the original figure.

      Author response image 2.

      15G. Why is the range of scores in "thought control ability" different in the 30-minute group compared to the 6-hour and 24-hour groups? I am not just asking about the scale on the x-axis: I am asking why the actual distribution of the scores in thought control ability is wider for the 30-minute group?

      We went back and tested whether the TCAQ score variance was the same across three groups. We found that there was significant difference in the variance of the TCAQ score distribution across three groups (F<sub>2.155</sub> = 4.324, P = 0.015, Levene test). However, post-hoc analyses found that the variance of TCAQ is not significantly different between the 30min and 6h groups (F<sub>26.25</sub> = 0.4788, P = 0.0697), nor between the 30min and 24h groups (i>F<sub>26.25</sub> = 0.4692, P = 0.0625). To further validate our correlational results between the TCAQ score and the fear recovery index, we removed the TCAQ scores that were outside the TCAQ score range of the 6h & 24h groups from the 30min group (resulting in 4 “outliner” TCAQ scores in the 30min group, panel a in Author response image 3 below) and the Levene test confirmed that the variance of the TCAQ scores showed no difference across groups after removing the 4 “outliner” data points in the 30min group (i>F<sub>2.147</sub> = 0.74028, P = 0.4788). Even with the 4 “outliers” removed from the 30min group, the correlational analysis of the TCAQ scores and the fear recovery index still yielded significant result in the 30min group (beta = -0.0148, t = -3.731, P = 0.0006, see panel b below), indicating our results were not likely due to the inclusion of subjects with extreme TCAQ scores.

      Author response image 3.

      (16) During testing in each experiment, how were the various stimuli presented? That is, was the presentation order for the CS+ and CS- pseudorandom according to some constraint, as it had been in extinction? This information should be added to the method section.

      We mentioned the order of the stimuli in the testing phase in the methods section “… For studies 2 & 3, …a pseudo-random stimulus order was generated for fear acquisition and extinction phases of three groups with the rule that no same trial- type (CS1+, CS2+ and CS-) repeated more than twice. In the test phase, to exclude the possibility that the difference between CS1+ and CS2+ was simply caused by the presentation sequence of CS1+ and CS2+, half of the participants completed the test phase using a pseudo-random stimuli sequence and the identities of CS1+ and CS2+ reversed in the other half of the participants.”

      (17) "These results are consistent with previous research which suggested that people with better capability to resist intrusive thoughts also performed better in motivated dementia in both declarative and associative memories."

      ***Which parts of the present results are consistent with such prior results? It is not clear from the descriptions provided here why thought control ability should be related to the present findings or, indeed, past ones in other domains. This should be elaborated to make the connections clear.

      In the 30min group, we found that subjects’ TCAQ scores were negatively correlated with their fear recovery indices. That is, people with better capacity to resist intrusive thoughts were also less likely to experience the return of fear memory, which are consistent with previous results. Together with our brain stimulation results, the short-term amnesia is related to subject’s cognitive control ability and intact dlPFC functions. It is because of these similarities that we propose that the short-term amnesia might be related to the automatic memory suppression mechanism originated from the declarative memory research. Since we have not provided all the evidence at this point of the results section, we briefly listed the connections with previous declarative and associative memory research.

      Reviewer #2 (Public Review):

      The fear acquisition data is converted to a differential fear SCR and this is what is analysed (early vs late). However, the figure shows the raw SCR values for CS+ and CS- and therefore it is unclear whether the acquisition was successful (despite there being an "early" vs "late" effect - no descriptives are provided).

      As the reviewer mentioned, the fear acquisition data was converted to a differential fear SCR and we conducted a two-way mixed ANOVA (reminder vs. no-reminder) x time (early vs. late part of fear acquisition) on the differential SCRs. We found a significant main effect of time (early vs. late; F<sub>1.55</sub> = 6.545, P = 0.013, η<sup>2</sup> = 0.106), suggesting successful fear acquisition in both groups. Fig. 1c also showed the mean differential SCR for the latter half of the acquisition phase in both the reminder and no-reminder groups and there was no significant difference in acquired SCRs between groups (early acquisition: t<sub>55</sub> = -0.063, P = 0.950; late acquisition: t<sub>55</sub> = -0.318, P = 0.751; Fig. 1c).

      In Experiment 1 (Test results) it is unclear whether the main conclusion stems from a comparison of the test data relative to the last extinction trial ("we defined the fear recovery index as the SCR difference between the first test trial and the last extinction trial for a specific CS") or the difference relative to the CS- ("differential fear recovery index between CS+ and CS-"). It would help the reader assess the data if Figure 1e presents all the indexes (both CS+ and CS-). In addition, there is one sentence that I could not understand "there is no statistical difference between the differential fear recovery indexes between CS+ in the reminder and no reminder groups (P=0.048)". The p-value suggests that there is a difference, yet it is not clear what is being compared here. Critically, any index taken as a difference relative to the CS- can indicate recovery of fear to the CS+ or absence of discrimination relative to the CS-, so ideally the authors would want to directly compare responses to the CS+ in the reminder and no-reminder groups. The latter issue is particularly relevant in Experiment 2, in which the CS- seems to vary between groups during the test and this can obscure the interpretation of the result.

      In all the experiments, the fear recovery index (FRI) was defined as the SCR difference between the first test trial and the last extinction trial for any CS. Subsequently, the differential fear recovery index (FRI) was defined between the FRI of a specific CS+ and the FRI of the CS-. The differential FRI would effectively remove the non-specific time related effect (using the CS- FRI as the baseline). We have revised the text accordingly.

      As we responded to reviewer #1, the CS- fear recovery indices (FIR) for the reminder and no-reminder groups were not statistically different (Kruskal-Wallis test , panel a, Author response image 1), though both groups showed significant fear recovery even in the CS- condition (Wilcoxon signed rank test, reminder: P = 0.0043, no-reminder: P = 0.0037, panel a). Next, we examined the mean SCR for CS- for the 30min, 6h and 24h groups in study 2 and found that there was indeed a group difference (one-way ANOVA,  one-way ANOVA,F<sub>2.76</sub> = 5.3462, P = 0.0067, panel b), suggesting that the CS- SCR was influenced by the test time delay. We also tested the CS- SCR for the 4 groups in study 3 and found that across TMS stimulation types (PFC vs. VER) and reminder types (reminder vs. no-reminder) the ANOVA analysis did not yield main effect of TMS stimulation type (F<sub>1.71</sub> = 0.322, P = 0.572) nor main effect of reminder type (F<sub>1.71</sub> = 0.0499, P = 0.824, panel c). We added the R-VER group results in study 3 (see panel c) to panel b and plotted the CS- SCR difference across 4 different test time points and found that CS- SCR decreased as the test-extinction delay increased (Jonckheere-Terpstra test, P = 0.00028). These results suggest a natural “forgetting” tendency for the CS- fear recovery index and highlight the importance of having the CS- as a control condition to compare the CS+ recovery index with (resulting in the Differential recovery index). Parametric and non-parametric analyses were adopted based on whether the data met the assumptions for the parametric analyses.

      In Experiment 1, the findings suggest that there is a benefit of retrieval followed by extinction in a short-term reinstatement test. In Experiment 2, the same effect is observed on a cue that did not undergo retrieval before extinction (CS2+), a result that is interpreted as resulting from cue-independence, rather than a failure to replicate in a within-subjects design the observations of Experiment 1 (between-subjects). Although retrieval-induced forgetting is cue-independent (the effect on items that are suppressed [Rp-] can be observed with an independent probe), it is not clear that the current findings are similar. Here, both cues have been extinguished and therefore been equally exposed during the critical stage.

      We appreciate the reviewer’s insight on this issue. Although in the discussion we raised the possibility of memory suppression to account for the short-term amnesia effect, we did not intend to compare our paradigm side-by-side with retrieval-induced forgetting. In our previous work (Wang et al., 2021), we reported that active suppression effect of CS+ related fear memory during the standard extinction training generalized to other CS+, yielding a cue-independent effect. In the current experiments, we did not implement active suppression; instead, we used the CS+ retrieval-extinction paradigm. It is thus possible that the CS+ retrieval cue may function to facilitate automatic suppression. Indeed, in the no-reminder group (standard extinction) of study 1, we did observe the return of fear expression, suggesting the critical role of CS+ reminder before the extinction training. Based on the results mentioned above, we believe our short-term amnesia results were consistent with the hypothesis that the retrieval CS+ (reminder) might prompt subjects to adopt an automatic suppress mechanism in the following extinction training, yielding cue-independent amnesia effects.

      The findings in Experiment 2 suggest that the amnesia reported in Experiment 1 is transient, in that no effect is observed when the test is delayed by 6 hours. The phenomena whereby reactivated memories transition to extinguished memories as a function of the amount of exposure (or number of trials) is completely different from the phenomena observed here. In the former, the manipulation has to do with the number of trials (or the total amount of time) that the cues are exposed to. In the current study, the authors did not manipulate the number of trials but instead the retention interval between extinction and test. The finding reported here is closer to a "Kamin effect", that is the forgetting of learned information which is observed with intervals of intermediate length (Baum, 1968). Because the Kamin effect has been inferred to result from retrieval failure, it is unclear how this can be explained here. There needs to be much more clarity on the explanations to substantiate the conclusions.

      Indeed, in our studies, we did not manipulate the amount of exposure (or number of trials) but only the retention interval between extinction and test. Our results demonstrated that the retrieval-extinction protocol yielded the short-term amnesia on fear memory, qualitatively different from the reconsolidation related amnesia proposed in the previous literatures. After examining the temporal dynamics, cue-specificity and TCAQ association with the short-term amnesia, we speculated that the short-term effect might be related to an automatic suppression mechanism. Of course, further studies will be required to test such a hypothesis.

      Our results might not be easily compared with the “Kamin effect”, a term coined to describe the “retention of a partially learned avoidance response over varying time intervals” using a learning-re-learning paradigm (Baum, 1968, Kamin, 1957). However, the retrieval-extinction procedure used in our studies was different from the learning-re-learning paradigm in the original paper (Kamin, 1957) and the reversal-learning paradigm the reviewer mentioned (Baum, 1968).

      There are many results (Ryan et al., 2015) that challenge the framework that the authors base their predictions on (consolidation and reconsolidation theory), therefore these need to be acknowledged. Similarly, there are reports that failed to observe the retrieval-extinction phenomenon (Chalkia et al., 2020), and the work presented here is written as if the phenomenon under consideration is robust and replicable. This needs to be acknowledged.

      We thank the reviewer pointing out the related literature and have added a separate paragraph about other results in the discussion (as well as citing relevant references in the introduction) to provide a full picture of the reconsolidation theory to the audience:

      “It should be noted that while our long-term amnesia results were consistent with the fear memory reconsolidation literatures, there were also studies that failed to observe fear prevention (Chalkia, Schroyens, et al., 2020; Chalkia, Van Oudenhove, et al., 2020; Schroyens et al., 2023). Although the memory reconsolidation framework provides a viable explanation for the long-term amnesia, more evidence is required to validate the presence of reconsolidation, especially at the neurobiological level (Elsey et al., 2018). While it is beyond the scope of the current study to discuss the discrepancies between these studies, one possibility to reconcile these results concerns the procedure for the retrieval-extinction training. It has been shown that the eligibility for old memory to be updated is contingent on whether the old memory and new observations can be inferred to have been generated by the same latent cause (Gershman et al., 2017; Gershman and Niv, 2012). For example, prevention of the return of fear memory can be achieved through gradual extinction paradigm, which is thought to reduce the size of prediction errors to inhibit the formation of new latent causes (Gershman, Jones, et al., 2013). Therefore, the effectiveness of the retrieval-extinction paradigm might depend on the reliability of such paradigm in inferring the same underlying latent cause. Furthermore, other studies highlighted the importance of memory storage per se and suggested that memory retention was encoded in the memory engram cell ensemble connectivity whereas the engram cell synaptic plasticity is crucial for memory retrieval (Ryan et al., 2015; Tonegawa, Liu, et al., 2015; Tonegawa, Pignatelli, et al., 2015). It remains to be tested how the cue-independent short-term and cue-dependent long-term amnesia effects we observed could correspond to the engram cell synaptic plasticity and functional connectivity among engram cell ensembles (Figure 6). This is particularly important, since the cue-independent characteristic of the short-term amnesia suggest that either different memory cues fail to evoke engram cell activities, or the retrieval-extinction training transiently inhibits connectivity among engram cell ensembles. Finally, SCR is only one aspect of the fear expression, how the retrieval-extinction paradigm might affect subjects’ other emotional (such as the startle response) and cognitive fear expressions such as reported fear expectancy needs to be tested in future studies since they do not always align with each other (Kindt et al., 2009; Sevenster et al., 2012, 2013).”

      The parallels between the current findings and the memory suppression literature are speculated in the general discussion, and there is the conclusion that "the retrieval-extinction procedure might facilitate a spontaneous memory suppression process". Because one of the basic tenets of the memory suppression literature is that it reflects an "active suppression" process, there is no reason to believe that in the current paradigm, the same phenomenon is in place, but instead, it is "automatic". In other words, the conclusions make strong parallels with the memory suppression (and cognitive control) literature, yet the phenomena that they observed are thought to be passive (or spontaneous/automatic).

      Ultimately, it is unclear why 10 mins between the reminder and extinction learning will "automatically" suppress fear memories. Further down in the discussion, it is argued that "For example, in the well-known retrieval-induced forgetting (RIF) phenomenon, the recall of a stored memory can impair the retention of related long-term memory and this forgetting effect emerges as early as 20 minutes after the retrieval procedure, suggesting memory suppression or inhibition can occur in a more spontaneous and automatic manner". I did not follow with the time delay between manipulation and test (20 mins) would speak about whether the process is controlled or automatic.

      In our previous research, we showed that the memory suppression instruction together with the extinction procedure successfully prevented the return of fear expression in the reinstatement test trials 30mins after the extinction training (Wang et al., 2021). In the current experiments, we replaced the suppression instruction with the retrieval cue before the extinction training (retrieval-extinction protocol) and observed similar short-term amnesia effects. These results prompted us to hypothesize in the discussion that the retrieval cue might facilitate an automatic suppression process. We made the analogy to RIF phenomenon in the discussion to suggest that the suppression of (competing) memories could be unintentional and fast (20 mins), both of which were consistent with our results. We agree with the reviewer that this hypothesis is more of a speculation (hence in the discussion), and more studies are required to further test such a hypothesis. However, what we want to emphasize in this paper is the report of the short-term amnesia effects which were clearly not related to the memory reconsolidation effect in a variety of aspects.

      Among the many conclusions, one is that the current study uncovers the "mechanism" underlying the short-term effects of retrieval extinction. There is little in the current report that uncovers the mechanism, even in the most psychological sense of the mechanism, so this needs to be clarified. The same applies to the use of "adaptive".

      Whilst I could access the data on the OFS site, I could not make sense of the Matlab files as there is no signposting indicating what data is being shown in the files. Thus, as it stands, there is no way of independently replicating the analyses reported.

      We have re-organized data on the OFS site, and they should be accessible now.

      The supplemental material shows figures with all participants, but only some statistical analyses are provided, and sometimes these are different from those reported in the main manuscript. For example, the test data in Experiment 1 is analysed with a two-way ANOVA with the main effects of group (reminder vs no-reminder) and time (last trial of extinction vs first trial of the test) in the main report. The analyses with all participants in the sup mat used a mixed two-way ANOVA with a group (reminder vs no reminder) and CS (CS+ vs CS-). This makes it difficult to assess the robustness of the results when including all participants. In addition, in the supplementary materials, there are no figures and analyses for Experiment 3.

      We are sorry for the lack of clarity in the supplementary materials. We have supplementary figures Fig. S1 & S2 for the data re-analysis with all the responders (learners + non-learners). The statistical analyses performed on the responders in both figures yielded similar results as those in the main text. For other analyses reported in the supplementary materials, we specifically provided different analysis results to demonstrate the robustness of our results. For example, to rule out the effects we observed in two-way ANOVA in the main text may be driven by the different SCR responses on the last extinction trial, we only tested the two-way ANOVA for the first trial SCR of test phase and these analyses provided similar results. Please note we did not include non-learners in these analyses (the texts of the supplementary materials).

      Since we did not exclude any non-learners in study 3, all the results were already reported in the main text.

      One of the overarching conclusions is that the "mechanisms" underlying reconsolidation (long term) and memory suppression (short term) phenomena are distinct, but memory suppression phenomena can also be observed after a 7-day retention interval (Storm et al., 2012), which then questions the conclusions achieved by the current study.

      As we stated before, the focus of the manuscript was to demonstrate a novel short-term fear amnesia effect following the retrieval-extinction procedure. We discussed memory suppression as one of the potential mechanisms for such a short-term effect. In fact, the durability of the memory suppression effect is still under debate. Although Storm et al. (2012) suggested that the retrieval-induced forgetting can persist for as long as a week, other studies, however, failed to observe long-term forgetting (after 24 hrs; (Carroll et al., 2007, Chan, 2009). It is also worth noting that Storm et al. (2012) tested RIF one week later using half of the items the other half of which were tested 5 minutes after the retrieval practice. Therefore, it can be argued that there is a possibility that the long-term RIF effect is contaminated by the test/re-test process on the same set of (albeit different) items at different time onsets (5mins & 1 week).

      Reviewer #3 (Public Review):

      (1) The entire study hinges on the idea that there is memory 'suppression' if (1) the CS+ was reminded before extinction and (2) the reinstatement and memory test takes place 30 minutes later (in Studies 1 & 2). However, the evidence supporting this suppression idea is not very strong. In brief, in Study 1, the effect seems to only just reach significance, with a medium effect size at best, and, moreover, it is unclear if this is the correct analysis (which is a bit doubtful, when looking at Figure 1D and E). In Study 2, there was no optimal control condition without reminder and with the same 30-min interval (which is problematic, because we can assume generalization between CS1+ and CS2+, as pointed out by the authors, and because generalization effects are known to be time-dependent). Study 3 is more convincing, but entails additional changes in comparison with Studies 1 and 2, i.e., applications of cTBS and an interval of 1 hour instead of 30 minutes (the reason for this change was not explained). So, although the findings of the 3 studies do not contradict each other and are coherent, they do not all provide strong evidence for the effect of interest on their own.

      Related to the comment above, I encourage the authors to double-check if this statement is correct: "Also, our results remain robust even with the "non-learners" included in the analysis (Fig. S1 in the Supplemental Material)". The critical analysis for Study 1 is a between-group comparison of the CS+ and CS- during the last extinction trial versus the first test trial. This result only just reached significance with the selected sample (p = .048), and Figures 1D and E even seem to suggest otherwise. I doubt that the analysis would reach significance when including the "non-learners" - assuming that this is what is shown in Supplemental Figure 1 (which shows the data from "all responded participants").

      Our subjects were categorized based on the criteria specified in supplementary table S1. More specifically, we excluded the non-responders (Mean CS SCR < 0.02 uS  in the fear acquisition phase), and non-learners and focused our analyses on the learners. Non-responders were dismissed after day 1 (the day of fear acquisition), but both learners and non-learners finished the experiments. This fact gave us the opportunity to examine data for both the learners and the responders (learners + non-learners). What we showed in fig. 1D and E were differential SCRs (CS+ minus CS-) of the last extinction trials and the differential fear recovery indices (CS+ minus CS-), respectively. We have double checked the figures and both the learners (Fig. 1) and the responders (i.e. learners and non-learners, supplementary Fig. 1) results showed significant differences between the reminder and no-reminder groups on the differential fear recovery index.

      Also related to the comment above, I think that the statement "suggesting a cue-independent short-term amnesia effect" in Study 2 is not correct and should read: "suggesting extinction of fear to the CS1+ and CS2+", given that the response to the CS+'s is similar to the response to the CS-, as was the case at the end of extinction. Also the next statement "This result indicates that the short-term amnesia effect observed in Study 2 is not reminder-cue specific and can generalize to the non-reminded cues" is not fully supported by the data, given the lack of an appropriate control group in this study (a group without reinstatement). The comparison with the effect found in Study 1 is difficult because the effect found there was relatively small (and may have to be double-checked, see remarks above), and it was obtained with a different procedure using a single CS+. The comparison with the 6-h and 24-h groups of Study 2 is not helpful as a control condition for this specific question (i.e., is there reinstatement of fear for any of the CS+'s) because of the large procedural difference with regard to the intervals between extinction and reinstatement (test).

      In Fig. 2e, we showed the differential fear recovery indices (FRI) for the CS+ in all three groups. Since the fear recovery index (FRI) was calculated as the SCR difference between the first test trial and the last extinction trial for any CS, the differential fear recovery indices (difference between CS+ FRI and CS- FRI) not significantly different from 0 should be interpreted as the lack of fear expression in the test phase. Since spontaneous recovery, reinstatement and renewal are considered canonical phenomena in demonstrating that extinction training does not really “erase” conditioned fear response, adding the no-reinstatement group as a control condition would effectively work as the spontaneous recovery group and the comparison between the reinstatement and no-instatement groups turns into testing the difference in fear recovery using different methods (reinstatement vs. spontaneous recovery).

      (2) It is unclear which analysis is presented in Figure 3. According to the main text, it either shows the "differential fear recovery index between CS+ and CS-" or "the fear recovery index of both CS1+ and CS2+". The authors should clarify what they are analyzing and showing, and clarify to which analyses the ** and NS refer in the graphs. I would also prefer the X-axes and particularly the Y-axes of Fig. 3a-b-c to be the same. The image is a bit misleading now. The same remarks apply to Figure 5.

      We are sorry about the lack of clarity here. Figures 3 & 5 showed the correlational analyses between TCAQ and the differential fear recovery index (FRI) between CS+ and CS-. That is, the differential FRI of CS1+ (CS1+ FRI minus CS- FRI) and the differential FRI of CS2+ (CS2+ FRI minus CS- FRI).

      We have rescaled both X and Y axes for figures 3 & 5 (please see the revised figures). 

      (3) In general, I think the paper would benefit from being more careful and nuanced in how the literature and findings are represented. First of all, the authors may be more careful when using the term 'reconsolidation'. In the current version, it is put forward as an established and clearly delineated concept, but that is not the case. It would be useful if the authors could change the text in order to make it clear that the reconsolidation framework is a theory, rather than something that is set in stone (see e.g., Elsey et al., 2018 (https://doi.org/10.1037/bul0000152), Schroyens et al., 2022 (https://doi.org/10.3758/s13423-022-02173-2)).

      In addition, the authors may want to reconsider if they want to cite Schiller et al., 2010 (https://doi.org/10.1038/nature08637), given that the main findings of this paper, nor the analyses could be replicated (see, Chalkia et al., 2020 (https://doi.org/10.1016/j.cortex.2020.04.017; https://doi.org/10.1016/j.cortex.2020.03.031).

      We thank the reviewer’s comments and have incorporated the mentioned papers into our revised manuscript by pointing out the extant debate surrounding the reconsolidation theory in the introduction:

      “Pharmacological blockade of protein synthesis and behavioral interventions can both eliminate the original fear memory expression in the long-term (24 hours later) memory test ( Lee, 2008; Lee et al., 2017; Schiller et al., 2013; Schiller et al., 2010), resulting in the cue-specific fear memory deficit (Debiec et al., 2002; Lee, 2008; Nader, Schafe, & LeDoux, 2000). For example, during the reconsolidation window, retrieving a fear memory allows it to be updated through extinction training (i.e., the retrieval-extinction paradigm (Lee, 2008; Lee et al., 2017; Schiller et al., 2013; Schiller et al., 2010), but also see (Chalkia, Schroyens, et al., 2020; Chalkia, Van Oudenhove, et al., 2020; D. Schiller, LeDoux, & Phelps, 2020). ”

      As well as in the discussion:

      “It should be noted that while our long-term amnesia results were consistent with the fear memory reconsolidation literatures, there were also studies that failed to observe fear prevention (Chalkia, Schroyens, et al., 2020; Chalkia, Van Oudenhove, et al., 2020; Schroyens et al., 2023). Although the memory reconsolidation framework provides a viable explanation for the long-term amnesia, more evidence is required to validate the presence of reconsolidation, especially at the neurobiological level (Elsey et al., 2018). While it is beyond the scope of the current study to discuss the discrepancies between these studies, one possibility to reconcile these results concerns the procedure for the retrieval-extinction training. It has been shown that the eligibility for old memory to be updated is contingent on whether the old memory and new observations can be inferred to have been generated by the same latent cause (Gershman et al., 2017; Gershman and Niv, 2012). For example, prevention of the return of fear memory can be achieved through gradual extinction paradigm, which is thought to reduce the size of prediction errors to inhibit the formation of new latent causes (Gershman, Jones, et al., 2013). Therefore, the effectiveness of the retrieval-extinction paradigm might depend on the reliability of such paradigm in inferring the same underlying latent cause. Furthermore, other studies highlighted the importance of memory storage per se and suggested that memory retention was encoded in the memory engram cell ensemble connectivity whereas the engram cell synaptic plasticity is crucial for memory retrieval (Ryan et al., 2015; Tonegawa, Liu, et al., 2015; Tonegawa, Pignatelli, et al., 2015). It remains to be tested how the cue-independent short-term and cue-dependent long-term amnesia effects we observed could correspond to the engram cell synaptic plasticity and functional connectivity among engram cell ensembles (Figure 6). This is particularly important, since the cue-independent characteristic of the short-term amnesia suggest that either different memory cues fail to evoke engram cell activities, or the retrieval-extinction training transiently inhibits connectivity among engram cell ensembles. Finally, SCR is only one aspect of the fear expression, how the retrieval-extinction paradigm might affect subjects’ other emotional (such as the startle response) and cognitive fear expressions such as reported fear expectancy needs to be tested in future studies since they do not always align with each other (Kindt et al., 2009; Sevenster et al., 2012, 2013).”

      Relatedly, it should be clarified that Figure 6 is largely speculative, rather than a proven model as it is currently presented. This is true for all panels, but particularly for panel c, given that the current study does not provide any evidence regarding the proposed reconsolidation mechanism.

      We agree with the reviewer that Figure 6 is largely speculative. We realize that there are still debates regarding the retrieval-extinction procedure and the fear reconsolidation hypothesis. We have provided a more elaborated discussion and pointed out that figure 6 is only a working hypothesis and more work should be done to test such a hypothesis:

      “Although mixed results have been reported regarding the durability of suppression effects in the declarative memory studies (Meier et al., 2011; Storm et al., 2012), future research will be needed to investigate whether the short-term effect we observed is specifically related to associative memory or the spontaneous nature of suppression (Figure 6C).”

      Lastly, throughout the paper, the authors equate skin conductance responses (SCR) with fear memory. It should at least be acknowledged that SCR is just one aspect of a fear response, and that it is unclear whether any of this would translate to verbal or behavioral effects. Such effects would be particularly important for any clinical application, which the authors put forward as the ultimate goal of the research.

      Again, we agree with the reviewer on this issue, and we have acknowledged that SCR is only one aspect of the fear response and caution should be exerted in clinical application:

      “Finally, SCR is only one aspect of the fear expression, how the retrieval-extinction paradigm might affect subjects’ other emotional (such as the startle response) and cognitive fear expressions such as reported fear expectancy needs to be tested in future studies since they do not always align with each other (Kindt et al., 2009; Sevenster et al., 2012, 2013).”

      (4) The Discussion quite narrowly focuses on a specific 'mechanism' that the authors have in mind. Although it is good that the Discussion is to the point, it may be worthwhile to entertain other options or (partial) explanations for the findings. For example, have the authors considered that there may be an important role for attention? When testing very soon after the extinction procedure (and thus after the reminder), attentional processes may play an important role (more so than with longer intervals). The retrieval procedure could perhaps induce heightened attention to the reminded CS+ (which could be further enhanced by dlPFC stimulation)?

      We thank the reviewer for this suggestion and have added more discussion on the potential mechanisms involved. Unfortunately, since the literature on attention and fear recovery is rather scarce, it is even more of a speculation given our study design and results are mainly about subjects’ skin conductance responses (SCR).

      (5) There is room for improvement in terms of language, clarity of the writing, and (presentation of the) statistical analyses, for all of which I have provided detailed feedback in the 'Recommendations for the authors' section. Idem for the data availability; they are currently not publicly available, in contrast with what is stated in the paper. In addition, it would be helpful if the authors would provide additional explanation or justification for some of the methodological choices (e.g., the 18-s interval and why stimulate 8 minutes after the reminder cue, the choice of stimulation parameters), and comment on reasons for (and implications of) the large amount of excluded participants (>25%).

      We have addressed the data accessibility issue and added the justifications for the methodological choices as well as the excluded participants. As we mentioned in the manuscript and the supplementary materials, adding the non-learners into data analysis did not change the results. Since the non-responders discontinued after Day 1 due to their non-measurable spontaneous SCR signals towards different CS, it’s hard to speculate whether or how the results might have changed. However, participants’ exclusion rate in the SCR studies were relatively high (Hu et al., 2018, Liu et al., 2014, Raio et al., 2017, Schiller et al., 2010, Schiller et al., 2012, Wang et al., 2021). The non-responders were mostly associated with participants being tested in the winter in our tasks. Cold weather and dry skins in the winter are likely to have caused the SCR hard to measure (Bauer et al., 2022, Vila, 2004). Different intervals between the reinstating US (electric shock) and the test trials were used in the previous literature such as 10min (Schiller et al., 2010, Schiller et al., 2013) and 18 or 19s (Kindt and Soeter, 2018, Kindt et al., 2009, Wang et al., 2021). We stuck with the 18s reinstatement interval in the current experiment. For the cTBS stimulation, since the stimulation itself lasted less than 2mins, we started the cTBS 8min after the onset of reminder cue to ensure that any effect caused by the cTBS stimulation occurred during the hypothesized time window, where the old fear memory becomes labile after memory retrieval. All the stimulation parameters were determined based on previous literature, which showed that with the transcranial magnetic stimulation (TMS) on the human dorsolateral prefrontal cortex could disrupt fear memory reconsolidation (Borgomaneri et al., 2020, Su et al., 2022).

      Finally, I think several statements made in the paper are overly strong in light of the existing literature (or the evidence obtained here) or imply causal relationships that were not directly tested.

      We have revised the texts accordingly.

      Reviewer #2 (Recommendations For The Authors):

      On numerous occasions there are typos and the autocorrect has changed "amnesia" for "dementia".

      We are sorry about this mistake and have revised the text accordingly.

      Reviewer #3 (Recommendations For The Authors):

      *"Neither of the studies reported in this article was preregistered. The data for both studies are publicly accessible at https://osf.io/9agvk". This excerpt from the text suggests that there are 2 studies, but there are 3 in the paper. Also, the data are only accessible upon request, not publicly available. I haven't requested them, as this could de-anonymize me as a reviewer.

      We are sorry for the accessibility of the link. The data should be available to the public now.

      *Please refrain from causal interpretations when they are not supported by the data:

      - Figure 3 "thought-control ability only affected fear recovery"; a correlation does not provide causal evidence.

      - "establishing a causal link between the dlPFC activity and short-term fear amnesia." I feel this statement is too strong; to what extent do we know for sure what the applied stimulation of (or more correct: near) the dlPFC does exactly?

      We thank the reviewer for the suggestion and have changed the wording related to figure 3. On the other hand, we’d like to argue that the causal relationship between the dlPFC activity and short-term fear amnesia is supported by the results from study 3. Although the exact functional role of the TMS on dlPFC can be debated, the fact that the TMS stimulation on the dlPFC (compared to the vertex group) brought back the otherwise diminished fear memory expression can be viewed as the causal evidence between the dlPFC activity and short-term fear amnesia.

      *The text would benefit from language editing, as it contains spelling and grammar mistakes, as well as wording that is vague or inappropriate. I suggest the authors check the whole text, but below are already some excerpts that caught my eye:

      "preludes memory reconsolidation"; "old fear memory can be updated"; "would cause short-term memory deficit"; "the its functional coupling"; "Subjects (...) yielded more severe amnesia in the memory suppression tasks"; "memory retrieval might also precipitate a short-term amnesia effect"; "more SEVERE amnesia in the memory suppression tasks"; "the effect size of reinstatement effect"; "the previous literatures"; "towards different CS"; "failed to show SCR response to the any stimuli"; "significant effect of age of TMS"; "each subject' left hand"; "latter half trials"; "Differntial fear recovery"; "fear dementia"; "the fear reinstatement effects at different time scale is related to"; "fear reocery index"; "thought-control abiliites"; "performed better in motivated dementia"; "we tested that in addition to the memory retrieval cue (reminder), whether the"; "during reconsolidation window"; "consisitent with the short-term dementia"; "low level of shock (5v)"

      We thank the reviewer for thorough reading and sorry about typos in the manuscript. We have corrected typos and grammar mistakes as much as we can find.

      *In line with the remark above, there are several places where the text could still be improved.

      - The last sentence of the Abstract is rather vague and doesn't really add anything.

      - Please reword or clarify: "the exact functional role played by the memory retrieval remains unclear".

      - Please reword or clarify: "the unbinding of the old memory trace".

      - "suggesting that the fear memory might be amenable to a more immediate effect, in addition to what the memory reconsolidation theory prescribes" shouldn't this rather read "in contrast with"?

      We have modified the manuscript.

      - In the Introduction, the authors state: "Specifically, memory reconsolidation effect will only be evident in the long-term (24h) memory test due to its requirement of new protein synthesis and is cue-dependent". They then continue about the more immediate memory update mechanisms that they want to study, but it is unclear from how the rationale is presented whether (and why (not)) they also expect this mechanism to be cue-dependent.

      Most of the previous studies on the fear memory reconsolidation using CS as the memory retrieval cues have demonstrated that the reconsolidation effect is cue-dependent (Kindt and Soeter, 2018, Kindt et al., 2009, Monfils et al., 2009, Nader et al., 2000, Schiller et al., 2013, Schiller et al., 2010, Xue et al., 2012). However, other studies using unconditioned stimulus retrieval-extinction paradigm showed that such protocol was able to prevent the return of fear memory expression associated with different CSs (Liu et al., 2014, Luo et al., 2015). In our task, we used CS+ as the memory retrieval cues and our results were consistent with results from previous studies using similar paradigms.

      - "The effects of cTBS over the right dlPFC after the memory reactivation were assessed using the similar mixed-effect four-way ANOVA". Please clarify what was analyzed here.<br /> - "designing novel treatment of psychiatric disorders". Please make this more concrete or remove the statement.

      This sentence was right after a similar analysis performed in the previous paragraph. While the previous graph focused on how the SCRs in the acquisition phase were modulated by factors such as CS+ (CS1+ and CS2+), reminder (reminder vs. no-reminder), cTBS site (right dlPFC vs. vertex) and trial numbers, this analysis focused instead on the SCR responses in the extinction training phase. We have made the modifications as the reviewer suggested.

      *I have several concerns related to the (presentation) of the statistical analyses/results:<br /> - Some statistical analyses, as well as calculation of certain arbitrary indices (e.g., differential fear recovery index) are not mentioned nor explained in the Methods section, but only mentioned in the Results section.

      We have added the explanation of the differential fear recovery index into the methods section:

      “To measure the extent to which fear returns after the presentation of unconditioned stimuli (US, electric shock) in the test phase, we defined the fear recovery index as the SCR difference between the first test trial and the last extinction trial for a specific CS for each subject. Similarly, in studies 2 and 3, differential fear recovery index was defined as the difference between fear recovery indices of CS+ and CS- for both CS1+ and CS2+.”

      - Figure 1C-E: It is unclear what the triple *** mean. Do they have the same meaning in Figure 1C and Figure 1E? I am not sure that that makes sense. The meaning is not explained in the figure caption (I think it is different from the single asterisk*) and is not crystal clear from the main text either.

      We explained the triple *** in the figure legend (Fig. 1): ***P < 0.001. The asterisk placed within each bar in Figure 1C-E indicates the statistical results of the post-hoc test of whether each bar was significant. For example, the *** placed inside bars in Figure 1E indicates that the differential fear recovery index is statistically significant in the no-reminder group (P < 0.001).

      - Supplemental Figure 1: "with all responded participants" Please clarify how you define 'responded participants' and include the n's.

      We presented the criteria for both the responder/non-responder and the learner/non-learner in the table of the supplementary materials and reported the number of subjects in each category (please see supplement Table 1).

      - "the differential SCRs (difference between CS+ and CS-) for the CS+". Please clarify what this means and/or how it is calculated exactly.

      Sorry, it means the difference between the SCRs invoked by CS+ and CS- for both CS1+ (CS1+ minus CS-) and CS2+ (CS2+ minus CS-).

      *I suggest that the authors provide a bit more explanation about the thought-control ability questionnaire. For example, the type of items, etc, as this is not a very commonly used questionnaire in the fear conditioning field.

      We provided a brief introduction to the thought-control ability questionnaire in the methods section:

      “The control ability over intrusive thought was measured by the 25-item Thought-Control Ability Questionnaire (TCAQ) scle(30). Participants were asked to rate on a five-point Likert-type scale the extent to which they agreed with the statement from 1 (completely disagree) to 5 (completely agree). At the end of the experiments, all participants completed the TCAQ scale to assess their perceived control abilities over intrusive thoughts in daily life(17).”

      We have added further description of the item types to the TCAQ scale.

      *The authors excluded more than 25% of the participants. It would be interesting to hear reasons for this relatively large number and some reflection on whether they think this selection affects their results (e.g., could being a (non)responder in skin conductance influence the susceptibility to reactivation-extinction in some way?).

      Participants exclusion rate in the SCR studies were relatively high (Hu et al., 2018, Liu et al., 2014, Raio et al., 2017, Schiller et al., 2010, Schiller et al., 2012, Wang et al., 2021). The non-responders were mostly associated with participants being tested in the winter in our tasks. Cold weather and dry skins in the winter are likely to have caused the SCR hard to measure (Bauer et al., 2022, Vila, 2004).

      *Minor comments that the authors may want to consider:

      - Please explain abbreviations upon first use, e.g., TMS.

      - In Figure 6, it is a bit counterintuitive that the right Y-axis goes from high to low.

      We added the explanation of TMS:

      “Continuous theta burst stimulation (cTBS), a specific form of repetitive transcranial magnetic stimulation (rTMS)…”

      We are sorry and agree that the right Y-axis was rather counterintuitive. However, since the direction of the fear recovery index (which was what we measured in the experiment) and the short/long-term amnesia effect are of the opposite directions, plotting one index from low to high would inevitably cause the other index to go from high to low.

      Reference:

      Anderson, M. C. and Floresco, S. B. 2022. Prefrontal-hippocampal interactions supporting the extinction of emotional memories: The retrieval stopping model. Neuropsychopharmacology, 47, 180-195.

      Anderson, M. C. and Green, C. 2001. Suppressing unwanted memories by executive control. Nature, 410, 366-9.

      Bauer, E. A., Wilson, K. A. and Macnamara, A. 2022. 3.03 - cognitive and affective psychophysiology. In: ASMUNDSON, G. J. G. (ed.) Comprehensive clinical psychology (second edition). Oxford: Elsevier.

      Baum, M. 1968. Reversal learning of an avoidance response and the kamin effect. J Comp Physiol Psychol, 66, 495-7.

      Borgomaneri, S., Battaglia, S., Garofalo, S., Tortora, F., Avenanti, A. and Di Pellegrino, G. 2020. State-dependent tms over prefrontal cortex disrupts fear-memory reconsolidation and prevents the return of fear. Curr Biol, 30, 3672-3679.e4.

      Cain, C. K., Blouin, A. M. and Barad, M. 2003. Temporally massed cs presentations generate more fear extinction than spaced presentations. J Exp Psychol Anim Behav Process, 29, 323-33.

      Carroll, M., Campbell-Ratcliffe, J., Murnane, H. and Perfect, T. 2007. Retrieval-induced forgetting in educational contexts: Monitoring, expertise, text integration, and test format. European Journal of Cognitive Psychology, 19, 580-606.

      Chan, J. C. K. 2009. When does retrieval induce forgetting and when does it induce facilitation? Implications for retrieval inhibition, testing effect, and text processing. Journal of Memory and Language, 61, 153-170.

      Gagnepain, P., Henson, R. N. and Anderson, M. C. 2014. Suppressing unwanted memories reduces their unconscious influence via targeted cortical inhibition. Proc Natl Acad Sci U S A, 111, E1310-9.

      Gershman, S. J., Jones, C. E., Norman, K. A., Monfils, M. H. and Niv, Y. 2013. Gradual extinction prevents the return of fear: Implications for the discovery of state. Front Behav Neurosci, 7, 164.

      Gershman, S. J., Monfils, M. H., Norman, K. A. and Niv, Y. 2017. The computational nature of memory modification. Elife, 6.

      Hu, J., Wang, W., Homan, P., Wang, P., Zheng, X. and Schiller, D. 2018. Reminder duration determines threat memory modification in humans. Sci Rep, 8, 8848.

      Kamin, L. J. 1957. The retention of an incompletely learned avoidance response. J Comp Physiol Psychol, 50, 457-60.

      Kindt, M. and Soeter, M. 2018. Pharmacologically induced amnesia for learned fear is time and sleep dependent. Nat Commun, 9, 1316.

      Kindt, M., Soeter, M. and Vervliet, B. 2009. Beyond extinction: Erasing human fear responses and preventing the return of fear. Nat Neurosci, 12, 256-8.

      Liu, J., Zhao, L., Xue, Y., Shi, J., Suo, L., Luo, Y., Chai, B., Yang, C., Fang, Q., Zhang, Y., Bao, Y., Pickens, C. L. and Lu, L. 2014. An unconditioned stimulus retrieval extinction procedure to prevent the return of fear memory. Biol Psychiatry, 76, 895-901.

      Luo, Y.-X., Xue, Y.-X., Liu, J.-F., Shi, H.-S., Jian, M., Han, Y., Zhu, W.-L., Bao, Y.-P., Wu, P., Ding, Z.-B., Shen, H.-W., Shi, J., Shaham, Y. and Lu, L. 2015. A novel ucs memory retrieval-extinction procedure to inhibit relapse to drug seeking. Nature Communications, 6, 7675.

      Monfils, M. H., Cowansage, K. K., Klann, E. and Ledoux, J. E. 2009. Extinction-reconsolidation boundaries: Key to persistent attenuation of fear memories. Science, 324, 951-5.

      Nader, K., Schafe, G. E. and Le Doux, J. E. 2000. Fear memories require protein synthesis in the amygdala for reconsolidation after retrieval. Nature, 406, 722-6.

      Raio, C. M., Hartley, C. A., Orederu, T. A., Li, J. and Phelps, E. A. 2017. Stress attenuates the flexible updating of aversive value. Proc Natl Acad Sci U S A, 114, 11241-11246.

      Schiller, D., Kanen, J. W., Ledoux, J. E., Monfils, M. H. and Phelps, E. A. 2013. Extinction during reconsolidation of threat memory diminishes prefrontal cortex involvement. Proc Natl Acad Sci U S A, 110, 20040-5.

      Schiller, D., Monfils, M. H., Raio, C. M., Johnson, D. C., Ledoux, J. E. and Phelps, E. A. 2010. Preventing the return of fear in humans using reconsolidation update mechanisms. Nature, 463, 49-53.

      Schiller, D., Raio, C. M. and Phelps, E. A. 2012. Extinction training during the reconsolidation window prevents recovery of fear. J Vis Exp, e3893.

      Su, S., Deng, J., Yuan, K., Gong, Y., Zhang, Y., Li, H., Cao, K., Huang, X., Lin, X., Wu, P., Xue, Y., Bao, Y., Shi, J., Shi, L. and Lu, L. 2022. Continuous theta-burst stimulation over the right dorsolateral prefrontal cortex disrupts fear memory reconsolidation in humans. iScience, 25, 103614.

      Vila, J. 2004. Psychophysiological assessment. In: SPIELBERGER, C. D. (ed.) Encyclopedia of applied psychology. New York: Elsevier.

      Wang, Y., Zhu, Z., Hu, J., Schiller, D. and Li, J. 2021. Active suppression prevents the return of threat memory in humans. Commun Biol, 4, 609.

      Xue, Y. X., Luo, Y. X., Wu, P., Shi, H. S., Xue, L. F., Chen, C., Zhu, W. L., Ding, Z. B., Bao, Y. P., Shi, J., Epstein, D. H., Shaham, Y. and Lu, L. 2012. A memory retrieval-extinction procedure to prevent drug craving and relapse. Science, 336, 241-5.

      Zhu, Z., Anderson, M. C. and Wang, Y. 2022. Inducing forgetting of unwanted memories through subliminal reactivation. Nature communications, 13, 6496-6496.

    1. Author response:

      The following is the authors’ response to the previous reviews.

      Recommendations for the authors:

      Reviewer #1:

      The authors have thoroughly changed the manuscript and addressed most of my concerns. I appreciate adding the activity assays of the C115/120S mutants, however, I suggest that the authors embed and also discuss these data more clearly. It also escaped my attention earlier that the positioning of the disulfide bond is 117-122 in the deposited PDBs instead of 115-120. The authors should carefully check which positioning is correct here.

      We thank reviewer #1 for his or her careful assessment of our revised manuscript. As suggested, we detailed the results section “CrSBPase enzymatic activity” with additional numerical values, and discussed more clearly the comparisons of results for activity assays of mutants C115S and C120S in the section “Oligomeric states of CrSBPase”. Residues numbering was carefully proof-checked throughout the manuscript for correctness and homogeneity. C115 and C120 are numbered according to best databases consensus, ie. GenBank and Uniprot, and may differ from one database to another (including PDB) due to varying numbering rules. We clarified the chosen nomenclature in methods section “Cloning and mutagenesis of CrSBPase expression plasmids”.

      Line 246-250: I think it is evident that the two SBPase structures superpose well given the sequence identity of more than 70%. However, it would be great to include a superposition of the two structures in Figure 1, especially with regard to the region harboring C115 and C120.

      We added a panel showing superimposition of CrSBPase 7b2o and PpSBPase 5iz3 and made a close-up view around the region C115-C120 in supplementary figure 5. Given the density in information of figure 1 we prefer not to add additional images on it. Supplementary figure 5 was initially intended to illustrate sequence conservation/variation among homologs, thus fitting with the objective to compare past and present XRC results.

      Line 255-266: I am again missing a panel in Figure 1 here, e.g. a side-by-side view of Xray vs AF2/3 structure.

      We added another panel in supplementary figure 5 to visually compare side-by-side SBPase crystallographic structure 7b2o and our AF3 model. Again, for the sake of clarity we prefer not to overload figure 1 with additional panels. This will also enable thorough comparison of past XRC of PpSBPase, present XRC of CrSBPase, and various AF models (see below, oligomer comparisons).

      Line 261-266: Did the authors predict dimers and tetramers using AF3? What are the confidence metrics in this case? Do the authors see differences to the monomer prediction in case a multimer is confidently predicted?

      We modeled dimers and tetramers using AF3 and added them on supplementary figure 5 side by side with protomer of XRC model 7b2o and with monomer predicted by AF3. Color code for supplementary figure 5 panels F-H is according to AF standard representation of plDDT. Confidence metrics per residue correspond to very high reliability (navy blue) or, locally, confident prediction (cyan) and overall prediction scores range from pTM=0.85-0.91, a high-quality prediction. Interface prediction score is high for both dimer (ipTM=0.9) and tetramer (ipTM=0.82). We reported these data in supplementary figure 5 and corresponding updated legend. XRC and AF models all align with RMSD<0.5 Å, indicating a globally unchanged structure of the protomer in the various methods and oligomeric states.

      Line 441: How does the oligomeric equilibrium change in C115/120S mutants? This information should be added for the mutants. Besides, the mAU units in Fig. 6 could be normalized to allow an easier comparison between the chromatograms of wt and mutants.

      Change in oligomeric equilibrium is assessed by size-exclusion chromatography of WT and mutants C115S, C120S as reported in figure 6A. We made quantitative estimation of WT, and C115S and C120S mutants equilibrium by comparing maximal peak intensity and added this information in the text. Briefly, the oligomer ratio on a scale of 100 is 9:48:43 for WT, 42:25:33 for mutant C115S, and 29:17:54 for mutant C120S (ratio expressed as tetramer:dimer:monomer). We prefer not to normalize values of absorbance, but rather keep the actual measurement of absorbance at 280 nm on the chromatogram of figure 6, for the sake of consistency with the added text and for a more transparent report of the experiment.

      Line 447: WT activity is 12.15+-2.15 and both mutants have a higher activity. The authors should check if their values (96% and 107%) are correct. Besides, did the authors check if the increase in C120S is statistically significant? My impression is that both mutants have a higher activity than the wildtype, in both correlating with increased fractions of the tetramer. This would also make sense, as the corresponding region is part of the tetramer interface in the crystal packing.

      The reported activity values were checked for correctness. Wild-type SBPase specific activity at 12.5 ±2.15 µmol(NADPH) min<sup>-1</sup> mg(SBPase)<sup>-1</sup> was obtained by pre-incubating the enzyme with 1 µM CrTRXf2 supplemented with 1 mM DTT and 10 mM Mg<sup>2+</sup>, while the results of supplementary figure 14 reporting the comparison of activation of WT and mutants, with a variation of 107 or 96 %, were obtained with a slightly different protocol for pre-incubation of the enzyme with 10 mM DTT and 10 mM Mg<sup>2+</sup>. Please note that whether WT enzyme was assayed in 10 mM DTT 10 mM Mg or in 1 µM TRX 1 mM DTT 10 mM Mg, its specific activity appears equal within experimental error. Both mutants have nearly the same activity than the WT in the assay reported in supplementary figure 14: we fully agree that 107% (and 96%) variation is indeed not significant considering the uncertainty of the measurement (see error bars representing standard deviations of the mean in supplementary figure 14). We added this important information in the text. Even though both mutations stabilize the most active tetramer in untreated recombinant protein, we think that after reducting treatment both WT and mutants all reach the same maximal activity because they all form an equivalent proportion of the active tetramer versus alternative oligomeric states. We furhter interprete this piece of data as a decoupling of reduction and catalysis: in physiological conditions we assume that SBPase would initiate activation upon the reduction of disulfide bridges, including but not limited to C115-C120 that restricts the entry into fully active tetramer, at which point SBPase in reduced form reaches maximal activity until another post-translational signal eventually changes its conformation and oligomerisation.

      We thank again reviewer 1 for his or her assessment and valuable suggestions.

    1. Author response:

      The following is the authors’ response to the previous reviews.

      Public Reviews:

      Reviewer #1 (Public review):

      First, the authors confirm the up-regulation of the main genes involved in the three branches of the Unfolded Protein Response (UPR) system in diet-induced obese mice in AT, observations that have been extensively reported before. Not surprisingly, IRE1a inhibition with STF led to an amelioration of the obesity and insulin resistance of the animals. Moreover, non-alcoholic fatty liver disease was also improved by the treatment. More novel are their results in terms of thermogenesis and energy expenditure, where IRE1a seems to act via activation of brown AT. Finally, mice treated with STF exhibited significantly fewer metabolically active and M1-like macrophages in the AT compared to those under vehicle conditions. Overall, the authors conclude that targeting IRE1a has therapeutical potential for treating obesity and insulin resistance.

      The study has some strengths, such as the detailed characterization of the effect of STF in different fat depots and a thorough analysis of macrophage populations. However, the lack of novelty in the findings somewhat limits the study´s impact on the field.

      We thank the reviewer for the appreciation of our findings. We would use the opportunity to highlight several novelties. First, we characterized the relationship between the newly discovered CD9<sup>+</sup> ATMs and the “M1-like” CD11c+ ATMs. Second, we demonstrated that M2 macrophage population was not reduced but instead increased in adipose tissue in obesity. Third, IRE1 inhibition does not improve thermogenesis by boosting M2 population, but instead, IRE1 inhibition suppresses pro-inflammatory macrophage populations including the M1-like ATMs.

      Reviewer #3 (Public review):

      Summary:

      The manuscript by Wu D. et al. explores an innovative approach in immunometabolism and obesity by investigating the potential of targeting macrophage Inositol-requiring enzyme 1α (IRE1α) in cases of overnutrition. Their findings suggest that pharmacological inhibition of IRE1α could influence key aspects such as adipose tissue inflammation, insulin resistance, and thermogenesis. Notable discoveries include the identification of High-Fat Diet (HFD)-induced CD9<sup>+</sup> Trem2+ macrophages and the reversal of metabolically active macrophages' activity with IRE1α inhibition using STF. These insights could significantly impact future obesity treatments.

      Strengths:

      The study's key strengths lie in its identification of specific macrophage subsets and the demonstration that inhibiting IRE1α can reverse the activity of these macrophages. This provides a potential new avenue for developing obesity treatments and contributes valuable knowledge to the field.

      Weaknesses:

      The research lacks an in-depth exploration of the broader metabolic mechanisms involved in controlling diet-induced obesity (DIO). Addressing this gap would strengthen the understanding of how targeting IRE1α might fit into the larger metabolic landscape.

      We thank the reviewer for the appreciation of strengths in our manuscript. In particular, we appreciate the reviewer’s recommendation on the exploration of broader metabolic landscape, such as the effect of IRE1 inhibition on non-adipose tissue macrophages and metabolism. We agree that achieving these will certainly broaden the therapeutic potential of IRE1 inhibition to larger metabolic disorders and we will pursue these explorations in future studies.

      Impact and Utility:

      The findings have the potential to advance the field of obesity treatment by offering a novel target for intervention. However, further research is needed to fully elucidate the metabolic pathways involved and to confirm the long-term efficacy and safety of this approach. The methods and data presented are useful, but additional context and exploration are required for broader application and understanding.

      Comments on revisions:

      The author has revised the manuscript and addressed the most relevant comments raised by the reviewers. The paper is now significantly improved, though two minor issues remain.

      (1) Studies were limited to male mice; this should be mentioned in the paper's Title.

      Thanks for comment. We have modified the title to reflect the male mice only.

      (2) Please include the sample size (n=) in all provided tables in the main manuscript and supplementary tables.

      We have included the sample size in the main manuscript.

    1. Author response:

      The following is the authors’ response to the previous reviews.

      Public Reviews:

      Reviewer #1 (Public review):

      Bacterial effectors that interfere with the inner molecular workings of eukaryotic host cells are of great biological significance across disciplines. On the one hand they help us to understand the molecular strategies that bacteria use to manipulate host cells. On the other hand they can be used as research tools to reveal molecular details of the intricate workings of the host machinery that is relevant for the interaction/defence/symbiosis with bacteria. The authors investigate the function and biological impact of a rhizobial effector that interacts with and modifies, and curiously is modified by, legume receptors essential for symbiosis. The molecular analysis revealed a bacterial effector that cleaves a plant symbiosis signaling receptor to inhibit signaling and the host counterplay by phosphorylation via a receptor kinase. These findings have potential implications beyond bacterial interactions with plants.

      Bao and colleagues investigated how rhizobial effector proteins can regulate the legume root nodule symbiosis. A rhizobial effector is described to directly modify symbiosis-related signaling proteins, altering the outcome of the symbiosis. Overall, the paper presents findings that will have a wide appeal beyond its primary field.

      Out of 15 identified effectors from Sinorhizobium fredii, they focus on the effector NopT, which exhibits proteolytic activity and may therefore cleave specific target proteins of the host plant. They focus on two Nod factor receptors of the legume Lotus japonicus, NFR1 and NFR5, both of which were previously found to be essential for the perception of rhizobial nod factor, and the induction of symbiotic responses such as bacterial infection thread formation in root hairs and root nodule development (Madsen et al., 2003, Nature; Tirichine et al., 2003; Nature). The authors present evidence for an interaction of NopT with NFR1 and NFR5. The paper aims to characterize the biochemical and functional consequences of these interactions and the phenotype that arises when the effector is mutated.

      Evidence is presented that in vitro NopT can cleave NFR5 at its juxtamembrane region. NFR5 appears also to be cleaved in vivo. and NFR1 appears to inhibit the proteolytic activity of NopT by phosphorylating NopT. When NFR5 and NFR1 are ectopically over-expressed in leaves of the non-legume Nicotiana benthamiana, they induce cell death (Madsen et al., 2011, Plant Journal). Bao et al., found that this cell death response is inhibited by the coexpression of nopT. Mutation of nopT alters the outcome of rhizobial infection in L. japonicus. These conclusions are well supported by the data.

      The authors present evidence supporting the interaction of NopT with NFR1 and NFR5. In particular, there is solid support for cleavage of NFR5 by NopT (Figure 3) and the identification of NopT phosphorylation sites that inhibit its proteolytic activity (Figure 4C). Cleavage of NFR5 upon expression in N. benthamiana (Figure 3A) requires appropriate controls (inactive mutant versions) that have been provided, since Agrobacterium as a closely rhizobia-related bacterium might increase defense related proteolytic activity in the plant host cells.

      We appreciate your recognition of the importance of appropriate controls in our experimental design. In response to your comments, we revised our manuscript to ensure that the figures and legends provide a clear description of the controls used. We also included a more detailed description of our experimental design at several places. In particular, we have highlighted the use of the protease-dead version of NopT as a control (NopT<sup>C93S</sup>). Therefore, NFR5-GFP cleavage in N. benthamiana clearly depended on protease activity of NopT and not on Agrobacterium (Fig. 3A). In the revised text, we carefully revied the conclusion and do not conclude at this stage that NopT proteolyzes NFR5. However, our subsequent experiments, including in vitro experiments, clearly show that NopT is able to proteolyze NFR5.

      Key results from N. benthamiana appear consistent with data from recombinant protein expression in bacteria. For the analysis in the host legume L. japonicus transgenic hairy roots were included. To demonstrate that the cleavage of NFR5 occurs during the interaction in plant cells the authors build largely on western blots. Regardless of whether Nicotiana leaf cells or Lotus root cells are used as the test platform, the Western blots indicate that only a small proportion of NFR5 is cleaved when co-expressed with nopT, and most of the NFR5 persists in its full-length form (Figures 3A-D). It is not quite clear how the authors explain the loss of NFR5 function (loss of cell death, impact on symbiosis), as a vast excess of the tested target remains intact. It is also not clear why a large proportion of NFR5 is unaffected by the proteolytic activity of NopT. This is particularly interesting in Nicotiana in the absence of Nod factor that could trigger NFR1 kinase activity.

      Thank you for your comments regarding the cleavage of NFR5 by NopT and its functional implications. We acknowledge that our immunoblots indicate only a relatively small proportion of the NFR5 cleavage product. Possible explanations could be as follows:

      (1) The presence of full-length NFR5 does not preclude a significant impact of NopT on function of NFR5, as NopT is able to interact with NFR5. In other words, the NopT-NFR5 and NopT-NFR1 interactions at the plasma membrane might influence the function of the NFR1/NFR5 receptor without proteolytic cleavage of NFR5. In fact, protease-dead NopT<sup>C93S</sup> expressed in NGR234ΔnopT showed certain effects in L. japonicus (less infection foci were formed compared to NGR234ΔnopT Fig. 5E). In this context, it is worth mentioning that the non-acylated NopT<sup>C93S</sup> (Fig. 1B) and NopT<sub>USDA257</sub> (Fig. 6B) proteins were unable to suppress NFR1/NFR5-induced cell death in N. benthamina, but this could be explained by the lack of acylation and altered subcellular localization.

      (2) In the cleavage assay, only small portion of NFR5 could be detected for cleavage by NopT. However, this cleavage might be sufficient to suppress signaling pathways, leading to the observed phenotypic changes (loss of cell death in N. benthamiana; altered infection in L. japonicus). We do believe this is a great point, therefore, we carefully revised the conclusion about this point. Throughout the paper, we stated that the cleavage of NFR5 suppresses symbiotic signaling but not disrupt the symbiotic signaling. We also removed the conclusion that cleavage of NFR5 by NopT results in the function loss of NFR5.

      (3) N. benthamiana co-expressing NFR1/NFR5 leads to strong cell death, which suggest that the NFR1 kinase activity might be constitutively active even in the absence of Nod factors. But why co-expression of symbiotic receptor leads to cell death and how kinase activity is active in the absence of Nod factor are not clear, which is of great interest to be studied.

      (4) The proteolytic activity of NopT may be reduced by the interaction of NopT with other proteins such as NFR1, which phosphorylates NopT and inactivates its protease activity.

      In our revised manuscript version, we provide now quantitative data for the efficiency of NFR5 cleavage by NopT in different expression systems used (Figure 3 and Supplemental Fig. 16). We have also improved our Discussion in this context.  

      Comments on latest version:

      The presentation of the figures and the language has greatly improved and the specific mistakes pointed out in the last review have been corrected. I especially appreciate the new images used to illustrate the observed mutant phenotypes, which are much clearer and easier to understand. The pictures used to illustrate the mutant phenotypes seem to be of more comparable root regions than before. Overall, the requested changes have been implemented, with some exceptions described below.

      • Figure 1: New representative images are shown for BAX1 and CERK1. These pictures are more consistent with the phenotype seen in other treatments, but since the data has not changed, I presume the data from leaf discs (where the leaf discs for these treatments looked very different) previously shown is still included. The criteria for what was considered cell death is in my opinion still not described in the legend. The cell death/total ratio has been added for all leaf discs, as requested.

      Thank you so much for carefully pointing out this. Cell death in leaf disc results in the formation of necrotic plaques, which restrains pathogens within deceased cells. These plaques commonly manifest as leaf dehydration, frequently accompanied by a translucent appearance. Brown and shriveled leaf discs serve as indicators of cell death. We have added these descriptions in the figure legend of Figure 1.

      • Figure 2: the discussion of the figure now emphasizes direct protein interaction. There is still no size marker in 2D or a description of size in the figure legend, making it difficult to compare the result to Figure 3. If I understand the rebuttal comments correctly, there are other bands on the blot, including non-specific bands. This does not negate the need to include the full blot as a supplemental figure to show cleaved NFR5 as well as other bands. I do not see any other clarifications on this subject in the manuscript.

      Thank you for your suggestion. In the revised manuscript, we have included the kDa range for all proteins detected in Figure.2D. The full blot of Co-IP assay was shown in Fig S2 (a new supplemental data). Yes, we detected some smaller bands after immunoblot, but we cannot give clear conclusion of what these bands are based on the current study. Interestingly, these smaller bands were immunoprecipitated by anti-FLAG beads, suggesting that these bands are some truncated peptides from NFR5.

      • Figure 5: From the pictures, it is now easier to understand what is meant by "infection foci". Although there is no description in the methods of how these were distinguished from infection threads, I believe the images are clear enough.

      Thank you for your helpful comment. In the revised manuscript, we have added the descriptions about this experiment in the method section and in the legend in Figure 5A.

      • Figure 6: The changes in the discussion are appreciated, but panel E still misrepresents the evidence in the paper, as from the drawing it still seems that the cleaved NFR5 is somehow directly responsible for suppressing infection when this was not shown.

      Thank you for your thoughtful comments. We appreciate your suggestion to the schematic model to illustrate the cleavage of NFR5 to suppressing rhizobia infection. In the revised manuscript, we have changed the model in Figure 6E.

      Reviewer #2 (Public review):

      Summary:

      This manuscript presents data demonstrating NopT's interaction with Nod Factor Receptors NFR1 and NFR5 and its impact on cell death inhibition and rhizobial infection. The identification of a truncated NopT variant in certain Sinorhizobium species adds an interesting dimension to the study. These data try to bridge the gaps between classical Nod-factor-dependent nodulation and T3SS NopT effector-dependent nodulation in legume-rhizobium symbiosis. Overall, the research provides interesting insights into the molecular mechanisms underlying symbiotic interactions between rhizobia and legumes.

      Strengths:

      The manuscript nicely demonstrates NopT's proteolytic cleavage of NFR5, regulated by NFR1 phosphorylation, promoting rhizobial infection in L. japonicus. Intriguingly, authors also identify a truncated NopT variant in certain Sinorhizobium species, maintaining NFR5 cleavage but lacking NFR1 interaction. These findings bridge the T3SS effector with the classical Nod-factor-dependent nodulation pathway, offering novel insights into symbiotic interactions.

      Weaknesses:

      (1) In the previous study, when transiently expressed NopT alone in Nicotiana tobacco plants, proteolytically active NopT elicited a rapid hypersensitive reaction. However, this phenotype was not observed when expressing the same NopT in Nicotiana benthamiana (Figure 1A). Conversely, cell death and a hypersensitive reaction were observed in Figure S8. This raises questions about the suitability of the exogenous expression system for studying NopT proteolysis specificity.

      We appreciate your attention to these plant-specific differences. Previous studies showed that NopT expressed in tobacco (N. tabacum) or in specific Arabidopsis ecotypes (with PBS1/RPS5 genes) causes rapid cell death (Dai et al. 2008; Khan et al. 2022). Khan et al. 2022 reported recently that cell death does not occur in N. benthamiana unless the leaves were transformed with PBS1/RPS5 constructs. Our data shown in Fig. S17 confirm these findings. As cell death is usually associated with induction of plant protease activities, we considered N. tabacum and A. thaliana plants as not suitable for testing NFR5 cleavage by NopT. In fact, no NopT/NFR5 experiments were not performed with these plants in our study. In response to your comment, we now better describe the N. benthamiana expression system and cite the previous articles_. Furthermore, we have revised the Discussion section to better emphasize effector-induced immunity in non-host plants and the negative effect of rhizobial effectors during symbiosis. Our revisions certainly provide a clearer understanding of the advantages and limitations of the _N. benthamiana expression system.

      (2) NFR5 Loss-of-function mutants do not produce nodules in the presence of rhizobia in lotus roots, and overexpression of NFR1 and NFR5 produces spontaneous nodules. In this regard, if the direct proteolysis target of NopT is NFR5, one could expect the NGR234's infection will not be very successful because of the Native NopT's specific proteolysis function of NFR5 and NFR1. Conversely, in Figure 5, authors observed the different results.

      Thank you for this comment, which points out that we did not address this aspect precisely enough in the original manuscript version. We improved our manuscript and now write that nfr1 and nfr5 mutants do not produce nodules (Madsen et al., 2003; Radutoiu et al., 2003) and that over-expression of either NFR1 or NFR5 can activate NF signaling, resulting in formation of spontaneous nodules in the absence of rhizobia (Ried et al., 2014). In fact, compared to the nopT knockout mutant NGR234ΔnopT, wildtype NGR234 (with NopT) is less successful in inducing infection foci in root hairs of L. japonicus (Fig. 5). With respect to formation of nodule primordia, we repeated our inoculation experiments with NGR234ΔnopT and wildtype NGR234 and also included a nopT over-expressing NGR234 strain into the analysis. Our data clearly showed that nodule primordium formation was negatively affected by NopT. The new data are shown in Fig. 5 of our revised version. Our data show that NGR234 infection is not really successful, especially when NopT is over-expressed. This is consistent with our observations that NopT targets Nod factor receptors in L. japonicus and inhibits NF signaling (NIN promoter-GUS experiments). Our findings indicate that NopT might be an “Avr effector” for L. japonicus. However, in other host plants of NGR234, NopT possesses a symbiosis-promoting role (Dai et al. 2008; Kambara et al. 2009). Such differences could be explained by different NopT targets in different plants (in addition to Nod factor receptors), which may influence the outcome of the infection process. Indeed, our work shows that NopT can interact with various kinase-dead LysM domain receptors, suggesting a role of NopT in suppression or activation of plant immunity responses depending on the host plant. We discuss such alternative mechanisms in our revised manuscript version and emphasize the need for further investigation to elucidate the precise mechanisms underlying the observed infection phenotype and the role of NopT in modulating symbiotic signaling pathways. In this context, we would also like to mention the new figures of our manuscript which are showing (i) the efficiency of NFR5 cleavage by NopT in different expression systems (Figure 3), (ii) the interaction between NopT<sup>C93S</sup> and His-SUMO-NFR5JM-GFP (Supplementary Fig. 5), and (iii) cleavage of His-SUMO-NFPJM-GFP by NopT (Supplementary Figs. S8 and S9).

      (3) In Figure 6E, the model illustrates how NopT digests NFR5 to regulate rhizobia infection. However, it raises the question of whether it is reasonable for NGR234 to produce an effector that restricts its own colonization in host plants.

      Thank you for mentioning this point. We are aware of the possible paradox that the broad-host-range strain NGR234 produces an effector that appears to restrict its infection of host plants. As mentioned in our answer to the previous comment, NopT could have additional functions beyond the regulation of Nod factor signaling. In our revised manuscript version, we have modified our text as follows:

      (1) We mention the potential evolutionary aspects of NopT-mediated regulation of rhizobial infection and discuss the possibility that interactions between NopT and Nod factor receptors may have evolved to fine-tune Nod factor signaling to avoid rhizobial hyperinfection in certain host legumes.

      (2) We also emphasize that the presence of NopT may confer selective advantages in other host plants than L. japonicus due to interactions with proteins related to plant immunity. Like other effectors, NopT could suppress activation of immune responses (suppression of PTI) or cause effector-triggered immunity (ETI) responses, thereby modulating rhizobial infection and nodule formation. Interactions between NopT and proteins related to the plant immune system may represent an important evolutionary driving force for host-specific nodulation and explain why the presence of NopT in NGR234 has a negative effect on symbiosis with L. japonicus but a positive one with other legumes.

      (4) The failure to generate stable transgenic plants expressing NopT in Lotus japonicus is surprising, considering the manuscript's claim that NopT specifically proteolyzes NFR5, a major player in the response to nodule symbiosis, without being essential for plant development.

      We also thank for this comment. We have revised the Discussion section of our manuscript and discuss now our failure to generate stable transgenic L. japonicus plants expressing NopT. We observed that the protease activity of NopT in aerial parts of L. japonicus had a negative effect on plant development, whereas NopT expression in hairy roots was possible. Such differences may be explained by different NopT substrates in roots and aerial parts of the plant. In this context, we also discuss our finding that NopT not only cleaves NFR5 but is also able to proteolyze other proteins of L. japonicus such as LjLYS11, suggesting that NopT not only suppresses Nod factor signaling, but may also interfere with signal transduction pathways related to plant immunity. We speculate that, depending on the host legume species, NopT could suppress PTI or induce ETI, thereby modulating rhizobial infection and nodule formation.

      Comments on revised version:

      This version has effectively addressed most of my concerns. However, one key issue remains unresolved regarding the mechanism of NopT in regulating nodule symbiosis. Specifically, the explanation of how NopT catabolizes NFR5 to regulate symbiosis is still not convincing within the current framework of plant-microbe interaction, where plants are understood to genetically control rhizobial colonization.

      While alternative regulatory mechanisms in plant-microbe interactions are plausible, the notion that the NRG234-secreted effector NopT could reduce its own infection by either suppressing plant immunity or degrading the symbiosis receptor remains unsubstantiated. I believe further revisions are needed in the discussion section to more clearly address and clarify these findings and any lingering uncertainties.

      We appreciate your positive comments on the reason why NopT catabolizes NFR5 to regulate symbiosis. NopT belongs to pathogen effecftors YopT family and also cleavage Arabidopsis AtLYK5 and L. japonicus LjLYS11 which trigger immunity responses in plants. NFR5, AtLYK5 and LjLYS11 has the conserved amino acid motif at the juxtamembrane domain, leading to cleaving NFR5 by NopT during symbiosis. Besides, in plant-microbe interaction, effector HopB1 cleaves immune co-receptor BAK1 at the kinase domain to inhibit plant defense. The effect on cleavage of receptor may be positive or negative. NopT suppressing symbiosis may avoid preventing hyperinfection in the specific interaction between rhizobia and legumes. In the revised manuscript, we have emphasized this point more clearly in why NopT could reduce its own infection by either suppressing plant immunity in discussion.

      Recommendations for the authors:

      Reviewer #1 (Recommendations for the authors):

      Evaluation of the author's responses to the reviewer comments during the first review round

      Reviewer's Comment:

      Regardless of whether Nicotiana leaf cells or Lotus root cells are used as the test platform, the Western blots indicate that only a small proportion of NFR5 is cleaved when co-expressed with NopT, and most of the NFR5 persists in its full-length form (Figures 3A-D). It is not quite clear how the authors explain the loss of NFR5 function (loss of cell death, impact on symbiosis), as a vast excess of the tested target remains intact. It is also not clear why a large proportion of NFR5 is unaffected by the proteolytic activity of NopT. This is particularly interesting in Nicotiana in the absence of Nod factor that could trigger NFR1 kinase activity.

      Summary of response:

      • NopT could be interfering with the NFR1/NFR5 complex without proteolytic cleavage

      • The cleaved fraction may still be sufficient to disrupt signaling pathways

      • Elevated abundance of NFR5 relative to WT levels

      • Add quantitative data for efficiency of NFR5 cleavage in different systems

      Evaluation of response:

      • The quantification of NFR5 cleavage efficiency is welcome, and there is some discussion of the possible reasons for the large proportion of uncleaved NFR5. It is clear that there is a large difference in cleavage efficiency between L. japonicus roots and N. benthamiana.

      • The data is shown as a bar plot. Given that only 3 biological replicates are used, the data points should be shown, and there is too little data to provide sensible error bars. It would be better to simply make a dot-plot and indicate the mean for each sample. However, the main aim of the comment is addressed.

      Thank you for your constructive comments regarding Figure S16. In the revised manuscript, we have presented these data into dot-Plot format.

      Reviewer's Comment:

      It is also difficult to evaluate how the ratios of cleaved and full-length protein change when different versions of NopT are present without a quantification of band strengths normalized to loading controls (Figure 3C, 3D, 3F). The same is true for the blots supporting NFR1 phosphorylation of NopT (Figure 4A).

      Summary of response:

      • Quantified proportion of cleaved and full length NFR5 in different systems (S14)

      • Band strengths of immunoblots quantified (4B)

      Evaluation of response:

      • The quantification has been performed as requested and the data is shown as bar plots. This type of data is frequently displayed as part of the blot figure itself, printed under each respective lane, making it easier for the reader to connect the ratios to the band sizes. If data is shown in a plot, the data points should be shown on the plot, as described above.

      Thank you for your constructive comments regarding Figure 3. In the revised manuscript, we have added the cleavage efficiency in the 3A-3D.

      Reviewer's Comment:

      Nodule primordia and infection threads are still formed when L. japonicus plants are inoculated with ∆nopT mutant bacteria, but it is not clear if these primordia are infected or develop into fully functional nodules (Figure 5). A quantification of the ratio of infected and non-infected nodules and primordia would reveal whether NopT is only active at the transition from infection focus to thread or perhaps also later in the bacterial infection process of the developing root nodule.

      Summary of response:

      • Additional experiments with NGR234 or NGR234ΔnopT mutants find no non-infected nodules (fig. 5)

      Evaluation of response:

      • The requested quantification has been done, although the support for the findings would be stronger if also mature nodules per plant were quantified and plotted. If non-infected nodules were neither present in NGR234 or NGR234ΔnopT, it would still be advisable to include images of cross-sections of the fully-developed nodules.

      We appreciate your positive comments on the cross-sections of the fully-developed nodules. In the revised manuscript, we have added the cross-section images of nodules in the Figure S12.

    1. Author response:

      The following is the authors’ response to the original reviews.

      Public Reviews:

      Reviewer #1 (Public review):

      Summary:

      The authors used a subset of a very large, previously generated 16S dataset to:<br /> (1) Assess age-associated features; and (2) develop a fecal microbiome clock, based on an extensive longitudinal sampling of wild baboons for which near-exact chronological age is known. They further seek to understand deviation from age-expected patterns and uncover if and why some individuals have an older or younger microbiome than expected, and the health and longevity implications of such variation. Overall, the authors compellingly achieved their goals of discovering age-associated microbiome features and developing a fecal microbiome clock. They also showed clear and exciting evidence for sex and rank-associated variation in the pace of gut microbiome aging and impacts of seasonality on microbiome age in females. These data add to a growing understanding of modifiers of the pace of age in primates, and links among different biological indicators of age, with implications for understanding and contextualizing human variation. However, in the current version, there are gaps in the analyses with respect to the social environment, and in comparisons with other biological indicators of age. Despite this, I anticipate this work will be impactful, generate new areas of inquiry, and fuel additional comparative studies.

      Thank you for the supportive comments and constructive reviews.

      Strengths:

      The major strengths of the paper are the size and sampling depth of the study population, including the ability to characterize the social and physical environments, and the application of recent and exciting methods to characterize the microbiome clock. An additional strength was the ability of the authors to compare and contrast the relative age-predictive power of the fecal microbiome clock to other biological methods of age estimation available for the study population (dental wear, blood cell parameters, methylation data). Furthermore, the writing and support materials are clear, informative and visually appealing.

      Weaknesses:

      It seems clear that more could be done in the area of drawing comparisons among the microbiome clock and other metrics of biological age, given the extensive data available for the study population. It was confusing to see this goal (i.e. "(i) to test whether microbiome age is correlated with other hallmarks of biological age in this population"), listed as a future direction, when the authors began this process here and have the data to do more; it would add to the impact of the paper to see this more extensively developed.

      Comparing the microbiome clock to other metrics of biological age in our population is a high priority (these other metrics of biological age are in Table S5 and include epigenetic age measured in blood, the non-invasive physiology and behavior clock (NPB clock), dentine exposure, body mass index, and blood cell counts (Galbany et al. 2011; Altmann et al. 2010; Jayashankar et al. 2003; Weibel et al. 2024; Anderson et al. 2021)). However, we have opted to test these relationships in a separate manuscript. We made this decision because of the complexity of the analytical task: these metrics were not necessarily collected on the same subjects, and when they were, each metric was often measured at a different age for a given animal. Further, two of the metrics (microbiome clock and NPB clock) are measured longitudinally within subjects but on different time scales (the NPB clock is measured annually while microbiome age is measured in individual samples). The other metrics are cross-sectional. Testing the correlations between them will require exploration of how subject inclusion and time scale affect the relationships between metrics.

      We now explain the complexity of this analysis in the discussion in lines 447-450. In addition, we have added the NPB clock (Weibel et al. 2024) to the text in lines 260-262 and to Table S5.

      An additional weakness of the current set of analyses is that the authors did not explore the impact of current social network connectedness on microbiome parameters, despite the landmark finding from members of this authorship studying the same population that "Social networks predict gut microbiome composition in wild baboons" published here in eLife some years ago. While a mother's social connectedness is included as a parameter of early life adversity, overall the authors focus strongly on social dominance rank, without discussion of that parameter's impact on social network size or directly assessing it.

      Thank you for raising this important point, which was not well explained in our manuscript. We find that the signatures of social group membership and social network proximity are only detectable our population for samples collected close in time. All of the samples analyzed in  Tung et al. 2015 (“Social networks predict gut microbiome composition in wild baboons”) were collected within six weeks of each other. By contrast, the data set analyzed here spans 14 years, with very few samples from close social partners collected close in time. Hence, the effects of social group membership and social proximity are weak or undetectable. We described these findings in Grieneisen et al. 2021 and Bjork et al. 2022, and we now explain this logic on line 530, which states, “We did not model individual social network position because prior analyses of this data set find no evidence that close social partners have more similar gut microbiomes, probably because we lack samples from close social partners sampled close in time (Grieneisen et al. 2021; Björk et al. 2022).”

      We do find small effects of social group membership, which is included as a random effect in our models of how each microbiome feature is associated with host age (line 529) and our models predicting microbiome Dage (line 606; Table S6).

      Reviewer #2 (Public review):

      Summary:

      Dasari et al present an interesting study investigating the use of 'microbiota age' as an alternative to other measures of 'biological age'. The study provides several curious insights into biological aging. Although 'microbiota age' holds potential as a proxy of biological age, it comes with limitations considering the gut microbial community can be influenced by various non-age related factors, and various age-related stressors may not manifest in changes in the gut microbiota. The work would benefit from a more comprehensive discussion, that includes the limitations of the study and what these mean to the interpretation of the results.

      We agree and have text to the discussion that expands on the limitations of this study and what those limitations mean for the interpretation of the results. For instance, lines 395-400 read, “Despite the relative accuracy of the baboon microbiome clock compared to similar clocks in humans, our clock has several limitations. First, the clock’s ability to predict  individual age is lower than for age clocks based on patterns of DNA methylation—both for humans and baboons (Horvath 2013; Marioni et al. 2015; Chen et al. 2016; Binder et al. 2018; Anderson et al. 2021). One reason for this difference may be that gut microbiomes can be influenced by several non-age-related factors, including social group membership, seasonal changes in resource use, and fluctuations in microbial communities in the environment”

      In addition, lines 405-411 now reads, “Third, the relationships between potential socio-environmental drivers of biological aging and the resulting biological age predictions were inconsistent. For instance, some sources of early life adversity were linked to old-for-age gut microbiomes (e.g., males born into large social groups), while others were linked to young-for-age microbiomes (e.g., males who experienced maternal social isolation or early life drought), or were unrelated to gut microbiome age (e.g., males who experienced maternal loss; any source of early life adversity in females).”

      Strengths:

      The dataset this study is based on is impressive, and can reveal various insights into biological ageing and beyond. The analysis implemented is extensive and high-level.

      Weaknesses:

      The key weakness is the use of microbiota age instead of e.g., DNA-methylation-based epigenetic age as a proxy of biological ageing, for reasons stated in the summary. DNA methylation levels can be measured from faecal samples, and as such epigenetic clocks too can be non-invasive. I will provide authors a list of minor edits to improve the read, to provide more details on Methods, and to make sure study limitations are discussed comprehensively.

      Thank you for this point. In response, we have deleted the text from the discussion that stated that non-invasive sampling is an advantage of microbiome clocks. In addition, we now propose a non-invasive epigenetic clock from fecal samples as an important future direction for our population (see line 450).

      Recommendations for the authors:

      Reviewer #1 (Recommendations for the authors):

      Abstract - The opening 2 sentences are not especially original or reflective of the potential value/ premise of the study. Members of this team have themselves measured variation in biological age in many different ways, and the implication that measuring a microbiome clock is easy or straightforward is not compelling. This paper is very interesting and provides unique insight, but I think overall there is a missed opportunity in the abstract to emphasize this, given the innovative science presented here. Furthermore, the last 2 sentences of the abstract are especially interesting - but missing a final statement on the broader significance of research outside of baboons.

      We appreciate these comments and have revised the Abstract accordingly. The introductory sentences now read, “Mammalian gut microbiomes are highly dynamic communities that shape and are shaped by host aging, including age-related changes to host immunity, metabolism, and behavior. As such, gut microbial composition may provide valuable information on host biological age.” (lines 31-34). The last two sentences of the abstract now read, “Hence, in our host population, gut microbiome age largely reflects current, as opposed to past, social and environmental conditions, and does not predict the pace of host development or host mortality risk. We add to a growing understanding of how age is reflected in different host phenotypes and what forces modify biological age in primates.” (lines 40-43).

      If possible, it would be highly useful to present some comments on concordance in patterns at different levels. Are all ASVs assessed at both the family and genus levels? Do they follow similar patterns when assessed at different levels? What can we learn about the system by looking at different levels of taxonomic assignment?

      The section on relationships between host age and individual microbiome features is already lengthy, so we have not added an analysis of concordance between different taxonomic levels. However, we added a justification for why we tested for age signatures in different levels of taxa to line 171, which reads, “We tested these different taxonomic levels in order to learn whether the degree to which coarse and fine-grained designations categories were associated with host age.”

      To calculate the delta age - please clarify if this was done at the level of years, as suggested in Figure 3C, or at the level of months or portion months, etc?

      Delta age is measured in years. This is now clarified in lines 294, 295, and 578.

      Spelling mistake in table S12, cell B4 (Octovber)

      Thank you. This typo has been corrected.

      Given the start intro with vertebrates, the second paragraph needs some tweaking to be appropriate. Perhaps, "At least among mammals, one valuable marker of biological aging may lie in the composition and dynamics of the mammalian gut microbiome (7-10)." Or simply remove "mammalian".

      We have updated this sentence based on your suggestions in line 54. It reads, “In mammals, one valuable marker of biological aging may lie in the composition and dynamics of the gut microbiome (Claesson et al. 2012; Heintz and Mair 2014; O’Toole and Jeffery 2015; Sadoughi et al. 2022).”

      A rewrite at the end of the introduction is needed to avoid the almost direct repetition in lines 115-118 and 129-131 (including lit cited). One potentially effective way to approach this is to keep the predictions in the earlier paragraph and then more clearly center the approach and the overarching results statement in the latter paragraph. (I.e., "we find that season and social rank have stronger effects on microbiome age than early life events. Further, microbiome age does not predict host development or mortality.").

      Thank you for pointing this out. We have re-organized the predictions in the introduction based on your suggestion. The alternative “recency effects” model now appears in the paragraph that starts in line 110. The final paragraph then centers on the overall approach and the results statement (lines 128-140)

      Be clear in each case where taxon-level trends are discussed if it's at Family, Genus, or other level. It's there most, but not all, of the time.

      We have gone through the text and clarified what taxa or microbiome feature was the subject of our analyses in any places where this was not clear.

      In the legend for Figure 2, add clarification for how values to right versus left of the centered value should be interpreted with respect to age (e.g. "values to x of the center are more abundant in older individuals").

      We now clarify in Figure 2C and 2D that “Positive values are more abundant in older hosts”.

      Figure 3 - Are Panels A, B, and C all needed - can the value for all individuals not also be overlaid in the panel showing sex differences and the same point showing individuals with "old" and "young" microbiomes be added in the same plot if it was slightly larger?

      We agree and have simplified Figure 3. We reduced the number of panels from three to two, and we added the information about how to calculate delta age to Panel A. We also moved the equation from the top of Panel C to the bottom right of Panel A.

      Reviewer #2 (Recommendations for the authors):

      Dasari et al present an interesting study investigating the use of 'microbiota age' as an alternative to other measures of 'biological age'. The study provides several curious insights which in principle warrant publication. However, I do think the manuscript should be carefully revised. Below I list some minor revisions that should be implemented. Importantly, the authors should discuss in the Discussion the pros and cons of using 'microbiota age' as a proxy of 'biological age'. Further, the authors should provide more information on Methods, to make sure the study can be replicated.

      Thank you for these important points. Based on your comments and those of the first reviewer, we have expanded our discussion of the limitations of using microbiota age as a proxy for biological age (see edits to the paragraph starting in line 395).

      We have also expanded our methods around sample collection, DNA extraction, and sequencing to describe our sampling methods, strategies to mitigate and address possible contamination, and batch effects. See lines 483-490 and our citations to the original papers where these methods are described in detail.

      (1) Lines 85-99: I think this paragraph could be revisited to make the assumptions clearer. For instance, the last sentence is currently a little confusing: are authors expecting males to exhibit old-for-age microbiomes already during the juvenile period?

      This prediction has been clarified. Line 96 now reads, “Hence, we predicted that adult male baboons would exhibit gut microbiomes that are old-for-age, compared to adult females (by contrast, we expected no sex effects on microbiome age in juvenile baboons).”

      (2) Lines 118-121: Could the authors discuss this assumption in relation to what has been observed e.g., in humans in terms of delays in gut microbiome development? Delayed/accelerated gut microbiome development has been studied before, so this assumption would be stronger if related to what we know from previous studies.

      This comment refers to the sentence which originally stated, “However, we also expected that some sources of early life adversity might be linked to young-for-age gut microbiota. For instance, maternal social isolation might delay gut microbiome development due to less frequent microbial exposures from conspecifics.” We have slightly expanded the text here (line 117) to explain our logic. We now include citations for our predictions. We did not include a detailed discussion of prior literature on microbiome development in the interest of keeping the same level of detail across all sections on our predictions.

      (3) As the authors discuss, various adversities can lead to old-for-age but also young-for-age microbiome composition. This should be discussed in the limitations.

      We agree. This is now discussed in the sentence starting at line 371, which reads, “…deviations from microbiome age predictions are explained by socio-environmental conditions experienced by individual hosts, especially recent conditions, although the effect sizes are small and are not always directionally consistent.” In addition, the text starting at line 405 now reads, “Third, the relationships between potential socio-environmental drivers of biological aging and the resulting biological age predictions were inconsistent. For instance, some sources of early life adversity were linked to old-for-age gut microbiomes (e.g., males born into large social groups), while others were linked to young-for-age microbiomes (e.g., males who experienced maternal social isolation or early life drought), or were unrelated to gut microbiome age (e.g., males who experienced maternal loss; any source of early life adversity in females).”

      (4) In various places, e.g., lines 129-131, it is a little unclear at what chronological age authors are expecting microbiota to appear young/old-for-age.

      This sentence was removed while responding to the comments from the first reviewer.

      (5) Lines 132-133: this statement could be backed by stating that this is because the gut microbiota can change rapidly e.g., when diet changes (or whatever the authors think could be behind this).

      We have added an expository sentence at line 123, including new citations. This sentence reads, “Indeed, gut microbiomes are highly dynamic and can change rapidly in response to host diet or other aspects of host physiology, behavior, or environments”.

      We now cite:

      · Hicks, A.L., et al. (2018). Gut microbiomes of wild great apes fluctuate seasonally in response to diet. Nature Communications 9, 1786.

      · Kolodny, O., et al. (2019). Coordinated change at the colony level in fruit bat fur microbiomes through time. Nature Ecology & Evolution 3, 116-124.

      · Risely, A., et al. (2021) Diurnal oscillations in gut bacterial load and composition eclipse seasonal and lifetime dynamics in wild meerkats. Nat Commun 12, 6017.

      (6) Lines 135-137: current or past season and social rank? This paragraph introduces the idea that it could be past rather than current socio-environmental factors that might predict microbiota age, so the authors should clarify this sentence.

      We have clarified the information in this sentence. line 135 now reads, “In general, our results support the idea that a baboon’s current socio-environmental conditions, especially their current social rank and the season of sampling, have stronger effects on microbiome age than early life events—many of which occurred many years prior to sampling.”

      (7) Lines 136-137: this sentence could include some kind of a conclusion of this finding. What might this mean?

      We have added a sentence at line 138, which speculates that, “…the dynamism of the gut microbiome may often overwhelm and erase early life effects on gut microbiome age.”

      (8) Use 'microbiota' or 'microbiome' across the manuscript; currently, the terms are used interchangeably. I don't have a strong opinion on this, although typically 'microbiota' is used when data comes from 16S rRNA.

      We have updated the text to replace any instance of “microbiota” with “microbiome”. We use the term microbiome in the sense of this definition from the National Human Genome Research Institute, which defines a microbiome as “the community of microorganisms (such as fungi, bacteria and viruses) that exists in a particular environment”.

      (9) Figure 1 legend: make sure to unify formatting; e.g., present sample sizes as N= or n=, rather than both, and either include or do not include commas in 4-digit values (sample sizes).

      We have checked the formatting related to sample sizes and the use of commas in 4-digits in the main text and supplement. The formats are now consistent.

      (10) Line 166: relative abundances surely?

      Following Gloor et al. (2017), our analyses use centered log-ratio (CLR) transformations of read counts, which is the recommended approach for compositional data such as 16S rRNA amplicon read counts. CLR transformations are scale-invariant, so the same ratio is obtained in a sample with few read versus many reads. We now cite Gloor et al. (2017) at line 169 and in the methods in line 517, which reads “centered log ratio (CLR) transformed abundances (i.e., read counts) of each microbial phyla (n=30), family (n=290), genus (n=747), and amplicon sequence variance (ASV) detected in >25% of samples (n=358). CLR transformations are a recommended approach for addressing the compositional nature of 16S rRNA amplicon read count data (Gloor et al. 2017).”  

      (11) Lines 167-172: were technical factors, e.g., read depth or sequencing batch, included as random effects?

      Thank you for catching this oversight in the text. We did model sequencing depth and batch effects. The sentence starting at line 173 now reads, “For each of these 1,440 features, we tested its association with host age by running linear mixed effects models that included linear and quadratic effects of host age and four other fixed effects: sequencing depth, the season of sample collection (wet or dry), the average maximum temperature for the month prior to sample collection, and the total rainfall in the month prior to sample collection (Grieneisen et al. 2021; Björk et al. 2022; Tung et al. 2015). Baboon identity, social group membership, hydrological year of sampling, and sequencing plate (as a batch effect) were modeled as random effects.”

      (12) Lines 175-180: When discussing how these alpha diversity results relate to previous findings, the authors should be clear about whether they talk about weighted or non-weighted measures of alpha diversity. - also maybe this should be included in the discussion rather than the results? Please consider this when revisiting the manuscript (see how it reads after edits).

      Richness is the only unweighted metric, which we now clarify in line 181. We opted to retain the interpretation in the text in its original location to maintain the emphasis in the discussion on the microbiome clock results.

      (13) Table S1 is very hard to interpret in the provided PDF format as columns are not presented side-by-side. It is currently hard to check model output for e.g., specific families. This needs to be revisited.

      We agree. We believe that eLife’s submission portal automatically generates a PDF for any supplementary item. However, we also include the supplementary tables as an Excel workbook which has the columns presented side-by-side.

      (14) Line 184: taxa meaning what? Unclear what authors refer to with this sentence, taxa across taxonomic levels, or ASVs, or what does the 51.6% refer to?

      We have edited line 191 to clarify that this sentence refers to taxa at all taxonomic levels (phyla to ASVs).

      (15) Line 191: a punctuation mark missing after ref (81).

      We have added the missing period at the end of this sentence.

      (16) Lines 189-197: this should go into the discussion in my opinion.

      We have opted to retain this interpretation, now at line 183.

      (17) Lines 215-219: Not sure what this means; do the authors mean features were not restricted to age-associated taxa, ie also e.g., diversity and other taxa-independent patterns were included? If so, the rest of the highlighted lines should be revisited to make this clear, currently to me it is very unclear what 'These could include features that are not strongly age-correlated in isolation' means. Currently, that sounds like some features included were only age-associated in combination with other features, but unclear how this relates to taxa-dependency/taxa-independency.

      We agree this was not clear. We have revised line 224 to read, “We included all 9,575 microbiome features in our age predictions, as opposed to just those that were statistically significantly associated with age because removing these non-significant features could exclude features that contribute to age prediction via interactions with other taxa.”

      (18) Line 403-407: There is now a paper showing epigenetic clocks can be built with faecal samples, so this argument is not valid. Please revisit in light of this publication: https://onlinelibrary.wiley.com/doi/epdf/10.1111/mec.17330

      Thank you for bringing this paper to our attention. We deleted the text that describes epigenetic clocks as invasive, and we now cite this paper in line 450, which reads, “We also hope to measure epigenetic age in fecal samples, leveraging methods developed in Hanski et al. 2024.”

      (19) Line 427: a punctuation mark/semicolon missing before However.

      We have corrected this typo.

      (20) Lines 419-428: I don't quite understand this speculation. Why would the priority of access to food lead to an old-looking gut microbiome? This paragraph needs stronger arguments, currently unclear and also not super convincing.

      We agree this was confusing. We have revised this text to clarify the explanation. The text starting at line 424 now reads, “This outcome points towards a shared driver of high social status in shaping gut microbiome age in both males and females. While it is difficult to identify a plausible shared driver, one benefit shared by both high-ranking males and females is priority of access to food. This access may result in fewer foraging disruptions and a higher quality, more stable diet. At the same time, prior research in Amboseli suggests that as animals age, their diets become more canalized and less variable (Grieneisen et al. 2021). Hence aging and priority of access to food might both be associated with dietary stability and old-for-age microbiomes. However, this explanation is speculative and more work is needed to understand the relationship between rank and microbiome age.”

      (21) Line 434: remove 'be'.

      We have corrected this typo.

      (22) Line 478: add information on how samples were collected; e.g., were samples collected from the ground? How was cross-contamination with soil microbiota minimised? Were samples taken from the inner part of depositions? These factors can influence microbiota samples quite drastically so detailed info is needed. Also what does homogenisation mean in this context? How soon were samples freeze-dried after sample collection?

      We have expanded our methods with respect to sample collection. This text starts in line 483 and reads, “Samples were collected from the ground within 15 minutes of defecation. For each sample, approximately 20 g of feces was collected into a paper cup, homogenized by stirring with a wooden tongue depressor, and a 5 g aliquot of the homogenized sample was transferred to a tube containing 95% ethanol. While a small amount of soil was typically present on the outside of the fecal sample, mammalian feces contains 1000 times the number of microbial cells in a typical soil sample (Sender, Fuchs, and Milo 2016; Raynaud and Nunan 2014), which overwhelms the signal of soil bacteria in our analyses (Grieneisen et al. 2021). Samples were transported from the field in Amboseli to a lab in Nairobi, freeze-dried, and then sifted to remove plant matter prior to long term storage at -80°C.”

      (23) Line 480 onwards: were negative controls included in extraction batches? Were samples randomised into extraction batches?

      Yes, we included extraction blanks. These are now described in lines 495-500. This text reads, “We included one extraction blank per batch, which had significantly lower DNA concentrations than sample wells (t-test; t=-50, p < 2.2x10⁻¹⁶; Grieneisen et al. 2021). We also included technical replicates, which were the same fecal sample sequenced across multiple extraction and library preparation batches. Technical replicates from different batches clustered with each other rather than with their batch, indicating that true biological differences between samples are larger than batch effects.”

      (24) Were extraction, library prep, and sequencing negative controls included? Is data available?

      We included extraction blanks (described above) and technical replicates, which were the same sample sequenced across multiple extraction and library preparation batches. Technical replicates from different batches clustered with each other rather than with their batch, indicating that true biological differences between samples are larger than batch effects.

      We have updated the data availability statement to read, “All data for these analyses are available on Dryad at https://doi.org/10.5061/dryad.b2rbnzspv. The 16S rRNA gene sequencing data are deposited on EBI-ENA (project ERP119849) and Qiita (study 12949). Code is available at the following GitHub repository: https://github.com/maunadasari/Dasari_etal-GutMicrobiomeAge”.

      (25) Line 562: how were corrected microbiome delta ages calculated? Currently, the authors state x, y and z factors were corrected for, but it is unclear how this was done.

      The paragraph starting at line 577 describes how microbiome delta age was calculated. We have made only a few changes to this text because we were not sure which aspects of these methods confused the reviewer. However, briefly, we calculated sample-specific microbiome Dage in years as the difference between a sample’s microbial age estimate, age<sub>m</sub> from the microbiome clock, and the host’s chronological age in years at the time of sample collection, age<sub>c</sub>. Higher microbiome Dages indicate old-for-age microbiomes, as age<sub>m</sub> > age<sub>c</sub>, and lower values (which are often negative) indicate a young-for-age microbiome, where age<sub>c</sub> > age<sub>m</sub> (see Figure 3).

      (26) Line 579: typo 'as'.

      We have corrected this typo.

      Works Cited

      Altmann, Jeanne, Laurence Gesquiere, Jordi Galbany, Patrick O Onyango, and Susan C Alberts. 2010. “Life History Context of Reproductive Aging in a Wild Primate Model.” Annals of the New York Academy of Sciences 1204:127–38. https://doi.org/10.1111/j.1749-6632.2010.05531.x.

      Anderson, Jordan A, Rachel A Johnston, Amanda J Lea, Fernando A Campos, Tawni N Voyles, Mercy Y Akinyi, Susan C Alberts, Elizabeth A Archie, and Jenny Tung. 2021. “High Social Status Males Experience Accelerated Epigenetic Aging in Wild Baboons.” Edited by George H Perry. eLife 10 (April):e66128. https://doi.org/10.7554/eLife.66128.

      Binder, Alexandra M., Camila Corvalan, Verónica Mericq, Ana Pereira, José Luis Santos, Steve Horvath, John Shepherd, and Karin B. Michels. 2018. “Faster Ticking Rate of the Epigenetic Clock Is Associated with Faster Pubertal Development in Girls.” Epigenetics 13 (1): 85–94. https://doi.org/10.1080/15592294.2017.1414127.

      Björk, Johannes R., Mauna R. Dasari, Kim Roche, Laura Grieneisen, Trevor J. Gould, Jean-Christophe Grenier, Vania Yotova, et al. 2022. “Synchrony and Idiosyncrasy in the Gut Microbiome of Wild Baboons.” Nature Ecology & Evolution, June, 1–10. https://doi.org/10.1038/s41559-022-01773-4.

      Chen, Brian H., Riccardo E. Marioni, Elena Colicino, Marjolein J. Peters, Cavin K. Ward-Caviness, Pei-Chien Tsai, Nicholas S. Roetker, et al. 2016. “DNA Methylation-Based Measures of Biological Age: Meta-Analysis Predicting Time to Death.” Aging (Albany NY) 8 (9): 1844–59. https://doi.org/10.18632/aging.101020.

      Claesson, Marcus J., Ian B. Jeffery, Susana Conde, Susan E. Power, Eibhlís M. O’Connor, Siobhán Cusack, Hugh M. B. Harris, et al. 2012. “Gut Microbiota Composition Correlates with Diet and Health in the Elderly.” Nature 488 (7410): 178–84. https://doi.org/10.1038/nature11319.

      Galbany, Jordi, Jeanne Altmann, Alejandro Pérez-Pérez, and Susan C. Alberts. 2011. “Age and Individual Foraging Behavior Predict Tooth Wear in Amboseli Baboons.” American Journal of Physical Anthropology 144 (1): 51–59. https://doi.org/10.1002/ajpa.21368.

      Gloor, Gregory B., Jean M. Macklaim, Vera Pawlowsky-Glahn, and Juan J. Egozcue. 2017. “Microbiome Datasets Are Compositional: And This Is Not Optional.” Frontiers in Microbiology 8. https://doi.org/10.3389/fmicb.2017.02224.

      Grieneisen, Laura E., Mauna Dasari, Trevor J. Gould, Johannes R. Björk, Jean-Christophe Grenier, Vania Yotova, David Jansen, et al. 2021. “Gut Microbiome Heritability Is Nearly Universal but Environmentally Contingent.” Science 373 (6551): 181–86. https://doi.org/10.1126/science.aba5483.

      Hanski, Eveliina, Susan Joseph, Aura Raulo, Klara M. Wanelik, Áine O’Toole, Sarah C. L. Knowles, and Tom J. Little. 2024. “Epigenetic Age Estimation of Wild Mice Using Faecal Samples.” Molecular Ecology 33 (8): e17330. https://doi.org/10.1111/mec.17330.

      Heintz, Caroline, and William Mair. 2014. “You Are What You Host: Microbiome Modulation of the Aging Process.” Cell 156 (3): 408–11. http://dx.doi.org/10.1016/j.cell.2014.01.025.

      Horvath, Steve. 2013. “DNA Methylation Age of Human Tissues and Cell Types.” Genome Biology 14 (10): R115. https://doi.org/10.1186/gb-2013-14-10-r115.

      Jayashankar, Lakshmi, Kathleen M. Brasky, John A. Ward, and Roberta Attanasio. 2003. “Lymphocyte Modulation in a Baboon Model of Immunosenescence.” Clinical and Vaccine Immunology 10 (5): 870–75. https://doi.org/10.1128/CDLI.10.5.870-875.2003.

      Marioni, Riccardo E., Sonia Shah, Allan F. McRae, Brian H. Chen, Elena Colicino, Sarah E. Harris, Jude Gibson, et al. 2015. “DNA Methylation Age of Blood Predicts All-Cause Mortality in Later Life.” Genome Biology 16 (1): 25. https://doi.org/10.1186/s13059-015-0584-6.

      O’Toole, Paul W., and Ian B. Jeffery. 2015. “Gut Microbiota and Aging.” Science 350 (6265): 1214–15. https://doi.org/10.1126/science.aac8469.

      Raynaud, Xavier, and Naoise Nunan. 2014. “Spatial Ecology of Bacteria at the Microscale in Soil.” PLOS ONE 9 (1): e87217. https://doi.org/10.1371/journal.pone.0087217.

      Sadoughi, Baptiste, Dominik Schneider, Rolf Daniel, Oliver Schülke, and Julia Ostner. 2022. “Aging Gut Microbiota of Wild Macaques Are Equally Diverse, Less Stable, but Progressively Personalized.” Microbiome 10 (1): 95. https://doi.org/10.1186/s40168-022-01283-2.

      Sender, Ron, Shai Fuchs, and Ron Milo. 2016. “Revised Estimates for the Number of Human and Bacteria Cells in the Body.” PLoS Biology 14 (8): e1002533. https://doi.org/10.1371/journal.pbio.1002533.

      Tung, J, L B Barreiro, M B Burns, J C Grenier, J Lynch, L E Grieneisen, J Altmann, S C Alberts, R Blekhman, and E A Archie. 2015. “Social Networks Predict Gut Microbiome Composition in Wild Baboons.” Elife 4. https://doi.org/10.7554/eLife.05224.

      Weibel, Chelsea J., Mauna R. Dasari, David A. Jansen, Laurence R. Gesquiere, Raphael S. Mututua, J. Kinyua Warutere, Long’ida I. Siodi, Susan C. Alberts, Jenny Tung, and Elizabeth A. Archie. 2024. “Using Non-Invasive Behavioral and Physiological Data to Measure Biological Age in Wild Baboons.” GeroScience 46 (5): 4059–74. https://doi.org/10.1007/s11357-024-01157-5.

    1. Author response:

      We thank the reviewers for their thoughtful reading and review of our manuscript. These reviews make clear that, for this work to be complete, we must make progress on the following fronts:

      (1) Expand the discussion to better incorporate alternate explanations of our data

      (2) Improve data visualization and experimental support or an experimental refutation for the following concepts

      a. Photoreceptor-derived lactate exported specifically from photoreceptors is utilized in the RPE TCA cycle

      b. Photoreceptors can utilize lactate as a fuel source when starved of glucose

      To address these concerns, we will focus our efforts on infusing <sup>13</sup>C<sub>6</sub>-glucose into rodΔglut1 mice. Lactate is not made without glucose, so this experiment should indicate whether glucose utilization in photoreceptors provides lactate to the RPE, and whether that lactate is used in the TCA cycle.

      The reviewers also noted that changes in <sup>13</sup>C labeling of RPE TCA cycle intermediates downstream of lactate is not obvious (between C57BL6J mice and AIPL1<sup>-/-</sup>). We think that at least in part, this is a consequence of the way we presented the data. We will improve how we display our data so that the differences of incorporation of <sup>13</sup>C in TCA cycle intermediates in control and AIPL1<sup>-/-</sup> RPE is clearer.

    1. Author response:

      The issue of a control without blue light illumination was raised. Clearly without the light we will not obtain any signal in the fluorescence microscopy experiments, which would not be very informative. Instead, we changed the level of blue light illumination in the fluorescence microscopy experiments (figure 4A) and the response of the bacteria scales with dosage. It is very hard to find an alternative explanation, beyond that the blue light is stressing the bacteria and modulating their membrane potentials.

      One of the referees refuses to see wavefronts in our microscopy data. We struggle to understand whether it is an issue with definitions (Waigh has published a tutorial on the subject in Chapter 5 of his book ‘The physics of bacteria: from cells to biofilms’, T.A.Waigh, CUP, 2024 – figure 5.1 shows a sketch) or something subtler on diffusion in excitable systems. We stand by our claim that we observe wavefronts, similar to those observed by Prindle et al<sup>1</sup> and Blee et al<sup>2</sup> for B. subtilis biofilms.

      The referee is questioning our use of ThT to probe the membrane potential. We believe the Pilizota and Strahl groups are treating the E. coli as unexcitable cells, leading to their problems. Instead, we believe E. coli cells are excitable (containing the voltage-gated ion channel Kch) and we now clearly state this in the manuscript. Furthermore, we include a section here discussing some of the issues with ThT.


      Use of ThT as a voltage sensor in cells

      ThT is now used reasonably widely in the microbiology community as a voltage sensor in both bacterial [Prindle et al]1 and fungal cells [Pena et al]12. ThT is a small cationic fluorophore that loads into the cells in proportion to their membrane potential, thus allowing the membrane potential to be measured from fluorescence microscopy measurements.

      Previously ThT was widely used to quantify the growth of amyloids in molecular biology experiments (standardized protocols exist and dedicated software has been created)13 and there is a long history of its use14. ThT fluorescence is bright, stable and slow to photobleach.

      Author response figure 1 shows a schematic diagram of the ThT loading in E. coli in our experiments in response to illumination with blue light. Similar results were previously presented by Mancini et al15, but regimes 2 and 3 were mistakenly labelled as artefacts.

      Author response figure 1. Schematic diagram of ThT loading during an experiment with E. coli cells under blue light illumination i.e. ThT fluorescence as a function of time. Three empirical regimes for the fluorescence are shown (1, 2 and 3).

      The classic study of Prindle et al on bacterial biofilm electrophysiology established the use of ThT in B. subtilis biofilms by showing similar results occurred with DiSc3 which is widely used as a Nernstian voltage sensor in cellular biology1 e.g. with mitochondrial membrane potentials in eukaryotic organisms where there is a large literature. We repeated such a comparative calibration of ThT with DiSc3 in a previous publication with both B. subtilis and P. aeruginosa cells2. ThT thus functioned well in our previous publications with Gram positive and Gram negative cells.

      However, to our knowledge, there are now two groups questioning the use of ThT and DiSc3 as voltage sensors with E. coli cells15-16. The first by the Pilizota group claims ThT only works as a voltage sensor in regime 1 of Author response figure 1 using a method based on the rate of rotation of flagellar motors. Another slightly contradictory study by the Strahl group claims DiSc316 only acts as a voltage sensor with the addition of an ionophore for potassium which allows free movement of potassium through the E. coli membranes.

      Our resolution to this contradiction is that ThT does indeed work reasonably well with E. coli. The Pilizota group’s model for rotating flagellar motors assumes the membrane voltage is not varying due to excitability of the membrane voltage (otherwise a non-linear Hodgkin Huxley type model would be needed to quantify their results) i.e. E. coli cells are unexcitable. We show clearly in our study that ThT loading in E. coli is a function of irradiation with blue light and is a stress response of the excitable cells. This is in contradiction to the Pilizota group’s model. The Pilizota group’s model also requires the awkward fiction of why cells decide to unload and then reload ThT in regimes 2 and 3 of Author response figure 1 due to variable membrane partitioning of the ThT. Our simple explanation is that it is just due to the membrane voltage changing and no membrane permeability switch needs to be invoked. The Strahl group’s16 results with DiSc3 are also explained by a neglect of the excitable nature of E. coli cells that are reacting to blue light irradiation. Adding ionophores to the E. coli membranes makes the cells unexcitable, reduces their response to blue light and thus leads to simple loading of DiSc3 (the physiological control of K+ in the cells by voltage-gated ion channels has been short circuited by the addition of the ionophore).

      Further evidence of our model that ThT functions as a voltage sensor with E. coli include:

      1) The 3 regimes in Author response figure 1 from ThT correlate well with measurements of extracellular potassium ion concentration using TMRM i.e. all 3 regimes in Author response figure 1 are visible with this separate dye (figure 1d).

      2) We are able to switch regime 3 in Author response figure 1, off and then on again by using knock downs of the potassium ion channel Kch in the membranes of the E. coli and then reinserting the gene back into the knock downs. This cannot be explained by the Pilizota model.

      We conclude that ThT works reasonably well as a sensor of membrane voltage in E. coli and the previous contradictory studies15-16 are because they neglect the excitable nature of the membrane voltage of E. coli cells in response to the light used to make the ThT fluoresce.

      Three further criticisms of the Mancini et al method15 for calibrating membrane voltages include:

      1) E. coli cells have clutches that are not included in their models. Otherwise the rotation of the flagella would be entirely enslaved to the membrane voltage allowing the bacteria no freedom to modulate their speed of motility.

      2) Ripping off the flagella may perturb the integrity of the cell membrane and lead to different loading of the ThT in the E. coli cells.

      3) Most seriously, the method ignores the activity of many other ion channels (beyond H+) on the membrane voltage that are known to exist with E. coli cells e.g. Kch for K+ ions. The Pilizota groups uses a simple Nernstian battery model developed for mitochondria in the 1960s. It is not adequate to explain our results.

      An additional criticism of the Winkel et al study17 from the Strahl group is that it indiscriminately switches between discussion of mitochondria and bacteria e.g. on page 8 ‘As a consequence the membrane potential is dominated by H+’. Mitochondria are slightly alkaline intracellular organelles with external ion concentrations in the cytoplasm that are carefully controlled by the eukaryotic cells. E. coli are not i.e. they have neutral internal pHs, with widely varying extracellular ionic concentrations and have reinforced outer membranes to resist osmotic shocks (in contrast mitochondria can easily swell in response to moderate changes in osmotic pressure).

      A quick calculation of the equilibrium membrane voltage of E. coli can be easily done using the Nernst equation dependent on the extracellular ion concentrations defined by the growth media (the intracellular ion concentrations in E. coli are 0.2 M K+ and 10-7 M H+ i.e. there is a factor of a million fewer H+ ions). Thus in contradiction to the claims of the groups of Pilizota15 and Strahl17, H+ is a minority determinant to the membrane voltage of E. coli. The main determinant is K+. For a textbook version of this point the authors can refer to Chapter 4 of D. White, et al’s ‘The physiology and biochemistry of prokaryotes’, OUP, 2012, 4th edition.

      Even in mitochondria the assumption that H+ dominates the membrane potential and the cells are unexcitable can be questioned e.g. people have observed pulsatile depolarization phenomena with mitochondria18-19. A large number of K+ channels are now known to occur in mitochondrial membranes (not to mention Ca2+ channels; mitochondria have extensive stores of Ca2+) and they are implicated in mitochondrial membrane potentials. In this respect the seminal Nobel prize winning research of Peter Mitchell (1961) on mitochondria needs to be amended20. Furthermore, the mitochondrial work is clearly inapplicable to bacteria (the proton motive force, PMF, will instead subtly depend on non-linear Hodgkin-Huxley equations for the excitable membrane potential, similar to those presented in the current article). A much more sophisticated framework has been developed to describe electrophysiology by the mathematical biology community to describe the activity of electrically excitable cells (e.g. with neurons, sensory cells and cardiac cells), beyond Mitchell’s use of the simple stationary equilibrium thermodynamics to define the Proton Motive Force via the electrochemical potential of a proton (the use of the word ‘force’ is unfortunate, since it is a potential). The tools developed in the field of mathematical electrophysiology8 should be more extensively applied to bacteria, fungi, mitochondria and chloroplasts if real progress is to be made.


      Related to the previous point, we now cite articles from the Pilizota and Strahl groups in the main text (one from each group). Unfortunately, the space constraints of eLife mean we cannot make a more detailed discussion in the main article.

      In terms of modelling the ion channels, the Hodgkin-Huxley type model proposes that the Kch ion channel can be modelled as a typical voltage-gated potassium ion channel i.e. with a 𝑛<sup>4</sup> term in its conductivity. The literature agrees that Kch is a voltage-gated potassium ion channel based on its primary sequence<sup>3</sup>. The protein has the typical 6 transmembrane helix motif for a voltage-gated ion channel. The agent-based model assumes little about the structure of ion channels in E. coli, other than they release potassium in response to a threshold potassium concentration in their environment. The agent based model is thus robust to the exact molecular details chosen and predicts the anomalous transport of the potassium wavefronts reasonably well (the modelling was extended in a recent Physical Review E article(<sup>4</sup>). Such a description of reaction-anomalous diffusion phenomena has not to our knowledge been previously achieved in the literature<sup>5</sup> and in general could be used to describe other signaling molecules.

      1. Prindle, A.; Liu, J.; Asally, M.; Ly, S.; Garcia-Ojalvo, J.; Sudel, G. M., Ion channels enable electrical communication in bacterial communities. Nature 2015, 527, 59.

      2. Blee, J. A.; Roberts, I. S.; Waigh, T. A., Membrane potentials, oxidative stress and the dispersal response of bacterial biofilms to 405 nm light. Physical Biology 2020, 17, 036001.

      3. Milkman, R., An E. col_i homologue of eukaryotic potassium channel proteins. _PNAS 1994, 91, 3510-3514.

      4. Martorelli, V.; Akabuogu, E. U.; Krasovec, R.; Roberts, I. S.; Waigh, T. A., Electrical signaling in three-dimensional bacterial biofilms using an agent-based fire-diffuse-fire model. Physical Review E 2024, 109, 054402.

      5. Waigh, T. A.; Korabel, N., Heterogeneous anomalous transport in cellular and molecular biology. Reports on Progress in Physics 2023, 86, 126601.

      6. Hodgkin, A. L.; Huxley, A. F., A quantitative description of membrane current and its application to conduction and excitation in nerve. Journal of Physiology 1952, 117, 500.

      7. Dawson, S. P.; Keizer, J.; Pearson, J. E., Fire-diffuse-fire model of dynamics of intracellular calcium waves. PNAS 1999, 96, 606.

      8. Keener, J.; Sneyd, J., Mathematical Physiology. Springer: 2009.

      9. Coombes, S., The effect of ion pumps on the speed of travelling waves in the fire-diffuse-fire model of Ca2+ release. Bulletin of Mathematical Biology 2001, 63, 1.

      10. Blee, J. A.; Roberts, I. S.; Waigh, T. A., Spatial propagation of electrical signals in circular biofilms. Physical Review E 2019, 100, 052401.

      11. Gorochowski, T. E.; Matyjaszkiewicz, A.; Todd, T.; Oak, N.; Kowalska, K., BSim: an agent-based tool for modelling bacterial populations in systems and synthetic biology. PloS One 2012, 7, 1.

      12. Pena, A.; Sanchez, N. S.; Padilla-Garfias, F.; Ramiro-Cortes, Y.; Araiza-Villaneuva, M.; Calahorra, M., The use of thioflavin T for the estimation and measurement of the plasma membrane electric potential difference in different yeast strains. Journal of Fungi 2023, 9 (9), 948.

      13. Xue, C.; Lin, T. Y.; Chang, D.; Guo, Z., Thioflavin T as an amyloid dye: fibril quantification, optimal concentration and effect on aggregation. Royal Society Open Science 2017, 4, 160696.

      14. Meisl, G.; Kirkegaard, J. B.; Arosio, P.; Michaels, T. C. T.; Vendruscolo, M.; Dobson, C. M.; Linse, S.; Knowles, T. P. J., Molecular mechanisms of protein aggregation from global fitting of kinetic models. Nature Protocols 2016, 11 (2), 252-272.

      15. Mancini, L.; Tian, T.; Guillaume, T.; Pu, Y.; Li, Y.; Lo, C. J.; Bai, F.; Pilizota, T., A general workflow for characterization of Nernstian dyes and their effects on bacterial physiology. Biophysical Journal 2020, 118 (1), 4-14.

      16. Buttress, J. A.; Halte, M.; Winkel, J. D. t.; Erhardt, M.; Popp, P. F.; Strahl, H., A guide for membrane potential measurements in Gram-negative bacteria using voltage-sensitive dyes. Microbiology 2022, 168, 001227.

      17. Derk te Winkel, J.; Gray, D. A.; Seistrup, K. H.; Hamoen, L. W.; Strahl, H., Analysis of antimicrobial-triggered membrane depolarization using voltage sensitive dyes. Frontiers in Cell and Developmental Biology 2016, 4, 29.

      18. Schawarzlander, M.; Logan, D. C.; Johnston, I. G.; Jones, N. S.; Meyer, A. J.; Fricker, M. D.; Sweetlove, L. J., Pulsing of membrane potential in individual mitochondria. The Plant Cell 2012, 24, 1188-1201.

      19. Huser, J.; Blatter, L. A., Fluctuations in mitochondrial membrane potential caused by repetitive gating of the permeability transition pore. Biochemistry Journal 1999, 343, 311-317.

      20. Mitchell, P., Coupling of phosphorylation to electron and hydrogen transfer by a chemi-osmotic type of mechanism. Nature 1961, 191 (4784), 144-148.

      21. Baba, T.; Ara, M.; Hasegawa, Y.; Takai, Y.; Okumura, Y.; Baba, M.; Datsenko, K. A.; Tomita, M.; Wanner, B. L.; Mori, H., Construction of Escherichia Coli K-12 in-frame, single-gene knockout mutants: the Keio collection. Molecular Systems Biology 2006, 2, 1.

      22. Schinedlin, J.; al, e., Fiji: an open-source platform for biological-image analysis. Nature Methods 2012, 9, 676.

      23. Hartmann, R.; al, e., Quantitative image analysis of microbial communities with BiofilmQ. Nature Microbiology 2021, 6 (2), 151.


      The following is the authors’ response to the original reviews.

      Critical synopsis of the articles cited by referee 2:

      (1) ‘Generalized workflow for characterization of Nernstian dyes and their effects on bacterial physiology’, L.Mancini et al, Biophysical Journal, 2020, 118, 1, 4-14.

      This is the central article used by referee 2 to argue that there are issues with the calibration of ThT for the measurement of membrane potentials. The authors use a simple Nernstian battery (SNB) model and unfortunately it is wrong when voltage-gated ion channels occur. Huge oscillations occur in the membrane potentials of E. coli that cannot be described by the SNB model. Instead a Hodgkin Huxley model is needed, as shown in our eLife manuscript and multiple other studies (see above). Arrhenius kinetics are assumed in the SNB model for pumping with no real evidence and the generalized workflow involves ripping the flagella off the bacteria! The authors construct an elaborate ‘work flow’ to insure their ThT results can be interpreted using their erroneous SNB model over a limited range of parameters.

      (2) ‘Non-equivalence of membrane voltage and ion-gradient as driving forces for the bacterial flagellar motor at low load’, C.J.Lo, et al, Biophysical Journal, 2007, 93, 1, 294.

      An odd de novo chimeric species is developed using an E. coli  chassis which uses Na+ instead of H+ for the motility of its flagellar motor. It is not clear the relevance to wild type E. coli, due to the massive physiological perturbations involved. A SNB model is using to fit the data over a very limited parameter range with all the concomitant errors.

      (3) Single-cell bacterial electrophysiology reveals mechanisms of stress-induced damage’, E.Krasnopeeva, et al, Biophysical Journal, 2019, 116, 2390.

      The abstract says ‘PMF defines the physiological state of the cell’. This statement is hyperbolic. An extremely wide range of molecules contribute to the physiological state of a cell. PMF does not even define the electrophysiology of the cell e.g. via the membrane potential. There are 0.2 M of K+ compared with 0.0000001 M of H+ in E. coli, so K+ is arguably a million times more important for the membrane potential than H+ and thus the electrophysiology!

      Equation (1) in the manuscript assumes no other ions are exchanged during the experiments other than H+. This is a very bad approximation when voltage-gated potassium ion channels move the majority ion (K+) around!

      In our model Figure 4A is better explained by depolarisation due to K+ channels closing than direct irreversible photodamage. Why does the THT fluorescence increase again for the second hyperpolarization event if the THT is supposed to be damaged? It does not make sense.

      (4) ‘The proton motive force determines E. coli robustness to extracellular pH’, G.Terradot et al, 2024, preprint.

      This article expounds the SNB model once more. It still ignores the voltage-gated ion channels. Furthermore, it ignores the effect of the dominant ion in E. coli, K+. The manuscript is incorrect as a result and I would not recommend publication.

      In general, an important problem is being researched i.e. how the membrane potential of E. coli is related to motility, but there are serious flaws in the SNB approach and the experimental methodology appears tenuous.

      Answers to specific questions raised by the referees

      Reviewer #1 (Public Review):

      Summary:

      Cell-to-cell communication is essential for higher functions in bacterial biofilms. Electrical signals have proven effective in transmitting signals across biofilms. These signals are then used to coordinate cellular metabolisms or to increase antibiotic tolerance. Here, the authors have reported for the first time coordinated oscillation of membrane potential in E. coli biofilms that may have a functional role in photoprotection.

      Strengths:

      - The authors report original data.

      - For the first time, they showed that coordinated oscillations in membrane potential occur in E. Coli biofilms.

      - The authors revealed a complex two-phase dynamic involving distinct molecular response mechanisms.

      - The authors developed two rigorous models inspired by 1) Hodgkin-Huxley model for the temporal dynamics of membrane potential and 2) Fire-Diffuse-Fire model for the propagation of the electric signal.

      - Since its discovery by comparative genomics, the Kch ion channel has not been associated with any specific phenotype in E. coli. Here, the authors proposed a functional role for the putative K+ Kch channel : enhancing survival under photo-toxic conditions.

      We thank the referee for their positive evaluations and agree with these statements.

      Weaknesses:

      - Since the flow of fresh medium is stopped at the beginning of the acquisition, environmental parameters such as pH and RedOx potential are likely to vary significantly during the experiment. It is therefore important to exclude the contributions of these variations to ensure that the electrical response is only induced by light stimulation. Unfortunately, no control experiments were carried out to address this issue.

      The electrical responses occur almost instantaneously when the stimulation with blue light begins i.e. it is too fast to be a build of pH. We are not sure what the referee means by Redox potential since it is an attribute of all chemicals that are able to donate/receive electrons. The electrical response to stress appears to be caused by ROS, since when ROS scavengers are added the electrical response is removed i.e. pH plays a very small minority role if any.

      - Furthermore, the control parameter of the experiment (light stimulation) is the same as that used to measure the electrical response, i.e. through fluorescence excitation. The use of the PROPS system could solve this problem.

      >>We were enthusiastic at the start of the project to use the PROPs system in E. coli as presented by J.M.Krajl et al, ‘Electrical spiking in E. coli probed with a fluorescent voltage-indicating protein’, Science, 2011, 333, 6040, 345. However, the people we contacted in the microbiology community said that it had some technical issues and there have been no subsequent studies using PROPs in bacteria after the initial promising study. The fluorescent protein system recently presented in PNAS seems more promising, ‘Sensitive bacterial Vm sensors revealed the excitability of bacterial Vm and its role in antibiotic tolerance’, X.Jin et al, PNAS, 120, 3, e2208348120.

      - Electrical signal propagation is an important aspect of the manuscript. However, a detailed quantitative analysis of the spatial dynamics within the biofilm is lacking. In addition, it is unclear if the electrical signal propagates within the biofilm during the second peak regime, which is mediated by the Kch channel. This is an important question, given that the fire-diffuse-fire model is presented with emphasis on the role of K+ ions.

      We have presented a more detailed account of the electrical wavefront modelling work and it is currently under review in a physical journal, ‘Electrical signalling in three dimensional bacterial biofilms using an agent based fire-diffuse-fire model’, V.Martorelli, et al, 2024 https://www.biorxiv.org/content/10.1101/2023.11.17.567515v1

      - Since deletion of the kch gene inhibits the long-term electrical response to light stimulation (regime II), the authors concluded that K+ ions play a role in the habituation response. However, Kch is a putative K+ ion channel. The use of specific drugs could help to clarify the role of K+ ions.

      Our recent electrical impedance spectroscopy publication provides further evidence that Kch is associated with large changes in conductivity as expected for a voltage-gated ion channel (https://pubs.acs.org/doi/10.1021/acs.nanolett.3c04446, 'Electrical impedance spectroscopy with bacterial biofilms: neuronal-like behavior', E.Akabuogu et al, ACS Nanoletters, 2024, in print.

      - The manuscript as such does not allow us to properly conclude on the photo-protective role of the Kch ion channel.

      That Kch has a photoprotective role is our current working hypothesis. The hypothesis fits with the data, but we are not saying we have proven it beyond all possible doubt.

      - The link between membrane potential dynamics and mechanosensitivity is not captured in the equation for the Q-channel opening dynamics in the Hodgkin-Huxley model (Supp Eq 2).

      Our model is agnostic with respect to the mechanosensitivity of the ion channels, although we deduce that mechanosensitive ion channels contribute to ion channel Q.

      - Given the large number of parameters used in the models, it is hard to distinguish between prediction and fitting.

      This is always an issue with electrophysiological modelling (compared with most heart and brain modelling studies we are very conservative in the choice of parameters for the bacteria). In terms of predicting the different phenomena observed, we believe the model is very successful.

      Reviewer #2 (Public Review):

      Summary of what the authors were trying to achieve:

      The authors thought they studied membrane potential dynamics in E.coli biofilms. They thought so because they were unaware that the dye they used to report that membrane potential in E.coli, has been previously shown not to report it. Because of this, the interpretation of the authors' results is not accurate.

      We believe the Pilizota work is scientifically flawed.

      Major strengths and weaknesses of the methods and results:

      The strength of this work is that all the data is presented clearly, and accurately, as far as I can tell.

      The major critical weakness of this paper is the use of ThT dye as a membrane potential dye in E.coli. The work is unaware of a publication from 2020 https://www.sciencedirect.com/science/article/pii/S0006349519308793 [sciencedirect.com] that demonstrates that ThT is not a membrane potential dye in E. coli. Therefore I think the results of this paper are misinterpreted. The same publication I reference above presents a protocol on how to carefully calibrate any candidate membrane potential dye in any given condition.

      We are aware of this study, but believe it to be scientifically flawed. We do not cite the article because we do not think it is a particularly useful contribution to the literature.

      I now go over each results section in the manuscript.

      Result section 1: Blue light triggers electrical spiking in single E. coli cells

      I do not think the title of the result section is correct for the following reasons. The above-referenced work demonstrates the loading profile one should expect from a Nernstian dye (Figure 1). It also demonstrates that ThT does not show that profile and explains why is this so. ThT only permeates the membrane under light exposure (Figure 5). This finding is consistent with blue light peroxidising the membrane (see also following work Figure 4 https://www.sciencedirect.com/science/article/pii/S0006349519303923 [sciencedirect.com] on light-induced damage to the electrochemical gradient of protons-I am sure there are more references for this).

      The Pilizota group invokes some elaborate artefacts to explain the lack of agreement with a simple Nernstian battery model. The model is incorrect not the fluorophore.

      Please note that the loading profile (only observed under light) in the current manuscript in Figure 1B as well as in the video S1 is identical to that in Figure 3 from the above-referenced paper (i.e. https://www.sciencedirect.com/science/article/pii/S0006349519308793 [sciencedirect.com]), and corresponding videos S3 and S4. This kind of profile is exactly what one would expect theoretically if the light is simultaneously lowering the membrane potential as the ThT is equilibrating, see Figure S12 of that previous work. There, it is also demonstrated by the means of monitoring the speed of bacterial flagellar motor that the electrochemical gradient of protons is being lowered by the light. The authors state that applying the blue light for different time periods and over different time scales did not change the peak profile. This is expected if the light is lowering the electrochemical gradient of protons. But, in Figure S1, it is clear that it affected the timing of the peak, which is again expected, because the light affects the timing of the decay, and thus of the decay profile of the electrochemical gradient of protons (Figure 4 https://www.sciencedirect.com/science/article/pii/S0006349519303923 [sciencedirect.com]).

      We think the proton effect is a million times weaker than that due to potasium i.e. 0.2 M K+ versus 10-7 M H+. We can comfortably neglect the influx of H+ in our experiments.

      If find Figure S1D interesting. There authors load TMRM, which is a membrane voltage dye that has been used extensively (as far as I am aware this is the first reference for that and it has not been cited https://www.ncbi.nlm.nih.gov/pmc/articles/PMC1914430 [ncbi.nlm.nih.gov]/). As visible from the last TMRM reference I give, TMRM will only load the cells in Potassium Phosphate buffer with NaCl (and often we used EDTA to permeabilise the membrane). It is not fully clear (to me) whether here TMRM was prepared in rich media (it explicitly says so for ThT in Methods but not for TMRM), but it seems so. If this is the case, it likely also loads because of the damage to the membrane done with light, and therefore I am not surprised that the profiles are similar.

      The vast majority of cells continue to be viable. We do not think membrane damage is dominating.

      The authors then use CCCP. First, a small correction, as the authors state that it quenches membrane potential. CCCP is a protonophore (https://pubmed.ncbi.nlm.nih.gov/4962086 [pubmed.ncbi.nlm.nih.gov]/), so it collapses electrochemical gradient of protons. This means that it is possible, and this will depend on the type of pumps present in the cell, that CCCP collapses electrochemical gradient of protons, but the membrane potential is equal and opposite in sign to the DeltapH. So using CCCP does not automatically mean membrane potential will collapse (e.g. in some mammalian cells it does not need to be the case, but in E.coli it is https://www.biorxiv.org/content/10.1101/2021.11.19.469321v2 [biorxiv.org]). CCCP has also been recently found to be a substrate for TolC (https://journals.asm.org/doi/10.1128/mbio.00676-21 [journals.asm.org]), but at the concentrations the authors are using CCCP (100uM) that should not affect the results. However, the authors then state because they observed, in Figure S1E, a fast efflux of ions in all cells and no spiking dynamics this confirms that observed dynamics are membrane potential related. I do not agree that it does. First, Figure S1E, does not appear to show transients, instead, it is visible that after 50min treatment with 100uM CCCP, ThT dye shows no dynamics. The action of a Nernstian dye is defined. It is not sufficient that a charged molecule is affected in some way by electrical potential, this needs to be in a very specific way to be a Nernstian dye. Part of the profile of ThT loading observed in https://www.sciencedirect.com/science/article/pii/S0006349519308793 [sciencedirect.com] is membrane potential related, but not in a way that is characteristic of Nernstian dye.

      Our understanding of the literature is CCCP poisons the whole metabolism of the bacterial cells. The ATP driven K+ channels will stop functioning and this is the dominant contributor to membrane potential.

      Result section 2: Membrane potential dynamics depend on the intercellular distance

      In this chapter, the authors report that the time to reach the first intensity peak during ThT loading is different when cells are in microclusters. They interpret this as electrical signalling in clusters because the peak is reached faster in microclusters (as opposed to slower because intuitively in these clusters cells could be shielded from light). However, shielding is one possibility. The other is that the membrane has changed in composition and/or the effective light power the cells can tolerate (with mechanisms to handle light-induced damage, some of which authors mention later in the paper) is lower. Given that these cells were left in a microfluidic chamber for 2h hours to attach in growth media according to Methods, there is sufficient time for that to happen. In Figure S12 C and D of that same paper from my group (https://ars.els-cdn.com/content/image/1-s2.0-S0006349519308793-mmc6.pdf [ars.els-cdn.com]) one can see the effects of peak intensity and timing of the peak on the permeability of the membrane. Therefore I do not think the distance is the explanation for what authors observe.

      Shielding would provide the reverse effect, since hyperpolarization begins in the dense centres of the biofilms. For the initial 2 hours the cells receive negligible blue light. Neither of the referee’s comments thus seem tenable.

      Result section 3: Emergence of synchronized global wavefronts in E. coli biofilms

      In this section, the authors exposed a mature biofilm to blue light. They observe that the intensity peak is reached faster in the cells in the middle. They interpret this as the ion-channel-mediated wavefronts moved from the center of the biofilm. As above, cells in the middle can have different membrane permeability to those at the periphery, and probably even more importantly, there is no light profile shown anywhere in SI/Methods. I could be wrong, but the SI3 A profile is consistent with a potential Gaussian beam profile visible in the field of view. In Methods, I find the light source for the blue light and the type of microscope but no comments on how 'flat' the illumination is across their field of view. This is critical to assess what they are observing in this result section. I do find it interesting that the ThT intensity collapsed from the edges of the biofilms. In the publication I mentioned https://www.sciencedirect.com/science/article/pii/S0006349519308793#app2 [sciencedirect.com], the collapse of fluorescence was not understood (other than it is not membrane potential related). It was observed in Figure 5A, C, and F, that at the point of peak, electrochemical gradient of protons is already collapsed, and that at the point of peak cell expands and cytoplasmic content leaks out. This means that this part of the ThT curve is not membrane potential related. The authors see that after the first peak collapsed there is a period of time where ThT does not stain the cells and then it starts again. If after the first peak the cellular content leaks, as we have observed, then staining that occurs much later could be simply staining of cytoplasmic positively charged content, and the timing of that depends on the dynamics of cytoplasmic content leakage (we observed this to be happening over 2h in individual cells). ThT is also a non-specific amyloid dye, and in starving E. coli cells formation of protein clusters has been observed (https://pubmed.ncbi.nlm.nih.gov/30472191 [pubmed.ncbi.nlm.nih.gov]/), so such cytoplasmic staining seems possible.

      >>It is very easy to see if the illumination is flat (Köhler illumination) by comparing the intensity of background pixels on the detector. It was flat in our case. Protons have little to do with our work for reasons highlighted before. Differential membrane permittivity is a speculative phenomenon not well supported by any evidence and with no clear molecular mechanism.

      Finally, I note that authors observe biofilms of different shapes and sizes and state that they observe similar intensity profiles, which could mean that my comment on 'flatness' of the field of view above is not a concern. However, the scale bar in Figure 2A is not legible, so I can't compare it to the variation of sizes of the biofilms in Figure 2C (67 to 280um). Based on this, I think that the illumination profile is still a concern.

      The referee now contradicts themselves and wants a scale bar to be more visible. We have changed the scale bar.

      Result section 4: Voltage-gated Kch potassium channels mediate ion-channel electrical oscillations in E. coli

      First I note at this point, given that I disagree that the data presented thus 'suggest that E. coli biofilms use electrical signaling to coordinate long-range responses to light stress' as the authors state, it gets harder to comment on the rest of the results.

      In this result section the authors look at the effect of Kch, a putative voltage-gated potassium channel, on ThT profile in E. coli cells. And they see a difference. It is worth noting that in the publication https://www.sciencedirect.com/science/article/pii/S0006349519308793 [sciencedirect.com] it is found that ThT is also likely a substrate for TolC (Figure 4), but that scenario could not be distinguished from the one where TolC mutant has a different membrane permeability (and there is a publication that suggests the latter is happening https://onlinelibrary.wiley.com/doi/10.1111/j.1365-2958.2010.07245.x [onlinelibrary.wiley.com]). Given this, it is also possible that Kch deletion affects the membrane permeability. I do note that in video S4 I seem to see more of, what appear to be, plasmolysed cells. The authors do not see the ThT intensity with this mutant that appears long after the initial peak has disappeared, as they see in WT. It is not clear how long they waited for this, as from Figure S3C it could simply be that the dynamics of this is a lot slower, e.g. Kch deletion changes membrane permeability.

      The work that TolC provides a possible passive pathway for ThT to leave cells seems slightly niche. It just demonstrates another mechanism for the cells to equilibriate the concentrations of ThT in a Nernstian manner i.e. driven by the membrane voltage.

      The authors themselves state that the evidence for Kch being a voltage-gated channel is indirect (line 54). I do not think there is a need to claim function from a ThT profile of E. coli mutants (nor do I believe it's good practice), given how accurate single-channel recordings are currently. To know the exact dependency on the membrane potential, ion channel recordings on this protein are needed first.

      We have good evidence form electrical impedance spectroscopy experiments that Kch increases the conductivity of biofilms  (https://pubs.acs.org/doi/10.1021/acs.nanolett.3c04446, 'Electrical impedance spectroscopy with bacterial biofilms: neuronal-like behavior', E.Akabuogu et al, ACS Nanoletters, 2024, in print.

      Result section 5: Blue light influences ion-channel mediated membrane potential events in E. coli

      In this chapter the authors vary the light intensity and stain the cells with PI (this dye gets into the cells when the membrane becomes very permeable), and the extracellular environment with K+ dye (I have not yet worked carefully with this dye). They find that different amounts of light influence ThT dynamics. This is in line with previous literature (both papers I have been mentioning: Figure 4 https://www.sciencedirect.com/science/article/pii/S0006349519303923 [sciencedirect.com] and https://ars.els-cdn.com/content/image/1-s2.0-S0006349519308793-mmc6.pdf [ars.els-cdn.com] especially SI12), but does not add anything new. I think the results presented here can be explained with previously published theory and do not indicate that the ion-channel mediated membrane potential dynamics is a light stress relief process.

      The simple Nernstian battery model proposed by Pilizota et al is erroneous in our opinion for reasons outlined above. We believe it will prove to be a dead end for bacterial electrophysiology studies.

      Result section 6: Development of a Hodgkin-Huxley model for the observed membrane potential dynamics

      This results section starts with the authors stating: 'our data provide evidence that E. coli manages light stress through well-controlled modulation of its membrane potential dynamics'. As stated above, I think they are instead observing the process of ThT loading while the light is damaging the membrane and thus simultaneously collapsing the electrochemical gradient of protons. As stated above, this has been modelled before. And then, they observe a ThT staining that is independent from membrane potential.

      This is an erroneous niche opinion. Protons have little say in the membrane potential since there are so few of them. The membrane potential is mostly determined by K+.

      I will briefly comment on the Hodgkin Huxley (HH) based model. First, I think there is no evidence for two channels with different activation profiles as authors propose. But also, the HH model has been developed for neurons. There, the leakage and the pumping fluxes are both described by a constant representing conductivity, times the difference between the membrane potential and Nernst potential for the given ion. The conductivity in the model is given as gK*n^4 for potassium, gNa*m^3*h sodium, and gL for leakage, where gK, gNa and gL were measured experimentally for neurons. And, n, m, and h are variables that describe the experimentally observed voltage-gated mechanism of neuronal sodium and potassium channels. (Please see Hodgkin AL, Huxley AF. 1952. Currents carried by sodium and potassium ions through the membrane of the giant axon of Loligo. J. Physiol. 116:449-72 and Hodgkin AL, Huxley AF. 1952. A quantitative description of membrane current and its application to conduction and excitation in nerve. J. Physiol. 117:500-44).

      In the 70 years since Hodgkin and Huxley first presented their model, a huge number of similar models have been proposed to describe cellular electrophysiology. We are not being hyperbolic when we state that the HH models for excitable cells are like the Schrödinger equation for molecules. We carefully adapted our HH model to reflect the currently understood electrophysiology of E. coli.

      Thus, in applying the model to describe bacterial electrophysiology one should ensure near equilibrium requirement holds (so that (V-VQ) etc terms in authors' equation Figure 5 B hold), and potassium and other channels in a given bacterium have similar gating properties to those found in neurons. I am not aware of such measurements in any bacteria, and therefore think the pump leak model of the electrophysiology of bacteria needs to start with fluxes that are more general (for example Keener JP, Sneyd J. 2009. Mathematical physiology: I: Cellular physiology. New York: Springer or https://journals.plos.org/plosone/article?id=10.1371/journal.pone.0000144 [journals.plos.org])

      The reference is to a slightly more modern version of a simple Nernstian battery model. The model will not oscillate and thus will not help modelling membrane potentials in bacteria. We are unsure where the equilibrium requirement comes from (inadequate modelling of the dynamics?)

      Result section 7: Mechanosensitive ion channels (MS) are vital for the first hyperpolarization event in E. coli.

      The results that Mcs channels affect the profile of ThT dye are interesting. It is again possible that the membrane permeability of these mutants has changed and therefore the dynamics have changed, so this needs to be checked first. I also note that our results show that the peak of ThT coincides with cell expansion. For this to be understood a model is needed that also takes into account the link between maintenance of electrochemical gradients of ions in the cell and osmotic pressure.

      The evidence for permeability changes in the membranes seems to be tenuous.

      A side note is that the authors state that the Msc responds to stress-related voltage changes. I think this is an overstatement. Mscs respond to predominantly membrane tension and are mostly nonspecific (see how their action recovers cellular volume in this publication https://www.pnas.org/doi/full/10.1073/pnas.1522185113 [pnas.org]). Authors cite references 35-39 to support this statement. These publications still state that these channels are predominantly membrane tension-gated. Some of the references state that the presence of external ions is important for tension-related gating but sometimes they gate spontaneously in the presence of certain ions. Other publications cited don't really look at gating with respect to ions (39 is on clustering). This is why I think the statement is somewhat misleading.

      We have reworded the discussion of Mscs since the literature appears to be ambiguous. We will try to run some electrical impedance spectroscopy experiments on the Msc mutants in the future to attempt to remove the ambiguity.

      Result section 8: Anomalous ion-channel-mediated wavefronts propagate light stress signals in 3D E. coli biofilms.

      I am not commenting on this result section, as it would only be applicable if ThT was membrane potential dye in E. coli.

      Ok, but we disagree on the use of ThT.

      Aims achieved/results support their conclusions:

      The authors clearly present their data. I am convinced that they have accurately presented everything they observed. However, I think their interpretation of the data and conclusions is inaccurate in line with the discussion I provided above.

      Likely impact of the work on the field, and the utility of the methods and data to the community:

      I do not think this publication should be published in its current format. It should be revised in light of the previous literature as discussed in detail above. I believe presenting it in it's current form on eLife pages would create unnecessary confusion.

      We believe many of the Pilizota group articles are scientifically flawed and are causing the confusion in the literature.

      Any other comments:

      I note, that while this work studies E. coli, it references papers in other bacteria using ThT. For example, in lines 35-36 authors state that bacteria (Bacillus subtilis in this case) in biofilms have been recently found to modulate membrane potential citing the relevant literature from 2015. It is worth noting that the most recent paper https://journals.asm.org/doi/10.1128/mbio.02220-23 [journals.asm.org] found that ThT binds to one or more proteins in the spore coat, suggesting that it does not act as a membrane potential in Bacillus spores. It is possible that it still reports membrane potential in Bacillus cells and the recent results are strictly spore-specific, but these should be kept in mind when using ThT with Bacillus.

      >>ThT was used successfully in previous studies of normal B. subtilis cells (by our own group and A.Prindle, ‘Spatial propagation of electrical signal in circular biofilms’, J.A.Blee et al, Physical Review E, 2019, 100, 052401, J.A.Blee et al, ‘Membrane potentials, oxidative stress and the dispersal response of bacterial biofilms to 405 nm light’, Physical Biology, 2020, 17, 2, 036001, A.Prindle et al, ‘Ion channels enable electrical communication in bacterial communities’, Nature, 2015, 527, 59-63). The connection to low metabolism pore research seems speculative.

      Reviewer #3 (Public Review):

      It has recently been demonstrated that bacteria in biofilms show changes in membrane potential in response to changes in their environment, and that these can propagate signals through the biofilm to coordinate bacterial behavior. Akabuogu et al. contribute to this exciting research area with a study of blue light-induced membrane potential dynamics in E. coli biofilms. They demonstrate that Thioflavin-T (ThT) intensity (a proxy for membrane potential) displays multiphasic dynamics in response to blue light treatment. They additionally use genetic manipulations to implicate the potassium channel Kch in the latter part of these dynamics. Mechanosensitive ion channels may also be involved, although these channels seem to have blue light-independent effects on membrane potential as well. In addition, there are challenges to the quantitative interpretation of ThT microscopy data which require consideration. The authors then explore whether these dynamics are involved in signaling at the community level. The authors suggest that cell firing is both more coordinated when cells are clustered and happens in waves in larger, 3D biofilms; however, in both cases evidence for these claims is incomplete. The authors present two simulations to describe the ThT data. The first of these simulations, a Hodgkin-Huxley model, indicates that the data are consistent with the activity of two ion channels with different kinetics; the Kch channel mutant, which ablates a specific portion of the response curve, is consistent with this. The second model is a fire-diffuse-fire model to describe wavefront propagation of membrane potential changes in a 3D biofilm; because the wavefront data are not presented clearly, the results of this model are difficult to interpret. Finally, the authors discuss whether these membrane potential changes could be involved in generating a protective response to blue light exposure; increased death in a Kch ion channel mutant upon blue light exposure suggests that this may be the case, but a no-light control is needed to clarify this.

      In a few instances, the paper is missing key control experiments that are important to the interpretation of the data. This makes it difficult to judge the meaning of some of the presented experiments.

      (1) An additional control for the effects of autofluorescence is very important. The authors conduct an experiment where they treat cells with CCCP and see that Thioflavin-T (ThT) dynamics do not change over the course of the experiment. They suggest that this demonstrates that autofluorescence does not impact their measurements. However, cellular autofluorescence depends on the physiological state of the cell, which is impacted by CCCP treatment. A much simpler and more direct experiment would be to repeat the measurement in the absence of ThT or any other stain. This experiment should be performed both in the wild-type strain and in the ∆kch mutant.

      ThT is a very bright fluorophore (much brighter than a GFP). It is clear from the images of non-stained samples that autofluorescence provides a negligible contribution to the fluorescence intensity in an image.

      (2) The effects of photobleaching should be considered. Of course, the intensity varies a lot over the course of the experiment in a way that photobleaching alone cannot explain. However, photobleaching can still contribute to the kinetics observed. Photobleaching can be assessed by changing the intensity, duration, or frequency of exposure to excitation light during the experiment. Considerations about photobleaching become particularly important when considering the effect of catalase on ThT intensity. The authors find that the decrease in ThT signal after the initial "spike" is attenuated by the addition of catalase; this is what would be predicted by catalase protecting ThT from photobleaching (indeed, catalase can be used to reduce photobleaching in time lapse imaging).

      Photobleaching was negligible over the course of the experiments. We employed techniques such as reducing sample exposure time and using the appropriate light intensity to minimize photobleaching.

      (3) It would be helpful to have a baseline of membrane potential fluctuations in the absence of the proposed stimulus (in this case, blue light). Including traces of membrane potential recorded without light present would help support the claim that these changes in membrane potential represent a blue light-specific stress response, as the authors suggest. Of course, ThT is blue, so if the excitation light for ThT is problematic for this experiment the alternative dye tetramethylrhodamine methyl ester perchlorate (TMRM) can be used instead.

      Unfortunately the fluorescent baseline is too weak to measure cleanly in this experiment. It appears the collective response of all the bacteria hyperpolarization at the same time appears to dominate the signal (measurements in the eLife article and new potentiometry measurements).

      (4) The effects of ThT in combination with blue light should be more carefully considered. In mitochondria, a combination of high concentrations of blue light and ThT leads to disruption of the PMF (Skates et al. 2021 BioRXiv), and similarly, ThT treatment enhances the photodynamic effects of blue light in E. coli (Bondia et al. 2021 Chemical Communications). If present in this experiment, this effect could confound the interpretation of the PMF dynamics reported in the paper.

      We think the PMF plays a minority role in determining the membrane potential in E. coli. For reasons outlined before (H+ is a minority ion in E. coli compared with K+).

      (5) Figures 4D - E indicate that a ∆kch mutant has increased propidium iodide (PI) staining in the presence of blue light; this is interpreted to mean that Kch-mediated membrane potential dynamics help protect cells from blue light. However, Live/Dead staining results in these strains in the absence of blue light are not reported. This means that the possibility that the ∆kch mutant has a general decrease in survival (independent of any effects of blue light) cannot be ruled out.

      >>Both strains of bacterial has similar growth curve and also engaged in membrane potential dynamics for the duration of the experiment. We were interested in bacterial cells that observed membrane potential dynamics in the presence of the stress. Bacterial cells need to be alive to engage in membrane potential  dynamics (hyperpolarize) under stress conditions. Cells that engaged in membrane potential dynamics and later stained red were only counted after the entire duration. We believe that the wildtype handles the light stress better than the ∆kch mutant as measured with the PI.

      (6) Additionally in Figures 4D - E, the interpretation of this experiment can be confounded by the fact that PI uptake can sometimes be seen in bacterial cells with high membrane potential (Kirchhoff & Cypionka 2017 J Microbial Methods); the interpretation is that high membrane potential can lead to increased PI permeability. Because the membrane potential is largely higher throughout blue light treatment in the ∆kch mutant (Fig. 3AB), this complicates the interpretation of this experiment.

      Kirchhoff & Cypionka 2017 J Microbial Methods, using fluorescence microscopy, suggested that changes in membrane potential dynamics can introduce experimental bias when propidium iodide is used to confirm the viability of tge bacterial strains, B subtilis (DSM-10) and Dinoroseobacter shibae, that are starved of oxygen (via N2 gassing) for 2 hours. They attempted to support their findings by using CCCP in stopping the membrane potential dynamics (but never showed any pictoral or plotted data for this confirmatory experiment). In our experiment methodology, cell death was not forced on the cells by introducing an extra burden or via anoxia. We believe that the accumulation of PI in ∆kch mutant is not due to high membrane potential dynamics but is attributed to the PI, unbiasedly showing damaged/dead cells. We think that propidium iodide is good for this experiment. Propidium iodide is a dye that is extensively used in life sciences. PI has also been used in the study of bacterial electrophysiology (https://pubmed.ncbi.nlm.nih.gov/32343961/, ) and no membrane potential related bias was reported.

      Throughout the paper, many ThT intensity traces are compared, and described as "similar" or "dissimilar", without detailed discussion or a clear standard for comparison. For example, the two membrane potential curves in Fig. S1C are described as "similar" although they have very different shapes, whereas the curves in Fig. 1B and 1D are discussed in terms of their differences although they are evidently much more similar to one another. Without metrics or statistics to compare these curves, it is hard to interpret these claims. These comparative interpretations are additionally challenging because many of the figures in which average trace data are presented do not indicate standard deviation.

      Comparison of small changes in the absolute intensities is problematic in such fluorescence experiments. We mean the shape of the traces is similar and they can be modelled using a HH model with similar parameters.

      The differences between the TMRM and ThT curves that the authors show in Fig. S1C warrant further consideration. Some of the key features of the response in the ThT curve (on which much of the modeling work in the paper relies) are not very apparent in the TMRM data. It is not obvious to me which of these traces will be more representative of the actual underlying membrane potential dynamics.

      In our experiment, TMRM was used to confirm the dynamics observed using ThT. However, ThT appear to be more photostable than TMRM (especially towars the 2nd peak). The most interesting observation is that with both dyes, all phases of the membrane potential dynamics were conspicuous (the first peak, the quiescent period and the second peak). The time periods for these three episodes were also similar.

      A key claim in this paper (that dynamics of firing differ depending on whether cells are alone or in a colony) is underpinned by "time-to-first peak" analysis, but there are some challenges in interpreting these results. The authors report an average time-to-first peak of 7.34 min for the data in Figure 1B, but the average curve in Figure 1B peaks earlier than this. In Figure 1E, it appears that there are a handful of outliers in the "sparse cell" condition that likely explain this discrepancy. Either an outlier analysis should be done and the mean recomputed accordingly, or a more outlier-robust method like the median should be used instead. Then, a statistical comparison of these results will indicate whether there is a significant difference between them.

      The key point is the comparison of standard errors on the standard deviation.

      In two different 3D biofilm experiments, the authors report the propagation of wavefronts of membrane potential; I am unable to discern these wavefronts in the imaging data, and they are not clearly demonstrated by analysis.

      The first data set is presented in Figures 2A, 2B, and Video S3. The images and video are very difficult to interpret because of how the images have been scaled: the center of the biofilm is highly saturated, and the zero value has also been set too high to consistently observe the single cells surrounding the biofilm. With the images scaled this way, it is very difficult to assess dynamics. The time stamps in Video S3 and on the panels in Figure 2A also do not correspond to one another although the same biofilm is shown (and the time course in 2B is also different from what is indicated in 2B). In either case, it appears that the center of the biofilm is consistently brighter than the edges, and the intensity of all cells in the biofilm increases in tandem; by eye, propagating wavefronts (either directed toward the edge or the center) are not evident to me. Increased brightness at the center of the biofilm could be explained by increased cell thickness there (as is typical in this type of biofilm). From the image legend, it is not clear whether the image presented is a single confocal slice or a projection. Even if this is a single confocal slice, in both Video S3 and Figure 2A there are regions of "haze" from out-of-focus light evident, suggesting that light from other focal planes is nonetheless present. This seems to me to be a simpler explanation for the fluorescence dynamics observed in this experiment: cells are all following the same trajectory that corresponds to that seen for single cells, and the center is brighter because of increased biofilm thickness.

      We appreciate the reviewer for this important observation. We have made changes to the figures to address this confusion. The cell cover has no influence on the observed membrane potential dynamics. The entire biofilm was exposed to the same blue light at each time. Therefore all parts of the biofilm received equal amounts of the blue light intensity. The membrane potential dynamics was not influenced by cell density (see Fig 2C). 

      The second data set is presented in Video S6B; I am similarly unable to see any wave propagation in this video. I observe only a consistent decrease in fluorescence intensity throughout the experiment that is spatially uniform (except for the bright, dynamic cells near the top; these presumably represent cells that are floating in the microfluidic and have newly arrived to the imaging region).

      A visual inspection of Video S6B shows a fast rise, a decrease in fluorescence and a second rise (supplementary figure 4B). The data for the fluorescence was carefully obtained using the imaris software. We created a curved geometry on each slice of the confocal stack. We analyzed the surfaces of this curved plane along the z-axis. This was carried out in imaris.

      3D imaging data can be difficult to interpret by eye, so it would perhaps be more helpful to demonstrate these propagating wavefronts by analysis; however, such analysis is not presented in a clear way. The legend in Figure 2B mentions a "wavefront trace", but there is no position information included - this trace instead seems to represent the average intensity trace of all cells. To demonstrate the propagation of a wavefront, this analysis should be shown for different subpopulations of cells at different positions from the center of the biofilm. Data is shown in Figure 8 that reflects the velocity of the wavefront as a function of biofilm position; however, because the wavefronts themselves are not evident in the data, it is difficult to interpret this analysis. The methods section additionally does not contain sufficient information about what these velocities represent and how they are calculated. Because of this, it is difficult for me to evaluate the section of the paper pertaining to wave propagation and the predicted biofilm critical size.

      The analysis is considered in more detail in a more expansive modelling article, currently under peer review in a physics journal, ‘Electrical signalling in three dimensional bacterial biofilms using an agent based fire-diffuse-fire model’, V.Martorelli, et al, 2024 https://www.biorxiv.org/content/10.1101/2023.11.17.567515v1

      There are some instances in the paper where claims are made that do not have data shown or are not evident in the cited data:

      (1) In the first results section, "When CCCP was added, we observed a fast efflux of ions in all cells"- the data figure pertaining to this experiment is in Fig. S1E, which does not show any ion efflux. The methods section does not mention how ion efflux was measured during CCCP treatment.

      We have worded this differently to properly convey our results.

      (2) In the discussion of voltage-gated calcium channels, the authors refer to "spiking events", but these are not obvious in Figure S3E. Although the fluorescence intensity changes over time, it's hard to distinguish these fluctuations from measurement noise; a no-light control could help clarify this.

      The calcium transients observed were not due to noise or artefacts.

      (3) The authors state that the membrane potential dynamics simulated in Figure 7B are similar to those observed in 3D biofilms in Fig. S4B; however, the second peak is not clearly evident in Fig. S4B and it looks very different for the mature biofilm data reported in Fig. 2. I have some additional confusion about this data specifically: in the intensity trace shown in Fig. S4B, the intensity in the second frame is much higher than the first; this is not evident in Video S6B, in which the highest intensity is in the first frame at time 0. Similarly, the graph indicates that the intensity at 60 minutes is higher than the intensity at 4 minutes, but this is not the case in Fig. S4A or Video S6B.

      The confusion stated here has now been addressed. Also it should be noted that while Fig 2.1 was obtained with LED light source, Fig S4A was obtained using a laser light source. While obtaining the confocal images (for Fig S4A ), the light intensity was controlled to further minimize photobleaching. Most importantly, there is an evidence of slow rise to the 2nd peak in Fig S4B. The first peak, quiescence and slow rise to second peak are evident.

      Recommendations for the authors:

      Reviewer #1 (Recommendations For The Authors):

      Scientific recommendations:

      - Although Fig 4A clearly shows that light stimulation has an influence on the dynamics of cell membrane potential in the biofilm, it is important to rule out the contribution of variations in environmental parameters. I understand that for technical reasons, the flow of fresh medium must be stopped during image acquisition. Therefore, I suggest performing control experiments, where the flow is stopped before image acquisition (15min, 30min, 45min, and 1h before). If there is no significant contribution from environmental variations (pH, RedOx), the dynamics of the electrical response should be superimposed whatever the delay between stopping the flow stop and switching on the light.

      In this current research study, we were focused on studying how E. coli cells and biofilms react to blue light stress via their membrane potential dynamics. This involved growing the cells and biofilms, stopping the media flow and obtaining data immediately. We believe that stopping the flow not only helped us to manage data acquisition, it also helped us reduce the effect of environmental factors. In our future study we will expand the work to include how the membrane potential dynamics evolve in the presence of changing environmental factors for example such induced by stopping the flow at varied times.

      - Since TMRM signal exhibits a linear increase after the first response peak (Supplementary Figure 1D), I recommend mitigating the statement at line 78.

      - To improve the spatial analysis of the electrical response, I suggest plotting kymographs of the intensity profiles across the biofilm. I have plotted this kymograph for Video S3 and it appears that there is no electrical propagation for the second peak. In addition, the authors should provide technical details of how R^2(t) is measured in the first regime (Figure 7E).

      See the dedicated simulation article for more details. https://www.biorxiv.org/content/10.1101/2023.11.17.567515v1

      - Line 152: To assess the variability of the latency, the authors should consider measuring the variance divided by the mean instead of SD, which may depend on the average value.

      We are happy with our current use of standard error on the standard deviation. It shows what we claim to be true.

      - Line 154-155: To truly determine whether the amplitude of the "action potential" is independent of biofilm size, the authors should not normalise the signals.

      Good point. We qualitatively compared both normalized and unnormalized data. Recent electrical impedance spectroscopy measurements (unpublished) indicate that the electrical activity is an extensive quantity i.e. it scales with the size of the biofilms.

      - To precise the role of K+ in the habituation response, I suggest using valinomycin at sub-inhibitory concentrations (10µM). Besides, the high concentration of CCCP used in this study completely inhibits cell activity. Not surprisingly, no electrical response to light stimulation was observed in the presence of CCCP. Finally, the Kch complementation experiment exhibits a "drop after the first peak" on a single point. It would be more convincing to increase the temporal resolution (1min->10s) to show that there is indeed a first and a second peak.

      An interesting experiment for the future.

      - Line 237-238: There are only two points suggesting that the dynamics of hyperpolarization are faster at higher irradiance(Fig 4A). The authors should consider adding a third intermediate point at 17µW/mm^2 to confirm the statement made in this sentence.

      Multiple repeats were performed. We are confident of the robustness of our data.

      - Line 249 + Fig 4E: It seems that the data reported on Fig 4E are extracted from Fig 4D. If this is indeed the case, the data should be normalised by the total population size to compare survival probabilities under the two conditions. It would also be great to measure these probabilities (for WT and ∆kch) in the presence of ROS scavengers.

      - To distinguish between model fitting and model predictions, the authors should clearly state which parameters are taken from the literature and which parameters are adjusted to fit the experimental data.

      - Supplementary Figure 4A: why can't we see any wavefront in this series of images?

      For the experimental data, the wavefront was analyzed by employing the imaris software. We systematically created a ROI with a curved geometry within the confocal stack (the biofilm). The fluorescence of ThT was traced along the surface of the curved geometry was analyzed along the z-axis.

      - Fig 7B: Could the authors explain why the plateau is higher in the simulations than in the biofilm experiments? Could they add noise on the firing activities?

      See the dedicated Martorelli modelling article. In general we would need to approach stochastic Hodgkin-Huxley modelling and the fluorescence data (and electrical impedance spectroscopy data) presented does not have extensive noise (due to collective averaging over many bacteria cells).

      - Supplementary Figure 4B: Why can't we see the second peak in confocal images?

      The second peak is present although not as robust as in Fig 2B. The confocal images were obtained with a laser source. Therefore we tried to create a balance between applying sufficient light stress on the bacterial cells and mitigating photobleaching.

      Editing recommendations:

      The editing recommendations below has been applied where appropriate

      - Many important technical details are missing (e.g. R^2, curvature, and 445nm irradiance measurements). Error bars are missing from most graphs. The captions should clearly indicate if these are single-cell or biofilm experiments, strain name, illumination conditions, number of experiments, SD, or SE. Please indicate on all panels of all figures in the main text and in the supplements, which are the conditions: single cell vs. biofilm, strains, medium, centrifugal vs centripetal etc..., where relevant. Please also draw error bars everywhere.

      We have now made appropriate changes. We specifically use cells when we were dealing with single cells and biofilms when we worked on biofilms. We decided to describe the strain name either on the panel or the image description.

      - Line 47-51: The way the paragraph is written suggests that no coordinated electrical oscillations have been observed in Gram-negative biofilms. However, Hennes et al (referenced as 57 in this manuscript) have shown that a wave of hyperpolarized cells propagates in Neisseria gonorrhoea colony, which is a Gram-negative bacterium.

      We are now aware of this work. It was not published when we first submitted our work and the authors claim the waves of activity are due to ROS diffusion NOT propagating waves of ions (coordinated electrical wavefronts).

      - Line 59: "stressor" -> "stress" or "perturbation".

      The correction has been made.

      - Line 153: Please indicate in the Material&Methods how the size of the biofilm is measured.

      The biofilm size was obtained using BiofilmQ and the step by step guide for using BiofilmQ were stated..

      - Figure 2A: Please provide associated brightfield images to locate bacteria.

      - Line 186: Please remove "wavefront" from the caption. Fig2B only shows the average signal as a function of time.

      This correction has been implemented.

      - Fig 3B,C: Please indicate single cell and biofilm on the panels and also WT and ∆kch.

      - Line 289: I suggest adding "in single cell experiments" to the title of this section.

      - Fig 5A: blue light is always present at regular time intervals during regime I and II. The presence of blue light only in regime I could be misleading.

      - Fig 5C: The curve in Fig 5D seems to correspond to the biofilm case. The curve given by the model, should be compared with the average curve presented in Fig 1D.

      - Fig 6A, B, and C: These figures could be moved to supplements.

      - Line 392: Replace "turgidity" with "turgor pressure".

      - Fig 7C,E: Please use a log-log scale to represent these data and indicate the line of slope 1.

      - Fig 7E: The x-axis has been cropped.

      - Please provide a supplementary movie for the data presented in Fig 7E.

      - Line 455: E. Coli biofilms do not express ThT.

      - Line 466: "\gamma is the anomalous exponent". Please remove anomalous (\gamma can equal 1 at this stage).

      - Line 475: Please replace "section" with "projection".

      - Line 476: Please replace "spatiotemporal" with "temporal". There is no spatial dependency in either figure.

      - Line 500: Please define Eikonal approximation.

      - Fig 8 could be moved to supplements.

      - Line 553: "predicted" -> "predict".

      - Line 593: Could the authors explain why their model offers much better quantitative agreement?

      - Line 669: What does "universal" mean in that context?

      - Line 671: A volume can be pipetted but not a concentration.

      - Line 676: Are triplicates technical or biological replicates?

      - Sup Fig1: Please use minutes instead of seconds in panel A.

      - Model for membrane dynamics: "The fraction of time the Q+ channel is open" -> "The dynamics of Q+ channel activity can be written". Ditto for K+ channel...

      - Model for membrane dynamics: "the term ... is a threshold-linear". This function is not linear at all. Why is it called linear? Also, please describe what \sigma is.

      - ABFDF model: "releasing a given concentration" -> "releasing a local concentration" or "a given number" but it's not \sigma anymore. Besides, this \sigma is unlikely related to the previous \sigma used in the model of membrane potential dynamics in single cells. Please consider renaming one or the other. Also, ions are referred to as C+ in the text and C in equation 8. Am I missing something?

      Reviewer #2 (Recommendations For The Authors):

      I have included all my comments as one review. I have done so, despite the fact that some minor comments could have gone into this section, because I decided to review each Result section. I thus felt that not writing it as one review might be harder to follow. I have however highlighted which comments are minor suggestions or where I felt corrections.

      However, while I am happy with all my comments being public, given their nature I think they should be shown to authors first. Perhaps the authors want to go over them and think about it before deciding if they are happy for their manuscript to be published along with these comments, or not. I will highlight this in an email to the editor. I question whether in this case, given that I am raising major issues, publishing both the manuscript and the comments is the way to go as I think it might just generate confusion among the audience.

      Reviewer #3 (Recommendations For The Authors):

      I was unable to find any legends for any of the supplemental videos in my review materials, and I could not open supplemental video 5.

      I made some comments in the public review about the analysis and interpretation of the time-to-fire data. One of the other challenges in this data set is that the time resolution is limited- it seems that a large proportion of cells have already fired after a single acquisition frame. It would be ideal to increase the time resolution on this measurement to improve precision. This could be done by imaging more quickly, but that would perhaps necessitate more blue light exposure; an alternative is to do this experiment under lower blue light irradiance where the first spike time is increased (Figure 4A).

      In the public review, I mentioned the possible impact of high membrane potential on PI permeability. To address this, the experiment could be repeated with other stains, or the viability of blue light-treated cells could be addressed more directly by outgrowth or colony-forming unit assays.

      In the public review, I mentioned the possible combined toxicity of ThT and blue light. Live/dead experiments after blue light exposure with and without ThT could be used to test for such effects, and/or the growth curve experiment in Figure 1F could be repeated with blue light exposure at a comparable irradiance used in the experiment.

      Throughout the paper and figure legends, it would help to have more methodological details in the main text, especially those that are critical for the interpretation of the experiment. The experimental details in the methods section are nicely described, but the data analysis section should be expanded significantly.

      At the end of the results section, the authors suggest a critical biofilm size of only 4 µm for wavefront propagation (not much larger than a single cell!). The authors show responses for various biofilm sizes in Fig. 2C, but these are all substantially larger. Are there data for cell clusters above and below this size that could support this claim more directly?

      The authors mention image registration as part of their analysis pipeline, but the 3D data sets in Video S6B and Fig. S4A do not appear to be registered- were these registered prior to the velocity analysis reported in Fig. 8?

      One of the most challenging claims to demonstrate in this paper is that these membrane potential wavefronts are involved in coordinating a large, biofilm-scale response to blue light. One possible way to test this might be to repeat the Live/Dead experiment in planktonic culture or the single-cell condition. If the protection from blue light specifically emerges due to coordinated activity of the biofilm, the Kch mutant would not be expected to show a change in Live/Dead staining in non-biofilm conditions.

      Line 140: How is "mature biofilm" defined? Also on this same line, what does "spontaneous" mean here?

      Line 151: "much smaller": Given that the reported time for 3D biofilms is 2.73 {plus minus} 0.85 min and in microclusters is 3.27 {plus minus} 1.77 min, this seems overly strong.

      Line 155: How is "biofilm density" characterized? Additionally, the data in Figure 2C are presented in distance units (µm), but the text refers to "areal coverage"- please define the meaning of these distance units in the legend and/or here in the text (is this the average radius?).

      Lines 161-162: These claims seem strong given the data presented before, and the logic is not very explicit. For example, in the second sentence, the idea that this signaling is used to "coordinate long-range responses to light stress" does not seem strongly evidenced at this point in the paper. What is meant by a long-range response to light stress- are there processes to respond to light that occur at long-length scales (rather than on the single-cell scale)? If so, is there evidence that these membrane potential changes could induce these responses? Please clarify the logic behind these conclusions.

      Lines 235-236: In the lower irradiance conditions, the responses are slower overall, and it looks like the ThT intensity is beginning to rise at the end of the measurement. Could a more prominent second peak be observed in these cases if the measurement time was extended?

      Line 242-243: The overall trajectories of extracellular potassium are indeed similar, but the kinetics of the second peak of potassium are different than those observed by ThT (it rises some minutes earlier)- is this consistent with the idea that Kch is responsible for that peak? Additionally, the potassium dynamics also reflect the first peak- is this surprising given that the Kch channel has no effect on this peak?

      Line 255-256: Again, this seems like a very strong claim. There are several possible interpretations of the catalase experiment (which should be discussed); this experiment perhaps suggests that ROS impacts membrane potential, but does not obviously indicate that these membrane potential fluctuations mitigate ROS levels or help the cells respond to ROS stress. The loss of viability in the ∆kch mutant might indicate a link between these membrane potential experiments and viability, but it is hard to interpret without the no-light control I mention in the public review.

      Lines 313-315: "The model predicts... the external light stress". Please clarify this section. Where this prediction arises from in the modeling work? Second, I am not sure what is meant by "modulates the light stress" or "keeps the cell dynamics robust to the intensity of external light stress" (especially since the dynamics clearly vary with irradiance, as seen in Figure 4A).

      Line 322: I am not sure what "handles the ROS by adjusting the profile of the membrane potential dynamics" means. What is meant by "handling" ROS? Is the hypothesis that membrane potential dynamics themselves are protective against ROS, or that they induce a ROS-protective response downstream, or something else? Later in lines 327-8 the authors write that changes in the response to ROS in the model agree with the hypothesis, but just showing that ROS impacts the membrane potential does not seem to demonstrate that this has a protective effect against ROS.

      Line 365-366: This section title seems confusing- mechanosensitive ion channels totally ablate membrane potential dynamics, they don't have a specific effect on the first hyperpolarization event. The claim that mechanonsensitive ion channels are specifically involved in the first event also appears in the abstract.

      Also, the apparent membrane potential is much lower even at the start of the experiment in these mutants- is this expected? This seems to imply that these ion channels also have a blue light independent effect.

      Lines 368, 371: Should be VGCCs rather than VGGCs.

      Line 477: I believe the figure reference here should be to Figure 7B, not 6B.

      Line 567-568: "The initial spike is key to registering the presence of the light stress." What is the evidence for this claim?

      Line 592-594: "We have presented much better quantitative agreement..." This is a strong claim; it is not immediately evident to me that the agreement between model and prediction is "much better" in this work than in the cited work. The model in Figure 4 of reference 57 seems to capture the key features of their data. Clarification is needed about this claim.

      Line 613: "...strains did not have any additional mutations." This seems to imply that whole genome sequencing was performed- is this the case?

      Line 627: I believe this should refer to Figure S2A-B rather than S1.

      Line 719: What percentage of cells did not hyperpolarize in these experiments?

      Lines 751-754: As I mentioned above, significant detail is missing here about how these measurements were made. How is "radius" defined in 3D biofilms like the one shown in Video S6B, which looks very flat? What is meant by the distance from the substrate to the core, since usually in this biofilm geometry, the core is directly on the substrate? Most importantly, this only describes the process of sectioning the data- how were these sections used to compute the velocity of ThT signal propagation?

      I also have some comments specifically on the figure presentation:

      Normalization from 0 to 1 has been done in some of the ThT traces in the paper, but not all. The claims in the paper would be easiest to evaluate if the non-normalized data were shown- this is important for the interpretation of some of the claims.

      Some indication of standard deviation (error bars or shading) should be added to all figures where mean traces are plotted.

      Throughout the paper, I am a bit confused by the time axis; the data consistently starts at 1 minute. This is not intuitive to me, because it seems that the blue light being applied to the cells is also the excitation laser for ThT- in that case, shouldn't the first imaging frame be at time 0 (when the blue light is first applied)? Or is there an additional exposure of blue light 1 minute before imaging starts? This is consequential because it impacts the measured time to the first spike. (Additionally, all of the video time stamps start at 0).

      Please increase the size of the scale bars and bar labels throughout, especially in Figure 2A and S4A.

      In Figure 1B and D, it would help to decrease the opacity on the individual traces so that more of them can be discerned. It would also improve clarity to have data from the different experiments shown with different colored lines, so that variability between experiments can be clearly visualized.

      Results in Figure 1E would be easier to interpret if the frequency were normalized to total N. It is hard to tell from this graph whether the edges and bin widths are the same between the data sets, but if not, they should be. Also, it would help to reduce the opacity of the sparse cell data set so that the full microcluster data set can be seen as well.

      Biofilm images are shown in Figures 2A, S3A, and Video S3- these are all of the same biofilm. Why not take the opportunity to show different experimental replicates in these different figures? The same goes for Figure S4A and Video S6B, which again are of the same biofilm.

      Figure 2C would be much easier to read if the curves were colored in order of their size; the same is true for Figure 4A and irradiance.

      The complementation data in Figure S3D should be moved to the main text figure 3 alongside the data about the corresponding knockout to make it easier to compare the curves.

      Fig.ure S3E: Is the Y-axis in this graph mislabeled? It is labeled as ThT fluorescence, but it seems that it is reporting fluorescence from the calcium indicator?

      Video S6B is very confusing - why does the video play first forwards and then backwards? Unless I am looking very carefully at the time stamps it is easy to misinterpret this as a rise in the intensity at the end of the experiment. Without a video legend, it's hard to understand this, but I think it would be much more straightforward to interpret if it only played forward. (Also, why is this video labeled 6B when there is no video 6A?)

    1. Author response:

      The following is the authors’ response to the original reviews.

      Reviewer #1 (Public review):

      This paper presents a comprehensive study of how neural tracking of speech is a ected by background noise. Using five EEG experiments and Temporal response function (TRF), it investigates how minimal background noise can enhance speech tracking even when speech intelligibility remains very high. The results suggest that this enhancement is not attention-driven but could be explained by stochastic resonance. These findings generalize across di erent background noise types and listening conditions, o ering insights into speech processing in real-world environments. I find this paper well-written, the experiments and results are clearly described. However, I have a few comments that may be useful to address.

      I thank the reviewer for their positive feedback.

      (1) The behavioral accuracy and EEG results for clear speech in Experiment 4 di er from those of Experiments 1-3. Could the author provide insights into the potential reasons for this discrepancy? Might it be due to linguistic/ acoustic di erences between the passages used in experiments? If so, what was the rationale behind using di erent passages across di erent experiments?

      The slight di erences in behavior and EEG magnitudes may be due to several factors. Di erent participants took part in the di erent experiments (with some overlap). Stories and questions were generated using ChatGPT using the same approach, but di erent research assistants have supported story and question generation, and ChatGPT advanced throughout the course of the study, such that di erent versions were used over time (better version control was only recently introduced by OpenAI). The same Google voice was used for all experiments, so this cannot be a factor. Most critically, within each experiment, assignment of speech-clarity conditions to di erent stories was randomized, such that statistical comparisons are una ected by these minor di erences between experiments. The noise-related enhancement generalizes across all experiments, showing that minor di erences in experimental materials do not impact it.

      (2) Regarding peak amplitude extraction, why were the exact peak amplitudes and latencies of the TRFs for each subject not extracted, and instead, an amplitude average within a 20 ms time window based on the group-averaged TRFs used? Did the latencies significantly di er across di erent SNR conditions?

      Estimation of peak latency can be challenging if a deflection is not very pronounced in a participant. Especially the N1 was small for some conditions. Using the mean amplitude in a specific time window is very common practice in EEG research that mitigates this issue. Another, albeit less common, approach is to use a Jackknifing procedure to estimate each participant’s latencies (Smulders 2010 Psychophysiology; although this may sometimes not work well). For the revision, I used the Jackknifing approach to estimate peak latencies for each participant and condition, and extracted the mean amplitude around the peak latency. As expected, this approach provides very similar e ects as reported in the main article, here exemplified for Experiments 1 and 2. The results are thus not a ected by this data analysis choice. The estimated latencies di ered across SNRs, e.g., the N1 increased with decreasing SNR (this is less surprising/novel and was thus not added to the manuscript to avoid increasing the amount of information).

      Author response image 1.

      P1-minus-N1 amplitude for Experiment 1 and 2, using amplitudes centered on individually estimated peak latencies. The asterisk indicates a significant di erence from the clear speech condition (FDR-thresholded).

      (3) How is neural tracking quantified in the current study? Does improved neural tracking correlate with EEG prediction accuracy or individual peak amplitudes? Given the di ering trends between N1 and P2 peaks in babble and speech-matched noise in experiment 3, how is it that babble results in greater envelope tracking compared to speech-matched noise?

      Neural tracking is generally used for responses resulting from TRF analyses, crosscorrelations, or coherence, where the speech envelope is regressed against the brain signals (see review of Brodbeck & Simon 2020 Current Opinion in Physiology). Correlations between EEG prediction accuracy and individual peak amplitudes was not calculated because the data used for the analyses are not independent. The EEG prediction accuracy essentially integrates information over a longer time interval (here 0–0.4 s), whereas TRF amplitudes are more temporally resolved. If one were to shorten the time interval (e.g., 0.08–0.12 s), then EEG prediction accuracy would look more similar to the TRF results (because the TRF is convolved with the amplitude-onset envelope of the speech [predicted EEG] before calculating the EEG prediction accuracy). Regarding the enhancement di erence between speech-matched noise and babble, I have discussed a possible interpretation in the discussion section. The result is indeed surprising, but it replicates across two experiments (Experiments 3 and 4), and is consistent with previous work using speech-matched noise that did not find the enhancement. I reproduce the part of the discussion here.

      “Other work, using a noise masker that spectrally matches the target speech, have not reported tracking enhancements (Ding and Simon, 2013; Zou et al., 2019; Synigal et al., 2023). However, in these works, SNRs have been lower (<10 dB) to investigate neural tracking under challenging listening conditions. At low SNRs, neural speech tracking decreases (Ding and Simon, 2013; Zou et al., 2019; Yasmin et al., 2023; Figures 1 and 2), thus resulting in an inverted u-shape in relation to SNR for attentive and passive listening (Experiments 1 and 2).”

      “The noise-related enhancement in the neural tracking of the speech envelope was greatest for 12talker babble, but it was also present for speech-matched noise, pink noise, and, to some extent, white noise. The latter three noises bare no perceptional relation to speech, but resemble stationary, background buzzing from industrial noise, heavy rain, waterfalls, wind, or ventilation. Twelve-talker babble – which is also a stationary masker – is clearly recognizable as overlapping speech, but words or phonemes cannot be identified (Bilger, 1984; Bilger et al., 1984; Wilson, 2003; Wilson et al., 2012b). There may thus be something about the naturalistic, speech nature of the background babble that facilitates neural speech tracking.”

      “Twelve-talker babble was associated with the greatest noise-related enhancement in neural tracking, possibly because the 12-talker babble facilitated neuronal activity in speech-relevant auditory regions, where the other, non-speech noises were less e ective.”

      (4) The paper discusses how speech envelope-onset tracking varies with di erent background noises. Does the author expect similar trends for speech envelope tracking as well? Additionally, could you explain why envelope onsets were prioritized over envelope tracking in this analysis?

      The amplitude-onset envelope was selected because several previous works have used the amplitude-onset envelope, our previous work that first observed the enhancement also used the amplitude-onset envelope, and the amplitude-onset envelope has been suggested to work better for speech tracking. This was added to the manuscript. For the manuscript revision, analyses were calculated for the amplitude envelope, largely replicating the results for the amplitude-onset envelope. The results for the amplitude envelope are now presented in the Supplementary Materials and referred to in the main text.

      “The amplitude-onset envelope was selected because a) several previous works have used it (Hertrich et al., 2012; Fiedler et al., 2017; Brodbeck et al., 2018a; Daube et al., 2019; Fiedler et al., 2019), b) our previous work first observing the enhancement also used the amplitude-onset envelope (Yasmin et al., 2023; Panela et al., 2024), and c) the amplitude-onset envelope has been suggested to elicit a strong speech tracking response (Hertrich et al., 2012). Results for analyses using the amplitude envelope instead of the amplitude-onset envelope show similar e ects and are provided in the Supplementary Materials (Figure 1-figure supplement 1).”

      Recommendations for the authors:

      (1) Include all relevant parameters related to data analysis where applicable. For example, provide the filter parameters (Line 154, Line 177, Line 172), and the default parameters of the speech synthesizer (Line 131).

      Additional filter information and parameter values are provided in the revised manuscript.

      (2) Please share the data and codes or include a justification as to why the data cannot be shared.

      Data and code are provided on OSF (https://osf.io/zs9u5/). A materials availability statement has been added to the manuscript.

      Reviewer #2 (Public review):

      The author investigates the role of background noise on EEG-assessed speech tracking in a series of five experiments. In the first experiment, the influence of di erent degrees of background noise is investigated and enhanced speech tracking for minimal noise levels is found. The following four experiments explore di erent potential influences on this e ect, such as attentional allocation, di erent noise types, and presentation mode. The step-wise exploration of potential contributors to the e ect of enhanced speech tracking for minimal background noise is compelling. The motivation and reasoning for the di erent studies are clear and logical and therefore easy to follow. The results are discussed in a concise and clear way. While I specifically like the conciseness, one inevitable consequence is that not all results are equally discussed in depth. Based on the results of the five experiments, the author concludes that the enhancement of speech tracking for minimal background noise is likely due to stochastic resonance. Given broad conceptualizations of stochastic resonance as a noise benefit this is a reasonable conclusion. This study will likely impact the field as it provides compelling support questioning the relationship between speech tracking and speech processing.

      I thank the reviewer for the positive review and thoughtful feedback.

      Recommendations for the authors:

      As mentioned in the public review, I like the conciseness. However, some points might benefit from addressing them.

      (1) The absence of comprehension e ects is on the one hand surprising, as the decreased intelligibility should (theoretically) be visible in this data. On the other hand, from my own experience, the generation of "good" comprehension questions is quite di icult. While it is mentioned in the methods section, that comprehension accuracy and gist rating go hand in hand, this is not the case here. I am wondering if the data here should be rather understood as "there is no di erence in intelligibility" or that comprehension assessment via comprehension questions is potentially not a valid measure.

      I assume that the reviewer refers to Experiment 1, where SNRs approximately below 15 dB led to reduced gist ratings (used as a proxy for speech intelligibility; Davis and Johnsrude, 2003, J Neurosci; Ritz et al., 2022, J Neurosci). That story comprehension accuracy does not decrease could be due to the comprehension questions themselves (as indicated by the reviewer, “good” questions can be hard to generate, potentially having low sensitivity). On the other hand, speech for the most di icult SNR was still ‘reasonably’ intelligible (gist ratings suggest ~85% of words could be understood), and participants may still have been able to follow the thread of the story. I do not further discuss this point in the manuscript, since it is not directly related to the noise-related enhancement in the neural tracking response, because the enhancement was present for high SNRs for which gist ratings did not show a di erence relative to clear speech (i.e., 20 dB and above).

      (2) However, if I understood correctly, the "lower" manipulation (same RMS for the whole sound stimulus) of experiment 3 was, what was also used in experiment 1. In experiment 3, unlike 1, there are comprehension e ects. I wondered if there are ideas about why that is.

      Yes indeed, the ‘lower’ manipulation in Experiment 3 was also used in Experiments 1, 2, 4, and 5. The generation of the stimulus materials was similar across experiments. However, a new set of stories and comprehension questions was used for each experiment and the participants di ered as well (with some overlap). These aspects may have contributed to the di erence. 

      (3) Concerning the prediction accuracy, for a naive reader, some surrounding information would be helpful: What is the purpose/expectation of this measure? Is it to show that all models are above chance?

      EEG prediction accuracy was included here, mainly because it is commonly used in studies using TRFs. A reader may wonder about EEG prediction accuracy if it were not reported. The hypotheses of the current study are related to the TRF weights/amplitude. This was added to the manuscript.

      “EEG prediction accuracy was calculated because many previous studies report it (e.g., Decruy et al., 2019; Broderick et al., 2021; Gillis et al., 2021; Weineck et al., 2022; Karunathilake et al., 2023), but the main focus of the current study is on the TRF weights/amplitude.”

      (4) Regarding the length of training and test data I got confused: It says per story 50 25-s snippets. As the maximum length of a story was 2:30 min, those snippets were mostly overlapping, right? It seems that depending on the length of the story and the "location within the time series" of the snippets, the number of remaining non-over-lapping snippets is variable. Also, within training, the snippets were overlapping, correct? Otherwise, the data for training would be too short. Again, as a naive reader, is this common, or can overlapping training data lead to overestimations?

      The short stories made non-overlapping windows not feasible, but the overlap unlikely a ects the current results. Using cross-correlation (Hertrich et al 2012 Psychophysiology; which is completely independent for di erent snippets) instead of TRFs shows the same results (now provided in the supplementary materials). In one of our previous studies where the enhancement was first observed (Yasmin et al. 2023 Neuropsychologia), non-overlapping data were used because the stories were longer. This makes any meaningful impact of the overlap very unlikely. Critically, speech-clarity levels were randomized and all analyses were conducted in the same way for all conditions, thus not confounding any of the results/conclusions. The methods section was extended to further explain the choice of overlapping data snippets.

      “Speech-clarity levels were randomized across stories and all analyses were conducted similarly for all conditions. Hence, no impact of overlapping training data on the results is expected (consistent with noise-related enhancements observed previously when longer stories and non-overlapping data were used; Yasmin et al., 2023). Analyses using cross-correlation, for which data snippets are treated independently, show similar results compared to those reported here using TRFs (Figure 1figure supplement 2).”

      (5) For experiment 1, three stories were clear, while the other 21 conditions were represented by one story each. Presumably, the ratio of 3:1 can a ect TRFs?

      TRFs were calculated for each story individually and then averaged across three stories: either three clear stories, or three stories in babble for neighboring SNRs. Hence, the same number of TRFs were averaged for clear and noise conditions, avoiding exactly this issue. This was described in the methods section and is reproduced here:

      “Behavioral data (comprehension accuracy, gist ratings), EEG prediction accuracy, and TRFs for the three clear stories were averaged. For the stories in babble, a sliding average across SNR levels was calculated for behavioral data, EEG prediction accuracy, and TRFs, such that data for three neighboring SNR levels were averaged. Averaging across three stories was calculated to reduce noise in the data and match the averaging of three stories for the clear condition.”

      (6) Was there an overlap in participants?

      Some participants took part in several of the experiments in separate sessions on separate days. This was added to the manuscript.

      “Several participants took part in more than one of the experiments, in separate sessions on separate days: 7, 7, 9, 9, and 14 (for Experiments 1-5, respectively) participated only in one experiment; 3 individuals participated in all 5 experiments; 68 unique participants took part across the 5 experiments.”

      (7) Can stochastic resonance also explain inverted U-shape results with vocoded speech?

      This is an interesting question. Distortions to the neural responses to noise-vocoding may reflect internal noise, but this would require additional research. For example, the Hauswald study (2022 EJN), showing enhancements due to noise-vocoding, used vocoding channels that also reduced speech intelligibility. The study would ideally be repeated with a greater number of vocoding channels to make sure the e ects are not driven by increased attention due to reduced speech intelligibility. I did not further discuss this in detail in the manuscript as it would go too far away from the experiments of the current study.

      (8) Typo in the abstract: box sexes is probably meant to say both sexes?

      This text was removed, because more detailed gender identification is reported in the methods, and the abstract needed shortening to meet the eLife guidelines.

      Reviewing Editor Comments:

      Interesting series of experiments to assess the influence of noise on cortical tracking in di erent conditions, interpreting the results with the mechanism of stochastic resonance.

      I thank the editor for their encouraging feedback.

      For experiment 2, the author wishes to exclude the role of attention, by making participants perform a visual task. Data from low performers on the visual task was excluded, to avoid that participants attended the spoken speech. However, from the high performers on the visual task, how can you be sure that they did not pay attention to the auditory stimuli as well (as auditory attention is quite automatic, and these participants might be good at dividing their attention)? I understand that you can not ask participants about the auditory task during the experiment, but did you ask AFTER the experiment whether they were able to understand the stimuli? I think this is crucial for your interpretation.

      Participants were not asked whether they were able to understand the stimuli. Participants would unlikely invest e ort/attention in understanding the stories in babble without a speech-related task. Nevertheless, for follow-up analyses, I removed participants who performed above 0.9 in the visual task (i.e., the high performers), and the di erence between clear speech and speech in babble replicates. In the plots, data from all babble conditions above 15 dB SNR (highly intelligible) were averaged, but the results look almost identical if all SNRs are averaged. Moreover, the correlation between visual task performance and the babble-related enhancement was not-significant. These analyses were added to the Supplementary Materials (Figure 2-figure supplement 1).  

      Statistics: inconsistencies across experiments with a lot of simple tests (FDR corrected) and in addition sometimes rmANOVA added - if interactions in rmANOVA are not significant then all the simple tests might not be warranted. So a bit of double dipping and over-testing here, but on the whole the conclusions do not seem to be overstated.

      The designs of the di erent experiments di ered, thus requiring di erent statistical approaches. Moreover, the di erent tests assess di erent comparisons. For all experiments, contrasting the clear condition to all noise conditions was the main purpose of the experiments. To correct for multiple comparison, the False Discovery Rate correction was used. Repeated-measures ANOVAs were conducted in addition to this – excluding the clear condition because it would not fit into a factorial structure (e.g., Experiment 3) or to avoid analyzing it twice (e.g., Experiment 5) – to investigate di erences between di erent noise conditions. There was thus no over-testing in the presented study.

      Small points:

      Question on methods: For each story, 50 25-s data snippets were extracted (Page 7, line 190). As you have stories with a duration of 1.5 to 2 minutes, does that mean there is a lot of overlap across data snippets? How does that influence the TRF/prediction accuracy?

      The short stories made non-overlapping windows not feasible, but the overlap unlikely a ects the current results. Using cross-correlation (Hertrich et al 2012 Psychophysiology; which is completely independent for di erent snippets) instead of TRFs shows the same results (newly added Figure 1-figure supplement 2). In one of our previous studies where the enhancement was first observed (Yasmin et al. 2023 Neuropsychologia), non-overlapping data were used because the stories were longer. This makes any meaningful impact of the overlap very unlikely. Critically, speechclarity levels were randomized and all analyses were conducted in the same way for all conditions, thus not confounding any of the results/conclusions. The methods section was extended to further explain the choice of overlapping data snippets.

      “Overlapping snippets in the training data were used to increase the amount of data in the training given the short duration of the stories. Speech-clarity levels were randomized across stories and all analyses were conducted similarly for all conditions. Hence, no impact of overlapping training data on the results is expected (consistent with noise-related enhancements observed previously when longer stories and non-overlapping data were used; Yasmin et al., 2023). Analyses using crosscorrelation, for which data snippets are treated independently, show similar results compared to those reported here using TRFs (Figure 1-figure supplement 2).”

      Results Experiment 3: page 17, line 417: no di erences were found between clear speech and masked speech - is this a power issue (as it does look di erent in the figure, Figure 4b)?

      I thank the editor for pointing this out. Indeed, I made a minor mistake. Two comparisons were significant after FDR-thresholding. This is now included in the revised Figure 4. I also made sure the mistake was not present for other analyses; which it was not.

    1. Author response:

      The following is the authors’ response to the previous reviews.

      Reviewer #1 (Public review):

      This paper examines the role of MLCK (myosin light chain kinase) and MLCP (myosin light chain phosphatase) in axon regeneration. Using loss-of-function approaches based on small molecule inhibitors and siRNA knockdown, the authors explore axon regeneration in cell culture and in animal models from central and peripheral nervous systems. Their evidence shows that MLCK activity facilitates axon extension/regeneration, while MLCP prevents it.

      Major concerns:

      (1) In the title, authors indicate that the observed effects from loss-of-function of MLCK/MLCP take place via F-actin redistribution in the growth cone. However, there are no experiments showing a causal effect between changes in axon growth mediated by MLCK/MLCP and F-actin redistribution.

      Thank you for your comments. We revised the title of our manuscript to “MLCK/MLCP regulates mammalian axon regeneration and redistributes the growth cone F-actin”. (line 3)

      (2) The author combines MLCK inhibitors with Bleb (Figure 6), trying to verify if both pairs of inhibitors act on the same target/pathway. MLCK may regulate axon growth independent of NMII activity. However, this has very important implications for the understanding not only on how NMII works and affects axon extension, but also in trying to understand what MLCP is doing. One wonders if MLCP actions, which are opposite of MLCK, also independent of NMII activity? The authors, in the discussion section, try to find an explanation for this finding, but I consider it fails since the whole rationale of the manuscript is still around how MLCK and MLCP affect NMII phosphorylation.

      Thank you for your comments. Although both MLCK and MLCP regulate the activity of NMII, it has been reported that they also govern domain-specific spatial control of actin-based motility in the growth cone. Specifically, MLCK activity is essential for arc translocation and retrograde flow within the P domain, while MLCP appears to specifically modulate arc movement and associated myosin II contractility in the T zone and C domain (Ref). Therefore, it is proposed that the regulatory mechanisms of MLCK and MLCP are highly complex during the process of axon growth. 

      [Ref]:Xiao-Feng Zhang, Andrew W Schaefer, Dylan T Burnette, Vincent T Schoonderwoert, Paul Forscher. Rho-dependent contractile responses in the neuronal growth cone are independent of classical peripheral retrograde actin flow. Neuron. 2003 Dec 4;40(5):931-44.

      What follows is a discussion of the merits and limitations of different claims of the manuscript in light of the evidence presented.

      (1) Using western blot and immunohistochemical analyses, authors first show that MLCK expression is increased in DRG sensory neurons following peripheral axotomy, concomitant to an increase in MLC phosphorylation, suggesting a causal effect (Figure 1). The authors claim that it is common that axon growth-promoting genes are upregulated. It would have been interesting at this point to study in this scenario the regulation of MLCP.

      We thank Reviewer for the positive comment on our manuscript.

      (2) Using DRG cultures and sciatic nerve crush in the context of MLCK inhibition (ML-7) and down-regulation, authors conclude that MLCK activity is required for mammalian peripheral axon regeneration both in vitro and in vivo (Figure 2). In parallel, the authors show that these treatments affect as expected the phosphorylation levels of MLC.

      The in vitro evidence is of standard methods and convincing. However, here, as well as in all other experiments using siRNAs, no Control siRNAs were used. Authors do show that the target protein is downregulated, and they can follow transfected cells with GFP. Still, it should be noted that the standard control for these experiments has not been done.

      Thank you for your comments. We utilized scrambled siRNA as a control. I sincerely apologize for the oversight in the manuscript; although we mentioned that scrambled siRNA was used as a control in the figure legends, we failed to clearly articulate this important information in the methods section. We have revised the manuscript accordingly. (line 87, line 549, line, line 562, line 568).

      (3) The authors then examined the role of the phosphatase MLCP in axon growth during regeneration. The authors first use a known MLCP blocker, phorbol 12,13-dibutyrate (PDBu), to show that is able to increase the levels of p-MLC, with a concomitant increase in the extent of axon regrowth of DRG neurons, both in permissive as well as non-permissive substrates. The authors repeat the experiments using the knockdown of MYPT1, a key component of the MLC-phosphatase, and again can observe a growth-promoting effect (Figure 3).

      The authors further show evidence for the growth-enhancing effect in vivo, in nerve crush experiments. The evidence in vivo deserves more evidence and experimental details (see comment 2). A key weakness of the data was mentioned previously: no control siARN was used.

      Thank you for your comments. As mentioned above, we used scramble siRNA as control in vivo experiment as well.

      (4) In the next set of experiments (presented in Figure 4) authors extend the previous observations in primary cultures from the CNS. For that, they use cortical and hippocampal cultures, and pharmacological and genetic loss-of-function using the above-mentioned strategies. The expected results were obtained in both CNS neurons: inhibition or knockdown of the kinase decreases axon growth, whereas inhibition or knockdown of the phosphatase increases growth. A main weakness in this set is that drugs were used from the beginning of the experiment, and hence, they would also affect axon specification. As pointed in Materials and Method (lines 143-145) authors counted as "axons" neurites longer than twice the diameter of the cell soma, and hence would not affect the variable measured. In any case, to be sure one is only affecting axon extension in these cells, the drugs should have been used after axon specification and maturation, which occurs at least after 5 DIV.

      Thank you for your comments. We acknowledge that the early administration of drugs can lead to unintended effects on neuronal polarization and axon formation. However, in line with our previous publication, we focused exclusively on measuring the longest length of the axon. To quantify axon length, we selected neurons exhibiting an axonal process exceeding twice the diameter of their cell body and measured the longest axon from 100 neurons for each condition (Ref 1, Ref 2). Consequently, we believe that drug administration at the onset of cell culture influences axon formation; however, it does not significantly affect the drug's impact on axon length.

      [Ref 1]: Chang-Mei Liu, Rui-Ying Wang, Saijilafu, Zhong-Xian Jiao, Bo-Yin Zhang, Feng-Quan Zhou. MicroRNA-138 and SIRT1 form a mutual negative feedback loop to regulate mammalian axon regeneration. Genes Dev. 2013 Jul 1;27(13):1473-83.

      [Ref 2]: Eun-Mi Hur, Saijilafu, Byoung Dae Lee, Seong-Jin Kim, Wen-Lin Xu, Feng-Quan Zhou. GSK3 controls axon growth via CLASP-mediated regulation of growth cone microtubules. Genes Dev. 2011 Sep 15;25(18):1968-81.

      (5) In Figure 7, the authors a local cytoskeletal action of the drug, but the evidence provided does not differentiate between a localized action of the drugs and a localized cell activity.

      We appreciate the reviewer’s insightful comments and have revised our title to “MLCK/MLCP Regulates mammalian axon regeneration and redistributes growth cone F-actin.” Furthermore, we have made corresponding revisions to the manuscript (line31, line 73).

      References:

      (1) Eun-Mi Hur 1, In Hong Yang, Deok-Ho Kim, Justin Byun, Saijilafu, Wen-Lin Xu, Philip R Nicovich, Raymond Cheong, Andre Levchenko, Nitish Thakor, Feng-Quan Zhou. 2011. Engineering neuronal growth cones to promote axon regeneration over inhibitory molecules. Proc Natl Acad Sci U S A. 2011 Mar 22;108(12):5057-62. doi: 10.1073/pnas.1011258108.

      (2) Garrido-Casado M, Asensio-Juárez G, Talayero VC, Vicente-Manzanares M. 2024. Engines of change: Nonmuscle myosin II in mechanobiology. Curr Opin Cell Biol. 2024 Apr;87:102344. doi: 10.1016/j.ceb.2024.102344.

      (3) Karen A Newell-Litwa 1, Rick Horwitz 2, Marcelo L Lamers. 2015. Non-muscle myosin II in disease: mechanisms and therapeutic opportunities. Dis Model Mech. 2015 Dec;8(12):1495-515. doi: 10.1242/dmm.022103.

      Reviewer #2 (Public review):

      Summary:

      Saijilafu et al. demonstrate that MLCK/MLCP proteins promote axonal regeneration in both the central nervous system (CNS) and peripheral nervous system (PNS) using primary cultures of adult DRG neurons, hippocampal and cortical neurons, as well as in vivo experiments involving sciatic nerve injury, spinal cord injury, and optic nerve crush. The authors show that axon regrowth is possible across different contexts through genetic and pharmacological manipulation of these proteins. Additionally, they propose that MLCK/MLCP may regulate F-actin reorganization in the growth cone, which is significant as it suggests a novel strategy for promoting axonal regeneration.

      Strengths:

      This manuscript presents a wide range of experimental models to address its hypothesis and biological question. Notably, the use of multiple in vivo models significantly enhances the overall validity of the study.

      We thank Reviewer for the positive comment on our manuscript.

      Weaknesses:

      - The authors previously published that blocking myosin II activity stimulates axonal growth and that MLCK activates myosin II. The present work shows that inhibiting MLCK blocks axonal regeneration while blocking MLCP (the protein that dephosphorylates myosin II) produces the opposite effect. Although this contradiction is discussed, no new evidence has been added to the manuscript to clarify this mechanism or address the remaining questions. Critical unresolved questions include: what happens to myosin II expression when both MLCK and MLCP are inhibited? If MLCK/MLCP are acting through an independent mechanism, what would that mechanism be?

      - In the discussion, the authors mention the existence of two myosin II isoforms with opposing effects on axonal growth. Still, there is no evidence in the manuscript to support this point.

      - It is also unclear how MLCK/MLCP acts on the actin cytoskeleton. The authors suggest that proteins such as ADF/cofilin, Arp 2/3, Eps8, Profilin, Myosin II, and Myosin V could regulate changes in F-actin dynamics. However, this study provides no experimental evidence to determine which proteins may be involved in the mechanism.

      Thank you for your comments. Axon growth is an exceptionally intricate process, facilitated by the coordinated regulation of gene expression in the soma, axonal transport along the shaft, and the assembly of cytoskeletal elements and membrane proteins at the growth cone. In this paper, our results primarily demonstrate that MLCK/MLCP plays a crucial role in regulating mammalian axon regeneration and redistributing F-actin within the growth cone; however, we did not investigate which specific proteins act downstream of MLCK/MLCP during axon regeneration.

      Recommendations for the authors:

      Reviewer #1 (Recommendations for the authors):

      - A title more suitable for the evidence shown can be: MLCK/MLCP regulates mammalian axon regeneration and redistributes the growth cone F-actin.

      Thank you for your comments. We revised the title of our manuscript to“MLCK/MLCP regulates mammalian axon regeneration and redistributes the growth cone F-actin” (line 3).

      -In figure 3, It would be useful to indicate in the figure legend, that the red arrow is pointing to a suture that was performed during surgery to mark clearly the injury site.

      Thank you for your comments. We revised Figure 3 legend that indicates the red arrow is pointing to a suture that was performed during surgery to mark clearly the injury site (line 571-572).

      - The following is a concern raised in the previous round, and that the response by the authors was so complete and accurate that I consider it would be useful to include it in the discussion section.

      Thank you for your comments. We included those contents in the discussion section of our revised manuscript (line 348-354, line 355-359).

      The author combines MLCK inhibitors with Bleb (Figure 6), trying to verify if both pairs of inhibitors act on the same target/pathway. The rationale is wrong for at least two reasons.

      a- Because both lines of evidence point to contrasting actions of NMII on axon growth, one approach could never "rescue" the other.

      Reply by authors in R1:If MLCK regulates axon growth through the activation of Myosin, the inhibitory effect of ML-7 (an MLCK inhibitor) on axon growth might be influenced by Bleb, a NMII inhibitor. However, our findings reveal that the combination of Bleb and ML-7 does not alter the rate of axon outgrowth compared to ML-7 alone. This suggests that the roles of ML-7 and Bleb in axon growth are independent. It means MLCK may regulate axon growth independent of NMII activity.

      b- Because the approaches target different steps on NMII activation, one could never "prevent" or rescue the other. For example, for Bleb to provide a phenotype, it should find any p-MLC, because it is only that form of MLC that is capable of inhibiting its ATPase site. In light of this, it is not surprising that Bleb is unable to exert any action in a situation where there is no p-MLC (ML-7, which by inhibiting the kinase drives the levels of p-MLC to zero, Figure 4A). Hence, the results are not possible to validate in the current general interpretation of the authors. (See 'major concern').

      Reply by authors in R1: The reported mechanism of blebbistatin is not through competition with the ATP binding site of myosin. Instead, it selectively binds to the ATPase intermediate state associated with ADP and inorganic phosphate, which decelerates the phosphate release. Importantly, blebbistatin does not impede myosin's interaction with actin or the ATP-triggered disassociation of actomyosin. It rather inhibits the myosin head when it forms a product complex with a reduced affinity for actin. This indicates that blebbistatin functions by stabilizing a particular myosin intermediate state that is independent of the phosphorylation status of myosin light chain (MLC).

      [Ref] Kovács M, Tóth J et al. Mechanism of blebbistatin inhibition of myosin II. J Biol Chem. 2004 Aug 20;279(34):35557-63.

    1. Author response:

      The following is the authors’ response to the original reviews.

      Public Reviews:

      Reviewer #1 (Public review):

      Summary:

      Liu et al., present an immersion objective adapter design called RIM-Deep, which can be utilized for enhancing axial resolution and reducing spherical aberrations during inverted confocal microscopy of thick cleared tissue.

      Strengths:

      RI mismatches present a significant challenge to deep tissue imaging, and developing a robust immersion method is valuable in preventing losses in resolution. Liu et al., present data showing that RIM-Deep is suitable for tissue cleared with two different clearing techniques, demonstrating the adaptability and versatility of the approach.

      Greetings, we greatly appreciate your feedback. In truth, we have utilized three distinct clearing techniques, including iDISCO, CUBIC, and MACS, to substantiate the adaptability and multifunctionality of the RIM-Deep adapter.

      Weaknesses:

      Liu et al., claim to have developed a useful technique for deep tissue imaging, but in its current form, the paper does not provide sufficient evidence that their technique performs better than existing ones.

      We are in complete agreement with your recommendation, and the additional experiments will conduct a thorough comparison of the efficacy between the RIM-deep adapter and the official adapter in the context of fluorescence bead experiments, along with their performance in cubic and MASC tissue clearing techniques.

      Reviewer #1 (Recommendations for the authors):

      Suggestions for improvement:

      Major revisions:

      (1) For the bead experiment, the comparison was made to a 10X dry objective instead of an immersion objective, please make a comparison to the standard immersion objective.

      Thank you for your suggestion. We fully agree with your suggestion to make a comparison with the standard immersion objective. We plan to conduct this comparison in future experiments and will thoroughly analyze the imaging differences between the official adapter and the RIM-deep adapter.

      (2) It is unclear if an accurate comparison of objectives (same NA etc) is being made in Fig 1G-J, since the official adapter image appears to be of lower resolution even at the surface. At the very least, progressive 2D slices of the reconstruction must be shown for both adapters instead of just the RIM-Deep adapter.

      Thank you for your suggestion. We strictly controlled the numerical aperture (NA) of the objectives in Fig 1G-J to ensure the accuracy of the comparison. However, the imaging resolution of the official adapter is consistent with that of the RIM-deep adapter. We agree that showing progressive 2D slices of the reconstruction would provide a more comprehensive comparison of the two adapters.

      (3) Similarly, since there already exists an official adapter, it would be useful to see that RIM-Deep performs better even in the mouse tissue, since the clearing method was different.

      Thank you for your suggestion. We will investigate the imaging performance of the two additional tissue clearing protocols using both the official adapter and the RIM-deep adapter.

      (4) The movies need legends, as it is unclear if they even show 2-D slices very deep into the tissue.

      Thank you for your suggestion. We will add figure legends to each movie.

      (5) The purpose of Supplementary Figure 3 in its current form is unclear, as is the statement in the text related to it : "The effectiveness and utility of this adapter configuration have been substantiated through a comprehensive series of experimental validations".

      Thank you for your suggestion. We will revise the statement to: "We validated the effectiveness and utility of this adapter configuration through a series of experiments."

      (6) The system is variably referred to as RIM-Deep or DepthView Enhancer in the text and figures, it would be beneficial to the readers if the authors stuck to one name.

      Thank you for your suggestion. We will choose RIM-Deep as the sole name.

      Minor revisions

      Figures

      (1) “Confocal" is incorrectly spelled as "confocol" in Figure 1, "media" is misspelled in multiple places.

      Thank you. We will correct these errors.

      (2) The camera is misplaced in the Figure 1 A drawing

      Thank you. We will fix this issue.

      (3) It would be useful to have actual pictures of the immersion objective setup (both RIM-Deep and the pre-existing adapter) since the diagrams are not very clear.

      Thank you. We will include actual pictures of both the RIM-Deep and the pre-existing adapter in the supplementary materials.

    1. Author response:

      The following is the authors’ response to the previous reviews.

      Public Reviews:

      Reviewer #1 (Public review):

      This study by Popli et al. evaluated the function of Atg14, an autophagy protein, in reproductive function using a conditional knockout mouse model. The authors showed that female mice lacking Atg14 were infertile partly due to defective embryo transport function of the oviduct and faulty uterine receptivity and decidualization using PgrCre/+;Atg14f/f mice. The findings from this work are exciting and novel. The authors demonstrated that a loss of Atg14 led to an excessive pyroptosis in the oviductal epithelial cells that compromises cellular integrity and structure, impeding the transport function of the oviduct. In addition, the authors use both genetic and pharmacological approaches to test the hypothesis. Therefore, the findings from this study are high-impact and likely reproducible. However, there are multiple major concerns that need to be addressed to improve the quality of the work.

      Thank you for the additional data that solidified the conclusion of this study. The authors addressed almost all of my previous concerns in this revised manuscript. However, some key points wording still need to be addressed.

      Comments on revisions:

      In Fig. 2A, please ensure that these are 5.0 dpc samples since implantation has already occurred at this point. However, the embryo appeared free-floating adjacent to the luminal epithelial cells (LE), even in control.

      We understand the reviewer’s concern. We have now replaced the previous H & E image with a clearer, higher-quality section that shows a fully attached embryo within a closed uterine lumen representing a typical implantation morphology at the D5 stage of pregnancy. (Revised Figure 2A)

      Fig. 3A-B: "Approximately 80-90% of blastocysts" contradicts the quantification in Figure 3C, which showed a percentage of blastocysts below 50%. Please clarify and correct as needed.

      In Fig. 3A-B, we mean to say approximately 80-90% embryos. We have now corrected the statement in the revised manuscript (Line no: 349-351).  

      The authors showed that Acetylated a-tubulin was present in the ampulla region of cKO (Fig. 4A). However, the revised manuscript still stated that (lines 397-399) ...there was a substantial loss of the ciliary epithelial cells (indicated by fewer a-tubulin and FOXJ1-positive cells) (Fig. 4B, left panel and Fig. S3)... So, the authors may want to tone down their conclusion regarding a "substantial loss" of ciliated epithelial cells if the quantification of ciliated cell number is not performed.

      We thank the reviewer for this suggestion. To avoid redundancy and ambiguity, we have revised the statement as below (Line no: 391-395):

      “As shown in Fig. 4A, normal ciliary structures were observed in the ampulla of both control and cKO oviducts. However, in the isthmus of cKO oviducts, we observed a reduction in both the FOXJ1- and PAX8-expressing cells (Fig. 4B, and Fig. S3).”

      Fig. 4C - the areas with red inset boxes labeled for isthmus are not really isthmus (in both control and cKO). The zoomed-in images (Fig. 4C - The far-right panel for both control and cKO, images are the transitional zone from the ampulla to the isthmus. The isthmus areas should have a thick muscle layer with almost no ciliated cells - see Fig. 4B cKO - those are true isthmus areas.

      We thank the reviewer for noting this. We have corrected the label accordingly. Since ciliary epithelial cells predominantly reside in the ampulla, we have included high-resolution images specifically for the ampulla regions.

      • Fig. 3A and 3C, it appears that the images were taken at different magnifications, but the scale bars are the same at 200 um. The authors, please double-check the scale bars.

      We thank the reviewer for noting this. We have double-checked all the figures to ensure the scale bars are correctly displayed and aligned with the resolution.

      • Fig. 6D - why polyphillin-treated samples did not sum to 100%? - please double-check.

      Since approximately 50% of the embryos were retained in the oviduct following polyphyllin treatment (Figure 6C, upper bar), the bar in Figure 6D represents this percentage (50% retained) rather than 100%.

      Reviewer #2 (Public review)

      In this manuscript, Popli et al investigated the roles of autophagy-related gene, Atg14, in the female reproductive tract (FRT) using conditional knockout mouse models. By ablation of Atg14 in both oviduct and uterus with PR-Cre (Atg14 cKO), authors discovered that such females are completely infertile. They went on to show that Atg14 cKO females have impaired embryo implantation as well as embryo transport from oviduct to uterus. Further analysis showed that Atg14 cKO leads to increased pyroptosis in oviduct, which disrupts oviduct epithelial integrity and leads to obstructive oviduct lumen and impaired embryo transport. The authors concluded that Atg14 is critical for maintaining the oviduct homeostasis and keeping the inflammation under check to enable proper embryo transport.

      The authors have barely addressed most of my concerns in this revised version with a few minor issues remaining to be addressed:

      (1) The authors tried to address my first concern regarding the statement that "autophagy is critical for maintaining the oviduct homeostasis". The revised statement in Lines 53-54 "we report that Atg14-dependent autophagy plays a crucial role in maintaining..." is still not correct. It should be corrected as " we report that autophagy-related protein Atg14 plays a crucial role in maintaining...".

      We thank the reviewer for this nice suggestion. We have now modified the statement as suggested (Line no: 54).

      (2) Line 349-351 described 80-90% of blastocysts retrieved from oviducts of cKO mice, which is in consistent with Figure 3B (showing more than 98%).

      We thank the reviewer for noting this. We have now corrected the statement as: “Unexpectedly, oviduct flushing from cKO mice resulted in the retrieval of approximately 90% of embryos, suggesting their potential entrapment within the oviducts, impeding their transit to the uterus”. (Line No: 349-351).

      (3) Line 447, "Fig. 5E" should be Fig. 6A. In addition, grammar error in the next sentence.

      We have corrected the figure number and addressed the grammatical error.

      (4) In Figure 6D, why the composition of blastocysts in chemical treated group do not add up to 100%.

      As explained in Reviewer 1 responses, the bar in Figure 6D represents the 50% retained embryos from Figure 6C upper bar the full count.

      Reviewer #3 (Public review):

      Summary:

      The manuscript by Pooja Popli and co-authors tested the importance of Atg14 in the female reproductive tract by conditionally deleting Atg14 use PrCre and also Foxj1cre. The authors showed that loss of Atg14 leads to infertility due to the retention of embryos within the oviduct. The authors further concluded that the retention of embryos within the oviduct is due to pyroptosis in oviduct cells leading to defective cellular integrity. The revised manuscript has included new experimental data (Figs. S2B, 5B, 5C, and S3) that satisfied the concerns of this reviewer. The manuscript should provide important advancement to the field.

      We sincerely thank the reviewer for the thoughtful evaluation of our manuscript and appreciate your constructive feedback.

    1. Author response:

      We appreciate the reviewers thoughtful consideration of our manuscript, and their recognition of the variety of experimental and computational approaches we have brought to bear in probing the very challenging question of uncoupled proton leak through EmrE.

      We did record SSME measurements with MeTPP+, a small molecule substrate at two different protein:lipid ratios. These experiments report the rate of net flux when both proton-coupled substrate antiport and substrate-gated proton leak are possible. We will add this data to the revision, including data acquired with different lipid:protein ratio that confirms we are detecting transport rather than binding. In brief, this data shows that the net flux is highly dependent on both proton concentration (pH) and drug-substrate concentration, as predicted by our mechanistic model. This demonstrates that both types of transport contribute to net flux when small molecule substrates are present.

      In the absence of drug-substrate, proton leak is the only possible transport pathway. The pyranine assay directly assesses proton leak under these conditions and unambiguously shows faster proton entry into proteoliposomes through the ∆107-EmrE mutant than through WT EmrE, with the rate of proton entry into ∆107-EmrE proteoliposomes matching the rate of proton entry achieved by the protonophore CCCP. We have revised the text to more clearly emphasize how this directly measures proton leak independently of any other type of transport activity. The SSME experiments with a proton gradient only (no small molecule substrate present) provide additional data on shorter timescales that is consistent with the pyranine data. The consistency of the data across multiple LPRs and comparison of transport to proton leak in the SSME assays  further strengthens the importance of the C-terminal tail in determining the rate of flux.

      None of the current structural models have good resolution (crystallography, EM) or sufficient restraints (NMR) to define the loop and tail conformations sufficiently for comparison with this work. We are in the process of refining an experimental structure of EmrE with better resolution of the loop and tail regions implicated in proton-entry and leak. Direct assessment of structural interactions via mutagenesis is complicated because of the antiparallel homodimer structure of EmrE. Any point mutation necessarily affects both subunits of the dimer, and mutations designed to probe the hydrophobic gate on the more open face of the transporter also have the potential to disrupt closure on the opposite face, particularly in the absence of sufficient resolution in the available structures. Thus, mutagenesis to test specific predicted structural features is deferred until our structure is complete so that we can appropriately interpret the results.

      In our simulation setup, the MD results can be considered representative and meaningful for two reasons. First, the C-terminal tail, not present in the prior structure and thus modeled by us, is only 4 residues long. We will show in the revision and detailed response that the system will lose memory of its previous conformation very quickly, such that velocity initialization alone is enough for a diverse starting point. Second, our simulation is more like simulated annealing, starting from a high free energy state to show that, given such random initialization, the tail conformation we get in the end is consistent with what we reported. It is also difficult to sample back-and-forth tail motion within a realistic MD timescale. Therefore, it can be unconclusive to causally infer the allosteric motions with unbiased MD of the wildtype alone. The best viable way is to look at the equilibrium statistics of the most stable states between WT- and ∆107-EmrE and compare the differences.

    1. Author response:

      The following is the authors’ response to the original reviews.

      eLife Assessment

      This descriptive manuscript builds on prior research showing that the elimination of Origin Recognition Complex (ORC) subunits does not halt DNA replication. The authors use various methods to genetically remove one or two ORC subunits from specific tissues and observe continued replication, though it may be incomplete. The replication appears to be primarily endoreduplication, indicating that ORC-independent replication may promote genome reduplication without mitosis. Despite similar findings in previous studies, the paper provides convincing genetic evidence in mice that liver cells can replicate and undergo endoreduplication even with severely depleted ORC levels. While the mechanism behind this ORC-independent replication remains unclear, the study lays the groundwork for future research to explore how cells compensate for the absence of ORC and to develop functional approaches to investigate this process. The reviewers agree that this valuable paper would be strengthened significantly if the authors could delve a bit deeper into the nature of replication initiation, potentially using an origin mapping experiment. Such an exciting contribution would help explain the nature of the proposed new type of Mcm loading, thereby increasing the impact of this study for the field at large.

      We appreciate the reviewers’ suggestion. Till now we know of only one paper that mapped origins of replication in regenerating mouse liver, and that was published two months back in Cell (PMID: 39293447).  We want to adopt this method, but we do not need it to answer the question asked.  We have mapped origins of replication in ORC-deleted cancer cell lines and compared to wild-type cells in Shibata et al., BioRXiv (PMID: 39554186) (it is under review).  We report the following:  Mapping of origins in cancer cell lines that are wild type or engineered to delete three of the subunits, ORC1, ORC2 or ORC5 shows that specific origins are still used and are mostly at the same sites in the genome as in wild type cells. Of the 30,197 origins in wild type cells (with ORC), only 2,466 (8%) are not used in any of the three ORC deleted cells and 18,319 (60%) are common between the four cell types. Despite the lack of ORC, excess MCM2-7 is still loaded at comparable rates in G1 phase to license reserve origins and is also repeatedly loaded in the same S phase to permit re-replication. 

      Citation: Specific origin selection and excess functional MCM2-7 loading in ORC-deficient cells. Yoshiyuki Shibata, Mihaela Peycheva, Etsuko Shibata, Daniel Malzl, Rushad Pavri, Anindya Dutta. bioRxiv 2024.10.30.621095; doi: https://doi.org/10.1101/2024.10.30.621095 (PMID: 39554186)

      We have now included this in the discussion.

      Public Reviews:

      Reviewer #1 (Public review):

      The origin recognition complex (ORC) is an essential loading factor for the replicative Mcm2-7 helicase complex. Despite ORC's critical role in DNA replication, there have been instances where the loss of specific ORC subunits has still seemingly supported DNA replication in cancer cells, endocycling hepatocytes, and Drosophila polyploid cells. Critically, all tested ORC subunits are essential for development and proliferation in normal cells. This presents a challenge, as conditional knockouts need to be generated, and a skeptic can always claim that there were limiting but sufficient ORC levels for helicase loading and replication in polyploid or transformed cells. That being said, the authors have consistently pushed the system to demonstrate replication in the absence or extreme depletion of ORC subunits.

      Here, the authors generate conditional ORC2 mutants to counter a potential argument with prior conditional ORC1 mutants that Cdc6 may substitute for ORC1 function based on homology. They also generate a double ORC1 and ORC2 mutant, which is still capable of DNA replication in polyploid hepatocytes. While this manuscript provides significantly more support for the ability of select cells to replicate in the absence or near absence of select ORC subunits, it does not shed light on a potential mechanism.

      The strengths of this manuscript are the mouse genetics and the generation of conditional alleles of ORC2 and the rigorous assessment of phenotypes resulting from limiting amounts of specific ORC subunits. It also builds on prior work with ORC1 to rule out Cdc6 complementing the loss of ORC1.

      The weakness is that it is a very hard task to resolve the fundamental question of how much ORC is enough for replication in cancer cells or hepatocytes. Clearly, there is a marked reduction in specific ORC subunits that is sufficient to impact replication during development and in fibroblasts, but the devil's advocate can always claim minimal levels of ORC remaining in these specialized cells.

      The significance of the work is that the authors keep improving their conditional alleles (and combining them), thus making it harder and harder (but not impossible) to invoke limiting but sufficient levels of ORC. This work lays the foundation for future functional screens to identify other factors that may modulate the response to the loss of ORC subunits.

      This work will be of interest to the DNA replication, polyploidy, and genome stability communities.

      Thank you.

      Reviewer #2 (Public review):

      This manuscript proposes that primary hepatocytes can replicate their DNA without the six-subunit ORC. This follows previous studies that examined mice that did not express ORC1 in the liver. In this study, the authors suppressed expression of ORC2 or ORC1 plus ORC2 in the liver.

      Comments:

      (1) I find the conclusion of the authors somewhat hard to accept. Biochemically, ORC without the ORC1 or ORC2 subunits cannot load the MCM helicase on DNA. The question arises whether the deletion in the ORC1 and ORC2 genes by Cre is not very tight, allowing some cells to replicate their DNA and allow the liver to develop, or whether the replication of DNA proceeds via non-canonical mechanisms, such as break-induced replication. The increase in the number of polyploid cells in the mice expressing Cre supports the first mechanism, because it is consistent with few cells retaining the capacity to replicate their DNA, at least for some time during development.

      In our study, we used EYFP as a marker for Cre recombinase activity. ~98% of the hepatocytes in tissue sections and cells in culture express EYFP, suggesting that the majority of hepatocytes successfully expressed the Cre protein to delete the ORC1 or ORC2 genes. To assess deletion efficiency, we employed sensitive genotyping and Western blotting techniques to confirm the deletion of ORC1 and ORC2 in hepatocytes isolated from Alb-Cre mice. Results in Fig. 2C and Fig. 6D demonstrate the near-complete absence of ORC2 and ORC1 proteins, respectively, in these hepatocytes.

      The mutant hepatocytes underwent at least 15–18 divisions during development. The inherited ORC1 or ORC2 protein present during the initial cell divisions, would be diluted to less than 1.5% of wild-type levels within six divisions, making it highly unlikely to support DNA replication, and yet we observe hepatocyte numbers that suggest there was robust cell division even after that point.

      Furthermore, the EdU incorporation data confirm DNA synthesis in the absence of ORC1 and ORC2. Specifically, immunofluorescence showed that both in vitro and in vivo, EYFP-positive hepatocytes (indicating successful ORC1 and ORC2 deletion) incorporated EdU, demonstrating that DNA synthesis can occur without ORC1 and ORC2.

      Finally, the Alb-ORC2f/f mice have 25-37.5% of the number of hepatocyte nuclei compared to WT mice (Table 2).  If that many cells had an undeleted ORC2 gene, that would have shown up in the genotyping PCR and in the Western blots.

      (2) Fig 1H shows that 5 days post infection, there is no visible expression of ORC2 in MEFs with the ORC2 flox allele. However, at 15 days post infection, some ORC2 is visible. The authors suggest that a small number of cells that retained expression of ORC2 were selected over the cells not expressing ORC2. Could a similar scenario also happen in vivo?

      This would not explain the significant incorporation of EdU in hepatocytes that are EYFP positive and do not have detectable ORC by Western blots.  Also note that for MEFs we are delivering the Cre by Adenovirus infection in vitro, so there is a finite probability that a cell will not receive the virus, the Cre and will not delete ORC2.  However, in vivo, the Alb-Cre will be expressed in every cell that turns on albumin.  There is no escaping the expression of Cre.

      (3) Figs 2E-G shows decreased body weight, decreased liver weight and decreased liver to body weight in mice with recombination of the ORC2 flox allele. This means that DNA replication is compromised in the ALB-ORC2f/f mice.

      It is possible that DNA replication is partially compromised or may slow down in the absence of ORC2. However, it is important to emphasize that livers with ORC2 deletion remain capable of DNA replication, so much so that liver function and life span are near normal. Therefore, some kind of DNA replication has to serve as a compensatory mechanism in the absence of ORC2 to maintain liver function and support regeneration.

      (4) Figs 2I-K do not report the number of hepatocytes, but the percent of hepatocytes with different nuclear sizes. I suspect that the number of hepatocytes is lower in the ALB-ORC2f/f mice than in the ORC2f/f mice. Can the authors report the actual numbers?

      We show in Table 2 that the Alb-Orc2f/f mice have about 25-37.5% of the hepatocytes compared to the WT mice.

      (5) Figs 3B-G do not report the number of nuclei, but percentages, which are plotted separately for the ORC2-f/f and ALB-ORC2-f/f mice. Can the authors report the actual numbers?

      In all the FACS experiments in Fig. 3B-G we collect data for a total of 10,000 nuclei (or cells).  For Fig. 3E-G we divide the 10,000 nuclei into the bottom 40% on the EYFP axis (EYFP low, which is mostly EYFP negative) as the control group, and EYFP high (top 20% on the EYFP axis) test group.  We have described this in the Methods in the revision and labeled EYFP negative and positive as EYFP low and high in the Figures and Figure legends.

      (6) Fig 5 shows the response of ORC2f/f and ALB-ORC2f/f mice after partial hepatectomy. The percent of EdU+ nuclei in the ORC2-f/f (aka ALB-CRE-/-) mice in Fig 5H seems low. Based on other publications in the field it should be about 20-30%. Why is it so low here? The very low nuclear density in the ALB-ORC2-f/f mice (Fig 5F) and the large nuclei (Fig 5I) could indicate that cells fire too few origins, proceed through S phase very slowly and fail to divide.

      The percentage of EdU+ nuclei in the ORC2f/f without Alb-Cre mice is 8%, while in PMID 10623657 ~10% of wild type nuclei incorporate  EdU at 42 hr post partial hepatectomy (mid-point between the 36-48 hr post hepatectomy that was used in our study).  The important result here is that in the ORC2f/f mice with Alb-Cre (+/-) we are seeing significant EdU incorporation. We have also corrected the X-axis labels in 5F, 5I, 7E and 7F to reflect that those measurements were not made at 36 hr post-resection but later (as was indicated in the schematic in Fig. 5A).

      (7) Fig 6F shows that ALB-ORC1f/f-ORC2f/f mice have very severe phenotypes in terms of body weight and liver weight (about on third of wild-type!!). Fig 6H and 6I, the actual numbers should be presented, not percentages. The fact that there are EYFP negative cells, implies that CRE was not expressed in all hepatocytes.

      The liver weight is very dependent on the body weight, and so we have to look at the liver to body weight ratio to determine if it is inordinately small, and the ratio is 70% of the WT.  In females the liver and body weight are low (although in proportion to each other), which maybe is what the reviewer is talking about.  However, the fact that liver weight and body weight are not as low in males, suggest that this is a gender (hormone?) specific effect and not a DNA replication defect.  We had discussed this possibility.  We have another paper also in BioRXiv (Su et al. doi.org/10.1101/2024.12.18.629220) that suggests that ORC subunits have significant effect on gene expression, so it is possible that that is what leads to this sexual dimorphism in phenotype.  We have now added this to the discussion.

      The bottom 40% of nuclei on the EYFP axis in the FACS profiles (what was labeled EYFP negative but will now be called EYFP low) contains mostly non-hepatocytes that are genuinely EYFP negative.   Non-hepatocytes (bile duct cells, endothelial cells, Kupffer cells, blood cells) are a significant part of cells in the dissociated liver (as can be seen in the single cell sequencing results in PMID: 32690901).  Their presence does not mean that hepatocytes are not expressing Cre.  Hepatocytes are nearly 100% EYFP positive, as can be seen in the tissue sections (where the hepatocytes take up most of visual field) and in cells in culture.  Also if there are EYFP negative hepatocyte nuclei in the FACS, that still does not rule out EYFP presence in the cytoplasm.  The important point from the FACS is that the EYFP high nuclei (which have expressed Cre for the longest period) are polyploid relative to the EYFP low nuclei.

      (8) Comparing the EdU+ cells in Fig 7G versus 5G shows very different number of EdU+ cells in the control animals. This means that one of these images is not representative. The higher fraction of EdU+ cells in the double-knockout could mean that the hepatocytes in the double-knockout take longer to complete DNA replication than the control hepatocytes. The control hepatocytes may have already completed DNA replication, which can explain why the fraction of EdU+ cells is so low in the controls. The authors may need to study mice at earlier time points after partial hepatectomy, i.e. sacrifice the mice at 30-32 hours, instead of 40-52 hours.

      The apparent difference that the reviewer comments on stems from differences in nuclear density in the images in Fig. 7G and 5G (also quantitated in Fig. 7F and 5F).  The quantitation in Fig. 7H and 5H show that the % of EdU plus cells are comparable (5-8%). 

      (9) Regarding the calculation of the number of cell divisions during development: the authors assume that all the hepatocytes in the adult liver are derived from hepatoblasts that express Alb. Is it possible to exclude the possibility that pre-hepatoblast cells that do not express Alb give rise to hepatocytes? For example the cells that give rise to hepatoblasts may proliferate more times than normal giving rise to a higher number of hepatoblasts than in wild-type mice.

      Single cell sequencing of mouse liver at e11 shows hepatoblasts expressing hepatocyte specific markers (PMID: 32690901).  All the cells annotated from the single-cell seq analysis are differentiated cells arguing against the possibility that undifferentiated endodermal cells (what the reviewer probably means by pre-hepatoblasts) exist at e11.  We have added this citation to the paper.

      Here is a review that says the hepatoblasts expressing Albumin are present before e13.  (https://www.ncbi.nlm.nih.gov/books/NBK27068/) says: “The differentiation of bi-potential hepatoblasts into hepatocytes or BECs begins around e13 of mouse development. Initially hepatoblasts express genes associated with both adult hepatocytes (Hnf4α, Albumin) ...”  Thus, we can be certain that hepatoblasts before e13 express albumin.  Our calculation of number of cell divisions in Table 2 begins from e12.

      The reviewer may be suggesting that ORC deletion leads to the immediate demise of hepatoblasts (despite having inherited ORC protein from the endodermal cells) causing undifferentiated endodermal cells to persist and proliferate much longer than in normal development.  We consider it unlikely, but if true it will be very unexpected, both by suggesting that deletion of ORC immediately leads to the death of the hepatoblasts (despite a healthy reserve of inherited ORC protein) and by suggesting that there is a novel feedback mechanism from the death/depletion of hepatoblasts leading to the persistence and proliferation of undifferentiated endodermal cells. We have added the reviewer’s suggestion to the discussion.

      (10) My interpretation of the data is that not all hepatocytes have the ORC1 and ORC2 genes deleted (eg EYFP-negative cells) and that these cells allow some proliferation in the livers of these mice.

      Please see the reply in question #1.  Particularly relevant: “Finally, the Alb-ORC2f/f mice have 25-37.5% of the number of hepatocyte nuclei compared to WT mice (Table 2).  If that many cells had an undeleted ORC2 gene, that would have shown up in the genotyping PCR and in the Western blots.

      Reviewer #3 (Public review):

      Summary:

      The authors address the role of ORC in DNA replication and that this protein complex is not essential for DNA replication in hepatocytes. They provide evidence that ORC subunit levels are substantially reduced in cells that have been induced to delete multiple exons of the corresponding ORC gene(s) in hepatocytes. They evaluate replication both in purified isolated hepatocytes and in mice after hepatectomy. In both cases, there is clear evidence that DNA replication does not decrease at a level that corresponds with the decrease in detectable ORC subunit and that endoreduplication is the primary type of replication observed. It remains possible that small amounts of residual ORC are responsible for the replication observed, although the authors provide arguments against this possibility. The mechanisms responsible for DNA replication in the absence of ORC are not examined.

      Strengths:

      The authors clearly show that there are dramatic reductions in the amount of the targeted ORC subunits in the cells that have been targeted for deletion. They also provide clear evidence that there is replication in a subset of these cells and that it is likely due to endoreduplication. Although there is no replication in MEFs derived from cells with the deletion, there is clearly DNA replication occurring in hepatocytes (both isolated in culture and in the context of the liver). Interestingly, the cells undergoing replication exhibit enlarged cell sizes and elevated ploidy indicating endoreduplication of the genome. These findings raise the interesting possibility that endoreduplication does not require ORC while normal replication does.

      Weaknesses:

      There are two significant weaknesses in this manuscript. The first is that although there is clearly robust reduction of the targeted ORC subunit, the authors cannot confirm that it is deleted in all cells. For example, the analysis in Fig. 4B would suggest that a substantial number of cells have not lost the targeted region of ORC2. Although the western blots show stronger effects, this type of analysis is notorious for non-linear response curves and no standards are provided. The second weakness is that there is no evaluation of the molecular nature of the replication observed. Are there changes in the amount of location of Mcm2-7 loading that is usually mediated by ORC? Does an associated change in Mcm2-7 loading lead to the endoreduplication observed? After numerous papers from this lab and others claiming that ORC is not required for eukaryotic DNA replication in a subset of cells, we still have no information about an alternative pathway that could explain this observation.

      We do not see a significant deficit in MCM2-7 loading (amount and rate) in cancer cell lines where we have deleted ORC1, ORC2 or ORC5 genes separately in Shibata et al. bioRxiv 2024.10.30.621095; doi: https://doi.org/10.1101/2024.10.30.621095 (PMID: 39554186).  This is now cited in the discussion.

      The authors frequently use the presence of a Cre-dependent eYFP expression as evidence that the ORC1 or ORC2 genes have been deleted. Although likely the best visual marker for this, it is not demonstrated that the presence of eYFP ensures that ORC2 has been targeted by Cre. For example, based on the data in Fig. 4B, there seems to be a substantial percentage of ORC2 genes that have not been targeted while the authors report that 100% of the cells express eYFP.

      (1) The PCR reactions in Fig. 4B are still contaminated by DNA from non-hepatocyte cells:  bile duct cells, endothelial, Kupfer cells and blood cells.  Microscopy of  cultured cells idnetifies the hepatocytes unequivocally from their morphology. <2% of the hepatocyte cells in culture in Fig. 4C are EYFP-.

      Recommendations for the authors:

      Reviewer #2 (Recommendations for the authors):

      The authors should present the data as suggested in the review and reformulate their conclusions. If possible, mice should be examined 30-32 hours after partial hepatectomy.

      Based on the Literature we chose a time that is consistent with the previous paper from us (Uchida et al., Genes & Dev).

      Reviewer #3 (Recommendations for the authors):

      (1) It would improve the paper to use single-cell methods (e.g. FISH) to assess the deletion of ORC subunits in the targeted cells.

      This is something we will reserve for future studies.

      (2) The importance of the paper would be increased dramatically by showing that the elimination of ORC changed the location of Mcm2-7 loading. This would be highly likely if the authors hypothesis that ORC is not involved is true. On the other hand, given ORC's role in origin selection, an observation that the same sites are used but less frequently would support a hypothesis that residual intact ORC is responsible for the replication observed.

      Shibata et al (PMID: 39554186) has answered this question.  The loss of ORC does not change the locations of origins or even the ability to specify origins.  We argue that this is what is to be expected from our hypothesis, that although ORC is clearly important for MCM loading in yeast and in biochemical experiments, something unexpected is going on in human cells.  Either a vanishingly small amount of ORC (undetectable by commonly used methods) can load the full complement of MCM2-7 at a rate that is comparable to wild type cells, or there is an ORC-independent mechanism of MCM2-7 loading.   This is now added to the discussion.

    1. Author response:

      The following is the authors’ response to the previous reviews.

      Reviewer 1:

      Comments on revisions:

      This manuscript is in some ways improved - mainly by toning down the conclusions - but a few major weaknesses have not been addressed. I do not agree that it is not justified to perform experiments to investigate the sterility of single CDK8 knockout mice since this could be important and given that the new data show that while there is some overlap in expression of the two prologues, there are also significant differences in the testis. At the least, it would have been interesting and easy to do to show the expression of CDK8 and CDK19 in the single cell transcriptomics, since this might help to identify the different populations.

      Certainly, we tried to analyse Cdk8/Cdk19 in single cell transcriptomics. However, we were unable to draw a clear conclusion. Due to a limited sensitivity of single cell sequencing, especially for low abundant transcripts, such as transcription factors (for 10x technology used in our study) (Chuang et al., 2024), it is challenging to establish with certainty CDK8/19 positive and -negative tissues from single cell data because both transcripts are minor. Nevertheless, the majority of cell types showed some expression of CDK8/19, with maximum expression in pachytene/diplotene spermatocytes. We do not include these data to the manuscript particularly as we were successful to assess Cdk8/19 expression patterns using IF approaches.

      Author response image 1.

      The only definitive way of concluding a kinase-independent phenotype is to rescue with a kinase dead mutant. While I agree that the inhibitors have been well validated, since they did not have any effects, it is hard to be sure that they actually reached their targets in the tissue concerned. This could have been done by cell thermal shift assay. In the absence of any data on this, the conclusion of a kinase-independent effect is weak.

      We totally agree with this point, but it takes several years to produce mice with inducible expression of KD CDK8 mice on the DKO background. These experiments are already underway in our lab, however, their results will be published in our future works.

      Figure 2 legend includes (G) between (B) and (C), and appears to, in fact, refer to Fig 1E, for which the legend is missing the description.

      Thank you, we corrected this.

      Finally, Figure S1C appears wrong. Goblet cells are not in the crypt but on the villi (so the graph axis label is wrong), and there are normally between 5 and 15 per villus, so the iDKO figure is normal, but there are a surprisingly high number of goblet cells in the controls. And normally there are 10-15 Paneth cells/crypt, so it looks like these have been underestimated everywhere. I wonder how the counting was done - if it is from images such as those shown here then I am not surprised as the quality is insufficient for quantification. How many crypts and villi were counted? Given the difficulty in counting and the variability per crypt/villus, with quantitative differences like this it is important to do quantifications blind. I personally wouldn't conclude anything from this data and I would recommend to either improve it or not include it. If these data are shown, then data showing efficient double knockout in this tissue should also accompany it, by IF, Western or PCR. Otherwise, given a potentially strong phenotype, repopulation of the intestine by unrecombined crypts might have occurred - this is quite common (see Ganuza et al, EMBO J. 2012).

      We added fig. S1C with Western blot showing presence of CDK8 and CCNC in WT intestine and  their absence in the DKO intestine. We also corrected that the part of the intestine analyzed was the duodenum, not ileum. We also replaced intestine sections photos with the ones of better quality and higher magnification (200X) and corrected Y axis legend. We apologize for the confusion, and thank the reviewer for careful analysis of our data, which allowed us to make this correction. The numbers of cells were counted on 600x magnification, and the magnification given in the article is for presentation purposes only. Our number of goblet cells was indeed calculated per villus, not crypt, and the resulting number is similar to ones reported in Dannapel et al (Dannappel et al., 2022). As for Paneth cells their numbers correspond to several articles that use the c57bl6 strain (Brischetto et al., 2021; King et al., 2013), as the number of Paneth cells differs between different part of the intestine and different mouse strains (Nakamura et al., 2020). 

      Reviewer 2:

      This reviewer appreciated the authors' effort in improving the quality of this manuscript during their revision. While some concerns remain, the revision is a much improved work and the authors addressed most of my major concerns.

      Figure 2E CDK8 and CDK19 immunofluorescent staining images seem to show CDK8 and CDK19 location are completely distinct and in different cells, the authors need to elaborate on this results and discuss what such a distinct location means in line of their double knockout data.

      We thank the reviewer for this suggestion. We had expanded the discussion in the lines 518 and 529 and included a better quality picture of the 200x magnification. Our main line of reasoning is that despite distinct expression in different cell types, high magnification show a certain level of expression of both proteins in most cells, so single knockouts will not demonstrate more than a slight phenotype, while the full knockout will have the full effect. This is especially true if our hypothesis that CCNC stabilization is important here, as both kinases can stabilize the protein.

      Minor comments:

      Supplemental figure 1(C) legend typo : (C) Periodic acid-Schiff stained sections of ilea of tamoxifen treated R26/Cre/ERT2 and DKO mice.

      Thank you, we corrected this.

      While the effort to identify and generate new antibodies is appreciated, the specificity of the antibodies used should be examined and presented if available.

      The specificity of the antibodies for the western blot is confirmed in figure S1F. We added fig. S1G with IF staining of CDK19 KO testes proving our CDK19 antibody specificity.

      References:

      Brischetto C., Krieger K., Klotz C., et.al. 2021. NF-κB determines Paneth versus goblet cell fate decision in the small intestine. Development 148. doi:10.1242/dev.199683

      Chuang H.-C., Li R., Huang H., et.al. 2024. Single-cell sequencing of full-length transcripts and T-cell receptors with automated high-throughput Smart-seq3. BMC Genomics 25:1127. doi:10.1186/s12864-024-11036-0

      Dannappel M.V., Zhu D., Sun X., et.al. 2022. CDK8 and CDK19 regulate intestinal differentiation and homeostasis via the chromatin remodeling complex SWI/SNF. J Clin Invest 132. doi:10.1172/JCI158593

      King S.L., Mohiuddin J.J., Dekaney C.M.. 2013. Paneth cells expand from newly created and preexisting cells during repair after doxorubicin-induced damage. Am J Physiol Gastrointest Liver Physiol 305:G151–62. doi:10.1152/ajpgi.00441.2012

      Nakamura K., Yokoi Y., Fukaya R., et.al. 2020. Expression and localization of Paneth cells and their α-defensins in the small intestine of adult mouse. Front Immunol 11:570296. doi:10.3389/fimmu.2020.570296

    1. Author response:

      The following is the authors’ response to the original reviews.

      Reviewer #1 (Recommendations For The Authors):

      Although the scripts are available at the github link that is shown, the Readme file is not available as a text file. Spreadsheets summarizing the RNA-seq data ought to be available for download, but these are not present. Likewise, are spreadsheets available for the data used to generate the plots in Fig. 10, so that the identities of particular, correlated genes can be viewed?

      We have now included the excel sheet with all the DEGs shown in Figure 8-9 (Figure 8 – Source data 1-8). The source data include DEGs that are up- and down-regulated in gWAT, iWAT, liver, and skeletal muscle. The source data files (excel) are the standard output format. We have also updated the github (https://github.com/Leandromvelez/CTRP10-Manuscript-DEG-Sex-specific-connectivities-and-integration) to include a README file and updated the R scripts to annotate steps and processing considerations.  In addition, the README file now contains drive links to the files used the unfiltered kallisto TPM and counts at the transcript-level, as well as resulting Differential Expression results based on genotype.  Obviously, all criteria from aligned transcripts such as gene filtering and normalization are included in the scripts provided.

      Several items would strengthen the work:

      (1) Is a CTRP10 antibody available, and does the protein abundance correlate with the mRNA abundances that were assessed in Fig. 1?

      Unfortunately, no validated antibody currently exists for CTRP10. Consequently, we were not able to assess protein abundance of CTRP10 in our study.

      (2) Were there compensatory changes in the abundance of other CTRP family members? This might be observed at the protein, but not mRNA, level. It might be reasonable to test for the effects of liver, gWAT, skeletal muscle, and iWAT.

      We observed no compensatory changes in other CTRP family members based on our RNA-seq data. Unfortunately, we do not have protein data for other CTRP family members.

      (3) The gene expression changes shown in Fig. 9 are ranked according to z-score, but it is not clear how this is calculated. It would be helpful to indicate the log2 change in each case.

      The z-score is a very commonly used method to show DEGs in studies involving RNA-seq data. We calculate the z-score based on the gene transcript source data (Fig. 8 – Source data 1-8). Z-score is defined as z = (x-μ)/σ, where x is the raw score (gene transcript level), μ is the population mean (mean of gene expression across both WT and KO samples), and σ is the population standard deviation. In essence, the z-score is the raw score minus the population mean, divided by the population standard deviation. We now included this information in Fig. 9 legend.

      (4) In Fig. 6, female HFD-fed KO mice had increased glucose (and insulin) after an overnight fast, but increased glucose was not observed in the GTT data. Possibly, this is because the mice were fasted for only 6h for the GTT. This might be mentioned during the description of these data, on lines 221-224. However, this also raises the question of whether there is a difference in the rate of gluconeogenesis (or possibly glycogenolysis for the 6h data) in the KO compared to the controls. Understanding this would require the use of tracers, and is reasonably beyond the scope of this study, but might be mentioned in the discussion.

      Per reviewer’s suggestion, we have included this in the “limitation section” of the discussion.

      Reduced RER in the HFD-fed female mice might begin to suggest a mechanism since this suggests the mice might have decreased oxidation of carbohydrates and increased oxidation of fat compared to control animals. A glucose tracer might be used to test whether more glucose is stored and, if so, in what tissue this occurs. Possibly, this could be done ex vivo on isolated tissues or cells. Again, this is reasonably beyond the scope of the present study.

      Per reviewer’s suggestion, we have included this in the “limitation section” of the discussion.

      (5) The discussion includes a brief discussion of the role of estrogen and suggests that in CTRP10 KO mice there are differences in other factors that would be needed to explain the phenotype. Although it is agreed that this is likely the case, estrogen levels were not measured in the present study. It seems like this would be important to study, and might shed light on the female-specific phenotype.

      We have now included serum estrogen data. No significant differences in estrogen levels were seen between WT and KO female mice fed either a low-fat diet (Fig. 4 – figure supplement 1) or a high-fat diet (Fig. 5 – figure supplement 2).

      Reviewer #2 (Recommendations For The Authors):

      While the concept is potentially exciting, there are major problems with the current manuscript. It lacks the mechanistic details behind MHO.

      (1) There is a significant gap that was not addressed by the authors. How exactly does CTRP10 lead to the activation of proteins like Fgf1, Fgf21, Il22ra1, Ucp3, and Klf15 in Ctrp10 knockout female mice? Is it likely that CTRP10 regulates these proteins via indirect mechanisms?

      We acknowledge that the lack of mechanistic understanding of how CTRP10 loss-of-function leads to changes in gene expression is a major limitation of the study. We have highlighted this limitation in the discussion section.

      • The author notes that Ctrp10 knockout female mice, particularly those on a high-fat diet lack Nr1d1 and can sustain a relatively healthy metabolic state. This is supported by the demonstrated upregulation of Fgf1, Fgf21, Il22ra1, Ucp3, and Klf15 in Ctrp10 knockout female mice. However, the mechanisms through which Ctrp10 knockout influences the expression of these molecules are not elucidated.

      We acknowledge that this is a major limitation of the study. We have highlighted this limitation in the discussion section. 

      • How do you substantiate the role of age and a high-nutrient diet in the development of obesity in knockout female mice? However, it is still unclear whether administering a high-fat diet in >20 week age of mice can develop insulin resistance where obesity is developing in LFD.

      When fed a low-fat diet, Ctrp10-KO female mice developed obesity with age and yet show little if any glucose intolerance or insulin resistance based on our glucose tolerance and insulin tolerance tests. For the HFD group, we are only comparing WT and KO mice on the same diet (not across diet). While WT mice on HFD gained significant amount of weight over time as expected, Ctrp10-KO female mice gain substantially higher amount of weight relative to WT littermates. Despite this, we did not observe a worsening of glucose tolerance and insulin resistance (based on GTT and ITT) in the KO female mice relative to WT controls as we would expect, since greater adiposity in HFD-fed mice generally correlated with worse metabolic outcomes. 

      (2) The authors should add the NR1D1 dependency study in female mice if possible.

      To address would require the generation of Ctrp10/Nr1d1 double KO mouse model and to carry out the entire study again in these double KO mice. Although this suggestion by the reviewer is a good one, this is beyond the scope of the present study.

      (3) NR1D1 represses the set of genes that promotes lipogenesis (the author should add some data that validates this statement).

      The role of NR1D1 in regulating metabolic genes are extensively documented in the published literature. NR1D1 (also known as REV-ERBα) is a constitutive transcriptional repressor (PMID: 26044300; PMID: 27445394). Many metabolic genes that are normally represses by NR1D1 is de-repressed in mice lacking NR1D1 globally or in the tissue-specific manner (PMID: 26044300; PMID: 34350828; PMID: 22562834). Among the many NR1D1 target genes involved in lipid metabolism include: CD36, Plin2, Elovl5, Acss3 (from: PMID: 26044300); as well as Scd1, Scd2, Pnpla5, Acsl1, Fasn, Hadhb, and Oxsm (from: PMID: 34350828).  We have included this information in the discussion section.

      (4) The authors should study the effect of Ctrp10 overexpression in HFD-fed female mice and also with KO of CTRP10 in adult mice if possible.

      The suggestion by the reviewer is a good one. However, this is beyond the scope of the study. We do not have a Ctrp10 conditional KO mouse model; as such, we could not study the effect of knocking out CTRP10 in adult mice. Overexpression studies are often considered non-physiological these days since the level of the overexpressed protein is generally much higher than the normal physiological level. For this reason, we did not attempt any overexpression study. 

      Reviewer #3 (Recommendations For The Authors):

      Line 114: Could you please provide definitions for "GluK2" and "GluK4" for readers unfamiliar with these terms?

      We have now provided definition for these terms.

      Line 140: It's stated that skeletal muscle and the pancreas express similar levels of Ctrp10 as the brain. Please double-check and clarify this assertion for accuracy.

      In mice, based on our own data (Fig. 1B), Ctrp10 expression in skeletal muscle and pancreas is comparable to that in the whole brain. In human, based on publicly available data (e.g., Genotype-Tissue Expression portal; GTex), brain expresses much higher level of CTRP10 transcript relative to other peripheral tissues.

      Line 141: Have you investigated whether Ctrp10 levels in plasma change after refeeding? If not, consider exploring this aspect to enhance the comprehensiveness of the study.

      No validated antibody currently exists for CTRP10. As such, we could not assess plasma level of CTRP10 after refeeding. We have included this as limitation of our study in the discussion section.  

      Lines 143-144: Clarify the age bracket of the animals used in the study. Additionally, have you observed similar responses, such as downregulation of Ctrp10 in response to refeeding, in both old and young mice in peripheral tissues?

      We have now included the age of the mice (~10 weeks old) for the fasting refeeding study as shown in Fig. 1C in the result and method sections.  

      Lines 135-149: To complement the experiments shown in Fig 1B-D, provide data pertaining to females.

      Ideally, we would like to have this data as well. However, to do this for females would involve 47 mice and the collection of 120 tissues (Fig. 1B; n = 10 per tissue), 390 tissues (Fig. 1C; n = 7-8 per tissue per fast or refed state), and 528 tissues (Fig. 1D; n = 11 per tissue per HFD or LFD). This would be a total of 1038 tissue samples. The main purpose of Fig. 1B-D is to demonstrate that Ctrp10 transcript is widely expressed and that its expression is modulated by nutritional (HFD vs. LFD) and metabolic (fast vs. refeed) states. These data provided a rationale to examine the metabolic phenotype in mice lacking CTRP10.

      To address the reviewer’s point, we looked at the expression levels of CTRP10/C1QL1 between males and females in the Genotype-Tissue Expression (GTEx) database portal and it does not appear that there are sex differences in CTRP10 expression patterns in normal tissues.  

      Line 152: Can you provide evidence supporting the hypothesis that Ctrp10 is secreted into the circulation?

      CTRP10 has a classic signal peptide sequence and the protein is secreted when expressed in HEK 293 cells (PMID: 18783346). We have shown previously that CTRP10 can be found in the FPLC-fractionated mouse serum using a polyclonal rabbit anti-mouse CTRP10 antibody we generated (PMID: 18783346); this antibody, however, does not work on tissue lysates (many non-specific bands). There is evidence in published literature to show that CTRP10/C1QL2 is clearly found circulating in human plasma. Some of the studies include: 1) Human C1QL2/CTRP10 is detected in the human plasma from UK BioBank (PMID: 37794186; C1QL2 is highlighted in page 335) and serum samples from pregnant females (PMID: 39062451; C1QL2 is highlighted in Table 2). We have included this information in the Introduction section.

      Line 178: In Fig 4 D and E (and other figures in the paper), it would be more accurate to express adipocyte size in "μm²" instead of "uM2."

      We have double checked and fixed this issue in the figure 4 and 7.

      Line 259: Please specify the age of the animals used in the study.

      In the method section, we did mention that LFD was provided for the duration of the study, beginning at 5 weeks of age; and that HFD was provided for 14 weeks, beginning at 6-7 weeks of age. Also, in Figure 2A and Figure 4A, the age of the mice is also indicated.

      Lines 275-283 and 288-296: It would be more appropriate to move this content to the Discussion section for better contextualization.

      We feel that the published information on NR1D1 and FGF21 should be mentioned in the result section so that the readers can immediately appreciate the significance of our data shown in Fig. 8 and 9. However, we also included similar information concerning NR1D1 in the discussion section for better contextualization as suggested.  

      Line 301: The section on DEG analysis requires additional details. How was the DEG analysis conducted? Were the DEGs from "wild type and KO mice" compared with "human DEGs regulated by sex"? Also, details about the phenotype of the human subjects and their association with obesity should be included. Additionally, discuss specific genes identified by the analysis and their relevance to the Ctrp10 story and human sex-specific gene connectivity analysis.

      We have updated the section on DEG analysis and, related to reviewer comments above, significantly expanded the github repository, detailing an analytical walkthrough of all computational analyses performed. To clarify the human integration analysis, we have added the following to the methods:

      “To investigate the degree of conservation of CTRP-engaged pathways, we mapped the differentially expressed genes (DEGs) identified from Ctrp10 knockout (KO) versus wild-type (WT) mice to their human orthologs, including human CTRP10, in the GTEx database for transcriptional correlations. Individuals were stratified by sex to examine sex-specific gene connectivity, consisting of 210 males and 100 females to compare gene expression across tissues. Gene-connectivity analyses were performed based on population correlation significances summarized by cumulative -log10(pvalues) as previously described"

      Line 330: In Fig 7L, increased oxidative stress in the liver of KO mice is shown. Please provide an explanation for the claim that Ctrp10-KO female mice resembled the WT controls.

      In Fig. 7L, we did observe a modest, but significant, increase in oxidative stress in the liver based on the quantification of malondialdehyde (MDA) level, a marker of tissue oxidative stress. However, we did not see any significant differences in the expression of oxidative genes in the liver between WT and KO female mice (Fig. 7J); thus, the statement in line 330 (discussion section) that pertains to oxidative gene expression in fat and liver (Fig. 7E and 7J) is correct. 

      Line 375: Could you clarify the term "adipose tissue health" and further discuss or provide evidence demonstrating compromised adipose tissue health in female KO mice following HFD?

      Adipose tissue health refers to the healthy functioning of adipose tissue (based on its functionality, immune cell population and profile, and metabolic gene expression profiles). Adipose tissue releases free fatty acids in response to fasting and takes up lipids in response to refeeding. Both are these functions are preserved in KO mice as we did not observe any significant differences in free fatty acids (NEFA) and triglyceride levels in the fasted and refed states (Fig. 6AB). Also, we did not observe any significant differences in the expression of inflammatory and fibrotic genes in the adipose tissue of WT and KO female mice fed a high-fat diet (Fig. 7E). If anything, we actually observed a modest, but significant, reduction in the expression of some ER and oxidative stress genes in the KO female mice relative to WT controls (Fig. 7E). 

      Line 408: Please provide data regarding estrogen levels in wild-type and KO female mice for comparison.

      We have now included serum estrogen data. No significant differences in estrogen levels were seen between WT and KO female mice fed either a low-fat diet (Fig. 4 – figure supplement 1) or a high-fat diet (Fig. 5 – figure supplement 2).

      Line 587: The GitHub link provided seems to be inactive or incorrect. Please verify and provide the correct link.

      We have also updated the github (https://github.com/Leandromvelez/CTRP10-Manuscript-DEG-Sex-specific-connectivities-and-integration) to include a README file and updated the R scripts to annotate steps and processing considerations. 

      Lines 590-599: Provide additional details about the analysis of human sex-specific genes. Including a table of the top DEGs and pathways differentially regulated by sex would be beneficial for readers' comprehension.

      We have expanded the methods, results and associated github repositories to detail all reproducible parameters used in these analyses.  The new table of DEGs is included in the manuscript and github repositories.

    1. Author response:

      The following is the authors’ response to the original reviews.

      Public Reviews:

      Reviewer #1 (Public review):

      Summary:

      In this article, Nedbalova et al. investigate the biochemical pathway that acts in circulating immune cells to generate adenosine, a systemic signal that directs nutrients toward the immune response, and S-adenosylmethionine (SAM), a methyl donor for lipid, DNA, RNA, and protein synthetic reactions. They find that SAM is largely generated through the uptake of extracellular methionine, but that recycling of adenosine to form ATP contributes a small but important quantity of SAM in immune cells during the immune response. The authors propose that adenosine serves as a sensor of cell activity and nutrient supply, with adenosine secretion dominating in response to increased cellular activity. Their findings of impaired immune action but rescued larval developmental delay when the enzyme Ahcy is knocked down in hemocytes are interpreted as due to effects on methylation processes in hemocytes and reduced production of adenosine to regulate systemic metabolism and development, respectively. Overall this is a strong paper that uses sophisticated metabolic techniques to map the biochemical regulation of an important systemic mediator, highlighting the importance of maintaining appropriate metabolite levels in driving immune cell biology.

      Strengths:

      The authors deploy metabolic tracing - no easy feat in Drosophila hemocytes - to assess flux into pools of the SAM cycle. This is complemented by mass spectrometry analysis of total levels of SAM cycle metabolites to provide a clear picture of this metabolic pathway in resting and activated immune cells.

      The experiments show that the recycling of adenosine to ATP, and ultimately SAM, contributes meaningfully to the ability of immune cells to control infection with wasp eggs.

      This is a well-written paper, with very nice figures showing metabolic pathways under investigation. In particular, the italicized annotations, for example, "must be kept low", in Figure 1 illustrate a key point in metabolism - that cells must control levels of various intermediates to keep metabolic pathways moving in a beneficial direction.

      Experiments are conducted and controlled well, reagents are tested, and findings are robust and support most of the authors' claims.

      Weaknesses:

      The authors posit that adenosine acts as a sensor of cellular activity, with increased release indicating active cellular metabolism and insufficient nutrient supply. It is unclear how generalizable they think this may be across different cell types or organs.

      In the final part of the Discussion, we elaborate slightly more on a possible generalization of our results, while being aware of the limited space in this experimental paper and therefore intend to address this in more detail and comprehensively in a subsequent perspective article.

      The authors extrapolate the findings in Figure 3 of decreased extracellular adenosine in ex vivo cultures of hemocytes with knockdown of Ahcy (panel B) to the in vivo findings of a rescue of larval developmental delay in wasp egg-infected larvae with hemocyte-specific Ahcy RNAi (panel C). This conclusion (discussed in lines 545-547) should be somewhat tempered, as a number of additional metabolic abnormalities characterize Ahcy-knockdown hemocytes, and the in vivo situation may not mimic the ex vivo situation. If adenosine (or inosine) measurements were possible in hemolymph, this would help bolster this idea. However, adenosine at least has a very short half-life.

      We agree with the reviewer, and in the 4th paragraph of the Discussion we now discuss more extensively the limitations of our study in relation to ex vivo adenosine measurements and the importance of the SAM pathway on adenosine production.

      Reviewer #2 (Public review):

      Summary:

      In this work, the authors wish to explore the metabolic support mechanisms enabling lamellocyte encapsulation, a critical antiparasitic immune response of insects. They show that S-adenosylmethionine metabolism is specifically important in this process through a combination of measurements of metabolite levels and genetic manipulations of this metabolic process.

      Strengths:

      The metabolite measurements and the functional analyses are generally very strong and clearly show that the metabolic process under study is important in lamellocyte immune function.

      Weaknesses:

      The gene expression data are a potential weakness. Not enough is explained about how the RNAseq experiments in Figures 2 and 4 were done, and the representation of the data is unclear.

      The RNAseq data have already been described in detail in our previous paper (doi.org/10.1371/journal.pbio.3002299), but we agree with the reviewer that we should describe the necessary details again here. The replicate numbers for RNAseq data were added to figure legends, the TPM values for the selected genes shown in figures are in S1_Data and new S4_Data file with complete RNAseq data (TPM and DESeq2) was added to this revised version.

      The paper would also be strengthened by the inclusion of some measure of encapsulation effectiveness: the authors show that manipulation of the S-adenosylmethionine pathway in lamellocytes affects the ability of the host to survive infection, but they do not show direct effects on the ability of the host to encapsulate wasp eggs.

      The reviewer is correct that wasp egg encapsulation and host survival may be different (the host can encapsulate and kill the wasp egg and still not survive) and we should also include encapsulation efficiency. This is now added to Figure 3D, which shows that encapsulation efficiency is reduced upon Ahcy-RNAi, which is consistent with the reduced number of lamellocytes.

      Reviewer #3 (Public review):

      Summary:

      The authors of this study provide evidence that Drosophila immune cells show upregulated SAM transmethylation pathway and adenosine recycling upon wasp infection. Blocking this pathway compromises the lamellocyte formation, developmental delay, and host survival, suggesting its physiological relevance.

      Strengths:

      Snapshot quantification of the metabolite pool does not provide evidence that the metabolic pathway is active or not. The authors use an ex vivo isotope labelling to precisely monitor the SAM and adenosine metabolism. During infection, the methionine metabolism and adenosine recycling are upregulated, which is necessary to support the immune reaction. By combining the genetic experiment, they successfully show that the pathway is activated in immune cells.

      Weaknesses:

      The authors knocked down Ahcy to prove the importance of SAM methylation pathway. However, Ahcy-RNAi produces a massive accumulation of SAH, in addition to blocking adenosine production. To further validate the phenotypic causality, it is necessary to manipulate other enzymes in the pathway, such as Sam-S, Cbs, SamDC, etc.

      We are aware of this weakness and have addressed it in a much more detailed discussion of the limitations of our study in the 6th paragraph of the Discussion.

      The authors do not demonstrate how infection stimulates the metabolic pathway given the gene expression of metabolic enzymes is not upregulated by infection stimulus.

      Although the goal of this work was to test by 13C tracing whether the SAM pathway activity is upregulated, not to analyze how its activity is regulated, we certainly agree with the reviewer that an explanation of possible regulation, especially in the context of the enzyme expressions we show, should be included in our work. Therefore, we have supplemented the data with methyltransferase expressions (Figure 2-figure supplement 3. And S3_Data) and better describe the changes in expression of some SAM pathway genes, which also support stimulation of this pathway by changes in expression. The enzymes of the SAM transmethylation pathway are highly expressed in hemocytes, and it is known that the activity of this pathway is primarily regulated by (1) increased methionine supply to the cell and (2) the actual utilization of SAM by methyltransferases. Therefore, a possible increase in SAM transmethylation pathway in our work can be suggested (1) by increased expression of 4 transporters capable of transporting methionine, (2) by decreased expression of AhcyL2 (dominant-negative regulator of Ahcy) and (3) by increased expression of 43 out of 200 methyltransferases. This was now added to the first section of Results.

      Recommendations for the authors:

      Reviewing Editor Comments:

      In the discussion with the reviewers, two points were underlined as very important:

      (1) Knocking down Ahyc and other enzymes in the SAM methylation pathway may give very distinct phenotypes. Generalising the importance of "SAM methyaltion" only by Ahcy-RNAi is a bit cautious. The authors should be aware of this issue and probably mention it in the Discussion part.

      We are aware of this weakness and have addressed it in a much more detailed discussion of the limitations of our study in the 6th paragraph of the Discussion.

      (2) Sample sizes should be indicated in the Figure Legends. Replicate numbers on the RNAseq are important - were these expression levels/changes seen more than once?

      Sample sizes are shown as scatter plots with individual values wherever possible and all graphs are supplemented with S1_Data table with raw data. The RNAseq data have already been described in detail in our previous paper (doi.org/10.1371/journal.pbio.3002299), but we agree with the reviewers that we should describe the necessary details again here. The replicate numbers for RNAseq data were added to figure legends, the TPM values for the selected genes shown in figures are in S1_Data and new S4_Data file with complete RNAseq data (TPM and DESeq2) was added to this revised version.

      Reviewer #1 (Recommendations for the authors):

      Major points:

      (1) Please provide sample sizes in the legends rather than in a supplementary table.

      Sample sizes are shown either as scatter plots with individual values or added to figure legends now.

      (2) More details in the methods section are needed:

      For hemocyte counting, are sessile and circulating hemocytes measured?

      We counted circulating hemocytes (upon infection, most sessile hemocytes are released into the circulation). While for metabolomics all hemocyte types were included, for hemocyte counting we were mainly interested in lamellocytes. Therefore, we counted them 20 hours after infection, when most of the lamellocytes from the first wave are fully differentiated but still mostly in circulation, as they are just starting to adhere to the wasp egg. This was added to the Methods section.

      How were levels of methionine and adenosine used in ex vivo cultures selected? This is alluded to in lines 158-159, but no references are provided.

      The concentrations are based on measurements of actual hemolymph concentrations in wild-type larvae in the case of methionine, and in the case of adenosine, we used a slightly higher concentration than measured in the adgf-a mutant to have a sufficiently high concentration to allow adenosine to flow into the hemocytes. This is now added to the Methods section.

      Minor points:

      Response to all minor points:  Thank you, errors has now been fixed.

      (1) Line 186 - spell out MTA - 5-methylthioadenosine.

      (2) Lines 196-212 (and elsewhere) - spelling out cystathione rather than using the abbreviation CTH is recommended because the gene cystathione gamma-lyase (Cth) is also discussed in this paragraph. Using the full name of the metabolite will reduce confusion.

      We rather used cystathionine γ-lyase as a full name since it is used only three times while CTH many more times, including figures.

      (3) Figure 2 - supplement 2: please include scale bars.

      (4) Line 303 - spelling error: "trabsmethylation" should be "transmethylation".

      (5) Line 373 - spelling error: "higer" should be "higher".

      Reviewer #2 (Recommendations for the authors):

      For the RNAseq data, it's unclear whether the gene expression data in Figures 2 and 4 include biological replicates, so it's unclear how much weight we should place on them.

      The replicate numbers for RNAseq data were added to figure legends, the TPM values for the selected genes shown in figures are in S1_Data and new S4_Data file with complete RNAseq data (TPM and DESeq2) was added to this revised version.

      The representation of these data is also a weakness: Figure 2 shows measurements of transcripts per million, but we don't know what would be high or low expression on this scale.

      We have added the actual TPM values for each cell in the RNAseq heatmaps in Figure 2, Figure 2-figure supplement 3, and Figure 4 to make them more readable. Although it is debatable what is high or low expression, to at least have something for comparison, we have added the following information to the figure legends that only 20% of the genes in the presented RNAseq data show expression higher than 15 TPM.

      Figure 4 is intended to show expression changes with treatment, but expression changes should be shown on a log scale (so that increases and decreases in expression are shown symmetrically) and should be normalized to some standard level (such as uninfected lamellocytes).

      The bars in Figure 4C,D show the fold change (this is now stated in the y-axis legend) compared to 0 h (=uninfected) Adk3 samples - the reason for this visualization is that we wanted to show (1) the differences in levels between Adk3 and Adk2 and in levels between Ak1 and Ak2, respectively, and at the same time (2) the differences between uninfected and infected Adk3 and Ak1. In our opinion, these fold change differences are also much more visible in normal rather than log scale.

      Reviewer #3 (Recommendations for the authors):

      (1) It might be interesting to test how general this finding would be. How about Bacterial or fungal infection? The authors may also try genetic activation of immune pathways, e.g. Toll, Imd, JAK/STAT.

      Although we would also like to support our results in different systems, we believe that our results are already strong enough to propose the final hypothesis and publish it as soon as possible so that it can be tested by other researchers in different systems and contexts than the Drosophila immune response.

      (2) How does the metabolic pathway get activated? Enzyme activity? Transporters? Please test or at least discuss the possible mechanism.

      The response is already provided above in the Reviewer #3 (Public review) section.

      (3) The authors might test overexpression or genetic activation of the SAM transmethylation pathway.

      Although we agree that this would potentially strengthen our study, it may not be easy to increase the activity of the SAM transmethylation pathway - simply overexpressing the enzymes may not be enough, the regulation is primarily through the utilization of SAM by methyltransferases and there are hundreds of them and they affect numerous processes. 

      (4) Supplementation of adenosine to the Ahcy-RNAi larvae would also support their conclusion.

      Again, this is not an easy experiment, dietary supplementation would not work, direct injection of adenosine into the hemolymph would not last long enough, adenosine would be quickly removed.

      (5) It is interesting to test genetically the requirement of some transporters, especially for gb, which is upregulated upon infection.

      Although this would be an interesting experiment, it is beyond the scope of this study; we did not aim to study the role of the SAM transmethylation pathway itself or its regulation, only its overall activity and its role in adenosine production.

    1. Author response:

      The following is the authors’ response to the original reviews.

      Reviewer #1 (Public review):

      Summary:

      Wang et al. created a series of specific FLIM-FRET sensors to measure the activity of different Rab proteins in small cellular compartments. They apply the new sensors to monitor Rab activity in dendritic spines during induction of LTP. They find sustained (30 min) inactivation of Rab10 and transient (5 min) activation of Rab4 after glutamate uncaging in zero Mg. NMDAR function and CaMKII activation are required for these effects. Knockdown of Rab4 reduced spine volume change while knockdown of Rab10 boosted it and enhanced functional LTP (in KO mice). To test Rab effects on AMPA receptor exocytosis, the authors performed FRAP of fluorescently labeled GluA1 subunits in the plasma membrane. Within 2-3 min, new AMPARs appear on the surface via exocytosis. This process is accelerated by Rab10 knock-down and slowed by Rab4 knock-down. The authors conclude that CaMKII promotes AMPAR exocytosis by i) activating Rab4, the exocytosis driver and ii) inhibiting Rab10, possibly involved in AMPAR degradation.

      Strengths:

      The work is a technical tour de force, adding fundamental insights to our understanding of the crucial functions of different Rab proteins in promoting/preventing synaptic plasticity. The complexity of compartmentalized Ras signaling is poorly understood and this study makes substantial inroads. The new sensors are thoroughly characterized, seem to work very well, and will be quite useful for the neuroscience community and beyond (e.g. cancer research). The use of FLIM for read-out is compelling for precise activity measurements in rapidly expanding compartments (i.e., spines during LTP).

      Thank you for the evaluation.

      Weaknesses:

      The interpretation of the FRAP experiments (Figure 5, Ext. Data Figure 13) is not straightforward as spine volume and surface area greatly expand during uncaging. I appreciate the correction for the added spine membrane shown in Extended Data Figure 14i, but shouldn't this be a correction factor (multiplication) derived from the volume increase instead of a subtraction?

      We thank the reviewer for this question. The fluorescence change should reflect a subtraction of surface area, as SEP-GluA1 is only fluorescent on the cell surface, unlike cytosolic mCherry, whose fluorescence intensity is proportional to spine volume. Therefore, the overall fluorescence change (ΔF) should be the addition of the contribution from AMPAR trafficking (ΔF<sub>t</sub>) and the change in surface area (ΔS) multiplied by the remaining SEP-GluA1 fluorescence per unit area (f):

      ΔF = ΔF<sub>t</sub> + fΔS

      Since fluorescence immediately after photobleaching (before AMPAR trafficking happens), F<sub>o</sub>, is given by fS (S is the surface area of the spine):

      ΔF/F<sub>o</sub> = ΔF<sub>t</sub>/ F<sub>o</sub> + fΔS / fS

      \= ΔF<sub>t</sub>/fS + ΔS/S

      Assuming that the surface area change (ΔS/S) is the volume change (ΔV/V) to the power of 2/3, the contribution of the AMPAR trafficking can be calculated as:

      ΔF<sub>t</sub>/F = ΔF/F – (Δ<sup>V/V)<sup>2/3</sup>

      This is the reason that we subtracted the contribution of the spine surface area. We have discussed this in the updated method section.

      Also, experiments were not conducted or analyzed blind, risking bias in the selection/exclusion of experiments for analysis. This reduces my confidence in the results.

      We acknowledge the reviewer's concern regarding the lack of blinding in our experiments. However, it is challenging to conduct blinded experiments for certain types of studies, such as sensor screening for a protein family, where we do not have expected results or a specific hypothesis prior to the experiments. In these cases, our primary readout is whether the sensor indicates any activity change upon stimulation.

      To address this concern, after identifying that Rab10 is inactivated during structural LTP (sLTP) and is likely important for inhibiting spine structural LTP, we performed blinded electrophysiology experiments and obtained similar results (deletion of Rab10 from Camk2a-positive neurons leads to enhanced LTP; Fig. 4k, 4l).

      Reviewer #2 (Public review):

      Summary:

      Wang et al. developed a set of optical sensors to monitor Rab protein activity. Their investigation into Rab activity in dendritic spines during structural long-term plasticity (sLTP) revealed sustained Rab10 inactivation (>30min) and transient Rab4 activation (~5 min). Through pharmacological and genetic manipulation to constitutively activate or inhibit Rab proteins, they found that Rab10 negatively regulates sLTP and AMPA receptor insertion, while Rab4 positively influences sLTP but only in the transient phase. The optical sensors provide new tools for studying Rab activity in cells and neurobiology. However, a full understanding of the timing of Rab activity will require a detailed characterization of sensor kinetics.

      Strengths:

      (1) Introduction of a series of novel sensors that can address numerous questions in Rab biology.

      (2) Multiple methods to manipulate Rab proteins to reveal the roles of Rab10 and rab4 in LTP.

      (3) Discovery of Rab4 activation and Rab10 inhibition with different kinetics during sLTP, correlating with their functional roles in the transient (Rab4) and both transient and sustained (Rab10) phases of sLTP.

      Thank you for the positive evaluation.

      Weaknesses:

      (1) Lack of characterization of sensor kinetics, making it difficult to determine if the observed Rab kinetics during sLTP were due to sensor behavior or actual Rab activity.

      We estimated that the kinetics of the sensors for Rab4 and Rab10 are within a few minutes. For Rab4, we observed rapid increase and decrease of the activation in response to glutamate uncaging. Thus, this would be the upper limit of the ON/OFF time constants of Rab4. For Rab10, we observed a rapid dissociation of the sensor in response to sLTP induction within ~1 min. This means that the donor and acceptor molecules are quickly dissociated during the process. Thus, the off kinetics of the sensor is within the range of minute. Meanwhile, we have the on-kinetics from Rab10 activation (donor/accepter association) in response to NMDA application and again this is within a few minutes. Given these rapid sensor kinetics in neurons, our observation of the sustained inactivation of Rab10 should reflect the true behavior of Rab10, rather than just the sensor’s response.

      We revised our manuscript discussion session as follows:

      “Understanding the kinetics of Rab4 and Rab10 sensors is essential for interpreting their actual activity during sLTP. The Rab4 sensor exhibits a rapid rise and fall in activation (Fig. 3), indicating ON/OFF times of less than a few minutes. In contrast, the Rab10 sensor rapidly dissociates during sLTP induction (Fig. 2), with OFF kinetics occurring within one minute and fast ON kinetics in response to NMDA (Fig. 1j). Given these rapid kinetics, the observed sustained inactivation of Rab10 likely reflects its true behavior rather than sensor dynamics.”

      (2) It is crucial to assess whether the overexpression of Rab proteins as reporters, affects Rab activity and cellular structure and physiology (e.g. spine number and size).

      While we did not measure the effects of Rab sensor overexpression on Rab activity or cellular structure and physiology, we showed that sLTP is similar in neurons expressing sensors. This suggests that the overexpression of Rab sensors does not significantly disrupt signaling required for sLTP.

      (3) The paper does not explain the apparently different results between NMDA receptor activation and glutamate uncaging. NMDA receptor activation increased Rab10 activity, while glutamate uncaging decreased it. NMDA receptor activation resulted in sustained Rab4 activation, whereas glutamate uncaging caused only brief activation of about 5 minutes. A potential explanation, ideally supported by data, is needed.

      It is a long-standing question in the field why simple NMDA receptor activation by bath application of NMDA does not induce LTP, but instead induce LTD. Rab proteins are regulated by many GEFs and GAPs and identifying different mechanisms requires completely different techniques, such as molecular screening. While our manuscript provides some insights into this question by showing that they provide opposing signals for Rab10, we believe that identifying exact mechanisms would be out of the scope of this manuscript.

      (4) There is a discrepancy between spine phenotype and sLTP potential with Rab10 perturbation. Rab10 perturbation affected spine density but not size, suggesting a role in spinogenesis rather than sLTP. However, glutamate uncaging affected sLTP, and spinogenesis was not examined. Explaining the discrepancy between spine size and sLTP potential is necessary. Exploring spinogenesis with glutamate uncaging would strengthen these results. Additionally, Figure 4j shows no change in synaptic transmission with Rab10 knockout, despite an increase in spine density. An explanation, ideally supported by data, is needed for the unchanged fEPSP slope despite an increase in spine density.

      We thank the reviewer for raising these important questions. In our findings, shRNA-mediated knockdown of Rab10 did not alter spine size but did increase spine density in the basal state (Extended Data Fig. 11i). This suggests that Rab10 may restrict spinogenesis without affecting spine size. Conversely, sLTP induction via glutamate uncaging is an activity-dependent process that may involve different molecular mechanisms. The signal interplay between spinogenesis and sLTP and how the exact roles of Rab signaling in different modalities of plasticity would remain elusive for the future study.

      The lack of change in synaptic transmission with Rab10 knockout, despite the increase in spine density from Rab10 shRNA knockdown, may be due to different preparation and developmental stages: spine density measurements were conducted with shRNA knockdown in organotypic slices (sliced at P6-8, DIV 9-13), while electrophysiological recordings were performed in knockout mice in acute slices from adult animals (P30-60).

      (5) Spine volume was imaged using acceptor fluorophores (mCherry, or mCherry/Venus) at 920nm, where the two-photon cross-section of mCherry is minimal. 920nm was also used to excite the donor fluorophore, hence the spine volume measurement based on total red channel fluorescence is the sum of minimal mCherry fluorescence from direct 920nm excitation, bleed-through from the green channel, and FRET. This confounded measurement requires correction and clarification.

      We assumed that the most of fluorescence is from direct excitation of mCherry at 920 nm. The contribution from the bleed-through from mEGFP-Rab (~3%) and from FRET changes (~20%) may influence the volume measurements. However, since we observed similar fluorescence changes in the green and red channels, these factors would have only a minor impact on our results (Extended Data Fig. 6a, 6d). Also, please note that the volume change in neurons expressing sensors is just to check if the volume change is normal, and not a major point of this manuscript.  We clarified this in the method section as:

      “For the sensor experiments, we used mCherry as a volume indicator. We acknowledge that contributions from bleed-through from mEGFP-Rab (approximately 3%) and FRET changes (around 20%) could affect the volume measurements. However, since we observed similar fluorescence changes in both the green and red channels, we believe these factors have a minimal impact on our results (Extended Data Fig. 6a, 6d).”

      Reviewer #3 (Public review):

      Summary:

      This study examines the roles of Rab10 and Rab4 proteins in structural long-term potentiation (sLTP) and AMPA receptor (AMPAR) trafficking in hippocampal dendritic spines using various different methods and organotypic slice cultures as the biological model.

      The paper shows that Rab10 inactivation enhances AMPAR insertion and dendritic spine head volume increase during sLTP, while Rab4 supports the initial stages of these processes. The key contribution of this study is identifying Rab10 inactivation as a previously unknown facilitator of AMPAR insertion and spine growth, acting as a brake on sLTP when active. Rab4 and Rab10 seem to be playing opposing roles, suggesting a somewhat coordinated mechanism that precisely controls synaptic potentiation, with Rab4 facilitating early changes and Rab10 restricting the extent and timing of synaptic strengthening.

      Strengths:

      The study combines multiple techniques such as FRET/FLIM imaging, pharmacology, genetic manipulations, and electrophysiology to dissect the roles of Rab10 and Rab4 in sLTP. The authors developed highly sensitive FRET/FLIM-based sensors to monitor Rab protein activity in single dendritic spines. This allowed them to study the spatiotemporal dynamics of Rab10 and Rab4 activity during glutamate uncaging-induced sLTP. They also developed various controls to ensure the specificity of their observations. For example, they used a false acceptor sensor to verify the specificity of the Rab10 sensor response.

      This study reveals previously unknown roles for Rab10 and Rab4 in synaptic plasticity, showing their opposing functions in regulating AMPAR trafficking and spine structural plasticity during LTP.

      Thank you for the positive evaluation.

      Weaknesses:

      In sLTP, the initial volume of stimulated spines is an important determinant of induced plasticity. To address changes in initial volume and those induced by uncaging, the authors present Extended Data Figure 2. In my view, the methods of fitting, sample selection, or both may pose significant limitations for interpreting the overall results. While the initial spine size distribution for Rab10 experiments spans ~0.1-0.4 fL (with an unusually large single spine at the upper end), Rab4 spine distribution spans a broader range of ~0.1-0.9 fL. If the authors applied initial size-matched data selection or used polynomials rather than linear fitting, panels a, b, e, f, and g might display a different pattern. In that case, clustering analysis based on initial size may be necessary to enable a fair comparison between groups not only for this figure but also for main Figures 2 and 3.

      We thank the reviewer for these questions. For sensor uncaging experiments, we usually uncaged glutamate at large mushroom spines because we need to have a good signal-to-noise ratio. We just happen to choose these spines with different initial sizes for Rab4 sensor and Rab10 sensor uncaging experiments.

      Another limitation is the absence of in vivo validation, as the experiments were performed in organotypic hippocampal slices, which may not fully replicate the complexity of synaptic plasticity in an intact brain, where excitatory and inhibitory processes occur concurrently. High concentrations of MNI-glutamate (4 mM in this study) are known to block GABAergic responses due to its antagonistic effect on GABA-A receptors, thereby precluding the study of inhibitory network activity or connectivity [1], which is already known to be altered in organotypic slice cultures.

      (1) https://www.frontiersin.org/journals/neural-circuits/articles/10.3389/neuro.04.002.2009/full

      We appreciate the reviewer's comments and would like to clarify that we have conducted experiments in acute slices for LTP using conditional Rab10 knockout (Fig. 4k, 4l), and we obtained similar results. Additionally, we have recently published findings on the behavioral deficits observed in heterozygous Rab10 knockout mice (PubMed 37156612). These studies further support our conclusions and provide additional context for our findings.

      Recommendations for the authors:

      From the Senior/Reviewing Editor:

      I apologize that this took longer than intended. As you will see from the reviews there was some disagreement on several points. There was some disagreement among reviewers as to the strength of the evidence with some characterizing it as "compelling," "convincing," or "solid" while others felt the characterization of the sensors was "incomplete" and that this could have affected some of the conclusions. After extensive discussion, reviewers agreed that there was a valid concern that the conclusion that Rab10 activation is sustained could reflect a feature of the sensor. If Rab10/RBD dissociation rate were very low, and the affinity of binding were very high, this could lead to an incorrect estimate of the sustained binding due to sensor kinetics, not Rab10 activation. It was noted that this has been seen in other sensors previously (e.g. first generation PKA activity sensors), which the developers altered in later generations to increase reversibility and off kinetics of the sensor.

      There was also discussion of how this might be addressed and we would be interested in your comments on this issue. It was suggested that it might be helpful to revise Figure 2b to show binding fraction dynamics separately for each spine (to determine whether any actually return to baseline). Subsequently, clustering of these binding dynamics into two groups could be summarized in a version of Fig. 2e for each cluster. Differences in spine volume dynamics between these clusters would provide a measure of how strongly Rab10 binding correlates with spine volume. If they never go back to baseline, some extra experiments with longer post-plasticity induction (150mins instead of 35), might show if any reversible Rab10 binding exists post-LTP induction.

      An alternative suggestion was to measure the time course in the presence of a GAP or GEF, which should alter the kinetics.

      Thanks for the comments. It is important that the inactivation is observed as the dissociation of the donor and acceptor of the sensor.  Thus, the fact that the sensor rapidly decreases in response to uncaging means that they have rapid off kinetics. In addition, we provide evidence of a rapid increase of Rab10 in response to NMDA application, suggesting that kinetics is also rapid. We added discussion about this in the revised manuscript as:

      “Understanding the kinetics of Rab4 and Rab10 sensors is essential for interpreting their actual activity during sLTP. The Rab4 sensor exhibits a rapid rise and fall in activation (Fig. 3), indicating ON/OFF times of just a few minutes. In contrast, the Rab10 sensor rapidly dissociates during sLTP induction (Fig. 2), with OFF kinetics occurring within one minute and fast ON kinetics in response to NMDA (Fig. 1j). Given these rapid kinetics, the observed sustained inactivation of Rab10 likely reflects its true behavior rather than sensor dynamics.”

      There was also further discussion of the nature of the "spine volume" signal, given the fact that the two-photon cross-section of mCherry is minimal at 920nm. It was suggested that this could be due to direct acceptor excitation rather than FRET, but there was agreement that further clarity on this issue would be valuable.

      We assumed that the most of fluorescence is from direct excitation of mCherry at 920 nm. The contribution from the bleed-through from mEGFP-Rab (~3%) and from FRET changes (~20%) may influence the volume measurements. However, since we observed similar fluorescence changes in the green and red channels, these factors would have only a minor impact on our results (Extended Data Fig. 6a, 6d). Also, please note that the volume change in neurons expressing sensors is just to check if the volume change is normal, and not a major point of this manuscript.  We clarified this in the method section as:

      “For the sensor experiments, we used mCherry as a volume indicator. We acknowledge that contributions from bleed-through from mEGFP-Rab (approximately 3%) and FRET changes (around 20%) could affect the volume measurements. However, since we observed similar fluorescence changes in both the green and red channels, we believe these factors have a minimal impact on our results (Extended Data Fig. 6a, 6d).”

      The equations in the methods section differ from other papers by the same lab (e.g. Laviv et al, Neuron 2020, Tu et al. Sci Adv. 2023, Jain et al. Nature 2024). Please clarify which equations are correct.

      Thanks for pointing this out. In fact, some of the equations in this manuscript were wrong, and we have corrected them in the method session.

      Reviewer #1 (Recommendations for the authors):

      The effects of Rab knockdown affect both spine volume expansion and AMPAR recovery in a very similar fashion. To explain this tight coupling, the authors suggest that the availability of membrane could be a limiting factor for spine enlargement. However, some Rabs are known to affect actin dynamics, which could also explain the dual effects on AMPAR exocytosis and spine enlargement. It is not easy to come up with an experiment to differentiate between these alternative explanations, as blocking actin polymerization would likely affect exocytosis, too. The authors should consider/discuss the possibility that all of the observed Ras effects result from altered actin dynamics and that the lipid bilayer is sufficiently fluid to form a minimal surface around the expanding cytoskeleton.

      Thanks for the suggestions. We included the discussion about the potential impact on the actin cytoskeleton by Rab10.

      Typos: heterougenous, compartmantalization, chemaical, ballistically/biolistically (chose one).

      Thanks for pointing out these typos. We have corrected them in the revised manuscript.

      Reviewer #2 (Recommendations for the authors):

      (1) Venus shows pH sensitivity, which can be significant at synapses due to pH changes. Characterizing the pH sensitivity of the sensors is essential.

      Thanks for the suggestions. We did not measure pH dependence, but the PKa of these fluorophores has already been published. PKa for EGFP and Venus are both 6.0, and it is unlikely that it influenced our measurements.

      (2) Presenting individual data points within all bar graphs (e.g. Fig. 2c, 2d) would enhance data transparency.

      Thanks for the suggestions. We now provide individual data points in the revised main figures.

      (3) In Figure 1f: Rab5 GAP expression increased the binding fraction against expectations. In addition, clarifying the color scheme in Figure 1 is needed. Are GAPs supposed to be blue/green, and GEFs red/orange? Figure 1f seems to contradict this color scheme.

      Thanks for the suggestions. We clarified these issues.

      (4) Quantification of the point spread function of the uncaging laser, response/settle time of the scan mirror during uncaging, and reason for changes in neighboring spines in many example images (e.g. Figure 2a, especially at 240 s; Figure 4a) would be important.

      The laser is controlled by Pockels cells, which changes the laser intensity with microsecond resolution. The laser is parked for milliseconds during uncaging, much longer than the settling time of the mirror (~0.1 milliseconds). The point spread function of the uncaging laser is limited by the diffraction (~0.5 um). The uncaging spot size is mostly limited by the diffusion of uncaged glutamate, but our calcium imaging and CaMKII imaging show that the signaling is induced mostly in the stimulated spines (Lee et al., 2009; Chang et al., 2017, 2019).

      (5) Please include traces for "false" sensors in stimulated spines in Figures 2b, 2e, 3b, and 3e.

      The traces for the false sensors have been presented in Extended Data Fig. 3 and Extended Data Fig. 8.

      (6) The traces in Figure 4k (fEPSP slope in response to theta burst stimulation, where there is a decrease in fEPSP slope followed by a gradual increase) differ from prior publications (e.g. PMID: 1359925, 3967730, 19144965, 20016099). An investigation and explanation for these differences are necessary.

      We appreciate the reviewer’s comments. We performed the experiments blindly and did not try to find a condition providing control data similar to previous publications. The variations in fEPSP responses compared to prior publications may be attributed to several factors, including differences in experimental conditions such as the genetic background of the animals used, the specific protocols for theta burst stimulation, and variations in the preparation of the hippocampal slices.

      (7) The title and text state that Rab10 inactivation promotes AMPAR insertion. It is unclear if this is a direct effect on AMPAR insertion or an indirect effect through membrane remodeling. Providing data to distinguish these possibilities or adjusting the title/text to reflect alternative interpretations would be beneficial.  

      We appreciate the reviewer's feedback. To clarify, we have revised our terminology to use "AMPAR trafficking" instead of "AMPAR insertion", as it includes both insertion and other mechanisms of AMPAR movement within the cell.

      (8) Please provide an explanation for the initial Rab10 inactivation observed in Figure 1j upon NMDA application.

      The application of NMDA in Fig. 1j is similar to the commonly used chemical LTD induction protocol. We used this broad stimulation approach to test whether our sensors could report Rab activity changes in neurons upon strong stimulation. However, it is an entirely different stimulation approach from the sLTP induction protocol, thus resulting in different sensor activity changes.  We describe the phenomenon in the revised manuscript, but we believe that detailed analyses of Rab10 activation in response to NMDA application are beyond the scope of this manuscript.

      (9) Please explain why the study focuses on Rab4 and Rab10 instead of other Rab proteins.

      During our initial screening of sensors for various Rab proteins, we observed significant activity changes in the sensors for Rab4 and Rab10 upon sLTP induction. This suggested their potential relevance in synaptic processes, leading us to focus on understanding their specific roles in structural long-term potentiation.

      Reviewer #3 (Recommendations for the authors):

      (1) Although it might seem trivial, the definition of adjacent spine has not been made in the text. It would be nice to have it in the Methods section.

      We included it in the Methods section as follows:

      "The adjacent spine refers to the first or second spine located next to the stimulated spine, typically positioned opposite the stimulated spine. Additionally, the size of the adjacent spine must be sufficiently large for imaging."

      (2) The transfection method has been mentioned as "ballistic" and "biolistic" transfection. You might want to use only one term. Additionally, you can add the equipment used (Bio-rad?) and pressure (psi) in the Methods section.

      We use “biolistic” throughout the manuscript now. We also added the equipment and conditions used.

    1. Author response:

      The following is the authors’ response to the original reviews.

      Public Reviews:

      Reviewer #1 (Public review):

      Neuronal activity spatiotemporal fine-tuning of cerebral blood flow balances metabolic demands of changing neuronal activity with blood supply. Several 'feed-forward' mechanisms have been described that contribute to activity-dependent vasodilation as well as vasoconstriction leading to a reduction in perfusion. Involved messengers are ionic (K+), gaseous (NO), peptides (e.g., NPY, VIP), and other messengers (PGE2, GABA, glutamate, norepinephrine) that target endothelial cells, smooth muscle cells, or pericytes. Contributions of the respective signaling pathways likely vary across brain regions or even within specific brain regions (e.g., across the cortex) and are likely influenced by the brain's physiological state (resting, active, sleeping) or pathological departures from normal physiology.

      The manuscript "Elevated pyramidal cell firing orchestrates arteriolar vasoconstriction through COX-2derived prostaglandin E2 signaling" by B. Le Gac, et al. investigates mechanisms leading to activitydependent arteriole constriction. Here, mainly working in brain slices from mice expressing channelrhodopsin 2 (ChR2) in all excitatory neurons (Emx1-Cre; Ai32 mice), the authors show that strong optogenetic stimulation of cortical pyramidal neurons leads to constriction that is mediated through the cyclooxygenase-2 / prostaglandin E2 / EP1 and EP3 receptor pathway with contribution of NPY-releasing interneurons and astrocytes releasing 20-HETE. Specifically, using a patch clamp, the authors show that 10-s optogenetic stimulation at 10 and 20 Hz leads to vasoconstriction (Figure 1), in line with a stimulation frequency-dependent increase in somatic calcium (Figure 2). The vascular effects were abolished in the presence of TTX and significantly reduced in the presence of glutamate receptor antagonists (Figure 3). The authors further show with RT-PCR on RNA isolated from patched cells that ~50% of analyzed cells express COX-1 or -2 and other enzymes required to produce PGE2 or PGF2a (Figure 4). Further, blockade of COX-1 and -2 (indomethacin), or COX-2 (NS-398) abolishes constriction. In animals with chronic cranial windows that were anesthetized with ketamine and medetomidine, 10-s long optogenetic stimulation at 10 Hz leads to considerable constriction, which is reduced in the presence of indomethacin. Blockade of EP1 and EP3 receptors leads to a significant reduction of the constriction in slices (Figure 5). Finally, the authors show that blockade of 20-HETE synthesis caused moderate and NPY Y1 receptor blockade a complete reduction of constriction.

      The mechanistic analysis of neurovascular coupling mechanisms as exemplified here will guide further in-vivo studies and has important implications for human neuroimaging in health and disease. Most of the data in this manuscript uses brain slices as an experimental model which contrasts with neurovascular imaging studies performed in awake (headfixed) animals. However, the slice preparation allows for patch clamp as well as easy drug application and removal. Further, the authors discuss their results in view of differences between brain slices and in vivo observations experiments, including the absence of vascular tone as well as blood perfusion required for metabolite (e.g., PGE2) removal, and the presence of network effects in the intact brain. The manuscript and figures present the data clearly; regarding the presented mechanism, the data supports the authors' conclusions.

      We thank the reviewer for his/her supportive comments as well as for pointing out pros and cons of the brain slice preparation.

      Some of the data was generated in vivo in head-fixed animals under anesthesia; in this regard, the authors should revise the introduction and discussion to include the important distinction between studies performed in slices, or in acute or chronic in-vivo preparations under anesthesia (reduced network activity and reduced or blockade of neuromodulation, or in awake animals (virtually undisturbed network and neuromodulatory activity).

      We have now added a paragraph in the introduction (lines 52-64) to highlight the distinction between ex vivo and in vivo models. We now also discuss that anesthetized animals exhibit slower NVC (Line 308-309).

      Further, while discussed to some extent, the authors could improve their manuscript by more clearly stating if they expect the described mechanism to contribute to CBF regulation under 'resting state conditions' (i.e., in the absence of any stimulus), during short or sustained (e.g., visual, tactile) stimulation, or if this mechanism is mainly relevant under pathological conditions; especially in the context of the optogenetic stimulation paradigm being used (10-s long stimulation of many pyramidal neurons at moderate-high frequencies) and the fact that constriction leading to undersupply in response to strongly increased neuronal activity seems counterintuitive?

      We now discuss more extensively the physiological relevance (lines 422-434 and 436-439) and the conditions where the described mechanisms of neurogenic vasoconstriction may occur.

      We agree with the reviewer that vasoconstriction in response to a large increase in neuronal activity is counterintuitive as it leads to undersupply despite an increased energy demand. We now discuss its potential physio/pathological role in attenuating neuronal activity by reducing energy supply (lines 453-464).

      Reviewer #2 (Public review):

      Summary:

      The present study by Le Gac et al. investigates the vasoconstriction of cerebral arteries during neurovascular coupling. It proposes that pyramidal neurons firing at high frequency lead to prostaglandin E2 (PGE2) release and activation of arteriolar EP1 and EP3 receptors, causing smooth muscle cell contraction. The authors further claim that interneurons and astrocytes also contribute to vasoconstriction via neuropeptide Y (NPY) and 20-hydroxyeicosatetraenoic acid (20-HETE) release, respectively. The study mainly uses brain slices and pharmacological tools in combination with Emx1Cre; Ai32 transgenic mice expressing the H134R variant of channelrhodopsin-2 (ChR2) in the cortical glutamatergic neurons for precise photoactivation. Stimulation with 470 nm light using 10-second trains of 5-ms pulses at frequencies from 1-20 Hz revealed small constrictions at 10 Hz and robust constrictions at 20 Hz, which were abolished by TTX and partially inhibited by a cocktail of glutamate receptor antagonists. Inhibition of cyclooxygenase-1 (COX-1) or -2 (COX-2) by indomethacin blocked the constriction both ex vivo (slices) and in vivo (pial artery), and inhibition of EP1 and EP3 showed the same effect ex vivo. Single-cell RT-PCR from patched neurons confirmed the presence of the PGE2 synthesis pathway.

      While the data are convincing, the overall experimental setting presents some limitations. How is the activation protocol comparable to physiological firing frequency? 

      As also suggested by Reviewer #1 we have now discussed more extensively the physiological relevance of our observations (lines 422-434 and 436-439).

      The delay (minutes) between the stimulation and the constriction appears contradictory to the proposed pathway, which would be expected to occur rapidly. The experiments are conducted in the absence of vascular "tone," which further questions the significance of the findings. 

      The slow kinetics observed ex vivo are probably due to the low recording temperature and the absence of pharmacologically induced vascular tone, as already discussed (lines 312-317). Furthermore, as recommended by reviewer #1, we have presented the advantages and limitations of ex vivo and in vivo approaches (lines 52-64).

      Some of the targets investigated are expressed by multiple cell types, which makes the interpretation difficult; for example, cyclooxygenases are also expressed by endothelial cells.

      Under normal conditions, endothelial cells only express COX-1 and barely COX-2, whose expression is essentially observed in pyramidal cells (see Tasic et al. 2016, Zeisel et al. 2015, Lacroix et al., 2015). As pointed out by Reviewer # 1, our ex vivo pharmacological data clearly indicate that vasoconstriction is mostly due to COX-2 activity, and to a much lesser extent to COX-1. Since it is well established that the previously described vascular effects of pyramidal cells are essentially mediated by COX-2 activity (Iadecola et al., 2000; Lecrux et al., 2011; Lacroix et al., 2015), we are quite confident that vasoconstriction described here is mainly due COX-2 activity of pyramidal cells.

      Finally, how is the complete inhibition of the constriction by the NPY Y1 receptor antagonist BIBP3226 consistent with a direct effect of PGE2 and 20-HETE in arterioles? 

      We agree with both reviewers that the complete blockade of the constriction by the NPY Y1 receptor antagonist BIBP3226 needs to be more carefully discussed. We have now included in the discussion the possible involvement of Y1 receptors in pyramidal cells, which could promote glutamate release and possibly COX-2, thereby contributing to PGE2 and 20-HETE signaling (lines 402-409).

      Overall, the manuscript is well-written with clear data, but the interpretation and physiological relevance have some limitations. However, vasoconstriction is a rather understudied phenomenon in neurovascular coupling, and the present findings may be of significance in the context of pathological brain hypoperfusion.

      We thank the reviewer for his/her comment and suggestions, which have helped us to improve our manuscript.

      Recommendations for the authors:

      Reviewer #1 (Recommendations for the authors):

      Methods:

      It is not clear if brain slices (or animals) underwent one, two, or several optogenetic stimulations - especially for experiments where 'control' is compared to 'treated' - does this data come from the same vessels (before and after treatment) or from two independent groups of vessels? If repeated stimulations are performed, do these repeated stimulations cause the same vascular response?

      As indicated in the Materials and Methods section, line 543: “Only one arteriole was monitored per slice” implies that the comparisons between the ‘control’ and ‘treated’ groups were made from independent groups of vessels. To clarify this point, we have added “receiving a single optogenetic or pharmacological stimulation” to this sentence lines 543-544.

      For in vivo experiments, animals underwent 10-20 optogenetic stimulations with a 5-minute interstimulus interval during an experiment lasting 2 hours for maximum. Trials from the same vessel were averaged (with a 0.1 s interpolation) for analysis, and the mean per vessels is presented in the graphics.

      Figure 2:

      Can the authors speculate about the cause for the slow increase in indicator fluorescence from minute 1.5 onward, which seems dependent on stimulation frequency? Is this increase also present when slices from a ChR2-negative animal undergo the same stimulation paradigm?

      Rhod2 was delivered by the patch pipette as indicated in the Materials and Methods section (line 514). Although a period of “at least 15 min after passing in whole-cell configuration to allow for somatic diffusion of the dye” (line 551-552) was observed, this single-wavelength Ca2+ indicator likely continued to diffuse into the cells during the optical recording thereby, inducing a slight increase in delta F/F0, which is consistent with the positive slopes of the mean fluorescence changes observed during the 30-s control baseline (Fig. 2b).

      Figure 4: Why did the authors include panel a) here? Also, do the authors observe that cells with different COX-1 or -2 expression profiles show different (electrical, morphological) properties?

      The purpose of panel a) in Fig. 4 was to ensure the regular spiking electrophysiological phenotype of the pyramidal neurons whose cytoplasm was harvested for subsequent RT-PCR analysis. Despite our efforts, we found no difference in the 32 electrophysiological features between COX-1 or COX-2 positive and negative cells. This is now clearly stated in the result section (lines 210-212) and a supplementary table of electrophysiological features is now provided. Because it is difficult to determine the morphology of neurons analyzed by single-cell RT-PCR (Devienne et al. 2018), these cells were not processed for biocytin labeling.

      Figure 5: (1) Maybe the authors could highlight panels b-f as in vivo experiments to emphasize that these are in-vivo observations while the other experiments (especially panels g, h) are made in slices? 

      We thank the reviewer for this suggestion. A black frame is now depicted in Figure 5 to emphasize in vivo experiments.

      (2) What is the power of the optogenetic stimulus in this experiment? 

      The power of the optogenetic stimulus was 38 mW/mm<sup>2</sup> in ex vivo experiments (see Line 527). For in vivo experiments, 1 mW pulses of 5 ms were used, the intensity being measured at the fiber end. We now provide the information for in vivo experiments in the Methods lines 639-640.

      (3) Experiments were performed with Fluorescein-Dextran at 920-nm excitation which would overlap with EYFP fluorescence from the ChR2-EYFP transgene. Did the authors encounter any issues with crosstalk between the two labels? 

      Crosstalk between EYFP and fluorescein fluorescence was indeed an issue. This is why arterioles were monitored at the pial level to avoid fluorescence contamination from the cortical parenchyma. Because of the perivascular space around pial arterioles, it was possible to measure vessel diameter without pollution for the parenchyma (see Author response image 1 below). To clarify this point we added the statement “which are not compromised by the fluorescence from the ChR2-EYFP transgene in the parenchyma (Madisen et al. 2012),” Line 628-629. Note that line scan acquisitions without photoactivation stimulation did not trigger any progressive change in the vessel size or resting fluorescence.

      Author response image 1.

      Example of a pial arteriole filled with fluorescein dextran (cyan) in an Emx1-EYFP mouse (parenchyma labeled with YFP, in cyan). The red line represents a line scan to record the change in diameter. Due to the perivascular space surrounding the arterioles, the vessel walls are clearly identified and separated from the fluorescent parenchyma.

      (4) Could the authors potentially extend the time course in panel e) to show the recovery of the preparation to the baseline? 

      Because arterioles were only monitored for a 40-s period during a session of optogenetic stimulation/imaging we cannot extend panel e. Nonetheless, a 5 minutes interstimulus interval was observed to allow the full recovery of the preparation to the baseline. This now clarified line 640. Of note, the arteriole shown in panel d before indomethacin treatment fully recovered to baseline after this treatment.

      Also, did the authors observe any 'abnormal' behavior of the vasculature after stimulation, such as large-amplitude oscillations? (5) 

      We did not specifically investigate resting state oscillations, such as vasomotion, but the 10-s long baseline recording for each measurement indicates no long lasting, abnormal and de novo behavior with a frequency higher than 0.1-0.2 Hz.

      Can the authors show in vivo data from control experiments in EYFP-expressing or WT mice that underwent the same stimulation paradigm (Supplementary Figure 1 shows data from brain slices)?

      The reviewer is correct to point out this important control, as optogenetic stimulation can induce a vascular response without channel rhodopsin activation at high power (see our study on the topic, Rungta et al, Nat Com 2017). We therefore tested this potential artefact in a WT mouse using our setup, with different intensities and durations of optogenetic stimulation.

      Author response image 2A shows that stimulations of 10 seconds, 10 Hz, 1 mW, 5 ms pulses, i.e. the conditions we used for the experiments in Emx1 mice, did not induce dilation or constriction. Stimulation for 5 seconds with the same number of pulses, but with a higher power (4 mW), longer duration (20 ms pulses) and at a higher frequency elicited a small dilation in 1 of 2 pial arterioles (Author response image 2B). For this reason, we used only shorter (5ms) and less intense (1 mW) optogenetic stimulation to ensure that the observed dilation was solely due to Emx1 activation and not to light-induced artefactual dilation.

      Author response image 2.

      Optogenetic stimulation in a wild-type mouse. A. No diameter changes upon stimulations of 10 seconds, 10 Hz, 1 mW, 5 ms pulses, i.e. the conditions we used for the experiments in Emx1 mice. B. Stimulation of higher power (4 mW), longer duration (20 ms pulses) and at a higher frequency elicited a small dilation in 1 (grey traces) of 2 pial arterioles.

      Figures 6 and 7: It is surprising that blockade of NPY Y1 receptors leads to a complete loss of the constriction response. As shown in Figure 7, the authors suggest that pyramidal neuron-released PGE2 (and glutamate) initiate several cascades acting on smooth muscle directly (PGE2-EP1/EP3), through astrocytes (Glu/COX-1/PGE2 or 20-HETE), or through NPY interneurons (Glu/NPY/Y1 or PGE2/NPY/Y1). This would imply that COX-1/2 and NPY/Y1 pathways act in series (as discussed by the authors). Besides the potential effects on NPY release mentioned in the discussion, could the authors comment if both (NPY and PGE2) pathways need to be co-activated in smooth muscle cells to cause constriction?

      We thank the reviewer for raising this surprising complete loss of vasoconstriction by Y1 antagonism, despite the contribution of other vasoconstrictive pathways. We now discuss (lines 402-409) the possibility that activation of the neuronal Y1 receptors in pyramidal cells may also have contributed to the vasoconstriction by promoting glutamate and possibly PGE2 release. The combined activation of vascular and neuronal Y1 receptors may explain the complete blockage of optogenetically induced vasoconstriction by BIBP3226.

      Reviewer #2 (Recommendations for the authors):

      The complete block of the constriction by BIBP3226 needs to be carefully considered.

      We thank the reviewer for stressing this point also raised by Reviewer #1. As mentioned above we now discuss (lines 402-409) the possibility that activation of the neuronal Y1 receptors in pyramidal cells may also have contributed to the vasoconstriction by promoting glutamate and possibly PGE2 release. The combined activation of vascular and neuronal Y1 receptors may explain the complete blockage of optogenetically induced vasoconstriction by BIBP3226.

    1. Author response:

      The following is the authors’ response to the original reviews.

      Public Reviews:

      Reviewer #1 (Public Review):

      Summary of what the authors were trying to achieve:

      In this manuscript, the authors investigated the role of β-CTF on synaptic function and memory. They report that β-CTF can trigger the loss of synapses in neurons that were transiently transfected in cultured hippocampal slices and that this synapse loss occurs independently of Aβ. They confirmed previous research (Kim et al, Molecular Psychiatry, 2016) that β-CTF-induced cellular toxicity occurs through a mechanism involving a hexapeptide domain (YENPTY) in β-CTF that induces endosomal dysfunction. Although the current study also explores the role of β-CTF in synaptic and memory function in the brain using mice chronically expressing β-CTF, the studies are inconclusive because potential effects of Aβ generated by γ-secretase cleavage of β-CTF were not considered. Based on their findings, the authors suggest developing therapies to treat Alzheimer's disease by targeting β-CTF, but did not address the lack of clinical improvement in trials of several different BACE1 inhibitors, which target β-CTF by preventing its formation.

      We would like to thank the reviewer for his/her suggestions. We have addressed the specific comments in following sections.

      Major strengths and weaknesses of the methods and results:

      The conclusions of the in vitro experiments using cultured hippocampal slices were well supported by the data, but aspects of the in vivo experiments and proteomic studies need additional clarification.

      (1) In contrast to the in vitro experiments in which a γ-secretase inhibitor was used to exclude possible effects of Aβ, this possibility was not examined in in-vivo experiments assessing synapse loss and function (Figure 3) and cognitive function (Figure 4). The absence of plaque formation (Figure 4B) is not sufficient to exclude the possibility that Aβ is involved. The potential involvement of Aβ is an important consideration given the 4-month duration of protein expression in the in vivo studies.

      We appreciate the reviewer for raising this question. While our current data did not exclude the potential involvement of Aβ-induced toxicity in the synaptic and cognitive dysfunction observed in mice overexpressing β-CTF, addressing this directly remains challenging. Treatment with γ-secretase inhibitors could potentially shed light on this issue. However, treatments with γ-secretase inhibitors are known to lead to brain dysfunction by itself likely due to its blockade of the γ-cleavage of other essential molecules, such as Notch[1, 2]. Therefore, this approach is unlikely to provide a clear answer, which prevents us from pursuing it further experimentally in vivo. We hope the reviewer understands this limitation. We have included additional discussion (page 14 of the revised manuscript) to highlight this question.

      (2) The possibility that the results of the proteomic studies conducted in primary cultured hippocampal neurons depend in part on Aβ was also not taken into consideration.

      We thank the reviewer for raising this question. In the revised manuscript, we examined the protein levels of synaptic proteins after treatment with γ-secretase inhibitors and found that the levels of certain synaptic proteins were further reduced in neurons expressing β-CTF (Supplementary figure 5A-B). These results do not support Aβ as a major contributor of the proteomic changes induced by β-CTF.

      Likely impact of the work on the field, and the utility of the methods and data to the community:

      The authors' use of sparse expression to examine the role of β-CTF on spine loss could be a useful general tool for examining synapses in brain tissue.

      We thank the reviewer for these comments.

      Additional context that might help readers interpret or understand the significance of the work:

      The discovery of BACE1 stimulated an international effort to develop BACE1 inhibitors to treat Alzheimer's disease. BACE1 inhibitors block the formation of β-CTF which, in turn, prevents the formation of Aβ and other fragments. Unfortunately, BACE1 inhibitors not only did not improve cognition in patients with Alzheimer's disease, they appeared to worsen it, suggesting that producing β-CTF actually facilitates learning and memory. Therefore, it seems unlikely that the disruptive effects of β-CTF on endosomes plays a significant role in human disease. Insights from the authors that shed further light on this issue would be welcome.

      Response: We would like to express our gratitude to the reviewer for raising this question. It remains puzzling why BACE1 inhibition has failed to yield benefits in AD patients, while amyloid clearance via Aβ antibodies are able to slow down disease progression. One possible explanation is that pharmacological inhibition of BACE1 may not be as effective as its genetic removal. Indeed, genetic depletion of BACE1 leads to the clearance of existing amyloid plaques[3], whereas its pharmacological inhibition prevents the formation of new plaques but does not deplete the existing ones[4]. We think the negative results of BACE1 inhibitors in clinical trials may not be sufficient to rule out the potential contribution of β-CTF to AD pathogenesis. Given that cognitive function continues to deteriorate rapidly in plaque-free patients after 1.5 years of treatment with Aβ antibodies in phase three clinical studies[5], it is important to consider the potential role of other Aβ-related fragments in AD pathogenesis, such as β-CTF. We included further discussion in the revised manuscript (page 15 of the revised manuscript) to discusss this question.

      Reviewer #2 (Public Review):

      Summary:

      In this study, the authors investigate the potential role of other cleavage products of amyloid precursor protein (APP) in neurodegeneration. They combine in vitro and in vivo experiments, revealing that β-CTF, a product cleaved by BACE1, promotes synaptic loss independently of Aβ. Furthermore, they suggest that β-CTF may interact with Rab5, leading to endosomal dysfunction and contributing to the loss of synaptic proteins.

      We would like to thank the reviewer for his/her suggestions. We have addressed the specific comments in following sections.

      Weaknesses:

      Most experiments were conducted in vitro using overexpressed β-CTF. Additionally, the study does not elucidate the mechanisms by which β-CTF disrupts endosomal function and induces synaptic degeneration.

      We would like to thank the reviewer for this comment. While a significant portion of our experiments were conducted in vitro, the main findings were also confirmed in vivo (Figure 3 and 4). Repeating all the experiments in vivo would be challenging and may not be possible because of technical difficulties. Regarding the use of overexpressed β-CTF, we acknowledge that this represents a common limitation in neurodegenerative disease studies. These diseases progress slowly over decades in patients. To model this progression in cell or mouse models within a time frame feasible for research, overexpression of certain proteins is often inevitable. Since β-CTF levels are elevated in AD patients[6], its overexpression is not a irrelevant approach to investigate its potential effects.

      We did not further investigate the mechanisms by which β-CTF disrupted endosomal function because our preliminary results align with previous findings that could explain its mechanism. Kim et al. demonstrated that β-CTF recruits APPL1 (a Rab5 effector) via the YENPTY motif to Rab5 endosomes, where it stabilizes active GTP-Rab5, leading to pathologically accelerated endocytosis, endosome swelling and selectively impaired transport of Rab5 endosomes[6]. However, this paper did not show whether this Rab5 overactivation-induced endosomal dysfunction leads to any damages in synapses. In our study, we observed that co-expression of Rab5<sub>S34N</sub> with β-CTF effectively mitigated β-CTF-induced spine loss in hippocampal slice cultures (Figures 6L-M), indicating that Rab5 overactivation-induced endosomal dysfunction contributed to β-CTF-induced spine loss. We included further discussion in the revised manuscript to clarify this (page 15 of the revised manuscript).

      Reviewer #3 (Public Review):

      Summary:

      Most previous studies have focused on the contributions of Abeta and amyloid plaques in the neuronal degeneration associated with Alzheimer's disease, especially in the context of impaired synaptic transmission and plasticity which underlies the impaired cognitive functions, a hallmark in AD. But processes independent of Abeta and plaques are much less explored, and to some extent, the contributions of these processes are less well understood. Luo et all addressed this important question with an array of approaches, and their findings generally support the contribution of beta-CTF-dependent but non-Abeta-dependent process to the impaired synaptic properties in the neurons. Interestingly, the above process appears to operate in a cell-autonomous manner. This cell-autonomous effect of beta-CTF as reported here may facilitate our understanding of some potentially important cellular processes related to neurodegeneration. Although these findings are valuable, it is key to understand the probability of this process occurring in a more natural condition, such as when this process occurs in many neurons at the same time. This will put the authors' findings into a context for a better understanding of their contribution to either physiological or pathological processes, such as Alzheimer's. The experiments and results using the cell system are quite solid, but the in vivo results are incomplete and hence less convincing (see below). The mechanistic analysis is interesting but primitive and does not add much more weight to the significance. Hence, further efforts from the authors are required to clarify and solidify their results, in order to provide a complete picture and support for the authors' conclusions.

      We would like to thank the reviewer for the suggestions. We have addressed the specific comments in following sections.

      Strengths:

      (1) The authors have addressed an interesting and potentially important question

      (2) The analysis using the cell system is solid and provides strong support for the authors' major conclusions. This analysis has used various technical approaches to support the authors' conclusions from different aspects and most of these results are consistent with each other.

      We would like to thank the reviewer for these comments.

      Weaknesses:

      (1) The relevance of the authors' major findings to the pathology, especially the Abeta-dependent processes is less clear, and hence the importance of these findings may be limited.

      We would like to thank the reviewer for this question. Phase 3 clinical trial data from Aβ antibodies show that cognitive function continues to decline rapidly, even in plaque-free patients, after 1.5 years of treatment[5]. This suggests that plaque-independent mechanisms may drive AD progression. Therefore, it is crucial to consider the potential contributions of other Aβ species or related fragments, such as alternative forms of Aβ and β-CTF. While it is early to predict how much β-CTF contributes to AD progression, it is notable that β-CTF induced synaptic deficits in mice, which recapitulates a key pathological feature of AD. Ultimately, the contribution of β-CTF in AD pathogenesis can only be tested through clinical studies in the future.

      (2) In vivo analysis is incomplete, with certain caveats in the experimental procedures and some of the results need to be further explored to confirm the findings.

      We would like to thank the reviewer for this suggestion. We have corrected these caveats in the revised manuscript.

      (3) The mechanistic analysis is rather primitive and does not add further significance.

      We would like to thank the reviewer for this comment. We did not delve further into the underlying mechanisms because our analysis indicates that Rab5 overactivation-induced endosomal dysfunction underlies β-CTF-induced synaptic dysfunction, which is consistent with another study and has been addressed in our study[6]. We hope the reviewer could understand that our focus in this paper is on how β-CTF triggers synaptic deficits, which is why we did not investigate the mechanisms of β-CTF-induced endosomal dysfunction further.

      Recommendations for the authors:

      Reviewer #1 (Recommendations For The Authors):

      Suggestions for improved or additional experiments, data, or analyses:

      (1) In Figures 4H, 4J, 4K and Supplemental Figures 3C, 3E, and 3G, it was unclear whether a repeated measures 2-way ANOVA, rather than a 2-way ANOVA, followed by appropriate post-hoc analyses was used to strengthen the conclusion that there were significant effects in the behavioral tests.

      We appreciate the reviewer for raising this point and apologize for the lack of clear description in the manuscript. In those figures mentioned above, we use a repeated measures 2-way ANOVA to analyze the data by Graphpad Prism. In Figure 4H, fear conditioning tests were conducted. The same cohort of mice were used in the baseline, contextual and cued tests. Firstly, baseline freezing was tested; then these mice underwent tone and foot shock training, followed by contextual test and cued test. So, a repeated measures 2-way ANOVA is more appropriate for the experiment.

      In water T maze tests (Figure 4J and K), the same cohort of mice were trained and tested each day. So, it’s also appropriate to use a repeated measures 2-way ANOVA.

      In Supplementary figure 3C, 3E and 3G, OFT was conducted. In this experiment, the locomotion of the same cohort of mice were recorded. Also, it’s appropriate to use a repeated measures 2-way ANOVA.

      Clearer description for these experiments has been provided in the revised manuscript.

      (2) Including gender analyses would be helpful.

      The mice we used in this study were all males.

      Minor corrections to text and figures:

      (1) Quantitative analyses in Figures 5A-C, 5H, 6G, 6H, and Supplementary Figures 4 and 5C would be helpful.

      We have provided quantitative analysis of these results (Figure 5D, 5J, 6K, Supplementary figure 4D, 5F) mentioned above in the revised manuscript.

      (2) Percent correct (%) in Figures 4J and 4K should be labeled as 0, 50, and 100 instead of 0.0, 0.5, and 1.0.

      We would like to thank the reviewer for pointing out this. We have made corrections in the revised manuscript.

      Reviewer #2 (Recommendations For The Authors):

      In the study conducted by Luo et al, it was observed that the fragment of amyloid precursor protein (APP) cleaved by beta-site amyloid precursor protein cleaving enzyme 1 (BACE1), known as β-CTF, plays a crucial role in synaptic damage. The study found increasing expression of β-CTF in neurons could induce synapse loss both in vitro and in vivo, independent of Aβ. Mechanistically, they explored how β-CTF could interfere with the endosome system by interacting with RAB5. While this study is intriguing, there are several points that warrant further investigation:

      (1) The study involved overexpressing β-CTF in neurons. It would be valuable to know if the levels of β-CTF are similarly increased in Alzheimer's disease (AD) patients or AD mouse models.

      We would like to thank the reviewer for the suggestion. It’s reported β-CTF levels were significantly elevated in the AD cerebral cortex[6]. Most AD mouse models are human APP transgenic mouse models with elevated β-CTF levels[7].

      (2) The study noted that β-CTF in neurons is a membranal fragment, but the overexpressed β-CTF was not located in the membrane. It is important to ascertain whether the membranal β-CTF and cytoplasmic β-CTF lead to synapse loss in a similar manner.

      We apologize for not clearly explaining the localization of β-CTF in the original manuscript. β-CTF is produced from APP through β-cleavage, a process that occurs in organelles such as endo-lysosomes[8]. The overexpressed β-CTF is also primarily localized in the endo-lysosomal systems (Figure 5C and Supplementary figure 4C), similar to those generated by APP cleavage.

      (3) The study found a significant decrease in GluA1, a subunit of AMPA receptors, due to β-CTF. It would be beneficial to investigate whether there are systematic alterations in NMDA receptors, including GluN2A and GluN2B.

      We would like to express our gratitude to the reviewer for bringing up this question. The protein levels of GluN2A and GluN2B are also reduced in neurons expressing β-CTF (Figure 6E-F)

      (4) The study showed a significant decrease in the frequency of miniature excitatory postsynaptic currents (mEPSC), indicating disrupted presynaptic vesicle neurotransmitter release. It would be pertinent to test whether the expression level of the presynaptic SNARE complex, which is required for vesicle release, is altered by β-CTF.

      We would like to express our gratitude to the reviewer for bringing up this question. The protein level of the presynaptic SNARE complex, such as VAMP2, is also reduced in neurons expressing β-CTF (Figure 6E, G).

      (5) Since AMPA receptors are glutamate receptors, it is important to determine whether the ability of glutamate release is altered by β-CTF. In vivo studies using a glutamate sensor should be conducted to examine glutamate release.

      We would like to express our gratitude to the reviewer for this suggestion. It will be interesting to use glutamate sensors to assess the ability of glutamate release in the future.

      (6) The quality of immunostaining associated with Figures 4B and 4C was noted to be suboptimal.

      We apologize for the suboptimal quality of these images. The immunostaining in Figures 4B and 4C were captured using the stitching function of a confocal microscope to display larger areas, including the entire hemisphere and hippocampus. We have reprocessed the images to obtain higher-quality versions.

      (7) It would be insightful to investigate whether treatment with a BACE1 inhibitor in the study could reverse synaptic deficits mediated by β-CTF.

      We would like to thank the reviewer for this sggestion. In Figure 1I-M, we constructed an APP mutant (APP<sub>MV</sub>), which cannot be cleaved by BACE1 to produce β-CTF and Aβ but has no impact on β’-cleavage. When co-expressed with BACE1, APP<sub>MV</sub> failed to induce spine loss, supporting the effect of β-CTF. We think these results domonstrate that β-CTF underlies the synaptic deficits. It would be interesting to test the effects of BACE1 inhibition in the future.

      (8) Considering the potential implications for therapeutics, it is worth exploring whether extremely low levels of β-CTF have beneficial effects in regulating synaptic function or promoting synaptogenesis at a physiological level.

      We would like to thank the reviewer for raising this question. We found that when the plasmid amount was reduced to 1/8 of the original dose, β-CTF no longer induced a decrease in dendritic spine density (Supplementary figure 2E-F). It’s reported APP-Swedish mutation in familial AD increased synapse numbers and synaptic transmission, whereas inhibition of BACE1 lowered synapse numbers, suppressed synaptic transmission in wild type neurons, suggesting that at physiological level, β-CTF might be synaptogenic[9].

      (9) The molecular mechanism through which β-CTF interferes with Rab5 function should be elucidated.

      We would like to thank the reviewer for raising this question. Kim et al have elucidated the mechanism through which β-CTF interferes with Rab5 function. β-CTF recruited APPL1 (a Rab5 effector) via YENPTY motif to Rab5 endosomes, where it stabilizes active GTP-Rab5, leading to pathologically accelerated endocytosis, endosome swelling and selectively impaired transport of Rab5 endosomes[6]. We have included additional discussion for this question in the revised manuscript (page 15 of the revised manuscript).

      (10) The study could compare the role of β-CTF and Aβ in neurodegeneration in AD mouse models.

      We would like to thank the reviewer for raising this point. While it is easier to dissect the role of Aβ and β-CTF in vitro, some of the critical tools are not applicabe in vivo, such as γ-secretase inhibitors, which lead to severe side effects because of their inhibition on other γ substrates[1, 2]. Therefore it will be difficult to deomonstrate their different roles in vivo. There are studies showing that β-CTF accumulation precedes Aβ deposition in model mice and mediates Aβ independent intracellular pathologies[10, 11], consistent with our results.

      (11) Based on the findings, it would be valuable to discuss possible explanations for the failure of most BACE1 inhibitors in recent clinical trials for humans.

      Response: We would like to express our gratitude to the reviewer for raising this recommendation. It is a big puzzle why BACE1 inhibition failed to provide beneficial effects in AD patients whereas clearance of amyloid by Aβ antibodies could slow down the AD progress. One potential answer is that pharmacological inhibition of BACE1 might be not as effective as its genetic removal. Indeed, genetic depletion of BACE1 leads to clearance of existing amyloid plaques[3], whereas pharmacological inhibition of BACE1 could not stop growth of existing plaques, although it prevents formation of new plaques[4]. The negative result of BACE1 inhibitors might not be sufficient to exclude the possibility that β-CTF could also contribute to the AD pathogenesis. We have included additional discussion for this question in the revised manuscript (page 15 of the revised manuscript).

      Reviewer #3 (Recommendations For The Authors):

      Major:

      (1) The cell experiments were performed at DIV 9, do the authors know whether at this age, the neurons are still developing and spine density has not reached a pleated yet? If so, the observed effect may reflect the impact on development and/or maturation, rather than on the mature neurons. The authors should be more specific about this issue.

      We would like to thank the reviewer for pointing out this question. These slice cultures were made from 1-week-old rats. DIV 9 is about two weeks old. These neurons are still developing and spine density has not reached a plateau yet[12]. In addition, we also investigated the effects of β-CTF on the synapses of mature neurons in two-month-old mice (Figure 3). So we think the observed effect reflects the impact on both immature and mature neurons.

      (2) mEPSCs shown in Figure 3D were of small amplitudes, perhaps also indicating that these synapses are not yet mature.

      In Figure 3D, the mEPSC results were obtained from pyramidal neurons in the CA1 region of two-month-old mice. At the age of two months, neurotransmitter levels and synaptic density have reached adult levels[13].

      (3) There was no data on the spine density or mEPSCs in the mice OE b-CTF, hence it is unclear whether a primary impact of this manipulation (b-CTF effect) on the synaptic transmission still occurs in vivo.

      In Figure 3, we examined the density of dendritic spines and mEPSCs from CA1 pyramidal neurons infected with lentivirus expressing β-CTF in mice and showed that those neurons expressing additional amount of β-CTF exhibited lower spine density and less mEPSCs, supporting that β-CTF also damaged synaptic transmission in vivo.

      (4) OE of b-CTF should lead to the production of Abeta, although this may not lead to the formation of significant plaques. How do the authors know whether their findings on behavioral and cognitive impairments were not largely mediated by Abeta, which has been widely reported by previous studies?

      We would like to thank the reviewer for pointing out this question. Indeed, our in vivo data could not exclude the potential involvement of Aβ in the pathology, despite the absence of amyloid plaque formation. It will be difficult to demonstrate this question in vivo because of the severe side effects from γ inhibition.

      (5) Figure 4H, the freezing level in the cued fear conditioning was very high, likely saturated; this may mask a potential reduction in the b-CTF OE mice (there is a hint for that in the results). The authors should repeat the experiments using less strong footshock strength (hence resulting in less freezing, <70%).

      We would like to express our gratitude to the reviewer for bringing up this question. The contextual fear conditioning test assesses hippocampal function, while the cued fear conditioning test assesses amygdala function. We hope the reviewer understands that our primary goal is to assess hippocampus-related functions in this experiment and we did see a significant difference between GFP and β-CTF groups. Therefore, we think the intensity of footshock we used was suitable to serve the primary purpose of this experiment.

      (6) Why was the deficit in the Morris water maze in the b-CTF OE mice only significant in the training phase?

      We would like to thank the reviewer for rasing this question and apologize for not describing the test clearly. This is a water T maze test, not Morris water maze test.

      To make the behavioral paradigm of the water T maze test easier to understand, we have provided a more detailed description of the methods in the new version of the manuscript.

      The acquisition phase of the Water T Maze (WTM) evaluates spatial learning and memory, where mice use spatial cues in the environment to navigate to a hidden platform and escape from water, while the reversal learning measures cognitive flexibility in which mice must learn a new location of the hidden platform[14]. In reversal learning task (Figure 4J-K), the learning curves of the two groups of mice did not show any significant differences, indicating that the expression of β-CTF only damages spatial learning and memory but not cognitive flexibility. This is consistent with a previous report using APP/PS1 mice[15].

      (7) Will the altered Rab5 in the b-CTF OE condition also affect the level of other proteins?

      We would like to express our gratitude to the reviewer for raising this interesting question.  Expression of Rab5<sub>S34N</sub> in β-CTF-expressing neurons did not alter the levels of synapse-related proteins that were reduced in these neurons (Supplementary figure 5G-H), suggesting Rab5 overactivation did not contribute to these protein expression changes induced by β-CTF.

      (8) How do the authors reconcile their findings with the well-established findings that Abeta affects synaptic transmission and spine density? Do they think these two processes may occur simultaneously in the neurons, or, one process may dominate in the other?

      APP, Aβ, and presenilins have been extensively studied in mouse models, providing convincing evidence that high Aβ concentrations are toxic to synapses[16]. Moreover, addition of Aβ to murine cultured neurons or brain slices is toxic to synapses[17]. However, Aβ-induced synaptotoxicity was not observed in our study. A major difference between our study and others is that our study used a isolated expression system that apply Aβ only to individual neurons surrounded by neurons without excessive amount of Aβ, whereas the rest studies generally apply Aβ to all the neurons. Therefore, we predict that Aβ does not lead to synaptic deficits from individual neurons in cell autonomous manners, whereas β-CTF does. Aβ and β-CTF represent two parallel pathways of action. Additional discussion for this question has been included in the revised manuscript (page 14 of the revised manuscript).

      Minor:

      Fig 2F-G, "prevent" rather than "reverse"?

      We would like to thank the reviewer for pointing this out. We have made corrections in the revised manuscript.

      Reference:

      (1) GüNER G, LICHTENTHALER S F. The substrate repertoire of γ-secretase/presenilin [J]. Seminars in cell & developmental biology, 2020, 105: 27-42.

      (2) DOODY R S, RAMAN R, FARLOW M, et al. A phase 3 trial of semagacestat for treatment of Alzheimer's disease [J]. The New England journal of medicine, 2013, 369(4): 341-50.

      (3) HU X, DAS B, HOU H, et al. BACE1 deletion in the adult mouse reverses preformed amyloid deposition and improves cognitive functions [J]. The Journal of experimental medicine, 2018, 215(3): 927-40.

      (4) PETERS F, SALIHOGLU H, RODRIGUES E, et al. BACE1 inhibition more effectively suppresses initiation than progression of β-amyloid pathology [J]. Acta neuropathologica, 2018, 135(5): 695-710.

      (5) SIMS J R, ZIMMER J A, EVANS C D, et al. Donanemab in Early Symptomatic Alzheimer Disease: The TRAILBLAZER-ALZ 2 Randomized Clinical Trial [J]. Jama, 2023, 330(6): 512-27.

      (6) KIM S, SATO Y, MOHAN P S, et al. Evidence that the rab5 effector APPL1 mediates APP-βCTF-induced dysfunction of endosomes in Down syndrome and Alzheimer's disease [J]. Molecular psychiatry, 2016, 21(5): 707-16.

      (7) MONDRAGóN-RODRíGUEZ S, GU N, MANSEAU F, et al. Alzheimer's Transgenic Model Is Characterized by Very Early Brain Network Alterations and β-CTF Fragment Accumulation: Reversal by β-Secretase Inhibition [J]. Frontiers in cellular neuroscience, 2018, 12: 121.

      (8) ZHANG X, SONG W. The role of APP and BACE1 trafficking in APP processing and amyloid-β generation [J]. Alzheimer's research & therapy, 2013, 5(5): 46.

      (9) ZHOU B, LU J G, SIDDU A, et al. Synaptogenic effect of APP-Swedish mutation in familial Alzheimer's disease [J]. Science translational medicine, 2022, 14(667): eabn9380.

      (10) LAURITZEN I, PARDOSSI-PIQUARD R, BAUER C, et al. The β-secretase-derived C-terminal fragment of βAPP, C99, but not Aβ, is a key contributor to early intraneuronal lesions in triple-transgenic mouse hippocampus [J]. The Journal of neuroscience : the official journal of the Society for Neuroscience, 2012, 32(46): 16243-1655a.

      (11) KAUR G, PAWLIK M, GANDY S E, et al. Lysosomal dysfunction in the brain of a mouse model with intraneuronal accumulation of carboxyl terminal fragments of the amyloid precursor protein [J]. Molecular psychiatry, 2017, 22(7): 981-9.

      (12) HARRIS K M, JENSEN F E, TSAO B. Three-dimensional structure of dendritic spines and synapses in rat hippocampus (CA1) at postnatal day 15 and adult ages: implications for the maturation of synaptic physiology and long-term potentiation [J]. The Journal of neuroscience : the official journal of the Society for Neuroscience, 1992, 12(7): 2685-705.

      (13) SEMPLE B D, BLOMGREN K, GIMLIN K, et al. Brain development in rodents and humans: Identifying benchmarks of maturation and vulnerability to injury across species [J]. Progress in neurobiology, 2013, 106-107: 1-16.

      (14) GUARIGLIA S R, CHADMAN K K. Water T-maze: a useful assay for determination of repetitive behaviors in mice [J]. Journal of neuroscience methods, 2013, 220(1): 24-9.

      (15) ZOU C, MIFFLIN L, HU Z, et al. Reduction of mNAT1/hNAT2 Contributes to Cerebral Endothelial Necroptosis and Aβ Accumulation in Alzheimer's Disease [J]. Cell reports, 2020, 33(10): 108447.

      (16) CHAPMAN P F, WHITE G L, JONES M W, et al. Impaired synaptic plasticity and learning in aged amyloid precursor protein transgenic mice [J]. Nature neuroscience, 1999, 2(3): 271-6.

      (17) WANG Z, JACKSON R J, HONG W, et al. Human Brain-Derived Aβ Oligomers Bind to Synapses and Disrupt Synaptic Activity in a Manner That Requires APP [J]. The Journal of neuroscience : the official journal of the Society for Neuroscience, 2017, 37(49): 11947-66.

    1. Author response:

      The following is the authors’ response to the current reviews.

      Recommendations for the authors:

      Reviewer #1 (Recommendations for the authors):

      A number of modifications/additions have been made to the text which help to clarify the background and details of the study and I feel have improved the study.

      NAD deficiency induced using the dietary/Haao null model showed a window of susceptibility at E7.5-10.5. Further, HAAO enymze activity data has been added at E11.5 and the minimal HAAO activity in the embryo act E11.5 supports the hypothesis that the NAD synthesis pathway from kynurenine is not functional until the liver starts to develop.

      The caveat to this is that absence of expression/activity in embryonic cells at E7.5-10/5 relies on previous scRNA-seq data. Both reviewers commented that analysis of RNA and/or protein expression at these stages (E7.5-10.5) would be necessary to rule this out, and would strongly support the conclusions regarding the necessity for yolk sac activity.

      There are a number of antibodies for HAAO, KNYU etc so it is surprising if none of these are specific for the mouse proteins, while an alternative approach in situ hydridisation would also be possible.

      We have tested 2 anti-HAAO antibodies, 2 anti-KYNU antibodies and 1 anti-QPRT antibody on adult liver and various embryonic tissues.

      Given that all tested antibodies only detected a specific band in tissues with very high expression and abundant target protein levels (adult liver), they were determined to be unsuitable to conclusively prove that these proteins of the NAD _de novo_synthesis pathway are absent in embryos prior to the development of a functional liver. They were also unsuitable for IHC experiments to determine which cell types (if any) have these proteins.

      The antibodies, tested assays and samples, and the results obtained were as follows:

      Anti-HAAO antibody (ab106436, Abcam, UK) 

      • Was tested in western blots of liver, E11.5-E14.5 yolk sac, E14.5 placenta, and E14.5 and E16.5 embryonic liver lysates from wild-type (WT) and Haao-/- mice. The target band (32.5 KD) was visible in the WT liver samples and absent in_Haao_-/- livers, and faintly visible in E11.5-E14.5 WT yolk sac, with intensity gradually increasing in E12.5 and E13.5 WT yolk sac. Multiple strong non-specific bands occurred in all samples, requiring cutting off the >50 KD area of the blots.

      • Was re-tested in western blots comparing WT, Haao-/-, and Kynu-/- E9.5-E11.5 embryo, E9.5 yolk sac, and adult liver tissues. It detected the target band faintly only in WT and Kynu-/- liver lysates. No target band could be resolved in E9.5 yolk sac or embryo lysates. Due to the low sensitivity of the antibody, it is unsuitable to conclusively determine whether HAAO is present or absent in E9.5 yolk sacs and E9.5-E11.5 embryos.

      • Was tested in IHC with DAB and IF, producing non-specific staining on both WT and Haao-/- liver and kidney tissue. 

      Anti-HAAO antibody (NBP1-77361, Novus Biologicals, LLC, CO, USA)

      • Was tested in western blots and detected a very faint target band in WT liver lysate that was absent in Haao-/- lysate, with stronger non-specific bands occurring in both genotypes.

      • Was tested in IHC with DAB, producing non-specific staining on both WT and Haao-/- liver and kidney tissue 

      Anti-L-Kynurenine Hydrolase antibody (11796-1-AP, Proteintech Group, IL, USA)

      • Was tested in western blots and detected a faint target band (52 KD) in E11.5, E12.5 E13.5, and E14.5 yolk sac lysates. Detected a weak band in E14.5 liver, a stronger band in E16.5 liver, but not in E14.5 placenta. The target band was only resolved with normal ECL substrate and extended exposure when the >75 KD part of the blot was cut off. 

      • Was re-tested in western blots comparing WT, Haao-/-, and Kynu-/- E9.5-E11.5 embryo, E9.5 yolk sac, and adult liver tissues. It detected the target band only in WT and Haao-/- liver lysates, requiring Ultra Sensitive Substrate. No target band could be resolved in yolk sac or embryo lysates of any genotype.

      Anti-L-Kynurenine Hydrolase antibody (ab236980, Abcam, UK)

      • Was tested in western blots and detected a very faint target band (52 KD) in WT liver lysates and no band in Kynu-/- liver lysates. Multiple non-specific bands occurred irrespective of the Kynu genotype of the lysate.

      • Was tested in IHC with DAB and IF, producing non-specific staining on both WT and Kynu-/- liver and kidney tissue 

      Anti-QPRT (orb317756, Biorbyt, NC, USA)

      • Was tested in western blots and detected a faint target band (31 KD) with multiple other bands between 25-75 KD and an extremely strong band around 150 KD on WT liver lysates.

      The following is the authors’ response to the original reviews.

      Reviewer 1 Public Review:

      The current dietary study narrows the period when deficiency can cause malformations (analysed at E18.5), and altered metabolite profiles (eg, increased 3HAA, lower NAD) are detected in the yolk sac and embryo at E10.5. However, without analysis of embryos at later stages in this experiment it is not known how long is needed for NAD synthesis to be recovered - and therefore until when the period of exposure to insufficient NAD lasts. This information would inform the understanding of the developmental origin of the observed defects.

      Our previous published work (Cuny et al 2023 https://doi.org/10.1242/dmm.049647) indicates that the timing of NAD de novo synthesis pathway precursor availability and consequently the timing of NAD deficiency during organogenesis drives which organs are affected in their development. Furthermore, experimental data of another project (manuscript submitted) shows that mouse embryos (from mothers on an NAD precursor restricted diet that induces CNDD) were NAD deficient at E9.5 and E11.5, but embryo NAD levels were fully recovered at E14.5 when compared to same-stage embryos from mothers on precursor-sufficient diet. This was observed irrespective of the embryos’ Haao genotype. In the current study, NAD precursor provision was only restricted until E10.5. Thus, we expect that our embryos phenotyped at E18.5 had recovered their NAD levels back to normal by E14.5 at the latest.  More research, beyond the scope of the current manuscript, is required to spatio-temporally link embryonic NAD deficiency to the occurrence of specific defect types and elucidate the mechanistic origin of the defects. To acknowledge this, we updated the respective Discussion paragraph on page 7 and added the following statement: “This observation supports our hypothesis that the timing of NAD deficiency during organogenesis determines which organs/tissues are affected (Cuny et al., 2023), but more research is needed to fully characterise the onset and duration of embryonic NAD deficiency in dietary NAD precursor restriction mouse models.”

      More importantly, there is still a question of whether in addition to the yolk sac, there is HAAO activity within the embryo itself prior to E12.5 (when it has first been assayed in the liver - Figure 1C). The prediction is that within the conceptus (embryo, chorioallantoic placenta, and visceral yok sac) the embryo is unlikely to be the site of NAD synthesis prior to liver development. Reanalysis of scRNA-seq (Fig 1B) shows expression of all the enzymes of the kynurenine pathway from E9.5 onwards. However, the expression of another available dataset at E10.5 (Fig S3) suggested that expression is 'negligible'. While the expression in Figure 1B, Figure S1 is weak this creates a lack of clarity about the possible expression of HAAO in the hepatocyte lineage, or especially elsewhere in the embryo prior to E10.5 (corresponding to the period when the authors have demonstrated that de novo NAD synthesis in the conceptus is needed). Given these questions, a direct analysis of RNA and/or protein expression in the embryos at E7.5-10.5 would be helpful. 

      We now have included additional data showing that whole embryos at E11.5 and embryos with their livers removed at E14.5 have negligible HAAO enzyme activity. The observed lack of HAAO activity in the embryo at E11.5 is consistent with the absence of a functional embryonic liver at that stage. Thus, it confirms that the embryo is dependent of extraembryonic tissues (the yolk sac) for NAD de novo synthesis prior to E12.5. The additional datasets are now included in Supplementary Table S1 and as Supplementary Figure 2. The Results section on page 2 has been updated to refer to these datasets.

      Reviewer #2 (Public Review): 

      Page 4 and Table S4. The descriptors for malformations of organs such as the kidney and vertebrae are quite vague and uninformative. More specific details are required to convey the type and range of anomalies observed as a consequence of NAD deficiency. 

      We now provide more information about the malformation types in the Results on page 4. Also, Table S4 now defines the missing vertebral, sternum, and kidney descriptors.

      Can the authors define whether the role of the NAD pathway in a couple of tissue or organ systems is the same? By this I mean is the molecular or cellular effect of NAD deficiency is the same in the vertebrae and organs such as the kidney. What unifies the effects on these specific tissues and organs and are all tissues and organs affected? If some are not, can the authors explain why they escape the need for the NAD pathway? 

      This is a good comment, highlighting that further research, beyond the scope of this manuscript, is needed to better understand the underlying mechanisms of CNDD causation. We have expanded the Discussion paragraph “NAD deficiency in early organogenesis is sufficient to cause CNDD” to indicate that while the timing of NAD deficiency during embryogenesis explains variability in phenotypes among the CNDD spectrum, it is unknown why other organs/tissues are seemingly not affected by NAD deficiency.

      To answer the reviewer’s questions and elucidate the underlying cellular and molecular processes in individual organs affected by NAD deficiency, a multiomic approach is required. This is because NAD is involved in hundreds of molecular and cellular processes affecting gene expression, protein levels, metabolism, etc. For details of NAD functions that have relevance to embryogenesis, the reviewer may refer to our recent review article (Dunwoodie et al 2023 https://doi.org/10.1089/ars.2023.0349). 

      Page 5 and Figure 6C. The expectation and conclusion for whether specific genes are expressed in particular cell types in scRNA-seq datasets depend on the number of cells sequenced, the technology (methodology) used, the depth of sequencing, and also the resolution of the analysis. It is therefore essential to perform secondary validation of the analysis of scRNA-seq data. At a minimum, the authors should perform in situ hybridization or immunostaining for Tdo2, Afmid, Kmo, Kynu, Haao, Qprt, and Nadsyn1 or some combination thereof at multiple time points during early mouse embryogenesis to truly understand the spatiotemporal dynamics of expression and NAD synthesis. 

      We have tested antibodies against HAAO, KYNU, and QPRT in adult mouse liver samples (the main site of NAD de novo synthesis) but these produced non-specific bands in western blotting experiments. Therefore, immunostaining studies on embryonic tissues were not feasible. 

      However, we agree that histological methods such as in situ hybridisation would provide secondary validation of the exact cell types that express these genes. To acknowledge this, we have updated a sentence on page 5 referring to the data shown in Figure 6C as follows: “While histological methods such as in situ hybridisation would be required to confirm the exact cell types expressing these genes, the available expression data indicates that the genes encoding those enzymes required to convert L-kynurenine to NAD (kynurenine pathway) are exclusively expressed in the yolk sac endoderm lineage from the onset of organogenesis (E8.0-8.5).”

      Absolute functional proof of the yolk sac endoderm as being essential and required for NAD synthesis in the context of CNDD might require conditional deletion of Haao in the yolk sac versus embryo using appropriate Cre driver lines or in the absence of a conditional allele, could be performed by tetraploid embryo-ES cell complementation approaches. But temporal dietary intervention can also approximate the same thing by perturbing NAD synthesis Shen the yolk sac is the primary source versus when the liver becomes the primary source in the embryo. 

      Reviewer 1 has made a similar comment about confirming that indeed NAD de novo synthesis activity is limited to extraembryonic tissues (=yolk sacs) and absent in the embryo prior to development of an embryonic liver. We now have included additional data showing that whole embryos at E11.5 and embryos with their livers removed at E14.5 have negligible HAAO enzyme activity. The observed lack of HAAO activity in the embryo at E11.5 is consistent with the absence of a functional embryonic liver at that stage. We think this provides enough proof that the embryo is dependent of extraembryonic tissues (the yolk sac) for NAD de novo synthesis prior to E12.5. The additional datasets are now included in Supplementary Table S1 and as Supplementary Figure 2. The Results section on page 2 has been updated to refer to these data.

      Reviewer #1 (Recommendations For The Authors): 

      (1) Introduction (page 1) introduces mouse models with defects in the kynurenine pathway "confirming that NAD de novo synthesis is required during embryogenesis ...". This requirement is revealed by the imposition of maternal dietary deficiency and more detail (or a more clear link to the following sentences) here would help the reader who is not familiar with the previous papers using the HAAO mice and dietary modulation.

      We have updated this paragraph in the Introduction to better indicate that the requirement of NAD de novo synthesis for embryogenesis was confirmed in mouse models by modulating the maternal dietary NAD precursor provision during pregnancy.

      (2) Discussion - throughout the introduction and results the authors refer to the NAD de novo synthesis pathway, with the study focussing on the effects of HAAO loss of function. Data implies that the kynurenine pathway is active in the yolk sac but whether de novo synthesis from L-tryptophan occurs has not been addressed. The first sub-heading of the discussion could be more accurate referring to the kynurenine pathway, or synthesis from kynurenine. 

      We agree that our manuscript needed to make better distinction between NAD de novo synthesis starting from kynurenine and starting from tryptophan. We removed “from Ltryptophan” from the sub-heading in the Discussion and clarified in this paragraph which genes are required to convert tryptophan to kynurenine and which genes to convert kynurenine to NAD. We also updated two Results paragraphs (page 2, 2nd paragraph; page 5, 5th paragraph) to improve clarity.

      It is worth noting that our statement in the Discussion “this is the first demonstration of NAD de novo synthesis occurring in a tissue outside of the liver and kidney.” is valid because vascular smooth muscle cells express Tdo2 and in combination with the other requisite genes expressed in endoderm cells, the yolk sac has the capability to synthesise NAD de novo from L-tryptophan.

      (3) Outlook - While this section is designed to be looking ahead to the potential implications of the work, the last section on gene therapy of the yolk sac seems far removed from the paper content and highly speculative. I feel this could detract from the main points of the study and could be removed. 

      We have updated the Outlook paragraph and shortened the final part to “Further research is required to better understand the mechanisms of CNDD causation and of other causes of adverse pregnancy outcomes involving the yolk sac.”

      (4) In Figure 2D it would be useful to label the clusters as the colours in the legend are difficult to match to the heatmap. 

      We now have labelled the clusters with lowercase letters above the heatmap to make it easier to match the clusters in Figure 2D to the colours used for designating tissues and genotypes. These labels are described in the figure’s key and the figure legend.  

      Reviewer #2 (Recommendations For The Authors): 

      Page 4 and Table S4. The descriptors for malformations of organs such as the kidney and vertebrae are quite vague and uninformative. More specific details are required to convey the type and range of anomalies observed as a consequence of NAD deficiency. 

      We now provide more information about the malformation types in the Results on page 4. Also, Table S4 now defines the missing vertebral, sternum, and kidney descriptors.

      Can the authors define whether the role of the NAD pathway in a couple of tissue or organ systems is the same? By this I mean is the molecular or cellular effect of NAD deficiency is the same in the vertebrae and organs such as the kidney. What unifies the effects on these specific tissues and organs and are all tissues and organs affected? If some are not, can the authors explain why they escape the need for the NAD pathway? 

      This is a good comment, highlighting that further research, beyond the scope of this manuscript, is needed to better understand the underlying mechanisms of CNDD causation. We have expanded the Discussion paragraph “NAD deficiency in early organogenesis is sufficient to cause CNDD” to indicate that while the timing of NAD deficiency during embryogenesis explains variability in phenotypes among the CNDD spectrum, it is unknown why other organs/tissues are seemingly not affected by NAD deficiency.

      To answer the reviewer’s questions and elucidate the underlying cellular and molecular processes in individual organs affected by NAD deficiency, a multiomic approach is required. This is because NAD is involved in hundreds of molecular and cellular processes affecting gene expression, protein levels, metabolism, etc. For details of NAD functions that have relevance to embryogenesis, the reviewer may refer to our recent review article (Dunwoodie et al 2023 https://doi.org/10.1089/ars.2023.0349). 

      Page 5 and Figure 6C. The expectation and conclusion for whether specific genes are expressed in particular cell types in scRNA-seq datasets depend on the number of cells sequenced, the technology (methodology) used, the depth of sequencing, and also the resolution of the analysis. It is therefore essential to perform secondary validation of the analysis of scRNA-seq data. At a minimum, the authors should perform in situ hybridization or immunostaining for Tdo2, Afmid, Kmo, Kynu, Haao, Qprt, and Nadsyn1 or some combination thereof at multiple time points during early mouse embryogenesis to truly understand the spatiotemporal dynamics of expression and NAD synthesis. 

      We have tested antibodies against HAAO, KYNU, and QPRT in adult mouse liver samples (the main site of NAD de novo synthesis) but these produced non-specific bands in western blotting experiments. Therefore, immunostaining studies on embryonic tissues were not feasible. 

      However, we agree that histological methods such as in situ hybridisation would provide secondary validation of the exact cell types that express these genes. To acknowledge this, we have updated a sentence on page 5 referring to the data shown in Figure 6C as follows: “While histological methods such as in situ hybridisation would be required to confirm the exact cell types expressing these genes, the available expression data indicates that the genes encoding those enzymes required to convert L-kynurenine to NAD (kynurenine pathway) are exclusively expressed in the yolk sac endoderm lineage from the onset of organogenesis (E8.0-8.5).”

    1. Author response:

      Public Reviews:

      Reviewer #1 (Public review):

      In this paper by Brickwedde et al., the authors observe an increase in posterior alpha when anticipating auditory as opposed to visual targets. The authors also observe an enhancement in both visual and auditory steady-state sensory evoked potentials in anticipation of auditory targets, in correlation with enhanced occipital alpha. The authors conclude that alpha does not reflect inhibition of early sensory processing, but rather orchestrates signal transmission to later stages of the sensory processing stream. However, there are several major concerns that need to be addressed in order to draw this conclusion.

      First, I am not convinced that the frequency tagging method and the associated analyses are adequate for dissociating visual vs auditory steady-state sensory evoked potentials.

      Second, if the authors want to propose a general revision for the function of alpha, it would be important to show that alpha effects in the visual cortex for visual perception are analogous to alpha effects in the auditory cortex for auditory perception.

      Third, the authors propose an alternative function for alpha - that alpha orchestrates signal transmission to later stages of the sensory processing stream. However, the supporting evidence for this alternative function is lacking. I will elaborate on these major concerns below.

      (1) Potential bleed-over across frequencies in the spectral domain is a major concern for all of the results in this paper. The fact that alpha power, 36Hz and 40Hz frequency-tagged amplitude and 4Hz intermodulation frequency power is generally correlated with one another amplifies this concern. The authors are attaching specific meaning to each of these frequencies, but perhaps there is simply a broadband increase in neural activity when anticipating an auditory target compared to a visual target?

      We appreciate the reviewer’s insightful comment regarding the potential bleed-over across frequencies in the spectral domain. We fully acknowledge that the trade-off between temporal and frequency resolution is a challenge, particularly given the proximity of the frequencies we are examining.

      To address this concern, we performed additional analyses to investigate whether there is indeed a broadband increase in neural activity when anticipating an auditory target as compared to a visual target, as opposed to distinct frequency-specific effects. Our results show that the bleed-over between frequencies is minimal and does not significantly affect our findings. Specifically, we repeated the analyses using the same filter and processing steps for the 44 Hz frequency. At this frequency, we did not observe any significant differences between conditions.

      These findings suggest that the effects we report are indeed specific to the 40 Hz frequency band and not due to a general broadband increase in neural activity. We hope this addresses the reviewer’s concern and strengthens the validity of our frequency-specific results.

      Author response image 1.

      Illustration of bleeding over effects over a span of 4 Hz. A, 40 Hz frequency-tagging data over the significant cluster differing between when expecting an auditory versus a visual target (identical to Fig. 9 in the manuscript). B, 44 Hz signal over the same cluster chosen for A. The analysis was identical with the analysis performed in  A, apart from the frequency for the band-pass filter.

      We do, however, not specifically argue against the possibility of a broadband increase when anticipating an auditory compared to a visual target. But even a broadband-increase would directly contradict the alpha inhibition hypothesis, which poses that an increase in alpha completely disengages the whole cortex. We will clarify this point in the revised manuscript.

      (2) Moreover, 36Hz visual and 40Hz auditory signals are expected to be filtered in the neocortex. Applying standard filters and Hilbert transform to estimate sensory evoked potentials appears to rely on huge assumptions that are not fully substantiated in this paper. In Figure 4, 36Hz "visual" and 40Hz "auditory" signals seem largely indistinguishable from one another, suggesting that the analysis failed to fully demix these signals.

      We appreciate the reviewer’s insightful concern regarding the filtering and demixing of the 36 Hz visual and 40 Hz auditory signals, and we share the same reservations about the reliance on standard filters and the Hilbert transform method.

      To address this, we would like to draw attention to Author response image 1, which demonstrates that a 4 Hz difference is sufficient to effectively demix the signals using our chosen filtering and Hilbert transform approach. We believe that the reason the 36 Hz visual and 40 Hz auditory signals show similar topographies lies not in incomplete demixing but rather in the possibility that this condition difference reflects sensory integration, rather than signal contamination.

      This interpretation is further supported by our findings with the intermodulation frequency at 4 Hz, which also suggests cross-modal integration. Furthermore, source localization analysis revealed that the strongest condition differences were observed in the precuneus, an area frequently associated with sensory integration processes. We will expand on this in the discussion section to better clarify this point.

      (3) The asymmetric results in the visual and auditory modalities preclude a modality-general conclusion about the function of alpha. However, much of the language seems to generalize across sensory modalities (e.g., use of the term 'sensory' rather than 'visual').

      We thank the reviewer for pointing this out and agree that in some cases we have not made a good enough distinction between visual and sensory. We will make sure, that when using ‘sensory’, we either describe overall theories, which are not visual-exclusive or refer to the possibility of a broad sensory increase. However, when directly discussing our results and the interpretation thereof, we will now use ‘visual’ in the revised manuscript.

      (4) In this vein, some of the conclusions would be far more convincing if there was at least a trend towards symmetry in source-localized analyses of MEG signals. For example, how does alpha power in the primary auditory cortex (A1) compare when anticipating auditory vs visual target? What do the frequency-tagged visual and auditory responses look like when just looking at the primary visual cortex (V1) or A1?

      We thank the reviewer for this important suggestion and have added a virtual channel analysis. We were however, not interested in alpha power in primary auditory cortex, as we were specifically interested in the posterior alpha, which is usually increased when expecting an auditory compared to a visual target (and used to be interpreted as a blanket inhibition of the visual cortex). We will improve upon the clarity concerning this point in the manuscript.

      We have however, followed the reviewer’s suggestion of a virtual channel analysis, showing that the condition differences are not observable in primary visual cortex for the 36 Hz visual signal and in primary auditory cortex for the 40 Hz auditory signal. Our data clearly shows that there is an alpha condition difference in V1, while there no condition difference for 36 Hz in V1 and for 40 Hz in Heschl’s Gyrus (see Author response image 2).

      Author response image 2.

      Virtual channels for V1 and Helschl’s gyrus. A, alpha power for the virtual channel created in V1 (Calcerine_L and Calcerine_R from AAL atlas; Tzourio-Mazoyer et al., 2002, NeuroImage). A cluster permutation analysis over time (between -2 and 0) revealed a significant condition difference between ~ -2 and -1.7 s (p = 0.0449). B, 36 Hz frequency-tagging signal for the virtual channel created in V1 (equivalent to the procedure in A). The same cluster permutation as performed in A revealed no significant condition differences. C, 40 Hz frequency-tagging signal for the virtual channel created in Heschl’s gryrus (Heschl_L and Heschl_R from AAL atlas; Tzourio-Mazoyer et al., 2002, NeuroImage). The same cluster permutation as performed in A revealed no significant condition differences.

      (5) Blinking would have a huge impact on the subject's ability to ignore the visual distractor. The best thing to do would be to exclude from analysis all trials where the subjects blinked during the cue-to-target interval. The authors mention that in the MEG experiment, "To remove blinks, trials with very large eye-movements (> 10 degrees of visual angle) were removed from the data (See supplement Fig. 5)." This sentence needs to be clarified since eye-movements cannot be measured during blinking. In addition, it seems possible to remove putative blink trials from EEG experiments as well, since blinks can be detected in the EEG signals.

      We thank the reviewer for mentioning that we were making this point confusing. From the MEG-data, we removed eyeblinks using ICA. Alone for the supplementary Fig. 5 analysis, we used the eye-tracking data to confirm that participants were in fact fixating the centre of the screen. For this analysis, we removed trials with blinks (which can be seen in the eye-tracker as huge amplitude movements or as large eye-movements in degrees of visual angle; see Author response image 3 below to show a blink in the MEG data and the according eye-tracker data in degrees of visual angle). We will clarify this in the methods section.

      As for the concern closed eyes to ignore visual distractors, in both experiments we can observe highly significant distractor cost in accuracy for visual distractors, which we hope will convince the reviewer that our visual distractors were working as intended.

      Author response image 3.

      Illustration of eye-tracker data for a trial without and a trial with a blink. All data points recorded during this trial are plottet. A, ICA component 1, which reflects blinks and its according data trace in a trial. No blink is visible. B, eye-tracker data transformed into degrees of visual angle for the trial depicted in A. C, ICA component 1, which reflects blinks and its according data trace in a trial. A clear blink is visible. D, eye-tracker data transformed into degrees of visual angle for the trial depicted in C.

      (6) It would be interesting to examine the neutral cue trials in this task. For example, comparing auditory vs visual vs neutral cue conditions would be indicative of whether alpha was actively recruited or actively suppressed. In addition, comparing spectral activity during cue-to-target period on neutral-cue auditory correct vs incorrect trials should mimic the comparison of auditory-cue vs visual-cue trials. Likewise, neutral-cue visual correct vs incorrect trials should mimic the attention-related differences in visual-cue vs auditory-cue trials.

      We thank the reviewer for this suggestion. We have analysed the neutral cue trials in the EEG dataset (see suppl. Fig. 1) and will expand this figure to show all conditions. There were no significant differences to auditory or visual cues, but descriptively alpha power was higher for neutral cues compared to visual cues and lower for neutral cues compared to auditory cues. While this may suggest that for visual trials alpha is actively suppressed and for auditory trials actively recruited, we do not feel comfortable to make this claim, as the neutral condition may not reflect a completely neutral state. The neutral task can still be difficult, especially because of the uncertainty of the target modality.

      As for the analysis of incorrect versus correct trials, we love the idea, but unfortunately the accuracy rate was quite high so that the number of incorrect trials would not be sufficient to perform a reliable analysis.

      (7) In the abstract, the authors state that "This implies that alpha modulation does not solely regulate 'gain control' in early sensory areas but rather orchestrates signal transmission to later stages of the processing stream." However, I don't see any supporting evidence for the latter claim, that alpha orchestrates signal transmission to later stages of the processing stream. If the authors are claiming an alternative function to alpha, this claim should be strongly substantiated.

      We thank the reviewer for pointing out, that we have not sufficiently explained our case. The first point refers to gain control akin to the alpha inhibition hypothesis, which claims that increases in alpha disengage a whole cortical area. Since we have confirmed the alpha increase in our data to originate from primary visual cortex through source analysis, this should lead to decreased visual processing. The increase in 36 Hz visual processing therefore directly contradicts the alpha inhibition hypothesis. We propose an alternative explanation for the functionality of alpha activity in this task. Through pulsed inhibition, information packages of relevant visual information could be transmitted down the processing stream, thereby enhancing relevant visual signal transmission. We believe the fact that the enhanced visual 36 Hz signal we found correlated with visual alpha power on a trial-by-trial basis, and did not originate from primary visual cortex, but from areas known for sensory integration supports our claim.

      We will make this point clearer in our revised manuscript.

      Reviewer #2 (Public review):

      Brickwedde et al. investigate the role of alpha oscillations in allocating intermodal attention. A first EEG study is followed up with a MEG study that largely replicates the pattern of results (with small to be expected differences). They conclude that a brief increase in the amplitude of auditory and visual stimulus-driven continuous (steady-state) brain responses prior to the presentation of an auditory - but not visual - target speaks to the modulating role of alpha that leads them to revise a prevalent model of gating-by-inhibition.

      Overall, this is an interesting study on a timely question, conducted with methods and analysis that are state-of-the-art. I am particularly impressed by the author's decision to replicate the earlier EEG experiment in MEG following the reviewer's comments on the original submission. Evidently, great care was taken to accommodate the reviewer's suggestions.

      We thank the reviewer for the positive feedback and expression of interest in the topic of our manuscript.

      Nevertheless, I am struggling with the report for two main reasons: It is difficult to follow the rationale of the study, due to structural issues with the narrative and missing information or justifications for design and analysis decisions, and I am not convinced that the evidence is strong, or even relevant enough for revising the mentioned alpha inhibition theory. Both points are detailed further below.

      We thank the reviewer for raising this important point. We will revise our introduction and results in line with the reviewer’s suggestions, hoping that our rationale will then be easier to follow and that our evidence will be more convincing.

      Strength/relevance of evidence for model revision: The main argument rests on 1) a rather sustained alpha effect following the modality cue, 2) a rather transient effect on steady-state responses just before the expected presentation of a stimulus, and 3) a correlation between those two. Wouldn't the authors expect a sustained effect on sensory processing, as measured by steady-state amplitude irrespective of which of the scenarios described in Figure 1A (original vs revised alpha inhibition theory) applies? Also, doesn't this speak to the role of expectation effects due to consistent stimulus timing? An alternative explanation for the results may look like this: Modality-general increased steady-state responses prior to the expected audio stimulus onset are due to increased attention/vigilance. This effect may be exclusive (or more pronounced) in the attend-audio condition due to higher precision in temporal processing in the auditory sense or, vice versa, too smeared in time due to the inferior temporal resolution of visual processing for the attend-vision condition to be picked up consistently. As expectation effects will build up over the course of the experiment, i.e., while the participant is learning about the consistent stimulus timing, the correlation with alpha power may then be explained by a similar but potentially unrelated increase in alpha power over time.

      We thank the reviewer for raising these insightful questions and suggestions.

      It is true that our argument rests on a rather sustained alpha effect and a rather transient effect on steady-state responses and a correlation between the two. However, this connection would not be expected under the alpha inhibition hypothesis, which states that alpha activity would inhibit a whole cortical area (when irrelevant to the task), exerting “gain control”. This notion directly contradicts our results of the “irrelevant” visual information a) being transmitted at all and b) increasing.

      However, it has been shown on many occasions that alpha activity exerts pulsed inhibition, so we proposed an alternative theory of an involvement in signal transmission. In this case, the cyclic inhibition would serve as an ordering system, which only allows for high-priority information to pass, resulting in higher signa-to-noise. We do not make a claim about how fast or when these signals are transmitted in relation to alpha power. For instance, it could be that alpha power increases as a preparatory state even before signal is actually transmitted.  Zhigalov (2020 Hum. Brain M.) has shown that in V1, frequency-tagging responses were up-and down regulated with attention – independent of alpha activity.

      But we do believe that the fact that visual alpha power correlates on a trial-by-trial level with visual 36 Hz frequency-tagging increases and (a relationship which has not been found in V1, see Zhigalov 2020, Hum. Brain Mapp.) suggest a strong connection. Furthermore, the fact that the alpha modulation originates from early visual areas and occurs prior to any frequency-tagging changes, while the increase in frequency-tagging can be observed in areas which are later in the processing stream (such as the precuneus) is strongly indicative for an involvement of alpha power in the transmission of this signal. We cannot fully exclude alternative accounts and mechanisms which effect both alpha power and frequency-tagging responses. 

      We do believe that the alternative account described by the reviewer does not contradict our theory, as we do believe that the alpha power modulation may reflect an expectation effect (and the idea that it could be related to the resolution of auditory versus visual processing is very interesting!). It is also possible that this expectation is, as the reviewer suggests, related to attention/vigilance and might result in a modality-general signal increase. And indeed, we can observe an increase in the frequency-tagging response in sensory integration areas. Accordingly, we believe that the alternative explanation provided by the reviewer contradicts the alpha inhibition hypothesis, but not necessarily our alternative theory.

      We will revise the discussion, which we hope will make our case stronger and easier to follow. Additionally, we will mention the possibility for alternative explanations as well as the possibility, that alpha networks fulfil different roles in different locations/task environments.

      Structural issues with the narrative and missing information: Here, I am mostly concerned with how this makes the research difficult to access for the reader. I list the major points below:

      In the introduction the authors pit the original idea about alpha's role in gating against some recent contradictory results. If it's the aim of the study to provide evidence for either/or, predictions for the results from each perspective are missing. Also, it remains unclear how this relates to the distinction between original vs revised alpha inhibition theory (Fig. 1A). Relatedly if this revision is an outcome rather than a postulation for this study, it shouldn't be featured in the first figure.

      We agree with the reviewer that we have not sufficiently clarified our goal as well as how different functionalities of alpha oscillations would lead to different outcomes. We will revise the introduction and restructure the results and hope that it will be easier to follow.

      The analysis of the intermodulation frequency makes a surprise entrance at the end of the Results section without an introduction as to its relevance for the study. This is provided only in the discussion, but with reference to multisensory integration, whereas the main focus of the study is focussed attention on one sense. (Relatedly, the reference to "theta oscillations" in this sections seems unclear without a reference to the overlapping frequency range, and potentially more explanation.) Overall, if there's no immediate relevance to this analysis, I would suggest removing it.

      We thank the reviewer for pointing this out and will add information about this frequency to the introduction part. We believe that the intermodulation frequency analysis is important, as it potentially supports the notion that condition differences in the visual-frequency tagging response are related to downstream processing rather than overall visual information processing in V1. We would therefore prefer to leave this analysis in the manuscript.

      Reviewer #3 (Public review):

      Brickwedde et al. attempt to clarify the role of alpha in sensory gain modulation by exploring the relationship between attention-related changes in alpha and attention-related changes in sensory-evoked responses, which surprisingly few studies have examined given the prevalence of the alpha inhibition hypothesis. The authors use robust methods and provide novel evidence that alpha likely exhibits inhibitory control over later processing, as opposed to early sensory processing, by providing source-localization data in a cross-modal attention task.

      This paper seems very strong, particularly given that the follow-up MEG study both (a) clarifies the task design and separates the effect of distractor stimuli into other experimental blocks, and (b) provides source-localization data to more concretely address whether alpha inhibition is occurring at or after the level of sensory processing, and (c) replicates most of the EEG study's key findings.

      We are very grateful to the reviewer for their positive feedback and evaluation of our work.

      There are some points that would be helpful to address to bolster the paper. First, the introduction would benefit from a somewhat deeper review of the literature, not just reviewing when the effects of alpha seem to occur, but also addressing how the effect can change depending on task and stimulus design (see review by Morrow, Elias & Samaha (2023).

      We thank the reviewer for this suggestion and agree. We will add a paragraph to the introduction which refers to missing correlation studies and the impact of task design.

      Additionally, the discussion could benefit from more cautionary language around the revision of the alpha inhibition account. For example, it would be helpful to address some of the possible discrepancies between alpha and SSEP measures in terms of temporal specificity, SNR, etc. (see Peylo, Hilla, & Sauseng, 2021). The authors do a good job speculating as to why they found differing results from previous cross-modal attention studies, but I'm also curious whether the authors think that alpha inhibition/modulation of sensory signals would have been different had the distractors been within the same modality or whether the cues indicated target location, rather than just modality, as has been the case in so much prior work?

      We thank the reviewer for suggesting these interesting discussion points and will include a paragraph in our discussion which goes deeper into these topics.

      Overall, the analyses and discussion are quite comprehensive, and I believe this paper to be an excellent contribution to the alpha-inhibition literature.

    1. Author response:

      The following is the authors’ response to the original reviews.

      General Response to Public Reviews

      We thank the three reviewers for their positive evaluation of our work, which presents the first molecular characterization of type-II NB lineages in an insect outside the fly Drosophila. They seem convinced of our finding of an additional type-II NB and increased proliferation during embryogenesis in the red flour beetle. The reviewers expressed hesitations on our interpretation that the observed quantitative differences of embryonic lineages can directly be linked to the embryonic development of the central complex in Tribolium. While we still believe that a connection of both observations is a valid and likely hypothesis, we acknowledge that due the lack of functional experiments and lineage tracing a causal link has not directly been shown. We have therefore changed the manuscript to an even more careful wording that on one hand describes the correlation between increased embryonic proliferation with the earlier development of the Cx but on the other hand also stresses the need for additional functional and lineage tracing experiments to test this hypothesis. We have also strengthened the discussion on alternative explanations of the increased lineage size and emphasize the less disputed elements like presence and conservation of type-II NB lineages. 

      While our manuscript could in conclusion not directly show that the reason of the heterochronic shift lies in the progenitor behaviour, we still provide a first approach to answering the question of the developmental basis of this shift and testable hypotheses directly emerge from our work. We agree with reviewer#1 that functional work is best suited to test our hypothesis and we are planning to do so. However, we believe that the presented work is already rich in novel data and significantly advances our understanding on the conservation and divergence of type-II NBs in insects. We would also like to stress that most transgenic tools for which genome-wide collections exist for Drosophila have to be created for Tribolium and doing so can be quite time consuming. Conducting RNAi experiments is certainly possible in Tribolium but observing phenotypes in this defined cellular context will need laborious optimization. We have for example tried knocking down Tc-fez/erm but could not see any embryonic phenotype which might be due to an escaper effect in which only mildly affected or wild type-like embryos survive while the others die in early embryogenesis. Due to pleiotropic functions of the involved genes a cell-specific knockdown might be necessary and we are working towards establishing a system to do that in the red flour beetle. For the stated reasons, we see our work as an important basis to inspire future functional studies that build up on the framework that we introduced. 

      In response to these common points, we have made the following changes to the manuscript

      -        The title has been changed from ‘being associated’ to ‘correlate’

      -        The conclusions part of the abstract has been changed

      -        We deleted the statement ‘…thus providing the material for the early central complex formation…’

      -        Rephrased to saying that the two observations just correlate

      -        The part of the discussion ‘Divergent timing of type-II NB activity and heterochronic development of the central complex’ has been extensively rewritten and now discusses several alternative explanations that were suggested by the reviewers. It also stresses the need for further functional work and lineage tracing (line 859-862 (608-611)).

      In addition, we have made numerous changes to the manuscript to account for more specific comments of the reviewers and to the recommendations for the authors.

      Our responses to the individual comments can be found in the following. 

      Public Reviews: 

      Reviewer #1 (Public Review): 

      Summary: 

      Insects inhabit diverse environments and have neuroanatomical structures appropriate to each habitat. Although the molecular mechanism of insect neural development has been mainly studied in Drosophila, the beetle, Tribolium castaneum has been introduced as another model to understand the differences and similarities in the process of insect neural development. In this manuscript, the authors focused on the origin of the central complex. In Drosophila, type II neuroblasts have been known as the origin of the central complex. Then, the authors tried to identify those cells in the beetle brain. They established a Tribolium fez enhancer trap line to visualize putative type II neuroblasts and successfully identified 9 of those cells. In addition, they also examined expression patterns of several genes that are known to be expressed in the type II neuroblasts or their lineage in Drosophila. They concluded that the putative type II neuroblasts they identified were type II neuroblasts because those cells showed characteristics of type II neuroblasts in terms of genetic codes, cell diameter, and cell lineage. 

      Strengths: 

      The authors established a useful enhancer trap line to visualize type II neuroblasts in Tribolium embryos. Using this tool, they have identified that there are 9 type II neuroblasts in the brain hemisphere during embryonic development. Since the enhancer trap line also visualized the lineage of those cells, the authors found that the lineage size of the type II neuroblasts in the beetle is larger than that in the fly. They also showed that several genetic markers are also expressed in the type II neuroblasts and their lineages as observed in Drosophila. 

      Weaknesses: 

      I recommend the authors reconstruct the manuscript because several parts of the present version are not logical. For example, the author should first examine the expression of dpn, a well-known marker of neuroblast. Without examining the expression of at least one neuroblast marker, no one can say confidently that it is a neuroblast. The purpose of this study is to understand what makes neuroanatomical differences between insects which is appropriate to their habitats. To obtain clues to the question, I think, functional analyses are necessary as well as descriptive analyses. 

      The expression of an exclusive type-II neuroblast marker would indeed have been the most convincing evidence. However, asense is absent from type-II NBs and deadpan is not specific enough as it is expressed in many other cells of the developing protocerebrum. The gene pointed, although also expressed elsewhere, emerged as the the most specific marker. Therefore, we start with pointed and fez/erm to describe the first appearance and developmental progression of the cells and then add further evidence that these cells are indeed type-II neuroblasts. Further evidence is provided in the following chapters.  We have discussed the need for functional work in the general response. 

      Reviewer #2 (Public Review): 

      The authors address the question of differences in the development of the central complex (Cx), a brain structure mainly controlling spatial orientation and locomotion in insects, which can be traced back to the neuroblast lineages that produce the Cx structure. The lineages are called type-II neuroblast (NB) lineages and are assumed to be conserved in insects. While Tribolium castaneum produces a functional larval Cx that only consists of one part of the adult Cx structure, the fan-shaped body, in Drosophila melanogaster a non-functional neuropile primordium is formed by neurons produced by the embryonic type-II NBs which then enter a dormant state and continue development in late larval and pupal stages. 

      The authors present a meticulous study demonstrating that type-II neuroblast (NB) lineages are indeed present in the developing brain of Tribolium castaneum. In contrast to type-I NB lineages, type-II NBs produce additional intermediate progenitors. The authors generate a fluorescent enhancer trap line called fez/earmuff which prominently labels the mushroom bodies but also the intermediate progenitors (INPs) of the type-II NB lineages. This is convincingly demonstrated by high-resolution images that show cellular staining next to large pointed labelled cells, a marker for type-II NBs in Drosophila melanogaster. Using these and other markers (e.g. deadpan, asense), the authors show that the cell type composition and embryonic development of the type-II NB lineages are similar to their counterparts in Drosophila melanogaster. Furthermore, the expression of the Drosophila type-II NB lineage markers six3 and six4 in subsets of the Tribolium type-II NB lineages (anterior 1-4 and 1-6 type-II NB lineages) and the expression of the Cx marker skh in the distal part of most of the lineages provide further evidence that the identified NB lineages are equivalent to the Drosophila lineages that establish the central complex. However, in contrast to Drosophila, there are 9 instead of 8 embryonic type-II NB lineages per brain hemisphere and the lineages contain more progenitor cells compared to the Drosophila lineages. The authors argue that the higher number of dividing progenitor cells supports the earlier development of a functional Cx in Tribolium. 

      While the manuscript clearly shows that type-II NB lineages similar to Drosophila exist in Tribolium, it does not considerably advance our understanding of the heterochronic development of the Cx in these insects. First of all, the contribution of these lineages to a functional larval Cx is not clear. For example, how do the described type-II NB lineages relate to the DM1-4 lineages that produce the columnar neurons of the Cx? What is the evidence that the embryonically produced type-II NB lineage neurons contribute to a functional larval Cx? The formation of functional circuits could rely on larval neurons (like in Drosophila) which would make a comparison of embryonic lineages less informative with respect to understanding the underlying variations of the developmental processes. Furthermore, the higher number of progenitors (and consequently neurons) in Tribolium could simply reflect the demand for a higher number of cells required to build the fan-shaped body compared to Drosophila. In addition, the larger lineages in Tribolium, including the higher number of INPs could be due to a greater number of NBs within the individual clusters, rather than a higher rate of proliferation of individual neuroblasts, as suggested. What is the evidence that there is only one NB per cluster? The presented schemes (Fig. 7/12) and description of the marker gene expression and classification of progenitor cells are inconsistent but indicate that NBs and immature INPs cannot be consistently distinguished. 

      We thank this reviewer for pointing out the inconsistency in our classification of cells within the lineages as one central part of our manuscript. These were due to a confusion in the used terms (young vs. immature). We have corrected this mistake and have changed the naming of the INP subtypes to immature-I and immature-II. We are confident that based on the analysed markers, type-II NBs and immature INPs can actually be distinguished with confidence.

      We agree that a functional link of increased proliferation to heterochronic CX development is not shown although we consider it to be likely. As stated in the general response we have changed the manuscript to saying that the two observations (higher number of progenitors and larger lineages/more INPs) correlate but that a causal link can only be hypothesized for the time being. At the same time, we have strengthened the discussion on alternative explanations.

      We would like to remain with our statement of an increased number of embryonic progeny of Tribolium type-II NBs. We counted the total number of progenitor cells emerging from the anterior median cluster and divided this by the number of type II NBs in that cluster. Hence, the shown increased number of cells represents an average per NB but is not influenced by the increased number of NBs. On the same line, we have never seen indication for the presence of additional NBs within any cluster while one type-II NB is what we regularly found. Hence, we are confident that we know the number of respective NBs. The fact that the fly data included also neurons and was counted at a later stage indicates that the observed differences are actually minimum estimates.

      We have discussed that based on the position and comparison to the grasshopper we believe that Tribolium type-II NB 1-4 contribute to the x, y, z and w tracts. To confirm this, lineage tracing experiments would be necessary, for which tools remain to be developed. 

      We agree that the role of larvally born neurons and the fate of Tribolium neuroblasts through the transition from embryo to larva and pupa need to be further studied.

      Available data suggests that the adult fan shaped body in Tribolium does not hugely differ in size from the Drosophila counterpart, although no data in terms of cell number is available. In the larva, however, no fan shaped body or protocerebral bridge can be distinguished in flies while in beetle larvae, these structures are clearly developed. Hence, we think that it is more likely that differences observed in the embryo reflect differences in the larval central complex. We discuss the need for further investigation of larval stages.

      The main difference between Tribolium and Drosophila Cx development with regards to the larval functionality might be that Drosophila type-II NB lineage-derived neurons undergo quiescence at the end of embryogenesis so that the development of the Cx is halted, while a developmental arrest does not occur in Tribolium. However, this needs to be confirmed (as the authors rightly observe). 

      Indeed, there is evidence that cells contributing to the CX go into quiescence in flies – hence, this certainly is one of the mechanisms. However, based on our data we would suggest that in addition, the balance of embryonic versus larval proliferation of type-II lineages is different between the two insects: The increased embryonic proliferation and development leads to a functional larval CX in beetles while in flies, postembryonic proliferation may be increased in order to catch up.

      Reviewer #3 (Public Review):

      Summary: 

      In this paper, Rethemeier et al capitalize on their previous observation that the beetle central complex develops heterochronically compared to the fly and try to identify the developmental origin of this difference. For this reason, they use a fez enhancer trap line that they generated to study the neuronal stem cells (INPs) that give rise to the central complex. Using this line and staining against Drosophila type-II neuroblast markers, they elegantly dissect the number of developmental progression of the beetle type II neuroblasts. They show that the NBs, INPs, and GMCs have a conserved marker progression by comparing to Drosophila marker genes, although the expression of some of the lineage markers (otd, six3, and six4) is slightly different. Finally, they show that the beetle type II neuroblast lineages are likely longer than the equivalent ones in Drosophila and argue that this might be the underlying reason for the observed heterochrony. 

      Strengths: 

      - A very interesting study system that compares a conserved structure that, however, develops in a heterochronic manner. 

      - Identification of a conserved molecular signature of type-II neuroblasts between beetles and flies. At the same time, identification of transcription factors expression differences in the neuroblasts, as well as identification of an extra neuroblast. 

      - Nice detailed experiments to describe the expression of conserved and divergent marker genes, including some lineaging looking into the co-expression of progenitor (fez) and neuronal (skh) markers. 

      Weaknesses: 

      - Comparing between different species is difficult as one doesn't know what the equivalent developmental stages are. How do the authors know when to compare the sizes of the lineages between Drosophila and Tribolium? Moreover, the fact that the authors recover more INPs and GMCs could also mean that the progenitors divide more slowly and, therefore, there is an accumulation of progenitors who have not undergone their programmed number of divisions. 

      We understand the difficulty of comparing stages between species, but we feel that our analysis is on the save side. At stages comparable with respect to overall embryonic development (retracting or retracted germband), the fly numbers are clearly smaller. To account for potential heterochronic shifts in NB activity, we have selected the stages to compare based on the criteria given: In Drosophila the number of INPs goes down after stage 16, meaning that they reach a peak at the selected stages. In Tribolium the chosen stages also reflect the phase when lineage size is larger than in all previous stages. Therefore, we believe that the conclusion that Tribolium has larger lineages and more INPs is well founded. Lineage size in Tribolium might further increase just before hatching (stage 15) but we were for technical reasons not able to look at this. As lineage size goes down in the last stage of Drosophila embryogenesis the number of INPs goes down and type-II NB enter quiescence, we think it is highly unlikely that the ratio between Tribolium and Drosophila INPs reverses at this stage, but a study of the behaviour of type-II NB in Tribolium and whether there is a stage of quiescence is still needed.

      - The main conclusion that the earlier central complex development in beetles is due to the enhanced activity of the neuroblasts is very handwavy and is not the only possible conclusion from their data. 

      As discussed in the general response we have made several changes to the manuscript to account for this criticism and discuss alternative explanations for the observations.

      - The argument for conserved patterns of gene expression between Tribolium and Drosophila type-II NBs, INPs, and GMCs is a bit circular, as the authors use Drosophila markers to identify the Tribolium cells. 

      We tested the hypothesis that in Tribolium there are type-II NBs with a molecular signature similar to flies. Our results are in line with that hypothesis. If pointed had not clearly marked cells with NB-morphology or fez/erm had not marked dividing cells adjacent to these NBs, we would have concluded that no such cells/lineages exist in the Tribolium embryo, or that central complex producing lineages exist but express different markers. Therefore, we regard this a valid scientific approach and hence find this argument not problematic.  

      An appraisal of whether the authors achieved their aims, and whether the results support their conclusions: Based on the above, I believe that the authors, despite advancing significantly, fall short of identifying the reasons for the divergent timing of central complex development between beetle and fly. 

      We agree that based on the available data, we cannot firmly make that link and we have changed the text accordingly.

      Recommendations for the authors:

      Reviewer #1 (Recommendations For The Authors): 

      In addition to these descriptive analyses, functional analyses can be included. RNAi is highly effective in this beetle. 

      We agree that functional analyses of some of the studied genes and possible effects of gene knockdowns on the studied cell lineages and on central complex development could be highly informative. However, when studying specific cell types or organs these experiments are less straight forward than it may seem as knockdowns often lead to pleiotropic effects, sterility or lethality. All the genes involved are expressed in additional cells and may have essential functions there. Given the systemic RNAi of Tribolium, it is challenging to unequivocally assign phenotypes to one of the cell groups. Overcoming these challenges is often possible but needs extensive optimization. Our study, though descriptive is already rich in data and is the first description of NB-II lineages in Tribolium central complex development. We see it as a basis for future studies on central complex development that will include functional experiments.

      (1) Introduction 

      For these reasons the beetle... 

      Could you explain the differences in the habitats between Tribolium and Drosophila? or What is the biggest difference between these two species at the ecological aspect? 

      We have added a short characterisation of the main differences.

      The insect central complex is an anterior... 

      The author should explain why they focus on the structure. 

      Added

      It is however not known how these temporal... 

      If the authors want to get the answer to the question, they need to conduct functional analyses. 

      While we agree with the importance of functional work (see above) we believe that detailed descriptions under the inclusion of molecular markers as presented here is very informative by itself for understanding developmental processes and sets the foundation for the analysis of mutant/RNAi- phenotypes in future studies.

      CX - Central complex? 

      We have opted to not use this abbreviation anymore for clarity.

      “because intermediate cycling progenitors have also been...” 

      Is the sentence correct? 

      We have included ‘INPs’ in the sentence to make clear what the comparison refers to and added a comma

      “However, molecular characterization of such lineage in another...” 

      The authors should explain why molecular characterization is necessary. 

      We have done so

      (2) Results 

      a) Figure 8. Could you delineate the skh/eGFP expression region? 

      We have added brackets to figure 1 panel A to indicate the extent of skh and other gene expressions within the lineages.

      b) This section should be reorganized for better logical flow. 

      There certainly are different ways to organize this part and we have considered different structures of the results part. We eventually subjectively concluded that the chosen one is the best fit for our data (also see comment below on dpn-expression).

      c) For the tables. The authors should mention what statistical analysis they have conducted. 

      The tables themselves are just listing the raw numbers. They are the basis for the graph in figure 9. Statistical tests (t-test) are mentioned in the legend of that figure and now also in the Methods sections.

      “We also found that the large Tc-pnt...” 

      The authors could examine the mitotic index using an anti-pH3 antibody. 

      We have used the anti-pH3 antibody to detect mitoses (figure 3C, table 1 and 3) but as data on mitoses based on this antibody is only a snapshot it would require a lot of image data to reliably determine an index in this specific cells. While mitotic activity over time possibly combined with live imaging might be very interesting in this system also with regards to the timing of development, for this basic study we are satisfied with the statement that the type-II NB are indeed dividing at these stages.

      “Based on their position by the end of embryogenesis...” 

      How can the authors conclude that they are neuroblasts without examining the expression of NB markers? 

      Type-II NB do not express asense as the key marker for type I neuroblasts. To corroborate our argument that the cells are neuroblasts we have used several criteria:

      - We have used the same markers that are used in Drosophila to label type-II NBs (pnt, dpn, six4). We are not aware of any other marker that would be more specific.

      - We have shown that these cells are larger and have larger nuclei than neighbouring cells and they are dividing

      - We have shown that these cells through their INP lineages give rise to central complex neuropile

      We believe that these features taken together leave little doubt that the described cells are indeed neuroblasts. 

      “We found that the cells they had assigned as...” 

      How did the authors distinguish that they are really neuroblasts? 

      We see the difficulty that we first describe the position and development of these cells (e.g. fig 3) and then add further evidence (cell size, additional marker dpn) that these are neuroblasts (also see above). However, without previous knowledge on position (and on pnt expression as the most specific marker) the type-II NB could not have been distinguished from other NBs based on cell size or expression of other markers.

      “Conserved patterns of gene expression...” 

      This must be the first (especially dpn). 

      Dpn is not specific to type-II NB because it is also expressed in type-1 NBs, mature INPs and possibly other neural cells. It is therefore impossible to identify type-II NBs based on this gene alone. We therefore first used the most specific marker, pnt, in addition to adjacent fez expression to identify candidates for type-II lineages. Then we mapped expression of further genes on these lineages to support the interpretation (and show homology to the Drosophila lineages). Although of course the structure of a paper does not necessarily have to reflect the sequence in which experiments were done we would find putting dpn expression first misleading as it would not be clear why exactly a certain part of the expression should belong to type-II NB. Also, our pnt-fez expression data shows the position of the NB-II in the context of the whole head lobe whereas the other gene expressions are higher magnifications focussing on details. We therefore believe that the structure we chose best fits our data and the other reviewers seemed to find it acceptable as well.  

      “As type-II NBs contribute to central...” 

      Before the sentence, the author could explain differences in the central complex structure between Tribolium and Drosophila in terms of cell number and tissue size. 

      We have added references on the comparisons of tissue sizes, but unfortunately there is no Tribolium data that can be directly compared to available Drosophila resources in terms of cell number.  

      “We conclude that the embryonic development of...” 

      How did the authors conclude? They must explain their logic. 

      Actually, before this sentence, I only found the description of the comparison between Tribolium NBs and Drosophila once. 

      We agree that this conclusion is not fully evident from the presented data. We have therefore changed this part to stating that there is a correlation with the earlier central complex development described in Tribolium. See also response to the general reviewer comments.

      “Hence, we wondered...” 

      The authors need to do a functional assessment of the genes they mentioned. 

      We agree that the goals originally stated at the beginning of this paragraph can only be achieved with functional experiments. We have therefore rephrased this part.

      (3) Discussion

      “A beetle enhancer trap line...” 

      This part should be moved elsewhere (it does not seem to be a discussion) 

      In accordance with this comment and reviewer#2’s similar comment we have removed this section. We have added a statement on the importance of testing the expression of an enhancer trap line to the results part and an added the use of CRISPR-Cas9 for line generation to the introduction. 

      “We have identified a total...” 

      The authors emphasized that they discovered 9 type II NBs. The authors should clarify how important this it

      We have added some discussion on the importance of this finding.

      Dpn is a neural marker - Is this correct? 

      According to Bier et al 1992 (now added as reference) dpn is a pan-neural marker. Reviewer#2 also recommended calling dpn a neural marker.

      “Previous work described a heterochronic...” - reference? 

      Reference have been added

      “By contrast, we show that Tribolium...” 

      What about the number of neurons in the central complex in Tribolium and Drosophila? 

      Does the lineage size of type II NBs reflect the number? 

      Unfortunately, we do not have numbers for that.  

      Reviewer #2 (Recommendations For The Authors): 

      I recommend using page and line numbers to make reviewing and revising less timeconsuming. 

      We apologize for this oversight. We include a line numbering system into our resubmission.

      (1) Abstract 

      "These neural stem cells are believed to be conserved among insects, but their molecular characteristics and their role in brain development in other insect neurogenetics models, such as the beetle Tribolium castaneum have so far not been studied." 

      I recommend explaining the importance of studying Tribolium with regard to the evolution of brain centres rather than just stating that data are lacking. 

      We have now emphasized the importance of Tribolium as model for the evolution of brain centres.

      "Intriguingly, we found 9 type-II neuroblast lineages in the Tribolium embryo while Drosophila produces only 8 per brain hemisphere." 

      It should be made clear that the 9 lineages also refer to brain hemispheres. 

      We have added this information

      (2) Introduction 

      I would remove the first paragraph of the introduction; the use of Tribolium as model representative for insects is too general. The authors should focus on the specific question, i.e. the introduction should start with paragraph 2. 

      While we can relate to the preference for short and concise writing, we feel that giving some background on Tribolium might be important as we expect that many of our readers might be primarily Drosophila researchers. Keeping this paragraph also seems in line with a recommendation of reviewer#1 to add some additional information on Tribolium ecology.  

      "Several NBs of the anterior-most part of the neuroectoderm contribute to the CX and compared…”

      The abbreviation has not been introduced. 

      For clarity we have now opted to not use this abbreviation but to always spell out central complex.

      "Several NBs of the anterior-most part of the neuroectoderm contribute to the CX and compared to the ventral ganglia produced by the trunk segments, it is of distinctively greater complexity..." 

      Puzzling statement. Why would you compare a brain center with ventral ganglia? I recommend removing this. 

      We have changed this statement to just emphasizing the complexity of the brain structure.

      "The dramatically increased number of neural cells that are produced by individual type-II lineages, and the fact that one lineage can produce different types of neurons..."  In my opinion, this statement is too vague and unprofessional in style. Instead of "dramatically increased" use numbers. 

      We have removed ‘dramatically increased’ and now give a numeric example.

      "The dramatically increased number of neural cells that are produced by individual type-II lineages, and the fact that one lineage can produce different types of neurons, leads to the generation of increased neural complexity within the anterior insect brain when compared to the ventral nerve cord.." 

      I assume that this statement relates to the comparison of type I and II nb lineages. However, type I NB lineages also produce different types of neurons due to GMC temporal identity, and neuronal hemi-lineage identity. 

      We have rephrased and tried to make clear that the second part of the statement is not specific to type-II NB only. In line with the comment above we have also removed the reference to the ventral nerve cord.

      "In addition, in Drosophila brain tumours have been induced from type-II NBs lineages [34], opening up the possibility of modelling tumorigenesis in an invertebrate brain, thus making these lineages one of the most intriguing stem cell models in invertebrates [35,36]." 

      This statement is misplaced here; it should be mentioned at the start (if at all). 

      We have moved this statement up.

      "However, molecular characterisation of such lineages in another insect but the fly and a thorough comparison of type-II NBs lineages and their sub-cell-types between fly and beetle are still lacking" 

      The background information should include what is known about type-II NB lineages in Tribolium, including marker gene expression, e.g. Farnworth et al. 

      We refer to He et al 2019, Farnworth et al 2020 and Garcia-Perez 2021. All these publications speculate about a contribution of type-II NBs to Tribolium central complex development but do not show evidence of it. As we emphasize throughout the manuscript, the present work is the first description of type-II NB in Tribolium. 

      "The ETS-transcription factor pointed (pnt) marks type-II NBs [40,41], which do not express the type-I NB marker asense (ase) but the pro-neural gene deadpan (dpn)"  Deadpan is considered a pan-neural gene. To avoid confusion, I would remove "proneural" throughout.

      We have done so throughout the manuscript.

      "We further found that, like the type-II NBs itself, the youngest Tc-pnt-positive but fezmm-eGFP-negative INPs neither express Tc-ase (Fig. 5D, pink arrowheads)."  What is the evidence that these are the youngest pnt positive cells? Position? This needs to be explained. 

      We have clarified that ‘youngest pnt-positive cells’ refers to the position of these cells close to the type-II NB.

      "Therefore these neural markers can be used for a classification of type II NBs (Tc-pnt+, Tcase-), young INPs (Tc-pnt+, Tc-fez/erm-, Tc-ase-), immature INPs (Tc-pnt+, Tcfez/erm+, Tcase+), mature INPs (Tc-dpn+, Tc-ase+, Tc-fez/erm+, Tc-pros+), and GMCs (Tc-ase+, Tcfez/ erm+, Tc-pros+, Tc-dpn). This classification is summarized in Fig. 7 A-B." 

      This is not the best classification and not in line with the schemes in Figure 7 - the young INPs are also immature. What is the difference? It needs to be explained what "mature" means (dividing?). 

      Thank you for pointing this out. We have corrected the error in this part that confused the two original groups (young and immature). To take the immaturity of both types of INPs into account we have then also changed our naming of INP subtypes into immature-I and immature-II and throughout the manuscript). Figure 7 and figure 12 were also changed accordingly. While our classification if primarily based on gene expression the available data indicates that both types of immature INPs are not dividing, whereas mature INPs are. We have added a statement on that to this part.

      "In beetles a single-unit functional central complex develops during embryogenesis while in flies the structure is postembryonic." 

      This statement is vague - the authors need to explain what is meant by "single-unit". The phrase "The structure is postembryonic" also needs more explanation. The Drosophila CX neuroblasts lineages originate in the embryo and the neurons form a commissural tract that becomes incorporated into the fan-shaped body of the Cx. 

      We have explained single-unit central complex and have improved our summary of known differences in central complex development between fly and beetle.

      "To assess the size of the embryonic type-II NBs lineages in beetles we counted the Tc- fez/erm positive (fez-mm-eGFP) cells (INPs and GMCs) associated with a Tc-pntexpressing type-II NBs of the anterior medial group (type-II NBs lineages 1-7).  It is not clear what is meant by "with a Tc-pnt-expressing type-II NBs". Is this a typo?" 

      We have removed this bit.

      (3) Discussion 

      I would remove the first paragraph "A beetle enhancer trap lines reflects Tc-fez/earmuff expression". This is a repetition of the methods rather than a discussion. 

      This part has been removed also in line with reviewer#1’s comment.

      (4) Figures 

      Figure 2 

      To which developing structure do the strongly labelled areas in Figure 2D correspond? 

      We believe that these areas from the protocerebrum including central complex, mushroom bodies and optic lobe. We have added this to the text and to the figure legend.

      Figure 7 

      What do A and B represent? Different stages? 

      A and B show the same lineage but map the expression of different additional markers for clarity. We have added an explanation of this. 

      The classification contradicts the description in the section "Conserved patterns of gene expression mark Tribolium type-II NBs, different stages of INPs and GMCs" (last sentence) where young INPs are first in the sequence and described as pnt+, erm-, ase- and immature INPs as pnt+ erm+ and ase+. 

      We have corrected this mistake and changed the names of the subtypes into immatureI and immature-II (see above).

      "We conclude that the evolutionary ancient six3 territory gives rise to the neuropile of the z, y, x and w tracts." 

      Please clarify if six3 is also expressed in the corresponding grasshopper NB lineages or if your conclusion is based on the comparison of Drosophila and Tribolium and you assume that this is the ancestral condition. 

      Six3 expression has not been studied in grasshoppers. Owing to the highly conserved nature of an anterior median six3 domain in arthropods and bilaterian animals in general, we would expect it to be expressed anterior-medially in grasshoppers as well. In Drosophila the gene is expressed in the anterior-medial embryonic region where the type-II NBs are expected to develop, but to our knowledge it has not been specifically studied which type-II NB lineages are located within this domain. We have clarified in our text that we do not claim that the origin of anterior-medial type-II NB 1-4 and the X,Y, Z and W lineages from the six3 territory is highly conserved but only the territory itself. As far as we know our work is the first to analyse the relationship of type-II lineages and the conserved head patterning genes six3 and otd. We have added some clarification of this into this part of the discussion.

      (5) Methods 

      The methods section should include the methods for cell counting, as well as cell and nuclei size measurements including statistics (e.g. how many embryos, how many NB lineages). The comparison of the Tribolium NB lineage cell numbers to published Drosophila data should include a brief description of the method used in Drosophila (in addition to the method used here in Tribolium) so that the reader can understand how the data compare. 

      We have added a separate section on this to the Methods part which also includes the criteria used in Drosophila. We have also included some more information to the results part on the inclusion of neurons in the Drosophila counts that may only be partially included in our numbers. This does however not change the results in terms of larger numbers of progenitor cells in Tribolium.

      (6) Typos and minor errors 

      Abstract 

      “However, little is known on the developmental processes that create this diversity” 

      Change to ... little is known about

      Changed.

      NBs lineages 

      Change to NB lineages throughout. 

      We have used text search to find and replace all position where this was used erroneously,

      Results 

      "Schematic drawing of expression different markers in type-II NB lineages.." 

      Schematic drawing of expression of different markers 

      Corrected

      Discussion 

      "However, the type-II NB 7, which is we assigned to the anterior medial group but which..." 

      .... which we assigned.... 

      corrected

      "......might be the one that does not have a homologue in the fly embryo The identification of more..."  Full stop missing. 

      Added.

      "Adult like x, y, and w tracts as well as protocerebral bridge are...." 

      Change to "The adult like x, y, and w tracts as well as the protocerebral bridge are.... 

      This part has been removed with the rewriting of this paragraph.  

      Reviewer #3 (Recommendations For The Authors): 

      (1) Suggestions for improved or additional experiments, data, or analyses: 

      a) The analysis of nuclear size is wrong. The authors compare the largest cell of a cluster of cells with a number of random cells from the same brain. It is obvious that the largest cell of a cluster will be larger than the average cell of the same brain. A better control would be to compare the largest cell of the pnt+ cluster with the largest cell of a random sample of cells, although this also comes with biases. Personally, I have no doubt that the authors are looking at neuroblasts, based on the markers they are using, so I would recommend completely eliminating Figure 4.

      We agree that we produced a somewhat biased and expected result when we select the largest cell of a cluster for size comparison. However, we found it important to show based on a larger sample that these cells are also statistically larger than the average cell of a brain, which we think our assessment shows. We do not claim that type-II NBs are the largest cells of a brain, or that they are larger than type-I NBs, therefore in a random sample there might be cells that are equally big (see also distribution of the control sample shown in figure 4, and we have added a note on this to the text). We are happy to hear that this reviewer has no doubts we are looking at neural stem cells. However, reviewer#1 did express some hesitations and therefore we think it is important to keep the information on cell size as part of our argument that we are indeed looking at type-II NBs (gene expression, cell size, dividing, part of a neural lineage).

      b) The comparison of NB, INP, and GMC numbers between Drosophila and Trbolium (section "The Tribolium embryonic lineages of type-II NBs are larger and contain more mature INPs than those of Drosophila") compares an experiment that the authors did with published data. I would suggest that the authors repeat the Drosophila stainings and compare themselves to avoid cases of batch effects, inconsistent counting, etc.

      None of the authors is a Drosophila expert or has any experience at working with this model and reassessing the lineage size would require a number of combinatorial staining. Therefore, we feel that using the published data produced by experts and which also includes repeat experiments is for us the more reliable approach.

      c) In Figure 10, there are some otd+ GFP+ cells laterally. What are these? 

      We believe that these cells contribute to the eye anlagen. We have added this information to the legend.

      (2) Minor corrections to the text and figures: 

      a) There are some typos in the text: e.g. "pattering" in the abstract. 

      We have carefully checked the text for typos and hope that we have found everything.

      b) The referencing of figures in the text is inconsistent (eg "Figure 5 panel A" vs "Figure 5D" on page 12). 

      We have checked throughout the manuscript and made sure to always refer to a panel correctly.

      c) In Figure 3C, the white staining (anti-PH3) is not indicated in the Figure. 

      The label has been added in the figure.

      d) Moreover, in Figure 3, green is not very visible in the images. 

      We have improved the colour intensity where possible.

      e) In the figures, it might be better to outline the cells with color-coded dashed circles instead of using arrows. 

      We think that this would obscure some details of the stainings and create a rather artificial representation. We also feel that doing this consistently in all our images is an amount of work not justified by the degree of expected improvement to the figures

      NOTE: We are submitting a revised version of the supplementary material which only contains two minor changes: a headline was added to Table S4 (Antibodies and staining reagents) and a typo was corrected in line one of table S5 (TC to Tc).

    1. Author response:

      The following is the authors’ response to the original reviews.

      First, we thank the reviewers for a thorough reading of our paper and some useful comments. A recurrent remark of the reviewers concerns the appearance of kRas-expressing cells (labelled by a nuclear blue fluorescent marker) which we attribute to the progeny of the initially induced cell. The reviewers suggest that these cells may have been obtained through activation of the Cre-recombinase in other cells by cyclofen released from light scattering, via diffusion, leakiness, etc. These remarks are perfectly reasonable from people not familiar with the cyclofen uncaging approach that we are using, but are unwarranted as we shall show below. 

      We have been using cyclofen uncaging with subsequent activation of a Cre-recombinase (or some other proteins) since 2010 (see ref.34, Sinha et al., Zebrafish 7, 199-204 (2010) and our 2018 review (ref.35, Zhang et al., ChemBioChem 19,1-8 (2018)). In our experiments, the embryos are incubated in the dark in 6µM caged cyclofen (cCyc) and washed in E3 medium (and transferred to a new medium with no cCyc). In these conditions, over many years we never observed activation of the recombinase, i.e. the appearance of the associated fluorescent label in cells of embryos grown in E3 medium. Hence leakiness can be ruled out (in presence of cCyc or in its absence).

      Following transfer of the embryos to new E3 medium we illuminate the embryos locally with light at 405nm. In these conditions, cCyc is only partially uncaged and results in activation of Cre-recombinase in only a few cells (1,2, 3, …) within the illuminated region only, namely in the appearance of the kRas-associated nuclear blue fluorescent label in usually one cell (and sometimes in a few more). Data and statistics are now incorporated in the revised manuscript, see Fig.2A and S7. In absence of activation of a reprogramming factor these fluorescently labelled cells disappear within a few days (either via shut-down of their promotor, apoptosis or some other mechanism). The crucial point here is that we see less and not more kRas expressing cells (i.e. with nuclear blue fluorescence) in absence of VentX activation. This observation rules out activation of Cre-recombinase in other cells days after illumination due to leakiness, cyclofen released by light or diffusing from the illumination spot.

      To observe many more fluorescent cells days after activation of the initial cell, one needs to transiently activate VentX-GR by overnight incubation in dexamethasone (DEX). Injecting the embryos at 1-cell stage with VentX-GR only or incubating them in DEX (without injection of VentX-GR) does not result in the appearance of more blue fluorescent cells.  Following activation of VentX-GR, the fluorescent cells observed a couple of days after initiation are visualized in E3 medium (i.e. in absence of cyclofen) and are localized to the vicinity of the otic vesicle (the region where the initial cell was activated). In the revised manuscript we show images of these fluorescent cells taken a few days apart in the same embryo in which a single cell was initially activated (Fig.S8). Hence, we attribute these cells to the progeny of the activated cell. Obviously, single cell tracking via time-lapse microscopy would definitely nail down this issue and provide fascinating insight into the initial stages of tumor growth. Unfortunately, immobilization of embryos in the usual medium (e.g. MS222, tricaine) over 5-6 days to track the division and motion of single cells is not possible. We are considering some other possibilities (immobilization in bungarotoxin or via photo-activation of anionic channels), but these challenging experiments are for a future paper.

      Reviewer #1 (Public Review): 

      The authors then performed allotransplantations of allegedly single fluorescent TICs in recipient larvae and found a large number of fluorescent cells in distant locations, claiming that these cells have all originated from the single transplanted TIC and migrated away. The number of fluorescent cells showed in the recipient larve just after two days is not compatible with a normal cell cycle length and more likely represents the progeny of more than one transplanted cell.  

      As mentioned in the manuscript, we measure the density of cells/nl and inject in the yolk of 2dpf Nacre embryos a volume equivalent to about 1 cell, following published protocols (S.Nicoli and M.Presta, Nat.Prot. 2,2918 (2007)). We further image the injected cell(s) by fluorescence microscopy immediately following injection, as shown in Fig.4A and Fig.S8B. We might miss a few cells but not many. With a typical cell cycle of ~10h the images of tumors in larvae at 3dpt (and not 2dpt) correspond to  ~100 cells. In any case the purpose of this experiment was to show that the progeny of the initial induced cell is capable of developing into a tumor in a naïve fish, which is the operational definition of cancer that we adopted here. 

      The ability to migrate from the injection site should be documented by time-lapse microscopy. 

      As stated above our purpose here is not to study tumor formation from transplanted cell(s)  but to use that assay as an operational test of cancer. Besides as mentioned earlier single cell tracking in larvea over 3-4dpt is not a trivial task.

      Then, the authors conclude that "By allowing for specific and reproducible single cell malignant transformation in vivo, their optogenetic approach opens the way for a quantitative study of the initial stages of cancer at the single cell level". However, the evidence for these claims are weak and further characterization should be performed to: 

      (1) Show that they are actually activating the oncogene in a single cell (the magnification is too low and it is difficult to distinguish a single nucleus, labelling of the cell membrane may help to demonstrate that they are effectively activating the oncogene in, or transplanting, a single cell)  

      In the revised manuscript we provide larger magnification of the initial induced cell and show examples of oncogene activation in more than one cell. 

      (2) The expression of the genes used as markers of tumorigenesis is performed in whole larvae, with only a few transformed cells in them. Changes should be confirmed in FACS sorted fluorescent cells  

      When the oncogene is activated in a whole larvae all cells are fluorescent and thus FACS  is of no use for cell sorting. Sorting could be done in larvae where single cells are activated , but then the efficiency of FACS is not good enough to isolate the few fluorescent cells among the many more non-fluorescent ones. We agree that the expression change of the genes used as markers of tumorigenesis is an underestimate of their true change, but our goal at this time is not to precisely measure the change in expression level, but to show that the pattern of change was different from the controls and corresponded to what is expected in tumorigenesis.

      (3) The histology of the so called "tumor masses" is not showing malignant transformation, but at the most just hyperplasia. 

      The histology of the hyperplasic tissues show cellular proliferation with a higher density of nuclear material which is characteristic of tumors, Fig.S4C. Besides the increased expression of pERK in these tissues, Fig.S4A,B is also a hallmark of cancer. 

      In the brain, the sections are not perfectly symmetrical and the increase of cellularity on one side of the optic tectum is compatible with this asymmetry. 

      The expected T-shape formed by the sections of the tegmentum and hypothalamus are compatible with the symmetric sections shown in Fg.2D. The asymmetry in the optic tectum is a result of the hyperplasic growth.

      (4) The number of fluorescent cells found dispersed in the larvae transplanted with one single TIC after 48 hours will require a very fast cell cycle to generate over 50 cells. Do we have an idea of the cell cycle features of the transplanted TICs? 

      As answered above, the transplanted larvae are shown at 3dpt. With a cell cycle of about 10h, a single cell can give rise to about 100 cells in that time lapse.  

      Reviewer #2 (Public Review): 

      Summary: 

      This paper describes a genetically tractable and modifiable system …which could be used to study an array of combinations and temporal relationships of these cancer drivers/modifiers. 

      We thank this referee for its positive comments. We would also like to point out that our approach provides for the first quantitative means to estimate the probability of tumorigenesis from a single cell, an estimate which is crucial in any assessment of cancer malignancy and the effectiveness of prophylactics. 

      Weaknesses: 

      There is minimal quantitation of … the efficiency of activation of the Ras-TFP fusion (Fig 1) in, purportedly, a single cell. …, such information seems essential.  

      We have added more images of induction of a single (or a few cells) and a plot where the probability of RAS activation in one or a few cells is specified. 

      The authors indicate that a single cell is "initiated" (Fig 2) using the laser optogenetic technique, but without definitive genetic lineage tracing, it is not possible to conclude that cells expressing TFP distant from the target site near the ear are daughter cells of the claimed single "initiated" cell. A plausible alternative explanation is 1) that the optogenetic targeting is more diffuse (i.e. some of the light of the appropriate wavelength hits other cells nearby due to reflection/diffraction), so these adjacent cells are additional independent "initiated" cells or 2) that the uncaged tamoxifen analogue can diffuse to nearby cells and allow for CreER activation and recombination.  

      We have addressed this point in our general comments to the reviewers’ remarks. The possibilities mentioned by this reviewer would result in cells expressing TFP in absence of VentX activation, which is NOT the case. Cells expressing TFP away from the initial site are observed DAYS after activation of the oncogene (and TFP) in a single cell and ONLY upon activation of VentX.

      In Fig 2B, the claim is made that "the activated cell has divided, giving rise to two cells" - unless continuously imaged or genetically traced, this is unproven. 

      We have addressed this remark previously. Tracking of larvae over many days is not possible with the usual protocol using tricaine to immobilize the larvae. Nonetheless, in the revised version we present images of an embryo imaged at various times post activation (1hpi, 3dpi, 7dpi) where proliferation and metastasis of the cells can be observed. We are pursuing other alternatives for time-lapse microscopy over many days, since besides convincing the sceptics, a single cell tracking experiment (possibly coupled with in-situ spatial transcriptomics) will shed a new and fascinating light on the initial stages of tumor growth. 

      In addition, it appears that Figures S3 and S4 are showing that hyperplasia can arise in many different tissues (including intestine, pancreas, and liver, S4C) with broad Ras + Ventx activation …. This should be clarified in the manuscript). 

      This is true and has been clarified in the new version. 

      In Fig S7 where single cell activation and potential metastasis is discussed, similar gut tissues have TFP+ cells that are called metastatic, but this seems consistent with the possibility that multiple independent sites of initiation are occurring even when focal activation is attempted. 

      As mentioned previously this is ruled out by the fact that these cells are observed days after cyclofen uncaging (and TFP activation) and IF AND ONLY IF VentX was activated during the first dpi.

      Although the hyperplastic cells are transplantable (Fig 4), the use of the term "cells of origin of cancer" or metastatic cells should be viewed with care in the experiments showing TFP+ cells (Fig 1, 2, 3) in embryos with targeted activation for the reasons noted above.  

      The purpose of this transplantation experiment was to show that cell in which both kRas and VentX have been activated possess the capacity to metastasize and develop a tumor mass when transplanted in a naïve zebrafish. This -  to the best of our knowledge  - is the operational definition of a malignant tumor. Notice also that transplantation of kRAS only activated cells (i.e. without subsequent activation of VentX) does NOT yield tumors, rather the transplanted cell disappears after a few days, see Fig.S10. 

      Reviewer #3 (Public Review): 

      Summary: 

      This study employs an optogenetics approach … to examine tumorigenesis probabilities under altered tissue environments.  

      We thank this reviewer for this remark, since we believe that the probability to assess the probability of tumorigenesis from a single cell is probably the most significant contribution of this work.

      Weaknesses: 

      Lack of Methodological Clarity: The manuscript lacks detailed descriptions of methodologies, 

      We have included additional detail of our methodology and statistical analyses in the revised manuscript.

      Sub-optimal Data Presentation and Quality:  

      Lack of quantitative data and control condition data obtained from images of higher magnification limits the ability to robustly support the conclusions.  

      We have included more images at higher magnification and quantitative data to support the main report of targeted single cell induction. 

      Here are some details:  

      Authors might want to provide more evidence to support their claim on the single cell KRAS activation.  

      More images and a data on activation of single or few cells in the illumination field are provided as well as statistical analysis of  cell induction.  

      Stability of cCYC: The manuscript does not provide information on the half-life and stability of cCYC. Understanding these properties is crucial for evaluating the system's reliability and the likelihood of leakiness, which could significantly influence the study's outcomes. 

      We have been using the cCyc system for about 14 years. We refer the reader to our previous papers and reviews on this methodology. Briefly, cCyc is stable when not illuminated with light around 375nm. Typically, we incubate our embryos in the dark for about 1h before washing, transferring them into E3 medium and illuminating them. Assessing the leakiness of the system is easy as expression of a fluorescent marker is permanently turned on. We have observed none in the conditions of our experiment or in previous works.

      Metastatic Dissemination claim: However, the absence of a supportive cellular compartment within the fin-fold tissue makes the presence of mTFP-positive metastatic cells there particularly puzzling. This distribution raises concerns about the spatial specificity of the optogenetic activation protocol … The unexpected locations of these signals suggest potential ectopic activation of the KRAS oncogene, 

      We have addressed this remark in the introduction and above. Specifically, metastatic and proliferative mTFP-positive cells are observed IF AND ONLY IF VentX is also activated concomitant with activation of kRAS in a single cell. No proliferative cells are observed in absence of VentX activation, or in presence of VentX or Dex alone, or if kRAS has not been activated by cyclofen uncaging. 

      Image Resolution Concerns: The cells depicted in Figure 3C β, which appear to be near the surface of the yolk sac and not within the digestive system as suggested in the MS, underscore the necessity for higher-resolution imaging. Without clearer images, it is challenging to ascertain the exact locations and states of these cells, thus complicating the assessment of experimental results. 

      Better images are provided in the revised version.

      The cell transplantation experiment is lacking protocol details:

      Details are provided. We have followed regular protocols for transplantation:  S.Nicoli and M.Presta, Nat.Prot. 2,2918 (2007). 

      If the cells are obtained from whole larvae with induced RAS + VX expression, it is notable and somewhat surprising that the larvae survived up to six days post-induction (6dpi) before cells were harvested for transplantation. This survival rate and the subsequent ability to obtain single cell suspensions raise questions about the heterogeneity of the RAS + VX expressing cells that transplanted. 

      From Fig.S4D, about 50% of the embryos survive at 6dpi. Though an interesting question by itself we have not (yet) addressed the important issue of the heterogeneity of the outgrowth obtained from a single cell. Our purpose here was just to show that cells in which both kRAS and VentX have been activated possess the capacity to metastasize and develop a tumor mass when transplanted in a naïve zebrafish. This -  to the best of our knowledge  - is the operational definition of a malignant tumor.

      Unclear Experimental Conditions in Figure S3B: …It is not specified whether the activation of KRAS was targeted to specific cells or involved whole-body exposure. 

      This was whole body (global) illumination and is specified in the revised version.

      Contrasting Data in Figure S3C compared to literature: The graph in Figure S3C indicates that KRAS or KRAS + DEX induction did not result in any form of hyperplastic growth. The authors should provide detailed descriptions of the conditions under which the experiments were conducted in Figure S3B and clarifying the reasons for the discrepancies observed in Figure S3C are crucial. The authors should discuss potential reasons for the deviation from previous reports. 

      This discrepancy is discussed in the revised version. First the previous reports consider the development of tumors within 3-4 weeks which we have not studied in detail. Second, the expression of the oncogene in these reports might be stronger than in ours. Third, the stochastic and random appearance of tumors in these reports suggest that some other mechanism (transient stress-induced reprogramming?) might have activated the oncogene in the initial cell. 

      Further comments: 

      Throughout the study, KRAS-activated cell expansion and metastasis are two key phenotypes discussed that Ventx is promoting. However, the authors did not perform any experiments to directly show that KRAS+ cells proliferate only in Ventx-activated conditions.  

      Yes, we did. See Fig. S1 and compare with Fig.S3B, or Fig.S10A in comparison with Fig.2A,B.

      The authors also did not show any morphological features or time-lapse videos demonstrating that KRAS+ cells are motile, even though zebrafish is an excellent model for in vivo live imaging. This seems to be a missed opportunity for providing convincing evidence to support the authors' conclusions.  

      Performing time-lapse microscopy on larvae over many (4-5) days is not possible with the regular tricaine protocol for immobilization. We are definitely planning such experiments, but they will require some other protocol, perhaps using bungarotoxin or some optogenetic inhibitory channels.

      There were minimal experimental details provided for the qPCR data presented in the supplementary figures S5 and S6, therefore, it is hard to evaluate result obtained. 

      More details are given in the revised version.

      Recommendations for the authors:

      Reviewer #1 (Recommendations For The Authors): 

      Abstract: what is the definition of tumors that they are using? I never heard of a full-blown tumor that develops in less than 6 days from a single cell!  

      This is indeed surprising! We are using an operational definition of a tumor: if cells from an hyperplasic tissue can metastasize and outgrow when transplanted in a naïve zebrafish, then it is a tumor. 

      Introduction: The claim that this is the first report of the induction of oncogene expression in a single cell in zebrafish is wrong as there are other reports (PMID: 27810924, PMID: 30061297) 

      These other approaches are invasive (electroporation and transplantation). We have added non-invasive in the revised version. 

      Figure 2: The quality of these images is too low to visualize the infiltration that they talk about, the sections are not perfectly coronal and the asymmetric distribution of cells may be confused with an infiltration. 

      We have addressed this question above. 

      Results, page 5: how do we know that these are metastatic cells? there could have been spurious activation in other locations, you need to prove that these cells moved from one place to the other and that they are of the same cell type as the primary tumor  

      We have addressed this question extensively in the introduction and in our answers to the reviewers. We have also added a figure showing cell proliferation in the same embryos at various time post induction. Time-lapse microscopy studies of tumor initiation and growth over many days are planned, but will be the subject of an other paper.

      Figure 3: not clear why they did not use anaesthetic or mounting media to take pictures of the transplanted fish  

      We tried to minimally stress the larvae that are already in a perilous condition…

      Results, page 6: Not clear why the authors used KRAS v12 as an oncogene and uncaged its expression in the brain, as KRAS is not a common oncogene for brain tumors. 

      There are reports of kRASG12V tumors in zebrafish brain (doi: 10.1186/s12943-015-0288-2)

      It is not clear what is the mechanism of Ventx -driven oncogenesis? What changes in gene expression, cell function etc are induced by Ventx in the cells that express KRASv12? The qPCR analysis performed is done on whole larvae and an analysis on single TICs and their progeny should be done following FACS sorting of fluorescent cells.  

      FACS sorting of a single TIC (and its progeny) among many thousand cells in the embryo is not possible. The analysis on whole larvae provides an underestimate of the changes in gene expression following activation of kRAS and VentX.  We are looking for spatial transcriptomics as a better approach of the changes in gene expression induced in single TICs and their progeny, but that is beyond the scope of this paper. 

      Nuclear staining is necessary to make sure that only 1 cell was transplanted. How is it possible that we get more than 50 cells from a single transplanted cell in less than 48 hours? What is the length of the cell cycle of these transformed cells? 

      Nuclear staining is not necessary as the transplanted cell is fluorescent. Thus we can see how many cells are transplanted. With a cell-cycle of about 10h in 3dpt, a single cell will have generated as many as 100 cells. 

      Reviewer #2 (Recommendations For The Authors): 

      Minor grammatical change - hyperplasic more commonly called hyperplastic. 

      Reviewer #3 (Recommendations For The Authors): 

      Provide Detailed Methodologies: Clearly describe all experimental protocols used, particularly those for cell transplantation and photo-activation techniques. Detailed protocols will aid in replicating your findings and enhancing the manuscript's credibility.  

      Done.

      Provide High-Resolution Imaging data: To substantiate the claims about cell location and behaviour, provide high-resolution images where individual cells and their specific tissue contexts are clearly visible. 

      Greater magnification images provided.

      Quantitative Data: Incorporate quantitative analyses to strengthen the findings, particularly in experiments where cell proliferation and activation are key outcomes. 

      Done.

      Verify Single Cell Activation: Offer additional evidence or experimental validation to support the claim that KRASG12V activation is confined to single cells, considering the limitations mentioned about the photo-activation setup. 

      Discussion, figures and statistical analysis added in manuscript.

      Discuss Stability and Leakage of cCYC: Provide data on the stability and half-life of cCYC to assess the likelihood of system leakiness, which could influence the interpretation of your results.  

      Reference to our previous papers and reviews added.

      Clarify Metastatic Claims: Discuss the unexpected presence of mTFP-positive cells in nontraditional metastatic sites, like the fin fold, and consider additional experiments to verify whether these are cases of ectopic activation or true metastasis.

      Discussion added in manuscript

      Utilize time-lapse live imaging to visually document the motility and behaviour of KRAS+ cells over time, leveraging the strengths of the zebrafish model. 

      Definitely interesting, but non trivial to conduct over many days and subject for a future paper.

      Address Discrepancies in KRAS Activation Effects from literature: Specifically, discuss why your findings on KRAS-induced hyperplasia differ from existing literature. Consider whether experimental conditions or KRAS expression levels might have contributed to these differences.  

      Discussion added in revised version

    1. Author response:

      The following is the authors’ response to the current reviews.

      Reviewer #1 (Public review):

      When different groups (populations, species) are presented with similar environmental pressures, how similar are the ultimate targets (genes, pathways)? This study sought to illuminate this broader question via experimental evolution in D. simulans and quantifying gene-expression changes, specifically in the context of standing genetic variation (and not de novo mutation). Ultimately, the authors showed pleiotropy and standing-genetic variation play a significant role in the "predictability" of evolution.

      The results of this manuscript look at the interplay between pleiotropy, standing genetic variation and parallelism (i.e. predictability of evolution) in gene expression. Ultimately, their results suggest that (a) pleiotropic genes typically have a smaller range in variation/expression, and (b) adaptation to similar environments tends to favor changes in pleiotropic genes, which leads to parallelism in mechanisms (though not dramatically). However, it is still uncertain how much parallelism is directly due to pleiotropy, instead of a complex interplay between them and ancestral variation.

      Yes, the reviewer is correct that our results for the direct effects of pleiotropy were not consistent for both measures of pleiotropy. We highlight this in the discussion:” Only tissue specificity had a significant direct effect, which was even larger than the indirect effect (Table 2). No significant direct effect was found for network connectivity. The discrepancy between the two measures of pleiotropy is particularly interesting given their significant correlation (Supplementary Figure 1). This suggests that both measures capture aspects of pleiotropy that differ in their biological implications.”

      Reviewer #2 (Public review):

      Summary:

      Lai and collaborators use a previously published RNAseq dataset derived from an experimental evolution set up to compare the pleiotropic properties of genes which expression evolved in response to fluctuating temperature for over 100 generations. The authors correlate gene pleiotropy with the degree of parallelisms in the experimental evolution set up to ask: are genes that evolved in multiple replicates more or less pleiotropic?

      They find that, maybe counter to expectation, highly pleiotropic genes show more replicated evolution. And such effect seems to be driven by direct effects (which the authors can only speculate on) and indirect effect through low variance in pleiotropic genes (which the authors indirectly link to genetic variation underlying gene expression variance).

      Weaknesses:

      The results offer new insights into the evolution of gene expression and into the parameters that constrain such evolution, i.e., pleiotropy. Although the conclusions are supported by the data, I find the interpretation of the results a little bit complicated.

      We are very happy to read that the reviewer finds our conclusions to be supported by the data.

      Major comment:

      The major point I ask the authors to address is whether the connection between polygenic adaptation and parallelism can indeed be used to interpret gene expression parallelism. If the answer is not, please rephrase the introduction and discussion, if the answer is yes, please make it explicit in the text why it is so.

      Yes, we think that gene expression parallelism can be explained by polygenic adaptation.

      The authors argument: parallelism in gene expression is the same as parallelism in SNP allele frequency (AFC) (see L389-383 here they don't mention that this explanation is derived from SNP parallelism and not trait parallelism, and see Fig1 b). In previous publications the authors have explained the low level of AFC parallelism using a polygenic argument. Polygenic traits can reach a new trait optimum via multiple SNPs and therefore although the trait is parallel across replicates, the SNPs are not necessarily so.

      In the current paper, they seem to be exchanging SNP AFC by gene expression, and to me, those are two levels that cannot be interchanged. Gene expression is a trait, not a SNP, and therefore the fact that a gene expression doesn't replicate cannot be explained by polygenic basis, because again the trait is gene expression itself. And, actually the results of the simulations show that high polygenicity = less trait parallelism (Fig4).

      We agree with the reviewer that it is important to consider different hierarchies when talking about the implications of polygenic adaptation. The lowest hierarchical level is SNP variation and the highest level is fitness. In-between these extreme hierarchical levels is gene expression. While gene expression is a trait itself, as correctly pointed out by the reviewer, it is possible that selection is not favoring a specific trait value, because selection targets a trait on a higher hierarchical level. This implies that not only SNPs, but also intermediate traits such as gene expression can exhibit redundancy. Considering a simple example of one selected trait (e.g. body size), which is affected by the expression level of two genes A and B, each regulated by SNP A1, A2 and B1, B2. It is now possible to modulate the focal trait by allele frequency changes of A1, which in turn will only affect gene A. Alternatively, SNP B2 may change, modifying the expression of gene B, leading to the same change in body size. Hence, we could have redundancy both at the SNP level as well as on the gene expression level (although higher redundancy is expected on the SNP level). Most importantly, this redundancy at intermediate hierarchical levels is not pure theory, but it is supported by empirical evidence. We have shown that redundancy exists not only for gene expression (10.1111/mec.16274) but also for metabolite concentrations (10.1093/gbe/evad098).

      Now, if the authors focus on high parallel genes (present in e.g. 7 or more replicates) and they show that the eQTLs for those genes are many (highly polygenic) and the AFC of those eQTL are not parallel, then I would agree with the interpretation. But, given that here they just assess gene expression and not eQTL AFC, I do not think they can use the 'highly polygenic = low parallelism' explanation.

      This is clearly an interesting proposed research project, but we doubt that it would result in the expected outcome. Since most of the adaptive gene expression changes are not having a simple genetic basis (10.1093/gbe/evae077) and most expression variation is determined by trans-regulatory effects (10.1038/s41576-020-00304-w), eQTL mapping will most likely not identify all contributing loci. Large effect loci are more easily identified, but they are also expected to be more parallel.

      The interpretation of the results to me, should be limited to: genes with low variance and high pleiotropy tend to be more parallel, and the explanation might be synergistic pleiotropy.

      We thank the reviewer for the suggestion, but prefer to stick to our interpretation of the data.

      Comments on revisions: The authors didn't really address any of the comments made by any of the reviewers - basically nothing was changed in the main text. Therefore, I leave my original review unchanged.

      We modestly disagree, in our point to point reply, we respond to all reviewers’ comments. Since, we did not identify any major problem in our manuscript, we only modified the wording in some parts where we felt that a clarification could resolve the misunderstanding of the reviewers. In response to the reviewers’ comments, we added a new paragraph in the discussion and generated a new figure.

      Reviewer #3 (Public review):

      The authors aim to understand how gene pleiotropy affects parallel evolutionary changes among independent replicates of adaptation to a new hot environment of a set of experimental lines of Drosophila simulans using experimental evolution. The flies were RNAsequenced after more than 100 generations of lab adaptation and the changes in average gene expression were obtained relative to ancestral expression levels from reconstructed ancestral lines. Parallelism of gene expression change among lines is evaluated as variance in differential gene expression among lines relative to error variance. Similarly, the authors ask how the standing variation in gene expression estimated from a handful of flies from a reconstructed outbred line affects parallelism. The main findings are that parallelism in gene expression responses is positively associated with pleiotropy and negatively associated with expression variation. Those results are in contradiction with theoretical predictions and empirical findings. To explain those seemingly contradictory results the authors invoke the role of synergistic pleiotropy and correlated selection, although they do not attempt to measure either.

      Strengths:

      The study uses highly replicated outbred laboratory lines of Drosophila simulans evolved in the lab under constant hot regime for over 100 generations. This allows for robust comparisons of evolutionary responses among lines.

      The manuscript is well written and the hypotheses are clearly delineated at the onset.

      The authors have run a causal analysis to understand the causal dependencies between pleiotropy and expression variation on parallelism.

      The use of whole-body RNA extraction to study gene expression variation is well justified.

      Weaknesses:

      The accuracy of the estimate of ancestral phenotypic variation in gene expression is likely low because estimated from a small sample of 20 males from a reconstructed outbred line. It might not constitute a robust estimate of the genetic variation of the evolved lines under study.

      We agree with the reviewer that variation estimates based on 20 samples are not very precise. Nevertheless, we demonstrated that the estimated variance in gene expression was highly correlated between two independent samples from the same ancestral population. Furthermore, we identified a significant correlation of expression variance with evolutionary parallelism. In other words, the biological signal has been sufficiently strong despite the variance estimate has been noisy.

      There are no estimates of the standing genetic variation of expression levels of the genes under study, only estimates of their phenotypic variation. I wished the authors had been clear about that limitation and had refrained from equating phenotypic variation in expression level with standing genetic variation.

      The reviewer is right that we did not estimate genetic variation of gene expression, but use expression variation as a proxy for the standing genetic variation. There are two potential problems with this approach. First, a large expression variation could be caused by a single large effect variant segregating at intermediate frequency. Such large effect variants will exhibit a highly parallel selection response-contrary to our empirical results. Since we have shown previously (10.1093/gbe/evae077) that adaptive gene expression changes are mostly polygenic we do not consider this extreme scenario to be very relevant in our study. Rather, we would like to emphasize that neither a SNP analysis of the 5’ region nor an eQTL study will provide an unbiased estimator of genetic variation of gene expression. The second problem arises if gene expression noise differs among genes, hence more noisy genes will appear to have more standing genetic variation than genes with less noise. Since, we average across many different cells and cell types, gene expression noise is expected to be levelled out- this aspect is discussed in detail in the manuscript.

      In other words, despite these two potential limitations, we consider our approach superior to alternative approaches of estimating genetic variation in gene expression.

      Moreover, since the phenotype studied is gene expression, its genetic basis extends beyond expressed sequences. The phenotypic variation of a gene's expression may thus likely misrepresent the genetic variation available for its evolution. The authors do not present evidence that sequence variation correlates with expression variation.

      Gene expression is determined by the joint effects of cis-regulatory and trans-regulatory variation. Hence, recombination can create more extreme phenotypes than the one of the parental lines (in quantitative genetics this is called transgressive segregation). It is unclear to what extent this constitutes a problem for our analyses. Nevertheless, we would like to point out that eQTL mapping will miss many trans-acting variants and therefore we doubt that the requested empirical evidence for correlation between genetic variation (estimated by eQTL mapping) and observed expression variation is as straight forward as suggested by the reviewer.

      Nevertheless, we reference an empirical study, which showed a positive correlation between expression variation and cis-regulatory variation.

      The authors have not attempted to estimate synergistic pleiotropy among genes, nor how selection acts on gene expression modules. It makes their conclusion regarding the role of synergistic pleiotropy rather speculative.

      The reviewer is correct that we did not demonstrate synergistic pleiotropy, but we discuss this as a possible explanation for the observed direct effects of pleiotropy.


      The following is the authors’ response to the original reviews.

      Reviewer #1 (Public review):

      The results of this manuscript look at the interplay between pleiotropy, standing genetic variation, and parallelism (i.e. predictability of evolution) in gene expression. Ultimately, their results suggest that (a) pleiotropic genes typically have a smaller range in variation/expression, and (b) adaptation to similar environments tends to favor changes in pleiotropic genes, which leads to parallelism in mechanisms (though not dramatically). However, it is still uncertain how much parallelism is directly due to pleiotropy, instead of a complex interplay between them and ancestral variation.

      I have a few things that I was uncertain about. It may be these things are easily answered but require more discussion or clarity in the manuscript.

      (1) The variation being talked about in this manuscript is expression levels, and not SNPs within coding regions (or elsewhere). The cause of any specific gene having a change in expression can obviously be varied - transcription factors, repressors, promoter region variation, etc. Is this taken into account within the "network connectivity" measurement? I understand the network connectivity is a proxy for pleiotropy - what I'm asking is, conceptually, what can be said about how/why those highly pleiotropic genes have a change (or not) in expression. This might be a question for another project/paper, but it feels like a next step worth mentioning somewhere.

      In current study, we are only able to detect significant and repeatable expression changes but unable to identify the underlying causal variants. An eQTL study in the founder population in combination with genomic resequencing for both evolved and ancestral populations would be required to address this question.

      (2) The authors do have a passing statement in line 361 about cis-regulatory regions. Is the assumption that genetic variation in promoter regions is the ultimate "mechanism" driving any change in expression? In the same vein, the authors bring up a potential confounding factor, though they dismiss it based on a specific citation (lines 476-481; citation 65). I'm of the mindset that in order to more confidently disregard this "issue" based on previous evidence, it requires more than one citation. Especially since the one citation is a plant. That specific point jumps out to me as needing a more careful rebuttal.

      It was not our intention to claim that the expression changes in our experiment are caused by cis-regulatory variation only. We believe that the observed expression variation has both cis- and trans-genetic components, where as some studies tend to estimate much higher cisvariation for gene expression in Drosophila populations (e.g. [1, 2]). We mentioned the positive correlation between cis-regulatory polymorphism and expression variation to (1) highlight the genetic control of gene expression and (2) make the connection between polygenic adaptation and gene expression evolutionary parallelism.

      (3) I feel like there isn't enough exploration of tissue specificity versus network connectivity. Tissue specificity was best explained by a model in which pleiotropy had both direct and indirect effects on parallelism; while network connectivity was best explained (by a small margin) via the model which was mostly pleiotropy having a direct effect on ancestral variation, that then had a direct effect on parallelism. When the strengths of either direct/indirect effects were quantified, tissue specificity showed a stronger direct effect, while network connectivity had none (i.e. not significant). My confusion is with the last point - if network connectivity is explained by a direct effect in the best-supported model, how does this work, since the direct effect isn't significant? Perhaps I am misunderstanding something.

      To clarify, for network connectivity, there’s a significant “indirect” effect on parallelism (i.e. network connectivity affect ancestral gene expression and ancestral gene expression affect parallelism). Hence, in table 2, the direct effect of network connectivity on parallelism is weak and not significant while the indirect effect via ancestral variation is significant.

      Also, network connectivity might favor the most pleiotropic genes being transcription factor hubs (or master regulators for various homeostasis pathways); while the tissue specificity metric perhaps is a kind of a space/time element. I get that a gene having expression across multiple tissues does fit the definition of pleiotropy in the broad sense, but I'm wondering if some important details are getting lost - I'm just thinking about the relative importance of what tissue specificity measurements say versus the network connectivity measurement.

      We examined the statistical relationship between the two measures and found a moderate positive correlation on the basis of which we argued that the two measures may capture different aspects of pleiotropy. We appreciate the reviewer’s suggestions about the biological basis of the two estimates of pleiotropy, but we think that without further experimental insights, an extended discussion of this topic is too premature to provide meaningful insights to the readership.

      Reviewer #2 (Public review):

      Summary:

      Lai and collaborators use a previously published RNAseq dataset derived from an experimental evolution set up to compare the pleiotropic properties of genes whose expression evolved in response to fluctuating temperature for over 100 generations. The authors correlate gene pleiotropy with the degree of parallelisms in the experimental evolution set up to ask: are genes that evolved in multiple replicates more or less pleiotropic?

      They find that, maybe counter to expectation, highly pleiotropic genes show more replicated evolution. Such an effect seems to be driven by direct effects (which the authors can only speculate on) and indirect effects through low variance in pleiotropic genes (which the authors indirectly link to genetic variation underlying gene expression variance).

      Weaknesses:

      The results offer new insights into the evolution of gene expression and into the parameters that constrain such evolution, i.e., pleiotropy. Although the conclusions are supported by the data, I find the interpretation of the results a little bit complicated.

      Major comment:

      The major point I ask the authors to address is whether the connection between polygenic adaptation and parallelism can indeed be used to interpret gene expression parallelism. If the answer is not, please rephrase the introduction and discussion, if the answer is yes, please make it explicit in the text why it is so.

      Our answer is yes, we interpreted gene expression parallelism (high ancestral variance -> less parallelism) using the same framework that links polygenic adaptation and parallelism (high polygenicity = less trait parallelism). We believe that our response covers several of the reviewer’s concerns.

      The authors' argument: parallelism in gene expression is the same as parallelism in SNP allele frequency (AFC) (see L389-383 here they don't mention that this explanation is derived from SNP parallelism and not trait parallelism, and see Figure 1 b). In previous publications, the authors have explained the low level of AFC parallelism using a polygenic argument. Polygenic traits can reach a new trait optimum via multiple SNPs and therefore although the trait is parallel across replicates, the SNPs are not necessarily so.

      Importantly, our rationale is based on the idea that gene expression is rarely the direct target of selection, but rather an intermediate trait [3]. Recently, we have specifically tested this assumption for gene expression and metabolite concentrations and our analysis showed that both traits were are redundant [4], as previously shown for DNA sequences [5]. The important implication for this manuscript is that gene expression is also redundant, so that adaptation can be achieved by distinct changes in gene expression in replicate populations adapting to the same selection pressure. This implies that we can use the same simulation framework for gene expression as for sequencing data. In our case different SNP frequencies correspond to different expression levels (averaged across individuals from a population), which in turn increases fitness by modifying the selected trait. Importantly, the selected trait in our simulations is not gene expression, but a not defined high level phenotype. A key insight from our simulations is that with increasing polygenicity the expression of a gene is more variable in the ancestral population.

      In the current paper, they seem to be exchanging SNP AFC by gene expression, and to me, those are two levels that cannot be interchanged. Gene expression is a trait, not an SNP, and therefore the fact that a gene expression doesn't replicate cannot be explained by a polygenic basis, because again the trait is gene expression itself. And, actually, the results of the simulations show that high polygenicity = less trait parallelism (Figure 4).

      As detailed above, because adaptation can be reached by changes in gene expression at different sets of genes, redundancy is also operating on the expression level not just on the level of SNPs. To clarify, the x-axis of Fig. 4 is the expression variation in the ancestral population.

      Now, if the authors focus on high parallel genes (present in e.g. 7 or more replicates) and they show that the eQTLs for those genes are many (highly polygenic) and the AFC of those eQTLs are not parallel, then I would agree with the interpretation. But, given that here they just assess gene expression and not eQTL AFC, I do not think they can use the 'highly polygenic = low parallelism' explanation.

      The interpretation of the results to me, should be limited to: genes with low variance and high pleiotropy tend to be more parallel, and the explanation might be synergistic pleiotropy.

      While we understand the desire to model the full hierarchy from eQTLs to gene expression and adaptive traits, we raise caution that this would be a very challenging task. eQTLs very often underestimate the contribution of trans-acting factors, hence the understanding of gene expression evolution based on eQTLs is very likely incomplete and cannot explain the redundancy of gene expression during adaptation. Hence, we think that the focus on redundant gene expression is conceptually simpler and thus allows us to address the question of pleiotropy without the incorporation of allele frequency changes.  

      Reviewer #3 (Public review):

      The authors aim to understand how gene pleiotropy affects parallel evolutionary changes among independent replicates of adaptation to a new hot environment of a set of experimental lines of Drosophila simulans using experimental evolution. The flies were RNAsequenced after more than 100 generations of lab adaptation and the changes in average gene expression were obtained relative to ancestral expression levels from reconstructed ancestral lines. Parallelism of gene expression change among lines is evaluated as variance in differential gene expression among lines relative to error variance. Similarly, the authors ask how the standing variation in gene expression estimated from a handful of flies from a reconstructed outbred line affects parallelism. The main findings are that parallelism in gene expression responses is positively associated with pleiotropy and negatively associated with expression variation. Those results are in contradiction with theoretical predictions and empirical findings. To explain those seemingly contradictory results the authors invoke the role of synergistic pleiotropy and correlated selection, although they do not attempt to measure either.

      Strengths:

      (1) The study uses highly replicated outbred laboratory lines of Drosophila simulans evolved in the lab under a constant hot regime for over 100 generations. This allows for robust comparisons of evolutionary responses among lines.

      (2) The manuscript is well written and the hypotheses are clearly delineated at the onset.

      (3) The authors have run a causal analysis to understand the causal dependencies between pleiotropy and expression variation on parallelism.

      (4) The use of whole-body RNA extraction to study gene expression variation is well justified.

      Weaknesses:

      (1) It is unclear how well phenotypic variation in gene expression of the evolved lines has been estimated by the sample of 20 males from a reconstructed outbred line not directly linked to the evolved lines under study. I see this as a general weakness of the experimental design.

      Our intention was not to measure the phenotypic variance of the evolved lines, but rather to estimate the phenotypic variance at the beginning of the experiment. Hence, we measured and investigated the variation of gene expression in the ancestral population since this was the beginning of the replicated experimental evolution. Furthermore, since the ancestral population represents the natural population in Florida, the gene expression variation reflects the history of selection history acting on it.

      (2) There are no estimates of standing genetic variation of expression levels of the genes under study, only phenotypic variation. I wished the authors had been clear about that limitation and had discussed the consequences of the analysis. This also constitutes a weakness of the study.

      The reviewer is correct that we do not aim to estimate the standing genetic variation, which is responsible for differences in gene expression. While we agree that it could be an interesting research question to use eQTL mapping to identify the genetic basis of gene expression, we caution that trans-effects are difficult to estimate and therefore an important component of gene expression evolution will be difficult to estimate. Hence, we consider that our focus on variation in gene expression without explicit information about the genetic basis is simpler and sufficient to address the question about the role of pleiotropy.

      (3) Moreover, since the phenotype studied is gene expression, its genetic basis extends beyond expressed sequences. The phenotypic variation of a gene's expression may thus likely misrepresent the genetic variation available for its evolution. The genetic variation of gene expression phenotypes could be estimated from a cross or pedigree information but since individuals were pool-sequenced (by batches of 50 males), this type of analysis is not possible in this study.

      We agree with the reviewer that gene expression variation may also have a non-genetic basis, we discuss this in depth in the discussion of the manuscript.  

      (4) The authors have not attempted to estimate synergistic pleiotropy among genes, nor how selection acts on gene expression modules. It makes any conclusion regarding the role of synergistic pleiotropy highly speculative.

      We mentioned synergistic pleiotropy as a possible explanation for our results. A positive correlation between the fitness effect of gene expression variation would predict more replicable evolutionary changes. A similar argument has been made by [6]. 

      I don't understand the reason why the analysis would be restricted to significantly differentially expressed genes only. It is then unclear whether pleiotropy, parallelism, and expression variation do play a role in adaptation because the two groups of adaptive and non-adaptive genes have not been compared. I recommend performing those comparisons to help us better understand how "adaptive" genes differentially contribute to adaptation relative to "nonadaptive" genes relative to their difference in population and genetic properties.

      We agree with the reviewer that the comparison between the pleiotropy of adaptive and nonadaptive genes is interesting. We performed the analysis but omitted from the current manuscript for simplicity. Similar to the results in [6], non-adaptive genes are more pleiotropic than the adaptive genes. For adaptive genes we find a positive correlation between the level of pleiotropy and evolutionary parallelism. Thus, high pleiotropy limits the evolvability of a gene, but moderate and potentially synergistic pleiotropy increases the repeatability of adaptive evolution. We included this result in the revised manuscript and discuss it.

      There is a lack of theoretical groundings on the role of so-called synergistic pleiotropy for parallel genetic evolution. The Discussion does not address this particular prediction. It could be removed from the Introduction.

      We modestly disagree with the reviewer, synergistic pleiotropy is covered by theory and empirical results also support the importance of synergistic pleiotropy. 

      References

      (1) Genissel A, McIntyre LM, Wayne ML, Nuzhdin SV. Cis and trans regulatory effects contribute to natural variation in transcriptome of Drosophila melanogaster. Molecular biology and evolution. 2008;25(1):101-10. Epub 20071112. doi: 10.1093/molbev/msm247. PubMed PMID: 17998255.

      (2) Osada N, Miyagi R, Takahashi A. Cis- and Trans-regulatory Effects on Gene Expression in a Natural Population of Drosophila melanogaster. Genetics. 2017;206(4):2139-48. Epub 20170614. doi: 10.1534/genetics.117.201459. PubMed PMID: 28615283; PubMed Central PMCID: PMCPMC5560811.

      (3) Barghi N, Hermisson J, Schlötterer C. Polygenic adaptation: a unifying framework to understand positive selection. Nature reviews Genetics. 2020;21(12):769-81. Epub 2020/07/01. doi: 10.1038/s41576-020-0250-z. PubMed PMID: 32601318.

      (4) Lai WY, Otte KA, Schlötterer C. Evolution of Metabolome and Transcriptome Supports a Hierarchical Organization of Adaptive Traits. Genome biology and evolution. 2023;15(6). Epub 2023/05/26. doi: 10.1093/gbe/evad098. PubMed PMID: 37232360; PubMed Central PMCID: PMCPMC10246829.

      (5) Barghi N, Tobler R, Nolte V, Jaksic AM, Mallard F, Otte KA, et al. Genetic redundancy fuels polygenic adaptation in Drosophila. PLoS biology. 2019;17(2):e3000128. Epub 2019/02/05. doi: 10.1371/journal.pbio.3000128. PubMed PMID: 30716062.

      (6) Rennison DJ, Peichel CL. Pleiotropy facilitates parallel adaptation in sticklebacks. Molecular ecology. 2022;31(5):1476-86. Epub 2022/01/09. doi: 10.1111/mec.16335. PubMed PMID: 34997980; PubMed Central PMCID: PMCPMC9306781.

    1. Author response:

      The following is the authors’ response to the original reviews.

      Reviewer 1:

      Point 1 of public reviews and point 2 of recommendations to authors. 

      Temporal ambiguity in credit assignment: While the current design provides clear task conditions, future studies could explore more ambiguous scenarios to further reflect real-world complexity…. The role of ambiguity is very important for the credit assignment process. However, in the current task design, the instruction of the task design almost eliminates the ambiguity of which the trial's choice should be assigned credit to. The authors claim the realworld complexity of credit assignment in this task design. However, the real-world complexity of this type of temporal credit assignment involves this type of temporal ambiguity of responsibility as causal events. I am curious about the consequence of increasing the complexity of the credit assignment process, which is closer to the complexity in the real world.

      We agree that the structure of causal relationships can be more ambiguous in real-world contexts. However, we also believe that there are multiple ways in which a task might approach “real-world complexity”. One way is by increasing the ambiguity in the relationships between choices and outcomes (as done by Jocham et al., 2016). Another is by adding interim decisions that must be completed between viewing the outcome of a first choice, which mimics task structures such as the cooking tasks described in the introduction. In such tasks, the temporal structure of the actions maybe irrelevant, but the relationship between choice identities and the actions is critical to be effective in the task (e.g., it doesn’t matter whether I add spice before or after the salt, all I need to know that adding spice will result in spicy soup).  While ambiguity about either form of causal relation is clearly an important part of real-world complexity, and would make credit assignment harder, our study focuses on how links between outcomes and specific past choice identities are created at the neural level when they are known to be causal. 

      We consequently felt it necessary to resolve temporal ambiguity for participants. Instructing participants on the structure of the task allowed us to make assumptions about how credit assignment for choice identities should proceed (assign credit to the choice made N trials back) and allowed us make positive predictions about the content of representations in OFC when viewing an outcome. This gave the highest power to detect multivariate information about the causal choice and the highest interpretability of such findings. 

      In contrast, if we had not resolved this ambiguity, it would be difficult to tell if incorrect decoding from the classifier resulted from noise in the neural signal, or if on that trial participants were assigning credit to non-causal choices that they erroneously believed to have caused the outcome due to the perceived temporal structure. We believe this would have ultimately decreased our power to determine whether representations of the causal choice were present at the time of outcome because we would have to make assumptions about what counts as a “true” causal representation. 

      We have commented on this in the discussions (p.13): 

      “While our study was designed to focus on the complexity of assigning credit in tasks with different known causal structures, another important component of real-world credit assignment is temporal ambiguity. To isolate the mechanisms which create associations between specific choices and specific outcomes, we instructed participants on the causal structure of each task, removing temporal ambiguity about the causal choice.  However, our results are largely congruent with previously reported results in tasks that dissolved the typical experimental trial structure, producing temporal ambiguity, and which observed more pronounced spreading of effect, in addition to appropriate credit assignment (Jocham et al, 2016).  Namely, this study found that activation in the lOFC increased only when participants received rewards contingent on a previous action, an effect that was more pronounced in subjects whose behavior reflected more accurate credit assignment. This suggests a shared lOFC mechanism for credit assignment in different types of complex environments. Whether these mechanisms extend to situations where the temporal causal structure is completely unknown remains an important question.”

      Point 2 of public reviews and point 1 of recommendations to authors

      Role of task structure understanding: The difference in task comprehension between human subjects in this study and animal subjects in previous studies offers an interesting point of comparison…. The credit assignment involves the resolution of the ambiguity in which the causal responsibility of an outcome event is assigned to one of the preceding events. In the original study of Walton and his colleagues, the monkey subjects could not be instructed on the task structure defining the causal relationships of the events. Then, the authors of the original study observed the spreading of the credit assignments to the "irrelevant" events, which did not occur in the same trial of the outcome event but to the events (choices) in neighbouring trials. This aberrant pattern of the credit assignment can be due to the malfunctions of the credit assignment per se or the general confusion of the task structure on the part of the monkey subjects. In the current study design, the subjects are humans and they are not confused about the task structure. Consistently, it is well known that human subjects rarely show the same patterns of the "spreading of credit assignment". So the implicit mechanism of the credit assignment process involves the understanding of the task structure. In the current study, there are clearly demarked task conditions that almost resolve the ambiguity inherent in the credit assignment process. Yet, the focus of the current analysis stops short of elucidating the role of understanding the task structure. It would be great if the authors could comment on the general difference in the process between the conditions, whether it is behavioral or neural.

      We would like to thank the reviewer for making this important point. We believe that understanding the structure of the credit-assignment problem above is quite important, at least for the type of credit assignment described here. That is, because participants know that the outcome viewed is caused by the choice they made, 0 or 1 trials into the past, they can flexibly link choice identities to the newly observed outcomes as the probabilities change. Note, however, that this is already very challenging in the 1-back condition because participants need to track the two independently changing probabilities. We believe this is critical to address the questions we aimed to answer with this experiment, as described above. 

      We agree that this might be quite different from previous studies done with non-human primates, which also included many more training trials and lesions to the lOFC. Both of these aspects could manifest as difference in task performance and processing at behavioural and neural levels, respectively. Consistent with this possibility, in our task, we found no differences in credit spreading between conditions, suggesting that humans were quite precise in both, despite causal relationships being harder to track in the “indirect transition condition”. This lack of credit spreading could be because humans better understood the task-structure compared to macaques or be due to differences in functioning of the OFC and other regions. Because all participants were trained to understand, and were cued with explicit knowledge of, the task structure, it is difficult to isolate its role as we would need another condition in which they were not instructed about the task structure. This would also be an interesting study, and we leave it to future research to parse the contributions of task-structure ambiguity to credit assignment. 

      Point 3 of public reviews. 

      The authors used a sophisticated method of multivariate pattern analysis to find the neural correlate of the pending representation of the previous choice, which will be used for the credit assignment process in the later trials. The authors tend to use expressions that these representations are maintained throughout this intervening period. However, the analysis period is specifically at the feedback period, which is irrelevant to the credit assignment of the immediately preceding choice. This task period can interfere with the ongoing credit assignment process. Thus, rather than the passive process of maintaining the information of the previous choice, the activity of this specific period can mean the active process of protecting the information from interfering and irrelevant information. It would be great if the authors could comment on this important interpretational issue.

      We agree that lFPC is likely actively protecting the pending choice representation from interference with the most recent choice for future credit assignment. This interpretation is largely congruent with the idea of “prospective memory” (e.g., Burgess, Gonen-Yaacovi, Volle, 2011), in which the lFPC can be thought of as protecting information that will be needed in the future but is not currently needed for ongoing behavior. That said, from our study alone it is difficult to make claims about whether the information maintained in frontal pole is actively protecting this information because of potentially interfering processes. Our “indirect transition condition” only contains trials where there is incoming, potentially interfering information about new outcomes, but no trials that might avoid interference (e.g., an interim choice made but there is nothing to be learned from it). We comment on this important future direction on page 14:  

      “One interpretation of these results is that the lFPC actively protects information about causal choices when potentially interfering information must be processed. Future studies will be needed to determine if the lFPC’s contributions are specific to these instances of potential interference, and whether this is a passive or active process”

      Point 3 of recommendation to authors 

      A slightly minor, but still important issue is the interpretation of the role of lOFC. The authors compared the observed patterns of the credit assignment to the ideal patterns of credit assignment. Then, the similarity between these two matrices is used to find the associated brain region. In the assumption that lOFC is involved in the optimal credit assignment, the result seems reasonable. But as mentioned above, the current design involves the heavy role of understanding the task structure, it is debatable whether the lOFC is just involved in the credit assignment process or a more general role of representing the task structure.

      We agree that this is an important distinction to make, and it is very likely that multiple regions of the OFC carry information about the task structure, and the extent to which participants understood this structure may be reflected in behavioral estimates of credit assignment or the overall patterns of the matrices (though all participants verbalized the correct structure prior to the task). However, we believe that in our task the lOFC is specifically involved in credit-assignment because of the content of the information we decoded. We demonstrated that the lOFC and HPC carry information about the causal choice during the outcome. These results cannot be explained by differences in understanding of the task structure because that understanding would have been consistent across trials where participants choose either shape identity. Thus, a classifier could not use this to separate these types of trials and would reflect chance decoding.   

      One interpretation of the lOFC’s role in credit assignment is that it is particularly important when a model of the task structure has to be used to assign credit appropriately. Here, we show lOFC the reinstates specific causal representations precisely at the time credit needs to be assigned, which are appropriate to participants’ knowledge of the task structure.  These representations may exist alongside representations of the task structure, in the lOFC and other regions of the brain (Park et al., 2020; Boorman et al., 2021; Seo and Lee, 2010; Schuck et al., 2016). We have added the following sentences to clarify our perspective on this point in the discussion (p. 13):

      “Our results from the “indirect transition” condition show that these patterns are not merely representations of the most recent choice but are representations of the causal choice given the current task structure, and may exist alongside representations of the task structure, in the lOFC and elsewhere (Boorman et al., 2021; Park et al., 2020; Schuck et al., 2016; Seo & Lee, 2010).”

      Point 4 of public reviews and point 4 of recommendation to authors

      Broader neural involvement: While the focus on specific regions of interest (ROIs) provided clear results, future studies could benefit from a whole-brain analysis approach to provide a more comprehensive understanding of the neural networks involved in credit assignment… Also, given the ROI constraint of the analysis, the other neural structure may be involved in representing the task structure but not detected in the current analysis

      Given our strong a priori hypotheses about regions of interest (ROIs) in this study, we focused on these specific areas. This choice was based on theoretical and empirical grounds that guided our investigation. However, we thank the reviewer for pointing this out and agree that there could be other unexplored areas that are critical to credit-assignment which we did not examine. 

      We conducted the same searchlight decoding procedure on a whole brain map and corrected for multiple comparisons using TFCE. We found no significant regions of the brain in the “direct transition condition” but did find other significant regions in our information connectivity analysis of the “indirect transition condition”. In addition to replicating the effects in lOFC and HPC, we also found a region of mOFC which showed a strong correlation with pending choice in lFPC. It’s difficult to say whether this region is involved in credit assignment per se, because we did not see this region in the “direct transition condition” and so we cannot say that it is consistently related to this process. However, the mOFC is thought to be critical to representing the current task state (Schuck et al., 2016), and the task structure (Park et al., 2020). In our task, it could be a critical region for communicating how to assign credit given the more complex task structure of the “indirect transition condition” but more evidence would be needed to support this interpretation. 

      For now, we have added the results of this whole brain analysis to a new supplementary figure S7 (page 41), and all unthresholded maps have been deposited in a Neurovault repository, which is linked in the paper, for interested readers to assess.  

      Minor points:

      There are some missing and confusing details in the Figure reference in the main text. For example, references to Figure 3 are almost missing in the section "Pending item representations in FPl during indirect transitions predict credit assignment in lOFC". For readability, the authors should improve this point in this section and other sections.

      Thank you to the reviewer for pointing this out. We have now added references to Figure 3 on page 8:

      “Our analysis revealed a cluster of voxels specifically within the right lFPC ([x,y,z] = [28, 54, 8], t(19) = 3.74, pTFCE <0.05 ROI-corrected; left hemisphere all pTFCE > 0.1, Fig. 3A)”

      And on page 10: 

      Specifically, we found significant correlations in decoding distance between lFPC and bilateral lOFC ([x,y,z] = [-32,24, -22], t(19) = 3.81, [x,y,z] = [20, 38, -14], t(19) = 3.87, pTFCE <0.05 ROI corrected]) and bilateral HC ([x,y,z] = [-28, -10, -24], t(19) = 3.41, [x,y,z] = [22, -10, -24], t(19) = 4.21, pTFCE <0.05 ROI corrected]), Fig. 3C).

      Task instructions for the two conditions (direct and indirect) play important roles in the study. If possible, please include the following parts in the figures and descriptions in the introduction and/or results sections.

      We have now included a short description of the condition instructions beginning on page 5: 

      “Participants were instructed about which condition they were in with a screen displaying “Your latest choice” in the direct transition condition, and “Your previous choice” in the indirect condition.”

      And have modified Figure 1 to include the instructions in the title of each condition. We thought this to be the most parsimonious solution so that the choice options in the examples were not occluded. 

      The subject sample size might be slightly too small in the current standards. Please give some justifications.

      We originally selected the sample size for this study to be commensurate with previous studies that looked for similar behavioral and neural effects (see Boorman et al., 2016; Howard et al., 2015; Jocham et al., 2016). This has been mentioned in the “methods” section on page 24.  

      However, to be thorough, we performed a power analysis of this sample size using simulations based on an independently collected, unpublished data set. In this data set, 28 participants competed an associative learning task similar to the task in the current manuscript. We trained a classifier to decode causal choice option at the time of feedback, using the same searchlight and cross-validation procedures described in the current manuscript, for the same lateral OFC ROI. We calculated power for various sample sizes by drawing N participants with replacement 1000 times, for values of N ranging from 15 to 25. After sampling the participants, we tested for significant decoding for the causal choice within the subset of data, using smallvolume TFCE correction to correct for multiple comparisons. Finally, we calculated the proportion of these samples that were significant at a level of pTFCE <.05.  

      The results of this procedure show that an N of 20 would result in 84.2% power, which is slightly above the typically acceptable level of 80%. We have added the following sentences to the methods section on page 25: 

      “Using an independent, unpublished data set, we conducted a power analysis for the desire neural effect in lOFC. We found that this number of participants had 84% power to detect this effect (Fig. S8).” 

      We also added the following figure to the supplemental figures page (42):

      Reviewer 2:

      I have several concerns regarding the causality analyses in this study. While Multivariate analyses of information connectivity between regions are interesting and appear rigorous, they make some assumptions about the nature of the input data. It is unclear if fMRI with its poor temporal resolution (in addition to possible region-specific heterogeneity in the readouts), can be coupled with these casual analysis methods to meaningfully study dynamics on a decision task where temporal dynamics is a core component (i.e., delay). It would be helpful to include more information/justification on the methods for inferring relationships across regions from fMRI data. Along this line, discussing the reported findings in light of these limitations would be essential.

      We agree that fMRI is limited for capturing fast neural dynamics, and that it can be difficult to separate events that occur within a few seconds. However, we designed the information connectivity analysis to maximally separate the events in question – the representations of the causal choice being held in a pending state, and the representation of the causal choice during credit assignment. These events were separated by at least 10 seconds and by 15 seconds on average, which is commensurate with recommended intervals for disentangling information in such analysis (Mumford et al., 2012, 2014, also see van Loon et al., 2018, eLife; as example of fluctuations in decodability over time). This feature of our task design may not have been clear because information connectivity analyses are typically performed in the same task period. We clarify this point on page 32:

      “Note that the decoding fidelity metric at each time point represents the decodability of the same choice at different phases of the task. These phases were separated by at least 10 seconds and 15 seconds on average, which can be sufficient for disentangling unique activity (Mumford et al., 2012, 2014).”

      However, we agree with the reviewer that the limitations of fMRI make it difficult to precisely determine how roles of the OFC and lFPC might change over time, and whether other regions may contribute to information transfer at times scales which cannot be detected by fMRI. Further, we do not wish to imply causality between lFPC and lOFC (something we believe we do not claim in the paper), only that information strength in lFPC predicts subsequent strength of the same information in the OFC and HC. We have clarified this limitation on page 14:

      “Although we show evidence that lFPC is involved in maintaining specific content about causal choices during interim choices, the limited temporal resolution of fMRI makes it difficult to tell if other regions may be supporting the learning processes at timescales not detectable in the BOLD response. Thus, it is possible that the network of regions supporting credit assignment in complex tasks may be much larger. Our results provide a critical first stem in discerning the nature of interactions between cognitive subsystems that make different contributions to the learning process in these complex tasks.”

      Reviewer 3:  

      Point 1 of public reviews:

      They do find (not surprisingly) that the one-back task is harder. It would be good to ensure that the reason that they had more trouble detecting direct HC & lOFC effects on the harder task was not because the task is harder and thus that there are more learning failures on the harder oneback task. (I suspect their explanation that it is mediated by FPl is likely to be correct. But it would be nice to do some subsampling of the zero-back task [matched to the success rate of the one-back task] to ensure that they still see the direct HC and lOFC there).

      We would like to thank the reviewer for this comment and agree that the “indirect transition condition” is more difficult than the direct transition condition. However, in this task it is difficult to have an explicit measure of learning failures per se because the “correctness” of a choice is to some extent subjective (i.e., based on the gift card preference and the computational model). We could infer when learning failures occur through the computational model by looking at trials in which participants made choices that the model would consider improbable, (i.e., non-reward maximizing) while accounting for outcome preference. However, there are also a myriad of other possible explanations for these choices, such as exploratory/confirmatory strategies, lapses in attention etc. Thus, we could not guarantee that the two conditions would be uniquely matched in difficulty with specific regard to learning even if we subsampled these trials. We feel it would be better left to future experiments which can specifically compare learning failures to tackle this issue. We have now addressed this point when discussing the model on page 31:  

      “Note that learning failures are not trivial to identify in our paradigm and model, because every choice is based on a participant’s preference between gift card outcomes, and the ability of the computational model to accurately estimate participants’ beliefs in the stimulus-outcome transition probabilities.”

      Point 2 of public reviews:

      The evidence that they present in the main text (Figure 3) that the HC and lOFC are mediated by FPl is a correlation. I found the evidence presented in Supplemental Figure 7 to be much more convincing. As I understand it, what they are showing in SF7 is that when FPl decodes the cue, then (and only then) HC and lOFC decode the cue. If my understanding is correct, then this is a much cleaner explanation for what is going on than the secondary correlation analysis. If my understanding here is incorrect, then they should provide a better explanation of what is going on so as to not confuse the reader.

      SF7 (now Figures 3C and 3D) does show that positive decoding in the HC and lOFC are more likely to occur when there is positive decoding in lFPC. However, the analysis shown in these figures are only meant to be control analysis to further characterise what is being captured, but not necessarily implied, by the information connectivity analysis. For example, in principle the classifier might never correctly decode a choice label in the lOFC or HC while still getting closer to the hyperplane when the lFPC patterns are correctly decoded. This would lead to a positive correlation, but a difficult to interpret result since patterns in lOFC and HPC are incorrect. Figure SF7A (now Fig. 3C) shows that this is not the case. Lateral OFC and HC have higher than chance positive decoding when lFPC has positive decoding. Figure SF7B (now Fig. 3D) shows that we can decode that information even if a new hyperplane is constructed. However, both cases have less information about the relationship between these regions because they do not include the trials where lOFC/HC and lFPC classifiers were incorrect at the same time. The correlation in Figure 3B includes these failures, giving a more wholistic picture of the data. We therefore try to concisely clarify this point on page 10:

      “These signed distances allow us to relate both success in decoding information, as well as failures, between regions.”

      And here on page 10: 

      “Subsequent analyses confirmed that this effect was due to these regions showing a significant increase in positive (correct) decoding in trials where pending information could be positively (correctly) decoded in lFPC, and not simply due to a reduction in incorrect information fidelity (see Fig. 3C & 3D).”

      And have integrated these figures on page 9:

      Point 3 of public reviews:

      I like the idea of "credit spreading" across trials (Figure 1E). I think that credit spreading in each direction (into the past [lower left] and into the future [upper right]) is not equivalent. This can be seen in Figure 1D, where the two tasks show credit spreading differently. I think a lot more could be studied here. Does credit spreading in each of these directions decode in interesting ways in different places in the brain?

      We agree that this an interesting question because each component of the off diagonal (upper and lower triangles) may reflect qualitatively different processes of credit spreading. However, we believe this analysis is difficult to carry out with the current dataset for two reasons. First, we designed this study to ask specifically about the information represented in key credit assignment regions during precise credit assignment, meaning we did not optimize the task to induce credit spreading at any point. Indeed, our efforts to train participants on the task were to ensure they would correctly assign credit as much as possible. Figure 1F shows that the regression coefficients representing credit spreading in each condition are near zero (in the negative direction), with little individual differences compared to the credit assignment coefficients. Thus, any analysis aiming to test for credit spreading would unfortunately be poorly powered. Studies such as Jocham et al. (2016), with more variability in causal structures, or studies with ambiguity about the causal structure by dissolving the typical trial structure would be better suited to address this interesting question. The second reason why such an analysis would be challenging is that due to our design, it is difficult to intuitively determine what kind of information should be coded by neural regions when credit spreads to the upper diagonal, since these cells reflect current outcomes that are being linked to future choices. 

      Replace all the FPl with LFPC (lateral frontal polar cortex)

      We have no replace “FPl” with “LFPC” throughout the text and figures

    1. Author response:

      The following is the authors’ response to the previous reviews.

      Public Reviews:

      Reviewer #1 (Public review):

      Comment of Review of Revised Version:

      Although the authors have partly corrected the manuscript by removing the mislabeling in their Co-IP experiments, my primary concern on the actual functional connotations and direct interaction between PA28y and C1QBP still remains unaddressed. As already mentioned in my previous review, since the core idea of the work is PA28y's direct interaction with C1QBP, stabilizing it, the same should be demonstrated in a more convincing manner.

      My other observation on the detection of C1QBP as a doublet has been addressed by usage of anti-C1QBP Monoclonal antibody against the polyclonal one used before. C1QBP doublets have not been observed in the present case.

      The authors have also worked on the presentation of the background by suitably modifying the statements and incorporating appropriate citations.

      However, the authors are requested to follow the recommendations provided to them by the reviewers to address the major concerns.

      Thank you very much for your comments. We appreciate your concerns regarding the need for more direct evidence to support the stabilizing interaction between PA28γ and C1QBP. In response to your feedback, we have taken additional steps to provide more convincing evidence of this interaction.

      To complement our existing pull-down and Co-IP experiments, we utilized AlphaFold 3 to predict the three-dimensional structure of the PA28γ-C1QBP complex. The predicted model reveals specific residues and interfaces that are likely involved in the direct interaction between PA28γ and C1QBP. Our analysis indicates that this interaction may depend on amino acids 1-167 and 1-213 of C1QBP (Revised Appendix Figure 1E-H). Furthermore, aspartate (ASP), as the 177th amino acids of PA28γ, was predicted to interact with the 76th amino acid threonine (THR) and the 78th amino acid glycine (GLY) of C1QBP (Revised Appendix Figure 1I). This structural insight was further validated by our immunoprecipitation experiments (Revised Figure 1J). These findings provide a molecular basis for the observed stabilizing effect and suggest potential mechanisms by which PA28γ influences C1QBP stability. Specifically, the identified interaction sites offer clues into how PA28γ may stabilize C1QBP at the molecular level.

      Furthermore, we performed proximity ligation assays (PLA) to detect in situ interactions between PA28γ and C1QBP at the single-cell level. PLA results clearly demonstrate the presence of PA28γ-C1QBP complexes within cells, providing direct evidence of their physical interaction (Revised Figure 1D). This approach overcomes some of the limitations associated with traditional IP experiments and confirms the direct nature of the interaction.

      In summary, the integration of AlphaFold 3 predictions, PLA data, and our previous Pull-down and Co-IP experiments provides robust and direct evidence for a stable interaction between PA28γ and C1QBP. We believe that these additional findings significantly reinforce our conclusions and effectively address the concerns raised by the reviewers. Once again, thank you for your valuable feedback, which has been instrumental in refining and enhancing our study.

      Reviewer #2 (Public review):

      Comment of Review of Revised Version:

      Weaknesses:

      Many data sets are shown in figures that cannot be understood without more descriptions either in the text or the legend, e.g., Fig. 1A. Similarly, many abbreviations are not defined.

      The revision addressed these issues.

      Some of the pull-down and coimmunoprecipitation data do not support the conclusion about the PA28g-C1QBP interaction. For example, in Appendix Fig. 1B the Flag-C1QBP was detected in the Myc beads pull-down when the protein was expressed in the 293T cells without the Myc-PA28g, suggesting that the pull-down was not due to the interaction of the C1QBP and PA28g proteins. In Appendix Fig. 1C, assume the SFB stands for a biotin tag, then the SFB-PA28g should be detected in the cells expressing this protein after pull-down by streptavidin; however, it was not. The Western blot data in Fig. 1E and many other figures must be quantified before any conclusions about the levels of proteins can be drawn.

      The revision addressed these problems.

      The immunoprecipitation method is flawed as it is described. The antigen (PA28g or C1QBP) should bind to the respective antibody that in turn should binds to Protein G beads. The resulting immunocomplex should end up in the pellet fraction after centrifugation, and analyzed further by Western blot for coprecipitates. However, the method in the Appendix states that the supernatant was used for the Western blot.

      The revision corrected this method.

      To conclude that PA28g stabilizes C1QBP through their physical interaction in the cells, one must show whether a protease inhibitor can substitute PA28q and prevent C1QBP degradation, and also show whether a mutation that disrupt the PA28g-C1QBP interaction can reduce the stability of C1QBP. In Fig. 1F, all cells expressed Myc-PA28g. Therefore, the conclusion that PA28g prevented C1QBP degradation cannot be reached. Instead, since more Myc-PA28g was detected in the cells expressing Flag-C1QBP compared to the cells not expressing this protein, a conclusion would be that the C1QBP stabilized the PA28g. Fig. 1G is a quantification of a Western blot data that should be shown.

      The binding site for PA28g in C1QBP was mapped to the N-terminal 167 residues using truncated proteins. One caveat would be that some truncated proteins did not fold correctly in the absence of the sequence that was removed. Thus, the C-terminal region of the C1QBP with residues 168-283 may still bind to the PA29g in the context of full-length protein. In Fig. 1I, more Flag-C1QBP 1-167 was pull-down by Myc-PA28g than the full-length protein or the Flag-C1QBP 1-213. Why?

      The interaction site in PA28g for C1QBP was not mapped, which prevents further analysis of the interaction. Also, if the interaction domain can be determined, structural modeling of the complex would be feasible using AlphaFold2 or other programs. Then, it is possible to test point mutations that may disrupt the interaction and if so, the functional effect.

      The revision added AlphaFold models for the protein interaction. However, the models were not analyzed and potential mutations that would disrupt the interact were not predicted, made and tested. The revision did not addressed the request for the protease inhibitor.

      Thank you for your insightful comments regarding the binding site of PA28γ in C1QBP. We appreciate your concern about the potential misfolding of truncated proteins and the possible interaction between the C-terminal region (residues 168-283) of C1QBP and PA28γ in the context of full-length protein.

      To address these concerns, we have conducted additional analyses and experiments to provide a more comprehensive understanding of the interaction between PA28γ and C1QBP. Using AlphaFold 3, we predicted the three-dimensional structure of the PA28γ-C1QBP complex. The model reveals specific residues and interfaces that are likely involved in the direct interaction between PA28γ and C1QBP. Notably, our structural analysis indicates that the interaction may primarily depend on amino acids 1-167 and 1-213 of C1QBP (Revised Appendix Figure 1E-H). Furthermore, aspartate (ASP), as the 177th amino acids of PA28γ, was predicted to interact with the 76th amino acid threonine (THR) and the 78th amino acid glycine (GLY) of C1QBP (Revised Appendix Figure 1I). This prediction supports the idea that the N-terminal region of C1QBP is crucial for its interaction with PA28γ. Regarding the observation in old Figure 1I (Revised Figure 1J), where more Flag-C1QBP 1-167 was pulled down by Myc-PA28γ compared to the full-length protein or Flag-C1QBP 1-213, we believe this can be explained by several factors:

      A. The truncation of C1QBP to residues 1-167 may expose key interaction sites that are partially obscured in the full-length protein. This enhanced accessibility could lead to stronger binding affinity and higher pull-down efficiency.

      B. While it is possible that some truncated proteins do not fold correctly, our data suggest that the N-terminal fragment (1-167) retains sufficient structural integrity to interact effectively with PA28γ. The increased pull-down of this fragment suggests that it captures the essential elements required for binding.

      C. The C-terminal region (168-283) might exert steric hindrance or allosteric effects on the N-terminal binding site in the context of the full-length protein. This interference could reduce the overall binding efficiency, leading to less pull-down of full-length C1QBP compared to the truncated version.

      Compared with the control group, the presence of Myc-PA28γ significantly increased the expression level of Flag-C1QBP (r Revised Figure 1G). Gray value analysis showed that in cells transfected with Myc-PA28γ, the decay rate of Flag-C1QBP was significantly slower than that of the control group (Revised Figure 1H), suggesting that PA28γ can delay the protein degradation of C1QBP and stabilize its protein level. This indicates that an increase in the level of PA28γ protein can significantly enhance the expression level of C1QBP protein, while PA28γ can slow down the degradation rate of C1QBP and improve its stability. In addition, our western blot analysis also proved that PA28γ could still prevent the degradation of C1QBP under the action of proteasome inhibitor MG-132 (Revised Appendix Figure 1D). Moreover, PA28γ could not stabilize the mutation of C-terminus of C1QBP (amino acids 94-282), which was not the interaction domain of PA28γ-C1QBP (Revised Figure 1K).

    1. Author response:

      The following is the authors’ response to the original reviews.

      Public Reviews:

      Reviewer #1 (Public review):

      Summary:

      Barlow and coauthors utilized the high-parameter imaging platform of CODEX to characterize the cellular composition of immune cells in situ from tissues obtained from organ donors with type 1 diabetes, subjects presented with autoantibodies who are at elevated risk, or non-diabetic organ donor controls. The panels used in this important study were based on prior publications using this technology, as well as a priori and domain-specific knowledge of the field by the investigators. Thus, there was some bias in the markers selected for analysis. The authors acknowledge that these types of experiments may be complemented moving forward with the inclusion of unbiased tissue analysis platforms that are emerging that can conduct a more comprehensive analysis of pathological signatures employing emerging technologies for both high-parameter protein imaging and spatial transcriptomics.

      Strengths:

      In terms of major findings, the authors provide important confirmatory observations regarding a number of autoimmune-associated signatures reported previously. The high parameter staining now increases the resolution for linking these features with specific cellular subsets using machine learning algorithms. These signatures include a robust signature indicative of IFN-driven responses that would be expected to induce a cytotoxic T-cell-mediated immune response within the pancreas. Notable findings include the upregulation of indolamine 2,3-dioxygenase-1 in the islet microvasculature. Furthermore, the authors provide key insights as to the cell:cell interactions within organ donors, again supporting a previously reported interaction between presumably autoreactive T and B cells.

      Weaknesses:

      These studies also highlight a number of molecular pathways that will require additional validation studies to more completely understand whether they are potentially causal for pathology, or rather, epiphenomenon associated with increased innate inflammation within the pancreas of T1D subjects. Given the limitations noted above, the study does present a rich and integrated dataset for analysis of enriched immune markers that can be segmented and annotated within distinct cellular networks. This enabled the authors to analyze distinct cellular subsets and phenotypes in situ, including within islets that peri-islet infiltration and/or intra-islet insulitis.

      Despite the many technical challenges and unique organ donor cohort utilized, the data are still limited in terms of subject numbers - a challenge in a disease characterized by extensive heterogeneity in terms of age of onset and clinical and histopathological presentation. Therefore, these studies cannot adequately account for all of the potential covariates that may drive variability and alterations in the histopathologies observed (such as age of onset, background genetics, and organ donor conditions). In this study, the manuscript and figures could be improved in terms of clarifying how variable the observed signatures were across each individual donor, with the clear notion that non-diabetic donors will present with some similar challenges and variability.

      Thank you to all reviewers and editors for their thoughtful and constructive engagement with our manuscript. We agree that patient heterogeneity and the sample size limited the impact of this study. In the future, more cases with insulitis will become available and spatial technologies will become more scalable.

      Given these constraints, we have made a significant effort to illustrate the individual heterogeneity of the disease by using the same color for each nPOD case ID throughout the manuscript and showing individual donors whenever feasible (e.g. Figures 1D-E, 2C, 2I, 3E, 3G, 4B-C, 5C, and 5F). For figures related to insulitis, we do not typically include non-T1D controls since they did not have any insulitis (Figure 2C). We also explicitly discuss the differences in the two autoantibody-positive, non-T1D cases: one closely resembled the T1D cases with respect to multiple features and the other more closely resembled the non-T1D, autoantibody-negative controls.

      Reviewer #2 (Public review):

      Summary:

      The authors aimed to characterize the cellular phenotype and spatial relationship of cell types infiltrating the islets of Langerhans in human T1D using CODEX, a multiplexed examination of cellular markers

      Strengths:

      Major strengths of this study are the use of pancreas tissue from well-characterized tissue donors, and the use of CODEX, a state-of-the-art detection technique of extensive characterization and spatial characterization of cell types and cellular interactions. The authors have achieved their aims with the identification of the heterogeneity of the CD8+ T cell populations in insulitis, the identification of a vasculature phenotype and other markers that may mark insulitis-prone islets, and the characterization of tertiary lymphoid structures in the acinar tissue of the pancreas. These findings are very likely to have a positive impact on our understanding (conceptual advance) of the cellular factors involved in T1D pathogenesis which the field requires to make progress in therapeutics.

      Weaknesses:

      A major limitation of the study is the cohort size, which the authors directly state. However, this study provides avenues of inquiry for researchers to gain further understanding of the pathological process in human T1D.

      Thank you for your analysis. We point the reader to our above description of our efforts to faithfully report the patient variability despite the small sample size.

      Reviewer #3 (Public review):

      Summary:

      The authors applied an innovative approach (CO-Detection by indEXing - CODEX) together with sophisticated computational analyses to image pancreas tissues from rare organ donors with type 1 diabetes. They aimed to assess key features of inflammation in both islet and extra-islet tissue areas; they reported that the extra-islet space of lobules with extensive islet infiltration differs from the extra-islet space of less infiltrated areas within the same tissue section. The study also identifies four sub-states of inflamed islets characterized by the activation profiles of CD8+T cells enriched in islets relative to the surrounding tissue. Lymphoid structures are identified in the pancreas tissue away from islets, and these were enriched in CD45RA+ T cells - a population also enriched in one of the inflamed islet sub-states. Together, these data help define the coordination between islets and the extra-islet pancreas in the pathogenesis of human T1D.

      Strengths:

      The analysis of tissue from well-characterized organ donors, provided by the Network for the Pancreatic Organ Donor with Diabetes, adds strength to the validity of the findings.

      By using their innovative imaging/computation approaches, key known features of islet autoimmunity were confirmed, providing validation of the methodology.

      The detection of IDO+ vasculature in inflamed islets - but not in normal islets or islets that have lost insulin-expression links this expression to the islet inflammation, and it is a novel observation. IDO expression in the vasculature may be induced by inflammation and may be lost as disease progresses, and it may provide a potential therapeutic avenue.

      The high-dimensional spatial phenotyping of CD8+T cells in T1D islets confirmed that most T cells were antigen-experienced. Some additional subsets were noted: a small population of T cells expressing CD45RA and CD69, possibly naive or TEMRA cells, and cells expressing Lag-3, Granzyme-B, and ICOS.

      While much attention has been devoted to the study of the insulitis lesion in T1D, our current knowledge is quite limited; the description of four sub-clusters characterized by the activation profile of the islet-infiltrating CD8+T cells is novel. Their presence in all T1D donors indicates that the disease process is asynchronous and is not at the same stage across all islets. Although this concept is not novel, this appears to be the most advanced characterization of insulitis stages.

      When examining together both the exocrine and islet areas, which is rarely done, authors report that pancreatic lobules affected by insulitis are characterized by distinct tissue markers. Their data support the concept that disease progression may require crosstalk between cells in the islet and extra-islet compartments. Lobules enriched in β-cell-depleted islets were also enriched in nerves, vasculature, and Granzyme-B+/CD3- cells, which may be natural killer cells.

      Lastly, authors report that immature tertiary lymphoid structures (TLS) exist both near and away from islets, where CD45RA+ CD8+T cells aggregate, and also observed an inflamed islet-subcluster characterized by an abundance of CD45RA+/CD8+ T cells. These TLS may represent a point of entry for T cells and this study further supports their role in islet autoimmunity.

      Weaknesses:

      As the authors themselves acknowledge, the major limitation is that the number of donors examined is limited as those satisfying study criteria are rare. Thus, it is not possible to examine disease heterogeneity and the impact of age at diagnosis. Of 8 T1D donors examined, 4 would be considered newly diagnosed (less than 3 months from onset) and 4 had longer disease durations (2, 2, 5, and 6 years). It was unclear if disease duration impacted the results in this small cohort. In the introduction, the authors discuss that most of the pancreata from nPOD donors with T1D lack insulitis. This is correct, yet it is a function of time from diagnosis. Donors with shorter duration will be more likely to have insulitis. A related point is that the proportion of islets with insulitis is low even near diagnosis, Finally, only one donor was examined that while not diagnosed with T1D, was likely in the preclinical disease stage and had autoantibodies and insulitis. This is a critically important disease stage where the methodology developed by the investigators could be applied in future efforts.

      While this was not the focus of this investigation, it appears that the approach was very much immune-focused and there could be value in examining islet cells in greater depth using the methodology the authors developed.

      Additional comments:

      Overall, the authors were able to study pancreas tissues from T1D donors and perform sophisticated imaging and computational analysis that reproduce and importantly extend our understanding of inflammation in T1D. Despite the limitations associated with the small sample size, the results appear robust, and the claims well-supported.

      The study expands the conceptual framework of inflammation and islet autoimmunity, especially by the definition of different clusters (stages) of insulitis and by the characterization of immune cells in and outside the islets.

      Thank you for your feedback. We agree that it would be very informative to expand on our analysis of autoantibody-positive cases and look at additional non-immune features. 

      Recommendations for the authors:

      Reviewer #1 (Recommendations for the authors):

      (1) Do any of the observed cellular or structural features correlate with age of onset or disease duration? While numbers of subjects are low, considering these as continuous variables may clarify some of the findings.

      Thank you for the suggestion. In Supplemental Figure 5B-C, we plotted the key immune signatures from the manuscript against the diabetes duration and age of onset.

      (2) The IDO is an interesting observation and has prior support in the literature. The authors speculate this may be induced as a feature of IFNg expressed by lymphocytes in the local microenvironment. Can any of these concepts be further validated by staining for transcription factors or surrogate downstream markers associated with Th1 skewing (e.g., Tbet, CXCR3, etc)?

      The only other interferon-stimulated gene in our panel is HLA-ABC. We updated Supplemental Figure 2F to include HLA-ABC expression in IDO- and IDO+ islets (within the “Inflamed” group). Consistent with the hypothesis that IDO is stimulated by interferon, HLA-ABC is also significantly higher in IDO+ islets than IDO- islets. PDL1, another interferon-stimulated gene. was included in the panel but we did not detect any signal. This antibody was very weak during testing in the tonsil, so we couldn’t confidently claim that PDL1 was not expressed.

      (3) The authors discuss the potential that CD45RA may be expressed in Temra populations. This could use additional clarification and a distinction from Tscm if possible.

      Unfortunately, we did not have the appropriate markers to distinguish naïve, TEMRA, or Tscm cells from each other. We updated the text in the discussion to include this consideration (Line 432).

      (4) Supplemental Figure 5 is not informative in the current display.

      Thank you, we replotted these data.

      (5) Supplemental Table 1 could be expanded with additional metadata of interest, including the genetic features of the donors (e.g, class II diplotype and GRS2 values) that are published and available in the nPOD program.

      Some genetic data are only available to nPOD investigators. We think it is more appropriate to request the data directly from them.

      Reviewer #2 (Recommendations for the authors):

      (1) I had only a few specific comments. I think the statement in Lines 317 and 318 is too strong. It implies that each lobe is always homogeneous for having all islets with insulitis or not having insulitis. Some lobes are certainly enriched for islets with insulitis but insulin+ islets without insulitis in some lobes in some T1D donors are seen. Please soften that statement.

      We apologize for our lack of clarity. We have edited the text (line 305-309) to better articulate that organ donors fall on a spectrum. Thank you for raising this point as we think the motivation for our analysis is much clearer after these revisions.

      (2) Please cite and discuss In't Veld Diabetes 20210 PMID: 20413508. While the main point of the paper is that there is beta cell replication after prolonged life support, another observation is that there is a correlation between prolonged life support and CD45+ cells in the pancreas parenchyma. This might indicate that not all immune cells in the parenchyma are T1D associated in donors with T1D.

      Thank you, we have added this citation to our discussion of the importance of duration of stay in the ICU (Line 471).

      (3) Can you rule out that CD46RA+/CD69+ CD8+ T cells in the islets are not TSCM?

      (See above)

      Reviewer #3 (Recommendations for the authors):

      Similar studies in experimental models may afford increased opportunity to evaluate the significance of these findings and model their potential relevance for disease staging and therapeutic targeting.

      We agree that the lack of experimental data limits the ability to interpret and validate the significance of our findings. We hope that our study motivates and helps inform such experiments.

    1. Author response:

      The following is the authors’ response to the previous reviews.’

      Public Reviews:

      Reviewer #1 (Public Review):

      For the colony analysis, it is unclear from the methods and main text whether the initial individual sorted colonies were split and subject to different conditions to support the claim of bi-potency. The finding that 40% of colonies displayed tenogenic differentiation, may instead suggest heterogeneity of the sorted progenitor population. The methods as currently described, suggest that two different plates were subject to different induction conditions. It is therefore difficult to assess the strength of the claim of bi-potency.

      Thanks for your valuable comment. We are sorry for the confusing illustration of colony assay. In fact, we first obtained CD29+/CD56+ myogenic progenitors by FACs. Then these freshly isolated cells were randomly seeded to 96-well plate with density of 1 cell/well. Subsequently, the single cell in each plate was cultured with growth medium to form colonies for ten days. Then myogenic induction was performed in three 96-well plates and tenogenic induction was performed in another three 96-well plates for subsequent analyses. We agree with your point that the sorted cell population could be heterogeneous myogenic progenitors. The result showed over 95% colonies successfully differentiated into myotubes, while 40% of colonies displayed tenogenic differentiation (Fig. 2g). Since the freshly obtained CD29+/CD56+ myogenic progenitors were randomly seeded for tenogenic induction or myogenic induction, the undifferentiated cells in each group were considered as the same sample. Furthermore, the optimal tenogenic differentiation condition for these cells was still waiting for investigation. Thus, we believe the colony analysis combined with the data in Figure 1 and Figure 2 could indicate the bi-potency for human CD29+/CD56+ myogenic progenitors.

      This group uses the well-established CD56+/CD29+ sorting strategy to isolate muscle progenitor cells, however recent work has identified transcriptional heterogeneity within these human satellite cells (ie Barruet et al, eLife 2020). Given that they identify a tenocyte population in their human muscle biopsy in Figure 1a, it is critical to understand the heterogeneity contained within the population of human progenitors captured by the authors' FACS strategy and whether tenocytes contained within the muscle biopsy are also CD56+/CD29+.

      Thanks for your constructive suggestion. We have included more samples to perform scRNA-seq and reanalyzed the data. The scRNA-seq data revealed that all the CD29+/CD56+ cells were myogenic progenitors, which occupied 19.3% of all the myogenic progenitors (Fig. 1e). However, there existed no tenocytes with CD29+/CD56+ (Fig. 1d), and tenocytes made up only a small percentage (0.06%) of all the mononuclear cells. Thus, human CD29+/CD56+ cells are myogenic progenitors, and tenocytes contained within the muscle biopsy are not CD56+/CD29+. In addition, both published research and our results indicated the heterogeneity of CD29+/CD56+ myogenic progenitors. Since the main purpose of current study was to investigate the tenogenic differentiation potential of CD29+/CD56+ myogenic progenitors, the heterogeneity in CD29+/CD56+ myogenic progenitors should be investigated in the further study.

      The bulk RNA sequencing data presented in Figure 3 to contrast the expression of progenitor cells under different differentiation conditions are not sufficiently convincing. In particular, it is unclear whether more than one sample was used for the RNAseq analyses shown in Figure 3. The volcano plots have many genes aligned on distinct curves suggesting that there are few replicates or low expression. There is also a concern that the sorted cells may contain tenocytes as tendon genes SCX, MKX, and THBS4 were among the genes upregulated in the myogenic differentiation conditions (shown in Figure 3b).

      Thanks for your comment. Each group consisted of three samples for RNAseq analyses. We are sorry there existed a minor analysis mistake in Fig. 3b and Fig. 3c, which have been reanalyzed in the revised version. There was no significantly difference of tendon related marker genes after myogenic differentiation (Fig. 3b), while these tenogenic genes were significantly up-regulated after tenogenic induction (Fig. 3c). As for contamination of tenocytes, scRNA-seq data showed there were no tenocytes with both CD29 and CD56 positive (please see response to Comment 2). And almost all the obtained cells highly expressed myogenic progenitors markers PAX7/MYOD1/MYF5 (Fig. 1f-g). Low expression levels of tendon markers were identified in these cells (Fig. 2a-c). Furthermore, although tendon genes slightly upregulated in myogenic differentiation conditions, these markers dramatically upregulated in tenogenic differentiation conditions (Fig. 2c). Thus, we believe the bulk RNA sequencing data could add the evidence of tenogenic differentiation ability of human CD29+/CD56+ myogenic progenitors.

      Reviewer #2 (Public Review):

      scRNAseq assay using total mononuclear cell population did not provide meaningful insight that enriched knowledge on CD56+/CD29+ cell population. CD56+/CD29+ cells information may have been lost due to the minority identity of these cells in the total skeletal muscle mononuclear population, especially given the total cell number used for scRNAseq was very low and no information on participant number and repeat sample number used for this assay. Using this data to claim a stem cell lineage relationship for MuSCs and tenocytes may not convincing, as seeing both cell types in the total muscle mononuclear population does not establish a lineage connection between them.

      Thanks for your constructive suggestion. We have included more samples to perform scRNA-seq and reanalyzed the data. Three samples with a total of 57,193 cells were included for analysis. As you can see in Fig. 1d and 1e, the joint expression analysis revealed that all the CD29+/CD56+ cells were myogenic progenitors, which occupied 19.3% of all the myogenic progenitors.  In addition, we agree with your comment that the pseudotime analysis could be a bit misleading as the nature of computational biology with pseudotime plots, so we deleted this assay.

      The TGF-b pathway assay uses a small molecular inhibitor of TGF-b to probe Smad2/3. The assay conclusion regarding Smad2/3 pathway responsible for tenocyte differentiation may be overinterpretation without Smad2/3 specific inhibitors being applied in the experiments.

      Thanks for your comment. We agree with your comment and we have revised it in the revision version (Figure 7, Line 306-326).

      Reviewer #3 (Public Review):

      This dual differentiation capability was not observed in mouse muscle stem cells.

      Thanks for your comment. We have explored the tenogenic differentiation potential of mouse MuSCs both in vivo and in vitro. However, low tenogenic differentiation ability was revealed (Figure 4), which might be due to species diversity. Maybe it is more demanding for humans to maintain the homeostasis of the locomotion system and the whole organism locomotion ability in much longer life span and bigger body size. Thus, the current study also indicated that anima studies may not clinically relevant when investigating human diseases.

      Recommendations For The Authors:

      Reviewer #1 (Recommendations For The Authors):

      The methods section contained insufficient details for sample tissue for many methods, including the single cell analysis, RNA FISH, and for in vivo cardiotoxin treatment. ie. how were the samples subclustered for the monocle pseudotime analysis; how many cells were counted in the FISH shown in Fig 1e/f, does the n=5 refer to tissue sections or biological replicates?; for the double injury, what was the cardiotoxin dose?

      Thanks for your comment. Three samples and a total 57,193 cells were analyzed in single cell analysis (Line 464). We deleted RNA FISH assay data because it provided limited information to prove bipotential ability of human CD29+/CD56+ myogenic progenitors. In addition, since the pseudotime analysis could be a bit misleading as the nature of computational biology with pseudotime plots, we also deleted this assay. For the double injury, 15μl of 10μM cardiotoxin was used for lineage tracing (Line 533).

      Additionally, the RNA sequencing datasets are not currently publicly available under the accession numbers provided.

      The raw data of RNA sequencing has been uploaded in NCBI (accession number: PRJNA1178160, PRJNA1012476 and PRJNA1012828), and these data will be released immediately after publication.

      The poor resolution of 1d makes it impossible to read any of the gene names or interpret the expression profiles of their proposed trajectories.

      Since the pseudotime analysis could be a bit misleading as the nature of computational biology with pseudotime plots, we deleted this assay.

      What does the color key for 3a refer to? It is not indicated in the figure or legend.

      Thanks for your comment. The color key for 3a refer to “Scaled expression values”, which has been added in the revised version.

      scRNAseq of the sorted CD29/56+ population could help uncover possible cell heterogeneity within these muscle progenitors and which sub-populations of myogenic progenitor cells have tenogenic potential.

      Thanks for your valuable suggestion. We included more cells from three biological repetitions to perform scRNA-seq and found that CD29/CD56+ cells were absolutely from myogenic progenitors (Fig. 1d and 1e). We agree with you that additional scRNAseq will be helpful to clarify the possible cell heterogeneity within these muscle progenitors. Since the main scope of current study is to investigate the biopotential of CD29/CD56+ myogenic progenitors, analysis of scRNAseq of the sorted CD29/56+ population would be performed in the further study for further exploration.

      Typos: Line 459 sored cells... preparasion with Chromium Single Cell 3' Reagent Kits (10X genomics, cat# 1000121-1000157). Figure 4E - typo in the word tamoxifen.

      Thanks for your valuable suggestion. We are sorry for the typos and have revised these typos (Line 459 and Fig. 4e).

      Reviewer #2 (Recommendations For The Authors):

      (1) scRNAseq is performed in total mononuclear cells isolated from human skeletal muscle. The cell number (around 15000 cells) seems very low for this assay, given the CD56+/CD29+ cells are a minority population in this sequencing, the data does not seem to provide meaningful insight into the MuSC cell identities. No information on sample numbers and number of patient participants can be found in the paper.

      Thanks for your comment. We added more cells to reanalyze the data in the revised manuscript. Three samples with a total of 57,193 cells were analyzed (Line 464). The joint expression analysis revealed that all the CD29+/CD56+ cells were myogenic progenitors, which occupied 19.3% of all the myogenic progenitors (Fig. 1d and 1e). These scRNA-seq data combined with functional experiment confirmed the MuSC cell identity of CD29+/CD56+ cells from mononuclear cells.

      In this regard, the paragraph starts with "To confirm the single cell analysis results, we first isolated myogenic progenitor cells from human muscle biopsy using FACS as described previously" which is misleading as the seRNAseq is not the result of the sorted cells. Please reword this paragraph to clarify.

      The related paragraph has been reworded (Line 84-95).

      Similarly, the existence of myocytes and tenocytes in scRNAseq does not necessarily prove a stem cell and mature cell lineage relationship. Please edit the wording to avoid overinterpretation.

      Thanks for your reminding. Since the pseudotime analysis could be a bit misleading as the nature of computational biology with pseudotime plots, we deleted this assay.

      (2) The in vitro differentiation assays are well performed, which included bulk culture and clonal culture. The efficiencies of those two assays seem to have discrepancies which may need clarification. Again, no sample numbers and repeats have been informed.

      Since the tendon differentiation period for bulk culture was 12 days, those myotubes fused by CD29+/CD56+ myogenic progenitors with only myogenic differentiation potential will be no longer alive. Thus, the efficiency of bulk culture seemed higher than that in clonal culture. As stated in statistical analysis, at least three biological replicates and technical repeats were performed in each experimental group (Line 577).

      In these paragraphs, terminologies including MuSCs, myogenic progenitors, CD56+/CD29+, and Pax7+ are interchangeably used, which generates confusion while reading. It is probably best to consistently use the cell sorting markers markers to address this cell population, throughout the paper.

      Thanks for your constructive suggestion. The cell population was consistently named as CD29+/CD56+ myogenic progenitors throughout the paper.

      Information on the proliferation rate and expansion of the MuSCs would be useful but not provided.

      Thanks for your comment. The analysis of cell proliferation was added in Figure 1 (Fig. 1h).

      The murine cell differentiation assays are not as convincing as the human study. The assay regarding "mouse muscle CD29+/CD56+ cells were isolated for tenogenic induction. However, very few mouse muscle CD29+/CD56+ cells expressed myogenic progenitor cell marker Pax7, MyoD1 and Vcam1" does not add any value to the work as those markers are not mouse MuSC markers to start with.

      Thanks for your comment. The experiments concerning mouse muscle CD29+/CD56+ cells have been deleted to avoid misleading.

      The Pax7-cre-TdTomato assay was also not convincing, as a negative finding may not be the best proof of absence.

      Thanks for your comment. Pax7 positive cells could consistently express TdTomato for lineage tracing. In current study, large amount of tdTomato+ myofibers were observed after muscle injury (SFig. 2c-d), suggesting that the tracing system works well. However, less than 0.2% tendon cells originated from TdTomato+ MuSCs were observed even four months after tendon removal (Fig. 4f-g). When comparing in vivo data between murine MuSCs and human CD29+/CD56+ myogenic progenitors, we believe these data could indicate the poor tendon differentiation abilities of murine MuSCs.

      (5) TGFb as a pathway of smad2/3 mediated tenocyte differentiation assays were well done albeit not novel. Using TGFb universal inhibitor may not accurately state the pathways were due to SMAD2/3 inhibition either.

      We agree with your comment and the conclusion concerning SMAD2/3 has been deleted throughout the manuscript.

      The paper also needs thorough proofreading. Currently, typographic, grammatical, and logical sequences of writing do not lend the paper to easy reading.

      (1) Figure 1K and 1I have similar legends but presumably K is referring to MuSC and I is referring to differentiated cells.

      (2) Tenogenic and myogenic induction should be changed to tenogenic/myogenic differentiation as they are the cells at the end of differentiation.

      (3) Figure 6, it is not clear how the "human cells" are calculated in this assay.

      Thanks for your constructive comment. (1) The figure legends in Figure1 have been revised (Line 797-804).  (2) Tenogenic and myogenic induction have been changed to tenogenic/myogenic differentiation manuscript when they are referring to cells at the end of differentiation (Fig.1, Fig.2, Fig.3, Fig.4, Fig.7 and SFig.1). (3) In Figure 6, “human cells” is referring to those injured tendons with transplantation of human CD29+/CD56+ myogenic progenitors. To evaluate the function of human CD29+/CD56+ myogenic progenitors, PBS group was set as negative control and uninjured group was set as normal control.

      Reviewer #3 (Recommendations For The Authors):

      (1) The full extent of the differentiation potential of CD29+/CD56+ stem/progenitor cells has not been thoroughly evaluated. There can also exist heterotopic ossification in injured tendon sites. Thus, it remains unclear whether these cells are truly bipotent as the authors claim, or can they differentiate into chondrocytes and osteoblasts.

      Thanks for your comment. The current study focused on the tenogenic differentiation potential of CD29+/CD56+ myogenic progenitors, so the research priority was the bipotential ability of CD29+/CD56+ myogenic progenitors. We agree with you that chondrogenic and osteogenic ability of CD29+/CD56+ myogenic progenitors is also important and would investigate it in the further study.

      (2) In Figure 3, the GO analysis also shows increased enrichment of muscle-related terms including muscle contraction and filament. Please clarify it.

      The tenogenic differentiation efficiency of CD29+/CD56+ myogenic progenitors was about 40% in clonal assay. Some cells would myogenically differentiated under this tenogenic induction system. Thus, the GO analysis could also enrich muscle related terms including muscle contraction and filament.

      (3) The authors use TNC staining to evaluate cell transplantation. My concern is whether the TNC expression is specific to the tendon site, or do engrafted human cells also express TNC in other sites such as muscle?

      TNC is one of a well-known tendon-related markers. As you can see in Figure 6b and Figure 6c, although some human cells (labeled by Lamin A/C) were engrafted in muscle tissue area (labeled by MyHC), these engrafted human cells didn’t express TNC in muscle. In addition, we also used tendon related markers SCX and TNMD to confirm the tenogenic differentiation ability of engrafted human cells in vivo (SFig. 3a and 3b).

      (4) The authors demonstrate that CD29+/CD56+ human stem/progenitor cells could efficiently transplant and contribute to myofiber regeneration in vivo. However, why were only a few transplanted human cells differentiating into myofiber (labeled by MyHC) in the tenon injury model even with CTX injection?

      Thanks for your comment. Since skeletal muscle is able to regenerate with in situ muscle progenitor cells, regeneration of injured muscle by CTX injection was dependent on not only CD29+/CD56+ myogenic progenitors, but also native murine MuSCs. Thus, it is reasonable that there were only a few transplanted human cells differentiating into myofiber (labeled by MyHC) in the tenon injury model even with CTX injection.

      (5) Figure 7 shows the crucial role of TGFB/SMAD signaling for the tenogenesis of human CD29+/CD56+ stem/progenitor cells. However, can TGFB/SMAD signaling activation facilitate the tenogenic differentiation of mouse MuSCs? This point is crucial to clarify the difference of MuSCs between different species.

      Thanks for your valuable suggestion. We did a series of pilot assays to investigate the effect of TGFβ signaling activation to facilitate tenogenic differentiation of mouse MuSCs (Author response image 1). As you can see, activating TGFβ by SRI-011381 could slightly increase the expression of tenogenic markers of murine MuSCs. It’s an interesting topic and we would investigate it in the further study.

      Author response image 1.

      TGFβ signaling pathway slightly elevated tenogenic differentiation ability of murine MuSCs (a) Immunofluorescence staining of tendon marker Scx and Tnc in murine MuSCs induced for tenogenic differentiation with or without TGFβ signaling pathway agonist SRI-011381, respectively. Scale bars, 50 µm. (b) Quantification of Scx and Tnc fluorescent intensity in murine MuSCs undergone tenogenic induction with or without TGFβ signaling pathway agonist SRI-011381, respectively. Error bars indicated standard deviation (n=5). (c) Protein levels of Tnc and Scx. Murine MuSCs were induced towards tenogenic differentiation with or without TGFβ signaling pathway agonist SRI-011381. Total protein was extracted from cells before and after differentiation and subjected for Tnc and Scx immunoblotting. GAPDH was served as loading control.

      (6) Please quantify the WB blot data throughout the manuscript.

      Thanks for your comment. The WB blot data has been quantified throughout the manuscript.

      (7) The data of RT-qPCR should indicate what the fold changes in relative to throughout the manuscript.

      Thanks for your comment. The sentence “GAPDH was served as reference gene” was added in the figure legends to illustrate RT-qPCR results.

    1. Author response:

      The following is the authors’ response to the previous reviews.

      eLife Assessment<br /> …. While intuitive, the model's underlying issue is grouping many factors under "variance in reproductive success" without explicitly modeling the molecular processes. This limitation, …, provides incomplete support for the authors' claim that the observed paradoxical patterns in rRNA genes can largely be explained by homogenizing processes, such as gene conversion, unequal crossover and replication slippage.

      This second paper addresses the genetic drift in multi-copy gene systems using rRNA genes as an example. Note that genetic drift happens in two stages here – within individuals and between individuals while the drift mechanisms are very different between the two stages. We now reply to the editors’ decision that it would be more rigorous to model each molecular process, than to lump all stochastic forces into V(K).  We respond to this criticism on three fronts.

      First, for molecular evolutionists, there is NO NEED to model the detailed molecular processes.  This is because we are only interested in knowing the totality of the stochastic variations.  Interesting biological forces such as selection and meiotic drive are masked by such random forces. Our objective is precisely to lump all noises into a quantity that can be estimated.

      Second, the homogenization process is the bulk, if not the totality of the within-individual random forces (i.e,, genetic drift). The criticism of incomplete support for drift as a sufficient account of the observations is curious because we did conclude that genetic drift is an insufficient explanation of the human data.  Since drift only influences fixation time, which can have a significant effect in short-term evolution (as shown in Fig 2), but it does not affect fixation rate itself. In contrast, selection influences the both. Thus, we can define the limitation of drift in evolutionary process. Even if the speed of drift-driven fixation is only a few generations, it is still too little for the human-chimpanzee divergence comparisons. In contrast, the speed of genetic drift in mice, as extrapolated from the polymorphism data, is sufficient to drive the divergence between M. m. domesticus and Mus spretus. The criticism appears to be that unbiased gene conversion, unequal crossover and replication slippage together may be insufficient to account for the observations. Since the contribution of each of these three forces is not central to our goal of filtering out the total contributions, we only conclude that the totality of within-individual drift in mice is sufficient to explain the data.

      Third, even if we really want to dissect the molecular processes, previous attempts by prominent theorists like Tom Nagylaki and Tomoko Ohta could only model a small subset of such processes.  In fact, Ohta often lumps a few of these forces into one process. More importantly, if we want to tackle other systems like viruses and mitochondria, we will have to develop a new set of theories for each molecular process.  V(K) can take care of all such diverse systemes.  In short, genetic drift is just noises and our goal is to quantify them in total across diverse systmes.  By filtering out noises, we will be able to move on to something more important.

      We now briefly comment on the WF models in relation to multi-gene systems. For example, in the case SARS-CoV-2, there are millions of virions in each patient among millions of patients. It is not possible to know what Ne acaully means in the WF modesl. Also, the rDNA population in each individual is not the sub-populations of the WF models.  After all, the mechanisms of genetic drift within individuals by the homogenization processes are entirely different from the genetic drift between individuals.  For a comparison, we published several papers (cited in #2) using the Haldane model to estimate the strength of genetic drift. It is also important to note that the parameters and assumptions of WF model cannot fully capture the evolutionary dynamics of the multi-copy genes.

      … ., along with insufficient consideration of technical challenges in alignment and variants calling, provides incomplete support for the authors' claim …

      Before delving into the technical details, we would like to summarize our defense. First, all rRNA gene copies belong in a pseudo-population, due to the homogenization process. The concept of specific locus with specific variants does not apply. Second, the levels of within-individual and within-species variation is so low that sequence alignment is not a problem at all. Third, thanks to the large number of sequence reads, occasional sequence errors (rarely encountered) should have minimal effects on the analyses.  Now the technical details:

      Regarding the concerns about the alignment and variant calling, we would like to clarify our methodology. While we acknowledge the technical challenges inherent in alignment and variant calling, particularly with respect to orthologous alignments to distinguish different copies, it is important to note that rDNA copies are subject to homogenization processes, meaning that there is no orthology among rDNA copies. Due to the high sequence similarity and frequent genetic exchange among rDNA units within species, we used the species-specific rDNA reference sequence for variant calling. We directly utilized the raw read depth from all rDNA copies within individuals to calculate the site frequency. For each site, we focused on the frequency of the major allele to calculate nucleotide diversity using the 2p(1-p), where p represents the frequency of the major allele. This approach helps capture genetic variation while minimizing the impact of alignment or variant calling errors, which primarily affect low-frequency variants (e.g., 0.800A, 0.199T, 0.001C, with A being the major allele). As for the divergence sites between species, we defined  FST = 0.8 as a cutoff (roughly, when a mutant is > 0.95 in frequency in one species and < 0.05 in the other, FST would be > 0.80.),  which is less likely to be influenced by low-frequency polymorphic sites within species.We believe this method is more appropriate for estimating genetic diversity at rDNA than traditional variant calling pipelines designed to detect homozygotes and heterozygotes.

    1. Author response:

      The following is the authors’ response to the previous reviews.

      eLife Assessment (divided into 3 parts)

      This study presents a useful modification of a standard model of genetic drift by incorporating variance in reproductive success, claiming to address several paradoxes in molecular evolution. ……

      It is crucial to emphasize that our model is NOT a modification of the standard model. The Haldane model, which is generalized here for population regulation, is based on the branching process. The Haldane model and the WF model which is based on population sampling are fundamentally different. We referred to our model as the integrated WF-H model because the results obtained from the WF model over the last 90 years are often (but not always) good approximations for the Haldane model. The analogy would be the comparisons between the Diffusion model and the Coalescence model. Obviously, the results from one model are often good approximations for the other.  But it is not right to say that one is a useful modification of the other.

      We realize that it is a mistake to call our model the integrated WFH model, thus causing confusions over two entirely different models. Clearly, the word “integrated” did not help. We have now revised the paper by using the more accurate name for the model – the Generalized Haldane (GH) model. The text explains clerarly that the original Haldane model is a special case of the GH model.

      Furthermore, we present the paradoxes and resolve them by the GH model.  We indeed overreached by claiming that WF models could not resolve them. Whether the WF models have done enough to resolve the paradoxes or at least will be able to resolve them should not be a central point of our study. Here is what we state at the end of this study.:

      “We understand that further modifications of the WF models may account for some or all of these paradoxes. However, such modifications have to be biologically feasible and, if possible, intuitively straightforward. Such possible elaborations of WF models are beyond the scope of this study. We are only suggesting that the Haldane model can be extensively generalized to be an alternative approach to genetic drift. The GH model attempts to integrate population genetics and ecology and, thus, can be applied to genetic systems far more complex than those studied before. The companion study is one such example.”

      ….. However, some of the claimed "paradoxes" seem to be overstatements, as previous literature has pointed out the limitations of the standard model and proposed more advanced models to address those limitations….

      As stated in the last paragraph of the paper, it is outside of the scope of our study to comment on whether the earlier WF models can resolve these paradoxes.  So, all such statements have been removed or at least drastically toned down in the formal presentation.  That said, editors and reviewers may ask whether we are re-inventing the wheels.  The answers are as follows:

      First, two entirely different models reaching the same conclusion are NOT the re-invention of wheels. The coalescence theory does not merely rediscover the results obtained by the diffusion models. The process of obtaining the results is itself a new invention.  This would lead to the next question: is the new process more rigorous and more efficient?  I think the Haldane model is indeed more efficient in comparisons with the very complex modifications of the WF models. 

      Second, we are not sure that the paradoxes have been resolved, or even can be resolved.  Note that these skepticisms have been purged from the formal presentation. Thefore, I am presenting the arguments outside of the paper for a purely intellectual discourse. Below, please allow us to address the assertions that the WF models can resolve the paradoxes. 

      The first paradox is that the drift strength in relation to N is often opposite of the WF model predictions.  Since the WF models (standard or modified) do not generate N from within the model, how can it resolve the paradox?  In contrast, the Generalized Haldane model generates N within the model. It is the regulation of N near the carrying capacity that creates the paradox – When N increases, drift also increases.

      The second paradox that the same locus experiences different drifts in males and females is accepted by the reviewers.  Nevertheless, we would like to point out that this second paradox echoed the first one as newly stated in the Discussion section “The second paradox of sex-dependent drift is about different V(K)’s between sexes (generally Vm > Vf) but the same E(K) between them. In the conventional models of sampling, it is not clear what sort of biological sampling scheme could yield V(K) ≠ E(K), let alone two separate V(K)’s with one single E(K). Mathematically, given separate K distributions for males and females, it is unlikely that E(K) for the whole population could be 1, hence, the population would either explode in size or decline to zero. In short, N regulation has to be built into the genetic drift model as the GH model does to avoid this paradox.”

      The third paradox stems from the fact that drift is operating even for genes under selection. But then the drift strength, 2s/V(K) for an advantage of s, is indepenent of N or Ne. Since the determinant of drift strength in the WF model is ALWAYS Ne, how is Paradox 3 not a paradox for the WF model?

      The 4th paradox about multi-copy gene systems is the subject of the companion paper (Wang et al.). Note that the WF model cannot handle systems of evolution that experience totally different sorts of drift within vs. between hosts (viruses, rDNAs etc).  This paradox can be understood by the GH model and and will be addressed in the next paper.

      While the modified model presented in this paper yields some intriguing theoretical predictions, the analysis and simulations presented are incomplete to support the authors' strong claims, and it is unclear how much the model helps explain empirical observations.

      The objections appear to be that our claims of “paradox resolution” being too strong.  We interpret this objection is based on the view (which we agree) that these paradoxes are intrisicallly difficult to resolve by the WF models. Since our model has been perceived to be a modified WF model, the claim of resolution is clearly too strong.  However, the GH model is conceptually and operationally entirely different from the WF models as we have emphasized above. In case our reading of the editorial comments is incorrect, would it be possible for some clarifications on the nature of “incomplete support”?  We would be grateful for the help.

    1. Author response:

      The following is the authors’ response to the original reviews.

      Public Reviews:

      Reviewer #1 (Public Review):

      Summary:

      In this manuscript, Janssens et al. addressed the challenge of mapping the location of transcriptionally unique cell types identified by single nuclei sequencing (snRNA-seq) data available through the Fly Cell Atlas. They identified 100 transcripts for head samples and 50 transcripts for fly body samples allowing the identification of every unique cell type discovered through the Fly Cell Atlas. To map all of these cell types, the authors divided the fly body into head and body samples and used the Molecular Cartography (Resolve Biosciences) method to visualize these transcripts. This approach allowed them to build spatial tissue atlases of the fly head and body, to identify the location of previously unknown cell types and the subcellular localization of different transcripts. By combining snRNA-seq data from the Fly Cell Atlas with their spatially resolved transcriptomics (SRT) data, they demonstrated an automated cell type annotation strategy to identify unknown clusters and infer their location in the fly body. This manuscript constitutes a proof-of-principle study to map the location of the cells identified by ever-growing single-cell transcriptomic datasets generated by others.

      Strengths:

      The authors used the Molecular Cartography (Resolve Biosciences) method to visualize 100 transcripts for head samples and 50 transcripts for fly body samples in high resolution. This method achieves high resolution by multiplexing a large number of transcript visualization steps and allows the authors to map the location of unique cell types identified by the Fly Cell Atlas. 

      We thank this reviewer for appreciating the quality of our spatial data. We do not know what caused the technical problem (grayscale version of PDF) for this reviewer (the PDF figures are in color on the eLife website and on bioRxiv). We are surprised that the eLife discussion session did not resolve this issue.

      Weaknesses:

      Combining single-nuclei sequencing (snRNA-seq) data with spatially resolved transcriptomics (SRT) data is challenging, and the methods used by the authors in this study cannot reliably distinguish between cells, especially in brain regions where the processes of different neurons are clustered, such as in neuropils. This means that a grid that the authors mark as a unique cell may actually be composed of processes from multiple cells. 

      The small size of an individual fly is one of the most challenging aspects of performing spatial transcriptomics. While the resolution of Molecular Cartography is rather high (< 200 nm), in the brain challenges remain as noted by the reviewer. Drosophila neuronal nuclei are notoriously small and cannot be easily resolved with the current imaging techniques. We agree that for a full atlas either expansion microscopy, 3D techniques or other super-resolution techniques will be required. 

      Reviewer #2 (Public Review):

      Summary:

      The landmark publication of the "Fly Atlas" in 2022 provided a single cell/nuclear transcriptomic dataset from 15 individually dissected tissues, the entire head, and the body of male and female flies. These data led to the annotation of more than 250 cell types. While certainly a powerful and datarich approach, a significant step forward relies on mapping these data back to the organism in time and space. The goal of this manuscript is to map 150 transcripts defined by the Fly Atlas by FISH and in doing so, provide, for the first time, a spatial transcriptomic dataset of the adult fly. Using this approach (Molecular Cartography with Resolve Biosciences), the authors, furthermore, distinguish different RNA localizations within a cell type. In addition, they seek to use this approach to define previously unannotated clusters found in the Fly Atlas. As a resource for the community at large interested in the computational aspects of their pipeline, the authors compare the strengths and weaknesses of their approach to others currently being performed in the field.

      Strengths:

      (1) The authors use Resolve Biosciences and a novel bioinformatics approach to generate a FISHbased spatial transcriptomics map. To achieve this map, they selected 150 genes (50 body; 100 head) that were highly expressed in the single nuclear RNA sequencing dataset and were used in the 2022 paper to annotate specific cell types; moreover, the authors chose several highly expressed genes characteristic of unannotated cell types. Together, the approach and generated data are important next steps in translating the transcriptomic data to spatial data in the organism.

      We thank the reviewer for this comment, as it reminded us that we need to be clearer in the text, about how we chose the genes to investigate. The statement that we selected “150 genes (50 body; 100 head) that were highly expressed in the single nuclear RNA sequencing dataset” is not correct. We have chosen genes with widely differing expression levels (log-scale range of 3.95 in body, 5.76 in head, we show this now in the new Figure 1 – figure fupplement 1B, D). Many of the chosen genes are also transcription factors. In fact, the here introduced method is more sensitive than the single cell atlas: the tinman positive cells were readily located (even non-heart cells were found to express tinman), whereas in the single cell FCA data tinman expression is often not detected in the cardiomyocytes (tinman is detected in 273 cells in the entire FCA (mean expression of 1.44 UMI in positive cells), and in 71 cells out of 273 cardiac cells (26%)). 

      (2) Working with Resolve, the authors developed a relatively high throughput approach to analyze the location of transcripts in Drosophila adults. This approach confirmed the identification of particular cell types suggested by the FlyAtlas as well as revealed interesting subcellular locations of the transcripts within the cell/tissue type. In addition, the authors used co-expression of different RNAs to unbiasedly identify "new cell types". This pipeline and data provide a roadmap for additional analyses of other time points, female flies, specific mutants, etc.

      (3) The authors show that their approach reveals interesting patterns of mRNA distribution (e.g alpha- and beta-Trypsin in apical and basal regions of gut enterocytes or striped patterns of different sarcomeric proteins in body muscle). These observations are novel and reveal unexpected patterns. Likewise, the authors use their more extensive head database to identify the location of cells in the brain. They report the resolution of 23 clusters suggested by the single-cell sequencing data, given their unsupervised clustering approach. This identification supports the use of spatial cell transcriptomics to characterize cell types (or cell states).

      (4) Lastly, the authors compare three different approaches --- their own described in this manuscript, Tangram, and SpaGE - which allow integration of single cell/nuclear RNA-seq data with spatial localization FISH. This was a very helpful section as the authors compared the advantages and disadvantages (including practical issues, like computational time).

      Weaknesses:

      (1) Experimental setup. It is not clear how many and, for some of the data, the sex of the flies that were analyzed. It appears that for the body data, only one male was analyzed. For the heads, methods say male and female heads, but nothing is annotated in the figures. As such, it remains unclear how robust these data are, given such a limited sample from one sex. As such, the claims of a spatial atlas of the entire fly body and its head ("a rosetta stone") are overstated. Also, the authors should clearly state in the main text and figure legends the sex, the age, how many flies, and how many replicates contributed to the data presented (not just the methods). What also adds to the confusion is the use of "n" in para 2 of the results. " ... we performed coronal sections at different depths in the head (n=13)..." 13 sections in total from 1 head or sections from 13 heads? Based on the body and what is shown in the figure, one assumes 13 sections from one head. Please clarify.

      While we agree that sex differences present indeed an interesting opportunity to study with spatial transcriptomics, our goal was not to define male/female differences but rather to establish the technology to go into this detail if wanted in the future. In the revised version, we have provided an additional supplementary table with a more detailed description of the head sections (Table S3). We have added the number of animals (12 for the head sections, mixed sex; and 1 male for the body sections) to the main text. We would like to point out that we verified the specificity of our MC method on all the 5 body sections (Figure 2A, TpnC4 & Act88F and text) and not only on one. Furthermore, we also would like to state that the idea of “a Rosetta stone” was mentioned as a future prospect that clearly goes beyond our presented work. We have rewritten the discussion to make this clearer and to any avoid overstatements.

      (2) Probes selected: Information from the methods section should be put into the main text so that it is clear what and why the gene lists were selected. The current main text is confusing. If the authors want others to use their approach, then some testing or, at the very least, some discussion of lower expressed genes should be added. How useful will this approach be if only highly expressed genes can be resolved? In addition, while it is understood that the company has a propriety design algorithm for the probes, the authors should comment on whether the probes for individual genes detect all isoforms or subsets (exons and introns?), given the high level of splicing in tissues such as muscle.

      As stated above, while there is a slight bias to higher expressed genes (as expected for marker genes), we have also used low expressed genes like salm, CG32121, tinman (body) or sens (head). This is now shown in new Figure 1 – figure Supplement 1B, D. This shows that our method is more sensitive than single-cell data, as all cardiomyocytes can be identified by tinman expression and not only some are positive, as is the case in the FCA data. In fact, the method cannot resolve too highly expressed genes due to optical crowding of the signal leading to a worse quantification. For this reason, ninaE was removed from the analysis (as mentioned in Spatial transcriptomics allows the localization of cell types in the head and brain and in Methods).

      As mentioned in the Methods, the probes are designed on gene level targeting all isoforms, but favoring principal isoforms (weighted by APPRIS level). The high level of splicing is indeed interesting and we expect that in the future spatial transcriptomics can help to generate more insight into this by designing isoform-specific probes.

      (3) Imaging: it isn't clear from the text whether the repeated rounds of imaging impacted data collection. In many of what appear to be "stitched" images, there are gradients of signal (eg, figure 2F); please comment. Also, since this a new technique, could a before and after comparison of the original images and the segmented images be shown in the supplemental data so that the reader can better appreciate how the authors assessed/chose/thresholded their data? More discussion of the accuracy of spot detection would be helpful. 

      High-resolution imaging (pixel size = 138 nm) of a large field of view (>1mm) for spatial transcriptomics uses a stitching method to combine several individual images to reconstruct a large field of view. This does not generate signal gradients, apart from lower signal at the extreme edges of each of the individual images, as seen in our images, too. The spot detection algorithm was written and used by Resolve Biosciences and benchmarked for human (Hela) and mouse (NIH-3T3) cell lines in Groiss et al. 2021 (Highly resolved spatial transcriptomics for detection of rare events in cells, bioR xiv). The specificity of the decoded probes was found to lie between 99.45 and 99.9% here, matching the results we found for specific detection of TpnC4 and Act88F (99.4 and 99.8%).

      (4) The authors comment on how many RNAs they detected (first paragraph of results). How do these numbers compare to the total mRNA present as detected by single-cell or single-nuclear sequencing?

      We can compare the numbers, but the different methodologies make the interpretation of such a comparison difficult. FCA used single nucleus sequencing, so only nuclear pre-mRNAs are detected. The total amount of counts per single cell sample strongly depends on how many cells were sequenced in an experiment. MC detects all mRNAs present in the section. Here, the size of the sample and hence the size or the number of cells analyzed determines how many mRNAs are detected. In Author response image 1, we have compared our MC results versus FCA data, comparing the genes investigated here in MC per section vs per sequencing experiment. Numbers for MC are slightly lower for the brain (not all cell types are on all sections) and much higher for the larger body samples. However, we feel a direct comparison is questionable, so we prefer to not include this figure in our manuscript.

      Author response image 1:

      Barplots showing total number of mRNA molecules detected in Molecular Cartography (MC, Resolve, spatial spots) and in snRNA-seq data from the Fly Cell Atlas (10x Genomics, UMIs). Individual black dots show individual experiments, counts are only shown for the chosen gene panel for each sample. Bar shows the mean, with error bars representing the standard error.

      (5) Using this higher throughput method of spatial transcriptomics, the authors discern different cell types and different localization patterns within a tissue/cell type.

      a. The authors should comment on the resolution provided by this approach, in terms of the detection of populations of mRNAs detected by low throughput methods, for example, in glia, motor neuron axons, and trachea that populate muscle tissue. Are these found in the images? Please show.

      We did not add any markers for trachea in our gene panel, but we do detect sparse spots of repo (glia) and elav/VGlut in the muscle tissues (Gad1/VAChT are hardly detected in the muscle tissue). This is consistent with the glutamatergic nature of motor neurons in Drosophila as described previously (Schuster CM (2006), Glutamatergic synapses of Drosophila neuromuscular junctions: a high-resolution model for the analysis of experience-dependent potentiation. Cell Tissue Res 326:

      287–299.). We have present these new data in new Figure 2 – figure supplement 1.

      b.The authors show interesting localization patterns in muscle tissue for different sarcomere proteincoding mRNAs, including enrichment of sls in muscle nuclei located near the muscle-tendon attachment sites. As this high throughput approach is newly being applied to the adult fly, it would increase confidence in these data, if the authors would confirm these data using a low throughput FISH technique. For example, do the authors detect such alternating "stripes" ( Act 88F, TpnC4, and Mhc) or enriched localization (sls) using FISH that doesn't rely on the repeated colorization, imaging, decolorization of the probes? 

      We thank the reviewer for the interest in the localization patterns in muscle tissue. We show that Act88F, TpnC4 are not detected outside of flight muscle cells (99.4% and 99.8% of the single molecular signal in flight muscles only), giving us confidence in the specificity of the MC method. Following the suggestion of the reviewer, we have adapted an HCR-FISH method to Drosophila adult body sections for the revised version of the manuscript. Using this method, we were able to confirm the higher expression/localization of sls transcripts to and around the adult flight muscle nuclei, with an enrichment in nuclei close to the muscle-tendon attachment sites (new Figure 4D-F and new Figure 4 – figure supplement 1). We have also been able to confirm some complementarity in the localization patterns of Act88F and TpnC4 in longitudinal stripes in adult flight muscles, however for Mhc we could not confirm this pattern with HCR-FISH (new Figure 5C-F and new Figure 5 – figure supplement 1). While we could confirm most of the pattern seen, we do not know the exact reason for the slight discrepancies. Thus, we now recommend that insights found with SRT should be confirmed with more classical FISH methods.

      (6) The authors developed an unbiased method to identify "new cell types" which relies on coexpression of different transcripts. Are these new cell types or a cell state? While expression is a helpful first step, without any functional data, the significance of what the authors found is diminished. The authors need to soften their statements.

      The term “new cell types” only appeared in the old title. We agree that with the current spatial map we cannot be sure to have found “new cell types”, instead we show where unannotated/uncharacterized clusters from the scRNA-seq atlas are located, based on their gene expression. Therefore, we have updated the title in the revised version (Spatial transcriptomics in the adult Drosophila brain and body) and thank the reviewer for this valuable suggestion.

      Appraisal:

      The authors' goal is to map single cell/nuclear RNAseq data described in the 2022 Fly Atlas paper spatially within an organism to achieve a spatial transcriptomic map of the adult fly; no doubt, this is a critical next step in our use of 'omics approaches. While this manuscript does the hard work of trying to take this next step, including developing and testing a new pipeline for high throughput FISH and its analysis, it falls short, in its present form, in achieving this goal. The authors discuss creating a robust spatial map, based on one male fly. Moreover, they do not reveal principles of mRNA localization, as stated in the abstract; they show us patterns, but nothing about the logic or function of these patterns. This same criticism can be said of the identification of "new cell types, just based on RNA colocalization. In both cases (mRNA subcellular localization or cell type identification), further data in the form of validation with traditional low throughput FISH and genetic manipulations to assess the relation to cell function are required for the authors to make such claims. 

      We have indeed used one male fly for the adult male body data. This is mainly due to the cost of the sample processing. We used 12 individuals for the head samples (from 1 individual we acquired 2 sections, a total of 13 sections). We show that the body samples show a high correlation with each other, while the head samples cover multiple depths of the head. Still, even in the head, we find that sections at similar depths show a high similarity to each other in terms of gene-gene coexpression and expression patterns. Although obtaining sections from more animals would be valuable, we do not believe it to be necessary for our current goals. Additional replicates beyond the ones we already provide would require significant amounts of extra time and budget, while they would very likely produce similar results as we already show. Following the reviewer’s suggestion, we have tested several genes with HCR-FISH and could readily confirm the localization pattern of sls mRNA close to the terminal nuclei of the flight muscles. This pattern is likely due to a higher expression of sls in these nuclei, as a large amount of sls mRNA signal is detected within the nuclei (Figure 4). A detailed dissection of the mechanism that establishes this pattern is beyond the scope of this manuscript, which is the first one on applying spatial transcriptomics to adult Drosophila.

      The usage of the term “new cell types” was indeed ambiguous and we removed this from the revised version. We now clarified that we map the spatial location of unannotated clusters in the brain. This may or may not include uncharacterized cell types. We now further specify that we have only inferred the location of the nuclei; thus, neuronal function or the location of their axonal processes are still unknown. As such, our data provides a starting point to identify uncharacterized cell types, since their marker genes and nuclear location are now determined. The next step to identify “new cell types” would indeed be to acquire genetic access to these cell types and characterize them in more detail. This is beyond the scope of this manuscript, and therefore we have toned down the title in the revised version and thank the reviewer for this valuable suggestion. 

      Discussion of likely impact:

      If revised, these data, and importantly the approach, would impact those working on Drosophila adults as well as those working in other model systems where single cell/nuclear sequencing is being translated to the spatial localization within the organism. The subcellular localization data - for example, the size of transcripts and how that relates to localization or the patterns of sarcomeric protein localization in muscle - are intriguing, and would likely impact our thinking on RNA localization, transport, etc if confirmed. Lastly, the authors compare their computational approaches to those available in the field; this is valuable as this is a rapidly evolving field and such considerations are critical for those wishing to use this type of approach.

      We thank this reviewer for appreciating the impact of our findings and approach to the Drosophila field and beyond. We here provide the groundwork for a full Drosophila adult spatial atlas, similar to how early scRNA-seq datasets provided a framework for the Fly Cell Atlas. In the manuscript we provide both experimental information on how to successfully perform spatial transcriptomics (treating slides for optimal attachment) and the data serves as a benchmark for future experiments to improve upon (similar to how early Drop-seq datasets were compared to later 10x datasets in single-cell transcriptomics). In addition, it also provides proof of principle methods on how to integrate the FCA data with these spatial data and it identifies localized mRNA species in large adult muscle cells, showing the complementarity of spatial techniques with single-cell RNA-seq. For a small number of genes, we have confirmed the mRNA patterns using HCR-FISH in the revised version of this manuscript. To conclude, this is the first spatial adult Drosophila transcriptomics paper, locating 150 mRNA species with easy data access in our user portal (https://spatialfly.aertslab.org/).

      Recommendations for the authors:

      Reviewer #1 (Recommendations For The Authors):

      (1) All figures in the manuscript were in grayscale, which made it difficult to interpret the results because the data could only be interpreted by distinguishing different colors to visualize different transcripts. This is likely a technical problem. The manuscript must contain colored images.

      We apologize to the reviewer for this technical issue. The manuscript was uploaded in color to bioRxiv and to eLife. We therefore do not understand to reason for this problem. We are surprised that this issue was not resolved in the reviewers’ discussion since color is obviously essential to appreciate the beauty of this manuscript.

      (2) In Figure 2a, the authors comment on the subcellular localization of trypsin isoforms, but the figure does not indicate the cell borders or the apical and basal regions of the cell. These must be indicated in the figure to help readers understand the results. 

      We thank the reviewer for pointing this out; we have now indicated the outlines of the single-cell layer epithelium on the figure. While we have no marker for cell borders, we have a nuclear marker showing that it is a single cell layer. We hope this allows the reader to appreciate the subcellular localization of the trypsin isoforms.

      (3) All figures (including the data on the authors' website) contain background staining, which I assume is labeling nuclei. This is not indicated in the manuscript, and should be clarified.

      We again thank the reviewer for pointing this out; the background staining indeed labels nuclei (using DAPI). We have indicated this better in the revised version.

      (4) In Figure 5c, the authors claim that neuronal and muscular genes are grouped into the same cluster, but they do not indicate which transcripts are neuronal and which ones are muscular. This must be indicated in the figure.

      We thank the reviewer for this comment. Indeed, there was only one gene, acj6, present in the muscle cluster. So, we decided to delete this statement in the revised version.

      (5) The authors utilized and compared three different approaches to integrate single nuclei sequencing data from the Fly Cell Atlas to their spatially resolved transcriptomics (SRT) data. I was wondering if it is possible to generate a virtual expression explorer using this integrated data, similar to the dataset published in the 2017 Science article by Karaiskos et al., where they combined publicly available in situ hybridization data of fly embryos and their single-cell sequencing data. This virtual expression explorer would be useful to visualize the expression pattern of transcripts that the authors of this paper did not use for their SRT.

      We thank the reviewer for this interesting comment. Using Tangram, we indeed infer gene expression for all genes from the Fly Cell Atlas. To make this visible we have created a Scope session (https://scope.aertslab.org/#/Spatial_Fly/*/welcome), with which users can browse inferred gene expression levels (note that this is on a segmented cell level). We do notice that the inferred gene expression levels contain many false positives and should therefore be used with caution. The spatial data themselves can be browsed through the spatial portal at https://spatialfly.aertslab.org/ .

      Reviewer #2 (Recommendations For The Authors):

      Suggestions for improved or additional experiments, data, or analyses:

      The authors have used a new high throughput approach to examine the location of 150 RNAs in adult Drosophila heads or one body. It is unclear whether the fixation/repeated imaging etc is accurately reflecting the patterns of expression in vivo. The authors should confirm these data using low throughput established techniques for the RNA patterns in muscle for example.

      The authors should clarify their experimental approaches and include additional samples if they indeed want to establish the rosetta stone of fly adults. These data are from only a male fly (and as such is not a complete analysis of the adult fly). To be a map of the adult fly, data from both sexes need to be included.

      Unless functional data that complement the descriptive data shown here are included, the authors have to soften their conclusions. For example, while spatial transcriptomics has mapped RNA expression to a location, without some functional data, it is difficult to conclude that these are indeed "new cell types". Same with the RNA localization principles.

      Recommendations for improving the writing and presentation:

      (1) The manuscript should be heavily revised: in many places, important details are left out or should be moved from the methods to the main text. In addition, the authors often overstate their findings throughout the manuscript. As an example, it appears that the data presented is only from 1 fly, so this doesn't increase the reader's confidence in the data or the applicability of the approach. Also, it isn't clear how many flies were analyzed for the heads (one male fly too?) nor what variability is present from fly to fly. For the approach and data to be used by others, this is important to know.

      We moved some text from the methods section to the main text to be clearer. We now also state how many animals were used for the MC method. While the data for the body has been generated from 1 male only, the data for the head was generated from 12 flies; for both cases, similar slices show very similar gene expression patterns. Furthermore, in the body we used widely known and published marker genes that all showed expected expression patterns, indicating robustness. We agree that this is not a full spatial atlas of the fly, this was also not our goal and we have removed such general statements from the revised version: we aimed to generate a spatial transcriptomics dataset, covering the entire fly (head and body) as a proof-of-principle, tackling data generation and analysis, and highlighting challenges in both.

      (2) The grammar and word choice throughout are challenging often making the text difficult to follow. This reads like an early draft of the paper.

      We apologize to the reviewer for any difficulties. We have revised the text and hope it is now easier to read, while still being accurate on the technical details of the various methods used in our manuscript.

      Minor corrections to the text and figures.

      See the weaknesses mentioned above. Also:

      Figure S1 is unreadable.

      There is no simple way to describe the expression values of 100 genes in 100 cell types on a single page. The resolution of the PDF is high enough that after zooming in, all the information can be read easily.

      Figure S2, in a, please include the axes so that the reader can better understand the sections shown.

      In b, it is unclear what the pink boxes mean. In c, the labels are barely legible.

      In Figure 1 – figure supplement 2 (head sections), we have ordered the head sections from anterior to posterior. The boxes in (B) represent boxplots. We have updated this plot for clarity to better display the number of mRNA molecules detected for each gene. We have increased the font size in (C).

      Figure S3, in a, please include axes. In b, the meaning of the pink box

      In Figure 1 – figure supplement 3 (the body sections) we have added the anterior to posterior and dorso-ventral axis, and ordered the sections that stem from the same animal. The boxes in (B) represent boxplots. We have updated this plot for clarity to better display the number of mRNA molecules detected for each gene. We have added an explanation to the figure legend.  

      Figure S4, the text in the axes of the heatmap should have a darker typeface

      We have changed it to black, thanks.

      Figure S5c, are the colors in the dendrogram supposed to match the spatial location on the right?

      The purple of the muscles is barely visible.

      Yes, they do match. Colors were modified in the revised version for better visibility.

    1. Author response:

      Public Reviews:

      Reviewer #1 (Public review):

      Summary:

      The significance of Notch in liver cancer has been inconsistently described to date. The authors conduct a PDX screen using JAG1 ab and identify 2 sensitive tumor models. Further characterization with bulk RNA seq, scRNA seq, and ATAC seq of these tumors was performed.

      Strengths:

      The reliance on an extensive panel of PDXs makes this study more definitive than prior studies.

      Gene expression analyses seem robust.

      Identification of a JAG1-dependent signature associated with hepatocyte differentiation is interesting.

      Weaknesses:

      The introduction is rather lengthy and not entirely accurate. HCC is a single cancer type/histology. There may be variants of histology (allusion to "mixed-lineage" is inaccurate as combined HCC-CCa are not conventionally considered HCC and are not treated as HCC in clinical practice as they are even excluded from HCC trials), but any cancer type can have differences in differentiation. Just state there are multiple molecular subtypes of this disease.

      We will shorten the Introduction, in part by eliminating the discussion of histological variation in HCC and focusing on the molecular classifications.

      There is minimal data on the PDXs, despite this being highlighted throughout the text. Clinical and possibly some molecular characterization of these cancers should be provided. It is also odd that the authors include only 35 HCC and then a varied sort of cancer histologies, which is peculiar given their prior statements regarding the heterogeneity of HCC.

      We agree that clinical and molecular characterizations of the PDX models would be helpful and will follow up with the relevant contract research organization to determine what characterization is available.

      Regarding the liver cancer PDX panel, we suggest that a major strength of the manuscript is the large number of HCC models that were tested (the reviewer also notes the importance of the “extensive” panel); thus, we are a bit confused by the reference to “only 35 HCC”.  To clarify the choice of models in the PDX screen, it may help to put the screen in historical perspective as the project unfolded.  In retrospect, our preliminary efficacy studies using only two HCC models were fortunate to identify the highly sensitive model, LIV78.  To go beyond the simple diagnostic hypothesis that focused on Jag1, Notch2 and Hes1 expression, we took an unbiased approach to discover features linked to Notch dependence.  This approach meant running an efficacy screen in all liver cancer models that were up and running at our chosen research organization, without biased selection criteria.  That set of models is what is represented in the “pre-clinical screen” in Fig. 1B

      "super-responder" is not a meaningful term, I would eliminate this use as it has no clinical or scientific convention that I am aware of.

      We were aware of the interchangeable terms of “exceptional-“ or “super-responder” and prefer to leave this language in the text.  Some references are as follows: 

      ● Prasad et al., Characteristics of exceptional or super responders to cancer drugs. Mayo Clinic Proceedings, 2015. 

      ● NCI Press Release 2020:  https://www.cancer.gov/news-events/press-releases/2020/cancer-exceptional-responders-study-genetic-alterations-may-contribute

      ● NIH Info:  https://www.nih.gov/news-events/nih-research-matters/understanding-exceptional-responders-cancer-treatment

      ● “What is a Super Responder?  Bradley Jones, Cancer Today, June 26, 2020.

      ● “What is a Super Responder?”  AACR.  https://www.aacr.org/patients-caregivers/progress-against-cancer/what-is-a-super-responder/

      The "expansion" of the PDX screen is poorly described. Why weren't these PDXs included in the first screen? This is quite odd as the responses in the initial screen were underwhelming. What was the denominator number of all PDXs that were assessed for JAG1 and NOTCH2 expression? This is important as it clarifies how relevant JAG1 inhibition would be to an unselected HCC population.

      We will revise the writing here to clarify as requested.  For now, we can hopefully clarify by building on the historical context described above.  As the reviewer notes and as we describe in the text, the in vivo screen revealed only a modest JAG1 dependence.  The screen also highlighted that LIV78 was exceptional, and we wanted to understand why.  Hypothesizing that the expression of progenitor markers in LIV78 were important for understanding its JAG1 dependence, we identified four additional models at other contract research organizations.  It is this set of four that comprises the “expansion” cohort.

      Was there some kind of determination of the optimal dose or dose dependency for the JAG1 ab? The original description of the JAG1 ab was in mouse lungs, not malignant or liver cells. In addition, supplementary Figure 2D is missing. There needs to be data provided on the specificity of the human-specific JAG1 ab and the anti-NOTCH2 ab. I'm not familiar with these ab, and if they are not publicly accessible reagents, more transparency on this is needed. In addition, given the reliance of the entire paper on these antibodies, I would recommend orthogonal approaches (either chemical or genetic) to confirm the sensitivity and insensitivity of select PDXs to Notch inhibition.

      First, we note that the anti-human/mouse Jagged1 and Notch2 blocking antibodies used in our study have been extensively characterized as potent and selective and have been widely used outside of our group by the Notch research community (for the human/mouse cross-reactive antibodies, see Wu et al., Nature, 2010 for anti-NOTCH2 and Lafkas et al., Nature 2015 for anti-JAG1). As noted, the antibodies have been used in studies of normal mouse lungs (Lafkas et al.).  Please note that the characterization also includes mouse models of primary liver cancer that formed the foundation for the current work (please refer to Huntzicker et al, 2015).

      While we show dose responses in Figures 1A and 1D, we have not optimized dosing, for example by determining the minimal drug exposures needed for pharmacodynamic changes (pathway inhibition) and efficacy.  For the purposes of this study, we erred on the side of dosing at high concentrations to minimize the risk of false negative responses.

      Regarding the specificity of the human-specific anti-JAG1 antibody, which is revealed here for the first time, we apologize that we incorrectly provided a text reference to Supplementary Figure 2D instead of Supplementary Figure 1D.  We will revise accordingly.  Fig. 1D shows results from a reporter assay demonstrating that the antibody blocks signaling induced by human but not mouse JAG1.

      We appreciate the value of orthogonal methods in establishing the credibility of a novel finding.  We note that genetic approaches are technically highly challenging in PDX models.  Chemically, we could have tested y-secretase inhibitors (GSIs). Our position is that such inhibitors are poor substitutes for the selective antibodies that we employed, at least for addressing the questions that are relevant in this study.   Although commonly used to perturb Notch signaling, GSIs target numerous proteins and signaling cascades independent of Notch.  Moreover, their use in vivo leads to intestinal and other toxicities, limiting exposure. 

      scRNA-seq data seems to add little to the paper and there is no follow-up of the findings. Are the low-expressing JAG1 cells eventually enriched in treated tumors contributing to disease recurrence?

      We respectfully disagree with this sentiment. The single-cell RNA sequencing dataset revealed the enrichment of hepatocyte-like tumor cells following Notch inhibition. Importantly, this dataset also allowed us to identify transcription factor activities regulating different cell states, which we could not have done otherwise. This understanding in turn was fundamental to develop our hypothesis that Notch inhibition, through derepressing CEBPA expression, allows chromatin engagement of HNF4A and CEPBA and thereby promotes a hepatocyte differentiation program that is not compatible with tumor maintenance.  

      The discussion should be tempered. The finding of only 2 PDXs that are sensitive out of 45+ tumors treated or selected for indicates that JAG1/NOTCH2 inhibition is likely only effective in rare HCC.

      We agree that strong responses to Notch inhibition in the PDX models are rare (~5%) and state as much in both the Results and Discussion sections. We maintain that it is important to put this PDX response frequency into a larger context.  First, establishing PDX models---human tumor samples that grow on the flanks of immunocompromised mice---represents a strong selective pressure.  In other words, we don’t know precisely how the frequency of responses in this selected set of PDX models may compare to the frequency that would be observed in human patient populations. Second, the magnitude of the response points to important and hitherto unappreciated biology, with blocking JAG1 or NOTCH2 reproducibly inducing regressions in the most sensitive models.  Our hope is that the field can build from this study to generate diagnostic tools that identify sensitive patient tumors, define the true frequency of this patient group within the larger HCC population (even though likely rare), and direct the relevant Notch-based therapeutics to these patients.  Within this context, and while noting the rarity of PDX responses, we hope that we have not overstated the case.

      Reviewer #2 (Public review):

      Summary:

      The authors used a large panel of hepatocellular carcinoma patient-derived xenograft models to test the hypothesis that the developmental dependence of the liver on Jagged1-Notch2 signaling is retained in at least a subset of hepatocellular carcinomas. This led to the identification of two models that were extraordinarily sensitive to well-characterized, specific inhibitory antibodies against Jagged1 or Notch2. Based on additional analyses in these in vivo models, the authors provide compelling evidence that the response is due to the inhibition of human Notch2 and human Jagged1 on tumor cells and that this inhibition leads to a change in gene expression from a progenitor-like state to a hepatocyte-like state accompanied by cell cycle arrest. This change in cell state is associated with up-regulation of HNF4a and CEBPB and increased accessibility of predicted HNF4a and CEBPB genomic binding sites, accompanied by loss of accessibility to sequences predicted to bind TFs linked to multipotent liver progenitors. The authors put forth a plausible model in which inhibition of Notch2 downregulates transcriptional repressors of the Hairy/Enhancer of Split family, leading to increased expression of CEBPB and changes in gene expression that drive hepatocyte differentiation.

      Strengths:

      The strengths of the paper include the breadth of the preclinical screen in PDX models (which may be of an unprecedented size as preclinical trials go), the high quality of the well-characterized antibodies used as therapeutics and as biological perturbagens, the quality of the data and data analysis, and the authors balanced discussion of the strengths and weaknesses of their findings.

      Weaknesses:

      The principal weakness is the inability to clearly demonstrate the "translatability" of the PDX findings to primary human hepatocellular carcinoma.

      We agree that translatability has not been fully addressed.  As noted in our response to Reviewer 1, our hope is that the field can build from this study to generate diagnostic tools that identify sensitive patient tumors, define the true frequency of this patient group within the larger HCC population, and direct the relevant Notch-based therapeutics to these patients.  We remain encouraged by the strength of the response in the sensitive models.

      Additional Comments:

      Hepatocellular carcinoma is increasing in frequency and is difficult to treat; cure is only possible through early diagnosis and surgery, often in the form of liver transplantation. It is also a common cancer, and so even if only 5% of tumors (a value based on the frequency of super-responders in this preclinical trial) fall into the Jagged1-Notch2 group defined by Seidel et al., the development of an effective therapy for this subgroup would be a very important advance. The chief limitation of their work is that it stops short of identifying primary human hepatocellular carcinomas that correspond to the super-responder PDX models. It can be hoped that their intriguing observations will spur work aimed at filling this gap.

      There are several other loose ends. An unusual feature of this model is that both Jagged 1 and Notch2 are expressed in the same cells, and even in the same individual cells. In developmental systems, the expression of ligands and receptors in the same cell generally produces receptor inhibition rather than activation, a phenomenon described as cis inhibition. Their super-responder tumor models appear to break this rule, and how and why this is so remains to be understood. A follow-up question is what explains the observed heterogeneity in tumor cells, both at the level of Notch2 activation and scRNAseq clustering, and whether these different cell states are static or interchangeable.

      We enthusiastically agree that these are fascinating questions, worthy of further study.  As noted, the majority of tumor cells express both ligand and receptor and seem to be “on” for Notch signaling.  We have not been able to determine whether the signal is induced in a cell autonomous or non-autonomous manner (or both).  As the reviewer notes, the HCC features we observe are inconsistent with the dogma that has arisen from studies on Notch signaling in developmental contexts.

      We do not yet have the experimental data to fully address the second question of what causes the heterogeneity of Notch2 activation and scRNAseq clustering.  We speculate that the cell states may be dynamic, which would be consistent with the changes in cell populations observed after antibody treatment.

      Another unanswered issue pertains to the nature of the tumor response to Notch signaling blockade, which appears to be mainly cell cycle arrest. There are a number of human tumors with cell autonomous Notch signaling due to gain of function Notch receptor mutations that also respond to Notch blockade with cell cycle arrest, such as T cell acute lymphoblastic leukemia (T-ALL). In general, clinical trials of pan-Notch inhibitors such as gamma-secretase inhibitors have been disappointing in such tumors, perhaps reflecting a limitation of treatments with significant toxicity that do not kill tumor cells directly. It could be argued that this limitation will be mitigated by the apparently excellent safety profile of Notch2 blocking antibody, which perhaps could be administered for a sustained period, akin to the use of tyrosine kinase inhibitors in chronic myeloid leukemia---but this remains to be determined.

      We agree that a full understanding of the tumor response warrants further investigation.  Like the reviewer, we speculate that the improved safety profile of selective antibodies relative to pan-Notch inhibitors may enable greater and sustained therapeutic coverage of Notch inhibition than has been feasible in T-ALL trials.  Given that in the sensitive PDX models we observe rapid tumor regressions, not just stasis, it would seem to follow that the mechanism underpinning the tumor response involves more than just cell cycle blockade.  Whether tumor shrinkage reflects additional cell death mechanisms or simply tumor cell turnover after cell cycle arrest remains to be determined. 

      A minor comment is reserved for the statement in the discussion that "In chronic myelomonocytic leukemia, which results from an inactivating mutation in the y-secretase complex component nicastrin, Notch signaling has a tumor suppressive function, that is mediated through direct repression of CEBPA and PU.1 by HES1 (Klinakis et al., 2011)". Thousands of cases of CMML and related myeloid tumors have been subjected to whole exome and even whole genome sequencing without the identification of Notch signaling pathway mutations. Thus, an important tumor suppressive role for Notch-mediated through HES1 in myeloid tumors is not proven.

      We agree that our sentence about Notch and CMML does not fit well with the prevalent paradigm established by genome wide sequencing and other methods.  We will edit this paragraph accordingly, focusing on Hes1 negative regulation of CEBPA in myeloid fate control and how that shapes our thinking on molecular mechanisms in the Notch-dependent HCCs.

      Reviewer #3 (Public review):

      Summary:

      Notch is active in HCC, but generally not mutated. The authors use a JAG1-selective blocking antibody in a large panel of liver cancer patient-derived xenograft models. They find JAG-dependent HCCs, and these are aggressive and proliferative. Notch inhibition induces cycle arrest and promotes hepatocyte differentiation, through upregulation of CEBPA expression and activation of existing HNF4A, mimicking normal developmental programs.

      The authors use aJ1.b70, a potent and selective therapeutic antibody that inhibits JAG1 against PDX models. They tested over 40 PDX models and found a handful of super-responders to single-agent inhibition. In LIV78 and Li1035 cancer cells, NOTCH2 was expressed and required, in contrast to NOTCH1. RNA-seq showed that the responsive HCCs resembled the S2 transcriptional class of HCCs, which were enriched for Notch-dependent models. They conclude that these dependent tumors have transcriptomes that resemble a hybrid progenitor cell expressing FGF9 and GAS7. Inhibition was able to induce hepatocyte differentiation away from a NOTCH-driven progenitor program. scRNA-seq analysis showed a large population of NOTCH-JAG expressing cells but also showed that there are cells that did not. Not surprisingly, NOTCH2 inhibition leads to increased CEBPA and HNF4A transcriptional activity, which are standard TFs in hepatocytes.

      Strengths:

      The paper provides useful information about the frequency of HCCs and CCA that respond to NOTCH inhibition and could allow us to anticipate the super-responder rate if these antibodies were actually used in the clinic. The inhibitor tools are highly specific, and provide useful information about NOTCH activities in liver cancers. The large number of PDXs and the careful transcriptomic analyses were positives about the study.

      Weaknesses:

      The paper is mostly descriptive.

    1. Author response:

      Public Reviews:

      Reviewer #1 (Public review):

      Summary:

      This article investigates the phenotype of macrophages with a pathogenic role in arthritis, particularly focusing on arthritis induced by immune checkpoint inhibitor (ICI) therapy.

      Building on prior data from monocyte-macrophage coculture with fibroblasts, the authors hypothesized a unique role for the combined actions of prostaglandin PGE2 and TNF. The authors studied this combined state using an in vitro model with macrophages derived from monocytes of healthy donors. They complemented this with single-cell transcriptomic and epigenetic data from patients with ICI-RA, specifically, macrophages sorted out of synovial fluid and tissue samples. The study addressed critical questions regarding the regulation of PGE2 and TNF: Are their actions co-regulated or antagonistic? How do they interact with IFN-γ in shaping macrophage responses?

      This study is the first to specifically investigate a macrophage subset responsive to the PGE2 and TNF combination in the context of ICI-RA, describes a new and easily reproducible in vitro model, and studies the role of IFNgamma regulation of this particular Mф subset.

      Strengths:

      Methodological quality: The authors employed a robust combination of approaches, including validation of bulk RNA-seq findings through complementary methods. The methods description is excellent and allows for reproducible research. Importantly, the authors compared their in vitro model with ex vivo single-cell data, demonstrating that their model accurately reflects the molecular mechanisms driving the pathogenicity of this macrophage subset.

      Weaknesses:

      Introduction: The introduction lacks a paragraph providing an overview of ICI-induced arthritis pathogenesis and a comparison with other types of arthritis. Including this would help contextualize the study for a broader audience.

      Thank you for this suggestion, we will add a paragraph on ICI-arthritis to intro.

      Results Section: At the beginning of the results section, the experimental setup should be described in greater detail to make an easier transition into the results for the reader, rather than relying just on references to Figure 1 captions.

      We will clarify the experimental setup.

      There is insufficient comparison between single-cell RNA-seq data from ICI-induced arthritis and previously published single-cell RA datasets. Such a comparison may include DEGs and GSEA, pathway analysis comparison for similar subsets of cells. Ideally, an integration with previous datasets with RA-tissue-derived primary monocytes would allow for a direct comparison of subsets and their transcriptomic features.

      This is a great idea, we will integrate the data sets and if batch correction is successful will present this analysis.

      While it's understandable that arthritis samples are limited in numbers and myeloid cell numbers, it would still be interesting to see the results of PGE2+TNF in vitro stimulation on the primary RA or ICI-RA macrophages. It would be valuable to see RNA-Seq signatures of patient cell reactivation in comparison to primary stimulation of healthy donor-derived monocytes.

      We agree that this would be interesting but given limited samples and distribution of samples amongst many studies and investigators this is beyond the scope of the current study. 

      Discussion: Prior single-cell studies of RA and RA macrophage subpopulations from 2019, 2020, 2023 publications deserve more discussion. A thorough comparison with these datasets would place the study in a broader scientific context.

      Creating an integrated RA myeloid cell atlas that combines ICI-RA data into the RA landscape would be ideal to add value to the field.

      As one of the next research goals, TNF blockade data in RA and ICI-RA patients would be interesting to add to such an integrated atlas. Combining responders and non-responders to TNF blockade would help to understand patient stratification with the myeloid pathogenic phenotypes. It would be great to read the authors' opinion on this in the Discussion section.

      We will be happy to improve the discussion by including these topics.

      Conclusion: The authors demonstrated that while PGE2 maintains the inflammatory profile of macrophages, it also induces a distinct phenotype in simultaneous PGE2 and TNF treatment. The study of this specific subset in single-cell data from ICI-RA patients sheds light on the pathogenic mechanisms underlying this condition, however, how it compares with conventional RA is not clear from the manuscript.

      Given the substantial incidence of ICI-induced autoimmune arthritis, understanding the unique macrophage subsets involved for future targeting them therapeutically is an important challenge. The findings are significant for immunologists, cancer researchers, and specialists in autoimmune diseases, making the study relevant to a broad scientific audience.

      Reviewer #2 (Public review):

      Summary/Significance of the findings:

      The authors have done a great job by extensively carrying out transcriptomic and epigenomic analyses in the primary human/mouse monocytes/macrophages to investigate TNF-PGE2 (TP) crosstalk and their regulation by IFN-γ in the Rheumatoid arthritis (RA) synovial macrophages. They proposed that TP induces inflammatory genes via a novel regulatory axis whereby IFN-γ and PGE2 oppose each other to determine the balance between two distinct TNF-induced inflammatory gene expression programs relevant to RA and ICI-arthritis.

      Strengths:

      The authors have done a great job on RT-qPCR analysis of gene expression in primary human monocytes stimulated with TNF and showing the selective agonists of PGE2 receptors EP2 and EP4 22 that signal predominantly via cAMP. They have beautifully shown IFN-γ opposes the effects of PGE2 on TNF-induced gene expression. They found that TP signature genes are activated by cooperation of PGE2-induced AP-1, CEBP, and NR4A with TNF-induced NF-κB activity. On the other hand, they found that IFN-γ suppressed induction of AP-1, CEBP, and NR4A activity to ablate induction of IL-1, Notch, and neutrophil chemokine genes but promoted expression of distinct inflammatory genes such as TNF and T cell chemokines like CXCL10 indicating that TP induces inflammatory genes via IFN-γ in the RA and ICI-arthritis.

      Weaknesses:

      (1) The authors carried out most of the assays in the monocytes/macrophages. How do APC-cells like Dendritic cells behave with respect to this TP treatment similar dosing?

      We agree that this is an interesting topic especially as TNF + PGE2 is one of the standard methods of maturing in vitro generated human DCs. As DC maturation is quite different from monocyte activation this would represent an entire new study and is beyond the scope of the current manuscript. We will instead describe and cite the literature on DC maturation by TNF + PGE2 including one of our older papers (PMID: 18678606; 2008)

      (2) The authors studied 3h and 24h post-treatment transcriptomic and epigenomic. What happens to TP induce inflammatory genes post-treatment 12h, 36h, 48h, 72h. It is critical to see the upregulated/downregulated genes get normalised or stay the same throughout the innate immune response.

      We will clarify that the gene response is mostly subsiding at the 24 hour time point, which is in line with in vitro stimulation of primary monocytes in other systems.

      (3) The authors showed IL1-axis in response to the TP-treatment. Do other cytokine axes get modulated? If yes, then how do they cooperate to reduce/induce inflammatory responses along this proposed axis?

      We will analyze the data for other pathways that are modulated.

      Overall, the data looks good and acceptable but I need to confirm the above-mentioned criticisms.

    1. Author response:

      The following is the authors’ response to the original reviews.

      Reviewer #1 (Public review):

      Summary:

      This manuscript presents evidence of ’vocal style’ in sperm whale vocal clans. Vocal style was defined as specific patterns in the way that rhythmic codas were produced, providing a fine-scale means of comparing coda variations. Vocal style effectively distinguished clans similar to the way in which vocal repertoires are typically employed. For non-identity codas, vocal style was found to be more similar among clans with more geographic overlap. This suggests the presence of social transmission across sympatric clans while maintaining clan vocal identity.

      Strengths:

      This is a well-executed study that contributes exciting new insights into cultural vocal learning in sperm whales. The methodology is sound and appropriate for the research question, building on previous work and ground-truthing much of their theories. The use of the Dominica dataset to validate their method lends strength to the concept of vocal style and its application more broadly to the Pacific dataset. The results are framed well in the context of previous works and clearly explain what novel insights the results provide to the current understanding of sperm whale vocal clans. The discussion does an overall great job of outlining why horizontal social learning is the best explanation for the results found.

      Weaknesses:

      The primary issues with the manuscript are in the technical nature of the writing and a lack of clarity at times with certain terminology. For example, several tree figures are presented and ’distance’ between trees is key to the results, yet ’distance’ is not clearly defined in a way for someone unfamiliar with Markov chains to understand. However, these are issues that can easily be dealt with through minor revisions with a view towards making the manuscript more accessible to a general audience.

      I also feel that the discussion could focus a bit more on the broader implications - specifically what the developed methods and results might imply about cultural transmission in other species. This is specifically mentioned in the abstract but not really delved into in detail during the discussion.

      We are grateful for the Reviewer’s recognition of the study’s contributions to understanding cultural vocal learning in sperm whales. In response to the concerns regarding clarity and accessibility, we have revised the manuscript to improve the definition of key concepts, such as the notion of “distance” between subcoda trees. This adjustment ensures clarity for readers unfamiliar with the technical details of Markov chains. Additionally, we have expanded the discussion to highlight broader implications of our findings, particularly their relevance to understanding cultural transmission in other species, as suggested.

      Reviewer #2 (Public review):

      Summary:

      The current article presents a new type of analytical approach to the sequential organisation of whale coda units.

      Strengths:

      The detailed description of the internal temporal structure of whale codas is something that has been thus far lacking.

      Weaknesses:

      It is unclear how the insight gained from these analyses differs or adds to the voluminous available literature on how codas varies between whale groups and populations. It provides new details, but what new aspects have been learned, or what features of variation seem to be only revealed by this new approach? The theoretical basis and concepts of the paper are problematical and indeed, hamper potentially the insights into whale communication that the methods could offer. Some aspects of the results are also overstated.

      We appreciate the Reviewer’s acknowledgment of the novelty in describing the internal temporal structure of whale codas. Regarding the concern about the unique contributions of this approach, we have further emphasized in the revised manuscript how our methodology reveals previously uncharacterized dimensions of coda structure. Specifically, our work highlights how non-identity codas, which have received limited attention, play a significant role in inter-clan acoustic interactions. By leveraging Variable Length Markov Chains, we provide a nuanced understanding of coda subunits that complements existing studies and demonstrates the value of this analytical approach.

      Reviewer #3 (Public review):

      Summary:

      The study presented by Leitao et al., represents an important advancement in comprehending the social learning processes of sperm whales across various communicative and socio-cultural contexts. The authors introduce the concept of ”vocal style” as an addition to the previously established notion of ”vocal repertoire,” thereby enhancing our understanding of sperm whale vocal identity.

      Strengths:

      A key finding of this research is the correlation between the similarity of clan vocal styles for non-ID codas and spatial overlap (while no change occurs for ID codas), suggesting that social learning plays a crucial role in shaping symbolic cultural boundaries among sperm whale populations. This work holds great appeal for researchers interested in animal cultures and communication. It is poised to attract a broad audience, including scholars studying animal communication and social learning processes across diverse species, particularly cetaceans.

      Weaknesses:

      In terms of terminology, while the authors use the term ”saying” to describe whale vocalizations, it may be more conservative to employ terms like ”vocalize” or ”whale speech” throughout the manuscript. This approach aligns with the distinction between human speech and other forms of animal communication, as outlined in prior research (Hockett, 1960; Cheney & Seyfarth, 1998; Hauser et al., 2002; Pinker & Jackendoff, 2005; Tomasello, 2010).

      We thank the Reviewer for recognizing the importance of our findings and their appeal to broader audiences interested in animal cultures and communication. In response to the suggestion regarding terminology, we have adopted a more conservative language to align with distinctions between human and non-human communication systems. For example, terms like “vocalize” and “vocal repertoire” are used in place of anthropomorphic terms such as “saying”. This ensures consistency with established conventions while maintaining clarity for a broad readership.

      Reviewer #1 (Recommendations):

      Comment 1

      Lines 11-13: As mentioned above, the implications for comparing communication systems and cultural transmission in other species isn’t really discussed much and I think it’s a really interesting component of the study’s broader implications.

      Thank you for the comment.

      Action - We added a few more sentences to the discussion regarding this.

      Comment 2

      Figure 1: More information on the figure of these trees would help. What do the connecting lines represent? What do the plain black dots and the black dot with the white dot represent? Especially since the ”distance between trees” is a key result, it’s important that someone unfamiliar with Markov chains can understand the basics of how this is calculated and what it represents. It is explained in the methods, but a brief explanation here would make the results and the figure a lot clearer since the methods are the last section of the manuscript.

      These were omitted as we believed that attempting to introduce the mathematical structure and the methodology to compare two instances, in a figure caption, would have caused more ambiguity than necessary.

      Action - Added an informal introduction to these concepts on the figure caption. Also added a pointer to the Supplementary Materials.

      Comment 3

      Table 1: A definition of dICIs should be included here.

      Added the definition of discrete ICI to the table.

      Comment 4

      Figure 2: The placement of the figures is a bit confusing because they are quite far from the text that references them.

      We thank the reviewer for pointing this out, we tried to edit the manuscript to improve this issue, but this part of the editing is more within the journal’s powers than our own.

      Action - Moved images closes to the corresponding text in manuscript.

      Comment 5

      Line 117: Probabilistic distance needs to be briefly explained earlier when you first mention distance (see Lines 11-13 comments).

      Action - Clarifications added in the caption of figure 1. as per comment on Lines 11-13

      Comment 6

      Figure 4: Is order considered in these pairwise comparisons? It looks like there are two dots for each pairwise comparison. Additionally, why is the overlap different in these two comparisons? For example, short:four-plus has an overlap of 0.6, while four-plus:short has an overlap of 0.95.

      The x-axis of the plots in Figure 4 is geographical clan overlap. This is calculated as per (Hersh et al., 2022) and is described in our Methods (see “Measuring clan overlap” section). Given two clans—for example, the Four-Plus and the Short clan—spatial overlap is calculated twice: as the proportion of the Four-Plus clan’s repertoires that were recorded within 1,000 km of at least one of the Short clan’s repertoires, and as the proportion of the Short clan’s repertoires that were recorded within 1,000 km of at least one of the Four-Plus clan’s repertoires.

      Order is important in these pairwise comparisons and generates an asymmetric matrix because the clans have different spatial extents. A clan found in only one small region might overlap completely with a clan that spans the Pacific Ocean, while the opposite is not true. For example, the Short clan spans the Pacific Ocean while the Four-Plus clan has been documented over a smaller area (but that smaller area overlaps extensively with the Short clan range). That is why the value is smaller (0.6) when considering how much of the Short clan’s range is shared with the Four-Plus clan, and larger ( 0.95) when considering how much of the Four-Plus clan’s range is shared with the Short clan.

      Action - We have now added a reference to that section of the Methods in our Figure 4 caption and include the clan spatial overlap matrix as a supplemental table (Table S5).

      Comment 7

      Figure 4: I think the reference should be Hersh et al. [11].

      Thank you for catching this.

      Action - Reference corrected

      Comment 8

      Line 227: What aspect of your analysis looked at how often codas were produced? You mention coda frequency, but it is unclear how this was incorporated into your analysis. If this is included in the methods, the language is a bit too technical to easily parse it out.

      Indeed here we are referencing the results of the paper mentioned in the previous line. We do not look at coda production frequency.

      Action - Added citation to paper that actually performs this analysis.

      Comment 9

      Lines 253-255: I think you could dig into this a little more, as ”there is currently no evidence” is not the most convincing argument that something is not a driver. Perhaps expanding on the latter sentence that clans are recognizable across oceans basins would be helpful. Does this suggest that clans with similar geographic overlap experience diverse environmental conditions across ocean basins? If so, this might better strengthen your argument against environmental drivers.

      Thank you for pointing this out. We feel that the next sentence highlights that clans are recognizable across environmental variation from one side to the other of the ocean basin, which supports the inductive reasoning that codas do not vary systematically with environment. However, we have edited these sentences for clarity.

      Comment 10

      Lines 311-314: It would also be interesting to look at vocal style across non-ID coda types. Are some more similar to each other across clans than others? Perhaps vocal style can further distinguish types of non-ID codas.

      In supplementary Materials 3.4.2 and 3.5 we highlight our results when the codas are separated by coda type summarized in Table S4. We do compare the vocal style across non-ID coda types across clans and within the same clan. The results however are aggregated to highlight the differences in style between the clans and a a coda type-only comparison is not shown.

      Comment 11

      Lines 390-392: I’m assuming this is why pairwise comparisons were directional (i.e., there was both an A:B and a B:A comparison)? Can you speak to why A:B and B:A comparisons can have such different overlap values?

      Given two clans—for example, the Four-Plus and the Short clan—spatial overlap is calculated twice: as the proportion of the Four-Plus clan’s repertoires that were recorded within 1,000 km of at least one of the Short clan’s repertoires, and as the proportion of the Short clan’s repertoires that were recorded within 1,000 km of at least one of the Four-Plus clan’s repertoires.

      Order is important in these pairwise comparisons and generates an asymmetric matrix because the clans have different spatial extents. A clan found in only one small region might overlap completely with a clan that spans the Pacific Ocean, while the opposite is not true. For example, the Short clan spans the Pacific Ocean while the Four-Plus clan has been documented over a smaller area (but that smaller area overlaps extensively with the Short clan range). That is why the value is smaller (0.6) when considering how much of the Short clan’s range is shared with the Four-Plus clan, and larger (0.95) when considering how much of the Four-Plus clan’s range is shared with the Short clan.

      Action - We now include the clan spatial overlap matrix as a supplemental table (Table S5).

      Comment 13

      Line 56: Can you briefly explain what memory means in the context of Markov chains?

      We provide an explanation of the meaning of memory in the Methods section on ”Variable length Markov Chains”. Briefly, the memory in this case means how many states in the past of the Markov chain’s current state are required to predict the next transition of the chain itself. Standard Markov chains “look” back only one time step, while k-th order Markov chains look back k steps. In our case, there was no reason to assume that the memory required to predict different sequences of states (interclick intervals) should be the same across all sequences, and thus we adopted the formalism of variable length Markov chains, that allow for different levels of memory across the system.

      Comment 14

      Supplementary Figure S3: Like in the main manuscript, briefly explain or remind us what the blank nodes and the yellow nodes are.

      Action - Clarified that the orange node represents the root of the tree in the figures.

      Comment 15

      Supplementary Figure S7: Put the letters before the dataset name.

      Action - Done.

      Comment 16

      Supplementary Figure S10: Unclear what ’inner vs outer’ means.

      One specifies comparisons across clans (outer) and the other within the same clan (inner)

      Action - Added clarification on the caption of Figure S10

      Comment 17

      Supplementary Figure S14: Include a-c labels in the figure itself.

      Action - Labels added to figure

      Comment 18

      Supplementary Figure S14: The information about the nodes is what needs to be included earlier and in the main body when discussing the trees.

      Action - Added the explanation earlier in the text and in the main body

      Reviewer #2 (Recommendations):

      Comment 19

      Line 22: ”Symbolic” and ”Arbitrary” are not synonyms. Please see the comment above.

      We agree. Here, we make the point that the evolution of symbolic markers of group identity can be explained from what are initially arbitrary, and meaningless, signals (see [L1, L2]). Our point being that any vocalization, any coda, could have become selected for as an identity coda, and to become symbolic, and evolve to play a key role in cultural group formation and in-group favoritism because they enable a community of individuals to solve the problem of with whom to collaborate. The specific coda itself does not affect collaborative pay offs, but group specific differences in behavior can, as such the coda is arguably symbolic; as it is observable and recognizable, and can serve as a means for social assortment even when the behavioural differences are not. This can explain the means by which the social segregation which is observed among behaviorally distinct clans of sperm whales. However, in this manuscript, we do not extend this discussion of existing literature and have attempted to concisely describe this in a couple of lines, which clearly do a disservice to the large body of literature on the evolution of symbolic markers and human ethnic groups. We have added some citations to this section so that the reader may follow up should they disagree with out brief introductory statements.

      Action - Added citations and pointers to the literature.

      Comment 20

      Line 24: The authors’ terminology around ”markers”, ”arbitrary”, ”symbolic” is unnecessarily confusing and mystifying, giving the impression these terms are interchangeable. They are not. These terms are an integral and long-established part of key definitions in signal theory. Term use should be followed accordingly. The observation that whale vocal signals vary per population does not necessarily mean that they function as a social tag. The word ”dog” varies per population but its use relates to an animal, not the population that utters the word. ”Dog” is not ”symbolic” of England, English-speaking populations or the English language. Furthermore, the function of whale vocal signals is extremely challenging to determine. In the best conditions, researchers can pin the signal’s context, this is distinct from signal’s function and further even for the signal’s meaning. How exactly the authors determine that whale vocal signals are arbitrary is, thus, perplexing given that this would require a detailed description and understanding of who is producing the song, when, towards whom, and how the receivers react, none of which the authors have and without which no claim on the signals’ function can be made. This terminological laxness and the sensu latu in extremis to various terms in an unjustified, unnecessary and unhelpful.

      We use these terms as established in Hersh et al 2022 and the works leading up to it over the last 20 years in the study of sperm whales. These are often derived from definitions by Boyd and Richerson’s work on culture in humans and animals along with evolution of symbolic markers both in theory and in humans. We agree with the reviewer that these are difficult to establish in non-humans, whales or otherwise, but feel strongly that the accumulating evidence provides strong support for the function of these signals as symbolic markers of cultural groups, and that they likely evolved from initially arbitrary calls which were a part of the vocal repertoire (similar to the process and selective environment in Efferson et al. [L1] and McElreath et al. [L2]). We feel that we do not use these terms interchangeably here, and have inherited their use from definitions from anthropology. The work presented here uses terminology built across two decades of work in cetacean, and sperm whale, culture. And do not feel that these terms should be omitted here.

      Comment 21

      Lines 21-27: Overly broad and hazy paragraph.

      We hope the replies above and our changes satisfy this comment and clarify the text.

      Comment 22

      Figure 1 legend: What are ”memory structures”? Unjustified descriptor.

      The phrase was chosen to make draw some intuition on the variation of context length in variable length markov models.

      Action - Re-worded from memory structures to statistical properties

      Comment 23

      Line 30: Omit ”finite”.

      Action - Omitted.

      Comment 24

      Line 31: Please define and distinguish ”rhythm” and ”tempo”. Also see comment above, rhythm and tempo definitions require the use of IOIs.

      We disagree with the reviewer’s claims here. In our research specifically, and for sperm whale research generally, coda inter-click intervals (ICIs) are calculated as the time between the start of the first click and the start of the subsequent click. This makes ICIs identical to inter-onset intervals (IOIs) under all definitions we are aware of. For example, Burchardt and Knornschild [L3] define IOIs as such: “In a sequence of acoustic signals, the time span between the start of an element and the next element, comprising the element duration and the following gap duration”. We now include a sentence making this point.

      Regardless, we disagree on a more fundamental level with the statement that unless researchers quantify inter-onset intervals (IOIs), they cannot make any claims about rhythm. There are many studies that investigate rhythmic aspects of human and animal vocalizations without using IOIs [L4–L7]. If the duration of sound elements of interest is relatively constant (as is the case for sperm whale clicks), then rhythm analyses can still be meaningfully conducted on inter-call intervals (the silent intervals between calls).

      For sperm whales, coda rhythm is defined by the relative ICIs standardized by their total duration. These can be clustered into discrete, defined rhythm types based on characteristic ICI patterns. Coda tempo is relative to the total duration of the coda itself. This can also be clustered into discrete tempo types across all coda durations as well (see [L8]).

      Action - We added a sentence specifying that in this case we can use both ICIs and IOIs because of the standardized length of a single click.

      Comment 25

      Line 36: Are there non-vocalized codas to require the disambiguation here?

      No, we have omitted for clarity.

      Comment 26

      Line 44: ”Higher” than which other social group class?

      Sperm whales live in a multi-level social organization. Clans are a “higher” level of social organization than the social “units” which we define in line 40. Clans are made up of all units which share similar production repertoire of codas.

      Action - We have added ’above social units’ on line 44 to make this clear.

      Comment 27

      Line 47: The use of “symbolic” continues to be enigmatic, even if authors are taking in this classification from other researchers. In signal theory (semiotics), not all biomarkers are necessarily symbols. I advise the authors to avoid the use of the term colloquially and instead adopt the definition used in the research field within which the study falls in.

      There is ample examples of the use of ”symbolic” when referring to markers of in-group membership both in human and non-human cultures.Our choice to use the term “symbolic” is based on a previous study [L9] that found quantitative evidence that sperm whale identity codas function as symbolic markers of cultural identity, at least for Pacific Ocean clans. The full reasoning behind why the authors used the term “symbolic markers” is given in that paper, but briefly, they found evidence that identity coda usage becomes more distinct as clan overlap increases, while non-identity coda usage does not change. This matches theoretical and empirical work on human symbolic markers[L1, L2, L10, L11].

      Action - We retain the use of the term here, as defined in the works cited, and based on its prior usage in the study of both human and non-human cultures.

      Comment 28

      Line 50: This statement is not technically accurate. The use of a signal as a marker by individuals can only be determined by how individuals ”interpret” and react to that signal - e.g., via playback experiments - it cannot be determined by how different populations use and produce the signals.

      We respectfully disagree. While we agree that the optimal situation would be that of playback, the contextual use can provide insight into the functional use of signals; as can expected patterns of use and variation, as was tested in the papers we cite. However, this argument is not the scope nor the synthesis of this paper. These statements are supported by existing published works, as cited, and we encourage the reviewer to take exception with those papers.

      Comment 29

      Line 69: ”Meaningful speech characteristics”??? These terms do not logically or technically follow the previous statement. Why not stay faithful to the results and state that the method used seems to be valid and reliable because it confirms former studies and methods?

      Action - Reworded to better underline the method’s results with previous studies

      Comment 30

      Lines 72-74: This statement doesn’t seem to accurately capture/explain/resume the difference between ID and non-ID codas.

      We are not sure what the reviewer is referring to in this case. The sentence in this case was meant to explain the different relations that ID/non-ID codas have with clan sympatry.

      Comment 31

      Line 75: The information provided in the few previous sentences does not allow the reader to understand why these results support the notion that cultural transmission and social learning occurs between clans.

      We conclude out introduction with a brief summary of our overall findings, which we then use the rest of the manuscript to support these statements.

      Comment 32

      Table 1: So far, the authors refer to their analyses as capturing the ”rhythm” of whale clicks. Consequently, it is not readily clear at this point why the authors rely on ”ICIs” (inter click intervals) instead of the ”universal” measure used across taxa to capture the rhythm of signal sequences - IOIs (inter onset intervals). If ICIs are the same measure as IOIs, why not use the common term, instead of creating a new term name? Alternatively, if ICIs are not equivalent to IOIs, then arguably the analyses do not capture the ”rhythm” of whale clicks, as claimed by the authors. Any rhythmic claim will need to be based on IOI measures. In animal behaviour, stereotyped is primarily used to describe pathological, dysfunctional behaviour. I suggest the use of other adjective, such as ”regular”, ”repetitive”, ”recurring”, ”predictable”. Another deviation from typical terminology: ”usage frequency” -¿ ”production rate”. Why is a clan a ”higher-order” level of social organization? This requires explanation, at least a mention, of what are the ”lower-order” levels. To the non-expert reader, there is a logical circularity/gap here: Clans are said to produce clan-specific codas, and then, it is said that codas are used to delineate clans. Either one deduces, or one infers, but not both. This raises the question, are clans confirmed by any other means than codas?

      We are not creating a “new term name”: inter-click interval (ICI) is the standard terminology used in odontocete (toothed whale) research. We take the reviewer’s point that some readers will not be coming to our paper with that background, however, and now explicitly point out that ICI is synonymous with IOI for sperm whales. Please see our response to your earlier comment for more on this point.

      Comment 33

      Line 92: Unclear term, ”sub-sequence”. Fig. 1B doesn’t seem to readily help disambiguate the meaning of the term.

      In fact reference to Fig. 1B is misplaced as it does not refer to the text. A sub-sequence is simply a contiguous subset of a coda, a subset of it.

      Action - Removed ambiguous reference to Fig. 1B

      Comment 34

      Line 94: How does the use of ”sequence” compare here with ”sub-sequence” above?

      In fact its the same situation although the previous comment highlighted a source of ambiguity.

      Action - Reworded the sentence to be less confusing.

      Comment 35

      Line 95: Signal sequences don’t ”contain” memory, they require memory for processing.

      Action - Rephrased from “sequences contain memory” to “states depend on previous sequences of varying length”.

      Comment 36

      Lines 95-97: The analogy with human language seems forced, combinatorics in any given species are expected to entail different transitions between unit/unit-sequences.

      Thank you for the comment. Indeed, the purpose of the analogy is to illustrate how variable length Markov Chains work (which have been shown to be good at discerning even accents of the same language). We used human language as an analogy to provide the readers’ with a more intuitive understanding of the results.

      Action - Revised paragraph to read: “Despite we do not have direct evidence of unitary blocks in sperm whale communication, on can imagine this effect similarly to what happens with words (e.g., a word beginning with “re” can continue in more ways than one starting with “zy”).”

      Comment 37

      Line 97: Unclear which possibility is this.

      Action - Made the wording clearer.

      Comment 38

      Line 99: Invocation of memory, although common in the use of Markov chains, in inadequate here given that the research did not study how individuals perceived or processed click sequences, only how individual produced click sequences. If the authors are referring to the cognitive load imposed by producing clicks sequences, terms such as ”sequence planning” will be more accurate.

      Here, we use the term “fixed-memory” in relation to the definition of a variable length Markov model. We feel that, in this section of the manuscript, the context is clear that it is a mathematical definition and in no way invokes the biological idea of memory or cognition. It is rather standard to use memory to describe the order of Markov chains. Swapping words in the definition of mathematical objects when the context is clear seems to cause unnecessary ambiguity.

      Action - We clarified this in the manuscript (see comments above).

      Reviewer #3 (Recommendations):

      Comment 39

      Line 16: Add ”broadly defined” as there are many other more restricted definitions (see for example Tomasello 1999; 2009). Tomasello M (1999) The cultural origins of human cognition. Harvard University Press, Cambridge Tomasello M (2009) The question of chimpanzee culture, plus postscript (chimpanzee culture 2009). In: Laland KN, Galef BG (eds) The question of animal culture. Harvard University Press, Cambridge, pp 198-221.

      Thanks for the clarification.

      Action - We added the term “broadly” and added the last reference.

      Comment 40

      Line 22: Is all stable social learned behavior that becomes idiosyncratic and ”distinguishable” considered symbolic markers? If not, consider adding ”potentially.”

      No, but the evolution of cultural groups with differing behavior can reorganize the selective environment in such a way that it can favour an in-group bias that was not initially advantageous to individuals and lead to a preference towards others who share an overt symbolic marker that initially had no meaning and a random frequency in both populations. That is to say, even randomly assigned trivial groups can evolve arbitrary symbolic markers through in-group favouritism once behavioural differences exist even in the absence of any history of rivalry, conflict, or competition between groups. See for example [L1, L2].

      Comment 41

      Table 1: Identity codas are defined as a ”Subset of coda types most frequently used by a sperm whale clan; canonically used to define vocal clans.” Therefore, I infer that an identity coda is not exclusively used by a specific clan and may be utilized by other clans, albeit less frequently. If this is the case, what criteria determine the frequency of usage for a coda to be categorized as an identity or non-identity coda? Does the criteria used to differentiate between ID and non-ID codas reflect the observed differences in micro changes between the two and within clans?

      The methods for this categorization are defined, discussed, and justified in previous work in [L9, L12]. We feel its outside the scope of this paper to review these details here in this manuscript. However, the differences between vocal styles discussed here and the frequency production repertoires which allow for the definition of identity codas are on different scales. The differences between identity and non-identity codas are not the observed differences in vocal style reported here.

      Comment 42

      Table 1: The definition of vocal style states that it ”Encodes the rhythmic variations within codas.” However, if rhythm changes, does the type of coda change as well? Typically, in musical terms, the component that maintains the structure of a rhythm is ”tempo,” not ”rhythm.” How much microvariation is acceptable to maintain the same rhythm, and when do these variations constitute a new rhythm?

      Thank you for raising this important point about the relationship between rhythmic variations and coda categorization. In our definition, ”vocal style” refers to subtle, micro-level variations in the rhythmic structure of codas that do not alter their overarching categorical identity. These microvariations are akin to ”tempo” changes in musical terms, which can modify the expression of a rhythm without fundamentally altering its structure.

      The threshold at which microvariations constitute a new rhythm, and thus a new coda type, remains an open question and is a limitation of current analytical approaches. In our study, we used established classification methods to group codas into types, treating variations within these groups as part of the same rhythm. Future work could refine these thresholds to better distinguish between meaningful rhythmic variation and the emergence of new coda types.

      Comment 43

      Table 1: Change ”say” to ”vocalize” (similarly as used in line 273 for humpback whales ”vocalizations”).

      Thanks.

      Action - Done.

      Comment 44

      Lines 33-35 and Figure 1-C: Can a lay listener discern the microvariations within each coda type by ear? Consider including sound samples of individual rhythmic microvariations for the same coda type pattern (e.g., Four plus, Palindrome, Plus One, Regular) to provide readers/listeners with an impression of their detectability. If authors considered too much or redundant Supplemental material at least give a sound sample for each the 4 subcodas modeled structures examples of 4R2 coda variations depicted in Figure 1-C so the reader can have an acoustic impression of them.

      We do not think that human listeners would be able to all of the variation detected here. However, this does not mean that it is not important variation for the whales. Human observers being able to classify call variation aurally shouldn’t be seen as a bar representing important biological variation for non-human species, given that their hearing and vocal production systems have evolved independently. Importantly, ’Four Plus’,’Palindrome’, etc are names of Clans; sympatric, but socially segregated, communities of whale families, which share a distinct vocal dialect of coda types. These clans each have have distinguishable coda dialects made up of dozens of coda types (and delineated based on identity codas), these are not names/categorical coda types themselves.

      Action - We now provide audio samples of all coda types listed in Figure 1B in the paper’s Github repository.

      Comment 45

      Line 69: As stated above, it may be confusing to refer to it as ”speech.” I suggest adding something like: ”Our method does capture one essential characteristic of human speech: phonology.” Reply 45.—Thank you for drawing our attention to this.

      Action - We removed the word “speech” from the manuscript, using “communication” and/or “vocalization” depending on the context.

      Comment 46

      Line 111-112: Consider adding a sound sample of the variation of the 4R2 coda type that can be vocalized as BCC but also as CBB as supplementary data.

      What the reviewer has correctly observed is that the traditional categorical coda type ’names’ do not capture the variation within a type by rhythm nor by tempo.

      Action - We have added samples of all coda types listed in Figure 1B in the paper’s Github repo.

      Comment 47

      Figure 3: Include a sound sample for each of the 7 coda types in Figure 1B (”specific vocal repertoires”) to illustrate the set of coda types used and their associated usage frequencies, or at least for each of the 7 coda types in Figure 3 and tables S1 and S2.

      Sperm whales in the Eastern Caribbean produce dozens of rhythm types across at least five categorical tempo types [L8, L13]. The coda types represented in Figure 1B do not demonstrate all the variability inherent in the sperm whales’ vocal dialect. Importantly, Figure 3, as well as table S1 and S2, refer to clan-level dialects not specific individual coda types.

      Action - We added sound samples for each coda rhythm type listed in Figure 1B to the Github repository.

      Comment 48

      Lines 184-190: It is unclear what human analogy term is used for ID codas. This needs clarification.

      We are not making an analogy in humans for the role of ID vs non-ID codas, but only providing the example of accents as changes in vocalization (style) without a change in the actual words used (repertoire).

      Action - We tried to make it clearer in the manuscript.

      Comment 49

      Line 190: Change ”whale speech” to ”whale vocalizations.”

      Thanks.

      Action - Done.

      Comment 50

      Figure 4: Correct citation number Hersh ”10” to Hersh ”11.”

      Thanks.

      Action - Fixed the reference.

      Comment 51

      Lines 224-232: Clarify whether the reference to how spatial overlap affects the frequency of ID codas refers to shared ID codas between clans or the production frequency of each coda within the total repertoire of codas.

      The similarity between ID coda repertoires we are referring to there is based on the ID codas of both clans.

      More details on the comparison can be found in [L9].

      Action - We added a sentence explaining the comparison is made using the joint set of ID codas.

      Comment 52

      Lines 240-241: What are non-ID codas vocal cues for?

      Non-ID codas likely serve as flexible, context-dependent signals that facilitate group coordination, convey environmental or social context, and promote social learning, especially in mixed-clan or overlapping habitats. Their variability suggests multifunctional roles shaped by ecological and social pressures.

      Comment 53

      Lines 267-268: It’s unclear whether non-ID coda vocal styles are genetically inherited or not, as argued in lines 257-258.

      We did not intend to argue that non-ID coda vocal styles are genetically inherited. Instead, we aimed to present a hypothetical consideration: if non-ID coda vocal styles were genetically inherited, one would expect a direct correlation between vocal style similarity and genetic relatedness. This hypothetical framework was introduced to strengthen our argument that the observed patterns are unlikely to be explained by genetic inheritance, as such correlations have not been observed. While we acknowledge that we lack definitive proof to rule out genetic influences entirely, the evidence available strongly suggests that social learning, rather than genetic transmission, is the more plausible mechanism.

      Action - Clarified in manuscript.

      Comment 54

      Line 277: Can males mate with females from different clans?

      Yes, genetic evidence shows that males may even switch ocean basins.

      Action - We have clarified that we mean the female members of units from different clans have only rarely been observed to interact at sea between clans.

      Comment 55

      Lines 287-292: Consider discussing the difference between controlled/voluntary and automatic/involuntary imitation and their implications for cultural selection and social learning (see Heyes 2011; 2012). Heyes, C. (2011). Automatic imitation. Psychological bulletin, 137(3), 463. Heyes, C. (2012). What’s social about social learning?. Journal of comparative psychology, 126(2), 193.

      Thank you for your insightful comment regarding this. The distinction between controlled/voluntary and automatic/involuntary imitation, as highlighted by Heyes [L14, L15], provides a potentially valuable framework for interpreting social learning mechanisms in sperm whales. Automatic imitation refers to reflexive, often unconscious mimicry driven by perceptual or motor coupling, while controlled imitation involves deliberate and goal-directed efforts to replicate behaviors. Both forms likely play complementary roles in the cultural transmission observed in sperm whales.

      This dual-process perspective highlights the potential for cultural selection to act at different levels. Automatic imitation may drive convergence in shared environments, promoting acoustic homogeneity and facilitating inter-clan communication. In contrast, controlled imitation ensures the preservation of clan-specific vocal traditions, maintaining cultural diversity. This interplay between automatic and controlled processes could reflect a balancing act between cultural assimilation and differentiation, underscoring the adaptive value of these mechanisms in dynamic social and ecological contexts.

      Action - We have incorporated a short discussion of this distinction and its implications for our findings in the Discussion. Additionally, we have cited [L14, L15] to provide theoretical grounding for this interpretation.

      Comment 56

      Methods: Consider integrating the paragraph from lines 319-321 into lines 28-35 and eliminate redundant information.

      Thanks.

      Action - We implemented the suggestion, removing the first paragraph of the Dataset description and integrating the information when we introduce the concepts of codas and clicks.

      [L1] C. Efferson, R. Lalive, and E. Fehr, Science 321, 1844 (2008).

      [L2] R. McElreath, R. Boyd, and P. Richerson, Curr. Anthropol. 44, 122 (2003).

      [L3] L. S. Burchardt and M. Knornschild, PLoS Computational Biology 16, e1007755 (2020).

      [L4] A. Ravignani and K. de Reus, Evolutionary Bioinformatics 15, 1176934318823558 (2019).

      [L5] C. T. Kello, S. D. Bella, B. Med´ e, and R. Balasubramaniam, Journal of the Royal Society Interface 14, 20170231 (2017).

      [L6] D. Gerhard, Canadian Acoustics 31, 22 (2003).

      [L7] N. Mathevon, C. Casey, C. Reichmuth, and I. Charrier, Current Biology 27, 2352 (2017).

      [L8] P. Sharma, S. Gero, R. Payne, D. F. Gruber, D. Rus, A. Torralba, and J. Andreas, Nature Communications 15, 3617 (2024).

      [L9] T. A. Hersh, S. Gero, L. Rendell, M. Cantor, L. Weilgart, M. Amano, S. M. Dawson, E. Slooten, C. M. Johnson, I. Kerr, et al., Proc. Natl. Acad. Sci. 119, e2201692119 (2022).

      [L10] R. Boyd and P. J. Richerson, Cult Anthropol 2, 65 (1987). [L11] E. Cohen, Curr. Anthropol. 53, 588 (2012).

      [L12] T. A. Hersh, S. Gero, L. Rendell, and H. Whitehead, Methods Ecol. Evol. 12, 1668 (2021), ISSN 2041-210X, 2041-210X.

      [L13] S. Gero, A. Bøttcher, H. Whitehead, and P. T. Madsen, R. Soc. Open Sci. 3, 160061 (2016).

      [L14] C. Heyes, Psychological Bulletin 137, 463 (2011).

      [L15] C. Heyes, Journal of Comparative Psychology 126, 193 (2012).

    1. Author response:

      The following is the authors’ response to the original reviews.

      Reviewer #1 (Public review):

      Summary:

      Lejeune et al. demonstrated sex-dependent differences in the susceptibility to MRSA infection. The authors demonstrated the role of the microbiota and sex hormones as potential determinants of susceptibility. Moreover, the authors showed that Th17 cells and neutrophils contribute to sex hormone-dependent protection in female mice.

      Strengths:

      The role of microbiota was examined in various models (gnotobiotic, co-housing, microbiota transplantation). The identification of responsible immune cells was achieved using several genetic knockouts and cell-specific depletion models. The involvement of sex hormones was clarified using ovariectomy and the FCG model.

      Weaknesses:

      The mechanisms by which specific microbiota confer female-specific protection remain unclear.

      We thank the reviewer for highlighting the strengths of the manuscript including the models and techniques we employ. We agree that the relationship between the microbiota and sex-dependent protection is less developed compared with other aspects of the study. As detailed below, we are attempting to identify specific microbes that confer femalespecific protection and links with sex hormones. We have promising but preliminary results. Thus, in our revised manuscript, we added new data on the host response as suggested by the detailed comments from the Reviewers. We also elaborate on the potential role of the microbiota in the discussion section.

      Reviewer #1 (Recommendations for the authors):

      (1) The authors nicely showed that the transfer of the protective phenotype by FMT requires the female sex in recipients (Figure 2E). However, it remains unclear whether the female sex is required to develop protective microbiota in donor mice, as only the female NYU donor-male Jax recipient combination was tested. What happens if the microbiota from male NYU mice is transplanted into female Jax mice? If sex hormones act only on the downstream of the microbiota, such mice would show the protective phenotype. However, if sex hormones are required to establish a protective microbiota, the transplantation of microbiota from male NYU mice will not confer protection in recipient female Jax mice.

      The Reviewer’s comment is well taken. We have not conducted the suggested experiment of FMT from male NYU mice to JAX female mice yet because we are pursuing an in vitro approach that we hope will eventually provide a more definitive answer. We observed that stool from female NYU mice and not JAX mice inhibits MRSA when cultured under anaerobic conditions, and this inhibitory activity is eliminated by filtration (Author response image 1A). We also observed that stool from male NYU mice inhibits MRSA growth to a similar extent as stool from female NYU mice (Author response image 1B). This result suggests that the protective role of sex hormones is downstream of the microbiota. We are in the process of identifying the specific microbiota member to support this conclusion.

      Author response image 1.

      Stool from NYU mice inhibits MRSA growth in vitro. (A) MRSA CFU/mL in media (TSB) following culture with unfiltered or filtered stool homogenate from female NYU or JAX mice. Stool homogenate or TSB alone was added in a 1:1 ratio to 1x10⁶ CFU/mL MRSA and cultured anaerobically for up to 24 hours. (B) MRSA CFU/mL in TSB following culture with unfiltered stool homogenate from NYU male or female mice. Stool homogenate or TSB alone was added in a 1:1 ratio to 1x10⁶ CFU/mL MRSA. 3 experimental replicates performed; stool taken from 6 individual mice per condition. Mean MRSA burden ± SEM. Area under the curve analysis + One way ANOVA with Sidak’s multiple comparisons test. ns: not significant.

      (2) The results clearly showed the involvement of the specific microbiota in NYU mice in the sex-dependent bias in susceptibility to MRSA. However, the mechanisms by which specific microbiota promotes female sex-mediated protection need to be better described. Is this simply attributed to the different Th17 cell numbers in NYU and Jax mice (i.e., increased commensalspecific Th17 cells in NYU like Taconic mice)? Or is it possible that NYU microbiota impacts the regulation of sex hormones or their downstream signaling? What about the level of sex hormones in NYU and Jax mice? Are these levels equivalent or different? Do NYU and Jax microbiotas regulate the expression of sex hormone receptors in immune cells differently?

      These are great questions. We do not observe baseline differences in Th17 cells like JAX versus Taconic mice (Figure 5B), suggesting that the mechanism is different. However, it is quite possible that an antigen-specific T cells, or Th17 cell specifically, is present at low levels and expands rapidly upon MRSA colonization. We have added this possibility to the discussion in the revised manuscript. To address the Reviewer’s question about the effect of the microbiota on sex hormones, we first sought to determine which sex hormone is necessary. Using estrogen receptor knockouts (Esr1<sup>-/-</sup>), we were able to implicate estrogen and have added this important finding to the manuscript (Fig 6C). Then, we measured levels of estradiol in stool samples but did not observe a difference between NYU and JAX female mice (Author response image 2). We provide the results below but did not add it to the revised manuscript because we found it difficult to draw a conclusion without more extensive profiling as well as quantification of the receptor on specific immune cell subsets and cell-type specific knockouts. Also, see our response to Reviewer #3 regarding receptor expression. Although we have yet to explain the role of the microbiota, we hope the Reviewer agrees that we have promising yet preliminary results and that the new experiments we added to the manuscript have further strengthened the mechanism on the host-side. 

      Author response image 2.

      Estradiol levels in stool samples prior to MRSA inoculation. (A) Estradiol levels in stool samples collected prior to MRSA inoculation in male and female mice bred at NYU or purchased from Jackson Labs. Frozen stool samples were normalized by weight and processed using the DetectX® Estradiol ELISA Kit (Arbor Assays).

      (3) The authors claimed that Th17-mediated recruitment of neutrophils likely promotes the clearance of MRSA in female NYU mice. However, the experimental evidence supporting this claim could be stronger. The authors should show the neutrophil recruitment in the gut mucosa in female and male NYU mice. Also, the levels of neutrophils between NYU and Jax female mice should be examined. To further strengthen the link between Th17 and neutrophils, it would be ideal to analyze neutrophil recruitment in mice lacking Th17 cells (i.e., Rag2-/-, anti-CD4 treated, Rorgt-/- mice).

      We agree and now include a more detailed analyses of neutrophils. We found that the number of neutrophils in the intestine were not higher in NYU female mice compared with NYU male mice, with or without MRSA. Instead, we show that neutrophils in NYU female mice display higher levels of surface CD11b, a sign of activation, compared to males following inoculation with MRSA . We have added these findings to the revised manuscript (Fig5 H and I). IL-17 can activate neutrophils and increase their antimicrobial activity. Consistent with this possibility, we now show that female mice lacking the IL-17 receptor lose the enhanced colonization resistance. Based on these findings, we have modified this aspect of the conclusion, and thank the reviewer for the helpful suggestion.

      Reviewer #2 (Public review):

      The current study by Lejeune et al. investigates factors that allow for persistent MRSA infection in the GI tract. They developed an intriguing model of intestinal MRSA infection that does not use the traditional antibiotic approach, thereby allowing for a more natural infection that includes the normal intestinal microbiota. This model is more akin to what might be expected to be observed in a healthy human host. They find that biological sex plays a clear role in bacterial persistence during infection but only in mice bred at an NYU Facility and not those acquired from Jackson Labs. This clearly indicates a role for the intestinal microbiome in affecting female bacterial persistence but not male persistence which was unaffected by the origin of the mice and thus the microbiome. Through a series of clever microbiome-specific transfer experiments, they determine that the NYU-specific microbiome plays a role in this sexual dimorphism but is not solely responsible. Additional experiments indicate that Th17 cells, estrogen, and neutrophils also participate in the resistance to persistent infection. Notably, they assess the role of sex chromosomes (X/Y) using the established four core genotype model and find that these chromosomes appear to play little role in bacterial persistence.

      Overall, the paper nicely adds to the growing body of literature investigating how biological sex impacts the immune system and the burden of infectious disease. The conclusions are mostly supported by the data although there are some aspects of the data that could be better addressed and clarified.

      We thank the Reviewer for appreciating our contribution and these supportive comments. We have added several experiments to fill-in gaps and text revisions to increase clarity and acknowledge limitations. 

      (1) There is something of a disconnect between the initial microbiome data and the later data that analyzes sex hormones and chromosomes. While there are clearly differences in microbial species across the two sites (NYU and JAX) how these bacterial species might directly interact with immune cells to induce female-specific responses is left unexplored. At the very least it would help to try and link these two distinct pieces of data to try and inform the reader how the microbiome is regulating the sex-specific response. Indeed, the reader is left with no clear exploration of the microbiota's role in the persistence of the infection and thus is left wanting.

      We agree. This comment is similar to Reviewer #1’s feedback. As mentioned above, we are attempting to clarify the association between sex differences and the microbiota and have included preliminary results for the Reviewers. However, addressing this disconnect will require substantially more investigation. Instead, we have added insightful new data that elaborate on aspects of the host response.  We hope the Reviewer agrees that revised manuscript is stronger and that further delineation of the microbiota can be addressed by future studies.

      (2) While the authors make a reasonable case that Th17 T cells are important for controlling infection (using RORgt knockout mice that cannot produce Th17 cells), it is not clear how these cells even arise during infection since the authors make most of the observations 2 days postinfection which is longer before a normal adaptive immune response would be expected to arise. The authors acknowledge this, but their explanation is incomplete. The increase in Th17 cells they observe is predicated on mitogenic stimulation, so they are not specific (at least in this study) for MRSA. It would be helpful to see a specific restimulation of these cells with MRSA antigens to determine if there are pre-existing, cross-reactive Th17 cells specific for MRSA and microbiota species which could then link these two as mentioned above.

      We acknowledge that this is a limitation of our study. Although an experiment demonstrating pre-existing, cross-reactive T cells would help support our conclusion, aspects of MRSA biology may make the results of this experiment difficult to interpret. We have consulted with an expert on MRSA virulence factors, co-lead author Dr. Victor Torres, about the feasibility of this experiment. MRSA possess superantigens, such as Staphylococcal enterotoxin B, which bind directly to specific Vβ regions of T-cell receptors (TCR) and major histocompatibility complex (MHC) class II on antigen-presenting cells, resulting in hyperactivation of T lymphocytes and monocytes/macrophages. Additionally, other MRSA virulence factors, such as α-hemolysin and LukED, induce cell death of lymphocytes. MRSA’s enterotoxins are heat stable, so heat-inactivation of the bacterium may not help in this matter.  For these reasons, it is unlikely that we can perform a simple restimulation of lymphocytes with MRSA antigens. 

      A study by Shao et al. provides an example of a host commensal species inducing Th17 cells with cross-reactivity against MRSA. Upon intestinal colonization, the intestinal fungus Candida albicans influences T cell polarization towards a Th17 phenotype in the spleen and peripheral lymph nodes which provided protection to the host against systemic candidemia. Interestingly, this induction of protective Th17 cells, increased IL-17 and responsiveness in circulating Ly6G+ neutrophils also protected mice from intravenous infection with MRSA, indicating that T cell activation and polarization by intestinal C. albicans leads to non-specific protective responses against extracellular pathogens.

      Shao TY, Ang WXG, Jiang TT, Huang FS, Andersen H, Kinder JM, Pham G, Burg AR, Ruff B, Gonzalez T, Khurana Hershey GK, Haslam DB, Way SS. Commensal Candida albicans Positively Calibrates Systemic Th17 Immunological Responses. Cell Host & Microbe. 2019 Mar 13;25(3):404-417.e6. doi: 10.1016/j.chom.2019.02.004. PMID: 30870622; PMCID: PMC6419754.

      We have added a brief version of the above discussion in the revised manuscript. Also, as mentioned earlier, we have added new data strengthening the axis between Th17 and neutrophils, including showing that IL-17 receptor is necessary and that neutrophils display signs of heightened activation in female mice during MRSA colonization.   

      (3) The ovariectomy experiment demonstrates a role for ovarian hormones; however, it lacks a control of adding back ovarian hormones (or at least estrogen) so it is not entirely obvious what is causing the persistence in this experiment. This is especially important considering the experiments demonstrating no role for sex chromosomes thus demonstrating that hormonal effects are highly important. Here it leaves the reader without a conclusive outcome as to the exact hormonal mechanism.

      This is a great suggestion. Rather than adding back ovarian hormones, we performed the more direct experiment and tested whether the estrogen receptor (ERα, encoded by Esr1) is necessary for the enhanced colonization resistance. Indeed, we observed that Esr1<sup>-/-</sup> female mice have increased MRSA burden compared to Esr1<sup>+/-</sup> littermates. We have added this new result (Figure 6C) and thank the Reviewer for their guidance. 

      4) The discussion is underdeveloped and is mostly a rehash of the results. It would greatly enhance the manuscript if the authors would more carefully place the results in the context of the current state of the field including a more enhanced discussion of the role of estrogen, microbiome, and T cells and how the field might predict these all interact and how they might be interacting in the current study as well.

      Author response: We thank the Reviewer for their feedback in improving the scholarship on the manuscript. We have expanded on the literature and the mechanistic model in both the discussion section and other parts to provide better context for our findings. 

      Reviewer #3 (Public review):

      Summary:

      Using a mouse model of Staphylococcus aureus gut colonization, Lejeune et al. demonstrate that the microbiome, immune system, and sex are important contributing factors for whether this important human pathogen persists in the gut. The work begins by describing differential gut clearance of S. aureus in female B6 mice bred at NYU compared to those from Jackson Laboratories (JAX). NYU female mice cleared S. aureus from the gut but NYU male mice and mice of both sexes from JAX exhibited persistent gut colonization. Further experimentation demonstrated that differences between staphylococcal gut clearance in NYU and JAX female mice were attributed to the microbiome. However, NYU male and female mice harbor similar microbiomes, supporting the conclusion that the microbiome cannot account for the observed sex-dependent clearance of S. aureus gut colonization. To identify factors responsible for female clearance of S. aureus, the authors performed RNAseq on intestinal epithelial cells and cells enriched within the lamina propria. This analysis revealed sexdependent transcriptional responses in both tissues. Genes associated with immune cell function and migration were distinctly expressed between the sexes. To determine which immune cell types contribute to S. aureus clearance Lejeune et al employed genetic and antibody-mediated immune cell depletion. This experiment demonstrated that CD4+ IL17+ cells and neutrophils promote the elimination of S. aureus from the gut. Subsequent experiments, including the use of the 'four core genotype model' were conducted to discern between the roles of sex chromosomes and sex hormones. This work demonstrated that sex-chromosome-linked genes are not responsible for clearance, increasing the likelihood that hormones play a dominant role in controlling S. aureus gut colonization.

      Strengths:

      A strength of the work is the rigorous experimental design. Appropriate controls were executed and, in most cases, multiple approaches were conducted to strengthen the authors' conclusions. The conclusions are supported by the data.

      The following suggestions are offered to improve an already strong piece of scholarship.

      Weaknesses:

      The correlation between female sex hormones and the elimination of S. aureus from the gut could be further validated by quantifying sex hormones produced in the four core genotype mice in response to colonization. Additionally, and this may not be feasible, but according to the proposed model administering female sex hormones to male mice should decrease colonization. Finally, knowing whether the quantity of IL-17a CD4+ cells change in the OVX mice has the potential to discern whether abundance/migration of the cells or their activation is promoted by female sex hormones.

      In the Discussion, the authors highlight previous work establishing a link between immune cells and sex hormone receptors, but whether the estrogen (and progesterone) receptor is differentially expressed in response to S. aureus colonization could be assessed in the RNAseq dataset. Differential expression of known X and Y chromosome-linked genes were discussed but specific sex hormones or sex hormone receptors, like the estrogen receptor, were not. This potential result could be highlighted.

      We appreciate the comment on the scholarship and thank the Reviewer for the insightful suggestions to improve this manuscript. We apologize for not including references that address some of the Reviewer’s questions. Other research groups have compared the levels of hormones between XX and XY males and females in the four core genotypes model and have found similar levels of circulating testosterone in adult XX and XY males. No difference was found in circulating estradiol levels in XX vs XY- females when tested at 4-6 or 79 months of age. 

      Karen M. Palaszynski, Deborah L. Smith, Shana Kamrava, Paul S. Burgoyne, Arthur P. Arnold, Rhonda R. Voskuhl, A Yin-Yang Effect between Sex Chromosome Complement and Sex Hormones on the Immune Response. Endocrinology, Volume 146, Issue 8, 1 August 2005, Pages 3280–3285, https://doi.org/10.1210/en.2005-0284

      Sasidhar MV, Itoh N, Gold SM, Lawson GW, Voskuhl RR. The XX sex chromosome complement in mice is associated with increased spontaneous lupus compared with XY. Ann Rheum Dis. 2012 Aug;71(8):1418-22. doi: 10.1136/annrheumdis-2011-201246. Epub 2012 May 12. PMID: 22580585; PMCID: PMC4452281.

      Administering female sex hormones to males is a good idea. We did not observe an effect of injecting males with estrogen on MRSA colonization (data not shown), perhaps due to the dose or timing, or because it is not sufficient (i.e., additional hormones and factors may be required). Therefore, we analyzed the necessity of estrogen signaling and found that Esr1<sup>-/-</sup> female mice impairs colonization resistance to MRSA. We have added this new experiment to the revised manuscript (Fig6 C).

      Examination of the levels of estrogen, progesterone, and androgen receptors in our cecalcolonic lamina propria RNA-seq dataset is an excellent idea. We observed a significant increase in the G-protein coupled estrogen receptor 1 (Gper1) and a non-significant increase in Estrogen receptor alpha (Esr1) following MRSA inoculation in the immune cell compartment. This analysis has been added to the revised manuscript (Supplemental Fig6).

      Reviewer #3 (Recommendations for the authors)

      Minor editing issues:

      The topic sentence of the last paragraph in the Results section states - 'male sex defining gene sex determining region Y (Sry) has been moved from the Y chromosome to an autosome'. 'Sex defining gene' and sex-determining region seems redundant in this context. A sex-defining gene would presumably be located within a sex-determining region.

      Bold the letter 'F' in the Figure 5 legend.

      It's not clear from the Figure 6E legend when the IL-17A+ CD4+ cells were quantified, 2 dpi?

      In the third sentence of the second paragraph of the Discussion, the two references are merged together.

      We thank the Reviewer for pointing out these editing issues. They have been addressed in the revised manuscript.

    1. Author response:

      The following is the authors’ response to the original reviews.

      Reviewer #1 (Public review):

      Summary:

      The manuscript by Cao et al. examines an important but understudied question of how chronic exposure to heat drives changes in affective and social behaviors. It has long been known that temperature can be a potent driver of behaviors and can lead to anxiety and aggression. However, the neural circuitry that mediates these changes is not known. Cao et al. take on this question by integrating optical tools of systems neuroscience to record and manipulate bulk activity in neural circuits, in combination with a creative battery of behavior assays. They demonstrate that chronic daily exposure to heat leads to changes in anxiety, locomotion, social approach, and aggression. They identify a circuit from the preoptic area (POA) to the posterior paraventricular thalamus (pPVT) in mediating these behavior changes. The POA-PVT circuit increases activity during heat exposure. Further, manipulation of this circuit can drive affective and social behavioral phenotypes even in the absence of heat exposure. Moreover, silencing this circuit during heat exposure prevents the development of negative phenotypes. Overall the manuscript makes an important contribution to the understudied area of how ambient temperature shapes motivated behaviors.

      Strengths:

      The use of state-of-the-art systems neuroscience tools (in vivo optogenetics and fiber photometry, slice electrophysiology), chronic temperature-controlled experiments, and a rigorous battery of behavioral assays to determine affective phenotypes. The optogenetic gain of function of affective phenotypes in the absence of heat, and loss of function in the presence of heat are very convincing manipulation data. Overall a significant contribution to the circuit-level instantiation of temperature-induced changes in motivated behavior, and creative experiments.

      Weaknesses:

      (1) There is no quantification of cFos/rabies overlap shown in Figure 2, and no report of whether the POA-PVT circuit has a higher percentage of Fos+ cells than the general POA population. Similarly, there is no quantification of cFos in POA recipient PVT cells for Figure 2 Supplement 2.

      Thanks for the comment. The quantification results of c-Fos signal have been provided in the main text and figures.  

      (2) The authors do not address whether stimulation of POA-PVT also increases core body temperature in Figure 3 or its relevant supplements. This seems like an important phenotype to make note of and could be addressed with a thermal camera or telemetry.

      Thanks for raising this point. We did indeed monitor the core body temperature during stimulation of POA-PVT pathway, but we did not observe any significant changes. We have included this finding in the revised manuscript.

      (3) In Figure 3G: is Day 1 vs Day 22 "pre-heat" significant? The statistics are not shown, but this would be the most conclusive comparison to show that POA-PVT cells develop persistent activity after chronic heat exposure, which is one of the main claims the authors make in the text. This analysis is necessary in order to make the claim of persistent circuit activity after chronic heat exposure.

      Figure 3G does compare the Day 1 preheat to Day22 preheat, and the difference was significant. The wording has been corrected to avoid confusion. Also, we have modified Figure 3D to 3H in our revised manuscript to improve the clarity of these plots.

      (4) In Figure 4, the control virus (AAV1-EYFP) is a different serotype and reporter than the ChR2 virus (AAV9-ChR2-mCherry). This discrepancy could lead to somewhat different baseline behaviors.

      Thanks for bringing out this issue. We acknowledge that using AA1-EGFP (a different serotype and reporter compared to the AAV9-ChR2-mCherry) as our control virus is not ideal. But based on our own prior experiments, we observed no significant differences in baseline behaviors between animals injected with AAV1 and AAV9 EYFP as well as control mice without virus injection. Therefore, we believe that the baseline behaviors of the animals were unaffected.

      (5) In Figure 5G, N for the photometry data: the authors assess the maximum z-score as a measure of the strength of calcium response, however the area under the curve (AUC) is a more robust and useful readout than the maximum z score for this. Maximum z-score can simply identify brief peaks in amplitude, but the overall area under the curve seems quite similar, especially for Figure 5N.

      Thanks for the comment. We agree with the reviewer that the area under the curve (AUC) is an alternative readout for measurement of the strength of calcium response. However, the reason why we chose the maximum z-score is based on the observation that we found POA recipient pPVT neurons after chronic heat treatment exhibited a higher calcium peak corresponding to certain behavioral performances when compared to pre-heat conditions. We thus applied the maximum z-score as a representative way to describe the neuronal activity changes of mice during certain behaviors before and after chronic heat treatment. The other consideration is that we want to reflect that POA recipient pPVT neurons become more sensitive and easier to be activated after chronic heat exposure under the same stressful situations compared to control mice. The maximum z score represented by peak in combination with particular behavioral performances is considered more suitable to highlight our findings in this study.

      (6) For Fig 5V: the authors run the statistics on behavior bouts pooled from many animals, but it is better to do this analysis as an animal average, not by compiling bouts. Compiling bouts over-inflates the power and can yield significant p values that would not exist if the analysis were carried out with each animal as an n of 1.

      Thanks for the comment and suggestion. We had tried both methods and the statistical results were similar. As suggested, we have updated Fig 5V, as well as Fig. 5H and 5O by comparing animal average in our revised manuscript.

      (7) In general this is an excellent analysis of circuit function but leaves out the question of whether there may be other inputs to pPVT that also mediate the same behavioral effect. Future experiments that use activity-dependent Fos-TRAP labeling in combination with rabies can identify other inputs to heat-sensitive pPVT cells, which may have convergent or divergent functions compared to the POA inputs.

      Thanks for the valuable suggestion, which would enhance the conclusion. We will consider adopting this approach in future investigations into this question.

      Reviewer #2 (Public review):

      Summary

      The study by Cao et al. highlights an interesting and important aspect of heat- and thermal biology: the effect of repetitive, long-term heat exposure and its impact on brain function.

      Even though peripheral, sensory temperature sensors and afferent neuronal pathways conveying acute temperature information to the CNS have been well established, it is largely unknown how persistent, long-term temperature stimuli interact with and shape CNS function, and how these thermally-induced CNS alterations modulate efferent pathways to change physiology and behavior. This study is therefore not only novel but, given global warming, also timely.

      The authors provide compelling evidence that neurons of the paraventricular thalamus change plastically over three weeks of episodic heat stimulation and they convincingly show that these changes affect behavioral outputs such as social interactions, and anxiety-related behaviors.

      Strengths

      (1) It is impressive that the assessed behaviors can be (i) recruited by optogenetic fiber activation and (ii) inhibited by optogenetic fiber inhibition when mice are exposed to heat. Technically, when/how long is the fiber inhibition performed? It says in the text "3 min on and 3 min off". Is this only during the 20-minute heat stimulation or also at other times?

      Thanks for pointing out the need for clarification. Our optogenetic inhibition had been conducted for 21 days during the heat exposure period (90 mins) for each mouse. And to avoid the light-induced heating effect, we applied the cyclical mode of 3 minutes’ light on and 3 minutes’ light off only during the process of heat exposure but not other time. The detailed description has been supplemented in the Method part of our revised manuscript.

      (2) It is interesting that the frequency of activity in pPVT neurons, as assessed by fiber photometry, stays increased after long-term heat exposure (day 22) when mice are back at normal room temperature. This appears similar to a previous study that found long-term heat exposure to transform POA neurons plastically to become tonically active (https://www.biorxiv.org/content/10.1101/2024.08.06.606929v1). Interestingly, the POA neurons that become tonically active by persistent heat exposure described in the above study are largely excitatory, and thus these could drive the activity of the pPVT neurons analyzed in this study.

      Thanks for pointing out this study that suggests similar plasticity of POA neurons under long-term heat exposure serving a different purpose. We have included this information in our discussion as well.  

      (3) How can it be reconciled that the majority of the inputs from the POA are found to be largely inhibitory (Fig. 2H)? Is it possible that this result stems from the fact that non-selective POA-to-pPVT projections are labelled by the approach used in this study and not only those pathways activated by heat? These points would be nice to discuss.

      Thanks for raising these important questions. Although it is not our primary focus, we are aware of the substantial inhibitory inputs from POA to pPVT which suggests an important function. However, we do not think that this pathway, which would exert an opposite effect on POA-recipient pPVT neurons compared to the excitatory input, contributes to the long-term effect of chronic heat exposure. This is due to the increased, rather than decreased, excitability of the neurons. There is a possibility that this inhibitory input serves as a short-term inhibitory control for other purpose. Further work is needed to fully address this question.

      (4) It is very interesting that no LTP can be induced after chronic heat exposure (Figures K-M); the authors suggest that "the pathway in these mice were already saturated" (line 375). Could this hypothesis be tested in slices by employing a protocol to extinguish pre-existing (chronic heat exposure-induced) LTP? This would provide further strength to the findings/suggestion that an important synaptic plasticity mechanism is at play that conveys behavioral changes upon chronic heat stimulation.

      We agree with the reviewer that the results of the suggested experiment would further strengthen our hypothesis. We will try to confirm this in future studies.

      (5) It is interesting that long-term heat does not increase parameters associated with depression (Figure 1N-Q), how is it with acute heat stress, are those depression parameters increased acutely? It would be interesting to learn if "depression indicators" increase acutely but then adapt (as a consequence of heat acclimation) or if they are not changed at all and are also low during acute heat exposure.

      Based on our observations, we did not find increased depression parameters after acute heat stress in our experiments (data not shown), which was consistent with other two previous studies (Beas et al., 2018; Zhang et al., 2021). It appears that acute heat stress is more associated with anxiety-like behavior and may not be sufficient to induce depression-like phenotypes in rodents, aligning with our observation during experiments.

      Beas BS, Wright BJ, Skirzewski M, Leng Y, Hyun JH, Koita O, Ringelberg N, Kwon HB, Buonanno A, Penzo MA (2018) The locus coeruleus drives disinhibition in the midline thalamus via a dopaminergic mechanism Nat Neurosci 21:963-973.

      Zhang GW, Shen L, Tao C, Jung AH, Peng B, Li Z, Zhang LI, Whit Tao HZ (2021) Medial preoptic area antagonistically mediates stress-induced anxiety and parental behavior Nat Neurosci 24:516-528.

      Weaknesses/suggestions for improvement.

      (1) The introduction and general tenet of the study is, to us, a bit too one-sided/biased: generally, repetitive heat exposure --heat acclimation-- paradigms are known to not only be detrimental to animals and humans but also convey beneficial effects in allowing the animals and humans to gain heat tolerance (by strengthening the cardiovascular system, reducing energy metabolism and weight, etc.).

      Thanks for the suggestion. We have modified the introduction in our revised manuscript to make it more balanced.

      (2) The point is well taken that these authors here want to correlate their model (90 minutes of heat exposure per day) to heat waves. Nevertheless, and to more fully appreciate the entire biology of repetitive/chronic/persistent heat exposure (heat acclimation), it would be helpful to the general readership if the authors would also include these other aspects in their introduction (and/or discussion) and compare their 90-minute heat exposure paradigm to other heat acclimation paradigms. For example, many past studies (using mice or rats)m have used more subtle temperatures but permanently (and not only for 90 minutes) stimulated them over several days and weeks (for example see PMID: 35413138). This can have several beneficial effects related to cardiovascular fitness, energy metabolism, and other aspects. In this regard: 38{degree sign}C used in this study is a very high temperature for mice, in particular when they are placed there without acclimating slowly to this temperature but are directly placed there from normal ambient temperatures (22{degree sign}C-24{degree sign}C) which is cold/coolish for mice. Since the accuracy of temperature measurement is given as +/- 2{degree sign}C, it could also be 40{degree sign}C -- this temperature, 40{degree sign}C, non-heat acclimated C57bl/6 mice will not survive for long.

      The authors could consider discussing that this very strong, short episodic heat-stress model used here in this study may emphasize detrimental effects of heat, while more subtle long-term persistent exposure may be able to make animals adapt to heat, become more tolerant, and perhaps even prevent the detrimental cognitive effects observed in this study (which would be interesting to assess in a follow-up study).

      Thanks for pointing out the important aspect regarding the different heat exposure paradigms and their potential impacts. We have incorporated these points into both the Introduction and Discussion sections of the revised manuscript.

      (3) Line 140: It would help to be clear in the text that the behaviors are measured 1 day after the acute heat exposure - this is mentioned in the legend to the figure, but we believe it is important to stress this point also in the text. Similarly, this is also relevant for chronic heat stimulation: it needs to be made very clear that the behavior is measured 1 day after the last heat stimulus. If the behaviors had been measured during the heat stimulus, the results would likely be very different.

      Thanks for the suggestion, and we have clarified the procedure in the revised manuscript.

      (4) Figure 2 D and Figure 2- Figure Supplement 1: since there is quite some baseline cFos activity in the pPVT region we believe it is important to include some control (room temperature) mice with anterograde labelling; in our view, it is difficult/not possible to conclude, based on Fig 2 supplement 2C, that nearly 100% of the cfos positive cells are contacted by POA fibre terminals (line 168). By eye there are several green cells that don't have any red label on (or next to) them; additionally, even if there is a little bit of red signal next to a green cell: this is not definitive proof that this is a synaptic contact. It is therefore advisable to revisit the quantification and also revisit the interpretation/wording about synaptic contacts.

      In relation to the above: Figure 2h suggests that all neurons are connected (the majority receiving inhibitory inputs), is this really the case, is there not a single neuron out of the 63 recorded pPVT neurons that does not receive direct synaptic input from the POA?

      Thanks for the comments. For Figure 2-figure supplement 1, the baseline c-Fos activity in pPVT were indeed measured from mouse under room temperature. Observed activity may be attributed to the diverse functions that the pPVT is responsible for. Compared to the heat-exposed group, we observed significant increases in c-Fos signals, suggesting the effect of heat exposure.

      For Figure 2-figure supplement 2, through targeted injection of AAV1-Cre into the POA, we achieved selective expression of Cre-dependent ChR2-mCherry in pPVT neurons receiving POA inputs. Following heat exposure, we observed substantial colocalization between heat-induced c-Fos expression (green signal) and ChR2-mCherry-labeled neurons (red signal) in the pPVT. This extensive overlap indicates that POA-recipient pPVT neurons are predominantly heat-responsive and likely mediate the behavioral alterations induced by chronic heat exposure. We have validated these signals and included updated quantification in our revised manuscript.

      For Fig 2H, we specifically patched those neurons that were surrounded by red fluorescence under the microscope, ensuring that the patched neurons had a high likelihood of being innervated from POA. This is why all 63 recorded pPVT neurons were found to receive direct synaptic input from the POA.

      (5) It would be nice to characterize the POA population that connects to the pPVT, it is possible/likely that not only warm-responsive POA neurons connect to that region but also others. The current POA-to-pPVT optogenetic fibre stimulations (Figure 4) are not selective for preoptic warm responsive neurons; since the POA subserves many different functions, this optogenetic strategy will likely activate other pathways. The referees acknowledge that molecular analysis of the POA population would be a major undertaking. Instead, this could be acknowledged in the discussion, for example in a section like "limitation of this study".

      Thanks for the suggestion. We have supplemented this part in our revised manuscript.

      (6) Figure 3a the strategy to express Gcamp in a Cre-dependent manner: it seems that the Gcamp8f signal would be polluted by EGFP (coming from the Cre virus injected into the POA): The excitation peak for both is close to 490nm and emission spectra/peaks of GCaMP8f (510-520 nm) and EGFP (507-510 nm) are also highly overlapping. We presume that the high background (EGFP) fluorescence signal would preclude sensitive calcium detection via Gcamp8f, how did the authors tackle this problem?

      Thank you for pointing out this issue. We acknowledge that we included AAV1-EGFP when recording the GCaMP8F signal to assist in the post-verification of the accuracy of the injection site. But we also collected recording data from mice with AAV1-Cre without EGFP injected into POA and Cre-dependent GCaMP8F in pPVT, albert in a smaller number. We did not observe any obvious differences in the change in calcium signal between these two virus strategies, suggesting that the sensitivity of the GCaMP signals was not significantly affected by the increased baseline fluorescence due to EGFP.

      (7) How did the authors perform the social interaction test (Figures 1F, G)? Was the intruder mouse male or female? If it was a male mouse would the interaction with the female mouse be a form of mating behavior? If so, the interpretation of the results (Figures 1F, G) could be "episodic heat exposure over the course of 3 weeks reduces mating behavior".

      Thanks for the comment. For this female encounter test, we strictly followed the protocol by Ago Y, et al., (2015). During this test, both the strange male and female mice were placed into a wired cup (which is made up of mental wire entanglement and the size for each hole is 0.5 cm [L] x 0.5 cm [W]), which successfully prevented large body contact and the mating behavior but only innate sex-motivated moving around the cup. We have supplemented the details in the method part of our revised manuscript.

      Ago Y, Hasebe S, Nishiyama S, Oka S, Onaka Y, Hashimoto H, Takuma K, Matsuda T (2015) The Female Encounter Test: A Novel Method for Evaluating Reward-Seeking Behavior or Motivation in Mice Int J Neuropsychopharmacol 18: pyv062.

      Reviewer #3 (Public review):

      In this study, Cao et al. explore the neural mechanisms by which chronic heat exposure induces negative valence and hyperarousal in mice, focusing on the role of the posterior paraventricular nucleus (pPVT) neurons that receive projections from the preoptic area (POA). The authors show that chronic heat exposure leads to heightened activity of the POA projection-receiving pPVT neurons, potentially contributing to behavioral changes such as increased anxiety level and reduced sociability, along with heightened startle responses. In addition, using electrophysiological methods, the authors suggest that increased membrane excitability of pPVT neurons may underlie these behavioral changes. The use of a variety of behavioral assays enhances the robustness of their claim. Moreover, while previous research on thermoregulation has predominantly focused on physiological responses to thermal stress, this study adds a unique and valuable perspective by exploring how thermal stress impacts affective states and behaviors, thereby broadening the field of thermoregulation. However, a few points warrant further consideration to enhance the clarity and impact of the findings.

      (1) The authors claim that behavior changes induced by chronic heat exposure are mediated by the POA-pPVT circuit. However, it remains unclear whether these changes are unique to heat exposure or if this circuit represents a more general response to chronic stress. It would be valuable to include control experiments with other forms of chronic stress, such as chronic pain, social defeat, or restraint stress, to determine if the observed changes in the POA-pPVT circuit are indeed specific to thermal stress or indicative of a more universal stress response mechanism.

      We also share similar considerations as the reviewer and indeed have conducted experiments to explore this possibility. Our findings suggest that the POA-pPVT pathway may also mediate behavioral changes induced by other chronic stress, e.g. chronic restraint stress. Nevertheless, given the well-known prominent role of POA neurons in heat perception, we do believe that the POA-pPVT has a specialized role in mediating chronic heat induced changes. The role of this pathway in other stress-related responses will need a more comprehensive study in the future.

      (2) The authors use the term "negative emotion and hyperarousal" to interpret behavioral changes induced by chronic heat (consistently throughout the manuscript, including the title and lines 33-34). However, the term "emotion" is broad and inherently difficult to quantify, as it encompasses various factors, including both valence and arousal (Tye, 2018; Barrett, L. F. 1999; Schachter, S. 1962). Therefore, the reviewer suggests the authors use a more precise term to describe these behaviors, such as valence. Additionally, in lines 117 and 137-139, replacing "emotion" with "stress responses," a term that aligns more closely with the physiological observations, would provide greater specificity and clarity in interpreting the findings.

      Thanks for the suggestion. We have modified the description of “emotion” to “emotional valence” in various places throughout the revised manuscript.

      (3) Related to the role of POA input to pPVT,

      a) The authors showed increased activity in pPVT neurons that receive projections from the POA (Figure 3), and these neurons are necessary for heat-induced behavioral changes (Figures 4N-W). However, is the POA input to the pPVT circuit truly critical? Since recipient pPVT neurons can receive inputs from various brain regions, the reviewer suggests that experiments directly inhibiting the POA-to-pPVT projection itself are needed to confirm the role of POA input. Alternatively, the authors could show that the increased activity of pPVT neurons due to chronic heat exposure is not observed when the POA is blocked. If these experiments are not feasible, the reviewer suggests that the authors consider toning down the emphasis on the role of the POA throughout the manuscript and discuss this as a limitation.<br /> b) In the electrophysiology experiments shown in Figures 6A-I, the authors conducted in vitro slice recordings on pPVT neurons. However, the interpretation of these results (e.g., "The increase in presynaptic excitability of the POA to pPVT excitatory pathway suggested plastic changes induced by the chronic heat treatment.", lines 349-350) appears to be an overclaim. It is difficult to conclude that the increased excitability of pPVT neurons due to heat exposure is specifically caused by inputs from the POA. To clarify this, the reviewer suggests the authors conduct experiments targeting recipient neurons in the pPVT, with anterograde labeling from the POA to validate the source of excitatory inputs.

      For point (a), we acknowledge that pPVT neurons receiving POA inputs may also receive projections from other brain regions. While these additional inputs warrant investigation, they fall beyond the scope of our current study and represent promising directions for future research. Notably, compared to other well-characterized regions such as the amygdala and ventral hippocampus, the pPVT receives particularly robust projections from hypothalamic nuclei (Beas et al., 2018). Our optogenetic inhibition of POA-recipient pPVT neurons during chronic heat exposure effectively prevented the influence of POA excitatory projections on pPVT neurons. Furthermore, selective optogenetic activation of POA excitatory terminals within the pPVT was sufficient to induce similar behavioral abnormalities in mice, strongly supporting the causal role of POA inputs in mediating chronic heat exposure-induced behavioral alterations.

      Beas BS, Wright BJ, Skirzewski M, Leng Y, Hyun JH, Koita O, Ringelberg N, Kwon HB, Buonanno A, Penzo MA (2018) The locus coeruleus drives disinhibition in the midline thalamus via a dopaminergic mechanism Nat Neurosci 21:963-973.

      Regarding point (b), we acknowledge certain limitations in our in vitro patch-clamp recordings when attributing increased pPVT neuronal excitability to enhanced presynaptic POA inputs. Nevertheless, our brain slice recordings clearly demonstrated heightened excitability of pPVT neurons following chronic heat exposure. This finding was further corroborated by our in vivo fiber photometry recordings specifically targeting POA-recipient pPVT neurons, which confirmed that the increased pPVT neuronal activity was indeed modulated by POA inputs. The causal relationship was strengthened by our observation that optogenetic activation of POA excitatory terminals within the pPVT reproduced behavioral abnormalities similar to those observed in chronic heat-exposed mice. Additionally, our inability to induce circuit-specific LTP in the POA-pPVT pathway suggests that these synapses were already potentiated and saturated, reflecting enhanced excitatory inputs from the POA to pPVT. Collectively, these findings support our conclusion that increased excitatory projections from the POA to pPVT likely represent a key mechanism underlying chronic heat exposure-induced behavioral alterations in mice.

      (4) The authors focus on the excitatory connection between the POA and pPVT (e.g., "Together, our results indicate that most of the pPVT-projecting POA neurons responded to heat treatment, which would then recruit their downstream neurons in the pPVT by exerting a net excitatory influence.", lines 169-171). However, are the POA neurons projecting to the pPVT indeed excitatory? This is surprising, considering i) the electrophysiological data shown in Figures 2E-K that inhibitory current was recorded in 52.4% of pPVT neurons by stimulation of POA terminal, and ii) POA projection neurons involved in modulating thermoregulatory responses to other brain regions are primarily GABAergic (Tan et al., 2016; Morrison and Nakamura, 2019). The reviewer suggests showing whether the heat-responsive POA neurons projecting to the pPVT are indeed excitatory (This could be achieved by retrogradely labeling POA neurons that project to the pPVT and conducting fluorescence in situ hybridization (FISH) assays against Slc32a1, Slc17a6, and Fos to label neurons activated by warmth). Alternatively, demonstrate, at least, that pPVT-projecting POA neurons are a distinct population from the GABAergic POA neurons that project to thermoregulatory regions such as DMH or rRPa. This would clarify how the POA-pPVT circuit integrates with the previously established thermoregulatory pathways.

      Thanks for the comment and suggestion. We acknowledge that there are both excitatory and inhibitory projections from POA to pPVT. Although it is not our primary focus, we are aware of the substantial inhibitory inputs from POA to pPVT which suggests an important function. However, we do not think that this pathway, which would exert an opposite effect on POA-recipient pPVT neurons compared to the excitatory input, contributes to the long-term effect of chronic heat exposure. This is due to the increased, rather than decreased, excitability of the neurons. There is a possibility that this inhibitory input serves as a short-term inhibitory control for other purpose. Further work is needed to fully address this question.

      Recommendations for the authors:

      Reviewer #1 (Recommendations for the authors):

      I have a number of suggested minor edits that would improve the readability and interpretation of figures for the reader. In many figures, there are places where it is unclear what is being tested, and making minor changes would make the manuscript flow more easily for the reader:

      (1) The authors could add additional details about the behavior paradigms in the Figures, especially Figure 1. How long was the chronic heat exposure for? At what temperature? What is the length of time between the end of heat exposure and the start of behaviors? What was the schedule of testing for EPM and social behaviors? Was it all on the same day or on different days? These details will make it easier for the reader to understand the behavior tests.

      We have revised our experimental scheme, especially Figure 1, and added more detailed descriptions in the method section. The modifications have also been applied to the other figures.

      (2) In Figures 1J and 1K, it is a bit unclear what is being shown in the right panel, since there are no axes or labels to interpret what is being plotted.

      We have added body kinetics (purple dot) in the left panel of Figure 1J and 1K to align with the right panels, and we have updated our descriptions in the figure legend.

      (3) In general, Figure 1 would benefit from more headers/labels or schematics to demonstrate what is being tested (for example, it's unclear that forced swim, tail suspension, open field, aggression, sucrose preference, or acoustic startle are being studied unless the reader looks at the figure legend in depth. Simple schematics or titles for each panel would help.

      We have added the abbreviated titles for each panel of Figure 1 to help readers to better understand what was being tested.

      (4) Figure 2A would benefit from edits to the schematic so that it is clear that heat exposure is being done before the animal is sacrificed and cFos is stained.

      We have revised the text to clarify that heat exposure occurred before the animal was sacrificed and c-Fos was stained.

      (5) Figure 2D: would help if the quantification of overlap of cFos and rabies was shown in the figure in addition to reporting it in the text (84%).

      We have added quantification in Figure 2D.

      (6) The supplemental data in Figure 2 - Supplemental Figure 1 showing increased Fos in PVT and POA after heat exposure would actually help if it was in main Figure 2 so that the reader can more clearly see the rationale for choosing the POA-PVT circuit. But this is a matter of preference and up to the author where they want to show this data.

      Thanks for the suggestion. But considering the layout and space, we will prefer to retain this part in Figure 2-supplemental figure 1.

      (7) Figure 3 would benefit from a behavior schematic illustrating the time course of the experiment and what the heat exposure protocol is for each day (how many minutes heat 'on' vs 'off', the temperature of heat, etc). Also, what is different about day 22 that makes it chronic heat vs day 21? Currently, it is a bit hard to understand the protocol.

      We have added the temperature and time of chronic heat exposure in the schematic of Figure 3. The “day 22” represented the time point after chronic heat exposure. And we measured the calcium activity of POA recipient pPVT neurons on day 22 to compare with day 1 to demonstrate that the activity changes of POA recipient pPVT neurons after chronic heat exposure.

      (8) Figure 3D, it is unclear what the difference is between the Day 1 data on the left and Day 1 data on the right. Same with Figure 3H, unclear what the difference is between the left and the right.

      The left panel and right panel reflect different parameters: frequency /min (left) and amplitude (△F/F) for Figure 3D-3H. By doing this, we want to reflect the dynamic activity changes of POA recipient pPVT neurons throughout chronic heat exposure process. Now, all figures in panel 3D to 3H have been revised to make them clearer in meaning.

      (9) Figure 4A would benefit from schematics showing the stimulation protocol for chronic optogenetics (how many days? Frequency? Duration of time? Etc)

      We have added detailed schematics in our Figure 4A.

      Reviewer #2 (Recommendations for the authors)

      (1) It is interesting that social behavior appears to be reduced upon long-term heat exposure but not after acute heat exposure. Interaction of animals, such as huddling, can be used by animals as a form of behavioral thermoregulation in cold environments and heat may drive animals apart to allow for better heat dissipation. The social interaction measured here is not huddling (because, I assume, the animals are separated by a divider?) but is this form of behavior measured here related to huddling/"social thermoregulation"? This could be discussed.

      Our behavioral tests were performed at room temperature. Even though huddling is a type of social behavior, based on our observation, the tested mouse was actively revolving around the mental cap, suggesting this type of behavior is not related to huddling/social thermoregulation type of social behavior.

      (2) Line 113: The statement "Chronic treatment did not change body temperature" should be clarified/rephrased because 90 minutes of 38 degrees centigrade exposure to heat will increase the body temperature of mice. It would be helpful if the authors made clear that they measure body temperature before the heat stimulus (and not during the heat stimulus), which is now only obvious if one digs into the methods section.

      We have revised the text and clarified that body temperature was measured before the heat stimulus in the revised manuscript.

      (3) Figure 1J and K: for the non-experts, these graphs are difficult to interpret, some more explanation is needed (what exactly is measured ?). We believe that the term "arousal" may not be justified in this context because the authors have not measured sleep patterns (EEG and EMG) to show that the mice arouse from a sleep (or sleep-like) stage; the authors may consider changing the terminology, e.g. something along the lines of "agitation" or "activity".

      We have further elaborated the meaning of Figure 1J and K in our revised manuscript. The acoustic startle response is a well-recognized behavioral parameter reflecting arousal levels in rodent model. The more agitation in response to stimulus, the higher the arousal levels in mice. We have used the term “agitation” to describe mice’s performance in the acoustic startle response test.

      Reviewer #3 (Recommendations for the authors):

      (1) The authors suggest in the introduction of the manuscript that the HPA axis and other multifaceted factors may influence emotional changes caused by heat stress (lines 63-78). However, there are no experiments or discussions on how the POA-pPVT circuit interacts with these factors. In line with the study's proposed direction in the introduction section, it would be valuable to explore, or at least discuss, whether and how the POA-pPVT circuit interacts with the HPA axis or other neural circuits known to regulate emotional and stress responses. Alternatively, the reviewer suggests revising the content of the introduction to align with the focus of the study.

      Although POA is known to possibly interact with the HPA axis via its connection with the paraventricular nucleus of the hypothalamus, there is hardly any evidence for the pPVT. Thus, we prefer not to speculate this question, which remains open, in our current manuscript.

      (2) In Figure 5, the authors report that pPVT neurons that receive projections from the POA exhibited increased responses to stressful situations following chronic heat exposure. However, considering the long pre- and post-recording time gap of approximately three weeks, the additional expression of GCaMP protein over time could potentially account for the increased signal. Therefore, the reviewer recommends including a control group without heat exposure to rule out this possibility.

      We have included Figure 3-figure supplement 1 in our manuscript to exclude the effect of expression of GCaMP protein over time on the recording of calcium signal.

      (3) Related to Figure 2, a) Please include quantification data of the overlap between retrogradely labeled and c-Fos-expressing POA neurons, which can be presented as a bar graph in Figure 2. This would be beneficial for readers to estimate how many warm-activated POA neurons connected to the pPVT are actively engaged under these conditions.

      In the revised manuscript, we have included the quantification analysis in Figure 2.

      b) The images in Figure 2 - Figure Supplement 1 seem to degrade in quality when magnified, making it difficult to discern finer details. Higher-resolution images would greatly improve the clarity and help in accurately visualizing the c-Fos expression patterns in the POA and pPVT regions.

      We have changed our images of Figure 2-figure supplement 1 to higher-resolution in the revised manuscript.

      c) The c-Fos images in Figure 2D and Figure 2 - Figure Supplement 2C appear unusual in that the c-Fos signal seems to fill the entire cell, whereas c-Fos protein is localized to the nucleus. Could the authors clarify whether this image accurately represents c-Fos staining or if there might be an issue with the staining or imaging process?

      We are confident that the green signals in both Figure 2D and Figure 2-figure supplement 2C, which did not occupy the whole cell body, have already accurately reflected the c-Fos and that they were nucleus staining. We have updated the amplified picture in Figure 2D.

      d) In Supplemental Figure 2B, the square marking the region of interest should be clearly explained in the figure legend to ensure that readers can fully understand the context and focus of the image.

      We have further modified our figure legend in Figure 2-figure supplement 1 in our revised manuscript.

    1. Author response:

      The following is the authors’ response to the previous reviews.

      Public Reviews:

      Reviewer #1 (Public Review):  

      Summary:  

      Satoshi Yamashita et al., investigate the physical mechanisms driving tissue bending using the cellular Potts Model, starting from a planar cellular monolayer. They argue that apical length-independent tension control alone cannot explain bending phenomena in the cellular Potts Model, contrasting with previous works, particularly Vertex Models. They conclude that an apical elastic term, with zero rest value (due to endocytosis/exocytosis), is necessary to achieve apical constriction, and that tissue bending can be enhanced by adding a supracellular myosin cable. Additionally, a very high apical elastic constant promotes planar tissue configurations, opposing bending.  

      Strengths:  

      - The finding of the required mechanisms for tissue bending in the cellular Potts Model provides a natural alternative for studying bending processes in situations with highly curved cells. 

      - Despite viewing cellular delamination as an undesired outcome in this particular manuscript, the model's capability to naturally allow T1 events might prove useful for studying cell mechanics during out-of-plane extrusion. 

      We thank the reviewer for the careful comments and suggestions.

      Weaknesses: 

      - The authors claim that the cellular Potts Model (CPM) is unable to achieve the results of the vertex model (VM) simulations due to naturally non-straight cellular junctions in the CPM versus the VM. The lack of a substantial comparison undermines this assertion. None of the references mentioned in the manuscript are from a work using vertex model with straight cellular junctions, simulating apical constriction purely by a enhancing a length-independent apical tension. Sherrard et al and Pérez-González et al. use 2D and 3D Vertex Models, respectively, with a "contractility" force driving apical constriction. However, their models allow cell curvature. Both references suggest that the cell side flexibility of the CPM shouldn't be the main issue of the "contractility model" for apical constriction. 

      We appreciate the comment.

      For the reports by Sherrard et al and Pérez-Gonález et al, lack of the cell rearrangement (T1 transition) might have caused the difference. Other than these, Muñoz et al. (doi:10.1016/j.jbiomech.2006.05.006), Polyakov et al. (doi:10.1016/j.bpj.2014.07.013), Inoue et al.

      (doi:10.1007/s10237-016-0794-1), Sui et al.

      (doi:10.1038/s41467-018-06497-3), and Guo et al. (doi:10.7554/eLife.69082) used simulation models with the straight lateral surface.

      We updated an explanation about the difference between the vertex model and the cellular Potts model in the discussion.

      P12L318 “An edge in the vertex model can be bent by interpolating vertices or can be represented with an arc of circle (Brakke, 1992). Even in cases where vertex models were extended to allow bent lateral surfaces, the model still limited cell rearrangement and neighbor changes (Pérez-González et al., 2021), limiting the cell delamination. Thus the difference in simulation results between the models could be due to whether the cell rearrangement was included or not. However, it is not clear how the absence of the cell rearrangement affected cell behaviors in the simulation, and it shall be studied in future. In contrast to the vertex model, the cellular Potts model included the curved cell surface and the cell rearrangement innately, it elucidated the importance of those factors.”

      - The myosin cable is assumed to encircle the invaginated cells. Therefore, it is not clear why the force acts over the entire system (even when decreasing towards the center), and not locally in the contour of the group of cells under constriction. The specific form of the associated potential is missing. It is unclear how dependent the results of the manuscript are on these not-well-motivated and model-specific rules for the myosin cable.

      A circle radius decreases when the circle perimeter shrinks, and this was simulated with the myosin cable moving toward the midline in the cross section.

      We added an explanation in the introduction and the results.

      P2L74 “In the same way with the contracting circumferential myosin belt in a cell decreasing the cell apical surface, the circular supracellular myosin cable contraction decreases the perimeter, the radius of the circle, and an area inside the circle.”

      P6L197 “In the cross section, the shrinkage of the circular supracellular myosin cable was simulated with a move of adherens junction under the myosin cable toward the midline.”

      - The authors are using different names than the conventional ones for the energy terms. Their current attempt to clarify what is usually done in other works might lead to further confusion. 

      The reviewer is correct. However we named the energy terms differently because the conventional naming would be misleading in our simulation model.

      We added an explanation in the results.

      P4L140 “Note that the naming for the energy terms differs from preceding studies. For example, Farhadifar et al. (2007) named a surface energy term expressed by a proportional function "line tensions" and a term expressed by a quadratic function "contractility of the cell perimeter". In this study, however, calling the quadratic term "contractility" would be misleading since it prevents the contraction when  < _0. Therefore we renamed the terms accordingly.”

      Reviewer #2 (Public Review): 

      Summary: 

      In their work, the Authors study local mechanics in an invaginating epithelial tissue. The work, which is mostly computational, relies on the Cellular Potts model. The main result shows that an increased apical "contractility" is not sufficient to properly drive apical constriction and subsequent tissue invagination. The Authors propose an alternative model, where they consider an alternative driver, namely the "apical surface elasticity". 

      Strengths: 

      It is surprising that despite the fact that apical constriction and tissue invagination are probably most studied processes in tissue morphogenesis, the underlying physical mechanisms are still not entirely understood. This work supports this notion by showing that simply increasing apical tension is perhaps not sufficient to locally constrict and invaginate a tissue. 

      We thank the reviewer for the careful comments.

      Weaknesses: 

      Although the Authors have improved and clarified certain aspects of their results as suggested by the Reviewers, the presentation still mostly relies on showing simulation snapshots. Snapshots can be useful, but when there are too many, the results are hard to read. The manuscript would benefit from more quantitative plots like phase diagrams etc. 

      We agree with the comment.

      However, we could not make the qualitative measurement for the phase diagram since 1) the measurement must be applicable to all simulation results, and 2) measured values must match with the interpretation of the results. To do so, the measurement must distinguish a bent tissue, delaminated cells, a tissue with curved basal surface and flat apical surface, and a tissue with closed invagination. Such measurement is hardly designed.

      Recommendations for the authors: 

      Reviewing Editor (Recommendations For The Authors): 

      I see that the authors have worked on improving their paper in the revision. However, I agree with both reviewer #1 and reviewer #2 that the presentation and discussion of findings could be clearer. 

      Concrete recommendations for improvement: 

      (1) I find the observation by reviewer #1 on cell rearrangement very illuminating: It is indeed another key difference between the Cellular Potts Model that the authors use compared to typical Vertex Models, and could very well explain the different model outcomes. The authors could expand on the discussion of this point. 

      We updated an explanation about the difference between the vertex model and the cellular Potts model in the discussion.

      P12L318 “An edge in the vertex model can be bent by interpolating vertices or can be represented with an arc of circle (Brakke, 1992). Even in cases where vertex models were extended to allow bent lateral surfaces, the model still limited cell rearrangement and neighbor changes (Pérez-González et al., 2021), limiting the cell delamination. Thus the difference in simulation results between the models could be due to whether the cell rearrangement was included or not. However, it is not clear how the absence of the cell rearrangement affected cell behaviors in the simulation, and it shall be studied in future. In contrast to the vertex model, the cellular Potts model included the curved cell surface and the cell rearrangement innately, it elucidated the importance of those factors.”

      (2) In lines 161-164, the authors write "Some preceding studies assumed that the apical myosin generated the contractile force (Sherrard et al, 2010: Conte et al., 2012; Perez-Mockus et al., 2017; Perez-Gonzalez et al., 2021), while others assumed the elastic force (Polyakov et al., 2014; Inoue et al. 2016; Nematbakhsh et al., 2020)." 

      Similarly, in lines 316-319 the authors write "In the preceding studies, the apically localized myosin was assumed to generate either the contractile force (Sherrard et al, 2010: Conte et al., 2012; Perez-Mockus et al., 2017; Perez-Gonzalez et al., 2021), or the elastic force (Polyakov et al., 2014; Inoue et al. 2016; Nematbakhsh et al., 2020)." 

      The phrasing here is poor, as it suggests that the latter three studies (Polyakov et al., 2014; Inoue et al. 2016; Nematbakhsh et al., 2020) do not use the assumption that apical myosin generated contractile forces. This is wrong. All three of these studies do in fact assume apical surface contractility mediated by myosin. In addition, they also include other factors such as elastic restoring forces from the cell membrane (but not mediated by myosin as far as I understand). 

      These statements should be corrected. 

      We named the energy term expressed with the proportional function “contractility” and the energy term expressed with the quadratic function “elasticity”. Here we did not define what biological molecules correspond with the contractility or the elasticity.

      For the three studies, the effect of myosin was expressed by the quadratic function, and Polyakov et al. (2014) named it “springlike elastic properties”, Inoue et al. (2016) named it “Apical circumference elasticity”, and Nematbakhsh et al. (2020) named it “Actomyosin contractility”. To explain that the for generated by myosin was expressed with the quadratic function in these studies, we wrote that they “assumed the elastic force”.

      We assumed the myosin activity to be approximated with the proportional function in later parts and proposed that the membrane might be expressed with the quadratic function and responsible for the apical constriction based on other studies.

      To clarify this, we added it to the results.

      P4L175 “Some preceding studies assumed that the apical myosin generated the contractile force (Sherrard et al., 2010; Conte et al., 2012; Perez-Mockus et al., 2017; Pérez-González et al., 2021), while the others assumed the myosin to generate the elastic force (Polyakov et al., 2014; Inoue et al., 2016; Nematbakhsh et al., 2020).”

      (3) Lines 294-296: The phrasing suggests that the "alternative driving mechanism" consists of apical surface elasticity remodelling alone. This is not true, it's an additional mechanism, not an alternative. The authors' model works by the combined action of increased apical surface contractility and apical surface elasticity remodelling (and the effect can be strengthened by including a supracellular actomyosin cable). 

      We agree with the comment that the surface remodeling is not solely driving the apical constriction but with myosin activity. However, if we wrote it as an additional mechanism, it might look like that both the myosin activity alone and the surface remodeling alone could drive the apical constriction, and they would drive it better when combined together. So we replaced “mechanism” with “model”.

      P12L311 “In this study, we demonstrated that the increased apical surface contractility could not drive the apical constriction, and proposed the alternative driving model with the apical surface elasticity remodeling.”

      (4) In general, the part of the results section encompassing equations 1-5 should more explicitly state which equations were used in all simulations (Eqs1+5), and which ones were used only for certain conditions (Eqs2+3+4). 

      We added it as follows.

      P4L153 “While the terms Equation 1 and Equation 5 were included in all simulations since they were fundamental and designed in the original cellular Potts model (Graner and Glazier, 1992), the other terms Equation 2-Equation 4 were optional and employed only for certain conditions.”

      (5) Lines 150-152: Please state which parameters were examined. I assume Equation 4 was also left out of this initial simulation, as it is the potential energy of the actomyosin cable that was only included in some simulations. 

      We added it as follows.

      P4L163 “The term Equation 4 was not included either. For a cell, its compression was determined by a balance between the pressure and the surface tension, i.e., the heigher surface tension would compress the cell more. The bulk modulus 𝜆 was set 1, the lateral cell-cell junction contractility 𝐽_𝑙 was varied for different cell compressions, and the apical and basal surface contractilities 𝐽_𝑎 and 𝐽_𝑏 were varied proportional to 𝐽_𝑙.”

      (6) Lines 118-122: The sentence is very long and hard to parse. I suggest the following rephrasing: 

      “In this study, we assumed that the cell surface tension consisted of contractility and elasticity. We modelled the contractility as constant to decrease the surface, but not dependent on surface width or strain. We modelled the elasticity as proportional to the surface strain, working to return the surface to its original width." 

      We updated the explanation as follows.

      P3L121 “In this study, we assumed that the cell surface tension consisted of contractility and elasticity. We modeled the contractility as a constant force to decrease the surface, but not dependent on surface width or strain. We modeled the elasticity as a force proportional to the surface strain, working to return the surface to its original width.”

      (7) Lines 270-274: Another long sentence that is difficult to understand.

      Suggested rephrasing: 

      "Note that the supracellular myosin cable alone could not reproduce the apical constriction (Figure 2c), and cell surface elasticity in isolation caused the tissue to stay almost flat. However, combining both the supracellular myosin cable and the cell surface elasticity was sufficient to bend the tissue when a high enough pulling force acted on the adherens junctions." 

      We updated the sentence as follows.

      P9L287 “Note that the supracellular myosin cable alone could not reproduce the apical constriction (Figure 2c), and that with some parameters the modified cell surface elasticity kept the tissue almost flat (Figure 4). However, combining both the supracellular myosin cable and the cell surface elasticity made a sharp bending when the pulling force acting on the adherens junction was sufficiently high.”

      (8) Lines 434-435: Unclear what is meant with sentence starting with "Rest of sites" 

      We update the sentence as follows.

      P17L456 “At the initial configuration and during the simulation, sites adjacent to medium and not marked as apical are marked as basal.”

      (9) Fixing typos and other minor grammar and wording changes would improve readability. Following is a list in order of appearance in the text with suggestions for improvement. 

      We greatly appreciate the careful editing, and corrected the manuscript accordingly.

      Line 14: "a" is not needed in the phrase "increased a pressure" 

      Line 15: "cell into not the wedge shape" --"cell not into the wedge shape"  In fact it might be better to flip the sentence around to say, e.g. "making the cells adopt a drop shape instead of the expected wedge shape". 

      Line 24: "cells decrease its apical surface" --"cells decrease their apical surface" 

      Line 25: instead of "turn into wedge shape", a more natural-sounding expression could be "adopt a wedge shape" 

      Line 28: "which crosslink and contract" --because the subject is the singular "motor protein", the verb tense needs to be changed to "crosslinks and contracts" 

      Line 29: I suggest to use the definite article "the" before "actin filament network" as this is expected to be a known concept to the reader. 

      Line 31: "adherens junction and tight junction" --use the plural, because there are many per cell: "adherens junctions and tight junctions" 

      Line 42: "In vertebrate" --"In vertebrates" 

      Line 46: "Since the interruption to" --"Since the interruption of" 

      Line 56: "the surface tension of the invaginated cells were" --since the subject is "the surface tension", the verb "were" needs to be changed to "was"  Line 63: "extra cellular matrix" --generally written as "extracellular matrix" without the first space 

      Line 66: "many epithelial tissues" --"in many epithelial tissues" 

      Line 70: "This supracellular cables" --"These supracellular cables" 

      Line 72: "encircling salivary gland" --either "encircling the salivary gland" or "encircling salivary glands" 

      Lines 76-77: "investigated a cell physical property required" --"investigated what cell physical properties were required" 

      Line 78: "was another framework" --"is another framework" (it is a generally and currently valid true statement, so use the present tense) 

      Line 79: "simulated an effect of the apically localized myosin" --for clarity, I suggest rephrasing as "simulated the effect of increased apical contractility mediated by apically localized myosin" 

      Similarly, in Line 80: "did not reproduce the apical constriction" --"did not reproduce tissue invagination by apical constriction", as technically the cells in the model do reduce their apical area, but fail to invaginate as a tissue. 

      Line 82: "we found that a force" --"we found that the force" 

      Line 101: "apico-basaly" --"apico-basally" 

      Lines 107-108: "in order to save a computational cost" --"in order to save on computational cost" 

      Line 114: "Therefore an area of the cell" --"Therefore the interior area of the cell" 

      Line 139: "formed along adherens junction" --"formed along adherens junctions" 

      Line 166: "we ignored an effect" --"we ignored the effect" 

      Line 167: "and discussed it later" --"and discuss it later" 

      Lines 167-168: "an experiment with a cell cultured on a micro pattern showed that the myosin activity was well corresponded by the contractility" --"an experiment with cells cultured on a micro pattern showed that the myosin activity corresponded well to the contractility" 

      Line 172: "success of failure" --"success or failure" 

      Figure 1 caption: "none-polar" --"non-polarized"; "reg" --"red" 

      Line 179: "To prevented the surface" --"To prevent the surface" 

      Line 180: "It kept the cells surface" --"It kept the cells' surface" (apostrophe missing) 

      Line 181: "cells were delaminated and resulted in similar shapes" --"cells were delaminated and adopted similar shapes" 

      Line 190: "To investigate what made the difference" --"To investigate the origin of the difference" 

      Line 203: For clarity, I would suggest to add more specific wording. "the pressure, and a difference in the pressure between the cells resulted in" --"the internal pressure due to cell volume conservation, and a difference in the pressure between the contracting and non-contracting cells resulted in" 

      Line 206: "by analyzing the energy with respect to a cell shape" --"by analyzing the energy with respect to cell shape" 

      Line 220: "indicating that cell could shrink" --"indicating that a cell could shrink" 

      Line 224: For clarity, I would suggest more specific wording "lateral surface, while it seems not natural for the epithelial cells" --"lateral surface imposed on the vertex model, a restriction that seems not natural for epithelial cells" 

      Line 244: "succeeded in invaginating" --"succeeding in invaginating" 

      Line 247: "were checked whether the cells" --"were checked to assess whether the cells" 

      Line 250: "cells became the wedge shape" --"cells adopted the wedge shape" 

      Line 286: "there were no obvious change in a distribution pattern" --"there was no obvious change in the distribution pattern" 

      Lines 296-297: "When the cells were assigned the high apical surface contractility, the cells were rounded" --"When the cells were assigned a high apical surface contractility, the cells became rounded" 

      Line 298: "This simulation results" --"These simulation results" 

      Lines 301-302: I suggest to increase clarity by somewhat rephrasing.  "Even when the vertex model allowed the curved lateral surface, the model did not assume the cells to be rearranged and change neighbors" --"Even in cases where vertex models were extended to allow curved lateral surfaces, the model still limited cell rearrangement and neighbor changes" 

      Line 326: "high surface tension tried to keep" --"high surface tension will keep" 

      Line 334: "In many tissue" --"In many tissues" 

      Line 345: "turned back to its original shape" --"turned back to their original shape" (subject is the plural "cells") 

      Lines 348-349: "resembles the result of simulation" --"resembles the result of simulations" 

      Line 352: "how the myosin" --"how do the myosin" 

      Line 356: "it bears the surface tension when extended and its magnitude" What does the last "its" refer to? The surface tension? 

      Line 365: "the endocytosis decrease" --"the endocytosis decreases" 

      Line 371: "activatoin" --"activation" 

      Line 374 "the cells undergoes" --"the cells undergo" 

      Line 378: "entier" --"entire" 

      Line 389: "individual tissue accomplish" --"individual tissues accomplish" 

      Line 423: "is determined" --"are determined" (subject is the plural "labels") 

      Line 430: "phyisical" --"physical" 

      Table 6 caption: "cell-ECN" --cell-ECM 

      Line 557: "do not confused" --"should not be confused" 

      Reviewer #1 (Recommendations For The Authors): 

      - The phrase "In addition, the encircling supracellular myosin cable largely promoted the invagination by the apical constriction, suggesting that too high apical surface tension may keep the epithelium apical surface flat." is not clear to me. It sounds contradictory. 

      This finding was unexpected and surprising for us too. However, it is actually not contradictory since stronger surface tension will make the surface flatter in general. Figure 4 shows the flat apical surface with the wedge shape cells for the too strong apical surface tension. On the other hand, the supracellular myosin cable promoted the cell shape changes without raising the surface tension, and thus it could make a sharp bending (Figure 5).

      We updated the explanation for the effect of the supracellular myosin cable as follows.

      P2L74 “In the same way as the contracting circumferential myosin belt in a cell decreasing the cell apical surface, the circular supracellular myosin cable contraction decreases the perimeter, the radius of the circle, and an area inside the circle.”

      P6L197 “In the cross section, the shrinkage of the circular supracellular myosin cable was simulated with a move of adherens junction under the myosin cable toward the midline.”

      - Even when the authors now avoid to say "in contrast to vertex model simulations" in pg.4, in the next section there is still the intention to compare VM to CPM. Idem in the Discussion section. The conclusion in that section is that the difference between the results arising with VM (achieving the constriction) and the CPM (not achieving the constriction, and leading to cell delamination) are due to the straight lateral surfaces. However, Sherrard et at could achieve the constriction with an enhanced apical surface contractility using a 2D VM that allows curvatures. Therefore, I don't think the main difference is given by the deformability of the lateral surfaces. Instead, it might be due to the facility of the CPM to drive cellular rearrangements, coupled to specific modeling rules such as the permanent lost of the "apical side" once a delamination occurs and the boundary conditions. A clear example is the observation of loss of cell-cell adherence when all the tensions are set the same. Instead, in a VM cells conserve their lateral neighbors in the uniform tension regime (Sherrard et at). Is it noteworthy that the two mentioned works using vertex models to achieve apical constriction (Sherrard et at. (2D) and Pérez-González (3D) et al.) seem to neglect T1 transitions. I specifically think the added discussion on the impact of the T1 events (fundamental for cell delamination) is quite poor. A more detailed description would help justify the differences between model outcomes. 

      We updated an explanation about the difference between the vertex model and the cellular Potts model in the discussion.

      P12L318 “ An edge in the vertex model can be bent by interpolating vertices or can be represented with an arc of circle (Brakke, 1992). Even in cases where vertex models were extended to allow bent lateral surfaces, the model still limited cell rearrangement and neighbor changes (Pérez-González et al., 2021), limiting the cell delamination. Thus the difference in simulation results between the models could be due to whether the cell rearrangement was included or not. However, it is not clear how the absence of the cell rearrangement affected cell behaviors in the simulation, and it shall be studied in future. In contrast to the vertex model, the cellular Potts model included the curved cell surface and the cell rearrangement innately, it elucidated the importance of those factors.”

      - Fig6c: cell boundary colors are quite difficult to see. 

      The images were drawn by custom scripts, and those scripts do not implement a method to draw wide lines.

      - Title Table 1: "epitherila". 

      We corrected the typo.

      Reviewer #2 (Recommendations For The Authors): 

      The Authors have addressed most of my initial comments. In my opinion, the results could be better represented. Overall, the manuscript contains too many snapshots that are hard to read. I am sure the Authors could come up with a parameter that would tell the overall shape of the tissue and distinguish between a proper invagination and delamination. Then they could plot this parameter in a phase diagram using color plots to show how varying values of model parameters affects the shape. Presentation aside, I believe the manuscript will be a valuable piece of work that will be very useful for the community of computational tissue mechanics. 

      We agree with the comment.

      However, we could not make a suitable qualitative measurement method. For the phase diagrams, the measurement must be applicable to simulation results, otherwise each figure introduce a new measurement and a color representation would just redraw the snapshots but no comparison between the figures. So the different measurements would make the figures more difficult to read.

      The single measurement must distinguish the cell delamination by the increased surface contractility from the invagination by the modified surface elasticity and the supracellular contractile ring, even though the center cells were covered by the surrounding cells and lost contact with apical side extracellular medium in both cases.

      With the center of mass, the delaminated cells would return large values because they were moved basally. With the tissue basal surface curvature, it would not measure if the tissue apical surface was also curved or kept flat. If the phase diagram and interpretation of the simulation results do not match with each other, it would be misleading.

      A measurement meeting all these conditions was hardly designed.

    1. Author response:

      The following is the authors’ response to the original reviews.

      Reviewer #1 (Public review):

      Weaknesses:

      (1) Important details about the nature of DEG comparisons between the wild type and the Lrrk2 G2019S model are missing.

      Please see the recommendations section below for specific responses to individual comments from Reviewer #1.

      (2) Some aspects of the integration between snRNA-seq and MERFISH data are not clear, and many MERFISH-identified cells do not appear to have a high-confidence cluster transfer into the snRNA-seq data space. Imputation is used to overcome some issues with the MERFISH dataset, but it is not clear that this is appropriate.

      Please see the recommendations section below for specific responses to individual comments from Reviewer #1.

      Reviewer #2 (Public review):

      (1) In the GO pathway analyses (both GSEA and DEG GO), I did not see a correction applied to the gene background considered. The study focusses on dopaminergic neurons and thus the gene background should be restricted to genes expressed in dopaminergic neurons, rather than all genes in the mouse genome. The problem arises that if we randomly sample genes from dopaminergic neurons instead of the whole genome, we are predisposed to sampling genes enriched in relevant cell-type-specific roles (and their relevant GO terms) and correspondingly depleted in genes enriched in functions not associated with this cell type. Thus, I am unsure whether the results presented in Figures 8 and 9 may be more likely to be obtained just by randomly sampling genes from a dopaminergic neuron. The background should be limited and these functional analyses rerun.

      Thank you for pointing out this important concern. We agree that overrepresentation analyses (ORAs) are vulnerable to selecting cell-type specific markers as significantly differentially expressed and thus inflating detection of cell-type associated gene sets rather than those truly altered as a function of experimental condition. We have thus re-run the GO analyses in our study with the genetic background being adjusted for each individual comparison. For dataset-level GO in Fig 8, genetic background was defined as genes with expression detected in at least 5% of all cells (to approximate the inclusion of cluster-specific genes). For comparisons of subsets within the dataset (i.e. a family or cluster) across conditions, a minimum detection level of 10% of cells was used to define the genetic background. These same thresholds were applied to filter the DEG lists used as input for GO. Interestingly, this correction appears to have filtered out or lowered the significance of some of the more generic brain-associated pathways that we initially presented, such as axonogenesis or learning and memory, and we feel even more confident in our original interpretation.

      Functional class scoring methods like GSEA, however, are unlike ORAs in that they do utilize a hypergeometric test to calculate overrepresentation as no distinction is made between significant and non-significant differential gene expression (nor is a genetic background provided as input to this tool). GSEA takes as input the full DE results, ranking genes according to their association with either group. Thus, genes simply enriched in DA neurons should be present towards both extremes of the rank list, rather than uniformly skewed toward one extreme. Per the GSEA authors’ user manual and original source paper, the entirety of DE testing should be provided as input for GSEA (barring genes with detection levels so low that their differential expression and/or ranking is likely to be artifactual):

      “The GSEA algorithm does not filter the expression dataset and generally does not benefit from your filtering of the expression dataset. During the analysis, genes that are poorly expressed or that have low variance across the dataset populate the middle of the ranked gene list and the use of a weighted statistic ensures that they do not contribute to a positive enrichment score. By removing such genes from your dataset, you may actually reduce the power of the statistic and processing time is rarely a factor as GSEA can easily analyze 22,000 genes with even modest processing power. However, an exception exists for RNA-seq datasets where GSEA may benefit from the removal of extremely low count genes (i.e., genes with artifactual levels of expression such that they are likely not actually expressed in any of the samples in the dataset).” [https://www.gsea-msigdb.org/gsea/doc/GSEAUserGuideFrame.html]

      In our study, this filtering of very low expression genes (to account for artifactually inflated fold changes or a large number of ties in the rank list that are subsequently ordered at random) occurred at the level of DE testing using the Seurat FindMarkers command, in which differential expression calculations were only performed for genes that were detected in a minimum of 10% of cells in the dataset.

      (2) In the scRDS results, I am unsure what is significant and what isn't. The authors refer to relative measures in the text ("highest") but I do not know whether these differences are significant nor whether any associations are significantly unexpected. Can the x-axis of scRDS results presented in Figure 9 H and I be replaced with a corrected p-value instead of the scRDS score?

      An important distinction should be made here between scDRS and similar approaches that utilize overrepresentation analyses to assess for associations of DEGs with putative risk genes, similar to the GO analyses performed in our paper. The scDRS score represents the relative association for each individual cell’s expression profile (among all other cells in the dataset) with PD risk loci by utilizing the underlying SNPs and associations described in GWAS summary statistics (see Methods or Zhang et al., Nat Genetics 2022 for more details). While scDRS can be used to generate a p value for each individual cell in the dataset, scDRS does not have a native method for defining group-level p values, nor have we attempted to calculate group-level p values here. In order to compare cluster-level mean scDRS scores and determine their significance, we created bootstrapped 95% confidence intervals for the mean scDRS score of each cluster or family (shown by the error bars in forest plots 9G, 9H). A score of 0 represents the null hypothesis of no association between gene expression and PD risk loci, and thus if the 95% confidence interval does not overlap 0, the mean scDRS score for a given group can be regarded as significant as there is a less than 5% chance of the true group mean containing the null. Similarly, groups can be compared to each other in the same way to determine if the group-level mean scDRS score is significantly different across a given pair. However, this overlap of confidence intervals should be interpreted cautiously, as there are a large number of potential comparisons that can be made, creating the potential for Type I error. We have added language to clarify what the scDRS score represents, and to ensure it is not conflated with approaches such as GO or GSEA.

      (3) The results discussed at the bottom of page 13 [page 14 of new version] state that 48.82% of the proteins encoded by the Calb1 DEGs have pre-synaptic localisations as opposed to 45.83% of the SOX6 DEGs, which does not support the statement that "greater proportions of DEGs are associated with presynaptic locations in cells from vulnerable DA neurons (Sox6 family, [and in particular,Sox6^tafa1]), compared to less vulnerable ones (Calb1 family)".

      Thank you for pointing this out; the error here lies in the wording of the results. The percentages mentioned above describe the percentages within the synaptic localized genes rather than the total DEG lists. We have rephrased this section for clarity to include both the percentages within this category as well as the total (the results of which are in line with our original statement).

      (4) While an interest in the Sox6^tafa1 subtype is explained through their expression of Anxa1 denoting a previously identified subtype associated with locomotory behaviours, it was unclear to me how to interpret the functional associations made to DEGs in this subtype taken out of context of other subtypes. Given all the other subtypes, it is not possible to ascertain how specific and thus how interesting these results are unless other subtypes are analysed in the same way and this Sox6^tafa1 subtype is demonstrated as unusual given results from other subtypes.

      In our study, we chose to specifically focus on this population given its unique acceleration-locked functional activity pattern observed in Azcorra & Gaertner et al, Nat Neuro 2023, as there are technical limitations that warrant cautious application of the above approach. We agree that the associations of this population to the described DEGs cannot be interpreted as unique to this population given the data presented and have added language to this effect within the text. There are two major challenges to analyzing all other subtypes to provide a comparison. Firstly, given the number of subtypes involved and number of downstream analyses, it is computationally intensive to carry out this analysis. More importantly however, the results cannot be easily compared across different populations due to the variability in both cluster size and internal heterogeneity of each cluster, as the statistical power in calculating DEGs will be inherently different across these populations (i.e. smaller or more heterogenous clusters would be expected to show a lower number of DEGs reaching significance). While pseudo bulk testing is effective for mitigating these factors, our limited sample number (n=2 independently generated datasets per group) dramatically underpowers differential expression testing using pseudo bulk analysis. One solution is to uniformly limit each cluster size to the minimally observed cluster size through random down-sampling. While this allows the ‘n’ in DE calculations to be uniform, this potentially worsens the problem of internal heterogeneity, which would remain roughly constant but in the setting of a lower ‘n’, increasing the variability in results for larger clusters. To provide a comparator for the population of interest we focused on, we have performed this down sampling approach in order to compare Sox6^Tafa1 to another cluster within the VTA, Calb1^Stac, that also expresses high levels of Anxa1 and Aldh1a1 given the broad interest in these markers as proxies for vulnerability. The results of this comparison are now shown in Figure S10.

      (5) On p12, the authors highlight Mir124a-1hg that encodes miR-124. This is upregulated in Figure 8D but the authors note this has been to be downregulated in PD patients and some PD mouse models. Can the authors comment on the directional difference?

      We have adjusted the text to reflect this discrepancy and speculate on why this may be observed. In short, one hypothesis is that miR-124, given its proposed neuroprotective effects, is increased in DA neurons facing toxic metabolic insults as a compensatory response. In our prodromal model without observable degeneration, this could represent an early sign of cell stress. While speculative, in PD patients or overtly degenerative models, lack of compensatory miR-124 or fulminant cell death among vulnerable cells could result in an observed decrease in miR-124 expression.

      (6) Lastly, can the authors comment on the selection of a LogFC cut-off of 0.15 for their DEG selection? I couldn't see this explained (apologies if I missed it).

      The 0.15 cutoff was selected arbitrarily based on the observed range of fold changes seen among our differentially expressed genes. However, importantly, this cutoff was not used for defining DEGs for downstream analyses such as GSEA or GO, nor for defining significance of differential expression, which was done purely based on FDR-adjusted p values <0.05. The selection of 0.15 affects only the coloring seen in the volcano plot, which we have decided to move to supplemental figures given the uniformly small effect size seen in individual genes and a separate reviewer comment regarding concern in the field over differential expression testing methods in single-cell datasets. Instead, this figure now focuses on highlighting pathway- and gene-set level comparisons that can provide easier interpretation of small, but concordant changes across swaths of genes.

      Recommendations for the authors:

      Reviewer #1 (Recommendations for the authors):

      (1) In the MERFISH dataset, only around half of the DAergic cells (2,297 of 4,532) were successfully projected into the snRNA-seq UMAP space, based on a similarity score > 0.5. Additionally, key transcripts that were used to define the snRNA-seq clusters (such as Sox6) were not identified at all in the MERFISH dataset. This raises some questions about the ability to integrate and compare these datasets directly, which are not fully considered in the manuscript. These discrepancies are smoothed over using imputation, which allows specific class-defining genes such as Sox6 to be plotted on spatial coordinates in Figure 4D. However, imputation is not without caveats, and the appropriateness of the imputation is not well considered in the text.

      We fully agree with the reviewer that the use of an imputation approach needs to be clarified and justified thoroughly. We added a sentence to better clarify the process of imputation on Page 9 “The imputed gene expression is extrapolated from anchors established from pairwise correspondences of cell expression levels between MERFISH and snRNA-Seq datasets.” This pair-wise cell correspondence as defined by anchors can be assessed using Seurat confidence score. We acknowledge the fact that only about 50% of cells could confidently be transferred onto the snRNA-Seq data. This is the result of using a stringent confidence level of 0.5 (similar to previous publications, PMID: 38092916 & 38092912). We preferred mapping fewer high-confidence cells than potentially misrepresenting the spatial location of some of these clusters.

      It is also important to demonstrate the reliability of gene imputation. Indeed as pointed out by the reviewer, some probes such as Sox6 were not detected in the MERFISH dataset. To strengthen our data integration and as already mentioned in the manuscript, we excluded 219 genes based on the deviation of average counts per cell between the datasets. The fact that the imputed expression of Sox6 perfectly reflects its well-characterized distribution (PMIDs: 25127144, 30104732, 25437550, 34758317) strengthened our confidence in our imputation pipeline. We also looked at the correlation of imputed gene expression with the detected transcripts in our MERFISH experiments. We added a new supplemental figure (S7) highlighting the correlations between MERFISH and imputed gene expression of 8 genes (4 for each Sox6 and Calb1 family). Together Fig S6 and S7 show the range of correlations between imputed and actual MERFISH transcript. Altogether, we can observe relatively high correlation between the number of detected transcripts per gene in snRNA-Seq and MERFISH datasets

      In addition, we added a paragraph discussing limitations of gene expression imputation on page 17: “A strength of our study is that it utilizes advantages of each transcriptomic approach, the deep molecular profiling of individual cells using snRNA-Seq and the spatial resolution of MERFISH. For instance, we relied on gene expression imputation to ascribe expression level to genes not covered/detected in our MERFISH probe panel. Gene imputation as described by Stuart et al.(92) has been used in several recent studies integrating spatial and transcriptomic data(46, 47). It relies on identifying anchors that enable projection of MERFISH data onto the UMAP space of a snRNA-Seq dataset and then uses neighboring cells to extrapolate the expression of genes not included in our probe panel. This approach was used to impute Sox6 expression, which accurately reflects what has been reported in prior immunofluorescence and in situ hybridization studies(11, 27, 38, 43, 55). Moreover, imputed gene expression levels correlated strongly with MERFISH detected transcript for most genes further supporting our approach (Fig S6 and S7). Nevertheless, dataset integration has limitations that should be considered. First, imputed gene expression relies on the ability to identify reliable anchors linking the snRNA-Seq and MERFISH datasets. These anchors are determined in part by the choice of genes included on probe panels and thus could indirectly influence the reliability of imputed gene expression. Secondly, gene counts per cell in MERFISH are determined via segmentation of images, which is susceptible to artifacts and bias from centrally versus peripherally localized gene transcripts. In summary, although limitations are present in multi-modal transcriptomic analyses, merging these two approaches provided a molecular and spatial map of the DA system that could not have been resolved by either method alone.”

      (2) In the discussion, the authors argue that the cellular classifications identified here for DA neurons are more likely to reflect discrete cell types than cell states. The rationale for this conclusion is largely based on the absence of subtype differences between wild-type and LRRK2 G2019S transgenic mice. I do not find this argument to be convincing, because it is still possible that certain subdivisions simply reflect dynamic cell states that are also not grossly altered in the mutant mouse. A stronger argument for this claim would be to include trajectory-based analyses that do not show predicted transition points between nearby or related clusters.

      We thank the reviewer for pointing out this particular limitation as differentiating “cell type” and “cell states” been debated in the field for years with no consensus emerging how to address the issue. As suggested, we performed a trajectory analysis using Monocle3 on both control and Lrrk2 samples. We’ve built the trajectory map, taking cluster 20 as the starting node. To avoid potential biased trajectories induced by different cell coverage, we’ve down sampled the Lrrk2 condition to match the number of cells of wildtype. As expected, since most of the DA clusters are not segregated in the UMAP space, the trajectory analysis showed predicted transitions between clusters (see Author response image 1A and 1B). Even though some clusters’ pseudotime score were statistically different between the wildtype and Lrrk2 samples, they overall remained similar (Author response image 1C). This analysis suggests that the LRRK2G2019S mutation induces a mild transcriptional perturbation but does not result in a major cell state drift. Indeed, we believe changes in the observed trajectory path would disappear as the number of cells analyzed increases. Because of this bias introduced by cell coverage, we prefer not to include this trajectory analysis in the manuscript to avoid misleading readers. Thus, as suggested by the reviewer, we softened our claim to “This suggests that our taxonomic scheme is agnostic to a mild perturbation such as LRRK2G2019S, suggesting that our clusters are reflective of cell types, rather than cell states. It is possible that with more severe perturbations, such as a toxin lesion, more substantial alterations of taxonomic schemes are observed(86, 93). However, we expect that for mild insults, day to day behavioral changes, or pharmacological paradigms, our clusters will be resistant to changes, although individual gene levels may vary. Nonetheless, we cannot definitively confirm that a given DA neuron cannot convert from one subtype to another. Ultimately, alternative approaches such as detailed fate mapping of clusters or RNAseq-based trajectory analyses with greater numbers of sampled cells could be used to resolve this question.”.

      Author response image 1.

      A)Trajectory analysis of wildtype and B) LRRK2<sup>G2019S</sup> samples. C) Pseudotime scores for each cluster across wildtype and Lrrk2 conditions. Error bars represent the confidence of error for false positives discovery rate of 5%.

      (3) The relationship between individual samples, GEMwell, and sequenced library should be clarified. If independent samples were combined into one GEMwell, this should be explicitly stated for clarity.

      We have revised the text to better clarify the methodology. In brief, each of our 4 independent samples (2 control, 2 mutants; equal sexes per sample) were isolated from n=2 pooled mice (for a total n=8 mice across the 4 samples). Each sample was processed in its own GEM well to produce 4 distinct libraries that were subsequently sequenced and analyzed as described.

      (4) Please include more details on DEG testing in the manuscript, this is key for interpreting the robustness of certain findings. Ideally, pseudobulked comparisons would be used here (given concerns in the field that DEG testing where N = number of cells artificially inflates the statistical power, violates assumptions of independence, and results in false positive DEGs).

      While we agree that pseudobulk analysis would be ideal for reducing false positives, our study, while exceptionally large in total numbers of DA cells profiled, was generated from 4 total 10X libraries as described above, without any mechanism to definitively demultiplex to the original n=8 source mice. Thus, pseudobulk comparisons would be performed using only n=2 per group, which is below the recommended sample size for these methods. Given this concern, we have moved the volcano plot from Figure 8D to the supplementals and added language to the methods and relevant figure legend acknowledging the limitation in Seurat’s default differential expression analysis methodology.

    1. Author response:

      The following is the authors’ response to the original reviews.

      eLife Assessment

      This important study proposes a framework to understand and predict generalization in visual perceptual learning in humans based on form invariants. Using behavioral experiments in humans and by training deep networks, the authors offer evidence that the presence of stable invariants in a task leads to faster learning. However, this interpretation is promising but incomplete. It can be strengthened through clearer theoretical justification, additional experiments, and by rejecting alternate explanations.

      We sincerely thank the editors and reviewers for their thoughtful feedback and constructive comments on our study. We have taken significant steps to address the points raised, particularly the concern regarding the incomplete interpretation of our findings.

      In response to Reviewer #1, we have included long-term learning curves from the human experiments to provide a clearer demonstration of the differences in learning rates across invariants, and have incorporated a new experiment to investigate location generalization within each invariant stability level. These new findings have shifted the focus of our interpretation from learning rates to the generalization patterns both within and across invariants, which, alongside the observed weight changes across DNN layers, support our proposed framework based on the Klein hierarchy of geometries and the Reverse Hierarchy Theory (RHT).

      We have also worked to clarify the conceptual foundation of our study and strengthen the theoretical interpretation of our results in light of the concerns raised by Reviewers #1 and #2. We have further expanded the discussion linking our findings to previous work on VPL generalization, and addressed alternative explanations raised by Reviewers #1.

      Reviewer #1 (Public Review):

      Summary:

      Visual Perceptual Learning (VPL) results in varying degrees of generalization to tasks or stimuli not seen during training. The question of which stimulus or task features predict whether learning will transfer to a different perceptual task has long been central in the field of perceptual learning, with numerous theories proposed to address it. This paper introduces a novel framework for understanding generalization in VPL, focusing on the form invariants of the training stimulus. Contrary to a previously proposed theory that task difficulty predicts the extent of generalization - suggesting that more challenging tasks yield less transfer to other tasks or stimuli - this paper offers an alternative perspective. It introduces the concept of task invariants and investigates how the structural stability of these invariants affects VPL and its generalization. The study finds that tasks with high-stability invariants are learned more quickly. However, training with low-stability invariants leads to greater generalization to tasks with higher stability, but not the reverse. This indicates that, at least based on the experiments in this paper, an easier training task results in less generalization, challenging previous theories that focus on task difficulty (or precision). Instead, this paper posits that the structural stability of stimulus or task invariants is the key factor in explaining VPL generalization across different tasks

      Strengths:

      - The paper effectively demonstrates that the difficulty of a perceptual task does not necessarily correlate with its learning generalization to other tasks, challenging previous theories in the field of Visual Perceptual Learning. Instead, it proposes a significant and novel approach, suggesting that the form invariants of training stimuli are more reliable predictors of learning generalization. The results consistently bolster this theory, underlining the role of invariant stability in forecasting the extent of VPL generalization across different tasks.

      - The experiments conducted in the study are thoughtfully designed and provide robust support for the central claim about the significance of form invariants in VPL generalization.

      Weaknesses:

      - The paper assumes a considerable familiarity with the Erlangen program and the definitions of invariants and their structural stability, potentially alienating readers who are not versed in these concepts. This assumption may hinder the understanding of the paper's theoretical rationale and the selection of stimuli for the experiments, particularly for those unfamiliar with the Erlangen program's application in psychophysics. A brief introduction to these key concepts would greatly enhance the paper's accessibility. The justification for the chosen stimuli and the design of the three experiments could be more thoroughly articulated.

      We appreciate your feedback regarding the accessibility of our paper, particularly concerning the Erlangen Program and its associated concepts. We have revised the manuscript to include a more detailed introduction to Klein’s Erlangen Program in the second paragraph of Introduction section. It provides clear descriptions and illustrative examples for the three invariants within the Klein hierarchy of geometries, as well as the nested relationships among them (see revised Figure 1). We believe this addition will enhance the accessibility of the theoretical framework for readers who may not be familiar with these concepts.

      In the revised manuscript, we have also expanded the descriptions of the stimuli and experimental design for psychophysics experiments. These additions aim to clarify the rationale behind our choices, ensuring that readers can fully understand the connection between our theoretical framework and experimental approach.

      - The paper does not clearly articulate how its proposed theory can be integrated with existing observations in the field of VPL. While it acknowledges previous theories on VPL generalization, the paper falls short in explaining how its framework might apply to classical tasks and stimuli that have been widely used in the VPL literature, such as orientation or motion discrimination with Gabors, vernier acuity, etc. It also does not provide insight into the application of this framework to more naturalistic tasks or stimuli. If the stability of invariants is a key factor in predicting a task's generalization potential, the paper should elucidate how to define the stability of new stimuli or tasks. This issue ties back to the earlier mentioned weakness: namely, the absence of a clear explanation of the Erlangen program and its relevant concepts.

      We thank you for highlighting the necessary to integrate our proposed framework with existing observations in VPL research.

      Prior VPL studies have not concurrently examined multiple geometrical invariants with varying stability levels, making direct comparisons challenging. However, we have identified tasks from the literature that align with specific invariants. For example, orientation discrimination with Gabors (e.g., Dosher & Lu, 2005) and texture discrimination task (e.g., Wang et al., 2016) involve Euclidean invariants, and circle versus square discrimination (e.g., Kraft et al., 2010) involves affine invariants. On the other hand, our framework does not apply to studies using stimuli that are unrelated to geometric transformations, such as motion discrimination with Gabors or random dots, depth discrimination, vernier acuity, spatial frequency discrimination, contrast detection or discrimination.

      By focusing on geometrical properties of stimuli, our work addresses a gap in the field and introduces a novel approach to studying VPL through the lens of invariant extraction, echoing Gibson’s ecological approach to perceptual learning.

      In the revised manuscript, we have added a clearer explanation of Klein’s Erlangen Program, including the definition of geometrical invariants and their stability (the second paragraph in Introduction section). Additionally, we have expanded the Discussion section to draw more explicit comparisons between our results and previous studies on VPL generalization, highlighting both similarities and differences, as well as potential shared mechanisms.

      - The paper does not convincingly establish the necessity of its introduced concept of invariant stability for interpreting the presented data. For instance, consider an alternative explanation: performing in the collinearity task requires orientation invariance. Therefore, it's straightforward that learning the collinearity task doesn't aid in performing the other two tasks (parallelism and orientation), which do require orientation estimation. Interestingly, orientation invariance is more characteristic of higher visual areas, which, consistent with the Reverse Hierarchy Theory, are engaged more rapidly in learning compared to lower visual areas. This simpler explanation, grounded in established concepts of VPL and the tuning properties of neurons across the visual cortex, can account for the observed effects, at least in one scenario. This approach has previously been used/proposed to explain VPL generalization, as seen in (Chowdhury and DeAngelis, Neuron, 2008), (Liu and Pack, Neuron, 2017), and (Bakhtiari et al., JoV, 2020). The question then is: how does the concept of invariant stability provide additional insights beyond this simpler explanation?

      We appreciate your thoughtful alternative explanation. While this explanation accounts for why learning the collinearity task does not transfer to the orientation task—which requires orientation estimation—it does not explain why learning the collinearity task fails to transfer to the parallelism task, which requires orientation invariance rather than orientation estimation. Instead, the asymmetric transfer observed in our study could be perfectly explained by incorporating the framework of the Klein hierarchy of geometries.

      According to the Klein hierarchy, invariants with higher stability are more perceptually salient and detectable, and they are nested hierarchically, with higher-stability invariants encompassing lower-stability invariants (as clarified in the revised Introduction). In our invariant discrimination tasks, participants need only extract and utilize the most stable invariant to differentiate stimuli, optimizing their ability to discriminate that invariant while leaving the less stable invariants unoptimized.

      For example:

      • In the collinearity task, participants extract the most stable invariant, collinearity, to perform the task. Although the stimuli also contain differences in parallelism and orientation, these lower-stability invariants are not utilized or optimized during the task.

      • In the parallelism task, participants optimize their sensitivity to parallelism, the highest-stability invariant available in this task, while orientation, a lower-stability invariant, remains irrelevant and unoptimized.

      • In the orientation task, participants can only rely on differences in orientation to complete the task. Thus, the least stable invariant, orientation, is extracted and optimized.

      This hierarchical process explains why training on a higher-stability invariant (e.g., collinearity) does not transfer to tasks involving lower-stability invariants (e.g., parallelism or orientation). Conversely, tasks involving lower-stability invariants (e.g., orientation) can aid in tasks requiring higher-stability invariants, as these higher-stability invariants inherently encompass the lower ones, resulting in a low-to-high-stability transfer effect.

      This unique perspective underscores the importance of invariant stability in understanding generalization in VPL, complementing and extending existing theories such as the Reverse Hierarchy Theory. To help the reader understand our proposed theory, we revised the Introduction and Discussion section.

      - While the paper discusses the transfer of learning between tasks with varying levels of invariant stability, the mechanism of this transfer within each invariant condition remains unclear. A more detailed analysis would involve keeping the invariant's stability constant while altering a feature of the stimulus in the test condition. For example, in the VPL literature, one of the primary methods for testing generalization is examining transfer to a new stimulus location. The paper does not address the expected outcomes of location transfer in relation to the stability of the invariant. Moreover, in the affine and Euclidean conditions one could maintain consistent orientations for the distractors and targets during training, then switch them in the testing phase to assess transfer within the same level of invariant structural stability.

      We thank you for this good suggestion. Using one of the primary methods for test generalization, we performed a new psychophysics experiment to specifically examine how VPL generalizes to a new test location within a single invariant stability level (see Experiment 3 in the revised manuscript). The results show that the collinearity task exhibits greater location generalization compared to the parallelism task. This finding suggests the involvement of higher-order visual areas during high-stability invariant training, aligning with our theoretical framework based on the Reverse Hierarchy Theory (RHT). We attribute the unexpected location generalization observed in the orientation task to an additional requirement for spatial integration in its specific experimental design (as explained in the revised Results section “Location generalization within each invariant”). Moreover, based on previous VPL studies that have reported location specificity in orientation discrimination (Fiorentini and Berardi, 1980; Schoups et al., 1995; Shiu and Pashler, 1992), along with the substantial weight changes observed in lower layers of DNNs trained on the orientation task (Figure 9B, C), we infer that under a more controlled experimental design—such as the two-interval, two-alternative forced choice (2I2AFC) task employed in DNN simulations, where spatial integration is not required for any of the three invariants—the plasticity for orientation tasks would more likely occur in lower-order areas.

      In the revised manuscript, we have discussed how these findings, together with the observed asymmetric transfer across invariants and the distribution of learning across DNN layers, collectively reveal the neural mechanisms underlying VPL of geometrical invariants.

      - In the section detailing the modeling experiment using deep neural networks (DNN), the takeaway was unclear. While it was interesting to observe that the DNN exhibited a generalization pattern across conditions similar to that seen in the human experiments, the claim made in the abstract and introduction that the model provides a 'mechanistic' explanation for the phenomenon seems overstated. The pattern of weight changes across layers, as depicted in Figure 7, does not conclusively explain the observed variability in generalizations. Furthermore, the substantial weight change observed in the first two layers during the orientation discrimination task is somewhat counterintuitive. Given that neurons in early layers typically have smaller receptive fields and narrower tunings, one would expect this to result in less transfer, not more.

      We appreciate your suggestion regarding the clarity of DNN modeling. While the DNN employed in our study recapitulates several known behavioral and physiological VPL effects (Manenti et al., 2023; Wenliang and Seitz, 2018), we acknowledge that the claim in the abstract and introduction suggesting the model provides a ‘mechanistic’ explanation for the phenomenon may have been overstated. The DNN serves primarily as a tool to generate important predictions about the underlying neural substrates and provides a promising testbed for investigating learning-related plasticity in the visual hierarchy.

      In the revised manuscript, we have made significant improvements in explaining the weight change across DNN layers and its implication for understanding “when” and “where” learning occurs in the visual hierarchy. Specifically, in the Results ("Distribution of learning across layers") and Discussion sections, we have provided a more explicit explanation of the weight change across layers, emphasizing its implications for understanding the observed variability in generalizations and the underlying neural mechanisms.

      Regarding the substantial weight change observed in the first two layers during the orientation discrimination task, we interpret this as evidence that VPL of this least stable invariant relies more on the plasticity of lower-level brain areas, which may explain the poorer generalization performance to new locations or features observed in the previous literature (Fiorentini and Berardi, 1980; Schoups et al., 1995; Shiu and Pashler, 1992). However, this does not imply that learning effects of this least stable invariant cannot transfer to more stable invariants. From the perspective of Klein’s Erlangen program, the extraction of more stable invariants is implicitly required when processing less stable ones, which leads to their automatic learning. Additionally, within the framework of the Reverse Hierarchy Theory (RHT), plasticity in lower-level visual areas affects higher-level areas that receive the same low-level input, due to the feedforward anatomical hierarchy of the visual system (Ahissar and Hochstein, 2004, 1997; Markov et al., 2013; McGovern et al., 2012). Therefore, the improved signal from lower-level plasticity resulted from training on less stable invariants can enhance higher-level representations of more stable invariants, facilitating the transfer effect from low- to high-stability invariants.

      Reviewer #2 (Public Review):

      The strengths of this paper are clear: The authors are asking a novel question about geometric representation that would be relevant to a broad audience. Their question has a clear grounding in pre-existing mathematical concepts, that, to my knowledge, have been only minimally explored in cognitive science. Moreover, the data themselves are quite striking, such that my only concern would be that the data seem almost *too* clean. It is hard to know what to make of that, however. From one perspective, this is even more reason the results should be publicly available. Yet I am of the (perhaps unorthodox) opinion that reviewers should voice these gut reactions, even if it does not influence the evaluation otherwise. Below I offer some more concrete comments:

      (1) The justification for the designs is not well explained. The authors simply tell the audience in a single sentence that they test projective, affine, and Euclidean geometry. But despite my familiarity with these terms -- familiarity that many readers may not have -- I still had to pause for a very long time to make sense of how these considerations led to the stimuli that were created. I think the authors must, for a point that is so central to the paper, thoroughly explain exactly why the stimuli were designed the way that they were and how these designs map onto the theoretical constructs being tested.

      We thank you for reminding us to better justify our experimental designs. In response, we have provided a detailed introduction to Klein’s Erlangen Program, describing projective, affine, and Euclidean geometries, their associated invariants, and the hierarchical relationships among them (see revised Introduction and Figure 1).

      All experiments in our study employed stimuli with varying structural stability (collinearity, parallelism, orientation, see revised Figure 2, 4), enabling us to investigate the impact of invariant stability on visual perceptual learning. Experiment 1 was adapted from paradigms studying the "configural superiority effect," commonly used to assess the salience of geometric invariants. This paradigm was chosen to align with and build upon related research, thereby enhancing comparability across studies. To address the limitations of Experiment 1 (as detailed in our Results section), Experiments 2, 3, and 4 employed a 2AFC (two-alternative forced choice)-like paradigm, which is more common in visual perceptual learning research. Additionally, we have expanded descriptions of our stimuli and designs. aiming to ensure clarity and accessibility for all readers.

      (2) I wondered if the design in Experiment 1 was flawed in one small but critical way. The goal of the parallelism stimuli, I gathered, was to have a set of items that is not parallel to the other set of items. But in doing that, isn't the manipulation effectively the same as the manipulation in the orientation stimuli? Both functionally involve just rotating one set by a fixed amount. (Note: This does not seem to be a problem in Experiment 2, in which the conditions are more clearly delineated.)

      We appreciate your insightful observation regarding the design of Experiment 1 and the potential similarity between the manipulations of the parallelism and orientation stimuli.

      The parallelism and orientation stimuli in Experiment 1 were originally introduced by Olson and Attneave (1970) to support line-based models of shape coding and were later adapted by Chen (1986) to measure the relative salience of different geometric properties. In the parallelism stimuli, the odd quadrant differs from the others in line slope, while in the orientation stimuli, the odd quadrant contains identical line segments but differs in the direction pointed by their angles. The faster detection of the odd quadrant in the parallelism stimuli compared to the orientation stimuli has traditionally been interpreted as evidence supporting line-based models of shape coding. However, as Chen (1986, 2005) proposed, the concept of invariants over transformations offers a different interpretation: in the parallelism stimuli, the fact that line segments share the same slope essentially implies that they are parallel, and the discrimination may be actually based on parallelism. This reinterpretation suggests that the superior performance with parallelism stimuli reflects the relative perceptual salience of parallelism (an affine invariant property) compared to the orientation of angles (a Euclidean invariant property).

      In the collinearity and orientation tasks, the odd quadrant and the other quadrants differ in their corresponding geometries, such as being collinear versus non-collinear. However, in the parallelism task, participants could rely either on the non-parallel relationship between the odd quadrant and the other quadrants or on the difference in line slope to complete the task, which can be seen as effectively similar to the manipulation in the orientation stimuli, as you pointed out. Nonetheless, this set of stimuli and the associated paradigm have been used in prior studies to address questions about Klein’s hierarchy of geometries (Chen, 2005; Wang et al., 2007; Meng et al., 2019). Given its historical significance and the importance of ensuring comparability with previous research, we adopted this set of stimuli despite its imperfections. Other limitations of this paradigm are discussed in the Results section (“The paradigm of ‘configural superiority effects’ with reaction time measures”), and optimized experimental designs were implemented in Experiment 2, 3, and 4 to produce more reliable results.

      (3) I wondered if the results would hold up for stimuli that were more diverse. It seems that a determined experimenter could easily design an "adversarial" version of these experiments for which the results would be unlikely to replicate. For instance: In the orientation group in Experiment 1, what if the odd-one-out was rotated 90 degrees instead of 180 degrees? Intuitively, it seems like this trial type would now be much easier, and the pattern observed here would not hold up. If it did hold up, that would provide stronger support for the authors' theory.

      It is not enough, in my opinion, to simply have some confirmatory evidence of this theory. One would have to have thoroughly tested many possible ways that theory could fail. I'm unsure that enough has been done here to convince me that these ideas would hold up across a more diverse set of stimuli.

      Thanks for your nice suggestion to validate our results using more diverse stimuli. However, the limitations of Experiment 1 make it less suitable for rigorous testing of diverse or "adversarial" stimuli. In addition to the limitation discussed in response to (2), another issue is that participants may rely on grouping effects among shapes in the quadrants, rather than solely extracting the geometrical invariants that are the focus of our study. As a result, the reaction times measured in this paradigm may not exclusively reflect the extraction time of geometrical invariants but could also be influenced by these grouping effects.

      Therefore, we have shifted our focus to the improved design used in Experiment 2 to provide stronger evidence for our theory. Building on this more robust design, we have extended our investigations to study location generalization (revised Experiment 3) and long-term learning effects (revised Figure 6—figure supplement 2). These enhancements allow us to provide stronger evidence for our theory while addressing potential confounds present in Experiment 1.

      While we did not explicitly test the 90-degree rotation scenario in Experiment 1, future studies could employ more diverse set of stimuli within the Experiment 2 framework to better understand the limits and applicability of our theoretical predictions. We appreciate this suggestion, as it offers a valuable direction for further research.

      Reviewer #1 (Recommendations For The Authors):

      Major comments:

      - A concise introduction to the Erlangen program, geometric invariants, and their structural stability would greatly enhance the paper. This would not only clarify these concepts for readers unfamiliar with them but also provide a more intuitive explanation for the choice of tasks and stimuli used in the study.

      - I recommend adding a section that discusses how this new framework aligns with previous observations in VPL, especially those involving more classical stimuli like Gabors, random dot kinematograms, etc. This would help in contextualizing the framework within the broader spectrum of VPL research.

      - Exploring how each level of invariant stability transfers within itself would be an intriguing addition. Previous theories often consider transfer within a condition. For instance, in an orientation discrimination task, a challenging training condition might transfer less to a new stimulus test location (e.g., a different visual quadrant). Applying a similar approach to examine how VPL generalizes to a new test location within a single invariant stability level could provide insightful contrasts between the proposed theory and existing ones. This would be particularly relevant in the context of Experiment 2, which could be adapted for such a test.

      - I suggest including some example learning curves from the human experiment for a more clear demonstration of the differences in the learning rates across conditions. Easier conditions are expected to be learned faster (i.e. plateau faster to a higher accuracy level). The learning speed is reported for the DNN but not for the human subjects.

      - In the modeling section, it would be beneficial to focus on offering an explanation for the observed generalization as a function of the stability of the invariants. As it stands, the neural network model primarily demonstrates that DNNs replicate the same generalization pattern observed in human experiments. While this finding is indeed interesting, the model currently falls short of providing deeper insights or explanations. A more detailed analysis of how the DNN model contributes to our understanding of the relationship between invariant stability and generalization would significantly enhance this section of the paper.

      Minor comments:

      - Line 46: "it is remains" --> "it remains"

      - Larger font sizes for the vertical axis in Figure 6B would be helpful.

      We thank your detailed and constructive comments, which have significantly helped us improve the clarity and rigor of our manuscript. Below, we provide a response to each point raised.

      Major Comments

      (1) A concise introduction to the Erlangen program, geometric invariants, and their structural stability:

      We appreciate your suggestion to provide a clearer introduction to these foundational concepts. In the revised manuscript, we have added a dedicated section in the Introduction that offers a concise explanation of Klein’s Erlangen Program, including the concept of geometric invariants and their structural stability. This addition aims to make the theoretical framework more accessible to readers unfamiliar with these concepts and to better justify the choice of tasks and stimuli used in the study.

      (2) Contextualizing the framework within the broader spectrum of VPL research:

      We have expanded the Discussion section to better integrate our framework with previous VPL studies that reported generalization, including those using classical stimuli such as Gabors (Dosher and Lu, 2005; Hung and Seitz, 2014; Jeter et al., 2009; Liu and Pack, 2017; Manenti et al., 2023) and random dot kinematograms (Chang et al., 2013; Chen et al., 2016; Huang et al., 2007; Liu and Pack, 2017). In particular, we now discuss the similarities and differences between our findings and these earlier studies, exploring potential shared mechanisms underlying VPL generalization across different types of stimuli. These additions aim to contextualize our framework within the broader field of VPL research and highlight its relevance to existing literature.

      (3) Exploring transfer within each invariant stability level:

      In response to this insightful suggestion, we have added a new psychophysics experiment in the revised manuscript (Experiment 3) to examine how VPL generalizes to a new test location within the same invariant stability level. This experiment provides an opportunity to further explore the neural substrates underlying VPL of geometrical invariants, offering a contrast to existing theories and strengthening the connection between our framework and location generalization findings in the VPL literature.

      (4) Including example learning curves from the human experiments:

      We appreciate your suggestion to include learning curves for human subjects. In the revised manuscript, we have added learning curves of long-term VPL (see revised Figure 6—figure supplement 2) to track the temporal learning processes across invariant conditions. Interestingly, and in contrast to the results reported in the DNN simulations, these curves show that less stable invariants are learned faster and exhibit greater magnitudes of learning. We interpret this discrepancy as a result of differences in initial performance levels between humans and DNNs, as discussed in the revised Discussion section.

      (5) Offering a deeper explanation of the DNN model's findings:

      We acknowledge your concern that the modeling section primarily demonstrates that DNNs replicate human generalization patterns without offering deeper mechanistic insights. To address this, we have expanded the Results and Discussion sections to more explicitly interpret the weight change patterns observed across DNN layers in relation to invariant stability and generalization. We discuss how the model contributes to understanding the observed generalization within and across invariants with different stability, focusing on the neural network's role in generating predictions about the neural mechanisms underlying these effects.

      Minor Comments

      (1) Line 46: Correction of “it is remains” to “it remains”:

      We have corrected this typo in the revised manuscript.

      (2) Vertical axis font size in Figure 6B:

      We have increased the font size of the vertical axis labels in revised Figure 8B for improved readability.

      Reviewer #2 (Recommendations For The Authors):

      (1) There are many details throughout the paper that are confusing, such as the caption for Figure 4, which does not appear to correspond to what is shown (and is perhaps a copy-paste of the caption for Experiment 1?). Similarly, I wasn't sure about many methodological details, like: How participants made their second response in Experiment 2? It says somewhere that they pressed the corresponding key to indicate which one was the target, but I didn't see anything explaining what that meant. Also, I couldn't tell if the items in the figures were representative of all trials; the stimuli were described minimally in the paper.

      (2) The language in the paper felt slightly off at times, in minor but noticeable ways. Consider the abstract. The word "could" in the first sentence is confusing, and, more generally, that first sentence is actually quite vague (i.e., it just states something that would appear to be true of any perceptual system). In the following sentence, I wasn't sure what was meant by "prior to be perceived in the visual system". Though I was able to discern what the authors were intending to say most times, I was required to "read between the lines" a bit. This is not to fault the authors. But these issues need to be addressed, I think.

      (1) We sincerely apologize for the oversight regarding the caption for (original) Figure 4, and thank you for pointing out this error. In the revised manuscript, we have corrected the caption for Figure 4 (revised Figure 5) and ensured it accurately describes the content of the figure. Additionally, we have strengthened the descriptions of the stimuli and tasks in both the Materials and Methods section and the captions for (revised) Figures 4 and 5 to provide a clearer and more comprehensive explanation of Experiment 2. These revisions aim to help readers fully understand the experimental design and methodology.

      (2) We appreciate your feedback regarding the clarity and precision of the language in the manuscript. We acknowledge that some expressions, particularly in the abstract, were unclear or imprecise. In the revised manuscript, we have rewritten the abstract to improve clarity and ensure that the statements are concise and accurately convey our intended meaning. Additionally, we have thoroughly reviewed the entire manuscript to address any other instances of ambiguous language, aiming to eliminate the need for readers to "read between the lines." We are grateful for your suggestions, which have helped us enhance the overall readability of the paper.

    1. Author response:

      The following is the authors’ response to the original reviews.

      Public Reviews:

      Reviewer #1 (Public Review):

      Summary:

      This study focuses on the role of GABA in semantic memory and its neuroplasticity. The researchers stimulated the left ATL and control site (vertex) using cTBS, measured changes in GABA before and after stimulation using MRS, and measured changes in BOLD signals during semantic and control tasks using fMRI. They analyzed the effects of stimulation on GABA, BOLD, and behavioral data, as well as the correlation between GABA changes and BOLD changes caused by the stimulation. The authors also analyzed the relationship between individual differences in GABA levels and behavioral performance in the semantic task. They found that cTBS stimulation led to increased GABA levels and decreased BOLD activity in the ATL, and these two changes were highly correlated. However, cTBS stimulation did not significantly change participants' behavioral performance on the semantic task, although behavioral changes in the control task were found after stimulation. Individual levels of GABA were significantly correlated with individuals' accuracy on the semantic task, and the inverted U-shaped (quadratic) function provides a better fit than the linear relationship. The authors argued that the results support the view that GABAergic inhibition can sharpen activated distributed semantic representations. They also claimed that the results revealed, for the first time, a non-linear, inverted-U-shape relationship between GABA levels in the ATL and semantic function, by explaining individual differences in semantic task performance and cTBS responsiveness

      Strengths:

      The findings of the research regarding the increase of GABA and decrease of BOLD caused by cTBS, as well as the correlation between the two, appear to be reliable. This should be valuable for understanding the biological effects of cTBS.

      We appreciated R1’s positive evaluation of our manuscript.

      Weaknesses:

      Regarding the behavioral effects of GABA on semantic tasks, especially its impact on neuroplasticity, the results presented in the article are inadequate to support the claims made by the authors. There are three aspects of results related to this: 1) the effects of cTBS stimulation on behavior, 2) the positive correlation between GABA levels and semantic task accuracy, and 3) the nonlinear relationship between GABA levels and semantic task accuracy. Among these three pieces of evidence, the clearest one is the positive correlation between GABA levels and semantic task accuracy. However, it is important to note that this correlation already exists before the stimulation, and there are no results supporting that it can be modulated by the stimulation. In fact, cTBS significantly increases GABA levels but does not significantly improve performance on semantic tasks. According to the authors' interpretation of the results in Table 1, cTBS stimulation may have masked the practice effects that were supposed to occur. In other words, the stimulation decreased rather than enhanced participants' behavioral performance on the semantic task.

      The stimulation effect on behavioral performance could potentially be explained by the nonlinear relationship between GABA and performance on semantic tasks proposed by the authors. However, the current results are also insufficient to support the authors' hypothesis of an inverted U-shaped curve. Firstly, in Figure 3C and Figure 3D, the last one-third of the inverted U-shaped curve does not have any data points. In other words, as the GABA level increases the accuracy of the behavior first rises and then remains at a high level. This pattern of results may be due to the ceiling effect of the behavioral task's accuracy, rather than an inverted U-shaped ATL GABA function in semantic memory. Second, the article does not provide sufficient evidence to support the existence of an optimal level of GABA in the ATL. Fortunately, this can be tested with additional data analysis. The authors can estimate, based on pre-stimulus data from individuals, the optimal level of GABA for semantic functioning. They can then examine two expectations: first, participants with pre-stimulus GABA levels below the optimal level should show improved behavioral performance after stimulation-induced GABA elevation; second, participants with pre-stimulus GABA levels above the optimal level should exhibit a decline in behavioral performance after stimulation-induced GABA elevation. Alternatively, the authors can categorize participants into groups based on whether their behavioral performance improves or declines after stimulation, and compare the pre- and post-stimulus GABA levels between the two groups. If the improvement group shows significantly lower pre-stimulus GABA levels compared to the decline group, and both groups exhibit an increase in GABA levels after stimulation, this would also provide some support for the authors' hypothesis.

      Another issue in this study is the confounding of simulation effects and practice effects. According to the results, there is a significant improvement in performance after the simulation, at least in the control task, which the authors suggest may reflect a practice effect. The authors argue that the results in Table 1 suggest a similar practice effect in the semantic task, but it is masked by the simulation of the ATL. However, since no significant effects were found in the ANOVA analysis of the semantic task, it is actually difficult to draw a conclusion. This potential confound increases the risk in data analysis and interpretation. Specifically, for Figure 3D, if practice effects are taken into account, the data before and after the simulation should not be analyzed together.

      We thank for the R1’s thoughtful comments. Due to the limited dataset, it is challenging to determine the optimal level of ATL GABA. Here, we re-grouped the participants into the responders and non-responders to address the issues R1 raised. It is important to note that we applied cTBS over the ATL, an inhibitory protocol, which decreases cortical excitability within the target region and semantic task performance (Chiou et al., 2014; Jung and Lambon Ralph, 2016). Therefore, responders and non-responders were classified according to their semantic performance changes after the ATL stimulation: subjects showing a decrease in task performance at the post ATL cTBS compared to the baseline were defined as responders; whereas subjects showing no changes or an increase in their task performance after the ATL cTBS were defined as non-responders. Here, we used the inverse efficiency (IE) score (RT/1-the proportion of errors) as individual semantic task performance to combine accuracy and RT. Accordingly, we had 7 responders and 10 non-responders.

      Recently, we demonstrated that the pre-stimulation neurochemical profile of the ATL was associated with cTBS responsiveness on semantic processing (Jung et al., 2022). Specifically, the baseline GABA and Glx levels in the ATL predicted cTBS induced semantic task performance changes: individuals with higher GABA and lower Glx in the ATL would show bigger inhibitory effects and responders who decreased semantic task performance after ATL stimulation. Importantly, the baseline semantic task performance was significantly better in responders compared to non-responders. Thus, we expected that responders would show better semantic task performance along with higher ATL GABA levels in their pre-stimulation session relative to non-responders. We performed the planned t-tests to examine the difference in task performance and ATL GABA levels in pre-stimulation session. The results revealed that responders had lower IE (better task performance, t = -1.756, p = 0.050) and higher ATL GABA levels (t = 2.779, p = 0.006) in the pre-stimulation session (Figure 3).

      In addition, we performed planned paired t-test to investigate the cTBS effects on semantic task performance and regional ATL GABA levels according to the groups (responders and non-responders). Responders showed significant increase of IE (poorer performance, t = -1.937, p = 0.050) and ATL GABA levels (t = -2.203, p = 0.035) after ATL cTBS. Non-responders showed decreased IE (better performance, t = 2.872, p = 0.009) and increased GABA levels in the ATL (t = -3.912, p = 0.001) after the ATL stimulation. The results were summarised in Figure 3.

      It should be noted that there was no difference between the responders and non-responders in the control task performance at the pre-stimulation session. Both groups showed better performance after the ATL stimulation – practice effects (Author response image 1 below).

      Author response image 1.

      As we expected, our results replicated the previous findings (Jung et al., 2022) that responders who showed the inhibitory effects on semantic task performance after the ATL stimulation had higher GABA levels in the ATL than non-responders at their baseline, the pre-stimulation session. Importantly, cTBS increased ATL GABA levels in both responders and non-responders. These findings support our hypothesis – the inverted U-shaped ATL GABA function for cTBS response (Figure 4B). cTBS over the ATL resulted in the inhibition of semantic task performance among individuals initially characterized by higher concentrations of GABA in the ATL, indicative of better baseline semantic capacity. Conversely, the impact of cTBS on individuals with lower semantic ability and relatively lower GABA levels in the ATL was either negligible or exhibited a facilitatory effect. This study posits that individuals with elevated GABA levels in the ATL tend to be more responsive to cTBS, displaying inhibitory effects on semantic task performance (responders). On the contrary, those with lower GABA concentrations and reduced semantic ability were less likely to respond or even demonstrated facilitatory effects following ATL cTBS (non-responders). Moreover, our findings suggest the critical role of the baseline neurochemical profile in individual responsiveness to cTBS in the context of semantic memory. This highlights substantial variability among individuals in terms of semantic memory and its plasticity induced by cTBS.

      Our analyses with responders and non-responders have highlighted significant inter-individual variability in both pre- and post-ATL stimulation sessions, including behavioural outcomes and ATL GABA levels. Responders showed distinctive neurochemical profiles in the ATL, associating with their task performance and responsiveness to cTBS in semantic memory. Our findings suggest that responders may possess an optimal level of ATL GABA conducive to efficient semantic processing. This results in enhanced semantic task performance and increased responsiveness to cTBS, leading to inhibitory effects on semantic processing following an inverted U-shaped function. On the contrary, non-responders, characterized by relatively lower ATL GABA levels, exhibited poorer semantic task performance compared to responders at the baseline. The cTBS-induced increase in GABA may contribute to their subsequent improvement in semantic performance. These results substantiate our hypothesis regarding the inverted U-shape function of ATL GABA and its relationship with semantic behaviour.

      To address the confounding of simulation effects and practice effects in behavioural data, we used the IE and computed cTBS-induced performance changes (POST-PRE). Employing a 2 x 2 ANOVA with stimulation (ATL vs. Vertex) and task (Semantic vs. Control) as within subject factors, we found a significant task effect (F<sub>1, 15</sub> = 6.656, p = 0.021) and a marginally significant interaction between stimulation and task (F<sub>1, 15</sub> = 4.064, p = 0.061). Post hoc paired t-test demonstrated that ATL stimulation significantly decreased semantic task performance (positive IE) compared to both vertex stimulation (t = 1.905, p = 0.038) and control task (t = 2.814, p = 0.006). Facilitatory effects (negative IE) were observed in the control stimulation and control task. Please, see the Author response image 2 below. Thus, we believe that ATL cTBS induced task-specific inhibitory effects in semantic processing.

      Author response image 2.

      Accordingly, we have revised the Methods and Materials (p 25, line 589), Results (p8, line 188, p9-11, line 202- 248), Discussion (p19, line 441) and Figures (Fig. 2-3 & all Supplementary Figures).

      Reviewer #2 (Public Review):

      Summary:

      The authors combined inhibitory neurostimulation (continuous theta-burst stimulation, cTBS) with subsequent MRI measurements to investigate the impact of inhibition of the left anterior temporal lobe (ATL) on task-related activity and performance during a semantic task and link stimulation-induced changes to the neurochemical level by including MR spectroscopy (MRS). cTBS effects in the ATL were compared with a control site in the vertex. The authors found that relative to stimulation of the vertex, cTBS significantly increased the local GABA concentration in the ATL. cTBS also decreased task-related semantic activity in the ATL and potentially delayed semantic task performance by hindering a practice effect from pre to post. Finally, pooled data from their previous MRS study suggest an inverted U-shape between GABA concentration and behavioral performance. These results help to better understand the neuromodulatory effects of non-invasive brain stimulation on task performance.

      Strengths:

      Multimodal assessment of neurostimulation effects on the behavioral, neurochemical, and neural levels. In particular, the link between GABA modulation and behavior is timely and potentially interesting.

      We appreciated R2’s positive evaluation of our manuscript.

      Weaknesses:

      The analyses are not sound. Some of the effects are very weak and not all conclusions are supported by the data since some of the comparisons are not justified. There is some redundancy with a previous paper by the same authors, so the novelty and contribution to the field are overall limited. A network approach might help here.

      Thank you for your thoughtful critique. We have taken your comments into careful consideration and have made efforts to address them.

      We acknowledge the limitations regarding the strength of some effects and the potential lack of justification for certain conclusions drawn from the data. In response, we have reviewed our analyses and performed new analyses to address the behavioural discrepancies and strengthened the justifications for our conclusions.

      Regarding the redundancy with a previous paper by the same authors, we understand your concern about the novelty and contribution to the field. We aim to clarify the unique contributions of our current study compared to our previous work. The main novelty lies in uncovering the neurochemical mechanisms behind cTBS-induced neuroplasticity in semantic representation and establishing a non-linear relationship between ATL GABA levels and semantic representation. Our previous work primarily demonstrated the linear relationship between ATL GABA levels and semantic processing. In the current study, we aimed to address two key objectives: 1) investigate the role of GABA in the ATL in short-term neuroplasticity in semantic representation, and 2) explore a biologically more plausible function between ATL GABA levels and semantic function using a larger sample size by combining data from two studies.

      Additionally, we appreciate your suggestion regarding a network approach. We have explored the relationship between ATL GABA and cTBS-induced functional connectivity changes in our new analysis. However, there was no significant relationship between them. In the current study, our decision to focus on the mechanistic link between ATL GABA, task-induced activity, and individual semantic task performance reflects our intention to provide a detailed exploration of the role of GABA in the ATL and semantic neuroplasticity.

      We have addressed the specific weaknesses raised by Reviewer #2 in detail in our response to 'Reviewer #2 Recommendations For The Authors'.

      Reviewer #3 (Public Review):

      Summary:

      The authors used cTBS TMS, magnetic resonance spectroscopy (MRS), and functional magnetic resonance imaging (fMRI) as the main methods of investigation. Their data show that cTBS modulates GABA concentration and task-dependent BOLD in the ATL, whereby greater GABA increase following ATL cTBS showed greater reductions in BOLD changes in ATL. This effect was also reflected in the performance of the behavioural task response times, which did not subsume to practice effects after AL cTBS as opposed to the associated control site and control task. This is in line with their first hypothesis. The data further indicates that regional GABA concentrations in the ATL play a crucial role in semantic memory because individuals with higher (but not excessive) GABA concentrations in the ATLs performed better on the semantic task. This is in line with their second prediction. Finally, the authors conducted additional analyses to explore the mechanistic link between ATL inhibitory GABAergic action and semantic task performance. They show that this link is best captured by an inverted U-shaped function as a result of a quadratic linear regression model. Fitting this model to their data indicates that increasing GABA levels led to better task performance as long as they were not excessively low or excessively high. This was first tested as a relationship between GABA levels in the ATL and semantic task performance; then the same analyses were performed on the pre and post-cTBS TMS stimulation data, showing the same pattern. These results are in line with the conclusions of the authors.

      Strengths:

      I thoroughly enjoyed reading the manuscript and appreciate its contribution to the field of the role of the ATL in semantic processing, especially given the efforts to overcome the immense challenges of investigating ATL function by neuroscientific methods such as MRS, fMRI & TMS. The main strengths are summarised as follows:

      • The work is methodologically rigorous and dwells on complex and complementary multimethod approaches implemented to inform about ATL function in semantic memory as reflected in changes in regional GABA concentrations. Although the authors previously demonstrated a negative relationship between increased GABA levels and BOLD signal changes during semantic processing, the unique contribution of this work lies within evidence on the effects of cTBS TMS over the ATL given by direct observations of GABA concentration changes and further exploring inter-individual variability in ATL neuroplasticity and consequent semantic task performance.

      • Another major asset of the present study is implementing a quadratic regression model to provide insights into the non-linear relationship between inhibitory GABAergic activity within the ATLs and semantic cognition, which improves with increasing GABA levels but only as long as GABA levels are not extremely high or low. Based on this finding, the authors further pinpoint the role of inter-individual differences in GABA levels and cTBS TMS responsiveness, which is a novel explanation not previously considered (according to my best knowledge) in research investigating the effect of TMS on ATLs.

      • There are also many examples of good research practice throughout the manuscript, such as the explicitly stated exploratory analyses, calculation of TMS electric fields, using ATL optimised dual echo fRMI, links to open source resources, and a part of data replicates a previous study by Jung et. al (2017).

      We appreciated R3’s very positive evaluation of our manuscript.

      Weaknesses:

      • Research on the role of neurotransmitters in semantic memory is still very rare and therefore the manuscript would benefit from more context on how GABA contributes to individual differences in cognition/behaviour and more justification on why the focus is on semantic memory. A recommendation to the authors is to highlight and explain in more depth the particular gaps in evidence in this regard.

      This is an excellent suggestion. Accordingly, we have revised our introduction, highlighting the role of GABA on individual differences in cognition and behaviour and research gap in this field.

      Introduction p3, line 77   

      “Research has revealed a link between variability in the levels of GABA in the human brain and  individual differences in cognitive behaviour (for a review, see 5). Specifically, GABA levels in the sensorimotor cortex were found to predict individual performance in the related tasks: higher GABA levels were correlated with a slower reaction time in simple motor tasks (12) as well as improved motor control (13) and sensory discrimination (14, 15). Visual cortex GABA concentrations were positively correlated with a stronger orientation illusion (16), a prolonged binocular rivalry (17), while displaying a negative correlation with motion suppression (17). Individuals with greater frontal GABA concentrations demonstrated enhanced working memory capacity (18, 19). Studies on learning have reported the importance of GABAergic changes in the motor cortex for motor and perceptual learning: individuals showing bigger decreases in local GABA concentration can facilitate this plasticity more effectively (12, 20-22). However, the relationship between GABAergic inhibition and higher cognition in humans remains unclear. The aim of the study was to investigate the role of GABA in relation to human higher cognition – semantic memory and its neuroplasticity at individual level.”

      • The focus across the experiments is on the left ATL; how do the authors justify this decision? Highlighting the justification for this methodological decision will be important, especially given that a substantial body of evidence suggests that the ATL should be involved in semantics bilaterally (e.g. Hoffman & Lambon Ralph, 2018; Lambon Ralph et al., 2009; Rice et al., 2017; Rice, Hoffman, et al., 2015; Rice, Ralph, et al., 2015; Visser et al., 2010).

      This is an important point, which we thank R3 for. Supporting the bilateral ATL systems in semantic representation, previous rTMS studies delivered an inhibitory rTMS in the left and right ATL and both ATL stimulation significantly decreased semantic task performance (Pobric et al., 2007 PNAS; 2010 Neuropsychologia; Lambon Ralph et al., 2009 Cerebral Cortex). Importantly, there was no significant difference on rTMS effects between the left and right ATL stimulation. Therefore, we assume that either left or right ATL stimulation could produce similar, intended rTMS effects on semantic processing. In the current study, we combined the cTBS with multimodal imaging to examine the cTBS effects in the ATL. Due to the design of the study (having a control site, control task, and control stimulation) and limitation of scanning time, we could have a target region for the simulation and chose the left ATL, which was the same MRS VOI of our precious study (Jung et al., 2017). This enabled us to combine the datasets to explore GABAergic function in the ATL.

      • When describing the results, (Pg. 11; lines 233-243), the authors first show that the higher the BOLD signal intensity in ATL as a response to the semantic task, the lower the GABA concentration. Then, they state that individuals with higher GABA concentrations in the ATL perform the semantic task better. Although it becomes clearer with the exploratory analysis described later, at this point, the results seem rather contradictory and make the reader question the following: if increased GABA leads to less task-induced ATL activation, why at this point increased GABA also leads to facilitating and not inhibiting semantic task performance? It would be beneficial to acknowledge this contradiction and explain how the following analyses will address this discrepancy.

      We apologised that our description was not clear. As R1 also commented this issue, we re-analysed behavioural results and demonstrated inter-individual variability in response to cTBS (Please, see the reply to R1 above).

      • There is an inconsistency in reporting behavioural outcomes from the performance on the semantic task. While experiment 1 (cTBS modulates regional GANA concentrations and task-related BOLD signal changes in the ATL) reports the effects of cTBS TMS on response times, experiment 2 (Regional GABA concentrations in the ATL play a crucial role in semantic memory) and experiment 3 (The inverted U-shaped function of ATL GABA concentration in semantic processing) report results on accuracy. For full transparency, the manuscript would benefit from reporting all results (either in the main text or supplementary materials) and providing further explanations on why only one or the other outcome is sensitive to the experimental manipulations across the three experiments.

      Regarding the inconsistency of behavioural outcome, first, there were inter- individual differences in our behavioural data (see the Figure below). Our new analyses revealed that there were responders and non-responders in terms of cTBS responsiveness (please, see the reply to R1 above. It should be noted that the classification of responders and non-responders was identical when we used semantic task accuracy). In addition, RT was compounded by practice effects (faster in the post-stimulation sessions), except for the ATL-post session. Second, we only found the significant relationship between semantic task accuracy and ATL GABA concentrations in both previous (Jung et al., 2017) and current study. ATL GABA levels were not correlated with semantic RT (Jung et al., 2017: r = 0.34, p = 0.14, current study: r = 0.26, p = 0.14). It should be noted that there were no significant correlations between ATL GABA levels and semantic inverse efficiency (IE) in both studies (Jung et al., 2017: r = 0.13, p = 0.62, current study: r = 0.22, p = 0.44). As a result, we found no significant linear and non-linear relationship between ATL GABA levels and RT (linear function R<sup>2</sup> = 0.21, p =0.45, quadratic function: R<sup>2</sup> = 0.17, p = 0.21) and between ATL GABA levels and IE (linear function R<sup>2</sup> = 0.24, p =0.07, quadratic function: R<sup>2</sup> = 2.24, p = 0.12). Thus, our data suggests that GABAergic action in the ATL may sharpen activated distributed semantic representations through lateral inhibition, leading to more accurate semantic performance (Isaacson & Scanziani., 2011; Jung et al., 2017).

      We agreed with R3’s suggestion to report all results. The results of control task and control stimulation were included in Supplementary information (Figure S1, S4-5).

      Overall, the most notable impact of this work is the contribution to a better understanding of individual differences in semantic behaviour and the potential to guide therapeutic interventions to restore semantic abilities in neurological populations. While I appreciate that this is certainly the case, I would be curious to read more about how this could be achieved.

      Thank you once again to R3 for the positive evaluation of our study. We acknowledge your interest in understanding the practical implications of our findings. It is crucial to highlight the substantial variability in the effectiveness of rTMS and TBS protocols among individuals. Previous studies in healthy subjects have reported response rates ranging from 40% to 70% in the motor cortex, and in patients, the remission rate for rTMS treatment in treatment-resistant depression is around 29%. Presently, the common practice in rTMS treatment is to apply the same protocol uniformly to all patients.

      Our study demonstrated that 40% of individuals in our sample were classified as responders to ATL cTBS. Notably, we observed differences in ATL GABA levels before stimulation between responders and non-responders. Responders exhibited higher baseline ATL GABA levels, along with better semantic performance at the baseline (as mentioned in our response to R1). This suggests that establishing the optimal level of ATL GABA by assessing baseline GABA levels before stimulation could enable the tailoring of an ideal protocol for each individual, thereby enhancing their semantic capability. To achieve this, more data is needed to delineate the proposed inverted U-shaped function of ATL GABA in semantic memory.

      Our ongoing efforts involve collecting additional data from both healthy aging and dementia cohorts using the same protocol. Additionally, future pharmacological studies aim to modulate GABA, providing a deeper understanding of the individual variations in semantic function. These initiatives contribute to the potential development of personalized therapeutic interventions for individuals with semantic impairments.

      Reviewer #1 (Recommendations For The Authors):

      My major suggestion is to include an analysis regarding the "existence of an optimal GABA level". This would be the most direct test for the authors' hypothesis on the relationship between GABA and semantic memory and its neuroplasticity. Please refer to the public review section for details.

      Here are some other suggestions and questions.

      (1) The sample size of this study is relatively small. Although the sample size was estimated, a small sample size can bring risks to the generalizability of the results to the population. How did the author consider this risk? Is it necessary to increase the sample size?

      We agreed with R1’s comments. However, the average of sample size in healthy individuals was 17.5 in TMS studies on language function (number of studies = 26, for a review, see Qu et al, 2022 Frontiers in Human Neuroscience), 18.3 in the studies employing rTMS and fMRI on language domain (number of studies = 8, for a review, see Hartwigsen & Volz., 2021 NeuroImage), and 20.8 in TMS combined MRS studies (number of studies = 11, for a review, see Cuypers & Marsman., 2021 NeuroImage). Notably, only two studies utilizing rTMS, fMRI, and MRS had sample sizes of N = 7 (Grohn et al., 2019 Frontiers in Neuroscience) and N = 16 (Rafique & Steeves. 2020 Brain and Behavior). Despite having 19 participants in our current study, it is noteworthy that our sample size aligns closely with studies employing similar approaches and surpasses those employing the same methodology.

      As a result of the changes in a scanner and the relocation of the authors to different institutes, it is impossible to increase the sample size for this study.

      (2) How did the authors control practice effects? How many practice trials were arranged before the experiment? Did you avoid the repetition of stimuli in tasks before and after the stimuli?

      At the beginning of the experiment, participants performed the practice session (20 trials) for each tasks outside of the scanner. Stimuli in tasks were not repeated before and after stimulation sessions.

      (3) In Figures 2D and E, does the vertical axis of the BOLD signal refer to the semantic task itself or the difference between the semantic and control tasks? Could you provide the respective patterns of the BOLD signal before and after the stimuli in the semantic and control tasks in a figure?

      We apologised that the names of axis of Figure 2 were not clear. In Fig 2D-E, the BOLD signal changes refer to the semantic task itself. Accordingly, we have revised the Fig. 2.

      (4) Figure 1A shows that MRS ATL always comes before MRS Vertex. Was the order of them counterbalanced across participants?

      The order of MRS acquisition was not counterbalanced across participants.

      (5) I am confused by the statement "Our results provide strong evidence that regional GABA levels increase following inhibitory cTBS in the human associative cortex, specifically in the ATL, a representational semantic hub. Notably, the observed increase was specific to the ATL and semantic processing, as it was not observed in the control region (vertex) and not associated with control processing (visuospatial processing)". GABA levels are obtained in the MRS, and this stage does not involve any behavioral tasks. Why do the authors state that the increase in GABA levels was specific to semantic processing and was not associated with control processing?

      Following R1’s suggestion, we have re-analysed behavioural data and showed cTBS-induced suppression in semantic task performance after ATL stimulation only (please, see the reply above). There were no cTBS effects in the control task performance, control site (vertex) and no correlations between the ATL GABA levels and control task performance. The Table was added to the Supplementary Information as Table S3.

      (6) In Figure 3, the relationship between GABA levels in the ATL and performance on semantic tasks is presented. What is the relationship between GABA levels at the control site and performance on semantic tasks? Should a graph be provided to illustrate this?

      As the vertex was not involved in semantic processing (no activation during semantic processing), we did not perform the analysis between vertex GABA levels and semantic task performance. Following R3’s suggestion, we performed a linear regression between vertex GABA levels and semantic task performance in the pre-stimulation session, accounting for GM volume, age, and sex. As we expected that there was no significant relationship between them. (R<sup>2</sup> = 0.279, p = 0.962).

      (7) The author claims that GABA can sharpen distributed semantic representations. However, even though there is a positive correlation between GABA levels and semantic performance, there is no direct evidence supporting the inference that this correlation is achieved through sharpening distributed semantic representations. How did the author come to this conclusion? Are there any other possibilities?

      We showed that ATL GABA concentrations in pre-stimulation was ‘negatively’ correlated with task-induced regional activity in the ATL and ‘positively’ correlated with semantic task performance. In our semantic task, such as recognizing a camel (Fig. 1), the activation of all related information in the semantic representation (e.g., mammal, desert, oasis, nomad, humps, & etc.) occurs. To respond accurately to the task (a cactus), it becomes essential to suppress irrelevant meanings through an inhibitory mechanism. Therefore, the inhibitory processing linked to ATL GABA levels may contribute to more efficient processing in this task.

      Animal studies have proposed a related hypothesis in the context of the close interplay between activation and inhibition in sensorimotor cortices (Isaacson & Scanziani., 2011). Liu et al (2011, Neuron) demonstrated that the rise of excitatory glutamate in the visual cortex is followed by the increase of inhibitory GABA in response to visual stimuli. Tight coupling of these paired excitatory-inhibitory functions results in a sharpening of the activated representation. (for a review, see Isaacson & Scanziani., 2011 Neuron How Inhibition Shapes Cortical Activity). In human, Kolasinski et al (2017, Current Biology) revealed that higher sensorimotor GABA levels are associated with more selective cortical tuning measured fMRI, which in turn is associated with enhanced perception (better tactile discrimination). They claimed that the relationship between inhibition and cortical tuning could result from GABAergic signalling, shaping the selective response profiles of neurons in the primary sensory regions of the brain. This process is crucial for the topographic organization (task-induced fMRI activation in the sensorimotor cortex) vital to sensory perception.

      Building on these findings, we suggest a similar mechanism may operate in higher-order association cortices, including the ATL semantic hub. This suggests a process that leads to more sharply defined semantic representations associated with more selective task-induced activation in the ATL and, consequently, more accurate semantic performance (Jung et al., 2017).

      Reviewer #2 (Recommendations For The Authors):

      Major issues:

      (1) It wasn't completely clear what the novel aspect of this study relative to their previous one on GABAergic modulation in semantic memory issue, this should be clarified. If I understand correctly, the main difference from the previous study is that this study considers the TMS-induced modulation of GABA?

      We apologise that the novelty of study was not clear. The main novelty lies in uncovering the neurochemical mechanisms behind cTBS-induced neuroplasticity in semantic representation and establishing a non-linear relationship between ATL GABA levels and semantic representation. Our previous work firstly demonstrated the linear relationship between the ATL GABA levels and semantic processing. In the current study, we aimed to address two key objectives: 1) investigate the role of GABA in the ATL in short-term neuroplasticity in semantic representation, and 2) explore a biologically more plausible function between ATL GABA levels and semantic function using a larger sample size by combining data from two studies.

      The first part of the experiment in this study mirrored our previous work, involving multimodal imaging during the pre-stimulation session. We conducted the same analysis as in our previous study to replicate the findings in a different cohort. Subsequently, we combined the data from both studies to examine the potential inverted U-shape function between ATL GABA levels and semantic function/neuroplasticity.

      Accordingly, we have revised the Introduction by adding the following sentences.

      “The study aimed to investigate the neural mechanisms underlying cTBS-induced neuroplasticity in semantic memory by linking cortical neurochemical profiles, task-induced regional activity, and variability in semantic memory capability within the ATL.”

      “Furthermore, to address and explore the relationship between regional GABA levels in the ATL and semantic memory function, we combined data from our previous study (Jung et al., 2017) with the current study’s data.”

      (2) I found the scope of the study very narrow. I guess everyone agrees that TMS induces network effects, but the authors selectively focus on the modulation in the ATL. This is unfortunate since semantic memory requires the interaction between several brain regions and a network perspective might add some novel aspect to this study which has a strong overlap with their previous one. I am aware that MRS can only measure pre-defined voxels but even these changes could be related to stimulation-induced effects on task-related activity at the whole brain level.

      We appreciate R2's thoughtful comments and acknowledge the concern about the perceived narrow scope of the study. We agreed with the notion that cTBS induces network-level changes. In our investigation, we did observe cTBS over the ATL influencing task-induced regional activity in other semantic regions and functional connectivity within the semantic system. Specifically, ATL cTBS increased activation in the right ATL after ATL stimulation compared to pre-stimulation, along with increased functional connectivity between the left and right ATL, between the left ATL and right semantic control regions (IFG and pMTG), and between the left ATL and right angular gyrus. These results were the replication of Jung & Lambon Ralph (2016) Cerebral Cortex.

      However, it is important to note that we did not find any significant correlations between ATL GABA changes and cTBS-induced changes in the functional connectivity. Consequently, we are currently preparing another paper that specifically addresses the network-level changes induced by ATL cTBS. In the current study, our decision to focus on the mechanistic link between ATL GABA, task-induced activity, and individual semantic task performance reflects our intention to provide a detailed exploration of the role of GABA in the ATL and semantic neuroplasticity.

      (3) On a related note, I think the provided link between GABAergic modulation and behavioral changes after TMS is somehow incomplete because it ignores the stimulation effects on task-related activity. Could these be linked in a regression analysis with two predictors (with behavior or GABA level as a criterion and the other two variables as predictors)?

      In response to R2’s suggestion, we performed a multiple regression analysis, by modelling cTBS-induced ATL GABA changes (POST-PRE), task-related BODL signal changes (POST-PRE), and semantic task performance (IE) changes (POST-PRE). The model with GABA changes (POST-PRE) as a criterion was significant (F<sub>2, 14</sub> = 8.77, p = 0.003), explaining 56% of cTBS-induced ATL GABA changes (adjusted R<sup>2</sup>) with cTBS-related ATL BOLD signal changes and semantic task performance changes. However, the model with semantic task performance change (POST-PRE) as a criterion was not significant (F = 0.26, p = 0.775). Therefore, cTBS-induced changes in ATL BOLD signals and semantic task performance significantly predicted the cTBS-induced ATL GABA changes. It was found that cTBS-induced ATL BOLD signal changes significantly predicted cTBS-induced GABA changes in the ATL (β = -4.184, p = 0.001) only, aligning with the results of our partial correlation analysis.

      Author response table 1.

      (4) Several statements in the intro and discussion need to be rephrased or toned down. For example, I would not agree that TBS "made healthy individuals mimic semantic dementia patients". This is clearly overstated. TMS protocols slightly modulate brain functions, but this is not similar to lesions or brain damage. Please rephrase. In the discussion, it is stated that the results provide "strong evidence". I disagree based on the overall low values for most comparisons.

      Hence, we have revised both the Introduction and the Discussion.

      “Perturbing the ATL with inhibitory repetitive transcranial magnetic stimulation (rTMS) and theta burst stimulation (TBS) resulted in healthy individuals exhibiting slower reaction times during semantic processing.”

      “Our results demonstrated an increase in regional GABA levels following inhibitory cTBS in human associative cortex, specifically in the ATL, a representational semantic hub.”

      (5) Changes in the BOLD signal in the ATL: There is a weak interaction between stimulation and VOI and post hoc comparisons with very low values reported. Are these corrected for multiple comparisons? I think that selectively reporting weak values with small-volume corrections (if they were performed) does not provide strong evidence. What about whole-brain effects and proper corrections for multiple comparisons?

      There was no significant interaction between the stimulation (ATL vs. Vertex) and session (pre vs post) in the ATL BOLD signal changes (p = 0.29). Our previous work combining rTMS with fMRI (Binney et al., 2015; Jung & Lambon Ralph, 2016) demonstrated that there was no significant rTMS effects on the whole brain analysis and only ROI analyses revealed the subtle but significant rTMS effects in the target site (reduction of task-induced ATL activity). In the current study, we focused our hypothesis on the anticipated decrease in task-induced regional activity in the ATL during semantic processing following the inhibitory cTBS. Accordingly, we conducted planned paired t-tests specifically within the ATL for BOLD signal changes without applying multiple comparison corrections. It's noted that these results were derived from regions of interest (ROIs) and not from small-volume corrections. Furthermore, no significant findings emerged from the comparison of the ATL post-session vs. Vertex post-session and the ATL pre-session vs. ATL post-session in the whole-brain analysis (see Supplementary figure 2).

      Accordingly, we have added the Figure S2 in the Supplementary Information.

      (6) Differences between selected VOIs: Numerically, the activity (BOLD signal effect) is higher in the vertex than the ATL, even in the pre-TMS session (Figure 2D). What does that mean? Does that indicate that the vertex also plays a role in semantic memory?

      We apologise that the figure was not clear. Fig. 2D displays the BOLD signal changes in the ATL VOI for the ATL and Vertex stimulation. As there was no activation in the vertex during semantic processing, we did not present the fMRI results of vertex VOI (please, see Author response image 3 below). Accordingly, we have revised the label of Y axis of the Figure 2D – ATL BOLD signal change.

      Author response image 3.

      The cTBS effects within the Vertex VOI during semantic processing

      (7) Could you provide the e-field for the vertex condition?

      We have added it in the Supplementary Information as Supplementary Figure 6.

      (8) Stimulation effects on performance (RTs): There is a main effect of the session in the control task. Post-hoc tests show that control performance is faster in the post-pre comparison, while the semantic task is not faster after ATL TMS (as it might be delayed). I think you need to perform a 3-way ANOVA here including the factor task if you want to show task specificity (e.g., differences for the control but not semantic task) and then a step-down ANOVA or t-tests.

      Thanks for R2’s suggestion. We have addressed this issue in reply to R1. Please, see the reply to R1 for semantic task performance analysis.

      Minor issue:

      In the visualization of the design, it would be helpful to have the timing/duration of the different measures to directly understand how long the experiment took.

      We have added the duration of the experiment design in the Figure 1.

      Reviewer #3 (Recommendations For The Authors):

      Further Recommendations:

      • Pg. 6; lines 138-147: There is a sense of uncertainty about the hypothesis conveyed by expressions such as 'may' or 'could be'. A more confident tone would be beneficial.

      Thanks for R3’s thoughtful suggestion. We have revised the Introduction.

      • Pg. 6; line 155: left or bilateral ATL, please specify.

      We have added ‘left’ in the manuscript.

      • Pg. 8; line 188: Can the authors provide a table with peak activations to complement the figure?

      We have added the Table for the fMRI results in the Supplementary Information (Table S1).

      • Pg 9; Figure 2C: The ATL activation elicited by the semantic task seems rather medial. What are the exact peak coordinates for this cluster, and how can the authors demonstrate that the electric fields induced by TMS, which seem rather lateral (Figure 2A), also impacted this area? Please explain.

      We apologise that the Figure was not clear. cTBS was delivered to the peak coordinate of the left ventral ATL [-36, -15, -30] determined by previous fMRI studies (Binney et al., 2010; Visser et al., 2012). To confirm the cTBS effects at the target region, we conducted ROI analysis centred in the ventral ATL [-36, -15, -30] and the results demonstrated a reduced ATL activity after ATL stimulation during semantic processing (t = -2.43, p = 0.014) (please, see Author response image 4 below). Thus, cTBS successfully modulated the ATL activity reaching to the targe coordinate.

      Author response image 4.

      • Pg.23; line 547: What was the centre coordinate of the ROI (VOI), and was it consistent across all participants? Please specify.

      We used the ATL MRS VOI (a hexahedron with 4cm x 2cm x 2cm) for our regions of interest analysis and the central coordinate was around -45, -12, -20 (see Author response image 5). As we showed in Fig. 1C, the location of ATL VOI was consistent across all participants.

      Author response image 5.

      • Pg. 24; line 556-570: What software was used for performing the statistical analyses? Please specify.

      We have added the following sentence.

      “Statistical analyses were undertaken using Statistics Package for the Social Sciences (SPSS, Version 25, IBM Cary, NC, USA) and RStudio (2023).”

      • Pg. 21; line 472-480: It is not clear if and how neuronavigation was used (e.g. were T1scans or an average MNI template used, what was the exact coordinate of stimulation and how was it decided upon). Please specify.

      We apologised the description was not clear. We have added a paragraph describing the procedure.

      “The target site in the left ATL was delineated based on the peak coordinate (MNI -36 -15 -30), which represents maximal peak activation observed during semantic processing in previous distortion-corrected fMRI studies (38, 41). This coordinate was transformed to each individual’s native space using Statistical Parametric Mapping software (SPM8, Wellcome Trust Centre for Neuroimaging, London, UK). T1 images were normalised to the MNI template and then the resulting transformations were inverted to convert the target MNI coordinate back to the individual's untransformed native space coordinate. These native-space ATL coordinates were subsequently utilized for frameless stereotaxy, employing the Brainsight TMS-MRI co-registration system (Rogue Research, Montreal, Canada). The vertex (Cz) was designated as a control site following the international 10–20 system.”

      • Miscellaneous

      - line 57: insert 'about' to the following sentence: '....little is known the mechanisms linking'

      - line 329: 'Previous, we demonstrated'....should be Previously we demonstrated....

      We thank for R3’s thorough evaluation our manuscript. We have revised them.

      Furthermore, it would be an advantage to make the data freely available for the benefit of the broader scientific community.

      We appreciate Reviewer 3’s suggestion. Currently, this data is being used in other unpublished work. However, upon acceptance of this manuscript, we will make the data freely available for the benefit of the broader scientific community.

      Chiou R, Sowman PF, Etchell AC, Rich AN (2014) A conceptual lemon: theta burst stimulation to the left anterior temporal lobe untangles object representation and its canonical color. J Cogn Neurosci 26:1066-1074.

      Jung J, Lambon Ralph MA (2016) Mapping the Dynamic Network Interactions Underpinning Cognition: A cTBS-fMRI Study of the Flexible Adaptive Neural System for Semantics. Cereb Cortex 26:3580-3590.

      Jung J, Williams SR, Sanaei Nezhad F, Lambon Ralph MA (2017) GABA concentrations in the anterior temporal lobe predict human semantic processing. Sci Rep 7:15748.

      Jung J, Williams SR, Nezhad FS, Lambon Ralph MA (2022) Neurochemical profiles of the anterior temporal lobe predict response of repetitive transcranial magnetic stimulation on semantic processing. Neuroimage 258:119386.

    1. Author response:

      The following is the authors’ response to the original reviews.

      Public Reviews:

      Reviewer #1(Public review):

      Strengths:

      Utilization of both human placental samples and multiple mouse models to explore the mechanisms linking inflammatory macrophages and T cells to preeclampsia (PE).<br /> Incorporation of advanced techniques such as CyTOF, scRNA-seq, bulk RNA-seq, and flow cytometry.

      Identification of specific immune cell populations and their roles in PE, including the IGF1-IGF1R ligand-receptor pair in macrophage-mediated Th17 cell differentiation.<br /> Demonstration of the adverse effects of pro-inflammatory macrophages and T cells on pregnancy outcomes through transfer experiments.

      Weaknesses:

      Comment 1. Inconsistent use of uterine and placental cells, which are distinct tissues with different macrophage populations, potentially confounding results.

      Response1: We thank the reviewers' comments. We have done the green fluorescent protein (GFP) pregnant mice-related animal experiment, which was not shown in this manuscript. The wild-type (WT) female mice were mated with either transgenic male mice, genetically modified to express GFP, or with WT male mice, in order to generate either GFP-expressing pups (GFP-pups) or their genetically unmodified counterparts (WT-pups), respectively. Mice were euthanized on day 18.5 of gestation, and the uteri of the pregnant females and the placentas of the offspring were analyzed using flow cytometry. The majority of macrophages in the uterus and placenta are of maternal origin, which was defined by GFP negative. In contrast, fetal-derived macrophages, distinguished by their expression of GFP, represent a mere fraction of the total macrophage population. We have added the GFP pregnant mice-related data in uterine and placental cells (Line204-212).

      Comment 2. Missing observational data for the initial experiment transferring RUPP-derived macrophages to normal pregnant mice.

      Response 2: We thank the reviewers' comments. We have added the observational data (Figure 4-figure supplement 1D, 1E) and a corresponding description of the data (Line 198-203).

      Comment 3. Unclear mechanisms of anti-macrophage compounds and their effects on placental/fetal macrophages.

      Response 3: We thank the reviewers' comments. PLX3397, the inhibitor of CSF1R, which is needed for macrophage development (Nature. 2023, PMID: 36890231; Cell Mol Immunol. 2022, PMID: 36220994), we have stated that on Line 227-230. However, PLX3397 is a small molecule compound that possesses the potential to cross the placental barrier and affect fetal macrophages. We have discussed the impact of this factor on the experiment in the Discussion section (Line457-459).

      Comment 4. Difficulty in distinguishing donor cells from recipient cells in murine single-cell data complicates interpretation.

      Response 4: We thank the reviewers' comments. Upon analysis, we observed a notable elevation in the frequency of total macrophages within the CD45<sup>+</sup> cell population. Then we subsequently performed macrophage clustering and uncovered a marked increase in the frequency of Cluster 0, implying a potential correlation between Cluster 0 and donor-derived cells. RNA sequencing revealed that the F480<sup>+</sup>CD206<sup>-</sup> pro-inflammatory donor macrophages exhibited a Folr2<sup>+</sup>Ccl7<sup>+</sup>Ccl8<sup>+</sup>C1qa<sup>+</sup>C1qb<sup>+</sup>C1qc<sup>+</sup> phenotype, which is consistent with the phenotype of cluster 0 in macrophages observed in single-cell RNA sequencing (Figure 4D and Figure 5E). Therefore, we believe that the donor cells should be cluster 0 in macrophages.

      Comment 5. Limitation of using the LPS model in the final experiments, as it more closely resembles systemic inflammation seen in endotoxemia rather than the specific pathology of PE.

      Response 5: We thank the reviewers' comments. Firstly, our other animal experiments in this manuscript used the Reduction in Uterine Perfusion Pressure (RUPP) mouse model to simulate the pathology of PE. However, the RUPP model requires ligation of the uterine arteries in pregnant mice on day 12.5 of gestation, which hinders T cells returning from the tail vein from reaching the maternal-fetal interface. In addition, this experiment aims to prove that CD4<sup>+</sup> T cells are differentiated into memory-like Th17 cells through IGF-1R receptor signaling to affect pregnancy by clearing CD4<sup>+</sup> T cells in vivo with an anti-CD4 antibody followed by injecting IGF-1R inhibitor-treated CD4<sup>+</sup> T cells. And we proved that injection of RUPP-derived memory-like CD4<sup>+</sup> T cells into pregnant mice induces PE-like symptoms (Figure 6F-6H). In summary, the application of the LPS model in the final experiments does not affect the conclusions.

      Reviewer #2 (Public review):

      Strengths:

      (1) This study combines human and mouse analyses and allows for some amount of mechanistic insight into the role of pro-inflammatory and anti-inflammatory macrophages in the pathogenesis of pre-eclampsia (PE), and their interaction with Th17 cells.

      (2) Importantly, they do this using matched cohorts across normal pregnancy and common PE comorbidities like gestation diabetes (GDM).

      (3) The authors have developed clear translational opportunities from these "big data" studies by moving to pursue potential IGF1-based interventions.

      Weaknesses:

      (1) Clearly the authors generated vast amounts of multi-omic data using CyTOF and single-cell RNA-seq (scRNA-seq), but their central message becomes muddled very quickly. The reader has to do a lot of work to follow the authors' multiple lines of inquiry rather than smoothly following along with their unified rationale. The title description tells fairly little about the substance of the study. The manuscript is very challenging to follow. The paper would benefit from substantial reorganizations and editing for grammatical and spelling errors. For example, RUPP is introduced in Figure 4 but in the text not defined or even talked about what it is until Figure 6. (The figure comparing pro- and anti-inflammatory macrophages does not add much to the manuscript as this is an expected finding).

      Response 1: We thank the reviewers' comments. According to the reviewer's suggestion, we have made the necessary revisions. Firstly, the title of the article has been modified to be more specific. We also introduce the RUPP mouse model when interpreted Figure 4-figure supplement 1. Thirdly, We have moved the images of Figure 7 to the Figure 6-figure supplement 2 make them easier to follow. Finally, we diligently corrected the grammatical and spelling errors in the article. As for the figure comparing pro- and anti-inflammatory macrophages, the Editor requested a more comprehensive description of the macrophage phenotype during the initial submission. As a result, we conducted the transcriptome RNA-seq of both uterine-derived pro-inflammatory and anti-inflammatory macrophages and conducted a detailed analysis of macrophages in scRNA-seq.

      Comment 2. The methods lack critical detail about how human placenta samples were processed. The maternal-fetal interface is a highly heterogeneous tissue environment and care must be taken to ensure proper focus on maternal or fetal cells of origin. Lacking this detail in the present manuscript, there are many unanswered questions about the nature of the immune cells analyzed. It is impossible to figure out which part of the placental unit is analyzed for the human or mouse data. Is this the decidua, the placental villi, or the fetal membranes? This is of key importance to the central findings of the manuscript as the immune makeup of these compartments is very different. Or is this analyzed as the entirety of the placenta, which would be a mix of these compartments and significantly less exciting?

      Response 2: We thank the reviewers' comments. Placental villi rather than fetal membranes and decidua were used for CyToF in this study. This detail about how human placenta samples were processed have been added to the Materials and Methods section (Line564-576).

      Comment 3. Similarly, methods lack any detail about the analysis of the CyTOF and scRNAseq data, much more detail needs to be added here. How were these clustered, what was the QC for scRNAseq data, etc? The two small paragraphs lack any detail.

      Response 3: We thank the reviewers' comments. The details about the analysis of the CyTOF (Line577-586) and scRNAseq (Line600-615) data have been added in the Materials and Methods section.

      Comment 4. There is also insufficient detail presented about the quantities or proportions of various cell populations. For example, gdT cells represent very small proportions of the CyTOF plots shown in Figures 1B, 1C, & 1E, yet in Figures 2I, 2K, & 2K there are many gdT cells shown in subcluster analysis without a description of how many cells are actually represented, and where they came from. How were biological replicates normalized for fair statistical comparison between groups?

      Response 4: We thank the reviewers' comments. In our study, approximately 8×10^<sup>5</sup> cells were collected per group for analysis using CyTOF. Of these, about 10% (8×10^<sup>4</sup> cells per group) were utilized to generate Figure 1B. As depicted in Figure 1B, gdT cells constitute roughly 1% of each group, with specific percentages as follows: NP group (1.23%), PE group (0.97%), GDM group (0.94%), and GDM&PE group (1.26%), which equates to approximately 800 cells per group. For the subsequent gdT cell analysis presented in Figure 2I, we employed data from all cells within each group to construct the tSNE maps, comprising approximately 8000 cells per group. Consequently, it may initially appear that the number of gdT cells is significantly higher than what is shown in Figure 1B. To clarify this, we have included pertinent explanations in the figure legend. Given the relatively low proportions of gdT cells, we did not pursue further investigations of these cells in subsequent experiments. Following your suggestion, we have relocated this result to the supplementary materials, where it is now presented as Figure 2-figure supplement 1D-E.

      The number of biological replicates (samples) is consistent with Figure 1, and this information has been added to the figure legend.

      Comment 5. The figures themselves are very tricky to follow. The clusters are numbered rather than identified by what the authors think they are, the numbers are so small, that they are challenging to read. The paper would be significantly improved if the clusters were clearly labeled and identified. All the heatmaps and the abundance of clusters should be in separate supplementary figures.

      Response 5: We thank the reviewers' comments. Based on your suggestions, we have labeled and defined the Clusters (Figure 2A, 2F, Figure 3A, Figure 5C and Figure 6A). Additionally, we have moved most of the heatmaps to the supplementary materials.

      Comment 6. The authors should take additional care when constructing figures that their biological replicates (and all replicates) are accurately represented. Figure 2H-2K shows N=10 data points for the normal pregnant (NP) samples when clearly their Table 1 and test denote they only studied N=9 normal subjects.

      Response 6: We thank the reviewers' careful checking. During our verification, we found that one sample in the NP group had pregnancy complications other than PE and GDM. The data in Figure 2H-2K was not updated in a timely manner. We have promptly updated this data and reanalyze it.

      Comment 7. There is little to no evaluation of regulatory T cells (Tregs) which are well known to undergird maternal tolerance of the fetus, and which are well known to have overlapping developmental trajectory with RORgt+ Th17 cells. We recommend the authors evaluate whether the loss of Treg function, quantity, or quality leaves CD4+ effector T cells more unrestrained in their effect on PE phenotypes. References should include, accordingly: PMCID: PMC6448013 / DOI: 10.3389/fimmu.2019.00478; PMC4700932 / DOI: 10.1126/science.aaa9420.

      Response 7: We thank the reviewers' comments. We have done the Treg-related animal experiment, which was not shown in this manuscript. We have added the Treg-related data in Figure 6F-6H. The injection of CD4<sup>+</sup>CD44<sup>+</sup> T cells derived from RUPP mouse, characterized by a reduced frequency of Tregs, could induce PE-like symptoms in pregnant mice (Line297-304). Additionally, we have added a necessary discussion about Tregs and cited the literature you mentioned (Line433-439).

      Comment 8. In discussing gMDSCs in Figure 3, the authors have missed key opportunities to evaluate bona fide Neutrophils. We recommend they conduct FACS or CyTOF staining including CD66b if they have additional tissues or cells available. Please refer to this helpful review article that highlights key points of distinguishing human MDSC from neutrophils: https://doi.org/10.1038/s41577-024-01062-0. This will both help the evaluation of potentially regulatory myeloid cells that may suppress effector T cells as well as aid in understanding at the end of the study if IL-17 produced by CD4+ Th17 cells might recruit neutrophils to the placenta and cause ROS immunopathology and fetal resorption.

      Response 8: We thank the reviewers' comments. Although we do not have additional tissues or cells available to conduct FACS or CyTOF staining, including for CD66b, we have utilized CD15 and CD66b antibodies for immunofluorescence stain of placental tissue, and our findings revealed a pronounced increase in the proportion of neutrophils among PE patients, fostering the hypothesis that IL-17A produced by Th17 cells might orchestrate the migration of neutrophils towards the placental milieu (Figure 6-figure supplement 2F; Line 325-328). We have cited these references and discussed them in the Discussion section (Line 459-465).

      Comment 9. Depletion of macrophages using several different methodologies (PLX3397, or clodronate liposomes) should be accompanied by supplementary data showing the efficiency of depletion, especially within tissue compartments of interest (uterine horns, placenta). The clodronate piece is not at all discussed in the main text. Both should be addressed in much more detail.

      Response 9: We thank the reviewers' comments. We already have the additional data on the efficiency of macrophage depletion involving PLX3397 and clodronate liposomes, which were not present in this manuscript, and we'll add it to the Figure 4-figure supplement 2A,2B. The clodronate piece is mentioned in the main text (Line236-239), but only briefly described, because the results using clodronate we obtained were similar to those using PLX3397.

      Comment 10. There are many heatmaps and tSNE / UMAP plots with unhelpful labels and no statistical tests applied. Many of these plots (e.g. Figure 7) could be moved to supplemental figures or pared down and combined with existing main figures to help the authors streamline and unify their message.

      Response 10: We thank the reviewers' comments. We have moved the images of Figure 7 to the Figure 6-figure supplement 2. We also have moved most of the heatmaps to the supplementary materials.

      Comment 11. There are claims that this study fills a gap that "only one report has provided an overall analysis of immune cells in the human placental villi in the presence and absence of spontaneous labor at term by scRNA-seq (Miller 2022)" (lines 362-364), yet this study itself does not exhaustively study all immune cell subsets...that's a monumental task, even with the two multi-omic methods used in this paper. There are several other datasets that have performed similar analyses and should be referenced.

      Response 11: We thank the reviewers' comments. We have search for more literature and reference additional studies that have conducted similar analyses (Line382-393).

      Comment 12. Inappropriate statistical tests are used in many of the analyses. Figures 1-2 use the Shapiro-Wilk test, which is a test of "goodness of fit", to compare unpaired groups. A Kruskal-Wallis or other nonparametric t-test is much more appropriate. In other instances, there is no mention of statistical tests (Figures 6-7) at all. Appropriate tests should be added throughout.

      Response 12: We thank the reviewers' comments. As stated in the Statistical Analysis section (lines 672-676), the Kruskal-Wallis test was used to compare the results of experiments with multiple groups. Comparisons between the two groups in Figures 5 were conducted using Student's t-test. The aforementioned statistical methods have been included in the figure legends.

      Recommendations for the authors:

      Reviewer #1 (Recommendations for the authors):

      Overall, the study has several strengths, including the use of human samples and animal models, as well as the incorporation of multiple cutting-edge techniques. However, there are some significant issues with the murine model experiments that need to be addressed:

      Comment 1. The authors are not consistent in their use of or focus on uterine and placental cells. These are distinct tissues, and numerous prior reports have indicated differences in the macrophage populations of these tissues, due in part to the predominantly maternal origin of macrophages in the uterus and the largely fetal origin of those in the placenta. The rationale for switching between uterine and placental cells in different experiments is not clear, and the inclusion of cells from both (such as in the bulk RNAseq experiments) could be potentially confounding.

      Response 1: We thank the reviewers' comments. We have done the green fluorescent protein (GFP) pregnant mice-related animal experiment, which was not shown in this manuscript. The wild-type (WT) female mice were mated with either transgenic male mice, genetically modified to express GFP, or with WT male mice, in order to generate either GFP-expressing pups (GFP-pups) or their genetically unmodified counterparts (WT-pups), respectively. Mice were euthanized on day 18.5 of gestation, and the uteri of the pregnant females and the placentas of the offspring were analyzed using flow cytometry. The majority of macrophages in the uterus and placenta are of maternal origin, which was defined by GFP negative. In contrast, fetal-derived macrophages, distinguished by their expression of GFP, represent a mere fraction of the total macrophage population, signifying their inconsequential or restricted presence amidst the broader cellular landscape. We have added the GPF pregnant mice-related data in Figure 4-figure supplement 1D-1E to explain the different macrophage populations in the uterine and placental cells.

      Comment 2. The observational data for the initial experiment transferring RUPP-derived macrophages to normal pregnant mice (without any other manipulations) seems to be missing. They do not seem to be presented in Figure 4 where they are expected based on the results text.

      Response 2: We thank the reviewers' comments. We thank the reviewers' comments. We have added the observational data (Figure 4-figure supplement 1D, 1E) and a corresponding description of the data (Line 198-203).

      Comment 3. The action of the anti-macrophage compounds is not well explained, nor are their mechanisms validated as affecting or not affecting the placental/fetal macrophage populations. It is important to clarify whether the macrophages are depleted or merely inhibited by these treatments, and it is absolutely critical to determine whether these treatments are affecting placental/fetal macrophage populations (the latter indicative of placental transfer), given the focus on placental macrophages.

      Response 3: We thank the reviewers' comments. PLX3397, the inhibitor of CSF1R, which is needed for macrophage development (Nature. 2023, PMID: 36890231; Cell Mol Immunol. 2022, PMID: 36220994), we have stated that on Line227-230. However, PLX3397 is a small molecule compound that possesses the potential to cross the placental barrier and affect fetal macrophages. We will discuss the impact of this factor on the experiment in the Discussion section (Line457-459).

      Comment 4. The interpretation of the murine single-cell data is hampered by the lack of means for distinguishing donor cells from recipient cells, which is important when seeking to identify the influence of the donor cells.

      Response 4: We thank the reviewers' comments. Upon analysis, we observed a notable elevation in the frequency of total macrophages within the CD45<sup>+</sup> cell population. Then we subsequently per formed macrophage clustering and uncovered a marked increase in the frequency of Cluster 0, implying a potential correlation between Cluster 0 and donor-derived cells. RNA sequencing revealed that the F480<sup>+</sup>CD206<sup>-</sup> pro-inflammatory donor macrophages exhibited a Folr2<sup>+</sup>Ccl7<sup>+</sup>Ccl8<sup>+</sup>C1qa<sup>+</sup>C1qb<sup>+</sup>C1qc<sup>+</sup> phenotype, which is consistent with the phenotype of cluster 0 in macrophages observed in single-cell RNA sequencing (Figure 4D and Figure 5E). Therefore, the donor cells should be in cluster 0 in macrophages.

      Comment 5. The switch to the LPS model in the final experiments is a limitation, as this model more closely resembles the systemic inflammation seen in endotoxemia rather than the specific pathology of preeclampsia (PE). While this is not an exhaustive list, the number of weaknesses in the experimental design makes it difficult to evaluate the findings comprehensively.

      Response 5: We thank the reviewers' comments. Firstly, our other animal experiments in this manuscript used the RUPP mouse model to simulate the pathology of PE. However, the RUPP model requires ligation of the uterine arteries in pregnant mice on day 12.5 of gestation, which hinders T cells returning from the tail vein from reaching the maternal-fetal interface. In addition, this experiment aims to prove that CD4<sup>+</sup> T cells are differentiated into memory-like Th17 cells through IGF-1R receptor signaling to affect pregnancy by clearing CD4<sup>+</sup> T cells in vivo with an anti-CD4 antibody followed by injecting IGF-1R inhibitor-treated CD4<sup>+</sup> T cells. We proved that injection of RUPP-derived memory-like CD4<sup>+</sup> T cells into pregnant rats induces PE-like symptoms (Figure 6F-6H). In summary, applying the LPS model in the final experiments does not affect the conclusions.

      Minor comments:

      Comment 1. Introduction, Lines 67-74: The phrasing here is unclear as to the roles that each mentioned immune cell subset is playing in preeclampsia. Given the statement "Elevated levels of maternal inflammation...", does this imply that the numbers of all mentioned immune cell subsets are increased in the maternal circulation? If not, please consider rewording this.

      Response 1: We thank the reviewers' comments. We have revised the manuscript as follows: Currently, the pivotal mechanism underpinning the pathogenesis of preeclampsia is widely acknowledged to involve an increased frequency of pro-inflammatory M1-like maternal macrophages, along with an elevation in Granulocytes capable of superoxide generation, CD56<sup>+</sup> CD94<sup>+</sup> natural killer (NK) cells, CD19<sup>+</sup>CD5<sup>+</sup> B1 lymphocytes, and activated γδ T cells. Conversely, this pathological process is accompanied by a notable decrease in the frequency of anti-inflammatory M2-like macrophages and NKp46<sup>+</sup> NK cells (Line67-77).

      Comment 2. Introduction, Lines 67-80: Is the involvement of the described immune cell subsets largely ubiquitous to preeclampsia? Recent multi-omic studies suggest that preeclampsia is a heterogeneous condition with different subsets, some more biased towards systemic immune activation than others. Thus, it is important to clarify whether the involvement of specific immune subsets is generally observed or more specific.

      Response 2: We thank the reviewers' comments. We have added a new paragraph as follows: Moreover, as PE can be subdivided into early- and late-onset PE diagnosed before 34 weeks or from 34 weeks of gestation, respectively. Research has revealed that among the myriad of cellular alterations in PE, pro-inflammatory M1-like macrophages and intrauterine B1 cells display an augmented presence at the maternal-fetal interface of both early-onset and late-onset PE patients. Decidual natural killer (dNK) cells and neutrophils emerge as paramount contributors, playing a more crucial role in the pathogenesis of early-onset PE than late-onset PE (Front Immunol. 2020. PMID: 33013837) (Line83-89).

      Comment 3. Introduction, Lines 81-86: The point of this short paragraph is not clear; the authors mention two very specific cellular interactions without explaining why.

      Response 3: In the previous paragraph, we uncovered a heightened inflammatory response among multiple immune cells in patients with PE, yet the intricate interplay between these individual immune cells has been seldom elucidated in the context of PE patient. This is precisely why we delve into the realm of specific immune cellular interactions in relation to other pregnancy complications in this paragraph (Line91-98).

      Comment 4. Methods: What placental tissues (e.g., villous tree, chorionic plate, extraplacental membranes) were included for CyTOF analysis? Was any decidual tissue (e.g., basal plate) included? Please clarify.

      Response 4: Placental villi rather than chorionic plate and extraplacental membranes were used for CyToF in this study. The relevant content has been incorporated into the "Materials and Methods" section (Line564-576).

      Comment 5. Results, Table 1: The authors should clarify that all PE samples were not full term (i.e., were less than 37 weeks of gestation), which is to be expected. In addition, were the PE cases all late-onset PE?

      Response 5: All PE samples enumerated in Table 1 demonstrate a late-onset preeclampsia, with placental specimens being procured from patients more than 35 weeks of gestation and less than the 38 weeks of pregnancy. The relevant content has been incorporated into the "Materials and Methods" section (Line574-576).

      Comment 6. Results, Figure 1: Are the authors considering the identified Macrophage cluster as being largely fetal (e.g., Hofbauer cells)? This also depends on whether any decidual tissue was included in the placental samples for CyTOF.

      Response 6: Firstly, the specimens subjected to CyToF analysis were devoid of decidual tissue and exclusively comprised placental villi. Secondly, the Macrophage cluster in Figure 1 undeniably encompasses Hofbauer cells, and we considering fetal-derived macrophages likely constituting the substantial proportion of the cellular population. However, a limitation of the CyToF technique lies in its inability to discern between maternal and fetal origins of these cells, thereby precluding a definitive distinction.

      Comment 7. Results, Figure 2C: Did the authors validate other T-cell subset markers (e.g., Th1, Th2, Th9, etc.)?

      Response 7: In this study, we did not validate additional T-cell subset markers presented in Figure 2C, recognizing the potential for deeper insights. As we embark on our subsequent research endeavors, we aim to meticulously explore and characterize the intricate changes in diverse T-cell populations at the maternal-fetal interface, with a particular focus on preeclampsia patients, thereby advancing our understanding of this complex condition.

      Comment 8. Results, Figure 2D: Where were the detected memory-like T cells located in the placenta? Did they cluster in certain areas or were they widely distributed?

      Response 8: Upon a thorough re-evaluation of the immunofluorescence images specific to the placenta, we observed a notable preponderance of memory-like T cells residing within the placental sinusoids (Line135-139).

      Comment 9. Results, Figure 2E: I would suggest separating the two plots so that the Y-axis can be expanded for TIM3, as it is impossible to view the medians currently.

      Response 9: We thank the reviewers' comments. We have made the adjustment to Figure 2E according to the reviewers' suggestions.

      Comment 10. Results, Lines 138-140: Do the authors consider that the altered T-cells are largely resident cells of the placenta or newly invading/recruited cells? The clarification of distribution within the placental tissues as mentioned above would help answer this.

      Response 10: Our analysis revealed the presence of memory-like T cells within the placental sinusoids, as evident from the immunofluorescence examination of placental tissues. Consequently, these T cells may represent recently recruited cellular entities, traversing the placental vasculature and integrating into this unique maternal-fetal microenvironment (Line135-139).

      Comment 11. Results, Figure 3C: Has a reduction of gMDSCs (or MDSCs in general) been previously reported in PE?

      Response 11: Myeloid-derived suppressor cells (MDSCs) constitute a diverse population of myeloid-derived cells that exhibit immunosuppressive functions under various conditions. Previous reports have documented a decrease in the levels of gMDSCs from peripheral blood or umbilical cord blood among patients with preeclampsia (Am J Reprod Immunol. 2020, PMID: 32418253; J Reprod Immunol. 2018, PMID: 29763854; Biol Reprod. 2023, PMID: 36504233). Nevertheless, there was no documented reports thus far on the alterations and specific characteristics in gMDSCs within the placenta of PE patients.

      Comment 12. Results, Figure 3D-E: It is not clear what new information is added by the correlations, as the increase of both cluster 23 in CD11b+ cells and cluster 8 in CD4+ T cells in PE cases was already apparent. Are these simply to confirm what was shown from the quantification data?

      Response 12: Despite the evident increase in both cluster 23 within CD11b<sup>+</sup> cells and cluster 8 within CD4<sup>+</sup> T cells in PE cases, the existence of a potential correlation between these two clusters remains elusive. To gain insight into this question, we conducted a Pearson correlation analysis, which is presented in Figure 3D-E, revealing a positive correlation between the two clusters.

      Comment 13. Results, Figure 4A: Please clarify in the results text that the RNA-seq of macrophages from RUPP mice was performed prior to their injection into normal pregnant mice.

      Response 13: We thank the reviewers' comments. We have updated Figure 4A according to the reviewers' suggestions.

      Comment 14. Results / Methods, Figure 4: For the transfer of macrophages from RUPP mice into normal mice, why were the uterine tissues included to isolate cells? The uterine macrophages will be almost completely maternal, as opposed to the largely fetal placental macrophages, and despite the sorting for specific markers these are likely distinct subsets that have been combined for injection. This could potentially impact the differential gene expression analysis and should be accounted for. In addition, did murine placental samples include decidua? This should be clarified.

      Response 14: We thank the reviewers' comments. For our experimental design involving human samples, we meticulously selected placental tissue as the primary focus. Initially, we aimed for uniformity by contemplating the utilization of mouse placenta. However, a pivotal revelation emerged from the GFP pregnant mice-related data in Figure 4-figure supplement 1D,1E: the uterus and placenta of mice are predominantly populated by maternal macrophages, with fetal macrophages virtually absent, marking a notable divergence from the human scenario. Furthermore, the uterine milieu exhibits a macrophage concentration exceeding 20% of total cellular composition, whereas in the placenta, this proportion dwindles to less than 5%, underscoring a distinct distribution pattern. Given these discrepancies and considerations, we incorporated mouse uterine tissues into our protocol to isolate cells, ensuring a more comprehensive and informative exploration that acknowledges the inherent differences between human and mouse placental biology.

      Comment 15. Results, Lines 186-187: I think the figure citation should be Figure 4D here.

      Response 15: We thank the reviewers' careful checking. We have revised and updated Figure 4 accordingly.

      Comment 16. Results, Figure 4: Where are the results of the injection of anti-inflammatory and pro-inflammatory macrophages into normal mice? This experiment is mentioned in Figure 4A, but the only results shown in Figure 4 are with the PLX3397 depletion.

      Response 16: The aim of this experiment in figure 4 is to conclusively ascertain the influence of pro-inflammatory and anti-inflammatory macrophages on the other immune cells within the maternal-fetal interface, as well as their implications for pregnancy outcomes. To achieve this, we employed a strategic approach involving the administration of PLX3397, a compound capable of eliminating the preexisting macrophages in mice. Subsequently, anti-inflam or pro-inflam macrophages were injected to these mice, thereby eliminating the confounding influence of the native macrophage population. This methodology allows for a more discernible observation of the specific effects these two types of macrophages exert on the immune landscape at the maternal-fetal interface and their ultimate impact on pregnancy outcomes.

      Comment 17. Results, Lines 189-190: Does PLX3397 inhibit macrophage development/signaling/etc. or result in macrophage depletion? This is an important distinction. If depletion is induced, does this affect placental/fetal macrophages or just maternal macrophages?

      Response 17: We thank the reviewers' comments. We have updated the additional data on the efficiency of macrophage depletion involving PLX3397 in Figure 4-figure supplement 2A. PLX3397 is a small molecule compound that possesses the potential to cross the placental barrier and affect fetal macrophages. We have discussed the impact of this factor on the experiment in the Discussion section (Line457-459).

      Comment 18. Results, Lines 197-198: Similarly, does clodronate liposome administration affect only maternal macrophages, or also placental/fetal macrophages?

      Response 18: We thank the reviewers' comments. We have updated the additional data on the efficiency of macrophage depletion involving Clodronate Liposomes in Figure 4-figure supplement 2B. Clodronate Liposomes, which are intricate vesicles encapsulating diverse substances, while only small molecule compounds possess the potential to cross the placental barrier. Consequently, we hold the view that the influence of these liposomes is likely confined to the maternal macrophages (Artif Cells Nanomed Biotechnol. 2023. PMID: 37594208).  

      Comment 19. Results, Line 206: A minor point, but consider continuing to refer to the preeclampsia model mice as RUPP mice rather than PE mice.

      Response 19: We thank the reviewers' comments. We have revised and updated this section accordingly.

      Comment 20. Results / Methods, Figure 5: For these experiments, why did the authors focus on the mouse uterus?

      Response 20: We have previously addressed this query in our Response 14. We incorporated mouse uterine tissues for cell isolation due to the profound differences in placental biology between humans and mice.

      Comment 21. Results, Figure 5: Did the authors have a means of distinguishing the transferred donor cells from the recipient cells for their single-cell analysis? If the goal is to separate the effects of the macrophage transfer on other uterine immune cells, then it would be important to identify and separate the donor cells.

      Response 21: We thank the reviewers' comments. Upon analysis, we observed a notable elevation in the frequency of total macrophages within the CD45<sup>+</sup> cell population. Then we subsequently performed macrophage clustering and uncovered a marked increase in the frequency of Cluster 0, implying a potential correlation between Cluster 0 and donor-derived cells. RNA sequencing revealed that the F480<sup>+</sup>CD206<sup>-</sup> pro-inflammatory donor macrophages exhibited a Folr2<sup>+</sup>Ccl7<sup>+</sup>Ccl8<sup>+</sup>C1qa<sup>+</sup>C1qb<sup>+</sup>C1qc<sup>+</sup> phenotype, which is consistent with the phenotype of cluster 0 in macrophages observed in single-cell RNA sequencing (Figure 4D and Figure 5E). Therefore, the donor cells should be in cluster 0 in macrophages.

      Comment 22. Results, Lines 247-248: While the authors have prudently noted that the observed T-cell phenotypes are merely suggestive of immunosuppression, any claims regarding changes in the immunosuppressive function after macrophage transfer would require functional studies of the T cells.

      Response 22: We thank the reviewers' comments. Upon revisiting and meticulously reviewing the pertinent literature, we have refined our terminology, transitioning from 'immunosuppression' to 'immunomodulation', thereby enhancing the accuracy and precision of our Results (Line285-287).

      Comment 23. Results, Figure 6G: The observation of worsened outcomes and PE-like symptoms after T-cell transfer is interesting, but other models of PE induced by the administration of Th1-like cells have already been reported. Are the authors' findings consistent with these reports? These findings are strengthened by the evaluation of second-pregnancy outcomes following the transfer of T cells in the first pregnancy.

      Response 23: We thank the reviewers' comments. As we verified in Figure 6F-6H, the injection of CD4<sup>+</sup>CD44<sup>+</sup> T cells derived from RUPP mouse, characterized by a reduced frequency of Tregs and an increased frequency of Th17 cells, could induce PE-like symptoms in pregnant mice. In line with other studies, which have implicated Th1-like cells in the manifestation of PE-like symptoms, we posit a novel hypothesis: beyond Th1 cells, Th17 cells also have the potential to induce PE-like symptoms.

      Comment 24. Results, Lines 327-337: The disease model implied by the authors here is not clear. Given that the authors' human findings are in the placental macrophages, are the authors proposing that placental macrophages are induced to an M1 phenotype by placenta-derived EVs? Please elaborate on and clarify the proposed model.

      Response 24 In the article authored by our team, titled "Trophoblast-Derived Extracellular Vesicles Promote Preeclampsia by Regulating Macrophage Polarization" published in Hypertension (Hypertension. 2022, PMID: 35993233), we employed trophoblast-derived extracellular vesicles isolated from PE patients as a means to induce an M1-like macrophage phenotype in macrophages from human peripheral blood in vitro. Consequently, in the present study, we have directly leveraged this established methodology to induce pro-inflammatory macrophages.

      Comment 25. Results / Methods, Figure 8E-H: What is the reasoning for switching to an LPS model in this experiment? LPS is less specific to PE than the RUPP model.

      Response 25: We thank the reviewers' comments. Firstly, our other animal experiments in this manuscript used the RUPP mouse model to simulate the pathology of PE. However, the RUPP model requires ligation of the uterine arteries in pregnant mice on day 12.5 of gestation, which hinders T cells returning from the tail vein from reaching the maternal-fetal interface. In addition, this experiment aims to prove that CD4<sup>+</sup> T cells are differentiated into memory-like Th17 cells through IGF-1R receptor signaling to affect pregnancy by clearing CD4<sup>+</sup> T cells in vivo with an anti-CD4 antibody followed by injecting IGF-1R inhibitor-treated CD4<sup>+</sup> T cells. And we proved that injection of RUPP-derived memory-like CD4<sup>+</sup> T cells into pregnant mice induces PE-like symptoms (Figure 6). In summary, the application of the LPS model in the final experiments does not affect the conclusions.

      Comment 26. Discussion: What do the authors consider to be the origins of the inflammatory cells associated with PE onset? Are these maternal cells invading the placental tissues, or are these placental resident (likely fetal) cells?

      Response 26: We thank the reviewers' comments. Numerous reports have consistently observed the presence of inflammatory cells and factors in the maternal peripheral blood and placenta tissues of PE patients, fostering the prevailing notion that the progression of PE is intricately linked to the maternal immune system's inflammatory response towards the fetus. Nevertheless, intriguing findings from single-cell RNA sequencing, analyzed through bioinformatic methods, have challenged this perspective (Elife. 2019. PMID: 31829938;Proc Natl Acad Sci U S A. 2017.PMID: 28830992). These studies reveal that the placenta harbors not just immune cells of maternal origin but also those of fetal origin, raising questions about whether these are maternal cells infiltrating placental tissues or resident (possibly fetal) placental cells. Further investigation is imperative to elucidate this complex interplay.

      Comment 27. Discussion: Given the observed lack of changes in the GDM or GDM+PE groups, do the authors consider that GDM represents a distinct pathology that can lead to secondary PE, and thus is different from primary PE without GDM?

      Response 27: It's possible. Though previous studies reported GDM is associated with aberrant maternal immune cell adaption the findings remained controversial. It seems that GDM does not induce significant alterations in placental immune cell profile in our study, which made us pay more attention to the immune mechanism in PE. However, it is confusing for the reasons why individuals with GDM&PE were protected from the immune alterations at the maternal fetal interface. Limited placental samples in the GDM&PE group can partly explain it, for it is hard to collect clean samples excluding confounding factors. A study reported that macrophages in human placenta maintained anti-inflammatory properties despite GDM (Front Immunol, 2017, PMID: 28824621).Barke et al. also found that more CD163<sup>+</sup> cells were observed in GDM placentas compared to normal controls (PLoS One, 2014, PMID: 24983948). Thus, GDM is likely to have a protective property in the placental immune environment when the individuals are complicated with PE.

      Reviewer #2 (Recommendations for the authors):

      Comment 1. IF images need to be quantified.

      Response 1: We thank the reviewers' comments. We have quantified and calculated the fluorescence intensity and added it in Figure 2D.

      Comment 2. Cluster 12 in Figure 3 is labeled as granulocytes but listed under macrophages.

      Response 2: We thank the reviewers' careful checking. We have revised and updated Figure 3A.

      Comment 3. Figure 4 labels in the text and figure do not match, no 4G in the figure.

      Response 3: We thank the reviewers' careful checking. The figure labels of Figure 4 have been revised and updated.

    1. Author response:

      We thank the reviewers for their thorough reading and thoughtful feedback. Below, we provisionally address each of the concerns raised in the public reviews, and outline our planned revision that aims to further clarify and strengthen the manuscript.

      In our response, we clarify our conceptualization of elasticity as a dimension of controllability, formalizing it within an information-theoretic framework, and demonstrating that controllability and its elasticity are partially dissociable. Furthermore, we provide clarifications and additional modeling results showing that our experimental design and modeling approach are well-suited to dissociating elasticity inference from more general learning processes, and are not inherently biased to find overestimates of elasticity. Finally, we clarify the advantages and disadvantages of our canonical correlation analysis (CCA) approach for identifying latent relationships between multidimensional data sets, and provide additional analyses that strengthen the link between elasticity estimation biases and a specific psychopathology profile.

      Reviewer 1:

      This research takes a novel theoretical and methodological approach to understanding how people estimate the level of control they have over their environment, and how they adjust their actions accordingly. The task is innovative and both it and the findings are well-described (with excellent visuals). They also offer thorough validation for the particular model they develop. The research has the potential to theoretically inform the understanding of control across domains, which is a topic of great importance.

      We thank the reviewer for their favorable appraisal and valuable suggestions, which have helped clarify and strengthen the study’s conclusion. 

      An overarching concern is that this paper is framed as addressing resource investments across domains that include time, money, and effort, and the introductory examples focus heavily on effort-based resources (e.g., exercising, studying, practicing). The experiments, though, focus entirely on the equivalent of monetary resources - participants make discrete actions based on the number of points they want to use on a given turn. While the same ideas might generalize to decisions about other kinds of resources (e.g., if participants were having to invest the effort to reach a goal), this seems like the kind of speculation that would be better reserved for the Discussion section rather than using effort investment as a means of introducing a new concept (elasticity of control) that the paper will go on to test.

      We thank the reviewer for pointing out a lack of clarity regarding the kinds of resources tested in the present experiment. Investing additional resources in the form of extra tickets did not only require participants to pay more money. It also required them to invest additional time – since each additional ticket meant making another attempt to board the vehicle, extending the duration of the trial, and attentional effort – since every attempt required precisely timing a spacebar press as the vehicle crossed the screen. Given this involvement of money, time, and effort resources, we believe it would be imprecise to present the study as concerning monetary resources in particular. That said, we agree with the Reviewer that results might differ depending on the resource type that the experiment or the participant considers most. Thus, in our revision of the manuscript, we will make sure to clarify the kinds of resources the experiment involved, and highlight the open question of whether inferences concerning the elasticity of control generalize across different resource domains.

      Setting aside the framing of the core concepts, my understanding of the task is that it effectively captures people's estimates of the likelihood of achieving their goal (Pr(success)) conditional on a given investment of resources. The ground truth across the different environments varies such that this function is sometimes flat (low controllability), sometimes increases linearly (elastic controllability), and sometimes increases as a step function (inelastic controllability). If this is accurate, then it raises two questions.

      First, on the modeling front, I wonder if a suitable alternative to the current model would be to assume that the participants are simply considering different continuous functions like these and, within a Bayesian framework, evaluating the probabilistic evidence for each function based on each trial's outcome. This would give participants an estimate of the marginal increase in Pr(success) for each ticket, and they could then weigh the expected value of that ticket choice (Pr(success)*150 points) against the marginal increase in point cost for each ticket. This should yield similar predictions for optimal performance (e.g., opt-out for lower controllability environments, i.e., flatter functions), and the continuous nature of this form of function approximation also has the benefit of enabling tests of generalization to predict changes in behavior if there was, for instance, changes in available tickets for purchase (e.g., up to 4 or 5) or changes in ticket prices. Such a model would of course also maintain a critical role for priors based on one's experience within the task as well as over longer timescales, and could be meaningfully interpreted as such (e.g., priors related to the likelihood of success/failure and whether one's actions influence these). It could also potentially reduce the complexity of the model by replacing controllability-specific parameters with multiple candidate functions (presumably learned through past experience, and/or tuned by experience in this task environment), each of which is being updated simultaneously.

      Second, if the reframing above is apt (regardless of the best model for implementing it), it seems like the taxonomy being offered by the authors risks a form of "jangle fallacy," in particular by positing distinct constructs (controllability and elasticity) for processes that ultimately comprise aspects of the same process (estimation of the relationship between investment and outcome likelihood). Which of these two frames is used doesn't bear on the rigor of the approach or the strength of the findings, but it does bear on how readers will digest and draw inferences from this work. It is ultimately up to the authors which of these they choose to favor, but I think the paper would benefit from some discussion of a common-process alternative, at least to prevent too strong of inferences about separate processes/modes that may not exist. I personally think the approach and findings in this paper would also be easier to digest under a common-construct approach rather than forcing new terminology but, again, I defer to the authors on this.

      We thank the reviewer for suggesting this interesting alternative modeling approach. We agree that a Bayesian framework evaluating different continuous functions could offer advantages, particularly in its ability to generalize to other ticket quantities and prices. We will attempt to implement this as an alternative model and compare it with the current model.  

      We also acknowledge the importance of avoiding a potential "jangle fallacy". We entirely agree with the Reviewer that elasticity and controllability inferences are not distinct processes. Specifically, we view resource elasticity as a dimension of controllability, hence the name of our ‘elastic controllability’ model. In response to this and other Reviewers’ comments, we now offer a formal definition of elasticity as the reduction in uncertainty about controllability due to knowing the amount of resources the agent is able and willing to invest (see further details in response to Reviewer 3 below).  

      With respect to how this conceptualization is expressed in the modelling, we note that the representation in our model of maximum controllability and its elasticity via different variables is analogous to how a distribution may be represented by separate mean and variance parameters. Ultimately, even in the model suggested by the Reviewer, there would need to be a dedicated variable representing elasticity, such as the probability of sloped controllability functions. A single-process account thus allows that different aspects of this process would be differently biased (e.g., one can have an accurate estimate of the mean of a distribution but overestimate its variance). Therefore, our characterization of distinct elasticity and controllability biases (or to put it more accurately, ‘elasticity of controllability bias’ and ‘maximum controllability bias’) is consistent with a common construct account. 

      That said, given the Reviewer’s comments, we believe that some of the terminology we used may have been misleading. In our planned revision, we will modify the text to clarify that we view elasticity as a dimension of controllability that can only be estimated in conjunction with controllability. 

      Reviewer 2:

      This research investigates how people might value different factors that contribute to controllability in a creative and thorough way. The authors use computational modeling to try to dissociate "elasticity" from "overall controllability," and find some differential associations with psychopathology. This was a convincing justification for using modeling above and beyond behavioral output and yielded interesting results. Interestingly, the authors conclude that these findings suggest that biased elasticity could distort agency beliefs via maladaptive resource allocation. Overall, this paper reveals some important findings about how people consider components of controllability.

      We appreciate the Reviewer's positive assessment of our findings and computational approach to dissociating elasticity and overall controllability.

      The primary weakness of this research is that it is not entirely clear what is meant by "elastic" and "inelastic" and how these constructs differ from existing considerations of various factors/calculations that contribute to perceptions of and decisions about controllability. I think this weakness is primarily an issue of framing, where it's not clear whether elasticity is, in fact, theoretically dissociable from controllability. Instead, it seems that the elements that make up "elasticity" are simply some of the many calculations that contribute to controllability. In other words, an "elastic" environment is inherently more controllable than an "inelastic" one, since both environments might have the same level of predictability, but in an "elastic" environment, one can also partake in additional actions to have additional control overachieving the goal (i.e., expend effort, money, time).

      We thank the reviewer for highlighting the lack of clarity in our concept of elasticity. We first clarify that elasticity cannot be entirely dissociated from controllability because it is a dimension of controllability. If no controllability is afforded, then there cannot be elasticity or inelasticity. This is why in describing the experimental environments, we only label high-controllability, but not low-controllability, environments as ‘elastic’ or ‘inelastic’. For further details on this conceptualization of elasticity, and a planned revision of the text, see our response above to Reviewer 1. 

      Second, we now clarify that controllability can also be computed without knowing the amount of resources the agent is able and willing to invest, for instance by assuming infinite resources available or a particular distribution of resource availabilities. However, knowing the agent’s available resources often reduces uncertainty concerning controllability. This reduction in uncertainty is what we define as elasticity. Since any action requires some resources, this means that no controllable environment is entirely inelastic if we also consider agents that do not have enough resources to commit any action. However, even in this case environments can differ in the degree to which they are elastic. For further details on this formal definition, see our response to Reviewer 3 below. We will make these necessary clarifications in the revised manuscript. 

      Importantly, whether an environment is more or less elastic does not determine whether it is more or less controllable. In particular, environments can be more controllable yet less elastic. This is true even if we allow that investing different levels of resources (i.e., purchasing 0, 1, 2, or 3 tickets) constitute different actions, in conjunction with participants’ vehicle choices. Below, we show this using two existing definitions of controllability. 

      Definition 1, reward-based controllability<sup>1</sup>: If control is defined as the fraction of available reward that is controllably achievable, and we assume all participants are in principle willing and able to invest 3 tickets, controllability can be computed in the present task as:

      where P(S' \= goal ∣ 𝑆, 𝐴, 𝐶 ) is the probability of reaching the treasure from present state 𝑆 when taking action A and investing C resources in executing the action. In any of the task environments, the probability of reaching the goal is maximized by purchasing 3 tickets (𝐶 = 3) and choosing the vehicle that leads to the goal (𝐴 = correct vehicle). Conversely, the probability of reaching the goal is minimized by purchasing 3 tickets (𝐶 = 3) and choosing the vehicle that does not lead to the goal (𝐴 = wrong vehicle). This calculation is thus entirely independent of elasticity, since it only considers what would be achieved by maximal resource investment, whereas elasticity consists of the reduction in controllability that would arise if the maximal available 𝐶 is reduced. Consequently, any environment where the maximum available control is higher yet varies less with resource investment would be more controllable and less elastic. 

      Note that if we also account for ticket costs in calculating reward, this will only reduce the fraction of achievable reward and thus the calculated control in elastic environments.   

      Definition 2, information-theoretic controllability<sup>2</sup>: Here controllability is defined as the reduction in outcome entropy due to knowing which action is taken:

      I(S'; A, C | S) = H(S'|S) - H(S'|S, A, C)

      where H(S'|S) is the conditional entropy of the distribution of outcomes S' given the present state 𝑆, and H(S'|S, A, C) is the conditional entropy of the outcome given the present state, action, and resource investment. 

      To compare controllability, we consider two environments with the same maximum control:

      • Inelastic environment: If the correct vehicle is chosen, there is a 100% chance of reaching the goal state with 1, 2, or 3 tickets. Thus, out of 7 possible action-resource investment combinations, three deterministically lead to the goal state (≥1 tickets and correct vehicle choice), three never lead to it (≥1 tickets and wrong vehicle choice), and one (0 tickets) leads to it 20% of the time (since walking leads to the treasure on 20% of trials).

      • Elastic Environment: If the correct vehicle is chosen, the probability of boarding it is 0% with 1 ticket, 50% with 2 tickets, and 100% with 3 tickets. Thus, out of 7 possible actionresource investment combinations, one deterministically leads to the goal state (3 tickets and correct vehicle choice), one never leads to it (3 tickets and wrong vehicle choice), one leads to it 60% of the time (2 tickets and correct vehicle choice: 50% boarding + 50% × 20% when failing to board), one leads to it 10% of time (2 ticket and wrong vehicle choice), and three lead to it 20% of time (0-1 tickets).

      Here we assume a uniform prior over actions, which renders the information-theoretic definition of controllability equal to another definition termed ‘instrumental divergence’3,4. We note that changing the uniform prior assumption would change the results for the two environments, but that would not change the general conclusion that there can be environments that are more controllable yet less elastic. 

      Step 1: Calculating H(S'|S)

      For the inelastic environment:

      P(goal) = (3 × 100% + 3 × 0% + 1 × 20%)/7 = .46, P(non-goal) = .54  H(S'|S) = – [.46 × log<sub>2</sub>(.46) + .54 × log<sub>2</sub>(.54)] \= 1 bit

      For the elastic environment:

      P(goal) \= (1 × 100% + 1 × 0% + 1 × 60% + 1 × 10% + 3 × 20%)/7 \= .33, P(non-goal) \= .67  H(S'|S) = – [.33 × log<sub>2</sub>(.33) + .67 × log<sub>2</sub>(.67)] \= .91 bits

      Step 2: Calculating H(S'|S, A, C)

      Inelastic environment: Six action-resource investment combinations have deterministic outcomes entailing zero entropy, whereas investing 0 tickets has a probabilistic outcome (20%). The entropy for 0 tickets is: H(S'|C \= 0) \= -[.2 × log<sub>2</sub>(.2) + 0.8 × log<sub>2</sub> (.8)] = .72 bits. Since this actionresource investment combination is chosen with probability 1/7, the total conditional entropy is approximately .10 bits

      Elastic environment: 2 actions have deterministic outcomes (3 tickets with correct/wrong vehicle), whereas the other 5 actions have probabilistic outcomes:

      2 tickets and correct vehicle (60% success): 

      H(S'|A = correct, C = 2) = – [.6 × log<sub>2</sub>(.6) + .4 × log<sub>2</sub>(.4)] \= .97 bits 2 tickets and wrong vehicle (10% success): 

      H(S'|A = wrong, C = 2) = – [.1 × <sub>2</sub>(.1) + .9 × <sub>2</sub>(.9)] \= .47 bits 0-1 tickets (20% success):

      H(S'|C = 0-1) = – [.2 × <sub>2</sub>(.2) + .8 × <sub>2</sub> .8)] \= .72 bits

      Thus the total conditional entropy of the elastic environment is: H(S'|S, A, C) = (1/7) × .97 + (1/7) × .47 + (3/7) × .72 \= .52 bits

      Step 3: Calculating I(S' | A, S)  

      Inelastic environment: I(S'; A, C | S) = H(S'|S) – H(S'|S, A, C) = 1 – 0.1 = .9 bits 

      Elastic environment: I(S'; A, C | S) = H(S'|S) – H(S'|S, A, C) = .91 – .52 = .39 bits

      Thus, the inelastic environment offers higher information-theoretic controllability (.9 bits) compared to the elastic environment (.39 bits). 

      Of note, even if each combination of cost and goal reaching is defined as a distinct outcome, then information-theoretic controllability is higher for the inelastic (2.81 bits) than for the elastic (2.30 bits) environment. 

      In sum, for both definitions of controllability, we see that environments can be more elastic yet less controllable. We will amend the manuscript to clarify this distinction between controllability and its elasticity.

      Reviewer 3:

      A bias in how people infer the amount of control they have over their environment is widely believed to be a key component of several mental illnesses including depression, anxiety, and addiction. Accordingly, this bias has been a major focus in computational models of those disorders. However, all of these models treat control as a unidimensional property, roughly, how strongly outcomes depend on action. This paper proposes---correctly, I think---that the intuitive notion of "control" captures multiple dimensions in the relationship between action and outcome is multi-dimensional. In particular, the authors propose that the degree to which outcome depends on how much *effort* we exert, calling this dimension the "elasticity of control". They additionally propose that this dimension (rather than the more holistic notion of controllability) may be specifically impaired in certain types of psychopathology. This idea thus has the potential to change how we think about mental disorders in a substantial way, and could even help us better understand how healthy people navigate challenging decision-making problems.

      Unfortunately, my view is that neither the theoretical nor empirical aspects of the paper really deliver on that promise. In particular, most (perhaps all) of the interesting claims in the paper have weak empirical support.

      We appreciate the Reviewer's thoughtful engagement with our research and recognition of the potential significance of distinguishing between different dimensions of control in understanding psychopathology. We believe that all the Reviewer’s comments can be addressed with clarifications or additional analyses, as detailed below.  

      Starting with theory, the elasticity idea does not truly "extend" the standard control model in the way the authors suggest. The reason is that effort is simply one dimension of action. Thus, the proposed model ultimately grounds out in how strongly our outcomes depend on our actions (as in the standard model). Contrary to the authors' claims, the elasticity of control is still a fixed property of the environment. Consistent with this, the computational model proposed here is a learning model of this fixed environmental property. The idea is still valuable, however, because it identifies a key dimension of action (namely, effort) that is particularly relevant to the notion of perceived control. Expressing the elasticity idea in this way might support a more general theoretical formulation of the idea that could be applied in other contexts. See Huys & Dayan (2009), Zorowitz, Momennejad, & Daw (2018), and Gagne & Dayan (2022) for examples of generalizable formulations of perceived control.

      We thank the Reviewer for the suggestion that we formalize our concept of elasticity to resource investment, which we agree is a dimension of action. We first note that we have not argued against the claim that elasticity is a fixed property of the environment. We surmise the Reviewer might have misread our statement that “controllability is not a fixed property of the environment”. The latter statement is motivated by the observation that controllability is often higher for agents that can invest more resources (e.g., a richer person can buy more things). We will clarify this in our revision of the manuscript.

      To formalize elasticity, we build on Huys & Dayan’s definition of controllability(1) as the fraction of reward that is controllably achievable, 𝜒 (though using information-theoretic definitions(2,3) would work as well). To the extent that this fraction depends on the amount of resources the agent is able and willing to invest (max 𝐶), this formulation can be probabilistically computed without information about the particular agent involved, specifically, by assuming a certain distribution of agents with different amounts of available resources. This would result in a probability distribution over 𝜒. Elasticity can thus be defined as the amount of information obtained about controllability due to knowing the amount of resources available to the agent: I(𝜒; max 𝐶). We will add this formal definition to the manuscript.  

      Turning to experiment, the authors make two key claims: (1) people infer the elasticity of control, and (2) individual differences in how people make this inference are importantly related to psychopathology. Starting with claim 1, there are three sub-claims here; implicitly, the authors make all three. (1A) People's behavior is sensitive to differences in elasticity, (1B) people actually represent/track something like elasticity, and (1C) people do so naturally as they go about their daily lives. The results clearly support 1A. However, 1B and 1C are not supported. Starting with 1B, the experiment cannot support the claim that people represent or track elasticity because the effort is the only dimension over which participants can engage in any meaningful decision-making (the other dimension, selecting which destination to visit, simply amounts to selecting the location where you were just told the treasure lies). Thus, any adaptive behavior will necessarily come out in a sensitivity to how outcomes depend on effort. More concretely, any model that captures the fact that you are more likely to succeed in two attempts than one will produce the observed behavior. The null models do not make this basic assumption and thus do not provide a useful comparison.

      We appreciate the reviewer's critical analysis of our claims regarding elasticity inference, which as detailed below, has led to an important new analysis that strengthens the study’s conclusions. However, we respectfully disagree with two of the Reviewer’s arguments. First, resource investment was not the only meaningful decision dimension in our task, since participant also needed to choose the correct vehicle to get to the right destination. That this was not trivial is evidenced by our exclusion of over 8% of participants who made incorrect vehicle choices more than 10% of the time. Included participants also occasionally erred in this choice (mean error rate = 3%, range [0-10%]). 

      Second, the experimental task cannot be solved well by a model that simply tracks how outcomes depend on effort because 20% of the time participants reached the treasure despite failing to board their vehicle of choice. In such cases, reward outcomes and control were decoupled. Participants could identify when this was the case by observing the starting location, which was revealed together with the outcome (since depending on the starting location, the treasure location was automatically reached by walking). To determine whether participants distinguished between control-related and non-control-related reward, we have now fitted a variant of our model to the data that allows learning from each of these kinds of outcomes by means of a different free parameter. The results show that participants learned considerably more from control-related outcomes. They were thus not merely tracking outcomes, but specifically inferred when outcomes can be attributed to control. We will include this new analysis in the revised manuscript.

      Controllability inference by itself, however, still does not suffice to explain the observed behavior. This is shown by our ‘controllability’ model, which learns to invest more resources to improve control, yet still fails to capture key features of participants’ behavior, as detailed in the manuscript. This means that explaining participants’ behavior requires a model that not only infers controllability—beyond merely outcome probability—but also assumes a priori that increased effort could enhance control. Building these a priori assumption into the model amounts to embedding within it an understanding of elasticity – the idea that control over the environment may be increased by greater resource investment. 

      That being said, we acknowledge the value in considering alternative computational formulations of adaptation to elasticity. Thus, in our revision of the manuscript, we will add a discussion concerning possible alternative models.  

      For 1C, the claim that people infer elasticity outside of the experimental task cannot be supported because the authors explicitly tell people about the two notions of control as part of the training phase: "To reinforce participants' understanding of how elasticity and controllability were manifested in each planet, [participants] were informed of the planet type they had visited after every 15 trips." (line 384).

      We thank the reviewer for highlighting this point. We agree that our experimental design does not test whether people infer elasticity spontaneously. Our research question was whether people can distinguish between elastic and inelastic controllability. The results strongly support that they can, and this does have potential implications for behavior outside of the experimental task. Specifically, to the extent that people are aware that in some contexts additional resource investment improve control, whereas in other contexts it does not, then our results indicate that they would be able to distinguish between these two kinds of contexts through trial-and-error learning. That said, we agree that investigating whether and how people spontaneously infer elasticity is an interesting direction for future work. We will clarify the scope of the present conclusions in the revised manuscript.

      Finally, I turn to claim 2, that individual differences in how people infer elasticity are importantly related to psychopathology. There is much to say about the decision to treat psychopathology as a unidimensional construct. However, I will keep it concrete and simply note that CCA (by design) obscures the relationship between any two variables. Thus, as suggestive as Figure 6B is, we cannot conclude that there is a strong relationship between Sense of Agency and the elasticity bias---this result is consistent with any possible relationship (even a negative one). The fact that the direct relationship between these two variables is not shown or reported leads me to infer that they do not have a significant or strong relationship in the data.

      We agree that CCA is not designed to reveal the relationship between any two variables. However, the advantage of this analysis is that it pulls together information from multiple variables. Doing so does not treat psychopathology as unidimensional. Rather, it seeks a particular dimension that most strongly correlates with different aspects of task performance. This is especially useful for multidimensional psychopathology data because such data are often dominated by strong correlations between dimensions, whereas the research seeks to explain the distinctions between the dimensions. Similar considerations hold for the multidimensional task parameters, which although less correlated, may still jointly predict the relevant psychopathological profile better than each parameter does in isolation. Thus, the CCA enabled us to identify a general relationship between task performance and psychopathology that accounts for different symptom measures and aspects of controllability inference. 

      Using CCA can thus reveal relationships that do not readily show up in two-variable analyses. Indeed, the direct correlation between Sense of Agency (SOA) and elasticity bias was not significant – a result that, for completeness, we will now report in the supplementary materials along with all other direct correlations. We note, however, that the CCA analysis was preregistered and its results were replicated. Furthermore, an auxiliary analysis specifically confirmed the contributions of both elasticity bias (Figure 6D, bottom plot) and, although not reported in the original paper, of the Sense of Agency score (SOA; p\=.03 permutation test) to the observed canonical correlation. Participants scoring higher on the psychopathology profile also overinvested resources in inelastic environments but did not futilely invest in uncontrollable environments (Figure 6A), providing external validation to the conclusion that the CCA captured meaningful variance specific to elasticity inference. The results thus enable us to safely conclude that differences in elasticity inferences are significantly associated with a profile of controlrelated psychopathology to which SOA contributed significantly.  

      Finally, whereas interpretation of individual CCA loadings that were not specifically tested remains speculative, we note that the pattern of loadings largely replicated across the initial and replication studies (see Figure 6B), and aligns with prior findings. For instance, the positive loadings of SOA and OCD match prior suggestions that a lower sense of control leads to greater compensatory effort(7), whereas the negative loading for depression scores matches prior work showing reduced resource investment in depression(5-6).

      We will revise the text to better clarify the advantageous and disadvantageous of our analytical approach, and the conclusions that can and cannot be drawn from it.

      There is also a feature of the task that limits our ability to draw strong conclusions about individual differences in elasticity inference. As the authors clearly acknowledge, the task was designed "to be especially sensitive to overestimation of elasticity" (line 287). A straightforward consequence of this is that the resulting *empirical* estimate of estimation bias (i.e., the gamma_elasticity parameter) is itself biased. This immediately undermines any claim that references the directionality of the elasticity bias (e.g. in the abstract). Concretely, an undirected deficit such as slower learning of elasticity would appear as a directed overestimation bias. When we further consider that elasticity inference is the only meaningful learning/decisionmaking problem in the task (argued above), the situation becomes much worse. Many general deficits in learning or decision-making would be captured by the elasticity bias parameter. Thus, a conservative interpretation of the results is simply that psychopathology is associated with impaired learning and decision-making.

      We apologize for our imprecise statement that the task was ‘especially sensitive to overestimation of elasticity’, which justifiably led to Reviewer’s concern that slower elasticity learning can be mistaken for elasticity bias. To make sure this was not the case, we made use of the fact that our computational model explicitly separates bias direction (λ) from the rate of learning through two distinct parameters, which initialize the prior concentration and mean of the model’s initial beliefs concerning elasticity (see Methods pg. 22). The higher the concentration of the initial beliefs (𝜖), the slower the learning. Parameter recovery tests confirmed that our task enables acceptable recovery of both the bias λ<sub>elasticity</sub> (r=.81) and the concentration 𝝐<sub>elasticity</sub> (r=.59) parameters. And importantly, the level of confusion between the parameters was low (confusion of 0.15 for 𝝐<sub>elasticity</sub>→ λ<sub>elasticity</sub> and 0.04 for λ<sub>elasticity</sub>→ 𝝐<sub>elasticity</sub>). This result confirms that our task enables dissociating elasticity biases from the rate of elasticity learning. 

      Moreover, to validate that the minimal level of confusion existing between bias and the rate of learning did not drive our psychopathology results, we re-ran the CCA while separating concentration from bias parameters. The results (Author response image 1) demonstrate that differences in learning rate (𝜖) had virtually no contribution to our CCA results, whereas the contribution of the pure bias (𝜆) was preserved. 

      We will incorporate these clarifications and additional analysis in our revised manuscript.

      Author response image 1.

      Showing that a model parameter correlates with the data it was fit to does not provide any new information, and cannot support claims like "a prior assumption that control is likely available was reflected in a futile investment of resources in uncontrollable environments." To make that claim, one must collect independent measures of the assumption and the investment.

      We apologize if this and related statements seemed to be describing independent findings. They were merely meant to describe the relationship between model parameters and modelindependent measures of task performance. It is inaccurate, though, to say that they provide no new information, since results could have been otherwise. For instance, instead of a higher controllability bias primarily associating with futile investment of resources in uncontrollable environments, it could have been primarily associated with more proper investment of resources in high-controllability environments. Additionally, we believe these analyses are of value to readers who seek to understand the role of different parameters in the model. In our planned revision, we will clarify that the relevant analyses are merely descriptive. 

      Did participants always make two attempts when purchasing tickets? This seems to violate the intuitive model, in which you would sometimes succeed on the first jump. If so, why was this choice made? Relatedly, it is not clear to me after a close reading how the outcome of each trial was actually determined.

      We thank the reviewer for highlighting the need to clarify these aspects of the task in the revised manuscript. 

      When participants purchased two extra tickets, they attempted both jumps, and were never informed about whether either of them succeeded. Instead, after choosing a vehicle and attempting both jumps, participants were notified where they arrived at. This outcome was determined based on the cumulative probability of either of the two jumps succeeding. Success meant that participants arrived at where their chosen vehicle goes, whereas failure meant they walked to the nearest location (as determined by where they started from). 

      Though it is unintuitive to attempt a second jump before seeing whether the first succeed, this design choice ensured two key objectives. First, that participants would consistently need to invest not only more money but also more effort and time in planets with high elastic controllability. Second, that the task could potentially generalize to the many real-world situations where the amount of invested effort has to be determined prior to seeing any outcome, for instance, preparing for an exam or a job interview. 

      It should be noted that the model is heuristically defined and does not reflect Bayesian updating. In particular, it overestimates control by not using losses with less than 3 tickets (intuitively, the inference here depends on your beliefs about elasticity). I wonder if the forced three-ticket trials in the task might be historically related to this modeling choice.

      We apologize for not making this clear, but in fact losing with less than 3 tickets does reduce the model’s estimate of available control. It does so by increasing the elasticity estimates

      (a<sub>elastic≥1</sub>, a<sub>elastic2</sub> parameters), signifying that more tickets are needed to obtain the maximum available level of control, thereby reducing the average controllability estimate across ticket investment options. 

      It would be interesting to further develop the model such that losing with less than 3 tickets would also impact inferences concerning the maximum available control, depending on present beliefs concerning elasticity, but the forced three-ticket purchases already expose participants to the maximum available control, and thus, the present data may not be best suited to test such a model. These trials were implemented to minimize individual differences concerning inferences of maximum available control, thereby focusing differences on elasticity inferences. We will discuss the Reviewer’s suggestion for a potentially more accurate model in the revised manuscript. 

      References

      (1) Huys, Q. J. M., & Dayan, P. (2009). A Bayesian formulation of behavioral control. Cognition, 113(3), 314– 328.

      (2) Ligneul, R. (2021). Prediction or causation? Towards a redefinition of task controllability. Trends in Cognitive Sciences, 25(6), 431–433.

      (3) Mistry, P., & Liljeholm, M. (2016). Instrumental divergence and the value of control. Scientific Reports, 6, 36295.

      (4) Lin, J. (1991). Divergence measures based on the Shannon entropy. IEEE Transactions on Information Theory, 37(1), 145–151

      (5) Cohen RM, Weingartner H, Smallberg SA, Pickar D, Murphy DL. Effort and cognition in depression. Arch Gen Psychiatry. 1982 May;39(5):593-7. doi: 10.1001/archpsyc.1982.04290050061012. PMID: 7092490.

      (6) Bi R, Dong W, Zheng Z, Li S, Zhang D. Altered motivation of effortful decision-making for self and others in subthreshold depression. Depress Anxiety. 2022 Aug;39(8-9):633-645. doi: 10.1002/da.23267. Epub 2022 Jun 3. PMID: 35657301; PMCID: PMC9543190.

      (7) Tapal, A., Oren, E., Dar, R., & Eitam, B. (2017). The Sense of Agency Scale: A measure of consciously perceived control over one's mind, body, and the immediate environment. Frontiers in Psychology, 8, 1552

    1. Author response:

      Reviewer #1 (Public review):

      Summary:

      This study identified three independent components of glucose dynamics-"value," "variability," and "autocorrelation", and reported important findings indicating that they play an important role in predicting coronary plaque vulnerability. Although the generalizability of the results needs further investigation due to the limited sample size and validation cohort limitations, this study makes several notable contributions: validation of autocorrelation as a new clinical indicator, theoretical support through mathematical modeling, and development of a web application for practical implementation. These contributions are likely to attract broad interest from researchers in both diabetology and cardiology and may suggest the potential for a new approach to glucose monitoring that goes beyond conventional glycemic control indicators in clinical practice.

      Strengths:

      The most notable strength of this study is the identification of three independent elements in glycemic dynamics: value, variability, and autocorrelation. In particular, the metric of autocorrelation, which has not been captured by conventional glycemic control indices, may bring a new perspective for understanding glycemic dynamics. In terms of methodological aspects, the study uses an analytical approach combining various statistical methods such as factor analysis, LASSO, and PLS regression, and enhances the reliability of results through theoretical validation using mathematical models and validation in other cohorts. In addition, the practical aspect of the research results, such as the development of a Web application, is also an important contribution to clinical implementation.

      We appreciate reviewer #1 for the positive assessment and for the valuable and constructive comments on our manuscript.

      Weaknesses:

      The most significant weakness of this study is the relatively small sample size of 53 study subjects. This sample size limitation leads to a lack of statistical power, especially in subgroup analyses, and to limitations in the assessment of rare events.

      We appreciate the reviewer’s concern regarding the sample size. We acknowledge that a larger sample size would increase statistical power, especially for subgroup analyses and the assessment of rare events.

      We would like to clarify several points regarding the statistical power and validation of our findings. Our sample size determination followed established methodological frameworks, including the guidelines outlined by Muyembe Asenahabi, Bostely, and Peters Anselemo Ikoha. “Scientific research sample size determination.” (2023). These guidelines balance the risks of inadequate sample size with the challenges of unnecessarily large samples. For our primary analysis examining the correlation between CGM-derived measures and %NC, power calculations (a type I error of 0.05, a power of 0.8, and an expected correlation coefficient of 0.4) indicated that a minimum of 47 participants was required. Our sample size of 53 exceeded this threshold and allowed us to detect statistically significant correlations, as described in the Methods section. Moreover, to provide transparency about the precision of our estimates, we have included confidence intervals for all coefficients.

      Furthermore, our sample size aligns with previous studies investigating the associations between glucose profiles and clinical parameters, including Torimoto, Keiichi, et al. “Relationship between fluctuations in glucose levels measured by continuous glucose monitoring and vascular endothelial dysfunction in type 2 diabetes mellitus.” Cardiovascular Diabetology 12 (2013): 1-7. (n=57), Hall, Heather, et al. “Glucotypes reveal new patterns of glucose dysregulation.” PLoS biology 16.7 (2018): e2005143. (n=57), and Metwally, Ahmed A., et al. “Prediction of metabolic subphenotypes of type 2 diabetes via continuous glucose monitoring and machine learning.” Nature Biomedical Engineering (2024): 1-18. (n=32).

      Furthermore, the primary objective of our study was not to assess rare events, but rather to demonstrate that glucose dynamics can be decomposed into three main factors - mean, variance and autocorrelation - whereas traditional measures have primarily captured mean and variance without adequately reflecting autocorrelation. We believe that our current sample size effectively addresses this objective.

      Regarding the classification of glucose dynamics components, we have conducted additional validation across diverse populations including 64 Japanese, 53 American, and 100 Chinese individuals. These validation efforts have consistently supported our identification of three independent glucose dynamics components.

      However, we acknowledge the importance of further validation on a larger scale. To address this, we conducted a large follow-up study of over 8,000 individuals (Sugimoto, Hikaru, et al. “Stratification of individuals without prior diagnosis of diabetes using continuous glucose monitoring” medRxiv (2025)), which confirmed our main finding that glucose dynamics consist of mean, variance, and autocorrelation. As this large study was beyond the scope of the present manuscript due to differences in primary objectives and analytical approaches, it was not included in this paper; however, it provides further support for the clinical relevance and generalizability of our findings.

      To address the sample size considerations, we will add the following sentences in the Discussion section:

      Although our analysis included four datasets with a total of 270 individuals, and our sample size of 53 met the required threshold based on power calculations with a type I error of 0.05, a power of 0.8, and an expected correlation coefficient of 0.4, we acknowledge that the sample size may still be considered relatively small for a comprehensive assessment of these relationships. To further validate these findings, larger prospective studies with diverse populations are needed to improve the predictive utility and generalizability of our findings.

      We appreciate the reviewer’s feedback and believe that these clarifications will strengthen the manuscript.

      In terms of validation, several challenges exist, including geographical and ethnic biases in the validation cohorts, lack of long-term follow-up data, and insufficient validation across different clinical settings. In terms of data representativeness, limiting factors include the inclusion of only subjects with well-controlled serum cholesterol and blood pressure and the use of only short-term measurement data.

      We appreciate the reviewer’s comment regarding the challenges associated with validation. In terms of geographic and ethnic diversity, our study includes validation cohorts from diverse populations, including 64 Japanese, 53 American and 100 Chinese individuals. These cohorts include a wide range of metabolic states, from healthy individuals to those with diabetes, ensuring validation across different clinical conditions. In addition, we recognize the limited availability of publicly available datasets with sufficient sample sizes for factor decomposition that include both healthy individuals and those with type 2 diabetes (Zhao, Qinpei, et al. “Chinese diabetes datasets for data-driven machine learning.” Scientific Data 10.1 (2023): 35.). The main publicly available datasets with relevant clinical characteristics have already been analyzed in this study using unbiased approaches.

      However, we fully agree with the reviewer that expanding the geographic and ethnic scope, including long-term follow-up data, and validation in different clinical settings would further strengthen the robustness and generalizability of our findings. To address this, we conducted a large follow-up study of over 8,000 individuals with two years of follow-up (Sugimoto, Hikaru, et al. “Stratification of individuals without prior diagnosis of diabetes using continuous glucose monitoring” medRxiv (2025)), which confirmed our main finding that glucose dynamics consist of mean, variance, and autocorrelation. As this large study was beyond the scope of the present manuscript due to differences in primary objectives and analytical approaches, it was not included in this paper; however, it provides further support for the clinical relevance and generalizability of our findings.

      Regarding the validation considerations, we will add the following sentences to the Discussion section:

      Although our analysis included four datasets with a total of 270 individuals, and our sample size of 53 met the required threshold based on power calculations with a type I error of 0.05, a power of 0.8, and an expected correlation coefficient of 0.4, we acknowledge that the sample size may still be considered relatively small for a comprehensive assessment of these relationships. To further validate these findings, larger prospective studies with diverse populations are needed to improve the predictive utility and generalizability of our findings.

      Although our LASSO and factor analysis indicated that CGM-derived measures were strong predictors of %NC, this does not mean that other clinical parameters, such as lipids and blood pressure, are irrelevant in T2DM complications. Our study specifically focused on characterizing glucose dynamics, and we analyzed individuals with well-controlled serum cholesterol and blood pressure to reduce confounding effects. While we anticipate that inclusion of a more diverse population would not alter our primary findings regarding glucose dynamics, it is likely that a broader data set would reveal additional predictive contributions from lipid and blood pressure parameters.

      In terms of elucidation of physical mechanisms, the study is not sufficient to elucidate the mechanisms linking autocorrelation and clinical outcomes or to verify them at the cellular or molecular level.

      We appreciate the reviewer’s point regarding the need for further elucidation of the physical mechanisms linking glucose autocorrelation to clinical outcomes. We fully agree with the reviewer that the detailed molecular and cellular mechanisms underlying this relationship are not yet fully understood, as noted in our Discussion section.

      However, we would like to emphasize the theoretical basis that supports the clinical relevance of autocorrelation. Our results show that glucose profiles with identical mean and variability can exhibit different autocorrelation patterns, highlighting that conventional measures such as mean or variance alone may not fully capture inter-individual metabolic differences. Incorporating autocorrelation analysis provides a more comprehensive characterization of metabolic states. Consequently, incorporating autocorrelation measures alongside traditional diabetes diagnostic criteria - such as fasting glucose, HbA1c and PG120, which primarily reflect only the “mean” component - can improve predictive accuracy for various clinical outcomes. While further research at the cellular and molecular level is needed to fully validate these findings, it is important to note that the primary goal of this study was to analyze the characteristics of glucose dynamics and gain new insights into metabolism, rather than to perform molecular biology experiments.

      Furthermore, our previous research has shown that glucose autocorrelation reflects changes in insulin clearance (Sugimoto, Hikaru, et al. “Improved Detection of Decreased Glucose Handling Capacities via Novel Continuous Glucose Monitoring-Derived Indices: AC_Mean and AC_Var.” medRxiv (2023): 2023-09.). The relationship between insulin clearance and cardiovascular disease has been well documented (Randrianarisoa, Elko, et al. “Reduced insulin clearance is linked to subclinical atherosclerosis in individuals at risk for type 2 diabetes mellitus.” Scientific reports 10.1 (2020): 22453.), and the mechanisms described in this prior work may potentially explain the association between glucose autocorrelation and clinical outcomes observed in the present study.

      Rather than a limitation, we view these currently unexplored associations as an opportunity for further research. The identification of autocorrelation as a key glycemic feature introduces a new dimension to metabolic regulation that could serve as the basis for future investigations exploring the molecular mechanisms underlying these patterns.

      While we agree that further research at the cellular and molecular level is needed to fully validate these findings, we believe that our study provides a strong theoretical framework to support the clinical utility of autocorrelation analysis in glucose monitoring, and that this could serve as the basis for future investigations exploring the molecular mechanisms underlying these autocorrelation patterns, which adds to the broad interest of this study. Regarding the physical mechanisms linking autocorrelation and clinical outcomes, we will add the following sentences in the Discussion section:

      This study also provided evidence that autocorrelation can vary independently from the mean and variance components using simulated data. In addition, simulated glucose dynamics indicated that even individuals with high AC_Var did not necessarily have high maximum and minimum blood glucose levels. This study also indicated that these three components qualitatively corresponded to the four distinct glucose patterns observed after glucose administration, which were identified in a previous study (Hulman et al., 2018). Thus, the inclusion of autocorrelation in addition to mean and variance may improve the characterization of inter-individual differences in glucose regulation and improve the predictive accuracy of various clinical outcomes.

      Despite increasing evidence linking glycemic variability to oxidative stress and endothelial dysfunction in T2DM complications (Ceriello et al., 2008; Monnier et al., 2008), the biological mechanisms underlying the independent predictive value of autocorrelation remain to be elucidated. Our previous work has shown that glucose autocorrelation is influenced by insulin clearance (Sugimoto et al., 2023), a process known to be associated with cardiovascular disease risk (Randrianarisoa et al., 2020). Therefore, the molecular pathways linking glucose autocorrelation to cardiovascular disease may share common mechanisms with those linking insulin clearance to cardiovascular disease. Although previous studies have primarily focused on investigating the molecular mechanisms associated with mean glucose levels and glycemic variability, our findings open new avenues for exploring the molecular basis of glucose autocorrelation, potentially revealing novel therapeutic targets for preventing diabetic complications.

      Reviewer #2 (Public review):

      Sugimoto et al. explore the relationship between glucose dynamics - specifically value, variability, and autocorrelation - and coronary plaque vulnerability in patients with varying glucose tolerance levels. The study identifies three independent predictive factors for %NC and emphasizes the use of continuous glucose monitoring (CGM)-derived indices for coronary artery disease (CAD) risk assessment. By employing robust statistical methods and validating findings across datasets from Japan, America, and China, the authors highlight the limitations of conventional markers while proposing CGM as a novel approach for risk prediction. The study has the potential to reshape CAD risk assessment by emphasizing CGM-derived indices, aligning well with personalized medicine trends.

      Strengths:

      (1) The introduction of autocorrelation as a predictive factor for plaque vulnerability adds a novel dimension to glucose dynamic analysis.

      (2) Inclusion of datasets from diverse regions enhances generalizability.

      (3) The use of a well-characterized cohort with controlled cholesterol and blood pressure levels strengthens the findings.

      (4) The focus on CGM-derived indices aligns with personalized medicine trends, showcasing the potential for CAD risk stratification.

      We appreciate reviewer #2 for the positive assessment and for the valuable and constructive comments on our manuscript.

      Weaknesses:

      (1) The link between autocorrelation and plaque vulnerability remains speculative without a proposed biological explanation.

      We appreciate the reviewer’s point about the need for a clearer biological explanation linking glucose autocorrelation to plaque vulnerability. We fully agree with the reviewer that the detailed biological mechanisms underlying this relationship are not yet fully understood, as noted in our Discussion section.

      However, we would like to emphasize the theoretical basis that supports the clinical relevance of autocorrelation. Our results show that glucose profiles with identical mean and variability can exhibit different autocorrelation patterns, highlighting that conventional measures such as mean or variance alone may not fully capture inter-individual metabolic differences. Incorporating autocorrelation analysis provides a more comprehensive characterization of metabolic states. Consequently, incorporating autocorrelation measures alongside traditional diabetes diagnostic criteria - such as fasting glucose, HbA1c and PG120, which primarily reflect only the “mean” component - can improve predictive accuracy for various clinical outcomes.

      Furthermore, our previous research has shown that glucose autocorrelation reflects changes in insulin clearance (Sugimoto, Hikaru, et al. “Improved Detection of Decreased Glucose Handling Capacities via Novel Continuous Glucose Monitoring-Derived Indices: AC_Mean and AC_Var.” medRxiv (2023): 2023-09.). The relationship between insulin clearance and cardiovascular disease has been well documented (Randrianarisoa, Elko, et al. “Reduced insulin clearance is linked to subclinical atherosclerosis in individuals at risk for type 2 diabetes mellitus.” Scientific reports 10.1 (2020): 22453.), and the mechanisms described in this prior work may potentially explain the association between glucose autocorrelation and clinical outcomes observed in the present study.

      Rather than a limitation, we view these currently unexplored associations as an opportunity for further research. The identification of autocorrelation as a key glycemic feature introduces a new dimension to metabolic regulation that could serve as the basis for future investigations exploring the molecular mechanisms underlying these patterns.

      While we agree that further research at the cellular and molecular level is needed to fully validate these findings, we believe that our study provides a strong theoretical framework to support the clinical utility of autocorrelation analysis in glucose monitoring, and that this could serve as the basis for future investigations exploring the molecular mechanisms underlying these autocorrelation patterns, which adds to the broad interest of this study. Regarding the physical mechanisms linking autocorrelation and clinical outcomes, we will add the following sentences in the Discussion section:

      This study also provided evidence that autocorrelation can vary independently from the mean and variance components using simulated data. In addition, simulated glucose dynamics indicated that even individuals with high AC_Var did not necessarily have high maximum and minimum blood glucose levels. This study also indicated that these three components qualitatively corresponded to the four distinct glucose patterns observed after glucose administration, which were identified in a previous study (Hulman et al., 2018). Thus, the inclusion of autocorrelation in addition to mean and variance may improve the characterization of inter-individual differences in glucose regulation and improve the predictive accuracy of various clinical outcomes.

      Despite increasing evidence linking glycemic variability to oxidative stress and endothelial dysfunction in T2DM complications (Ceriello et al., 2008; Monnier et al., 2008), the biological mechanisms underlying the independent predictive value of autocorrelation remain to be elucidated. Our previous work has shown that glucose autocorrelation is influenced by insulin clearance (Sugimoto et al., 2023), a process known to be associated with cardiovascular disease risk (Randrianarisoa et al., 2020). Therefore, the molecular pathways linking glucose autocorrelation to cardiovascular disease may share common mechanisms with those linking insulin clearance to cardiovascular disease. Although previous studies have primarily focused on investigating the molecular mechanisms associated with mean glucose levels and glycemic variability, our findings open new avenues for exploring the molecular basis of glucose autocorrelation, potentially revealing novel therapeutic targets for preventing diabetic complications.

      (2) The relatively small sample size (n=270) limits statistical power, especially when stratified by glucose tolerance levels.

      We appreciate the reviewer’s concern regarding sample size and its potential impact on statistical power, especially when stratified by glucose tolerance level. We fully agree that a larger sample size would increase statistical power, especially for subgroup analyses.

      We would like to clarify several points regarding the statistical power and validation of our findings. Our sample size determination followed established methodological frameworks, including the guidelines outlined by Muyembe Asenahabi, Bostely, and Peters Anselemo Ikoha. “Scientific research sample size determination.” (2023). These guidelines balance the risks of inadequate sample size with the challenges of unnecessarily large samples. For our primary analysis examining the correlation between CGM-derived measures and %NC, power calculations (a type I error of 0.05, a power of 0.8, and an expected correlation coefficient of 0.4) indicated that a minimum of 47 participants was required. Our sample size of 53 exceeded this threshold and allowed us to detect statistically significant correlations, as described in the Methods section. Moreover, to provide transparency about the precision of our estimates, we have included confidence intervals for all coefficients.

      Furthermore, our sample size aligns with previous studies investigating the associations between glucose profiles and clinical parameters, including Torimoto, Keiichi, et al. “Relationship between fluctuations in glucose levels measured by continuous glucose monitoring and vascular endothelial dysfunction in type 2 diabetes mellitus.” Cardiovascular Diabetology 12 (2013): 1-7. (n=57), Hall, Heather, et al. “Glucotypes reveal new patterns of glucose dysregulation.” PLoS biology 16.7 (2018): e2005143. (n=57), and Metwally, Ahmed A., et al. “Prediction of metabolic subphenotypes of type 2 diabetes via continuous glucose monitoring and machine learning.” Nature Biomedical Engineering (2024): 1-18. (n=32).

      Regarding the classification of glucose dynamics components, we have conducted additional validation across diverse populations including 64 Japanese, 53 American, and 100 Chinese individuals. These validation efforts have consistently supported our identification of three independent glucose dynamics components.

      However, we acknowledge the importance of further validation on a larger scale. To address this, we conducted a large follow-up study of over 8,000 individuals with two years of follow-up (Sugimoto, Hikaru, et al. “Stratification of individuals without prior diagnosis of diabetes using continuous glucose monitoring” medRxiv (2025)), which confirmed our main finding that glucose dynamics consist of mean, variance, and autocorrelation. As this large study was beyond the scope of the present manuscript due to differences in primary objectives and analytical approaches, it was not included in this paper; however, it provides further support for the clinical relevance and generalizability of our findings.

      To address the sample size considerations, we will add the following sentences in the Discussion section:

      Although our analysis included four datasets with a total of 270 individuals, and our sample size of 53 met the required threshold based on power calculations with a type I error of 0.05, a power of 0.8, and an expected correlation coefficient of 0.4, we acknowledge that the sample size may still be considered relatively small for a comprehensive assessment of these relationships. To further validate these findings, larger prospective studies with diverse populations are needed to improve the predictive utility and generalizability of our findings.

      (3) Strict participant selection criteria may reduce applicability to broader populations.

      We appreciate the reviewer’s comment regarding the potential impact of strict participant selection criteria on the broader applicability of our findings. We acknowledge that extending validation to more diverse populations would improve the generalizability of our findings.

      Our study includes validation cohorts from diverse populations, including 64 Japanese, 53 American and 100 Chinese individuals. These cohorts include a wide range of metabolic states, from healthy individuals to those with diabetes, ensuring validation across different clinical conditions. However, we acknowledge that further validation in additional populations and clinical settings would strengthen our conclusions. To address this, we conducted a large follow-up study of over 8,000 individuals (Sugimoto, Hikaru, et al. “Stratification of individuals without prior diagnosis of diabetes using continuous glucose monitoring” medRxiv (2025)), which confirmed our main finding that glucose dynamics consist of mean, variance, and autocorrelation. As this large study was beyond the scope of the present manuscript due to differences in primary objectives and analytical approaches, it was not included in this paper; however, it provides further support for the clinical relevance and generalizability of our findings.

      We will add the following text to the Discussion section to address these considerations:

      Although our analysis included four datasets with a total of 270 individuals, and our sample size of 53 met the required threshold based on power calculations with a type I error of 0.05, a power of 0.8, and an expected correlation coefficient of 0.4, we acknowledge that the sample size may still be considered relatively small for a comprehensive assessment of these relationships. To further validate these findings, larger prospective studies with diverse populations are needed to improve the predictive utility and generalizability of our findings.

      Although our LASSO and factor analysis indicated that CGM-derived measures were strong predictors of %NC, this does not mean that other clinical parameters, such as lipids and blood pressure, are irrelevant in T2DM complications. Our study specifically focused on characterizing glucose dynamics, and we analyzed individuals with well-controlled serum cholesterol and blood pressure to reduce confounding effects. While we anticipate that inclusion of a more diverse population would not alter our primary findings regarding glucose dynamics, it is likely that a broader data set would reveal additional predictive contributions from lipid and blood pressure parameters.

      (4) CGM-derived indices like AC_Var and ADRR may be too complex for routine clinical use without simplified models or guidelines.

      We appreciate the reviewer’s concern about the complexity of CGM-derived indices such as AC_Var and ADRR for routine clinical use. We acknowledge that for these indices to be of practical use, they must be both interpretable and easily accessible to healthcare providers.

      To address this concern, we have developed an easy-to-use web application that automatically calculates these measures, including AC_Var, mean glucose levels, and glucose variability. This tool eliminates the need for manual calculations, making these indices more practical for clinical implementation.

      Regarding interpretability, we acknowledge that establishing specific clinical guidelines would enhance the practical utility of these measures. For example, defining a cut-off value for AC_Var above which the risk of diabetes complications increases significantly would provide clearer clinical guidance. However, given our current sample size limitations and our predefined objective of investigating correlations among indices, we have taken a conservative approach by focusing on the correlation between AC_Var and %NC rather than establishing definitive cutoffs. This approach intentionally avoids problematic statistical practices like p-hacking. It is not realistic to expect a single study to accomplish everything from proposing a new concept to conducting large-scale clinical trials to establishing clinical guidelines. Establishing clinical guidelines typically requires the accumulation of multiple studies over many years. Recognizing this reality, we have been careful in our manuscript to make modest claims about the discovery of new “correlations” rather than exaggerated claims about immediate routine clinical use.

      To address this limitation, we conducted a large follow-up study of over 8,000 individuals in the next study (Sugimoto, Hikaru, et al. “Stratification of individuals without prior diagnosis of diabetes using continuous glucose monitoring” medRxiv (2025)), which proposed clinically relevant cutoffs and reference ranges for AC_Var and other CGM-derived indices. As this large study was beyond the scope of the present manuscript due to differences in primary objectives and analytical approaches, it was not included in this paper; however, by integrating automated calculation tools with clear clinical thresholds, we expect to make these measures more accessible for clinical use.

      We will add the following text to the Discussion section to address these considerations:

      While CGM-derived indices such as AC_Var and ADRR hold promise for CAD risk assessment, their complexity may present challenges for routine clinical implementation. To improve usability, we have developed a web-based calculator that automates these calculations. However, the definition of clinically relevant thresholds and reference ranges requires further validation in larger cohorts.

      (5) The study does not compare CGM-derived indices to existing advanced CAD risk models, limiting the ability to assess their true predictive superiority.

      We appreciate the reviewer’s comment regarding the comparison of CGM-derived indices with existing CAD risk models. Given that our study population consisted of individuals with well-controlled total cholesterol and blood pressure levels, a direct comparison with the Framingham Risk Score for Hard Coronary Heart Disease (Wilson, Peter WF, et al. “Prediction of coronary heart disease using risk factor categories.” Circulation 97.18 (1998): 1837-1847.) may introduce inherent bias, as these factors are key components of the score.

      Nevertheless, to further assess the predictive value of the CGM-derived indices, we performed additional analyses using linear regression to predict %NC. Using the Framingham Risk Score, we obtained an R² of 0.04 and an Akaike Information Criterion (AIC) of 330. In contrast, our proposed model incorporating the three glycemic parameters - CGM_Mean, CGM_Std, and AC_Var - achieved a significantly improved R² of 0.36 and a lower AIC of 321, indicating superior predictive accuracy.

      We will add the following text to the Result section:

      The regression model including CGM_Mean, CGM_Std and AC_Var to predict %NC achieved an R² of 0.36 and an Akaike Information Criterion (AIC) of 321. Each of these indices showed statistically significant independent positive correlations with %NC. In contrast, the model using conventional glycemic markers (FBG, HbA1c, and PG120) yielded an R<sup>2</sup> of only 0.05 and an AIC of 340. Similarly, the model using the Framingham Risk Score for Hard Coronary Heart Disease (Wilson et al., 1998) showed limited predictive value, with an R<sup>2</sup> of 0.04 and an AIC of 330.

      (6) Varying CGM sampling intervals (5-minute vs. 15-minute) were not thoroughly analyzed for impact on results.

      We appreciate the reviewer’s comment regarding the potential impact of different CGM sampling intervals on our results. To assess the robustness of our findings across different sampling frequencies, we performed a down sampling analysis by converting our 5-minute interval data to 15-minute intervals. The AC_Var value calculated from 15-minute intervals was significantly correlated with that calculated from 5-minute intervals (R = 0.99, 95% CI: 0.97-1.00). Furthermore, the regression model using CGM_Mean, CGM_Std, and AC_Var from 15-minute intervals to predict %NC achieved an R<sup>2</sup> of 0.36 and an AIC of 321, identical to the model using 5-minute intervals. These results indicate that our results are robust to variations in CGM sampling frequency.

      We will add this analysis to the Result section:

      The AC_Var value calculated from 15-minute intervals was significantly correlated with that calculated from 5-minute intervals (R = 0.99, 95% CI: 0.97-1.00). Consequently, the regression model including CGM_Mean, CGM_Std and AC_Var from 15-minute intervals to predict %NC achieved an R² of 0.36 and an AIC of 321.

      Reviewer #3 (Public review):

      Summary:

      This is a retrospective analysis of 53 individuals over 26 features (12 clinical phenotypes, 12 CGM features, and 2 autocorrelation features) to examine which features were most informative in predicting percent necrotic core (%NC) as a parameter for coronary plaque vulnerability. Multiple regression analysis demonstrated a better ability to predict %NC from 3 selected CGM-derived features than 3 selected clinical phenotypes. LASSO regularization and partial least squares (PLS) with VIP scores were used to identify 4 CGM features that most contribute to the precision of %NC. Using factor analysis they identify 3 components that have CGM-related features: value (relating to the value of blood glucose), variability (relating to glucose variability), and autocorrelation (composed of the two autocorrelation features). These three groupings appeared in the 3 validation cohorts and when performing hierarchical clustering. To demonstrate how these three features change, a simulation was created to allow the user to examine these features under different conditions.

      We appreciate reviewer #3 for the valuable and constructive comments on our manuscript.

      Review:

      The goal of this study was to identify CGM features that relate to %NC. Through multiple feature selection methods, they arrive at 3 components: value, variability, and autocorrelation. While the feature list is highly correlated, the authors take steps to ensure feature selection is robust. There is a lack of clarity of what each component (value, variability, and autocorrelation) includes as while similar CGM indices fall within each component, there appear to be some indices that appear as relevant to value in one dataset and to variability in the validation.

      We appreciate the reviewer’s comment regarding the classification of CGM-derived measures into the three components: value, variability, and autocorrelation. As the reviewer correctly points out, some measures may load differently between the value and variability components in different datasets. However, we believe that this variability reflects the inherent mathematical properties of these measures rather than a limitation of our study.

      For example, the HBGI clusters differently across datasets due to its dependence on the number of glucose readings above a threshold. In populations where mean glucose levels are predominantly below this threshold, the HBGI is more sensitive to glucose variability (Fig. S7A). Conversely, in populations with a wider range of mean glucose levels, HBGI correlates more strongly with mean glucose levels (Fig. 3A). This context-dependent behavior is expected given the mathematical properties of these measures and does not indicate an inconsistency in our classification approach.

      Importantly, our main findings remain robust: CGM-derived measures systematically fall into three components-value, variability, and autocorrelation. Traditional CGM-derived measures primarily reflect either value or variability, and this categorization is consistently observed across datasets. While specific indices such as HBGI may shift classification depending on population characteristics, the overall structure of CGM data remains stable.

      To address these considerations, we will add the following text to the Discussion section:

      Some indices, such as HBGI, showed variation in classification across datasets, with some populations showing higher factor loadings in the “value” component and others in the “variability” component. This variation occurs because HBGI calculations depend on the number of glucose readings above a threshold. In populations where mean glucose levels are predominantly below this threshold, the HBGI is more sensitive to glucose variability (Fig. S7A). Conversely, in populations with a wider range of mean glucose levels, the HBGI correlates more strongly with mean glucose levels (Fig. 3A). Despite these differences, our validation analyses confirm that CGM-derived indices consistently cluster into three components: value, variability, and autocorrelation.

      We are sceptical about statements of significance without documentation of p-values.

      We appreciate the reviewer’s concern regarding statistical significance and the documentation of p values.

      First, given the multiple comparisons in our study, we used q values rather than p values, as shown in Figure S1. Q values provide a more rigorous statistical framework for controlling the false discovery rate in multiple testing scenarios, thereby reducing the likelihood of false positives.

      Second, our statistical reporting follows established guidelines, including those of the New England Journal of Medicine (Harrington, David, et al. “New guidelines for statistical reporting in the journal.” New England Journal of Medicine 381.3 (2019): 285-286.), which recommend that “reporting of exploratory end points should be limited to point estimates of effects with 95% confidence intervals” and that “replace p values with estimates of effects or association and 95% confidence intervals”. According to these guidelines, p values should not be reported in this type of study. We determined significance based on whether these 95% confidence intervals excluded zero - a statistical method for determining whether an association is significantly different from zero (Tan, Sze Huey, and Say Beng Tan. "The correct interpretation of confidence intervals." Proceedings of Singapore Healthcare 19.3 (2010): 276-278.).

      For the sake of transparency, we provide p values for readers who may be interested, although we emphasize that they should not be the basis for interpretation, as discussed in the referenced guidelines. Specifically, in Figure 1, the p values for CGM_Mean, CGM_Std, and AC_Var were 0.02, 0.02, and <0.01, respectively, while those for FBG, HbA1c, and PG120 were 0.83, 0.91, and 0.25, respectively. In Figure 3C, the p values for factors 1–5 were 0.03, 0.03, 0.03, 0.24, and 0.87, respectively, and in Figure S10B, the p values for factors 1–3 were <0.01, <0.01, and 0.20, respectively.

      We appreciate the opportunity to clarify our statistical methodology and are happy to provide additional details if needed.

      While hesitations remain, the ability of these authors to find groupings of these many CGM metrics in relation to %NC is of interest. The believability of the associations is impeded by an obtuse presentation of the results with core data (i.e. correlation plots between CGM metrics and %NC) buried in the supplement while main figures contain plots of numerical estimates from models which would be more usefully presented in supplementary tables.

      We appreciate the reviewer’s comment regarding the presentation of our results and recognize the importance of ensuring clarity and accessibility of the core data.

      The central finding of our study is twofold: first, that the numerous CGM-derived measures can be systematically classified into three distinct components-mean, variance, and autocorrelation-and second, that each of these components is independently associated with %NC. This insight cannot be derived simply from examining scatter plots of individual correlations, which are provided in the Supplementary Figures. Instead, it emerges from our statistical analyses in the main figures, including multiple regression models that reveal the independent contributions of these components to %NC.

      However, we acknowledge the reviewer’s concern regarding the accessibility of key data. To improve clarity, we will move several scatter plots from the Supplementary Figures to the main figures to allow readers to more directly visualize the relationships between CGM-derived measures and %NC. We believe this revision will improve the transparency and readability of our results while maintaining the rigor of our analytical approach.

      Given the small sample size in the primary analysis, there is a lot of modeling done with parameters estimated where simpler measures would serve and be more convincing as they require less data manipulation. A major example of this is that the pairwise correlation/covariance between CGM_mean, CGM_std, and AC_var is not shown and would be much more compelling in the claim that these are independent factors.

      We appreciate the reviewer’s feedback on our statistical analysis and data presentation. The correlations between CGM_Mean, CGM_Std, and AC_Var are documented in Figure S1B. However, to improve accessibility and clarity, we will move these correlation analyses to the main figures. Regarding our modeling approach, we chose LASSO and PLS methods because they are well-established techniques that are particularly suited to scenarios with many input variables and a relatively small sample size. These methods have been extensively validated in the literature as robust approaches for variable selection under such conditions (Tibshirani R. 1996. Regression shrinkage and selection via the lasso. J R Stat Soc 58:267–288. Wold S, Sjöström M, Eriksson L. 2001. PLS-regression: a basic tool of chemometrics. Chemometrics Intellig Lab Syst 58:109–130. Pei X, Qi D, Liu J, Si H, Huang S, Zou S, Lu D, Li Z. 2023. Screening marker genes of type 2 diabetes mellitus in mouse lacrimal gland by LASSO regression. Sci Rep 13:6862. Wang C, Kong H, Guan Y, Yang J, Gu J, Yang S, Xu G. 2005. Plasma phospholipid metabolic profiling and biomarkers of type 2 diabetes mellitus based on high-performance liquid chromatography/electrospray mass spectrometry and multivariate statistical analysis. Anal Chem 77:4108–4116.).

      Lack of methodological detail is another challenge. For example, the time period of CGM metrics or CGM placement in the primary study in relation to the IVUS-derived measurements of coronary plaques is unclear. Are they temporally distant or proximal/ concurrent with the PCI?

      We appreciate the reviewer’s important question regarding the temporal relationship between CGM measurements and IVUS-derived plaque assessments. As described in our previous work (Otowa‐Suematsu, Natsu, et al. “Comparison of the relationship between multiple parameters of glycemic variability and coronary plaque vulnerability assessed by virtual histology–intravascular ultrasound.” Journal of Diabetes Investigation 9.3 (2018): 610-615.), all individuals underwent continuous glucose monitoring for at least three consecutive days within the seven-day period prior to the PCI procedure. To improve clarity for readers, we will include this methodological detail in the revised manuscript.

      A patient undergoing PCI for coronary intervention would be expected to have physiological and iatrogenic glycemic disturbances that do not reflect their baseline state. This is not considered or discussed.

      We appreciate the reviewer’s concern regarding potential glycemic disturbances associated with PCI. As described in our previous work (Otowa‐Suematsu, Natsu, et al. “Comparison of the relationship between multiple parameters of glycemic variability and coronary plaque vulnerability assessed by virtual histology–intravascular ultrasound.” Journal of Diabetes Investigation 9.3 (2018): 610-615.), all CGM measurements were performed before the PCI procedure. This temporal separation ensures that the glycemic patterns analyzed in our study reflect the baseline metabolic state of the patients, rather than any physiological or iatrogenic effects of PCI. To avoid any misunderstanding, we will clarify this temporal relationship in the revised manuscript.

      The attempts at validation in external cohorts, Japanese, American, and Chinese are very poorly detailed. We could only find even an attempt to examine cardiovascular parameters in the Chinese data set but the outcome variables are unspecified with regard to what macrovascular events are included, their temporal relation to the CGM metrics, etc. Notably macrovascular event diagnoses are very different from the coronary plaque necrosis quantification. This could be a source of strength in the findings if carefully investigated and detailed but due to the lack of detail seems like an apples-to-oranges comparison.

      We appreciate the reviewer’s comment regarding the validation cohorts and the need for greater clarity, particularly in the Chinese dataset. We acknowledge that our initial description lacked sufficient methodological detail, and we will expand the Methods section to provide a more comprehensive explanation.

      For the Chinese dataset, the data collection protocol was previously documented (Zhao, Qinpei, et al. “Chinese diabetes datasets for data-driven machine learning.” Scientific Data 10.1 (2023): 35.). Briefly, trained research staff used standardized questionnaires to collect demographic and clinical information, including diabetes diagnosis, treatment history, comorbidities, and medication use. Physical examinations included anthropometric measurements, and body mass index was calculated using standard protocols. CGM monitoring was performed using the FreeStyle Libre H device (Abbott Diabetes Care, UK), which records interstitial glucose levels at 15-minute intervals for up to 14 days. Laboratory measurements, including metabolic panels, lipid profiles, and renal function tests, were obtained within six months of CGM placement. While previous studies have linked necrotic core to macrovascular events (Xie, Yong, et al. “Clinical outcome of nonculprit plaque ruptures in patients with acute coronary syndrome in the PROSPECT study.” JACC: Cardiovascular Imaging 7.4 (2014): 397-405.), we acknowledge the limitations of the cardiovascular outcomes in the Chinese data set. These outcomes were extracted from medical records rather than standardized diagnostic procedures or imaging studies. To address these concerns, we will expand the Discussion section to clarify the differences in outcome definitions and methodological approaches between the data sets.

      Finally, the simulations at the end are not relevant to the main claims of the paper and we would recommend removing them for the coherence of this manuscript.

      We appreciate the reviewer’s feedback regarding the relevance of the simulation component of our manuscript. The primary contribution of our study goes beyond demonstrating correlations between CGM-derived measures and %NC; it highlights three fundamental components of glycemic patterns-mean, variability, and autocorrelation-and their independent relationships with coronary plaque characteristics.

      The simulations are included to illustrate how glycemic patterns with identical means and variability can have different autocorrelation structures. Because temporal autocorrelation can be conceptually difficult to interpret, these visualizations were intended to provide intuitive examples for the readers.

      However, we recognize the reviewer’s concern about the coherence of the manuscript. In response, we will streamline the simulation section by removing technical simulations that do not directly support our primary conclusions, while retaining only those that enhance understanding of the three glycemic components.

    1. Author response:

      The following is the authors’ response to the previous reviews.

      Public Reviews:

      Reviewer #1 (Public review):

      Summary:

      In this study, Bu et al examined the dynamics of TRPV4 channel in cell overcrowding in carcinoma conditions. They investigated how cell crowding (or high cell confluence) triggers a mechano-transduction pathway involving TRPV4 channels in high-grade ductal carcinoma in situ (DCIS) cells that leads to large cell volume reduction (or cell volume plasticity) and proinvasive phenotype.

      In vitro, this pathway is highly selective for highly malignant invasive cell lines derived from a normal breast epithelial cell line (MCF10CA) compared to the parent cell line, but not present in another triple-negative invasive breast epithelial cell line (MDA-MB-231). The authors convincingly showed that enhanced TRPV4 plasmamembrane localization correlates with highgrade DCIS cells in patient tissue samples. Specifically in invasive MCF10DCIS.com cells they showed that overcrowding or over-confluence leads to a decrease in cell volume and intracellular calcium levels. This condition also triggers the trafficking of TRPV4 channels from intracellular stores (nucleus and potentially endosomes), to the plasma membrane (PM). When these over-confluent cells are incubated with a TRPV4 activator, there is an acute and substantial influx of calcium, attesting the fact that there are high number of TRPV4 channels present on the PM. Long-term incubation of these over-confluent cells with the TRPV4 activator results in the internalization of the PM-localized TRPV4 channels.

      In contrast, cells plated at lower confluence primarily have TRPV4 channels localized in the nucleus and cytosol. Long-term incubation of these cells at lower confluence with a TRPV4 inhibitor leads to the relocation of TRPV4 channels to the plasma membrane from intracellular stores and a subsequent reduction in cell volume. Similarly, incubation of these cells at low confluence with PEG 3000 (a hyperosmotic agent) promotes the trafficking of TRPV4 channels from intracellular stores to the plasma membrane.

      Strengths:

      The study is elegantly designed and the findings are novel. Their findings on this mechanotransduction pathway involving TRPV4 channels, calcium homeostasis, cell volume plasticity, motility and invasiveness will have a great impact in the cancer field and potentially applicable to other fields as well. Experiments are well-planned and executed, and the data is convincing. Authors investigated TRVP4 dynamics using multiple different strategies- overcrowding, hyperosmotic stress, pharmacological and genetic means, and showed a good correlation between different phenomena.

      All of my previous concerns have been addressed. The quality of the manuscript has improved significantly.

      We are deeply grateful to the reviewer for their thoughtful assessment and invaluable suggestions, including crucial additional experiments and more effective presentation and description of our findings, which have greatly enhanced the quality of our manuscript.

      Reviewer #2 (Public review):

      Summary:

      The metastasis poses a significant challenge in cancer treatment. During the transition from non-invasive cells to invasive metastasis cells, cancer cells usually experience mechanical stress due to a crowded cellular environment. The molecular mechanisms underlying mechanical signaling during this transition remain largely elusive. In this work, the authors utilize an in vitro cell culture system and advanced imaging techniques to investigate how non-invasive and invasive cells respond to cell crowding, respectively.

      The results clearly show that pre-malignant cells exhibit a more pronounced reduction in cell volume and are more prone to spreading compared to non-invasive cells. Furthermore, the study identifies that TRPV4, a calcium channel, relocates to the plasma membrane both in vitro and in vivo (patient's samples). Activation and inhibition of TRPV4 channel can modulate the cell volume and cell mobility. These results unveil a novel mechanism of mechanical sensing in cancer cells, potentially offering new avenues for therapeutic intervention targeting cancer metastasis by modulating TRPV4 activity. This is a very comprehensive study, and the data presented in the paper are clear and convincing. The study represents a very important advance in our understanding of the mechanical biology of cancer.

      We sincerely appreciate the reviewer’s insightful evaluation and invaluable recommendations for key additional experiments, which have significantly strengthened our manuscript.

    1. Author response:

      The following is the authors’ response to the original reviews.

      Public Reviews:

      Reviewer #1 (Public review):

      Summary:

      The study by Jena et al. addresses important questions on the fundamental mechanisms of genetic adaptation, specifically, does adaptation proceed via changes of copy number (gene duplication and amplification "GDA") or by point mutation. While this question has been worked on (for example by Tomanek and Guet) the authors add several important aspects relating to resistance against antibiotics and they clarify the ability of Lon protease to reduce duplication formation (previous work was more indirect).

      A key finding Jena et al. present is that point mutations after significant competition displace GDA. A second one is that alternative GDA constantly arise and displace each other (see work on GDA-2 in Figure 3). Finally, the authors found epistasis between resistance alleles that was contingent on lon. Together this shows an intricate interplay of lon proteolysis for the evolution and maintenance of antibiotic resistance by gene duplication.

      Strengths:

      The study has several important strengths: (i) the work on GDA stability and competition of GDA with point mutations is a very promising area of research and the authors contribute new aspects to it, (ii) rigorous experimentation, (iii) very clearly written introduction and discussion sections. To me, the best part of the data is that deletion of lon stimulates GDA, which has not been shown with such clarity until now.

      Weaknesses:

      The minor weaknesses of the manuscript are a lack of clarity in parts of the results section (Point 1) and the methods (Point 2).

      We thank the reviewer for their comments and suggestions on our manuscript. We also appreciate the succinct summary of primary findings that the Reviewer has taken cognisance of in their assessment, in particular the association of the Lon protease with the propensity for GDAs as well as its impact on their eventual fate. We have now revised the manuscript for greater clarity as suggested by Reviewer #1.

      Reviewer #2 (Public review):

      Summary:

      In this strong study, the authors provide robust evidence for the role of proteostasis genes in the evolution of antimicrobial resistance, and moreover, for stabilizing the proteome in light of gene duplication events.

      Strengths:

      This strong study offers an important interaction between findings involving GDA, proteostasis, experimental evolution, protein evolution, and antimicrobial resistance. Overall, I found the study to be relatively well-grounded in each of these literatures, with experiments that spoke to potential concerns from each arena. For example, the literature on proteostasis and evolution is a growing one that includes organisms (even micro-organisms) of various sorts. One of my initial concerns involved whether the authors properly tested the mechanistic bases for the rule of Lon in promoting duplication events. The authors assuaged my concern with a set of assays (Figure 8).

      More broadly, the study does a nice job of demonstrating the agility of molecular evolution, with responsible explanations for the findings: gene duplications are a quick-fix, but can be out-competed relative to their mutational counterparts. Without Lon protease to keep the proteome stable, the cell allows for less stable solutions to the problem of antibiotic resistance.

      The study does what any bold and ambitious study should: it contains large claims and uses multiple sorts of evidence to test those claims.

      Weaknesses:

      While the general argument and conclusion are clear, this paper is written for a bacterial genetics audience that is familiar with the manner of bacterial experimental evolution. From the language to the visuals, the paper is written in a boutique fashion. The figures are even difficult for me - someone very familiar with proteostasis - to understand. I don't know if this is the fault of the authors or the modern culture of publishing (where figures are increasingly packed with information and hard to decipher), but I found the figures hard to follow with the captions. But let me also consider that the problem might be mine, and so I do not want to unfairly criticize the authors.

      For a generalist journal, more could be done to make this study clear, and in particular, to connect to the greater community of proteostasis researchers. I think this study needs a schematic diagram that outlines exactly what was accomplished here, at the beginning. Diagrams like this are especially important for studies like this one that offer a clear and direct set of findings, but conduct many different sorts of tests to get there. I recommend developing a visual abstract that would orient the readers to the work that has been done.

      The reviewer’s comments regarding data presentation are well-taken. Since we already had a diagrammatic model that sums up the chief findings of our study (Figure 9), we have now provided schematics in Figures 1, 3, 5 and 8 to clarify the workflow of smaller sections of the study. We hope that these diagrams provide greater clarity with regards to the experiments we have conducted.

      Next, I will make some more specific suggestions. In general, this study is well done and rigorous, but doesn't adequately address a growing literature that examines how proteostasis machinery influences molecular evolution in bacteria.

      While this paper might properly test the authors' claims about protein quality control and evolution, the paper does not engage a growing literature in this arena and is generally not very strong on the use of evolutionary theory. I recognize that this is not the aim of the paper, however, and I do not question the authors' authority on the topic. My thoughts here are less about the invocation of theory in evolution (which can be verbose and not relevant), and more about engagement with a growing literature in this very area.

      The authors mention Rodrigues 2016, but there are many other studies that should be engaged when discussing the interaction between protein quality control and evolution.

      A 2015 study demonstrated how proteostasis machinery can act as a barrier to the usage of novel genes: Bershtein, S., Serohijos, A. W., Bhattacharyya, S., Manhart, M., Choi, J. M., Mu, W., ... & Shakhnovich, E. I. (2015). Protein homeostasis imposes a barrier to functional integration of horizontally transferred genes in bacteria. PLoS genetics, 11(10), e1005612

      A 2019 study examined how Lon deletion influenced resistance mutations in DHFR specifically: Guerrero RF, Scarpino SV, Rodrigues JV, Hartl DL, Ogbunugafor CB. The proteostasis environment shapes higher-order epistasis operating on antibiotic resistance. Genetics. 2019 Jun 1;212(2):565-75.

      A 2020 study did something similar: Thompson, Samuel, et al. "Altered expression of a quality control protease in E. coli reshapes the in vivo mutational landscape of a model enzyme." Elife 9 (2020): e53476.

      And there's a new review (preprint) on this very topic that speaks directly to the various ways proteostasis shapes molecular evolution:

      Arenas, Carolina Diaz, Maristella Alvarez, Robert H. Wilson, Eugene I. Shakhnovich, C. Brandon Ogbunugafor, and C. Brandon Ogbunugafor. "Proteostasis is a master modulator of molecular evolution in bacteria."

      I am not simply attempting to list studies that should be cited, but rather, this study needs to be better situated in the contemporary discussion on how protein quality control is shaping evolution. This study adds to this list and is a unique and important contribution. However, the findings can be better summarized within the context of the current state of the field. This should be relatively easy to implement.

      We thank the reviewer for their encouraging assessment of our manuscript as well as this important critique regarding the context of other published work that relates proteostasis and molecular evolution. Indeed, this was a particularly difficult aspect for us given the different kinds of literature that were needed to make sense of our study. We have now added the references suggested by the reviewer as well as others to the manuscript. We have also added a paragraph in the discussion section (Lines 463-476) that address this aspect and hopefully fill the lacuna that the reviewer points out in this comment.

      Reviewer #3 (Public review):

      Summary:

      This paper investigates the relationship between the proteolytic stability of an antibiotic target enzyme and the evolution of antibiotic resistance via increased gene copy number. The target of the antibiotic trimethoprim is dihydrofolate reductase (DHFR). In Escherichia coli, DHFR is encoded by folA and the major proteolysis housekeeping protease is Lon (lon). In this manuscript, the authors report the results of the experimental evolution of a lon mutant strain of E. coli in response to sub-inhibitory concentrations of the antibiotic trimethoprim and then investigate the relationship between proteolytic stability of DHFR mutants and the evolution of folA gene duplication. After 25 generations of serial passaging in a fixed concentration of trimethoprim, the authors found that folA duplication events were more common during the evolution of the lon strain, than the wt strain. However, with continued passaging, some folA duplications were replaced by a single copy of folA containing a trimethoprim resistance-conferring point mutation. Interestingly, the evolution of the lon strain in the setting of increasing concentrations of trimethoprim resulted in evolved strains with different levels of DHFR expression. In particular, some strains maintained two copies of a mutant folA that encoded an unstable DHFR. In a lon+ background, this mutant folA did not express well and did not confer trimethoprim resistance. However, in the lon- background, it displayed higher expression and conferred high-level trimethoprim resistance. The authors concluded that maintenance of the gene duplication event (and the absence of Lon) compensated for the proteolytic instability of this mutant DHFR. In summary, they provide evidence that the proteolytic stability of an antibiotic target protein is an important determinant of the evolution of target gene copy number in the setting of antibiotic selection.

      Strengths:

      The major strength of this paper is identifying an example of antibiotic resistance evolution that illustrates the interplay between the proteolytic stability and copy number of an antibiotic target in the setting of antibiotic selection. If the weaknesses are addressed, then this paper will be of interest to microbiologists who study the evolution of antibiotic resistance.

      Weaknesses:

      Although the proposed mechanism is highly plausible and consistent with the data presented, the analysis of the experiments supporting the claim is incomplete and requires more rigor and reproducibility. The impact of this finding is somewhat limited given that it is a single example that occurred in a lon strain and compensatory mutations for evolved antibiotic resistance mechanisms are described. In this case, it is not clear that there is a functional difference between the evolution of copy number versus any other mechanism that meets a requirement for increased "expression demand" (e.g. promoter mutations that increase expression and protein stabilizing mutations).

      We thank the reviewer for their in-depth assessment of our work and appreciate their concerns regarding reproducibility and rigor in analysis of our data. We have now incorporated this feedback and provided necessary clarifications/corrections in the revised version of our manuscript.

      Recommendations for the authors:

      Reviewer #1 (Recommendations for the authors):

      Major Points:

      (1) The authors show that a deletion of lon increases the ability for GDA and they argue that this is adaptive during TMP treatment because it increases the dosage of folA (L. 129). However, the highest frequency of GDA occurred in drug-free conditions (see Figure 1C). This indicates either that GDA is selected in drug-free media and potentially selected against by certain antibiotics. It would help for the authors to discuss this possibility more clearly.

      We thank the reviewer for this astute observation. It is indeed striking that the GDA mutation (i.e. the GDA-2 mutation) selected in a lon-deficient background does not come up in presence of antibiotics. To probe this further, we have now measured the relative fitness of a representative population of lon-knockout from short-term evolution in drug-free LB (population #3) that harbours GDA-2 against its ancestor (marked with DlacZ). These competition experiments were performed in LB (in which GDA-2 emerged spontaneously), as well as in LB supplemented with antibiotics at the concentrations used during the short term evolution.

      Values of relative fitness, w (mean ± SD from 3 measurements), are provided below:

      LB: 1.4 ± 0.2

      LB + Trimethoprim: 1.6 ± 0.2

      LB + Spectinomycin: 0.9 ± 0.2

      LB + Erythromycin: 1.3 ± 0.3

      LB + Nalidixic acid: 1.5 ± 0.2

      LB + Rifampicin: 1.4 ± 0.2

      These data show an increase in relative fitness in drug-free LB as would be expected. Interestingly, we also observe an increase in relative fitness in LB supplemented with antibiotics, except spectinomycin. This result supports the idea that GDA-2 is a “media adaptation” and provides a general fitness advantage to the lon knockout. However, as the reviewer pointed out, we should expect to see GDA-2 emerge spontaneously in antibiotic-supplemented media as well. We think that this does not happen as the fitness advantage of drug-specific mutations (GDAs or point mutations) far exceed the advantage of a media adaptation GDA. As a result, we only see the specific mutations that provide high benefit against the antibiotic at least over the relatively short duration of 20-25 generations. It is noteworthy the GDA-2 mutation does come up in LTMPR1 when it is passaged over >200 generations in drug-free media, but shows fluctuating frequency over time. We expect, therefore, that given enough time we may detect the GDA-2 mutations even in antibiotic-supplemented media.  

      We note, however, that a major caveat in the above fitness calculations is that we cannot be sure that the competing ancestor has no GDA-2 mutations during the course of the experiment. Thus, the above fitness values are only indicative and not definitive. We have therefore not included these data in the revised manuscript.

      (2) It is unclear if the isolates WTMPR1 - 5 and LTMPR1 - 5 were pure clones. The authors write in L.488 "Colonies were randomly picked, cultured overnight in drug-free LB and frozen in 50% glycerol at -80C until further use." And in L. 492 "For long-term evolution, trimethoprim-resistant isolates LTMPR1, WTMPR4 and WTMPR5 were first revived from frozen stocks in drug-free LB overnight." From these descriptions, it is possible that the isolates contained a fraction of cells of other genotypes since colonies are often formed by more than one cell and thus, unless pure-streaked, a subpopulation is present and would in drug-free media be maintained. The possibility of pre-existing subpopulations is important for all statements relating to "reversal".

      This is indeed a valid concern. As far as we can tell all our initial isolates (i.e. WTMPR1-5 and LTMPR1-5) are pure clones at least as far as SNPs are concerned. This is based on whole genome sequencing data that we have reported earlier in Patel and Matange, eLife (2021), where we described the evolution and isolation of WTMPR1-5 and the present study for LTMPR1-5. All SNPs detected were present at a frequency of 100%. For clones with GDAs, however, there is no way to eliminate a sub-population that has a lower or higher gene copy number than average from an isolate. This is because of the inherent instability of GDAs that will inevitably result in heterogeneous gene copy number during standard growth. In this sense, there is most certainly a possibility of a pre-existing subpopulation within each of the clones that may have reversed the GDA. Indeed, we believe that it is this inherent instability that contributes to their rapid loss during growth in drug-free media.

      Minor Points:

      (1) L. 406. "allowing accumulation of IS transposases in E. coli" Please specify that it is the accumulation of transposase proteins (and not genes).

      We have made this change.

      (2) L. 221 typo. Known "to" stabilize.

      We have made this change.

      Reviewer #2 (Recommendations for the authors):

      Most of my suggestions are found in the public review. I believe this to be a strong study, and some slight fixes can solidify its presence in the literature.

      We have attempted to address the two main critiques by Reviewer 2. To simplify the understanding of our data, we have provided small schematics at various points in the paper to clarify the experimental pipelines used by us. We have also provided additional discussion situating our study in the emerging area of proteostasis and molecular evolution. We hope that our revisions have addressed these lacunae in our manuscript.

      Reviewer #3 (Recommendations for the authors):

      Major Points:

      (1) The manuscript is generally a bit difficult to follow. The writing is overly complicated and lacks clarity at times. It should be simplified and improved.

      We have made several revisions to the text, as well as provided schematics in some of our figures which hopefully make our paper easier to understand.

      (2) I cannot find the raw variant summary data for the lon strain evolution experiment in trimethoprim (after 25 generations). Were there any other mutations identified? If not, this should be explicitly stated in the text and the variant output summary from sequencing included as supplemental data.

      We apologise for this oversight. We have now provided these data as Table 1.

      (3) What is the trimethoprim IC50 of the starting (pre-evolution) strains (i.e. wt and lon)? I can't find this information, but it is critical to interpretation.

      We had reported these values earlier in Matange N., J Bact (2020). Wild type and lon-knockout have similar MIC values for trimethoprim, though the lon mutant shows a higher IC50 value. We have now mentioned this in the results section (Line 100-101) and also provided the reference for these data.

      (4) What was the average depth of coverage for WGS? This information is necessary to assess the quality of the variant calling, especially for the population WGS.

      All genome sequencing data has a coverage at least 100x. We have added this detail to the methods section (Line 580-581).

      (5) Five replicate evolution experiments (25 generations, or 7x 10% daily batch transfers) were performed in trimethoprim for the wt and lon strains. Duplication of the folA locus occurred in 1/5 and 4/5 experiments, respectively. It is not entirely clear what type of sampling was actually done to arrive at these numbers (this needs to be stated more clearly), but presumably 1 random colony was chosen at the end of the passaging protocol for each replicate. Based on this result, the authors conclude that folA duplication occurred more frequently in the lon strain, however, this is not rigorously supported by a statistical evaluation. With N=5, one cannot rigorously conclude that a 20% frequency and 80% frequency are significantly different. Furthermore, it's not entirely clear what the mechanism of resistance is for these strains. For example, in one colony sequenced (LTMPR5), it appears no known resistance mechanism (or mutations?) were identified, and yet the IC50 = 900 nM, which is also similar to other strains.

      Indeed, we agree with the reviewer that we don’t have the statistical power to rigorously make this claim. However, since the lon-knockout showed us a greater frequency of GDA across 3 different environments we are fairly confident that loss of lon enhances the overall frequency for GDA mutations. This idea in also supported by a number of previous papers that related GDAs and IS-element transpositions with Lon, viz. Nicoloff et al, Antimicrob Agent Chemother (2007), Derbyshire et al. PNAS (1990), Derbyshire and Grindley, Mol Microbiol (1996). We have therefore not provided further justification in the revised manuscript.

      We had indeed sampled a random isolate from each of the 5 populations and have added a schematic to figure 1 that provides greater clarity.

      Having relooked at the sequencing data for LTMPR1-5 isolates (Table 1), we realised that both LTMPR4 and LTMPR5 harbour mutations in the pitA gene. We had missed this locus during the previous iteration of this manuscript and misidentified an mgrB mutations in LTMPR4. PitA codes for a metal-phosphate symporter. We have observed mutations in pitA in earlier evolution experiments with trimethoprim as well (Vinchhi and Yelpure et al. mBio 2023). Interestingly, in LTMPR5 there was a deletion of pitA, along with 17 other contiguous genes mediated by IS5. To test if loss of pitA is beneficial in trimethoprim, we tested the ability of a pitA knockout to grow on trimethoprim supplemented plates. Indeed, loss of pitA conferred a growth advantage to E. coli on trimethoprim, comparable to loss of mgrB, indicating that the mechanism of resistance of LTMPR5 may be due to loss of pitA. We have added these data to the Supplementary Figure 1 of the revised manuscript and provided a brief description in Lines 103-108. How pitA deficiency confers trimethoprim resistance is yet to be investigated. The mechanism is likely to be by activating some intrinsic resistance mechanism as loss of pitA also conferred a fitness benefit against other antibiotics. This work is currently underway in our lab and hence we do not provide any further mechanism in the present manuscript.

      (6) Although measurement error/variance is reported, statistical tests were not performed for any of the experiments. This is critical to support the rigor and reproducibility of the conclusions.

      We have added statistical testing wherever appropriate to the revised manuscript.

      (7) Lines 150-155 and Figure 2E: Putting a wt copy of mgrB back into the WTMPR4 and LTMPR1 strains would be a better experiment to dissect out the role of mgrB versus the other gene duplications in these strains on fitness. Without this experiment, you cannot confidently attribute the fitness costs of these strains to the inactivation of mgrB alone.

      We agree with the reviewer that our claim was based on a correlation alone. We have now added some new data to confirm our model (Figure 2 E, F). The costs of mgrB mutations come from hyperactivation of PhoQP. In earlier work we have shown that the costs (and benefit) of mgrB mutations can be abrogated in media supplemented with Mg<sup>2+</sup>, which turns off the PhoQ receptor (Vinchhi and Yelpure et al. mBio, 2023). We use this strategy to show that like the mgrB-knockout, the costs of WTMPR4, WTMPR5 and LTMPR1 can be almost completely alleviated by adding Mg<sup>2+</sup> to growth media. These results confirm that the source of fitness cost of TMP-resistant bacteria was not linked to GDA mutations, but to hyperactivation of PhoQP.

      (8) Figure 3F and G: Does the top symbol refer to the starting strain for the 'long-term' evolution? If so, why does WTMPR4 not have the mgrB mutation (it does in Figure 1)? Based on your prior findings, it seems odd that this strain would evolve an mgrB loss of function mutation in the absence of trimethoprim exposure.

      We thank the reviewer for pointing this error out. We have made the correction in the revised manuscript.

      (9) Figure 6A: If the marker is neutral, it should be maintained at 0.1% throughout the 'neutrality' experiment. In both plots, the proportion of some marked strains goes up and then down. This suggests either ongoing evolution (these competitions take place over 105 generations), or noisy data. I suspect these data are just inherently noisy. I don't see error bars in the plots. Were these experiments ever replicated? It seems that replicating the experiments might be able to separate out noise from signal and perhaps clarify this point and better confirm the hypothesis that the point mutants are more fit.

      These experiments were indeed noisy and the apparent enrichment is most likely a measurement error rather than a real change in frequency of competing genotypes. We have now provided individual traces for each of the competing pairs with mean and SD from triplicate observations at each time point.

      (10) Figure 6A: Please indicate which plotted line refers to which 'point mutant' using different colors. These mutants have different trimethoprim IC50s and doubling times, so it would be nice to be able to connect each mutant to its specific data plot.

      We thank the reviewer for this suggestion. We have now colour coded the different strain combinations as suggested.

      (11) Lines 284-285: I disagree that the IC50s are similar. The C-35T mutant has IC50 that is 2x that of LTMPR1. Perhaps more telling is that, compared to the folA duplication strain from the same time-point (which also carries the rpoS mutation), all of the point mutants have greater IC50s (~2x greater). 2-fold changes in IC50 are significant. It would seem that the point-mutants were likely not competing against LTMPR1 at the time they arose, so LTMPR1 might not be the best comparator if it was extinguished from the population early. I'm assuming this is why you chose a contemporary isolate (and, also, rpoS mutant) for the competition experiments. This should be explained more clearly.

      We thank the reviewer for this comment. Indeed, the reviewer is correct about the rationale behind the use of a contemporary isolate and we have provided this clarification in the revised manuscript (Line 287-289). Also, the reviewer is correct in pointing out that a two-fold difference in IC50 cannot be ignored. However, the key point here would be in assessing the differences in growth rates at the antibiotic concentration used during competition (i.e. 300 ng/mL). We are unable to see a direct correlation between the growth rates and enrichment in culture indicating that the observed trends are unlikely to be driven by ‘level of resistance’ alone. We have added these clarifications to the modified manuscript (Lines 299-301)

      Minor Points:

      (1) Line 13: Add a comma before 'Escherichia'

      We have made this change.

      (2) Line 14: Consider changing "mutations...were beneficial in trimethoprim" to "mutations...were beneficial under trimethoprim exposure"

      We have made this change.

      (3) Line 32: Is gene dosage really only "relative to the genome"? Is it not simply its relative copy number generally? Consider changing to "The dosage of a gene, or its relative copy number, can impact its level of expression..."

      We have made this change.

      (4) Line 38: The idea that GDAs are 1000x more frequent than point mutations seems an overgeneralization.

      We agree with the reviewer and have softened our claim.

      (5) Line 50: The term "hard-wired" is confusing. Please be more specific.

      We have modified this statement to “…GDAs are less stable than point mutations….”.

      (6) Line 52-53: What do you mean by "there is also evidence to suggest that...more common in bacteria than appreciated"? Are you implying the field is naïve to this fact? If there is "evidence" of this, then a reference should be included. However, it's not clear why this is important to state in the article. I would consider simply removing this sentence. Less is more in this case.

      We have removed this statement.

      (7) Lines 59-60: Enzymes catalyze reactions. Please also state the substrates for DHFR. Consider, "It catalyzes the NADPH-dependent reduction of dihydrofolate to tetrahydrofolate, and important co-factor for..."

      We have made this change.

      (8) Line 72: Please change to, "In E. coli, DHFR is encoded by folA." You do not need to state this is a gene, as it is implicit with lowercase italics.

      We have made this change.

      (9) Lines 72-86: This paragraph is a bit confusing to read, as it has several different ideas in it. Consider breaking it into two paragraphs at Line 80, "In this study,...". The first paragraph could just review the trimethoprim resistance mechanisms in E. coli and so would change the first sentence (Line 72) to reflect this topic: "In E. coli, DHFR is encoded by folA and several different resistance mechanisms have been characterized." Then, just describe each mechanism in turn. Also, by "hot spots" it would seem you are referring to "point mutations" in the gene that alter the protein sequence and cluster onto the 3D protein structure when mapped? Please be more specific with this sentence for clarity.

      We have made these changes.

      (10) Lines 92-93: Please also state the MIC value of the strain to specifically define "sub-MIC". Alternatively, you could also state the fraction MIC (e.g. 0.1 x MIC).

      We have modified this statement to “…in 300 ng/mL of trimethoprim (corresponding to ~0.3 x MIC) for 25 generations.”

      (11) Lines 95-96. Remove, "These sequencing have been reported earlier, ...(2021)". You just need to cite the reference.

      We have made this change.

      (12) Line 96: Remove the word "gene".

      We have made this change.

      (13) Figure 1 and Figure 4C: The color scheme is tough for those with the most common type of color blindness. Red/green color deficiency causes a lot of difficulty with Red/gray, red/green, green/gray. Consider changing.

      We thank the reviewer for bringing this to our notice. We have modified the colour scheme throughout the manuscript.

      (14) Figure 1: Was there a trimethoprim resistance mechanism identified for LTMPR5?

      As stated by us in response to major comment #7, LTMPR5’s resistance seems to come from a novel mechanism involving loss of the pitA gene.

      (15) Line 349-351: Please briefly define "lower proteolytic stability" as a relative susceptibility to proteolytic degradation and make sure it is clear to the reader that this causes less DHFR. This needs to be clarified because it is confusing how a mutation that causes DHFR proteolytic instability would lead to an increase in trimethoprim IC50. So, you also need to mention that some mutations can cause both increased trimethoprim inhibition and lower proteolytic stability simultaneously. It seems the Trp30Arg mutation is an example of this, as this mutation is associated with a net increase in trimethoprim resistance despite the competing effects of the mutation on enzyme inhibition and DHFR levels.

      We thank the reviewer for this comment and agree that the text in the original manuscript did not fully convey the message. We have made modifications to this section (Lines 359-363) in the revised manuscript in agreement with the reviewer’s suggestions.

    1. Author response:

      We would like to sincerely thank the editors and reviewers for their thoughtful comments, which provide valuable insights, and will help us enhance the overall quality of our manuscript. We will address all comments comprehensively in our revised submission.

      It appears to us that two major concerns were raised by the reviewers and highlighted by the editor, regarding statistical methodology and manuscript readability.

      As a provisional response, we would like to summarize our approach for addressing them in our revised manuscript:

      (1) Statistical Methodology

      Two specific concerns were raised regarding the statistical methods:

      First, regarding FDR versus FWE correction in our voxelwise (searchlight) analyses. We recognize that our methods section might have created some confusion on this point. While we stated that "all analyses are FDR-corrected unless noted otherwise", this was meant to refer only to ROI-based analyses. For all voxel-wise analyses, including searchlight RSA analyses, we actually employed FWE correction. This was briefly mentioned in the section on univariate analyses. However, we did not emphasize this information in the searchlight section of the methods, and it is to our understanding that this might have created some confusion.

      To clarify: we used (1) FWE correction for all voxel-based analyses and (2) FDR correction for ROI-based analyses (which could thus be considered exploratory). However, to fully address the concerns raised by the reviewers, and avoid potential confusion for the future readers, we will use exclusively FWE correction methods in the revised version of the manuscript. If some category of ROI-based analysis only yields not-significant results when corrected with FWE, we plan to report the uncorrected p-values, and pinpoint the exploratory nature of these results.

      Second, regarding the alpha threshold adjustment for searchlight analyses involving multiple comparisons within the same experimental phase: We acknowledge this concern and will address it thoroughly in our revision.

      (2) Manuscript Readability

      We agree that readability should be improved despite the paradigm's inherent complexity. In our revision, we will:

      - Replace non-essential technical terminology with clearer descriptions

      - Improve writing quality in particularly dense or conceptually complex sections

      - Enhance the overall structure to better guide readers through our methods and findings

    1. Author response:

      The following is the authors’ response to the original reviews.

      Public Reviews: 

      Reviewer #1 (Public Review):

      This manuscript presents a pipeline incorporating a deep generative model and peptide property predictors for the de novo design of peptide sequences with dual antimicrobial/antiviral functions. The authors synthesized and experimentally validated three peptides designed by the pipeline, demonstrating antimicrobial and antiviral activities, with one leading peptide exhibiting antimicrobial efficacy in animal models. However, the manuscript as it stands, has several major limitations on the computational side.

      Thanks for your comments. 

      Major issues:

      (1) The choice of GAN as the generative model. There are multiple deep generative frameworks (e.g., language models, VAEs, and diffusion models), and GANs are known for their training difficulty and mode collapse. Could the authors elaborate on the specific rationale behind choosing GANs for this task?

      We thank the reviewer for his/her concern on GAN models. We agree that there are some limitations of GAN itself such as its training difficulty, but we cannot deny its potential in generating biological sequences, especially in AMP generation. GAN and VAE are the two most commonly used generative models in the field of AMP design (Curr Opin Struct Biol 2023, 83:102733). AMPGAN (J Chem Inf Model, 2021, 61, 2198-2207.), Multi-CGAN (J Chem Inf Model 2024, 64, 1, 316–326), PepGAN (ACS Omega, 2020, 5, 22847-22851) and others have verified its application ability on peptide design. Moreover, PandoraGAN (Sn Comput Sci 2023, 4, 607) is one of the few works on AVP generation which is also based on GAN architecture. GAN updates the generator weights on the backpropagation from the discriminator directly rather than manually defined complicated loss function, which alleviates the reliance on input data. Our current results demonstrated that the trained GAN generator could produce novel sequences that featured high antimicrobial activity, both validated in silico and in vitro

      (2) The pipeline is supposed to generate peptides showing dual properties. Why were antiviral peptides not used to train the GAN? Would adding antiviral peptides into the training lead to a higher chance of getting antiviral generations?

      A major mechanism of antimicrobial peptides is to disrupt cell membranes. Thus, some antimicrobial peptides are reported with broad-spectrum antibacterial and antiviral activities, since the virus shares a membrane structure with bacteria, especially the enveloped viruses. In APD3 database, 244 of 3940 AMPs are labeled with antiviral activities. In constrast, most reported antiviral peptides inhibit the viruses by binding to specific targets (proteins and nucleic acids) related to viral proliferation so that they may not have antibacterial effects. Therefore, we trained the GAN with the AMP dataset. We chose this AMP dataset mainly for AMPredictor (with detailed logMIC label against E.coli) and then used the same dataset to train a GAN for simplification. 

      In the revised manuscript, we also tested adding available antiviral peptides from AVPdb to train the GAN model. The number of AVPs is 1,788 after removing overlaps with used AMP dataset. The GAN architecture and hyperparameters remain the same. After generating a batch of sequences with this trained generator, we scored them by AMPredictor and filtered them with five AVP classifiers. As expected, the predicted MIC values shifted to higher performance with 17 sequences < 5 μM and 39 sequences < 10 uM, and previous numbers are 26 and 42 in the manuscript. Among 39 sequences < 10 μM, 13 passed all five AVP classifiers and 17 passed four (33.3% and 43.6%, respectively). Previous ratios are 40.5% and 35.7% (17 and 15 out of 42). Two generators perform roughly the same for generating AVPs (76.9% vs. 76.1%) as evaluated by our rules (4 or more positives), but the generator trained solely with AMPs provided more AVPs with higher possibility (5 positives).

      We also experimentally tested dozens of generated peptides from two versions of generators (v1 for training solely on AMPs, v2 for training with AVPs, Figure 2 in revised manuscript). The ‘antiviral’ feature of a peptide was checked when significant inhibition was observed in immunofluorescence assays against HSV-1 at the concentration of 10 µM. Six and seven antiviral peptides were found out of 12 tested peptides from generators v1 and v2, respectively. Therefore, the success rates for two versions of generators are about 60% (including three reported peptides in the original manuscript) and show no significant difference.

      (3) For the antimicrobial peptide predictor, where were the contact maps of peptides sourced from?

      The contact maps of AMPs were predicted from ESM, which were obtained at the same time when obtaining the ESM embeddings (Methods section, Page 24, Line 538: Pretrained language model esm1b_t33_650M_UR50S was used to provide the embeddings and the contact maps.)

      (4) Morgan fingerprint can be used to generate amino acid features. Would it be better to concatenate ESM features with amino acid-level fingerprints and use them as node features of GNN?

      We thank the reviewer for this suggestion. We test using ESM and fingerprint (FP) features on graph nodes and the result is shown in Author response table 1. AMPredictor (ESM on nodes, FP after GNN) still performed slightly better than concatenating FP on node features on four regression metrics. 

      Author response table 1.

      Results of AMPredictor with fingerprint on nodes 

      (5) Although the number of labeled antiviral peptides may be limited, the input features (ESM embeddings) should be predictive enough when coupled with shallow neural networks. Have the authors tried simple GNNs on antiviral prediction and compared the prediction performance to those of existing tools?

      We thank the reviewer for his/her suggestion on AVP predictions. We haven’t tried it. An important reason is that we focused on developing regressors instead of binary classifiers. Currently available AVP data with numerical labels did not support training a reliable regressor, for their limited amount as well as heterogenous virus target and experimental assay. Therefore, we decided to use reported AVP classifiers as an additional filter following AMPredictor. Since only using one classifier may lead to bias, we chose five AVP classifiers as ensemble votes. 

      (6) Instead of using global alignment to get match scores, the authors should use local alignment.

      We calculated the match scores by global alignment methods referred to AMPGAN v2 (J Chem Inf Model 2021, 61, 2198−2207), CLaSS (Nat Biomed Eng 2021 5, 613–623), and AMPTrans-lstm (Comput Struct Biotechnol J 2022, 21, 463-471), to check the similarity between the generated sequences and any sequences in the training set. In addition, we also used local alignment to check the novelty of peptides (regarding the next question). 

      (7) How novel are the validated peptides? The authors should run a sequence alignment to get the most similar known AMP for each validated peptide, and analyze whether they are similar.

      We have listed the most similar AMP segments to our generated peptides from the training set and DRAMP database (28,233 sequences after filtering out those containing irregular characters). BLAST parameters were set as CLaSS (Nat Biomed Eng 2021 5, 613–623) for short peptides. The lowest Evalue of P001 aligned with the training set is 1.2, and no hits were found for P001 with DRAMP. Two E-values of P002 are 1.4 and 0.46. P076 had no hits in the training set and got a high E-value of 7.0 with DRAMP. Detailed alignments are shown below. This result indicates that our three validated AMPs are novel. 

      Since we generated more sequences using two versions of generator for validation, we also checked the BLAST E-value of these validated peptides. The results are listed in Table S3. All sequences obtained E-values > 0.1 and some of them had no hits when aligned with the training set or the DRAMP database. 

      Author response image 1.

      Alignments of three validated peptides.

      (8) Only three peptides were synthesized and experimentally validated. This is too few and unacceptable in this field currently. The standard is to synthesize and characterize several dozens of peptides at the very least to have a robust study.

      We thank the reviewer for the suggestion and promoted our models to generate >10 times more peptides in the revised manuscript. We have synthesized and tested more peptides in vitro and added these results in the revised manuscript (Figure 2). From two versions of generators (trained with or without AVPs), we selected 24 peptides in total for antibacterial and antiviral validations. All 24 peptides showed antibacterial activity towards at least bacterial strain, and 13 peptides were screened out through the quick antiviral test. This result indicates the capability of our design method for bifunctional AMPs with a notable success rate (60%).

      Reviewer #2 (Public Review):

      Summary:

      This study marks a noteworthy advance in the targeted design of AMPs, leveraging a pioneering deeplearning framework to generate potent bifunctional peptides with specificity against both bacteria and viruses. The introduction of a GAN for generation and a GCN-based AMPredictor for MIC predictions is methodologically robust and a major stride in computational biology. Experimental validation in vitro and in animal models, notably with the highly potent P076 against a multidrug-resistant bacterium and P002's broad-spectrum viral inhibition, underpins the strength of their evidence. The findings are significant, showcasing not just promising therapeutic candidates, but also demonstrating a replicable means to rapidly develop new antimicrobials against the threat of drug-resistant pathogens.

      Strengths:

      The de novo AMP design framework combines a generative adversarial network (GAN) with an AMP predictor (AMPredictor), which is a novel approach in the field. The integration of deep generative models and graph-encoding activity regressors for discovering bifunctional AMPs is cutting-edge and addresses the need for new antimicrobial agents against drug-resistant pathogens. The in vitro and in vivo experimental validations of the AMPs provide strong evidence to support the computational predictions. The successful inhibition of a spectrum of pathogens in vitro and in animal models gives credibility to the claims. The discovery of effective peptides, such as P076, which demonstrates potent bactericidal activity against multidrug-resistant A. baumannii with low cytotoxicity, is noteworthy. This could have far-reaching implications for addressing antibiotic resistance. The demonstrated activity of the peptides against both bacterial and viral pathogens suggests that the discovered AMPs have a wide therapeutic potential and could be effective against a range of pathogens.

      We thank the reviewer for the comments.

      Reviewer #3 (Public Review):

      Summary:

      Dong et al. described a deep learning-based framework of antimicrobial (AMP) generator and regressor to design and rank de novo antimicrobial peptides (AMPs). For generated AMPs, they predicted their minimum inhibitory concentration (MIC) using a model that combines the Morgan fingerprint, contact map, and ESM language model. For their selected AMPs based on predicted MIC, they also use a combination of antiviral peptide (AVP) prediction models to select AMPs with potential antiviral activity. They experimentally validated 3 candidates for antimicrobial activity against S. aureus, A. baumannii, E. coli, and P. aeruginosa, and their toxicity on mouse blood and three human cell lines. The authors select their most promising AMP (P076) for in vivo experiments in A. baumannii-infected mice. They finally test the antiviral activity of their 3 AMPs against viruses.

      Strengths:

      -The development of de novo antimicrobial peptides (AMPs) with the novelty of being bifunctional (antimicrobial and antiviral activity).

      -Novel, combined approach to AMP activity prediction from their amino acid sequence.

      Weaknesses:

      (1) I missed justification on why training AMPs without information of their antiviral activity would generate AMPs that could also have antiviral activity with such high frequency (32 out of 104).

      Thanks for your inquiry. A major mechanism of antimicrobial peptides is to disrupt cell membranes. Thus, some antimicrobial peptides are reported with broad-spectrum antibacterial and antiviral activities, since the virus shares a membrane structure with bacteria, especially the enveloped viruses. In APD3 database, 244 of 3940 AMPs are labeled with antiviral activities. However, several reported antiviral peptides inhibit the viruses by binding to specific targets (proteins and nucleic acids) related to viral proliferation so that they may not have antibacterial effects. Therefore, we trained the GAN with the AMP dataset. We chose this AMP dataset mainly for AMPredictor (with detailed logMIC label against E.coli) and then used the same dataset to train a GAN for simplification. In addition, it’s not 32 antiviral candidates out of 104 but 32 out of 42 peptides with predicted MIC < 10 µM because we did the filtering process stepwise. 

      In revision, we also tested adding available antiviral peptides from AVPdb to train the GAN model (generator v2). The number of AVPs is 1,788 after removing overlaps with used AMP dataset. The GAN architecture and hyperparameters remain the same. We used generator v2 to obtain a batch of sequences and screened out bifunctional candidates following the same procedure. 30 out of 39 peptides with predicted MIC < 10 µM passed four or five AVP predictors. Therefore, two generators perform roughly the same for generating AVP candidates (76.9% vs. 76.1%). 

      (2) The justification for AMP predictor advantages over previous tools lacks rationale, comparison with previous tools (e.g., with the very successful AMP prediction approach described by Ma et al. 10.1038/s41587-022-01226-0), and proper referencing.

      Thanks for your suggestion. Ma et al. proposed ensemble binary classification models to mine AMPs from metagenomes successfully. However, we concentrated on the development of regression models. As a regressor, AMPredictor predicts the specific logMIC value of the input sequences instead of giving a yes/no answer. Since the training settings and evaluation metrics are different for the classification and regression tasks, we could not compare AMPredictor with Ma et al. directly. Instead, we compared the performance of AMPredictor with some regression baseline models (Figure S2a) and our model outperformed them. 

      (3) Experimental validation of three de novo AMPs is a very low number compared to recent similar studies.

      Thanks for pointing out this shortcoming. We have synthesized and tested more peptides in vitro and added these results in the revised manuscript (Figure 2). From two versions of generators (trained with or without AVPs), we selected 24 peptides in total for antibacterial and antiviral validations. All 24 peptides showed antibacterial activity towards at least bacterial strain, and 13 peptides were screened out through the quick antiviral test. This result indicates the capability of our design method for bifunctional AMPs with a notable success rate (60%).

      (4) I have concerns regarding the in vivo experiments including i) the short period of reported survival compared to recent studies (0.1038/s41587-022-01226-0, 10.1016/j.chom.2023.07.001, 0.1038/s41551-022-00991-2) and ii) although in Figure 2 f and g statistics have been provided, log scale y-axis would provide a better comparative representation of different conditions.

      Thank you for your suggestions. 

      i) In current study, we monitored the survival of mice with peritoneal bacterial infection for 48 h.

      Because abdominal bacterial infection can induce severe sepsis and cause mouse death within 40 h (Sci Adv 2019, 5(7), eaax1946), the 48 h is sufficient to evaluate the therapeutic efficacy of antimicrobial peptides (Nat Biotechnol 2019, 37(10), 1186-1197).

      ii) In Figure 2f and 2g (3f and 3g in the revised manuscript), the y-axis has already been in log-scale and tick labels are marked in scientific notation.

      (5) I had difficulty reading the story because of the use of acronyms without referring to their full name for the first time, and incomplete annotation in figures and captions.

      Thank you for pointing this. We have checked the manuscript carefully and modified the figure captions during revision. 

      Reviewer #2 (Recommendations For The Authors):

      (1) To validate the generalizability of the model, it would be prudent to include data on AMPs targeting a broader range of bacteria and viruses. This could help ensure that the peptides designed are not narrowly focused on E. coli but are effective against a more extensive set of pathogens. 

      Thanks for your suggestions. We just incorporated AMPs with E. coli activity labels since it is the most common strain among available AMP databases. As for a regressive model (AMPredictor), the fitting object should be defined concisely, which means limited targeting bacteria. Some other articles also focused on E. coli labels as well (Nat Commun 2023, 14, 7197; mSystems 2023, 8, e0034523). 

      We used the same processed dataset to train the GAN generator for simplification. Most reported AMPs have the potential to target various microbes. We have counted the antimicrobial labels of these peptides in our dataset, shown in Figure S1b. In addition to E. coli, some of the peptides target Grampositive S. aureus, fungus C. albicans, and other bacterial species as well. Our experimental validation also reveals the wide spectrum of designed peptides inhibiting Gram-negative, Gram-positive, drugresistant bacteria, and enveloped viruses. With the expansion of well-curated AMP databases, we expect to update the model with larger scale datasets in the near future. 

      (2) Conduct sensitivity analyses to understand how minor changes in the peptide sequences impact the model’s predictions. This will reduce the chances of overlooking potential AMP candidates due to the model’s inability to capture subtle changes.

      Thank you for this valuable suggestion. We kept similar known peptide sequences in the training sets regarding that a single mutation may have an impact on their antimicrobial performances. We took P001 as an example to perform the sensitivity analysis by site saturation mutagenesis in silico. Author response image 2 represents the change of antimicrobial activity scores as predicted by AMPredictor. Since the predicted MIC of P001 is 0.949 µM (experimentally measured value is 0.80 µM), most single mutations lead to higher scores (i.e., worse performance), especially Asp (D) and Glu (E) residues with negative charges. The largest change value of single amino acid replacement is 25.51 (W6D). Although this value may not reflect the actual changes, it is enough to be distinguished when screening and ranking candidate sequences.

      Author response image 2.

      Site saturated mutagenesis of P001. Color shows the change of predicted MIC against E. coli as predicted by AMPredictor (lower score is better).

      (3) Given the relatively short length of the peptides, typically ranging from 10 to 20 residues, the authors might consider employing a fully-connected graph in the peptide’s graphical representation. This approach could potentially simplify the model without sacrificing the descriptive power due to the limited size of the peptides.

      Thanks for your suggestions. We tested fully-connected graph edge encodings and the results on the test set were shown in Author response table 2 below. We found that AMPredictor with peptide contact map still performed better on Pearson correlation coefficient and CI, while using fully-connected graphs reached a slightly improved RMSE and MSE. Nonetheless, using fully-connected graph demands about 10time memory and more computational costs when processing more complicated message-passing. Therefore, the involvement of structural information is still a preferred choice.

      Author response table 2.

      Results of AMPredictor with different graph edge encodings

      (4) Upon reviewing Table S1, it is apparent that the application of ESM embeddings alone achieves commendable prediction accuracy. It would be intriguing to investigate whether the adoption of the more recent ESM models-specifically the second-generation ESM2 t36_3B, t48_15B, and t33_650Mcould enhance model performance beyond that observed using the esm1b_t33_650M_UR50S model described in the manuscript. 

      Thanks for your suggestions. Here, we included various ESM2 models’ outputs as our node features and presented the results in Author response table 3. Notably, the dimensions of esm2_t36_3B and esm2_t48_15B are 2560 and 5120, respectively, while both esm2_t33_650M and esm1b_t33_650M are 1280 dimensions. 

      Interestingly, we found that larger models don’t lead to improved performance. ESM-1b version still holds the best metrics in RMSE, MSE, and Pearson correlation coefficient. This indicates that the choice of pretrained model versions depended on specific downstream tasks. 

      Author response table 3.

      Results of AMPredictor with different ESM versions

      (5) It may be pertinent to reevaluate the use of the MM-PBSA approach within the scope of this study. Typically, MM-PBSA is utilized to estimate the free energy differences between the bound and unbound states of solvated molecules. The application of MM-PBSA is to calculate binding energies between proteins and membranes is unconventional and infrequently documented in the literature. Therefore, it is recommended that the authors consider omitting this portion of the manuscript, or provide a robust justification for its inclusion and application in this context.

      Thanks for your comments on MM/PBSA methods. There have been several literatures using this approach to calculate peptide-membrane binding free energy (Langmuir 2016, 32, 1782-1790; J Cell Biochem 2018, 119, 9205-9216; J Chem Inf Model 2019, 59, 3262-3276; Molecular Therapy Oncolytics 2019, 16, 7-19; Microbiology Spectrum 2023, 11, e0320622; J Chem Inf Model 2023, 63, 5823-5833) and we referred to their settings, such as the dielectric constant. All of these works built similar all-atom systems including cationic antimicrobial peptides and membrane bilayers, and utilized MM/PBSA method to describe the absorption process of the peptide from an unbound initial state. The order of magnitude of our calculation results is consistent with other reported works. Additionally, computational results may provide supporting evidence and we discussed that this quantitative energy calculation should be considered along with other observed metrics. 

      Reviewer #3 (Recommendations For The Authors):

      The weaknesses I mentioned in the Public Review may be addressed by improving the writing and presentation and corrections to the text and figures.

      Thanks for your suggestion. We have carefully checked and improved the presentation of text and figures in the revised manuscript.

    1. Author response:

      The following is the authors’ response to the original reviews.

      Public Reviews:

      Reviewer #1 (Public review):

      Summary:

      The paper is well-organized, with clearly defined sections. The systematic review methodology is thorough, with clear eligibility criteria, search strategy, and data collection methods. The risk of bias assessment is also detailed and useful for evaluating the strength of evidence. The involvement of a patient panel is noticeable and positive, ensuring the research addresses real-world concerns and aligning scientific inquiry with patient perspectives. The statistical approach used for analyzing seems appropriate.

      The authors are encouraged to take into account the following points:

      As the authors have acknowledged, there is a high risk of bias across all included studies, particularly in randomization, selective outcome reporting, and incomplete data, which could be highlighted more explicitly in the paper's discussion section, particularly the potential implications for the generalizability of the results. The authors can also suggest mitigation strategies for future studies (e.g., better randomization, blinding, reporting standards, etc.).

      We agree that it is important to highlight mitigation strategies that will allow preclinical researchers to more transparently report future studies. We have directed readers to ensure reporting in alignment with the ARRIVE 2.0 guidelines for further details on reporting of preclinical studies, as follows in paragraph two of the Discussion, “Future studies should carefully incorporate all elements of the ARRIVE 2.0 guidelines to help ensure that all results are transparently reported and improve confidence in the findings.(41)”

      None of the studies include female animals, and the use of young adult animals (instead of aged models) limits the applicability of the findings to the human stroke population, where stroke incidence is higher in older adults and perhaps the gender issue must be included to reflect the translational aspects. The authors can add to the paper's discussion section that perhaps future preclinical studies should include both sexes and aged animals to align better with the clinical population and improve the translation of findings. Another point is the comorbidity. Comorbidities such as diabetes and hypertension are prevalent in stroke patients. How can these be considered in preclinical designs? The authors should emphasize the importance of future research incorporating such comorbid models to enhance clinical relevance. None of the studies had independent replication of their findings, which is a key limitation, especially for a field with high translational expectations. This should be highlighted as a critical next step for validating the efficacy of CCR5 antagonists.

      We agree that these are important evidence gaps to address. Although we highlighted these gaps in paragraph 3 of the Discussion, we have now added a more explicit call to action for researchers to address these gaps at the end of the relevant paragraph as follows, “Future preclinical research should aim to address these evidence gaps to further increase the clinical relevance and comprehensiveness of evidence for CCR5 antagonists in stroke.”

      The studies accessed limited cognitive outcomes (only one reported a cognitive outcome). Given the importance of cognitive recovery post-stroke, this is a gap to highlight in the discussion. Future studies should include more diverse and comprehensive behavioral assessments, including cognitive and emotional domains, to fully evaluate the therapeutic potential.

      We have expanded on this important point in paragraph four of the Discussion, which explores the alignment of the preclinical literature to the CAMAROS trial, as follows, “Finally, clinically relevant secondary outcomes in the CAMAROS trial, such as cognitive and emotional domains as measured by the Montreal Cognitive Assessment (MoCA) and Stroke Aphasia Depression Questionnaire (SADQ) were not modelled in the preclinical literature. Although one study included a cognitive outcome, the other treatment parameters of this study were not aligned to the CAMAROS trial. Future preclinical studies should assess a more diverse and comprehensive battery of clinically relevant behavioural tasks, which could be based on the range of outcomes employed in the CAMAROS trial, or those found in the SRRR recommendations.(9)”

      This addition highlights the lack of supporting preclinical evidence for cognitive recovery post-stroke. We also offer recommendations on discrete ways to address this gap in future preclinical studies by taking inspiration from the outcomes used in CAMAROS as well as the SRRR guidelines used throughout our assessment of the CCR5 literature.  

      The timing of CCR5 administration across studies varies widely (from pre-stroke to several days post-stroke) complicating the interpretation and comparison of results. The authors are encouraged to add that future preclinical studies could focus on narrowing the therapeutic window to more clinically relevant time points.

      We agree with the review and feel that this recommendation is currently captured in paragraph three of our Discussion -  “However, demonstration of efficacy under a wider range of conditions, such as in aged animals, females, animals with stroke-related comorbidities, more clinically relevant timing of dose administrations, or in conjunction with rehabilitative therapies are necessary to provide further confidence in these findings.” As mentioned above, we added a new sentence to the end of this paragraph to make it more explicit that these are gaps that should be addressed by future preclinical research. “Future preclinical research should aim to address these evidence gaps to further increase the clinical relevance and comprehensiveness of evidence for CCR5 antagonists in stroke.” We also added the word “clinically” to the original sentence mentioned above to more explicitly align with the reviewer’s recommendation.

      The paper identifies some alignment with clinical trials, but there are several gaps, too, particularly in the types of behavioral tests used in preclinical studies versus those in clinical trials. If this systematic review and meta-analysis aim to formulate a set of recommendations for future studies, it is important that the authors also propose specific preclinical behavioral tasks that could better align with clinical measures used in trials, like functional assessments related to human stroke outcomes.

      As mentioned above, we added a sentence to Discussion paragraph four, the comparison to the CAMAROS trial, that provides recommendations as to the behavioural tasks that would be useful to employ in future studies. Namely, “Future preclinical studies should assess a more diverse and comprehensive battery of clinically relevant behavioural tasks, which could be modelled after the range of outcomes employed in the CAMAROS trial, or those found in the SRRR recommendations.(9)” The SRRR recommendations that we reference here provide discrete consensus recommendations for interested readers on behavioural task selection, as well as priority rankings based on rodent species, to better align with clinical measures used in trials.

      The discussion needs some revisions. It could benefit from an expanded explanation of CCR5's mechanistic role in neuroplasticity and stroke recovery. For instance, linking CCR5 antagonism more closely with molecular pathways related to synaptic repair and remyelination would enhance the quality of the discussion and understanding of the drugs' potential.

      We have provided a synthesis of CCR5’s proposed mechanistic roles in the Supplementary Materials, Figure S1 (for a summary pathway diagram), and Table S3 (for a list of potential mechanistic pathways and supporting evidence presented in each paper). Given our focus on study quality and alignment with translational recommendations, we felt that it was more appropriate to not focus on mechanistic elements in the Discussion.  Indeed, the appraisal of the quality of support for each potential mechanism was beyond the scope of our present analysis.  

      While the tool is used to assess the risk of bias, it might be helpful to integrate a broader framework for evaluating the quality of included studies. This could include sample size justifications, statistical power analysis, or the use of pre-registration in animal studies. These elements can also introduce bias or minimize those if in place.

      We agree these are important and the SYRCLE risk of bias tool we used addresses many major domains of bias mentioned by the reviewer (e.g., selection bias, performance bias, detection bias, attrition bias, reporting bias). For example, the SYRCLE item of  “selective outcome reporting” domain address pre-registration by asking “Was the study protocol available and were all of the study’s pre-specified primary and secondary outcomes reported in the current manuscript?”. The SYRCLE Risk of Bias tool represents the current state of the art for risk of bias assessment in preclinical systematic reviews and aligns well with similar tools used clinically, such as the Cochrane Risk of Bias tool. Although the tool does not assess statistical power, we would note that this is considered to be a separate issue from internal validity, and it is the reason this is not even assessed by the Cochrane risk of bias tool used in clinical systematic reviews. 

      Please also highlight confounding factors that might have influenced the results in the included studies, such as variation in stroke models, dosing regimens, or behavioral assessment methods.

      We agree that exploring potential confounding factors is an important element of the assessment. We highlight potential confounding factors in several parts of the Results and Discussion, such as in our Synthesis of Behavioural Outcomes section, “…equivalent infarct volumes were not demonstrated between the treated and control groups in this cohort, which could potentially lead to confounding effects.” and Comprehensiveness of Preclinical Evidence section, “All studies tested both behavioral and histological outcomes and demonstrated neuroprotective effects, but most studies failed to measure and control post-stroke temperature, which could potentially confound the observed neuroprotection (Table S4).(32) Most histological measurements were also assessed at <72 hours, which could confound the observed neuroprotective effects if cell death was merely delayed.(32) For CCR5 antagonists as a post-stroke recovery-inducing treatment, one experiment assessed the effects of initiating CCR5 administration in a similar post-stroke phase as the CAMAROS trial. This experiment (Joy et al.)(6) did not demonstrate that each treatment group had equivalent baseline stroke volumes, which may potentially confound observed behavioral effects.”

      Although there are many factors that could potentially confound the observed results, we believe that we have addressed some of the most prominent examples that are known in the preclinical stroke literature. We expanded our statement in the final sentence of the Results to highlight this, “Overall, our assessments highlight a variety of knowledge gaps, potential confounding factors, and areas of misalignment between the preclinical evidence and clinical trial parameters that could be improved with further preclinical experimentation.

      There is some discussion of the meta-analysis' limitations due to the few studies, but this point could be more thoroughly addressed. Please consider including a more critical discussion of the limitations of pooling data from heterogeneous study designs, stroke models, and outcome measures. What can this lead to? Is it reliable to do so, or does it lack scientific rigor? The authors are encouraged to formulate a balanced discussion adding, positive and negative aspects.

      We appreciate the reviewer’s insightful comment regarding the limitations related to pooling data from heterogeneous study designs, stroke models, and outcome measures. We have added to the original limitations described in the first paragraph of our Discussion with additional text to provide a better balance about the potential risks and benefits of the meta-analysis strategy that we undertook in the present study.

      “Pooling data across heterogenous experimental designs, animal/stroke models, and treatment parameters, as we have done with the infarct volume analysis in the present study, can introduce variability that increases the risk of overestimating or underestimating the true effect of the intervention.(38) Treatment effects observed across model systems and therapeutic compounds may represent different biological mechanisms. Despite this potential limitation, meta-analysis can provide valuable insights, especially in preclinical settings where the sample sizes of individual studies may be too small to detect significant effects on their own. In these cases, pooling data across studies can help identify overarching estimates of benefits and harm, highlight subgroups of interest, and help guide areas of future research. As described in the results above, we attempted to mitigate the risks of inappropriate data pooling through careful investigation of heterogeneity, subgroup analyses, and differentiation between outcomes where we felt that meta-analytic pooling was (infarct volume) and was not (behavioural outcomes) appropriate. Overall, we believe that our results indicate that further investigation is warranted to determine the optimal timing of administration and behavioral domains under which CCR5 antagonists exhibit the strongest post-stroke neuroprotective and recovery-inducing effects.”

      The conclusion should more explicitly acknowledge that while CCR5 antagonists show potential, the findings are still preliminary due to the limitations in the preclinical studies (high bias risk, lack of diverse animal models). Overall, the conclusion can end with a call for rigorous, well-controlled, and replicated studies with improved alignment to clinical populations and trials to show that the conclusion remains inconclusive, considering what has been analyzed here.

      We modified our concluding paragraph to highlight that the current evidence should be considered preliminary, as follows, “In conclusion, CCR5 antagonists show promise in preclinical studies for stroke neuroprotection, corresponding reduction in impairment, as well as improved functional recovery related to neural repair in the late sub-acute/early chronic phase. However, high risk of bias and the limited (or no) evidence in clinically relevant domains underscore the need for more rigorous and transparent preclinical research to further strengthen the current preliminary evidence available in the literature.”

      Reviewer #2 (Public review):

      Summary:

      This is an interesting, timely, and high-quality study on the potential neuroprotective capabilities of C-C chemokine receptor type 5 (CCR5) antagonists in ischemic stroke. The focus is on preclinical investigations.

      Strengths:

      The results are timely and interesting. An outstanding feature is that stroke patient representatives have directly participated in the work. Although this is often called for, it is hardly realized in research practice, so the work goes beyond established standards.

      The included studies were assessed regarding the therapeutic impact and their adherence to current quality assurance guidelines such as STAIR and SRRR, another important feature of this work. While overall results were promising, there were some shortcomings regarding guideline adherence.

      The paper is very well written and concise yet provides much highly useful information. It also has very good illustrations and extremely detailed and transparent supplements.

      Weaknesses:

      Although the paper is of very high quality, a couple of items that may require the authors' attention to increase the impact of this exciting work further. Specifically:

      Major aspects:

      (1) I hope I did not miss that (apologies if I did), but when exactly was the search conducted? Is it possible to screen the recent literature (maybe up to 12/2024) to see whether any additional studies were published?

      We added the following statements to the “Information sources and search strategy” section of Materials and Methods to clarify the timing and intention of our search strategy, “The search was conducted October 25, 2022, to align with the listed launch date of the CAMAROS trial (September 15, 2022). Our intention in doing so was to collate and assess all preclinical evidence that could have feasibly informed the clinical trial. We sought to assess the comprehensiveness of evidence and readiness for translation of CCR5 antagonist drugs at the time of their actual translation into human clinical trials, as well as the alignment of the CAMAROS trial design to the existing preclinical evidence base.”

      Although we agree that an update of the search provides valuable information for the field, we believe that the studies entering the literature after the launch of the CAMAROS trial fill a different conceptual niche than those prior to trial launch (since newer preclinical studies explicitly did not inform decisions to move to clinical trials or clinical trial design). It is our view that newer studies should be assessed from a lens of how effectively they close knowledge gaps that were present at trial launch and emulate the conditions of clinical trial populations and design parameters (which represent the de facto most “clinically relevant” conditions). Such an analysis would require a different approach that is outside the scope and aims of the present study. The present study provides an assessment of the preclinical literature up to the date of the translation of CCR5 antagonist drugs into human clinical trials (via the CAMAROS trial), which we believe will serve as a valuable prospective benchmark for evaluating the predictiveness of preclinical evidence after the results of the CAMAROS trial emerge.

      (2) Please clearly define the difference between "study" and "experiment," as this is not entirely clear. Is an "experiment" a distinct investigation within a particular publication (=study) that can describe more than one such "experiment"? Thanks for clarifying.

      We have now added definitions for “studies” and “experiments” immediately after the first time they are mentioned in paragraph one of the Study Selection section of Results, as follows: “Herein, “studies” refer to the published articles as a unit, while “experiments” refer to distinct investigations within each published article used to test various hypotheses (i.e., a subunit of “studies” comprised of a select cohort of animals).”

      (3) Is there an opportunity to conduct a correlation analysis between the quality of a study (for instance, after transforming the ROB assessment into a kind of score) and reported effect sizes for particular experiments or studies? This might be highly interesting.

      This is an interesting suggestion, which under different circumstances could provide insights into potential associations between study quality and effect size, as have been observed in the literature (e.g., Macleod et al., 2008; PMID:18635842). However, we are unable to assess this relationship in the present dataset as all studies were scored as “high risk of bias”, meaning that there was no variability in terms of observed study quality.

      Recommendations for the authors:

      Reviewer #2 (Recommendations for the authors):

      Minor aspects:

      (1) The scope of the work is perfectly in line with very recent STAIR recommendations, which strongly suggest assessing potential interventions that may augment impact and improve outcomes in recanalization procedures (Wechsler et al., doi: 10.1161/STROKEAHA.123.044279; PMID 37886850). The authors may to discuss their work in light of these recent recommendations.

      We thank the reviewer for highlighting the more recent STAIR recommendation document, as well as its focus on assessing interventions in conjunction with recanalization procedures. An item related to the importance of combining novel interventions with established recanalization procedures was included as part of Table S4 but was not highlighted in the main text. We have added to the final paragraph of the Results section “Comprehensiveness of preclinical evidence” to highlight that no studies tested CCR5 antagonist drugs in conjunction with recanalization procedures as follows, “…no studies assessed behavioural effects on upper extremity skilled reaching / grasping or potential interactions of CCR5 antagonists with rehabilitative therapies or established recanalization procedures (Table S4).(35–38)” The Weschler reference provided by the reviewer has now been cited as well.

      (2) The authors may wish to consider the term "cerebroprotective" rather than "neuroprotective" unless neurons are the only cells to which a respective statement applies.

      We agree that “cerebroprotective” is the more appropriate term and have thus substituted it wherever we previously used “neuroprotective”.

      (3) The paper features a mixture between American (e.g.," hemorrhagic") and British English (e.g., "favours"). Although this is not untypical for Canadian English, deciding on one or the other may be an option.

      Given eLife’s basis in the UK, we have modified the language used throughout to be consistent with British English style.

    1. Author response:

      The following is the authors’ response to the original reviews.

      Public Reviews:

      Reviewer #1 (Public review):

      Summary:

      The manuscript entitled "Phosphodiesterase 1A Physically Interacts with YTHDF2 and Reinforces the Progression of Non-Small Cell Lung Cancer" explores the role of PDE1A in promoting NSCLC progression by binding to the m6A reader YTHDF2 and regulating the mRNA stability of several novel target genes, consequently activating the STAT3 pathway and leading to metastasis and drug resistance.

      Strengths:

      The study addresses a novel mechanism involving PDE1A and YTHDF2 interaction in NSCLC, contributing to our understanding of cancer progression.

      Weaknesses:

      The following issues should be addressed:

      (1) The body weight changes and/or survival times of each group in the in vivo metastasis studies should be provided.

      Thank you for your suggestion! We have already provided the body weight of each group in the in vivo metastasis studies in FigureS4D and FigureS5D (see below).

      (2) In Figure 7, the direct binding between YTHDF2 and the potential target genes should be further validated by silencing YTHDF2 to observe the half-life of the mRNA levels of target genes, in addition to silencing PDE1A.

      Thank you for your suggestion! We have found that siYTHDF2 does not significantly affect expression of SOCS2 in NSCLC cells (see author response image 1 below). We hypothesize that YTHDF2 functions as a m6A reader to recognize the target mRNA, thus if YTHDF2 is silence by siRNA, there is still some expression in the cells, allowing it to continue recognizing and exerting its function. Therefore, the mRNA of SOCS2 could not significantly affect expressed. However, PDE1A functions as a degrader of mRNA, thus when it is disrupted, the mRNA degradation effect could be strong.

      Author response image 1.

      SOCS2 mRNA expression after siYTHDF2 in NSCLC cells

      (3) In Figure 7, the potential methylation sites of "A" on the target genes such as SOCS2 should be verified by mutation analysis, followed by m6A IP or reporter assays.

      Thank you for your suggestion! The m6A IP or reporter assays may be carried out to detect the potential methylation sites in future. We have added the suggestion in manuscript “Meanwhile, YTHDF2 might act as an m6A RNA “reader” by interacting with PDE1A, but the mechanism might need further investigation”.

      (4) In Figure 6G, the correlation between the mRNA levels of STAT3 and YTHDF2 needs clarification. According to the authors' mechanism, the STAT3 pathway is activated, rather than upregulation of mRNA levels (or protein levels, as shown in Figure 6F). Figure 7 does not provide evidence that STAT3 is a bona fide target gene regulated by YTHDF2.

      Thank you for your suggestion! The reviewer is right, STAT3 pathway is activated, rather than upregulation of mRNA levels by YTHDF2, so the relationship between YTHDF2 mRNA and STAT3 mRNA is not suitable for this study. Meanwhile, the relationship between YTHDF2 mRNA and STAT3 mRNA is not as strong as we expected with Pearson value 0.37. Thus, we have already deleted Figure 6G in the revised version.

      (5) The final figure, which discusses sensitization to cisplatin by PDE1A suppression, does not appear to be closely related to the interaction or regulation of PDE1A/YTHDF2. If the authors claim this is an m6A-associated event, additional evidence is needed. Otherwise, this part could be removed from the manuscript.

      Thank you for your suggestion! We have already deleted Figure 8 just as the reviewer suggested.

      Reviewer #2 (Public review):

      This manuscript aims to investigate the biological impact and mechanisms of phosphodiesterase 1A (PDE1A) in promoting non-small cell lung cancer (NSCLC) progression. They first analyzed several databases and used three established NSCLC cell lines and a normal cell line to demonstrate that PDE1A is overexpressed in lung cancer and its expression negatively correlated with the outcomes of patients. Based on this data, they suggested PDE1A could be considered as a novel prognostic predictor in lung cancer treatment and progression. To study the biological function of PDE1A in NSCLC, they focused on testing the effect of inhibition of PDE1A genetically and pharmacologically on cell proliferation, migration, and invasion in vitro. They also used an experimental metastasis model via tail vein injection of H1299 cells to test if PDE1A promoted metastasis. By database analysis, they also decided to investigate if PDE1A promoted angiogenesis by co-culturing NSCLC cells with HUVECs as well as assessing the tumors from the subcutaneous xenograft model. However, in this model, whether PDE1A modulation impacted tumor metastasis was not examined. To address the mechanism of how PDE1A promotes metastasis, the authors again performed a bioinformatic and GSEA enrichment analysis and confirmed PDE1A indeed activated STAT3 signaling to promote migration. In combination with IP followed by Mass spectrometry, they found PDE1A is a partner of YTHDF2, the cooperation of PDE1A and YTHDF2 negatively regulated SOCS2 mRNA as demonstrated by RIP assay, and ultimately activated STAT3 signaling. Finally, the authors shifted the direction from metastasis to chemoresistance, specifically, they found that PDEA1 inhibitions sensitized NSCLC cells to cisplatin through MET and NRF2 signaling.

      Strength:

      Overall, the manuscript was well-written and the majority of the data supported the conclusions. The authors used a series of methods including cell lines, animal models, and database analysis to demonstrate the novel roles and mechanism of how PDE1 promotes NSCLC invasion and metastasis as well as cisplatin sensitivity. Given that PDE1A inhibitors have been perused to use in clinic, this study provided valuable findings that have the translational potential for NSCLC treatment.

      Weaknesses:

      The role of YTHDF2 in PDE1A-promoted tumor metastasis was not investigated. To make the findings more clinical and physiologically relevant, it would be interesting to test if inhibition of PDE1A impacts metastasis using lung cancer orthotopic and patient-derived xenograft models. It is also important to use a cisplatin-resistant NSCLC cell line to test if a PDE1A inhibitor has the potential to sensitize cisplatin in vitro and in vivo.

      Thank you for your suggestion! The role of YTHDF2 in PDE1A-promoted tumor metastasis may need in vivo analysis. Therefore, we discussed the point in the discussion section “In addition, it is worth testing if PDE1A inhibition affects metastasis in lung cancer orthotopic and patient-derived xenograft models. The role of YTHDF2 in PDE1A-driven tumor metastasis should be elucidated in future studies”.

      The reviewer is absolutely right, it is very important to use a cisplatin-resistant NSCLC cell line to test the potential effect of PDE1A in sensitization to cisplatin. The current data could not support the conclusion, more data is needed to make the final conclusion. As suggested by reviewer 1, we have deleted these data in this version.

      Furthermore, this study relied heavily on different database analyses, although providing novel and compelling data that was followed up and confirmed in the paper, it is critical to have detailed statistical description section on data acquisition throughout the manuscript.

      Thank you for your suggestion! We have already added the detailed statistical description section in Figure legends.

      Recommendations for the authors:

      Reviewer #1 (Recommendations for the authors):

      (1) Scale Bar Display: Scale bars should be included in Figures 4F, 5F, and 6E to ensure clarity and accuracy in the presented microscopic images.

      Thank you for your suggestion! We have already added the scale bars on Figures 4F, 5F, and 6E.

      (2) HE Staining Images: The authors are suggested to provide more images for HE staining of lungs to offer a comprehensive visual representation and to substantiate the findings.

      Thank you for your suggestion! We have already provided more images for HE staining of lungs in Figure S4E and Figure S5E.

      Reviewer #2 (Recommendations for the authors):

      It would be helpful to clarify several points in the manuscript for better understanding.

      (1)The HELF cells were stated between the epithelial cell line (page 7, line 118) and fibroblast (page 12, line 288) which needs to be clarified. It is not clear if the cells used in this study were periodically authenticated.

      Thank you for your suggestion! We have already revised the expression of HELF cells, and it is actually the human lung fibroblasts.

      (2) More details could be added to the methods such as the amount of Matrigel coated for invasion assay and the components for the lysis buffer and IP buffer.

      Thank you for your suggestion! We have already added more details in the Methods section.

      (3) Providing the rationale for using 20% FBS instead of using some chemoattracts such as EGF, LPA, or HGF or a low level of FBS for migration will be helpful.

      Thank you for your suggestion! Although chemoattracts are suitable for cell migration experiment, and 20% FBS is also suitable for cell migration experiment. We listed the literatures using this system below for example.

      (1) Xiaolin Peng, Zhengming Wang, Yang Liu. et al. Oxyfadichalcone C inhibits melanoma A375 cell proliferation and metastasis via suppressing PI3K/Akt and MAPK/ERK pathways, Life Sciences, 2018, 206, 35-44. https://doi.org/10.1016/j.lfs.2018.05.032

      (2) Rong, S., Dai, B., Yang, C. et al. HNRNPC modulates PKM alternative splicing via m6A methylation, upregulating PKM2 expression to promote aerobic glycolysis in papillary thyroid carcinoma and drive malignant progression. J Transl Med, 2024, 22, 914 (2024). https://doi.org/10.1186/s12967-024-05668-9

      (4) For HPA analysis In Figure 1, it would be great to assess how many lung cancer cases are NSCLC and define IDO/area for the y-axis.

      Thank you for your suggestion! There are 19 samples were analyzed, they are all NSCLC sample, and we have already revised our manuscript accordingly. Meanwhile, we also made a mistake, it should be IOD/area which means Integral optical density/area. We have revised the Figures and Figure legends.

      (5) On page 23, line 480, "Therefore, this study reveals the effect and mechanism of PDEA1 in promoting HCC metastasis...", should HCC be NSCLC?

      Thank you for your suggestion! We have already revised the manuscript accordingly.

      (6) Specific scramble siRNAs should be clearly shown in their respective figures. In Figure 7F, it is not clear why DMSO did not scramble siRNA was used as the control.

      Thank you for your suggestion! It is our fault to show the DMSO in Figure 5F, DMSO is the negative control of Figure 5G, and we have revised the Figure 5F and 5G accordingly.

    1. Author response:

      The following is the authors’ response to the original reviews.

      Common comments

      (1) Significance of zero mutation rate

      Reviewers asked why we included mutation rate even though setting mutation rate to zero doesn’t change results. We think that including non-zero mutation rate makes our results more generalisable, and thus is a strength rather than weakness. To better motivate this choice, we have added a sentence to the beginning of Results:

      (2) Writing the mu=0 case first

      Reviewers suggested that we should first focus on the mu=0 case, and then generalize the result. The suggestions are certainly good. However, given the large amount of work involved in a re-organization, we have decided to adhere to our current narrative. However, we now only include equations where mu=0 in the main text, and have moved the case of nonzero mutation rate to Supplementary Information.

      Making equations more accessible

      We have taken three steps to make equations more readable.

      ● Equations in the main text correspond to the case of zero-mutation rate.

      ● The original section on equation derivation is now in a box in the main text so that readers have the choice of skipping it but interested readers can still get a gist of where equations came from.

      We have provided a much more detailed interpretation of the equation:

      (3) Validity of the Gaussian approximation

      Reviewers raised concerns about the validity of Gaussian approximation on F suggest that𝑓( 𝜏this) approximation is reasonable. Still, we added a discussion frequency. The fact that our calculations closely match simulations about the validity of this approximation in Box 1.

      We also added to SI with various cases of initial S and F sizes. This figure not normal. However, if initial S and F are both on the order of hundreds,𝑓(𝜏) then shows that when either initial S or initial F is small, the distribution of    is the distribution of 𝑓(𝜏) is approximately Gaussian.

      Public Reviews:

      Summary:

      The authors demonstrate with a simple stochastic model that the initial composition of the community is important in achieving a target frequency during the artificial selection of a community.

      Strengths:

      To my knowledge, the intra-collective selection during artificial selection has not been seriously theoretically considered. However, in many cases, the species dynamics during the incubation of each selection cycle are important and relevant to the outcome of the artificial selection experiment. Stochasticity from birth and death (demographic stochasticity) plays a big role in these species' abundance dynamics. This work uses a simple framework to tackle this idea meticulously.

      This work may or may not be hysteresis (path dependency). If this is true, maybe it would be nice to have a discussion paragraph talking about how this may be the case. Then, this work would even attract the interest of people studying dynamic systems.

      We have added this clarification in the main text:

      “Note that here, selection outcome is path-dependent in the sense of being sensitive to initial conditions. This phenomenon is distinct from hysteresis where path-dependence results from whether a tuning parameter is increased or decreased.

      Weaknesses:

      (1) Connecting structure and function

      In typical artificial selection literature, most of them select the community based on collective function. Here in this paper, the authors are selecting a target composition. Although there is a schematic cartoon illustrating the relationship between collective function (y-axis) and the community composition in the main Figure 1, there is no explicit explanation or justification of what may be the origin of this relationship. I think giving the readers a naïve idea about how this structure-function relationship arises in the introduction section would help. This is because the conclusion of this paper is that the intra-collective selection makes it hard to artificially select a community that has an intermediate frequency of f (or s). If there is really evidence or theoretical derivation from this framework that indeed the highest function comes from the intermediate frequency of f, then the impact of this paper would increase because the conclusions of this stochastic model could allude to the reasons for the prevalent failures of artificial selection in literature.

      We have added this to introduction: “This is a common quest: whenever a collective function depends on both populations, collective function is maximised, by definition, at an intermediate frequency (e.g. too little of either population will hamper function [23]).”

      (2) Explain intra-collective and inter-collective selection better for readers.

      The abstract, the introduction, and the result section use these terms or intra-collective and inter-collective selection without much explanation. For the wide readership of eLife, a clear definition in the beginning would help the audience grasp the importance of this paper, because these concepts are at the core of this work.

      This is a great point. We have added in Abstract:

      “Such collective selection is dictated by two opposing forces: during collective maturation, intra-collective selection acts like a waterfall, relentlessly driving the S-frequency to lower values, while during collective reproduction, inter-collective selection resembles a rafter striving to reach the target frequency. Due to this model structure, maintaining a target frequency requires the continued action of inter-collective selection.”

      and in Introduction

      “A selection cycle consists of three stages (Fig. 1). During collective maturation, intra-collective selection favors fast-growing individuals within a collective. At the end of maturation, inter-collective selection acts on collectives and favors those achieving the target composition. Finally during collective reproduction, offspring collectives sample stochastically from the parents, a process dominated by genetic drift.”

      (3) Achievable target frequency strongly depending on the degree of demographic stochasticity.

      I would expect that the experimentalists would find these results interesting and would want to consider these results during their artificial selection experiments. The main Figure 4 indicates that the Newborn size N0 is a very important factor to consider during the artificial selection experiment. This would be equivalent to how much bottleneck is imposed on the artificial selection process in every iteration step (i.e., the ratio of serial dilution experiment). However, with a low population size, all target frequencies can be achieved, and therefore in these regimes, the initial frequency now does not matter much. It would be great for the authors to provide what the N0 parameter actually means during the artificial selection experiments. Maybe relative to some other parameter in the model. I know this could be very hard. But without this, the main result of this paper (initial frequency matters) cannot be taken advantage of by the experimentalists.

      We have added an analytical approximation for N0˘, the Newborn size below which all target frequencies can be achieved in SI.

      Also, we have added lines indicating N0˘ in Fig4a.

      (4) Consideration of environmental stochasticity.

      The success (gold area of Figure 2d) in this framework mainly depends on the size of the demographic stochasticity (birth-only model) during the intra-collective selection. However, during experiments, a lot of environmental stochasticity appears to be occurring during artificial selection. This may be out of the scope of this study. But it would definitely be exciting to see how much environmental stochasticity relative to the demographic stochasticity (variation in the Gaussian distribution of F and S) matters in succeeding in achieving the target composition from artificial selection.

      You are correct that our work considers only demographic stochasticity.

      Indeed, considering other types of stochasticity will be an exciting future research direction. We added in the main text:

      “Overall our model considers mutational stochasticity, as well as demographic stochasticity in terms of stochastic birth and stochastic sampling of a parent collective by offspring collectives. Other types of stochasticity, such as environmental stochasticity and measurement noise, are not considered and require future research.”

      (5) Assumption about mutation rates

      If setting the mutation rates to zero does not change the result of the simulations and the conclusion, what is the purpose of having the mutation rates \mu? Also, is the unidirectional (S -> F -> FF) mutation realistic? I didn't quite understand how the mutations could fit into the story of this paper.

      This is a great point. We have added this to the beginning of Results to better motivate our study:

      “We will start with a complete model where S mutates to F at a nonzero mutation rate µ. We made this choice because it is more challenging to attain or maintain the target frequency when the abundance of fast-growing F is further increased via mutations. This scenario is encountered in biotechnology: an engineered pathway will slow down growth, and breaking the pathway (and thus faster growth) is much easier than the other way around. When the mutation rate is set to zero, the same model can be used to capture collectives of two species with different growth rates.

      See answer on common question 1.

      (6) Minor points

      In Figure 3b, it is not clear to me how the frequency difference for the Intra-collective and the Inter-collective selection is computed.

      We added a description in caption 3b.

      In Figure 5b, the gold region (success) near the FF is not visible. Maybe increase the size of the figure or have an inset for zoom-in. Why is the region not as big as the bottom gold region?

      We increased the resolution of Fig 5b so that the gold region near FF is more visible.

      We have added Fig 5c and the following explanation to the main text:

      “From numerical simulations, we identified two accessible regions: a small region near FF and a band region spanning from S to F (gold in Fig. 5b i). Intuitively, the rate at which FF grows faster than S+F is greater than the rate at which F grows faster than S (see section VIII in Supplementary Information). Thus, the problem can initially be reduced to a two-population problem (i.e. FF versus F+S; Fig. 5c left), and then expanded to a three-population problem (Fig. 5c right).”

      Recommendations For The Authors

      Since the conclusion of the model greatly depends on the noise (variation) of F and S in the Gaussian distribution, it would be nice to have a plot where the y-axis is the variation in terms of frequency and the x-axis is the s_0 or f_0 (frequency). In the plot, I would love to see how the variation in the frequency depends on the initial frequency of S and F. Maybe this is just trivial.

      In the SI, we added Fig6a, as per your request. Previous Fig6 became Fig6b.

      Reviewer #2 (Public review):

      The authors provide an analytical framework to model the artificial selection of the composition of communities composed of strains growing at different rates. Their approach takes into account the competition between the targeted selection at the level of the meta-community and the selection that automatically favors fast-growing cells within each replicate community. Their main finding is a tipping point or path-dependence effect, whereby compositions dominated by slow-growing types can only be reached by community-level selection if the community does not start and never crosses into a range of compositions dominated by fast growers during the dynamics.

      These results seem to us both technically correct and interesting. We commend the authors on their efforts to make their work reproducible even when it comes to calculations via extensive appendices, though perhaps a table of contents and a short description of these appendices at the start of SI would help navigate them.

      Thank you for the suggestion. We have added a paragraph at the beginning of SI.

      The main limitation in the current form of the article is that it could clarify how its assumptions and findings differ from and improve upon the rest of the literature:

      -  Many studies discuss the interplay between community-level evolution and species- or strain-level evolution. But "evolution" can be a mix of various forces, including selection, drift/randomness, and mutation/innovation.

      - This work's specificity is that it focuses strictly on constant community-level selection versus constant strain-level selection, all other forces being negligible (neither stochasticity nor innovation/mutation matter at either level, as we try to clarify now).

      Note that intra-collective selection is not strictly “constant” in the sense that selection favoring F is the strongest at intermediate F frequency (Fig 3). However, we think that you mean that intra- and inter-collective selection are present in every cycle, and this is correct for our case, and for community selection in general.

      -  Regarding constant community-level selection, it is only briefly noted that "once a target frequency is achieved, inter-collective selection is always required to maintain that frequency due to the fitness difference between the two types" [pg. 3 {section sign}2]. In other words, action from the selector is required indefinitely to maintain the community in the desired state. This assumption is found in a fraction of the literature, but is still worth clarifying from the start as it can inform the practical applicability of the results.

      This is a good point. We have added to abstract:

      “Such collective selection is dictated by two opposing forces: during collective maturation, intra-collective selection acts like a waterfall, relentlessly driving the S-frequency to lower values, while during collective reproduction, inter-collective selection resembles a rafter striving to reach the target frequency. Due to this model structure, maintaining a target frequency requires the continued action of inter-collective selection.”

      - More importantly, strain-level evolution also boils down here to pure selection with a constant target, which is less usual in the relevant literature. Here, (1) drift from limited population sizes is very small, with no meaningful counterbalancing of selection, (2) pure exponential regime with constant fitness, no interactions, no density- or frequency-dependence, (3) there is no innovation in the sense that available types are unchanging through time (no evolution of traits such as growth rate or interactions) and (4) all the results presented seem unchanged when mutation rate mu = 0 (as noted in Appendix III), meaning that the conclusions are not "about" mutation in any meaningful way.

      With regard to point (1), Figure 4a (reproduced below) shows how Newborn size affects the region of achievable targets. Indeed at large Newborn size (e.g. 5000 and above), no target frequency is achievable (since drift is too small to generate sufficient inter-community variation and consequently all communities are dominated by fast-growing F). However at Newborn size of for example 1000, there are two regions of accessible target frequencies. At smaller Newborn size, all target frequencies become achievable due to drift becoming sufficiently strong.

      With regard to points (2) and (3), we have added to Introduction

      “To enable the derivation of an analytical expression, we have made the following simplifications.

      First, growth is always exponential, without complications such as resource limitation, ecological interactions between the two populations, or density-dependent growth. Thus, the exponential growth equation can be used. Second, we consider only two populations (genotypes or species): the fast-growing F population with size F and the slow-growing S population with size S. We do not consider a spectrum of mutants or species, since with more than two populations, an analytical solution becomes very difficult.”

      With regard to point (4), we view this as a strength rather than weakness. We have added the following to the beginning of Results and Discussions:

      “We will start with a complete model where S mutates to F at a nonzero mutation rate µ. We made this choice because it is more challenging to attain or maintain the target frequency when the abundance of fast-growing F is further increased via mutations.”

      “When the mutation rate is set to zero, the same model can be used to capture collectives of two species with different growth rates.”

      See Point 1 of Common comments.

      - Furthermore, the choice of mutation mechanism is peculiar, as it happens only from slow to fast grower: more commonly, one assumes random non-directional mutations, rather than purely directional ones from less fit to fitter (which is more of a "Lamarckian" idea). Given that mutation does not seem to matter here, this choice might create unnecessary opposition from some readers or could be considered as just one possibility among others.

      We have added the following justification:

      “This scenario is encountered in biotechnology: an engineered pathway will slow down growth, and breaking the pathway (and thus faster growth) is much easier than the other way around.”

      It would be helpful to have all these points stated clearly so that it becomes easy to see where this article stands in an abundant literature and contributes to our understanding of multi-level evolution, and why it may have different conclusions or focus than others tackling very similar questions.

      Finally, a microbial context is given to the study, but the assumptions and results are in no way truly tied to that context, so it should be clear that this is just for flavor.

      We have deleted “microbial” from the title, and revised our abstract:

      Recommendations For The Authors

      (1) More details concerning our main remark above:

      - The paragraph discussing refs [24, 33] is not very clear in how they most importantly differ from this study. Our impression is that the resource aspect is not very important for instance, and the main difference is that these other works assume that strains can change in their traits.

      We are fairly sure that resource depletion is important in Rainey group’s study, as the attractor only evolved after both strains grew fast enough to deplete resources by the end of maturation. Indeed, evolution occurred in interaction coefficients which dictate the competition between strains for resources.

      Regardless, you raised an excellent point. As discussed earlier, we have added the following:

      “To enable the derivation of an analytical expression, we have made the following simplifications.

      First, growth is always exponential, without complications such as resource limitation, ecological interactions between the two populations, or density-dependent growth. Thus, the exponential growth equation can be used. Second, we consider only two populations (genotypes or species): the fast-growing F population with size F and the slow-growing S population with size S. We do not consider a spectrum of mutants or species, since with more than two populations, an analytical solution becomes very difficult.”

      - We would advise the main text to focus on mu = 0, and only say in discussion that results can be generalized.

      Your suggestion is certainly good. However, given the large amount of work involved in a reorganisation, we have decided to adhere to our current narrative. However, as discussed earlier, we have added this at the beginning of Results to help orient readers:

      “We will start with a complete model where S mutates to F at a nonzero mutation rate µ. We made this choice because it is more challenging to attain or maintain the target frequency when the abundance of fast-growing F is further increased via mutations.”

      “When the mutation rate is set to zero, the same model can be used to capture collectives of two species with different growth rates.”

      (2) We think the material on pg. 5 "Intra-collective evolution is the fastest at intermediate F frequencies, creating the "waterfall" phenomenon", although interesting, could be presented in a different way. The mathematical details on how to find the probability distribution of the maximum of independent random variables (including Equation 1) will probably be skipped by most of the readers (for experienced theoreticians, it is standard content; for experimentalists, it is not the most relevant), as such I would recommend displacing them to SM and report only the important results.

      This is an excellent suggestion. We have put a sketch of our calculations in a box in the main text to help orient interested readers. As before, details are in SI.

      Similarly, Equations 2, 3, and 4 are hard to read given the large amount of parameters and the low amount of simplification. Although exploring the effect of the different parameters through Figures 3 and 4 is useful, I think the role of the equations should be reconsidered:

      i. Is it possible to rewrite them in terms of effective variables in a more concise way?

      See Point 3 of Common comments.

      ii. Is it possible to present extreme/particular cases in which they are easier to interpret?

      We have focused on the case where the mutation rate is zero. This makes the mathematical expressions much simpler (see above).

      (3) Is it possible to explain more in detail why the distribution of f_k+1 conditional to f_k^* is well approximated by a Gaussian? Also, have you explored to what extent the results would change if this were not true (in light of the few universal classes for the maximum of independent variables)?

      Despite the appeal to the CLT and the histograms in the Appendix suggesting that the distribution looks a bit like a Gaussian at a certain scale, fluctuations on that scale are not necessarily what is relevant for the results - a rapid (and maybe wrong) attempt at a characteristic function calculation suggests that in your case, one does not obtain convergence to Gaussians unless we renormalize by S(t=0) and F(t=0), so it seems there is a justification missing in the text as is for the validity of this approximation (or that it is simply assumed).

      See point 4 of Common comments.

      Reviewer #3 (Public Reviews):

      The authors address the process of community evolution under collective-level selection for a prescribed community composition. They mostly consider communities composed of two types that reproduce at different rates, and that can mutate one into the other. Due to such differences in 'fitness' and to the absence of density dependence, within-collective selection is expected to always favour the fastest grower, but the collective-level selection can oppose this tendency, to a certain extent at least. By approximating the stochastic within-generation dynamics and solving it analytically, the authors show that not only high frequencies of fast growers can be reproducibly achieved, aligned with their fitness advantage. Small target frequencies can also be maintained, provided that the initial proportion of fast growers is sufficiently small. In this regime, similar to the 'stochastic corrector' model, variation upon which selection acts is maintained by a combination of demographic stochasticity and of sampling at reproduction. These two regions of achievable target compositions are separated by a gap, encompassing intermediate frequencies that are only achievable when the bottleneck size is small enough or the number of communities is (disproportionately) larger.

      A similar conclusion, that stochastic fluctuations can maintain the system over evolutionary time far from the prevalence of the faster-growing type, is then confirmed by analyzing a three-species community, suggesting that the qualitative conclusions of this study are generalizable to more complex communities.

      I expect that these results will be of broad interest to the community of researchers who strive to improve community-level selection, but are often limited to numerical explorations, with prohibitive costs for a full characterization of the parameter space of such embedded populations. The realization that not all target collective functions can be as easily achieved and that they should be adapted to the initial conditions and the selection protocol is also a sobering message for designing concrete applications.

      A major strength of this work is that the qualitative behaviour of the system is captured by an analytically solvable approximation so that the extent of the 'forbidden region' can be directly and generically related to the parameters of the selection protocol.

      Thanks so much for these positive comments.

      I however found the description of the results too succinct and I think that more could be done to unpack the mathematical results in a way that is understandable to a broader audience. Moreover, the phenomenon the authors characterize is of purely ecological nature. Here, mutations of the growth rate are, in my understanding, neither necessary (non-trivial equilibria can be maintained also when \mu =0) nor sufficient (community-level selection is necessary to keep the system far from the absorbing state) for the phenomenon described. Calling this dynamics community evolution reflects a widespread ambiguity, and is not ascribable just to this work. I find that here the authors have the opportunity to make their message clearer by focusing on the case where the 'mutation' rate \mu vanishes (Equations 39 & 40 of the SI) - which is more easily interpretable, at least in some limits - while they may leave the more general equations 3 & 4 in the SI.

      See points 1-4 of Common comments.

      Combined with an analysis of the deterministic equations, that capture the possibility of maintaining high frequencies of fast growers, the authors could elucidate the dynamics that are induced by the presence of a second level of selection, and speculate on what would be the result of real open-ended evolution (not encompassed by the simple 'switch mutations' generally considered in evolutionary game theory), for instance discussing the invasibility (or not) of mutant types with slightly different growth rates.

      Indeed, evolution is not restricted to two types. However, our main goal here is to derive an analytical expression, and it was difficult for even two types. For three-type collectives, we had to resort to simulations. Investigating the case where fitness effects of mutations are continuously distributed is beyond the scope of this study.

      The single most important model hypothesis that I would have liked to be discussed further is that the two types do not interact. Species interactions are not only essential to achieve inheritance of composition in the course of evolution but are generally expected to play a key role even on ecological time scales. I hope the authors plan to look at this in future work.

      In our system, the S and F do interact in a competitive fashion: even though S and F are not competing for nutrients (which are always in excess), they are competing for space. This is because a fixed number of cells are transferred to the next cycle. Thus, the presence of F will for example reduce the chance of S being propagated. We have added this clarification to our main text:

      “Note that even though S and F do not compete for nutrients, they compete for space: because the total number of cells transferred to the next cycle is fixed, an overabundance of one population will reduce the likelihood of the other being propagated.”

      Recommendations For The Authors

      I felt the authors could put some additional effort into making their theoretical results meaningful for a population of readers who, though not as highly mathematically educated as they are, can nonetheless appreciate the implications of simple relations or scaling. Below, you find some suggestions:

      (1) In order to make it clear that there is a 'natural' high-frequency equilibrium that can be reached even in the absence of selection, the authors could examine first the dynamics of the deterministic system in the absence of mutations, and use its equilibria to elucidate the combined role of the 'fitness' difference \omega and of the generation duration \tau in setting its value. The fact that these parameters always occur in combination (when there are no mutations) is a general and notable feature of the stochastic model as well. Moreover, this model would justify why you only focus on decreasing the frequency in the new generation.

      Note that the ‘natural’ high-frequency equilibrium in the absence of collective selection is when fast grower F becomes fixed in the population. Following your suggestion, we have introduced two parameters 𝑅τ and 𝑊τ to reflect the coupling between ‘fitness’ and ‘generation duration’:

      (2) Since the phenomenon described in the paper is essentially ecological in nature (as the author states, it does not change significantly if the 'mutation rate' \mu is set to zero), I would put in the main text Equations 39 & 40 of the SI in order to improve intelligibility.

      See Point 2 at the beginning of this letter.

      These equations can be discussed in some detail, especially in the limit of small f^*_k, where I think it is worth discussing the different dependence of the mean and the variance of the frequency distribution on the system's parameters.

      This is a great suggestion. We have added the following:

      “In the limit of small , Equation (3) becomes f while Equation (4) becomes . Thus, both Newborn size (N<sub>0</sub>) and fold-change in F/S during maturation (W<sub>τ</sub>) are important determinants of selection progress.

      (3) I would have appreciated an explanation in words of what are the main conceptual steps involved in attaining Equation 2, the underlying hypotheses (notably on community size and distributions), and the expected limits of validity of the approximation.

      See points 3 and 4 at the beginning of this letter.

      (4) I think that some care needs to be put into explaining where extreme value statistics is used, and why is the median of the conditional distribution the most appropriate statistics to look at for characterizing the evolutionary trajectory (which seems to me mostly reliant on extreme values).

      Great point! We added an explanation of using median value in Box 1.

      and also added figure 7 to explaining it in SI.

      Showing in a figure the different distributions you are considering (for instance, plotting the conditional distribution for one generation in the trajectories displayed in Figure 2) would be useful to understand what information \bar f provides on a sequence of collective generations, where in principle there may be memory effects.

      Thanks for this suggestion. We have added to Fig 2d panel to illustrate the shape and position of F frequency distributions in each step in the first two selection cycles.

      (5) Similarly, I do not understand why selecting the 5% best communities should push the system's evolution towards the high-frequency solution, instead of just slowing down the improvement (unless you are considering the average composition of the top best communities - which should be justified). I think that such sensitivity to the selection intensity should be appropriately referenced and discussed in the main text, as it is a parameter that experimenters are naturally led to manipulate.

      In the main text, we have added this explanation:

      “In contrast with findings from an earlier study [23], choosing top 1 is more effective than the less stringent “choosing top 5%”. In the earlier study, variation in the collective trait is partly due to nonheritable factors such as random fluctuations in Newborn biomass. In that context, a less stringent selection criterion proved more effective, as it helped retain collectives with favorable genotypes that might have exhibited suboptimal collective traits due to unfavorable nonheritable factors. However, since this study excludes nonheritable variations in collective traits, selecting the top 1 collective is more effective than selecting the top 5% (see Fig. 11 in Supplementary Information).”

      (6) Equation 1 could be explained in simpler terms as the product between the probability that one collective reaches the transmitted value times the probability that all others do worse than that. The current formulation is unclear, perhaps just a matter of English formulation.

      We have revised our description to state:

      “Equation (1) can be described as the product between two terms related to probability: (i) describes the probability density that any one of the g Adult collectives achieves f given , and (ii) describes the probability that all other g – 1 collectives achieve frequencies above f and thus not selected.”

      (7) I think that the discussion of the dependence of the boundaries of the 'waterfall' region with the difference in growth rate \omega is important and missing, especially if one wants to consider open-ended evolution of the growth rate - which can occur at steps of different magnitude.

      We added a new chapter and figure in supplementary information on the threshold values when \omega varies. As expected, smaller \omega enlarges the success area.

      We have also added a new figure panel to show how maturation time affects selection efficacy.

      (8) Notations are a bit confusing and could be improved. First of all, in most equations in the main text and SI, what is initially introduced as \omega appears as s. This is confusing because the letter s is also used for the frequency of the slow type.

      The letter S is used to denote an attribute of cells (S cells), the type of cells (Equations 1-3 of the SI) and the number of these cells in the population, sometimes with different meanings in the same sentence. This is confusing, and I suggest referring to slow cells or fast cells instead (or at least to S-cells and F-cells), and keeping S and F as variables for the number of cells of the two types.

      All typos related to the notation have been fixed. We use S and F as types, and S and F (italic) and population numbers.

      (9) On page 3, when introducing the sampling of newborns as ruled by a binomial distribution, the information that you are just transmitting one collective is needed, while it is conveyed later.

      We have added this emphasis:

      “At the end of a cycle, a single Adult with the highest function (with F frequency f closest to the target frequency ) is chosen to reproduce g Newborn collectives each with N<sub>0</sub> cells (‘Selection’ and ’Reproduction’ in Fig. 1).”

      (10) I found that the abstract talks too early about the 'waterfall' phenomenon. As this is a concept introduced here, I suggest the authors first explain what it is, then use the term. It is a useful metaphor, but it should not obscure the more formal achievements of the paper.

      We feel that the “waterfall” analogy offers a gentle helping hand to orient those who have not thought much about the phenomenon. We view abstract as an opportunity to attract readership, and thus the more accessible the better.

      (11) In the SI there are numerous typos and English language issues. I suggest the authors read carefully through it, and add line numbers to the next version so that more detailed feedback is possible.

      Thank you for going through SI. We have gone through the SI, and fixed problems.

  2. Feb 2025
    1. Author response:

      The following is the authors’ response to the previous reviews.

      Reviewer #1 (Public Review):

      Summary:

      This paper presents a compelling and comprehensive study of decision-making under uncertainty. It addresses a fundamental distinction between belief-based (cognitive neuroscience) formulations of choice behavior with reward-based (behavioral psychology) accounts. Specifically, it asks whether active inference provides a better account of planning and decision making, relative to reinforcement learning. To do this, the authors use a simple but elegant paradigm that includes choices about whether to seek both information and rewards. They then assess the evidence for active inference and reinforcement learning models of choice behavior, respectively. After demonstrating that active inference provides a better explanation of behavioral responses, the neuronal correlates of epistemic and instrumental value (under an optimized active inference model) are characterized using EEG. Significant neuronal correlates of both kinds of value were found in sensor and source space. The source space correlates are then discussed sensibly, in relation to the existing literature on the functional anatomy of perceptual and instrumental decision-making under uncertainty.

      We are deeply grateful for your careful review of our work and your suggestions. Your insights have helped us identify areas where we can strengthen the arguments and clarify the methodology. We hope to apply the idea of active inference to our future work, emphasizing the integrity of perception and action.

      Reviewer #1 (Recommendations For The Authors):

      Many thanks for attending to my previous suggestions. I think your presentation is now much clearer and nicely aligned with the active inference literature.

      There is one outstanding issue. I think you have overinterpreted the two components of epistemic value in Equation 8. The two components that you have called the value of reducing risk and the value of reducing ambiguity are not consistent with the normal interpretation. These two components are KL divergences that measure the expected information gain about parameters and states respectively.

      If you read the Schwartenbeck et al paper carefully, you will see that the first (expected information gain about parameters) is usually called novelty, while the second (expected information gain about states) is usually called salience.

      This means you can replace "the value of reducing ambiguity" with "novelty" and "the value of reducing risk" with "salience".

      For your interest, "risk" and "ambiguity" are alternative ways of decomposing expected free energy. In other words, you can decompose expected free energy into (negative) expected information gain and expected value (as you have done). Alternatively, you can rearrange the terms and express expected free energy as risk and ambiguity. Look at the top panel of Figure 4 in:

      https://www.sciencedirect.com/science/article/pii/S0022249620300857

      I hope that this helps.

      We deeply thank you for your recommendations about the interpretation of the epistemic value in Equation 8. We have now corrected them to Novelty and Salience:

      In addition, in order to avoid terminology conflicts with active inference and to describe these two different uncertainties, we replaced Ambiguity in the article with Novelty, referring to the uncertainty that can be reduced by sampling, and replaced Risk with Variability, referring to the uncertainty inherent in the environment (variance).

      Reviewer # 2 (Public Review):

      Summary:

      Zhang and colleagues use a combination of behavioral, neural, and computational analyses to test an active inference model of exploration in a novel reinforcement learning task..

      Strengths:

      The paper addresses an important question (validation of active inference models of exploration). The combination of behavior, neuroimaging, and modeling is potentially powerful for answering this question.

      I appreciate the addition of details about model fitting, comparison, and recovery, as well as the change in some of the methods.

      We are deeply grateful for your careful review of our work and your suggestions. And we are also very sorry that in our last responses, there were a few suggestions from you that we did not respond them appropriately in our manuscript. We hope to be able to respond to these suggestions well in this revision. Thank you for your contribution to ensuring the scientificity and reproducibility of the work.

      The authors do not cite what is probably the most relevant contextual bandit study, by Collins & Frank (2018, PNAS), which uses EEG.

      The authors cite Collins & Molinaro as a form of contextual bandit, but that's not the case (what they call "context" is just the choice set). They should look at the earlier work from Collins, starting with Collins & Frank (2012, EJN).

      We deeply thank you for your comments. Now we add the relevant citations in the manuscript (line 46):

      “These studies utilized different forms of multi-armed bandit tasks, e.g the restless multi-armed bandit tasks (Daw et al., 2006; Guha et al., 2010), risky/safe bandit tasks (Tomov et al., 2020; Fan et al., 2022; Payzan et al., 2013), contextual multi-armed bandit tasks (Collins & Frank, 2018; Schulz et al., 2015; Collins & Frank, 2012)”

      Daw, N. D., O'doherty, J. P., Dayan, P., Seymour, B., & Dolan, R. J. (2006). Cortical substrates for exploratory decisions in humans. Nature, 441(7095), 876-879.

      Guha, S., Munagala, K., & Shi, P. (2010). Approximation algorithms for restless bandit problems. Journal of the ACM (JACM), 58(1), 1-50.

      Tomov, M. S., Truong, V. Q., Hundia, R. A., & Gershman, S. J. (2020). Dissociable neural correlates of uncertainty underlie different exploration strategies. Nature communications, 11(1), 2371.

      Fan, H., Gershman, S. J., & Phelps, E. A. (2023). Trait somatic anxiety is associated with reduced directed exploration and underestimation of uncertainty. Nature Human Behaviour, 7(1), 102-113.

      Payzan-LeNestour, E., Dunne, S., Bossaerts, P., & O’Doherty, J. P. (2013). The neural representation of unexpected uncertainty during value-based decision making. Neuron, 79(1), 191-201.

      Collins, A. G., & Frank, M. J. (2018). Within-and across-trial dynamics of human EEG reveal cooperative interplay between reinforcement learning and working memory. Proceedings of the National Academy of Sciences, 115(10), 2502-2507.

      Schulz, E., Konstantinidis, E., & Speekenbrink, M. (2015, April). Exploration-exploitation in a contextual multi-armed bandit task. In International conference on cognitive modeling (pp. 118-123).

      Collins, A. G., & Frank, M. J. (2012). How much of reinforcement learning is working memory, not reinforcement learning? A behavioral, computational, and neurogenetic analysis. European Journal of Neuroscience, 35(7), 1024-1035.

      Placing statistical information in a GitHub repository is not appropriate. This needs to be in the main text of the paper. I don't understand why the authors refer to space limitations; there are none for eLife, as far as I'm aware.

      We deeply thank you for your comments. We calculated the average t-value of the brain regions with significant results over the significant time, and added the t-value results to the main text and supplementary materials.

      In answer to my question about multiple comparisons, the authors have added the following: "Note that we did not attempt to correct for multiple comparisons; largely, because the correlations observed were sustained over considerable time periods, which would be almost impossible under the null hypothesis of no correlations." I'm sorry, but this does not make sense. Either the authors are doing multiple comparisons, in which case multiple comparison correction is relevant, or they are doing a single test on the extended timeseries, in which case they need to report that. There exist tools for this kind of analysis (e.g., Gershman et al., 2014, NeuroImage). I'm not suggesting that the authors should necessarily do this, only that their statistical approach should be coherent. As a reference point, the authors might look at the aforementioned Collins & Frank (2018) study.

      We deeply thank you for your comments. We have now replaced all our results with the results after false discovery rate correction and added relevant descriptions (line 357,358):

      “The significant results after false discovery rate (FDR) (Benjamini et al., 1995, Gershman et al., 2014) correction were shown in shaded regions. Additional regression results can be found in Supplementary Materials.”

      Benjamini, Y., & Hochberg, Y. (1995). Controlling the false discovery rate: a practical and powerful approach to multiple testing. Journal of the Royal statistical society: series B (Methodological), 57(1), 289-300.

      Gershman, S. J., Blei, D. M., Norman, K. A., & Sederberg, P. B. (2014). Decomposing spatiotemporal brain patterns into topographic latent sources. NeuroImage, 98, 91-102.

      After FDR correction, our results have changed slightly. We have updated our Results and Discussion section.

      It should be acknowledged that the changes in these results may represent a certain degree of error in our data (perhaps because the EEG data is too noisy or because of the average template we used, ‘fsaverage’). Therefore, we added relevant discussion in the Discussion section (line527-529):

      “It should be acknowledged that our EEG-based regression results are somewhat unstable, and the brain regions with significant regression are inconsistent before and after FDR correction. In future work, we should collect more precise neural data to reduce this instability.”

      I asked the authors to show more descriptive comparison between the model and the data. Their response was that this is not possible, which I find odd given that they are able to use the model to define a probability distribution on choices. All I'm asking about here is to show predictive checks which build confidence in the model fit. The additional simulations do not address this. The authors refer to figures 3 and 4, but these do not show any direct comparison between human data and the model beyond model comparison metrics.

      We deeply thank you for your comments. We now compare the participants’ behavioral data and the model’s predictions trial by trial (Figure 5). We can clearly see the participants’ behavioral strategies in different states and trials and the model’s prediction accuracy. We have added the discussion related to Figure 5 (line 309-318):

      “Figure 5 shows the comparison between the active inference model and the behavioral data, where we can see that the model can fit the participants behavioral strategies well. In the “Stay-Cue" choice, participants always tend to choose to ask the ranger and rarely choose not to ask. When the context was unknown, participants chose the “Safe" option or the “Risky" option very randomly, and they did not show any aversion to variability. When given “Context 1", where the “Risky" option gave participants a high average reward, participants almost exclusively chose the “Risky" option, which provided more information in the early trials and was found to provide more rewards in the later rounds. When given “Context 2", where the “Risky" option gave participants a low average reward, participants initially chose the “Risky" option and then tended to choose the “Safe" option. We can see that participants still occasionally chose the “Risky" option in the later trials of the experiment, which the model does not capture. This may be due to the influence of forgetting. Participants chose the “Risky" option again to establish an estimate of the reward distribution.”

      Reviewer # 2 (Recommendations For The Authors):

      In the supplement, there are missing references ("[?]").

      Thank you very much for pointing out this. We have now fixed this error.

      Reviewer # 3 (Public review):

      Summary:

      This paper aims to investigate how the human brain represents different forms of value and uncertainty that participate in active inference within a free-energy framework, in a two-stage decision task involving contextual information sampling, and choices between safe and risky rewards, which promotes shifting between exploration and exploitation. They examine neural correlates by recording EEG and comparing activity in the first vs second half of trials and between trials in which subjects did and did not sample contextual information, and perform a regression with free-energy-related regressors against data "mapped to source space."

      Strengths:

      This two-stage paradigm is cleverly designed to incorporate several important processes of learning, exploration/exploitation and information sampling that pertain to active inference. Although scalp/brain regions showing sensitivity to the active-inference related quantities do not necessary suggest what role they play, they are illuminating and useful as candidate regions for further investigation. The aims are ambitious, and the methodologies impressive. The paper lays out an extensive introduction to the free energy principle and active inference to make the findings accessible to a broad readership.

      Weaknesses:

      In its revised form the paper is complete in providing the important details. Though not a serious weakness, it is important to note that the high lower-cutoff of 1 Hz in the bandpass filter, included to reduce the impact of EEG noise, would remove from the EEG any sustained, iteratively updated representation that evolves with learning across trials, or choice-related processes that unfold slowly over the course of the 2-second task windows.

      We are deeply grateful for your careful review of our work and your suggestions. We are very sorry that we did not modify our filter frequency (it would be a lot of work to modify it). Thank you very much for pointing this out. We noticed the shortcoming of the high lower-cutoff of 1 Hz in the bandpass filter. We will carefully consider the filter frequency when preprocessing data in future work. Thank you very much!

    1. Author response:

      The following is the authors’ response to the previous reviews.

      Public Reviews:

      Reviewer #1 (Public review):

      […] Weaknesses:

      Unfortunately, the revised manuscript does not show significant improvement. While the identification of the receptors is highly convincing, important issues about the biological relevance remain unaddressed. First, the main point I raised about the first version of this article is that the redundancy and/or specificity of the two receptors should be clarified, even though I understand that it cannot be deeply investigated here. I believe that this point, shared by all reviewers, is highly relevant for the scope of this work. In this revised version, it is still unclear how to reconcile gain and loss-of-function experiments and the different expression profiles of the receptors. Second, the newly added explanations and pieces of discussion provided about the mild in vivo phenotypes of early pupation upon Cad96ca or Fgfr1 knock-out do not clarify the issue but instead put emphasis on methodological issues. Indeed, it is not clear whether the mild phenotypes reflect the biological role of Cad96ca and Fgfr1, or the redundancy of these two RTKs (and/or others), or some issue with the knock-out strategy (partial efficiency, mosaicism...). Finally, parts of the updated discussion and the modifications to the figures are confusing.

      Thank you for asking the questions. We performed additional experiments, including editing Met1 individually (single knockout), Cad96ca and Fgfr1 together (double knockout), and Met1, Cad96ca and Fgfr1 together (triple knockout) using CRISPR/Cas9. The results showed that single mutation of Cad96ca or Fgfr1 caused precocious pupation, respectively. The double mutation of Cad96ca and Fgfr1 caused earlier pupation and death compared to the single mutation of Cad96ca or Fgfr1. The triple mutation of Met1, Cad96ca and Fgfr1 caused most serious effect on pupation time and death. These data suggested that both CAD96CA and FGFR1 can transmit JH signal to prevent pupation independently and cooperatively, and the JH exert a complete regulatory role through cell membrane receptors and intracellular receptor of JH. We increased the results in Lines 242-263 and discussion in Lines 328-375.

      CAD96CA and FGFR1 have similar functions in JH signaling, including transmitting JH signal for Kr-h1 expression, larval status maintaining, rapid intracellular calcium increase, phosphorylation of transcription factors MET1 and TAI, and high affinity to JH III. CAD96CA and FGFR1 are essential in the JH signal pathway, and the loss-of-function of each is sufficient to trigger strong effects on pupation, suggesting they can transmit JH signal individually. The difference is that CAD96CA expression has no tissue specificity, and the Fgfr1 gene is highly expressed in the midgut. A possibility is that CAD96CA and FGFR1 play roles by forming homodimer or heterodimer with each other or with other RTKs in tissues, which needs to be addressed in future studies. CAD96CA and FGFR1 transmit JH III signals in three different insect cell lines, suggesting their conserved roles in other insects.

      The mild phenotypes shown in the previous picture, Fig 4E, were counted from all the surviving individuals injected with gRNA, including mutated and non-mutated individuals. In fact, there is no phenotype of pupation on time in the mutants. According to the first round of reviewers' comments, we found that it was inappropriate to count all the surviving individuals injected with gRNA, so we replaced the picture by counting the phenotypes of all successfully mutated individuals in the second version to avoid the confusion of the phenotypes.

      Reviewer #2 (Public review):

      […] Weaknesses:

      Results of their in vivo experiments, particularly those of their loss-of-function analyses using CRISPR mutants are still preliminary, and the results rather indicate that these membrane receptors do not have any physiologically significant roles in vivo. More specifically, previous studies in lepidopteran species have clearly and repeatedly shown that precocious metamorphosis is the hallmark phenotype for all JH signaling-deficient larvae. In contrast, the present study showed that Cad96ca and Fgfr1 G0 mutants only showed slight acceleration in their pupation timing, which is not a typical phenotype one would expect from JH signaling deficiency. This is inconsistent with their working model provided in Figure 6, which indicates that these cell membrane JH receptors promote the canonical JH signaling by phosphorylating Met/Tai. If the authors argue that this slight acceleration of pupation is indeed a major JH signaling-deficient phenotype in Helicoverpa, they need to provide more data to support their claim by analyzing CRISPR mutants of other genes involved in JH signaling, such as Jhamt and Met. An alternative explanation is that there is functional redundancy between CAD96CA and FGFR1 in mediating phosphorylation of Met/Tai. This possibility can be tested by analyzing double knockouts of these two receptors. Currently, the validity of their calcium imaging analysis in Figure 5 is also questionable. When performing calcium imaging in cultured cells, it is critically important to treat all the cells at the end of each experiment with a hormone or other chemical reagents that universally induce calcium increase in each particular cell line. Without such positive control, the validity of calcium imaging data remains unknown, and readers cannot properly evaluate their results.

      Thank you for the comments. We took your suggestions and performed additional experiments, editing Met1 individually (single knockout), Cad96ca and Fgfr1 together (double knockout), and Met1, Cad96ca and Fgfr1 together (triple knockout) using CRISPR/Cas9. We increased the results in Lines 242-263 and discussion in Lines 328-375.

      About the calcium imaging in cultured cells (now Fig 6), our goal is to examine the roles of CAD96CA and FGFR1 in JH trigged cellular responses. The experiment was well designed and controlled and the results were validated. For examples: JH III induced intracellular Ca<sup>2+</sup> release and extracellular Ca<sup>2+</sup> influx in Sf9 and S2 cells, but DMSO could not. However, knockdown of Cad96ca and Fgfr1 significantly decreased JH III-induced intracellular Ca<sup>2+</sup> release and extracellular Ca<sup>2+</sup> influx (Figure 6A, B), and Kr-h1 expression (Figure 6—figure supplement 1A and B), suggesting that CAD96CA and FGFR1 had a general function to transmit JH signal in S. frugiperda and D. melanogaster.

      Wild mammalian HEK-293T cells had no significant changes in calcium ion levels under JH III induction, because there is no CAD96CA and FGFR1 in mammal cells (Figure 6C). However, when HEK-293T cells were overexpressed insect CAD96CA or FGFR1, respectively, JH III triggered rapid cytosolic Ca<sup>2+</sup> release and influx (Figure 6D).

      An increase in Ca<sup>2+</sup> was not detected in mutants of CAD96CA-M3 and CAD96CA-M4 under JH III induction (Figure 6E) and nor in FGFR1-M4 (Figure 6F). These results confirmed that CAD96CA and FGFR1 play roles in transmitting JH III signal.

      We carefully revised the description of the results and methods to help people understand the study.

      Reviewer #3 (Public review):

      […] Weaknesses:

      The authors have provided evidences that the Cad96Ca and FGF1 RTK receptors contribute to JH signaling through CRISPR/Cas9, inducing precocious metamorphosis, although not to the same extent as absence of JH. Therefore, it still remains unclear whether these RTKs are completely required for pathway activation or only necessary for high activation levels during the last larval stage. While the authors have included some additional data, the mechanism by which different RTKs function in transducing JH signaling in a tissue specific manner is still unclear. As the authors note in the discussion, it is possible that other RTKs may also play a role in facilitating the transduction of JH signaling. Lastly, the study does not yet explain how RTKs with known ligands could also bind JH and contribute to JH signaling activation. Although receptor promiscuity has been suggested as a possible mechanism, future studies could explore whether activation of RTK pathways by their known ligands induces certain levels of JH transducer phosphorylation, which, in the presence of JH, could contribute to full pathway activation without the need for direct JH-RTK binding.

      Thank you for your comments. To address your questions, we carried out additional experiments. The relevant results have been incorporated into Lines 242-263, and the corresponding discussion has been added to Lines 328-375.

      We agree with your suggestions that the future studies should resolve the questions such as how different RTKs function in transducing JH signaling in a tissue specific manner; whether other RTKs can transduce JH signal; how RTKs with known ligands could also bind JH and contribute to JH signaling activation; and how the RTK pathways are activated by their ligands.

      Recommendations for the authors:

      Reviewer #1 (Recommendations for the authors):

      (1) First, some of the new paragraphs, repeatedly used in the point-by-point answer to the reviewers, are highly confusing and need proofreading (i.e. 225-230; 320-340)

      Thank you for your advice. We have carefully revised the manuscript and the point-by-point answer to avoid repetition.

      (2) While the double knock-down or knock-out of Cad96ca and Fgfr1 is expected to provide valuable information regarding their respective functions, the authors indicated that they wouldn't provide experiments in that direction. It is not clear to me if they have tried or not. The Crispr/Cas9 approach might be difficult to put in place to test this interaction. However, couldn't the authors try the double knock-down compared to single knock-downs using dsRNA? This method gave convincing results to test the role of the putative receptors in mediating JH-induced developmental delay in vivo (Figure 1).

      Thank you for your suggestion. We added experiments, editing Met1 individually (single knockout), Cad96ca and Fgfr1 together (double knockout), and Met1, Cad96ca and Fgfr1 together (triple knockout) using CRISPR/Cas9, the new evidence fully defined the physiological roles of these receptors in JH signaling in vivo. We increased the results in Lines 242-263 and discussion in Lines 328-375.

      (3) Concerning the effect of Crispr knock-out on pupation timing, this paragraph was added: "The low death rate after Cad96ca and Fgfr1 knockout might be because of following reasons, including the editing efficiency (67% and 61% for Cad96ca mutant and Fgfr1 mutant, respectively), the chimera of the gene knockout at the G0 generation, and the redundant RTKs that play similar roles in JH signaling". A similar explanation applies to the pupation phenotype itself... I am therefore wondering whether the Crispr/Cas9 approach (at the G0 generation) is the best strategy. Since the dsRNA knock-down gave efficient (and probably more reproducible) results according to Figure 1B-C, why not using the same approach for analyzing loss-of-function phenotypes?

      (4) Similarly, this new paragraph regarding the knock-out strategy by Crispr is problematic: "However, in the Cad96ca mutant, 86% of the larvae (an editing efficiency of 67% by TA clone analysis) had a shortened feeding stage in the sixth instar and entered the metamorphic molting stage earlier, showing early pupation, with the pupation time being 24 h earlier. In the Fgfr1 mutant, 91% of the larvae (an editing efficiency of 61%) had a shortened feeding stage in the sixth instar and entered the metamorphic molting stage earlier, showing early pupation, with the pupation time being 23 h earlier" (lines 225-230).

      - How does the editing efficiency relate to the mutation efficiency few lines earlier (not clearly explained in the methods)? Were the animals homozygous or heterozygous for the mutations? - A shortened feeding stage can only be invoked if previous developmental transitions are unaffected. Such statement should be supported by a better description of the developmental timing phenotype (as suggested already by reviewer 2).

      Thank you for your questions in (3) and (4). The editing rates of 67% and 61% for Cad96ca and Fgfr1 in individuals were calculated from the PCR products, indicating that the cells were mosaics by CRISPR/Cas9 editing. The mutants produced by CRISPR/Cas9 are mosaics. We removed the content to the methods section and increased the detail methods, Lines 705-717.

      We increased discussion: "The phenotypes of gene mutation in H. armigera are somehow different from those obtained by homozygous mutation in other animals, due to the mosaic mutation by CRISPR/Cas9. In addition, RNAi of Cad96ca and Fgfr1 was observed precocious pupation as was the case in CRISPR/Cas9, suggesting the RNAi can be used for the study of gene function in insect, especially when the gene editing is embryonic lethal". Lines 367-380.

      We removed the improper description of the phenotypes in the results, such as that of the feeding stage. By increasing experiments of editing Met1 individually (single knockout), Cad96ca and Fgfr1 together (double knockout), and Met1, Cad96ca and Fgfr1 together (triple knockout) to define the physiological roles of these receptors in JH signaling in vivo.

      (5) Importantly, I don't understand where the new version of the figure 4E stems from. The « pupation on time » (blue) category present in the first version of the figure has now disappeared for mutant animals. Why? In the first, my understanding was that, among the mutant animals, around 50% had precocious pupation. In the new version of the figure 4E, the "pupation on time" category is missing, and the percentages of early pupation are therefore strongly increased... The explanations provided in the text are not clear regarding the reanalysis of the mutant phenotypes. In the first version of the manuscript, the following explanation was given: "In 61 survivors of Cas9 protein and Cad96ca-gRNA injection, 30 mutants were identified by the earlier pupation and sequencing (an editing efficiency of 49.2%)". Were all animals sequenced, or only the 30 displaying earlier pupation? Were the 31 others not sequenced or did they have no mutation? Could it be, as suggested by the first version of the figure, that some mutant animals did not display early pupation? It was indeed stated in the text that: "CRISPR/Cas9 editing by Cad96ca-gRNA or Fgfr1-gRNA injection resulted in earlier pupation (Figure 4D) for about 23-24 h by comparison with normal pupation in 46% and 54% of larvae, respectively". This new version of the figure should be explained.

      Thank you for your reminder. The phenotype of pupation on time appeared in the first version, because we counted the phenotypes of all the surviving individuals injected with gRNA, that is, the survivors in Figure 4C, which including mutated and non-mutated individuals. According to the comments from first round of reviewers, we realized that it was inappropriate to count all the surviving individuals injected with gRNA, since there is no phenotype of pupation on time in the mutants. Therefore, in the second version, we replaced the picture by counting the phenotypes of all successfully mutated individuals, namely the mutants in Figure 4C.

    1. Author response:

      The following is the authors’ response to the original reviews.

      Reviewer #1 (Public Review):

      Summary:

      Juvenile Hormone (JH) plays a key role in insect development and physiology. Although the intracellular receptor for JH was identified long ago, a number of studies have shown that part of JH functions should be fulfilled through binding to an unknown membrane receptor, which was proposed to belong to the RTK family. In this study, the authors screened all RTKs from the H. armigera genome for their ability to mediate responses to JH III treatment both in cultured cells and in developing animals. They also present convincing evidence that CAD96CA and FGFR1 directly bind JH III, and that their role might be conserved in other insect species.

      Strengths:

      Altogether, the experimental approach is very complete and elegant, providing evidence for the role of CAD96CA and FGFR1 in JH signalling using different techniques and in different contexts. I believe that this work will open new perspectives to study the role of JH and better understand what is the contribution of signalling through membrane receptors for JH-dependent developmental processes.

      Weaknesses:

      I don't see major weaknesses in this study. However, I think that the manuscript would benefit from further information or discussion regarding the relationship between the two newly identified receptors. Experiments (especially in HEK-293T cells) suggest that CAD96CA and FGFR1 are sufficient on their own to transduce JH signalling. However, they are also necessary since loss-of-function conditions for each of them are sufficient to trigger strong effects (while the other is supposed to be still present).

      Thank you for the suggestion. We have added the discussion in the text: "CAD96CA and FGFR1 have similar functions in JH signaling, including transmitting JH signal for Kr-h1 expression, larval status maintaining, rapid intracellular calcium increase, phosphorylation of transcription factors MET1 and TAI, and high affinity to JH III. CAD96CA and FGFR1 are essential in the JH signal pathway, and loss-of-function for each is sufficient to trigger strong effects on pupation. The difference is that CAD96CA expression has no tissue specificity, and the Fgfr1 gene is highly expressed in the midgut; possibly, it plays a significant role in the midgut. Other possibility is that they play roles by forming heterodimer with each other or other RTKs, which needs to be addressed in future study. CAD96CA and FGFR1 transmit JH III signals in three different insect cell lines, suggesting their conserved roles in other insects.".

      In addition, despite showing different expression patterns, the two receptors seem to display similar developmental functions according to loss-of-function phenotypes. It is therefore unclear how to draw a model for membrane receptor-mediated JH signalling that includes both CAD96CA and FGFR1.

      Thank you for your question. We have modified the figure and the legends to make the conception clear.

      Reviewer #2 (Public Review):

      Summary:

      Juvenile hormone (JH) is a pleiotropic terpenoid hormone in insects that mainly regulates their development and reproduction. In particular, its developmental functions are described as the "status quo" action, as its presence in the hemolymph (the insect blood) prevents metamorphosis-initiating effects of ecdysone, another important hormone in insect development, and maintains the juvenile status of insects. While such canonical functions of JH are known to be mediated by its intracellular receptor complex composed of Met and Tai, there have been multiple reports suggesting the presence of cell membrane receptor(s) for JH, which mediate non-genomic effects of this terpenoid hormone. In particular, the presence of receptor tyrosine kinase(s) that phosphorylate Met/Tai in response to JH and thus indirectly affect the canonical JH signaling pathway has been strongly suggested. Given the importance of JH in insect physiology and the fact that the JH signaling pathway is a major target of insect growth regulators, elucidating the identification and functions of putative JH membrane receptors is of great significance from both basic and applied perspectives. In the present study, the authors identified candidate receptors for such cell membrane JH receptors, CAD96CA and FGFR1, in the cotton bollworm Helicoverpa armigera.

      Strengths:

      Their in vitro analyses are conducted thoroughly using multiple methods, which overall supports their claim that these receptors can bind to JH and mediate their non-genomic effects.

      Weaknesses:

      Results of their in vivo experiments, particularly those of their loss-of-function analyses using CRISPR mutants are still preliminary, and the results rather indicate that these membrane receptors do not have any physiologically significant roles in vivo. More specifically, previous studies in lepidopteran species have clearly and repeatedly shown that precocious metamorphosis is the hallmark phenotype for all JH signaling-deficient larvae. In contrast, the present study showed that Cad96ca and Fgfr1 G0 mutants only showed a slight acceleration in their pupation timing, which is not a typical phenotype one would expect from JH signaling deficiency. This is inconsistent with their working model provided in Figure 6, which indicates that these cell membrane JH receptors promote the canonical JH signaling by phosphorylating Met/Tai.

      If the authors argue that this slight acceleration of pupation is indeed a major JH signaling-deficient phenotype in Helicoverpa, they need to provide more data to support their claim by analyzing CRISPR mutants of other genes involved in JH signaling, such as Jhamt and Met. An alternative explanation is that there is functional redundancy between CAD96CA and FGFR1 in mediating phosphorylation of Met/Tai. This possibility can be tested by analyzing double knockouts of these two receptors.

      Thank you for your question and suggestion. The cadherin 96ca (CAD96CA) and fibroblast growth factor receptor 1 (FGFR1) were finally determined as JH cell membrane receptors by their roles in JH regulated-gene expression, maintaining larval status, JH induced-rapid increase of intracellular calcium levels, JH induced-phosphorylation of MET and TAI, and their JH-binding affinity. Their roles as JH cell membrane receptors were further determined by knockdown and knockout of them in vivo and in cell lines, and overexpression of them in mammal HEK-293T heterogeneously. Figure 6 is drafted by these solidate evidences.

      Cad96ca and Fgfr1 G0 mutants caused slight acceleration of pupation is one of the types of evidence of JH signaling-deficient. Othe evidences include a set of gene expression and the block of JH induced-rapid intracellular calcium increase.

      Kr-h1 is a typical indicator gene at the downstream of Jhamt and in JH signaling, so we used it as an indicator to examine JH signaling. Jhamt and Met or other genes might be affected in Cad96ca and Fgfr1 G0 mutants, which can be examined in future study.

      We have discussed the question that Cad96ca and Fgfr1 G0 mutants only showed a slight acceleration in their pupation timing: "Homozygous Cad96ca null Drosophila die at late pupal stages (Wang et al., 2009). However, we found that 86% of the larvae of the Cad96ca mutant successfully pupated in G0 generation, although earlier than the control. Similarly, null mutation of Fgfr1 or Fgfr2 in mouse is embryonic lethal (Arman et al., 1998; Deng et al., 1994; Yamaguchi et al., 1994). In D. melanogaster, homozygous Htl (Fgfr) mutant embryos die during late embryogenesis, too (Beati et al., 2020; Beiman et al., 1996; Gisselbrecht et al., 1996). However, in H. armigera, 91% of larvae successfully pupated in G0 generation after Fgfr1 knockout. The low death rate after Cad96ca and Fgfr1 knockout might be because of following reasons, including the editing efficiency (67% and 61% for Cad96ca mutant and Fgfr1 mutant, respectively), the chimera of the gene knockout at the G0 generation, and the redundant RTKs that play similar roles in JH signaling, similar to the redundant roles of MET and Germ-cell expressed bHLH-PAS (GCE) in JH signaling (Liu et al., 2009), which needs to obtain alive G1 homozygote mutants and double knockout of these two receptors in future study. We indeed observed that the eggs did not hatch successfully after mixed-mating of G0 Cad96ca mutant or Fgfr1 mutant, respectively, but the reason was not addressed further due to the embryonic death. By the similar reasons, most of the Cad96ca and Fgfr1 mutants showed a slight acceleration of pupation (about one day) without the typical precocious metamorphosis (at least one instar earlier) phenotype caused by JH signaling defects (Daimon et al., 2012; Fukuda, 1944; Riddiford et al., 2010) and JH pathway gene deletions (Abdou et al., 2011; Liu et al., 2009). On other side, JH can regulate gene transcription by diffusing into cells and binding to the intracellular receptor MET to conduct JH signal, which might affect the results of gene knockdown and knockout.".

      Currently, the validity of their calcium imaging analysis in Figure 5 is also questionable. When performing calcium imaging in cultured cells, it is critically important to treat all the cells at the end of each experiment with a hormone or other chemical reagents that universally induce calcium increase in each particular cell line. Without such positive control, the validity of calcium imaging data remains unknown, and readers cannot properly evaluate their results.

      Thank you for your question. For Figure 5, our goal was to demonstrate that JH can induce calcium mobilization through CAD96CA and FGFR1. Controls have been established between different experimental groups within the same cell, as well as between different cells. Increasing the positive experimental group would make the results more complex.

      Reviewer #3 (Public Review):

      Summary:

      In this study, Li et al. identified CAD96CA and FGF1 among 20 receptor tyrosine kinase receptors as mediators of JH signaling. By performing a screen in HaEpi cells with overactivated JH signaling, the authors pinpointed two main RTKs that contribute to the transduction of JH. Using the CRISPR/Cas9 system to generate mutants, the authors confirmed that these RTKs are required for normal JH activation, as precocious pupariation was observed in their absence. Additionally, the authors demonstrated that both CAD96CA and FGF1 exhibit a high affinity for JH, and their activation is necessary for the proper phosphorylation of Tai and Met, transcription factors that promote the transcriptional response. Finally, the authors provided evidence suggesting that the function of CAD96CA and FGF1 as JH receptors is conserved across insects.

      Strengths:

      The data provided by the authors are convincing and support the main conclusions of the study, providing ample evidence to demonstrate that phosphorylation of the transducers Met and Tai mainly depends on the activity of two RTKs. Additionally, the binding assays conducted by the authors support the function of CAD96CA and FGF1 as membrane receptors of JH. The study's results validate, at least in H. amigera, the predicted existence of membrane receptors for JH.

      Weaknesses:

      The study has several weaknesses that need to be addressed. Firstly, it is not clear what criteria were used by the authors to discard several other RTKs that were identified as repressors of JH signaling. For example, while NRK and Wsck may not fulfill all the requirements to become JH receptors, other evidence, such as depletion analysis and target gene expression, suggests they are involved in proper JH signaling activation.

      Thank you for your question. We screened the RTKs sequentially, including examining the roles of 20 RTKs identified in the H. armigera genome in JH regulated-gene expression to obtain primary candidates, followed by screening of the candidates by their roles in maintaining larval status, JH induced-rapid increase of intracellular calcium levels, JH induced-phosphorylation of MET and TAI, and affinity to JH. WSCK was not involved in the phosphorylation of MET and TAI and was discarded during subsequent screening. NRK did not bind to JH III, did not meet the screening strategy, and was discarded.

      We increased the information in the Introduction: "We screened the RTKs sequentially, including examining the roles of 20 RTKs identified in the H. armigera genome in JH regulated-gene expression to obtain primary candidates, followed by screening of the candidates by their roles in maintaining larval status, JH induced-rapid increase of intracellular calcium levels, JH induced-phosphorylation of MET and TAI, and affinity to JH. The cadherin 96ca (CAD96CA) and fibroblast growth factor receptor 1 (FGFR1) were finally determined as JH cell membrane receptors by their roles in JH regulated-gene expression, maintaining larval status, JH induced-rapid increase of intracellular calcium levels, JH induced-phosphorylation of MET and TAI, and their JH-binding affinity. Their roles as JH cell membrane receptors were further determined by knockdown and knockout of them in vivo and cell lines, and overexpression of them in mammal HEK-293T heterogeneously.".

      We increased discussion: "This study found six RTKs that respond to JH induction by participating in JH induced-gene expression and intracellular calcium increase, however; they exert different functions in JH signaling, and finally CAD96CA and FGFR1 are determined as JH cell membrane receptors by their roles in JH induced-phosphorylation of MET and TAI and binding to JH III. We screen the RTKs transmitting JH signal primarily by examining some of JH induced-gene expression. By examining other genes or by other strategies to screen the RTKs might find new RTKs functioning as JH cell membrane receptors; however, the key evaluation indicators, such as the binding affinity of the RTKs to JH and the function in transmitting JH signal to maintain larval status are essential.".

      Secondly, the expression of the six RTKs, which, when knocked down, were able to revert JH signaling activation, was mainly detected in the last larval stage of H. amigera. However, since JH signaling is active throughout larval development, it is unclear whether these RTKs are completely required for pathway activation or only needed for high activation levels at the last larval stage.

      Thank you for the question. We knocked down the genes at last larval stage to observe pupation, which is a relatively simple and easily to be observed target to examine the role of the gene in JH-maintained larval status. The results from CRISPR/Cas9 experiments showed: "Most wild-type larvae showed a phenotype of pupation on time. However, in the Cad96ca mutant, 86% of the larvae (an editing efficiency of 67% by TA clone analysis) had a shortened feeding stage in the sixth instar and entered the metamorphic molting stage earlier, showing early pupation, with the pupation time being 24 h earlier. In the Fgfr1 mutant, 91% of the larvae (an editing efficiency of 61%) had a shortened feeding stage in the sixth instar and entered the metamorphic molting stage earlier, showing early pupation, with the pupation time being 23 h earlier (Figure 4D and E). The data suggested that CAD96CA and FGFR1 support larval growth and prevent pupation in vivo.".

      Additionally, the mechanism by which different RTKs exert their functions in a specific manner is not clear. According to the expression profile of the different RTKs, one might expect some redundant role of those receptors. In fact the no reversion of phosphorilation of tai and met upon depletion of Wsck in cells with overactivated JH signalling seems to support this idea.

      Nevertheless, and despite the overlapping expression of the different receptors, all RTKs seem to be required for proper pathway activation, even in the case of FGF1 which seems to be only expressed in the midgut. This is an intriguing point unresolved in the study.

      Thank you for your comments. Yes, from our study, different RTKs exert their functions in a specific manner. We have increased discussion: "This study found six RTKs that respond to JH induction by participating in JH induced-gene expression and intracellular calcium increase, however; they exert different functions in JH signaling, and finally CAD96CA and FGFR1 are determined as JH cell membrane receptors by their roles in JH induced-phosphorylation of MET and TAI and binding to JH III. We screen the RTKs transmitting JH signal primarily by examining some of JH induced-gene expression. By examining other genes or by other strategies to screen the RTKs might find new RTKs functioning as JH cell membrane receptors; however, the key evaluation indicators, such as the binding affinity of the RTKs to JH and the function in transmitting JH signal to maintain larval status are essential.".

      Finally, the study does not explain how RTKs with known ligands could also bind JH and contribute to JH signaling activation. in Drosophila, FGF1 is activated by pyramus and thisbe for mesoderm development, while CAD96CA is activated by collagen during wound healing. Now the authors claim that in addition to these ligands, the receptors also bind to JH. However, it is unclear whether these RTKs are activated by JH independently of their known ligands, suggesting a specific binding site for JH, or if they are only induced by JH activation when those ligands are present in a synergistic manner. Alternatively, another explanation could be that the RTK pathways by their known ligands activation may induce certain levels of JH transducer phosphorylation, which, in the presence of JH, contributes to the full pathway activation without JH-RTK binding being necessary.

      Thank you for your professional questions. It is an exciting and challenging to explore the molecular mechanism by which multiple ligands transmit signals through the same receptor. It requires a long-term research plan and in-depth studies. We added discussion in the text: "CAD96CA (also known as Stitcher, Ret-like receptor tyrosine kinase) activates upon epidermal wounding in Drosophila embryos (Tsarouhas et al., 2014) and promotes growth and suppresses autophagy in the Drosophila epithelial imaginal wing discs (O'Farrell et al., 2013). There is a CAD96CA in the genome of the H. armigera, which is without function study. Here, we reported that CAD96CA prevents pupation by transmitting JH signal as a JH cell membrane receptor. We also showed that CAD96CA of other insects has a universal function of transmitting JH signal to trigger Ca2+ mobilization, as demonstrated by the study in Sf9 cell lines of S. frugiperda and S2 cell lines of D. melanogaster.

      FGFRs control cell migration and differentiation in the developing embryo of D. melanogaster (Muha and Muller, 2013). The ligand of FGFR is FGF in D. melanogaste_r (Du et al., 2018_). FGF binds FGFR and triggers cell proliferation, differentiation, migration, and survival (Beenken and Mohammadi, 2009; Lemmon and Schlessinger, 2010). Three FGF ligands and two FGF receptors (FGFRs) are identified in Drosophila (Huang and Stern, 2005). The Drosophila FGF-FGFR interaction is specific. Different ligands have different functions. The activation of FGFRs by specific ligands can affect specific biological processes (Kadam et al., 2009). The FGFR in the membrane of Sf9 cells can bind to Vip3Aa (Jiang et al., 2018). One FGF and one FGFR are in the H. armigera genome, which has yet to be studied functionally. The study found that FGFR prevents insect pupation by transmitting JH signal as a JH cell membrane receptor. Exploring the molecular mechanism and output by which multiple ligands transmit signals through the same receptor is exciting and challenging.".

      Reviewer #1 (Recommendations For The Authors):

      As an experimental suggestion, I will only propose that authors test the double knock-down/knock-out or overexpression of CAD96CA and FGFR1 to give some hints into how redundant/independent the two receptors are.

      Thank you very much for your professional advice. We agree with your point of view that double knockout of CAD96CA and FGFR1 is very important to resolve the redundant/independent of the two receptors, which can make our research more complete. Unfortunately, due to experimental difficulty and time constraints, we did not provide supplementary experiments. In this study, we aim to screen the cell membrane receptors of JH. Therefore, we focused on which RTKs can function as receptors. This article is a preliminary study to identify the cell membrane receptors of JH. To further understand the relationship between the two membrane receptors, we will conduct in-depth research in future work.

      Apart from that, here are some minor points about the manuscript:

      Figure 2A: changing the scale on the y-axis would help to better see the different genotypes (similar to the way it is presented in Figure 5).

      Thanks for your reminding, we have changed the scale in Figure 2A.

      Figure 4J: image settings could be improved to better highlight the green fluorescence.

      Thank you for your advice, we have improved the imaged in Figure 4J.

      In general, the manuscript would benefit from some proofreading since a number of sentences are incorrect.

      Thanks for your reminding, we have carefully revised the manuscript.

      Reviewer #2 (Recommendations For The Authors):

      (1) Although the authors note that there are 21 RTK genes in Drosophila (line 55), I can only see 16 Drosophila RTKs in Figure 1 - Figure Supplement 1. Some important Drosophila RTKs such as breathless are missing. The authors need to redraw the phylogenetic tree.

      Thanks for your reminding, we have presented the new phylogenetic tree in Figure 1-figure supplement 1.

      (2) The accelerated pupation phenotype in Cad96ca and Fgfr1 G0 mutants needs to be better described. In particular, it is critical to examine which developmental stage(s) are shortened in these mutant larvae. Refer to a similar study on a JH biosynthetic enzyme in Bombyx (PMID: 22412378) regarding how to describe the developmental timing phenotype.

      Thank you for your advice. We have re-shown Figure 4E and added the explanation in the text: "In 61 survivors of Cas9 protein plus Cad96ca-gRNA injection, 30 mutants were sequenced, and a mutation efficiency was 49.2%. Similarly, in the 65 survivors of Cas9 protein plus Fgfr1-gRNA injection, 35 mutants were sequenced, and a mutation efficiency was 53.8% (Figure 4C). The DNA sequences, deduced amino acids and off–target were analyzed (Figure 4—figure supplement 1). Most wild-type larvae showed a phenotype of pupation on time. However, in the Cad96ca mutant, 86% of the larvae (an editing efficiency of 67% by TA clone analysis) had a shortened feeding stage in the sixth instar and entered the metamorphic molting stage earlier, showing early pupation, with the pupation time being 24 h earlier. In the Fgfr1 mutant, 91% of the larvae (an editing efficiency of 61%) had a shortened feeding stage in the sixth instar and entered the metamorphic molting stage earlier, showing early pupation, with the pupation time being 23 h earlier (Figure 4D and E). The data suggested that CAD96CA and FGFR1 support larval growth and prevent pupation in vivo.".

      (3) The editing efficiency described in lines 211-213 is obscure. Does this indicate the percentage of animals with noisy sequencing spectra or the percentage of mutation rates analyzed by TA cloning?

      Thanks for your reminder. We have revised the description in the text: "In 61 survivors of Cas9 protein plus Cad96ca-gRNA injection, 30 mutants were sequenced, and a mutation efficiency was 49.2%. Similarly, in the 65 survivors of Cas9 protein plus Fgfr1-gRNA injection, 35 mutants were sequenced, and a mutation efficiency was 53.8% (Figure 4C). The DNA sequences, deduced amino acids and off–target were analyzed (Figure 4—figure supplement 1). Most wild-type larvae showed a phenotype of pupation on time. However, in the Cad96ca mutant, 86% of the larvae (an editing efficiency of 67% by TA clone analysis) had a shortened feeding stage in the sixth instar and entered the metamorphic molting stage earlier, showing early pupation, with the pupation time being 24 h earlier. In the Fgfr1 mutant, 91% of the larvae (an editing efficiency of 61%) had a shortened feeding stage in the sixth instar and entered the metamorphic molting stage earlier, showing early pupation, with the pupation time being 23 h earlier (Figure 4D and E). The data suggested that CAD96CA and FGFR1 support larval growth and prevent pupation in vivo.".

      (4) In Figures 4F and G, the authors examined expression levels of some JH/ecdysone responsive genes only at 0 hr-old 6th instar larvae. This single developmental stage is not enough for this analysis. In particular, the expression level of Fgfr1 only goes up in the mid-6th instar according to their own data (Figure 1-Figure Supplement 4), so it is critical to examine expression levels of these genes at least throughout the 6th larval instar.

      Thank you for your advice. Indeed, it is essential to detect the expression levels of JH/ecdysone response genes in the whole sixth instar larvae. Because we observed that the mutation has a shorter feeding stage at the sixth instar, we examined the expression level of the JH/ecdysone response gene at the early sixth instar. Due to the number of mutants obtained in the experiment was small and non-destructive sampling could not be performed in sixth instar period, there were no enough samples to test. In the future, we will generate Cad96ca Fgfr1 double mutations to carry out studies and detect the expression level of JH/ecdysone response genes in the whole sixth instar.

      (5) As mentioned above, some important Drosophila RTKs such as breathless are missing in their analyses. As breathless is a close paralog of heartless (Htl), I am sure that Drosophila breathless is also orthologous to Helicoverpa FGFR1. The authors therefore need to analyze breathless in Figure 5B in addition to Htl.

      Thank you for your advice. We added experiments and the results are shown in Figure 5B and Figure 5—figure supplement 1.

      (6) More discussion about the reason why dsNrk and dsWsck can provide resistance to JHIII in Figure 1 is required.

      Thank you for your advice. We added explanation in the discussion: "It is generally believed that the primary role of JH is to antagonize 20E during larval molting (Riddiford, 2008). The knockdown of Cad96ca, Nrk, Fgfr1, and Wsck showed phenotypes resistant to JH III induction and the decrease of Kr-h1 and increase of Br-z7 expression, but knockdown of Vegfr and Drl only decrease Kr-h1, without increase of Br-z7. Br-z7 is involved in 20E-induced metamorphosis in H. armigera (Cai et al., 2014), whereas, Kr-h1 is a JH early response gene that mediates JH action (Minakuchi et al., 2009) and represses Br expression (Riddiford et al., 2010). The high expression of Br-z7 is possible due to the down-regulation of Kr-h1 in Cad96ca, Nrk, Fgfr1 and Wsck knockdown larvae. The different expression profiles of Br-z7 in Vegfr and Drl knockdown larvae suggest other roles of Vegfr and Drl in JH signaling, which need further study."

      Reviewer #3 (Recommendations For The Authors):

      (1) The authors should consider optimizing their experimental approach by depleting the six candidate RTKs in an early larval stage rather than using a sensitized background with JH application in the last larval stage.

      Thank you for your precious suggestion. We knocked down the genes at last larval stage to observe pupation, which is a relatively simple and easily to be observed target to examine the role of the gene in JH-maintained larval status. The results from CRISPR/Cas9 experiments showed: "Most wild-type larvae showed a phenotype of pupation on time. However, in the Cad96ca mutant, 86% of the larvae (an editing efficiency of 67% by TA clone analysis) had a shortened feeding stage in the sixth instar and entered the metamorphic molting stage earlier, showing early pupation, with the pupation time being 24 h earlier. In the Fgfr1 mutant, 91% of the larvae (an editing efficiency of 61%) had a shortened feeding stage in the sixth instar and entered the metamorphic molting stage earlier, showing early pupation, with the pupation time being 23 h earlier (Figure 4D and E). The data suggested that CAD96CA and FGFR1 support larval growth and prevent pupation in vivo.". To know the roles of other RTKs in the whole larval development needs future work since a lot of experiments are needed.

      (2) Including a positive control for JH signaling, such as met or tai, would strengthen the assays and provide a benchmark for evaluating the downregulation of target genes and phenotype reversion upon JH application. This addition, especially in Figure 1, would enhance the interpretability of the results.

      Thank you for your suggestion. We agree with your point of view that adding the detection of Met or Tai as a positive control. Our laboratory has reported in previous studies that knockdown of Met leads to decreased expression of genes in the JH signaling pathway and precocious pupation (PMID: 24872508), so we did not repeat this related experiment in this study. In the future, when performg Cad96ca and Fgfr1 double mutant experiments, Met mutant can be generated as a control to provide more references for the interpretation of the results.

      (3) I recommend revising the manuscript to improve readability, particularly in the Results section, where descriptions of the binding part are particularly dense.

      Thank you for your advice. We have carefully revised the manuscript.

      (4) In line 122, please add the reference Wang et al., 2016.

      Thank you for your reminding, we have added the reference in line 125 of the new manuscript.

      (5) The authors should clarify why they chose to test the possible binding to JH of only Cad96CA, FGFR1, and NRK after conducting various assays while including OTK in the study as a negative control. This explanation should be included in the text.

      Thank you for the suggestion. We added the explanation, as described in the text: "We screened the RTKs sequentially, including examining the roles of 20 RTKs identified in the H. armigera genome in JH regulated-gene expression to obtain primary candidates, followed by screening of the candidates by their roles in maintaining larval status, JH induced-rapid increase of intracellular calcium levels, JH induced-phosphorylation of MET and TAI, and affinity to JH. The cadherin 96ca (CAD96CA) and fibroblast growth factor receptor 1 (FGFR1) were finally determined as JH cell membrane receptors by their roles in JH regulated-gene expression, maintaining larval status, JH induced-rapid increase of intracellular calcium levels, JH induced-phosphorylation of MET and TAI, and their JH-binding affinity. Their roles as JH cell membrane receptors were further determined by knockdown and knockout of them in vivo and cell lines, and overexpression of them in mammal HEK-293T heterogeneously.".

      "Since Cad96CA, FGFR1, and NRK were not only involved in JH-regulated Kr-h1 expression, JH III-induced delayed pupation, and calcium levels increase, but also involved in MET and TAI phosphorylation, we further analyzed their binding affinity to JH III. OTK did not respond to JH III, so we used it as a control protein on the cell membrane to exclude the possibility of nonspecific binding.".

      (6) The observed embryonic lethality of cad96ca and FGF1 mutants in Drosophila contrasts with the ability of the respective mutants in H. armigera to reach the pupal stage. The authors should discuss this significant difference.

      Thank you for the suggestion. We added the explanation in the discussion, as described in the text: "Homozygous Cad96ca null Drosophila die at late pupal stages (Wang et al., 2009). However, we found that 86% of the larvae of the Cad96ca mutant successfully pupated in G0 generation, although earlier than the control. Similarly, null mutation of Fgfr1 or Fgfr2 in mouse is embryonic lethal (Arman et al., 1998; Deng et al., 1994; Yamaguchi et al., 1994). In D. melanogaster, homozygous Htl (Fgfr) mutant embryos die during late embryogenesis, too (Beati et al., 2020; Beiman et al., 1996; Gisselbrecht et al., 1996). However, in H. armigera, 91% of larvae successfully pupated in G0 generation after Fgfr1 knockout. The low death rate after Cad96ca and Fgfr1 knockout might be because of following reasons, including the editing efficiency (67% and 61% for Cad96ca mutant and Fgfr1 mutant, respectively), the chimera of the gene knockout at the G0 generation, and the redundant RTKs that play similar roles in JH signaling, similar to the redundant roles of MET and Germ-cell expressed bHLH-PAS (GCE) in JH signaling (Liu et al., 2009), which needs to obtain alive G1 homozygote mutants and double knockout of these two receptors in future study. We indeed observed that the eggs did not hatch successfully after mixed-mating of G0 Cad96ca mutant or Fgfr1 mutant, respectively, but the reason was not addressed further due to the embryonic death. By the similar reasons, most of the Cad96ca and Fgfr1 mutants showed a slight acceleration of pupation (about one day) without the typical precocious metamorphosis (at least one instar earlier) phenotype caused by JH signaling defects (Daimon et al., 2012; Fukuda, 1944; Riddiford et al., 2010) and JH pathway gene deletions (Abdou et al., 2011; Liu et al., 2009). On other side, JH can regulate gene transcription by diffusing into cells and binding to the intracellular receptor MET to conduct JH signal, which might affect the results of gene knockdown and knockout.".

      (7) Building upon the previous point, it is noteworthy that the cad96ca and FGF1 mutants exhibit only a 24-hour early pupation phenotype, contrasting with the 48-hour early pupation induced by Kr-h1 depletion. This discrepancy suggests that while the function of these RTKs is necessary, it may not be sufficient to fully activate JH signaling. The expression profile of these receptors, primarily observed in the last larval stage, supports this hypothesis.

      Thank you for your suggestion. We added the explanation in the discussion, as described in the text: "Homozygous Cad96ca null Drosophila die at late pupal stages (Wang et al., 2009). However, we found that 86% of the larvae of the Cad96ca mutant successfully pupated in G0 generation, although earlier than the control. Similarly, null mutation of Fgfr1 or Fgfr2 in mouse is embryonic lethal (Arman et al., 1998; Deng et al., 1994; Yamaguchi et al., 1994). In D. melanogaster, homozygous Htl (Fgfr) mutant embryos die during late embryogenesis, too (Beati et al., 2020; Beiman et al., 1996; Gisselbrecht et al., 1996). However, in H. armigera, 91% of larvae successfully pupated in G0 generation after Fgfr1 knockout. The low death rate after Cad96ca and Fgfr1 knockout might be because of following reasons, including the editing efficiency (67% and 61% for Cad96ca mutant and Fgfr1 mutant, respectively), the chimera of the gene knockout at the G0 generation, and the redundant RTKs that play similar roles in JH signaling, similar to the redundant roles of MET and Germ-cell expressed bHLH-PAS (GCE) in JH signaling (Liu et al., 2009), which needs to obtain alive G1 homozygote mutants and double knockout of these two receptors in future study. We indeed observed that the eggs did not hatch successfully after mixed-mating of G0 Cad96ca mutant or Fgfr1 mutant, respectively, but the reason was not addressed further due to the embryonic death. By the similar reasons, most of the Cad96ca and Fgfr1 mutants showed a slight acceleration of pupation (about one day) without the typical precocious metamorphosis (at least one instar earlier) phenotype caused by JH signaling defects (Daimon et al., 2012; Fukuda, 1944; Riddiford et al., 2010) and JH pathway gene deletions (Abdou et al., 2011; Liu et al., 2009). On other side, JH can regulate gene transcription by diffusing into cells and binding to the intracellular receptor MET to conduct JH signal, which might affect the results of gene knockdown and knockout.".

      (8) The expression profile of the RTK hits described in Supplementary Figure 4A appears to be limited to the last larval stage until pupation. The authors should clarify whether these receptors are expressed earlier, and the meaning of the letters in the plot should be described in the figure legend.

      Thank you for the suggestion. We added the explanation in the Figure 1—figure supplement 4 legend, as described in the text: "The expression profiles of Vegfr1, Drl, Cad96ca, Nrk, Fgfr1, and Wsck during development. 5F: fifth instar feeding larvae; 5M: fifth instar molting larvae; 6th-6 h to 6th-120 h: sixth instar at 6 h to sixth instar 120 h larvae; P0 d to P8 d: pupal stage at 0-day to pupal stage at 8-day F: feeding stage; M: molting stage; MM: metamorphic molting stage; P: pupae.".

      We are very sorry, but due to time limitations, we will investigate the expression profile of RTK throughout the larval stage in future work.

      (9) In Figure 4, panels F and G, the levels of Kr-h1 are shown in cad96ca and FGF1 mutants in the last larval stage. The authors should indicate whether Kr-h1 levels are also low in earlier larval stages or only detected in the last larval stage, as this would imply that these RTKs are only required at this stage.

      Thank you for your suggestion. In this study, the Cad96ca and Fgfr1 mutants' feeding stage was shortened in the sixth instar, and they entered the metamorphic molting stage earlier. So, we detected the expression of Kr-h1 in the sixth instar. It is an excellent idea to detect the expression of Kr-h1 at various larvae stages to analyze the stages in which CAD96CA and FGFR1 play a role and to study the relationship between CAD96CA and FGFR1 in future.

      (10) While Figure 5 demonstrates JH-triggered calcium ion mobilization in Sf9 cells and S2 cells, the authors should also include data on JH signaling target genes, such as Kr-h1, for a more comprehensive analysis.

      Thank you for your advice. We added experiments, as described in the text: "To demonstrate the universality of CAD96CA and FGFR1 in JH signaling in different insect cells, we investigated JH-triggered calcium ion mobilization and Kr-h1 expression in Sf9 cells developed from S. frugiperda and S2 cells developed from D. melanogaster. Knockdown of Cad96ca and Fgfr1 (named Htl or Btl in D. melanogaster), respectively, significantly decreased JH III-induced intracellular Ca2+ release and extracellular Ca2+ influx, and Kr-h1 expression (Figure 5A, B, Figure 5—figure supplement 1A and B). The efficacy of RNAi of Cad96ca and Fgfr1 was confirmed in the cells (Figure 5—figure supplement 1C and D), suggesting that CAD96CA and FGFR1 had a general function to transmit JH signal in S. frugiperda and D. melanogaster.".

      (11) The authors should consider improving the quality of images and some plots, particularly enlarging panels showing larval and pupal phenotypes, such as Figure 1B and Supplementary Figure C. Additionally, adding a plot showing the statistical analysis of the phenotype in Supplementary Figure C would enhance clarity. Some plots are overly busy and difficult to read due to small size, such as Figure 1C, Figure 2A, and all the plots in Figure 3. Figure 4E also requires improvement for better readability.

      Thank you for your suggestion. We have adjusted Figure 1B, Figure 1C, Figure 1—figure supplement 1C, Figure 2A and Figure 4E. However, for Figure 3, we have not found a better way to arrange and adapt them, considering the overall arrangement of the results and the page space, so we keep them in their original state.

    1. Author response:

      The following is the authors’ response to the original reviews.

      Public Reviews:

      Reviewer #1 (Public review):

      Summary:

      This work is meant to help create a foundation for future studies of the Central Complex, which is a critical integrative center in the fly brain. The authors present a systematic description of cellular elements, cell type classifications, behavioral evaluations and genetic resources available to the Drosophila neuroscience community.

      Strengths:

      The work contributes new, useful and systematic technical information in compelling fashion to support future studies of the fly brain. It also continues to set a high and transparent standard by which large-scale resources can be defined and shared.

      Weaknesses:

      manuscript p. 1

      "The central complex (CX) of the adult Drosophila melanogaster brain consists of approximately 2,800 cells that have been divided into 257 cell types based on morphology and connectivity (Scheer et al., 2020; Hulse et al. 2021; Wolff et al., 2015)."

      The 257 accumulated cell types have informational names (e.g., PBG2‐9.s‐FBl2.b‐NO3A.b) in addition to their associations with specific Gal4 lines and specific EM Body IDs. All this is very useful. I have one suggestion to help a reader trying to get a "bird's eye view" of such a large amount of detailed and multi-layered information. Give each of the 257 CX cell types an arbitrary number: 1 to 257. In fact, Supplemental File 2 lists ~277 cell types each with a number in sequence, so perhaps in principle, it is there. This could expedite the search function when a reader is trying to cross-reference CX cell type information from the text, to the Figures and/or to the Supplemental Figures. Also, the use of (arbitrary) cell type numbers could expedite the explanation of which cell types are included in any compilation of information (e.g., which ones were tested for specific NT expression).

      In this report we adhered to the nomenclature introduced in Hulse et al. 2021. We agree that the nomenclature of cell types in the CX is imperfect. There are inherent limitations to what can be done with present data. Even between the hemibrain and FAFB/Flywire EM datasets, it was not possible to derive a one-to-one correspondence in many cases, largely because we do not yet have enough information to distinguish between natural variation within a cell type and distinct cell types (see Schlegel et al. 2024).  Moreover, many cell type distinctions depend on connectivity differences that are observable only in EM datasets but not in LM images. Several research groups are currently engaged in a comprehensive and collaborative effort to update the CX nomenclature that will extend over the next few months as additional connectomes become available. This work will require hundreds of hours of effort from anatomical and computational experts in multiple laboratories who have a strong interest in the CX. Since the correspondence between the established Hulse et al nomenclature we use and this new nomenclature will be made clear, it will be easy to transfer our data to that new nomenclature. For all these reasons, we believe we should not unilaterally introduce any new naming systems at this time.

      manuscript p 2

      "Figure 2 and Figure 2-figure supplements 1-4 show the expression of 52 new split-GAL4 lines with strong GAL4 expression that is largely limited to the cell type of interest. .... We also generated lines of lesser quality for other cell types that in total bring overall coverage to more than three quarters of CX cell types."

      This section describes the generation and identification of specific split Gal4 lines, and the presentation is generally excellent. It represents an outstanding compendium of information. My reading of the text suggests ~200 cell types have Gal4 lines that are of immediate use (having high specificity or v close-to-high). Use of an arbitrary number system (mentioned above) could augment that description for the reasons stated. For example, which of the 257 cell types are represented by split Gal4 lines that constitute the ~1/3 representing "high-quality lines "? A second comment relates to this study 's functional analysis of the contributions of CX cell types to sleep physiology. The recent literature contains renewed interest in the specific expression patterns of Gal4 lines that can promote sleep-like behaviors. In particular Gal4 line expression outside the brain (in the VNC and outside the CNS) have been raised as important elements that need be included for interpretation interpretation of sleep regulation. This present study offers useful information about a large number of expression patterns, as well as a basis with which to seek additional information., including mention of VNC expression in many cases However, perhaps I missed it, but I could not find a short description of the over-all strategy used to describe the expression patterns and feel that could be helpful. Were all Gal4 lines studied for expression in the VNC? and in the peripheral NS? It is probably published elsewhere, but even a short reprise would still be useful.

      We added a couple of sentences to clarify that the lines were imaged in the adult female brain and VNC and many were also imaged in males. These data, including the ability to download the original confocal stacks, are contained in an on-line web source cited in the text. We also make clear that we did not assay expression outside of the brain, optic lobes and VNC. Therefore, we cannot rule out expression in the peripheral nervous system (other than detected in the axons of sensory neurons in the CNS) or in muscle or other non-neuronal cell types.

      manuscript p 9

      Neurotransmitter expression in CX cell types

      "To determine what neurotransmitters are used by the CX cell types, we carried out fluorescent in situ hybridization using EASI-FISH (Eddison and Irkhe, 2022; Close et al., 2024) on brains that also expressed GFP driven from a cell-type-specific split GAL4 line. In this way, we could determine what neurotransmitters were expressed in over 100 different CX cell types based on ...."

      Reading this description, I was uncertain whether the >100 cell types mentioned were tested with all the NT markers by EASI-FISH? Also, assigning arbitrary numbers to the cell types (same suggestion as above) could help the reader more readily ascertain which were the ~100 cell types classified in this context.

      The specific probes used for each cell type are indicated in Figure 9 and in Supplemental File 1.

      manuscript p 10

      "Our full results are summarized below, together with our analysis of neuropeptide expression in the same cell types."

      I recommend specifying which Figures and Tables contain the "full results" indicated.

      We changed the wording to read:

      “Our full results are summarized, together with our analysis of neuropeptide expression in the same cell types, in Figures 5 -9 and in Supplemental File 1.”

      NP expression in CX cell types

      Similar to the comments regarding studies of NT expression: were all ~100 cell types tested with each of the 17 selected NPs? Arbitrary numerical identifies could be useful for the reader to determine which cell types/ lines were tested and which were not yet tested.

      We expanded the description in Methods to now read:

      “For neurotransmitters, the specific probes used for each cell type are indicated in Figure 9 and in Supplemental File 1. For neuropeptides, each of the 17 selected NP probes shown in Figure 5—figure supplement 1 was used on all cell types in Figure 9 except those marked by “—” in the neuropeptide column.”

      manuscript p. 11

      "The neuropeptide expression patterns we observed fell into two broad categories."

      This section presents information that is extensive and extremely useful. It supports consideration of peptidergic cell signaling at a circuits level and in a systematic fashion that will promote future progress in this field. I have two comments. First, regarding the categorization of two NP expression patterns, discernible by differences in cell number: this idea mirrors one present in prior literature. Recently the classification of the transcription factor DIMM summarizes this same two-way categorization (e.g., doi: 10.1371/journal.pone.0001896). That included the fact that a single NP can be utilized by cell of either category.

      We inserted a sentence to acknowledge this earlier work:

      “Such large neurosecretory cells often express the transcription factor DIMM (Park et al. 2008).”

      Second, regarding this comment:

      "In contrast, neuropeptides like those shown in Figure 6 appear to be expressed in dozens to hundreds of cells and appear poised to function by local volume transmission in multiple distinct circuits."

      Signaling by NPs in this second category (many small cells) suggests more local diffusion, a smaller geographic expanse compared to "volume" signaling by the sparser larger peptidergic cells. Given this, I suggest re-consideration in using the term "volume" in this instance, perhaps in favor of "local" or "paracrine". This is only a suggestion and in fact rests almost entirely on speculation/ interpretation, as the field lacks a strong empirical basis to say how far NPs diffuse and act. A recent study in the fly brain of peptide co-transmitters (doi: 10.1016/j.cub.2020.04.025) provides an instructive example in which differences between the spatial extents of long-range (peptide 1) versus short-range (peptide 2) NP signaling may be inferred in vivo.

      We have modified the text to now read:

      “those shown in Figure 6 are expressed in dozens to hundreds of cells and appear poised to function by transmission to nearby cells in multiple distinct circuits.”  

      Spab was mentioned (Figure 6 legend) but discarded as a candidate NP to include based on a personal communication, as was Nplp1. The manuscript did not include reasons to do so, nor include a reference to spab peptide. I suggest including explicit reasons to discard candidate NPs.

      While there is strong supportive evidence for many NPs in Drosophila, the fact that other transcripts express NPs is more circumstantial often relying simply on sequence analysis and without convincing evidence for a specific cognate receptor. We note that Spab is not listed as a neuropeptide in the current release of FlyBase. In these cases, we relied on the opinion of individuals with extensive experience in studying Drosophila NPs. The results obtained with the probes for Spab and Nplp1 are still available in Supplemental File 1.

      In Fig 9-supplement 1, neurotransmitter biosynthetic enzymes were measured by RNA-seq for given CX cell types to augment the cell type classification. The same methods could be used to support cell type classification regarding putative peptidergic character (in Figure 9 supplement 2) by measuring expression levels of critical, canonical neuropeptide biosynthetic enzymes. These include the proprotein convertase dPC2 (amon); the carboxypeptidase dCPD/E (silver); and the amidating enzymes dPHM; dPal1; dPal2. PHM is most related to DBM (dopamine beta monooxygenase), the rate limiting enzyme for DA production, and greater than 90% of Drosophila neuropeptides are amidated. If the authors are correct in surmising widespread use of NPs by CX cell types (and I expect they are), there could be diagnostic value to report expression levels of this enzyme set across many/most CX cell types.

      In our admittedly limited experience, most cells express these enzymes and the level we observed in confirmed NP expressing cell types was not reproducibly higher.  (The complete data for all genes for the cell types we assayed are available from our deposition in the NCBI Gene Expression Omnibus with accession number GSE271123.) Given our small sample size we chose not to comment on this in the paper.

      Comment #6

      Screen of effects on Sleep behavior

      This work is large in scope and as suggested likely presents excellent starting points for many follow-up studies. I again suggest assigning stable number identities to the elements described. In this case, not cell types, but split Gal4 lines. This would expedite the cross-referencing of results across the four Supplemental Files 3-6. For example, line SS00273 is entry line #27 in S Files 3 and 4, but line entry #18 in S Files 5 and 6.

      We believe the interested reader can make this correspondence by searching the supplemental files which are excel spreadsheets. We note that both driver lines and cell types have stable identifiers that are used across Figures and Tables: the line numbers (for example, SS00273) for driver lines and the Hulse et al cell type names for cell types.

      manuscript p 26

      Clock to CX

      "Not surprisingly, the connectome reveals that many of the intrinsic CX cell types with sleep phenotypes are connected by wired pathways (Figure 12 and Figure 12-figure supplement 1)."

      Do intrinsic CX cells with sleep phenotypes also connect by wired pathways to CX cells that do not have sleep phenotypes?

      Yes, but we do not have high confidence that negative sleep phenotypes in our assays indicate no role in sleep.

      "The connectome also suggested pathways from the circadian clock to the CX. Links between clock output DN1 neurons to the ExR1 have been described in Lamaze et al. (2018) and Guo et al. (2018), and Liang et al. (2019) described a connection from the clock to ExR2 (PPM3) dopaminergic neurons."

      The introduction to this section indicates a focus on connectome-defined synaptic contacts. Whereas the first two studies cited featured both physiological and anatomic evidence to support connectivity from clock cells to CX, the third did not describe any anatomical connections, and that connection may in fact be due to diffuse not synaptic signaling

      I could not easily discern the difference between Figs 12 and 12-S1? These appear to be highly-related circuit models, wherein the second features more elements. Perhaps spell out the basis for the differences between the two models to avoid ambiguity.

      We clarify the supplemental diagram differs from the one in the main text by the inclusion of additional connections:

      “The strongest of these connections are diagrammed in Figure 12, with Figure 12—figure supplement 1 also showing additional weaker connections.”

      "...the cellular targets of Dh31 released from ER5 are unknown, however previous work (Goda et al., 2017; Mertens et al., 2005; Shafer et al., 2008) has shown that Dh31 can activate the PDF receptor raising the possibility of autocrine signaling."

      Regarding pharmacological evidence for Dh31 activation of Pdfr: strong in vivo evidence was developed in doi: 10.1016/j.neuron.2008.02.018: a strong pdfr mutation greatly reduces response to synthetic dh31 in neurons that normally express Pdfr

      We added the Shafer et al., 2008 reference. 

      manuscript p 30

      "Unexpectedly, we found that all neuropeptide-expressing cell types also expressed a small neurotransmitter."

      Did this conclusion apply only to CX cell types? - or was it also true for large peptidergic neurons? Prior evidence suggests the latter may not express small transmitters (doi: 10.1016/j.cub.2009.11.065). The question pertains to the broader biology of peptidergic neurons, and is therefore outside the strict scope of the main focus area - the CX. However, the text did initially consider peptidergic neurons outside the CX, so the information may be pertinent to many readers.

      We did not look at other cell types in the current study and so cannot provide an answer.

      Reviewer #2 (Public review):

      Summary:

      In this paper, Wolff et al. describe an impressive collection of newly created split-GAL4 lines targeting specific cell types within the central complex (CX) of Drosophila. The CX is an important area in the brain that has been involved in the regulation of many behaviors including navigation and sleep/wake. The authors advocate that to fully understand how the CX functions, cell-specific driver lines need to be created. In that respect, this manuscript will be of very important value to all neuroscientists trying to elucidate complex behaviors using the fly model. In addition, and providing a further very important finding, the authors went on to assess neurotransmitter/neuropeptides and their receptors expression in different cells of the CX. These findings will also be of great interest to many and will help further studies aimed at understanding the CX circuitries. The authors then investigated how different CX cell types influence sleep and wake. While the description of the new lines and their neurochemical identity is excellent, the behavioral screen seems to be limited.

      Strengths:

      (1) The description of dozens of cell-specific split-GAL4 lines is extremely valuable to the fly community. The strength of the fly system relies on the ability to manipulate specific neurons to investigate their involvement in a specific behavior. Recently, the need to use extremely specific tools has been highlighted by the identification of sleep-promoting neurons located in the VNC of the fly as part of the expression pattern of the most widely used dorsal-Fan Shaped Body (dFB) GAL4 driver. These findings should serve as a warning to every neurobiologist, make sure that your tool is clean. In that respect, the novel lines described in this manuscript are fantastic tools that will help the fly community.

      (2) The description of neurotransmitter/neuropeptides expression pattern in the CX is of remarkable importance and will help design experiments aimed at understanding how the CX functions.

      Weaknesses:

      (1) I find the behavioral (sleep) screen of this manuscript to be limited. It appears to me that this part of the paper is not as developed as it could be. The authors have performed neuronal activation using thermogenetic and/or optogenetic approaches. For some cell types, only thermogenetic activation is shown. There is no silencing data and/or assessment of sleep homeostasis or arousal threshold. The authors find that many CX cell types modulate sleep and wake but it's difficult to understand how these findings fit one with the other. It seems that each CX cell type is worthy of its own independent study and paper. I am fully aware that a thorough investigation of every CX neuronal type in sleep and wake regulation is a herculean task. So, altogether I think that this manuscript will pave the way for further studies on the role of CX neurons in sleep regulation.

      (2) Linked to point 1, it is possible that the activation protocols used in this study are insufficient for some neuronal types. The authors have used 29{degree sign} for thermogenetic activation (instead of the most widely used 31{degree sign}) and a 2Hz optogenetic activation protocol. The authors should comment on the fact that they may have missed some phenotypes by using these mild activation protocols.

      Our primary goal was to test the feasibility of using these tools in assessing sleep and wake function of neurons within the CX. In the process we uncovered several new neurons within the DFB-EB network that control sleep and make connections with previously identified sleep regulating neurons. For all single cell type lines and lines with sparse patterns and no VNC expression we present both optogenetics and thermogenetic data. The lines for which we only have thermogenetic but no optogenetic data are those which have multiple cell types or VNC expression. We felt that optogenetic data for these non-specific or contaminated lines would not reliably indicate a role for individual cell types in sleep regulation.

      Many previous studies that have used 31 degrees have done so for shorter durations and often using different times of the day for manipulations. The lack of consistency between studies using this temperature may be due in part to the fact that 31 degrees alters behaviors of flies (including controls) and, for this reason, is usually not used for 24-hour activation durations.

      To keep the screen consistent and ensure we capture changes in both daytime and nighttime sleep we used 29 degrees. The behavior of control flies is not as disrupted or altered at this temperature, and 29 degrees for activation is routinely used in behavioral experiments.

      We similarly selected an optogenetic stimulation protocol that minimizes the response of flies to the red-light pulses. We chose this protocol because we found, in earlier experiments in a different project, that this level of stimulation was able to elicit activation phenotypes across a range of cell types (including several known clock neurons). However, we cannot rule out false negatives in both the TrpA and optogenetic experiments and agree that we might have missed some phenotypes.

      Finally, as the reviewer rightfully points out, a thorough, detailed investigation of each cell type is a herculean task. We screened in both genders with very sparse, and often cell-type-specific, driver lines while using two distinct modes of activation and different methods for assessing sleep. For these reasons, we believe the GAL4 lines we identified provide excellent starting points for the additional investigations that will be required to better understand the roles of specific cell types.

      (3) There are multiple spelling errors in the manuscript that need to be addressed.

      Reviewer #3 (Public review):

      Summary:

      The authors created and characterized genetic tools that allow for precise manipulation of individual or small subsets of central complex (CX) cell types in the Drosophila brain. They developed split-GAL4 driver lines and integrated this with a detailed survey of neurotransmitter and neuropeptide expression and receptor localization in the central brain. The manuscript also explores the functional relevance of CX cell types by evaluating their roles in sleep regulation and linking circadian clock signals to the CX. This work represents an ambitious and comprehensive effort to provide both molecular and functional insights into the CX, offering tools and data that will serve as a critical resource for researchers.

      Strengths:

      (1) The extensive collection of split-GAL4 lines targeting specific CX cell types fills a critical gap in the genetic toolkit for the Drosophila neuroscience community.

      (2) By combining anatomical, molecular, and functional analyses, the authors provide a holistic view of CX cell types that is both informative and immediately useful for researchers across diverse disciplines.

      (3) The identification of CX cell types involved in sleep regulation and their connection to circadian clock mechanisms highlights the functional importance of the CX and its integrative role in regulating behavior and physiological states.

      (4) The authors' decision to present this work as a single, comprehensive manuscript rather than fragmenting it into smaller publications each focusing on separate central complex components is commendable. This decision prioritizes accessibility and utility for the broader neuroscience community, which will enable researchers to approach CX-related questions with a ready-made toolkit.

      Weaknesses:

      While the manuscript is an outstanding resource, it leaves room for more detailed mechanistic exploration in some areas. Nonetheless, this does not diminish the immediate value of the tools and data provided.

      Appraisal:

      The authors have succeeded in achieving their aims of creating well-characterized genetic tools and providing a detailed survey of neurochemical and functional properties in the CX. The results strongly support their conclusions and open numerous avenues for future research. The work effectively bridges the gap between genetic manipulation, molecular characterization, and functional assessment, enabling a deeper understanding of the CX's diverse roles.

      Impact and Utility

      This manuscript will have a significant and lasting impact on the field, providing tools and data that facilitate new discoveries in the study of the CX, sleep regulation, circadian biology, and beyond. The genetic tools developed here are likely to become a standard resource for Drosophila researchers, and the comprehensive dataset on neurotransmitter and neuropeptide expression will inspire investigations into the interplay between neuromodulation and classical neurotransmission.

      Additional Context

      The breadth and depth of the resources presented in this manuscript justify its publication without further modification. By delivering an integrated dataset that spans anatomy, molecular properties, and functional relevance, the authors have created a resource that will serve the neuroscience community for years to come.

      Recommendations for the authors:

      Reviewing Editor:

      The reviewers suggest that a nomenclature, perhaps a numbering system, be adopted for different cell types and Gal4 drivers in order to facilitate reading of the manuscript and cross-referencing.

      We agree that a comprehensive reanalysis of the CX nomenclature is in order, but it is premature for us to attempt that as part of this study. This is best done after additional connectomes are generated to help resolve the degree of variation in morphology and connectivity between the same cell in multiple animals.

      Reviewer #3 (Recommendations for the authors):

      The authors have characterized a large number of split-GAL4 drivers targeting individual or small subsets of CX cell types. This manuscript delivers a detailed anatomical, molecular, and functional mapping of the CX.

      By integrating data on neurotransmitters, neuropeptides, and their receptors, the authors provide a holistic view of CX cell types that will undoubtedly serve as a foundation for future studies.

      The use of these genetic tools to identify CX cell types affecting sleep, as well as those linking the circadian clock to the CX, represents a significant advance. These findings hint at the diverse and integrative roles of the CX in regulating both behavior and physiological states.

      The authors' decision to present this work as a single, comprehensive manuscript rather than fragmenting it into smaller publications each focusing on separate central complex components is commendable. This decision prioritizes accessibility and utility for the broader neuroscience community, which will enable researchers to approach CX-related questions with a ready-made toolkit.

      While the manuscript leaves room for further exploration and mechanistic studies, the breadth and depth of the resources presented are more than sufficient to justify publication in their current form.

      The data on neuropeptide and receptor expression patterns, especially the observation that all examined CX cell types co-express a small neurotransmitter, opens intriguing new avenues of inquiry into the interplay between classical neurotransmission and neuromodulation in this region.

      This manuscript has provided a much-needed resource for the Drosophila neuroscience community and beyond. This work will facilitate important discoveries in CX function, sleep regulation, circadian biology, and more.

    1. Author response:

      The following is the authors’ response to the previous reviews.

      Public Reviews:

      Reviewer #4 (Public review):

      We would like to thank the reviewer for their careful consideration of our manuscript. The suggestions have been useful in improving our manuscript. Please see our responses to the specific comments below.

      Summary:

      This is an important study that underscores that reproduction-survival trade-offs are not manifested (contrary to what generally accepted theory predicts) across a range of studies on birds. This has been studied by a meta-analytical approach, gathering data from a set of 46 papers (30 bird species). The overall conclusion is that there are no trade-offs apparent unless experimental manipulations push the natural variability to extreme values. In the wild, the general pattern for within-species variation is that birds with (naturally) larger clutches survive better.

      Strengths:

      I agree this study highlights important issues and provides good evidence of what it claims, using appropriate methods.

      Weaknesses:

      I also think, however, that it would benefit from broadening its horizon beyond bird studies. The conclusions can be reinforced through insights from other taxa. General reasoning is that there is positive pleiotropy (i.e. individuals vary in quality and therefore some are more fit (perform better) than others. Of course, this is within their current environment (biotic, abiotic, social. ...), with consequences of maintaining genetic variation across generations - outlined in Maklakov et al. 2015 (https://doi.org/10.1002/bies.201500025). This explains the outcomes of this study very well and would come to less controversy and surprise for a more general audience.

      I have two fish examples in my mind where this trade-off is also discounted. Of course, given that it is beyond brood-caring birds, the wording in those studies is slightly different, but the evolutionary insight is the same. First, within species but across populations, Reznick et al. (2004, DOI: 10.1038/nature02936) demonstrated a positive correlation between reproduction and parental survival in guppies. Second, an annual killifish study (2021, DOI: 10.1111/1365-2656.13382) showed, within a population, a positive association between reproduction and (reproductive) aging.

      In fruit flies, there is also a strong experimental study demonstrating the absence of reproduction-lifespan trade-offs (DOI: 10.1016/j.cub.2013.09.049).

      I suggest that incorporating insights from those studies would broaden the scope and reach of the current manuscript.

      We would like to thank the reviewer for this useful insight and for highlighting these studies. We have added detail in our discussion around positive correlations observed in the wild, and how positive pleiotropy has been presented as an explanation. We have also added the suggested studies as references to demonstrate the reproduction-lifespan trade-off has been shown to be absent. See lines 257-260.

      Likely impact:

      I think this is an important contribution to a slow shift in how we perceive the importance of trade-offs in ecology and evolution in general. While the current view still is that one individual excelling in one measure of its life history (i.e. receiving benefits) must struggle (i.e. pay costs) in another part. However, a positive correlation between all aspects of life history traits is possible within an individual (such as due to developmental conditions or fitting to a particular environment). Simply, some individuals can perform generally better (be of good quality than others).

      We would like to thank the reviewer for highlighting the importance of our study. We hope our study will help the research community reflect on the importance of trade-offs between life-history traits and consider other possible explanations as to why variation in life-history traits is maintained within species.

    1. Author response:

      The following is the authors’ response to the original reviews.

      Reviewer #1 (Public Review):

      The authors have performed extensive work generating reporter mice and performing single-cell analysis combined with in situ hybridization to arrive at 14 clusters of enterochromaffin (EC) cells. Then, they focus on Piezo channel expression in distal EC cells and find that these channels might play a role in regulating colonic motility. Overall, this is an informative study that comprehensively classifies EC cells in different regions of the small and large intestine. From a functional point of view, however, the authors seem to ignore the fact that the expression of Piezo-2-IRES-Cre is broad, which would raise concerns regarding their physiological conclusions.

      The authors may wish to consider the following specific points: 

      It is surprising that the number of ileal EC cells is less than that of the distal colon, and it would be interesting to know whether the authors can comment about ileal EC cells. It is unclear why ileal ECs were not included in the study, even though they are mentioned in the diagram (Fig. 2c).

      We have discussed the rationale for excluding ileal ECs in the methods section under “Elimination of ileal GFP+ cells”. In our initial scRNA-seq experiment, our yield of epithelial cells and GFP positive cells was low, and a large proportion of these cells appeared to not have fully committed to the EC lineage. Also to note, we have previously seen fewer ECs in the distal ileum than upper small intestine and colon (PMID: 26803512). Given the low yield, and some uncertainty regarding the nature of the ileal EC population sorted by our methods, we considered that data from ileal ECs may not be an accurate representation of ileal EC cell diversity. Thus, we did not use ileal ECs in our second scRNA-seq experiment.

      Based on their analysis, there are 10 EC cell clusters in SI while there are only 4 clusters in the colon. The authors should comment on whether this is reflective of lesser diversity among colonic ECs or due to the smaller number of colonic ECs collected.

      The 4 clusters identified in the colon are consistent with previous a previous publication (Glass et al., Mol. Metab. 2017, PMID: 29031728), supporting the idea that these clusters are representative of the major clusters of colonic ECs. Nonetheless, we anticipate that with greater sample sizes (in any region) further resolution of subtypes could be resolved. 

      The authors previously described that distal colonic EC cells exhibit various morphologies (Kuramoto et al., 2021). Do Ascl1(+) EC cells particularly co-localize with EC cells with long basal processes? Also, to validate the RNA seq data, the authors might show co-localization between Piezo2/Ascl1/Tph1 in distal EC cells. It would be interesting to see whether Ascl1-CreER (which is available in Jax) specifically labels distal colonic EC cells as this could provide a good genetic tool to specifically manipulate distal colonic EC cells.

      We have shown co-localization between Piezo2/Ascl1/Tph1 in Supplementary Figure 6a. Unfortunately we did not study cell morphology in the Ascl1 smRNA-FISH experiments as these used thin cryosections, whereas morphological assessment of EC processes is best performed with thick (>60 µm) sections. It would be interesting if neuronal-like expression profiles correlate with neuronal-like morphology, which could be addressed in future studies with spatial transcriptomics. 

      The authors used Piezo2-IRES-Cre mice, whose expression is rather broad. They might examine the distribution of Chrm3-mCitrine in the intestine (IF/IHC would be straightforward). And if the expression is in other cell types (which is most likely the case), they should justify that the observed phenotype derives from Piezo2-expressing EC cells. Alternatively, they could use Piezo2-Cre;ePetFlp (or Vil-Flp);Chrm3 to specifically express DREADD receptors in distal colonic EC cells. Also, what does 5HT release look like in jejunal EC cells in Piezo-CHRM3 mice?

      Unfortunately we no longer have access to the animals to do these experiments.

      For the same reasons as above, DTR experiments may also be non-specific. For example, based on the IF staining (Fig. 6b,d), there seems to be a loss of Tph1+ cells in the proximal colon of Piezo2-DTR mice, so the effects of the Piezo2-DTR likely extend beyond the distal colon. 

      Figures 6b and d show distal colon, not proximal colon. Our Tph1<sup>+</sup> cell counts indicate there was no loss of Tph1 cells in the proximal colon following intraluminal administrations of DT. 

      It is unclear why the localized loss of Piezo2 in Piezo2-DTR mice alters small intestinal transit (Fig. 6g,h). The authors should discuss the functional differences observed between Piezo2-DTR (intraluminal app) and Vil1Piezo2 KO mice i.e., small intestinal transit, 5HT release, etc. Are these differences due to the residual Piezo2 expression in Piezo2 KO mice? In this context, the authors may want to discuss their findings in the context of recent papers, such as those from the Patapoutian and Ginty groups. 

      We have made the following amendment to speculate on the reason for delayed small intestinal transit in the DTR experiments:

      “There are a several possible explanations for this. Some Piezo2+ cells in the small intestine could have been depleted. Alternatively, 5-HT released from Piezo2+Tph1+ cells in the distal colon may provide feedback to the small intestine to accelerate motility, and thus depletion of these cells would result in slower intestinal transit.” 

      We have also added a comment speculating on why we did not see similar slowing of small intestinal transit in the Villlin-Cre Piezo2 KO:

      “No difference was observed in small intestine transit… in contrast to the DTR experiments, in which small intestinal transit was delayed. This could be due to the depletion of EC cells in the DTR experiments, whereas they are retained in the Villin-Cre Piezo2 KO mice. 5-HT secretion from ECs can be induced by other stimulants (even when Piezo2 is knocked out), and thus colonic 5-HT could be providing feedback to the small intestine to accelerate motility in the Villin-Cre Piezo2 KO mice. Residual Piezo2 expression in these mice could also be contributing to this effect.”

      We have added a comment on neural Piezo2 in the discussion:

      “However, in contrast to Piezo2 signalling in ECs which results in accelerated gut transit, Piezo2 signalling in DRG neurons appears to slow transit (refs: Wolfson et al., Cell 2023; PMID: 37541195; Servin-Venves et al., Cell 2023, PMID: 37541196).”

      Reviewer #2 (Public Review):

      Summary:

      The authors investigated the expression profile of enterochromaffin (EC) cells after creating a new tryptophan hydroxylase 1 (Tph1) GFP-reporter mouse using scRNAseq and confirmative RNAscope analysis. They distinguish 14 clusters of Tph1+ cells found along the gut axis. The manuscript focuses on two of these, (i) a multihormonal cell type shown to express markers of pathogen/toxin and nutrient detection in the proximal small intestine, and (ii) on a EC-cluster in the distal colon, which expresses Piezo2, rendering these cells mechanosensitive. In- and ex- vivo data explore the role of the mechanosensitive EC population for intestinal/colonic transit, using chemogenetic activation, diptheria-toxin receptor dependent cell ablation and conditional gut epithelial specific Piezo2 knock-out. Whilst some of these data are confirmative of previous reports - Piezo2 has been implicated in mechanosensitive serotonin release previously, as referred to by the authors - the data are solid and emphasize the importance of mechanosensitive serotonin release for colonic propulsion. The transcriptomic data will guide future research.

      Strengths:

      The transcriptomic data, whilst confirmative, is more granular than previous data sets. Employing new tools to establish a role of mechanosensitive EC cells for colonic and thus total intestinal transit. 

      Weaknesses: 

      (1) The proposed villus/crypt distribution of the 14 cell types is not verified adequately. The RNAscope and immunohistochemistry samples presented do not allow assessment of whether this interpretation is correct - spatial transcriptomics, now approaching single-cell resolution, would be likely to help verify this claim.

      Spatial transcriptomics would be excellent in validating the spatial distribution of the EC cell types in future studies. In our work, although the villus/crypt cluster annotations are assumptions (based on the differential expression of Neurog3, Tac1, and Sct, which is well supported by the literature), we have validated the spatial segregation of key markers. We quantified the crypt/villus location of Cartpt, Ucn3, and Trpm2 overlap with Tph1 (Figure 2d), Oc3, Cck, and Tph1 (Figure 3d), and TK/5-HT (Supplementary Fig 2d). This work supports our predictions on the spatial distribution of these clusters.

      (2) The physiological function and/or functionality of most of the transcriptomically enriched gene products has not been assessed. Whilst a role for Piezo2 expressing cells for colonic transit is convincingly demonstrated, the nature of the mechanical stimulus or the stimulus-secretion coupling downstream of Piezo2 activation is not clear.

      While we have not investigated the mechanical forces involved in activating Piezo2, we can at least say that physiological mechanical stimulation activates Piezo2, as we measured fecal pellet output in the DTR experiments. 

      Reviewer #2 (Recommendations For The Authors):

      (1) Please state (even more) clearly if/that the apparently GFP+/Tph1+ cells which clustered with the GFP- cells (Suppl. Fig1d/e) were excluded from the subsequent analysis. The detectable Chg-a/b expression in the GFP- cells in Suppl. Fig1f seems to suggest that these (if they have been included in the GFP- group here) are genuine ECs. How do these cells relate to the non-EC cells in Fig1d, which seem to lack Tph1 expression? And given the information in the methods, what %age of these cells derived from the ileum?

      To clarify, data shown in Suppl. Fig 1d/e/f was from our first single cell profiling experiment whereas our subsequent clustering analysis utilizes data from a second (independent) single cell profiling experiment (e.g. Fig1d). 

      In the first profiling experiment, 23% of GFP<sup>+</sup> cells clustered with GFP<sup>-</sup> cells, and for the purposes of Suppl. Figures 1d/e/f, we called these “non-ECs”. In the second profiling experiment (e.g. shown in Fig 1d) we performed a more detailed cluster analysis focusing on only GFP<sup>+</sup> cells. In this second experiment, 19% of GFP<sup>+</sup> cells were identified as “non-EC cells” based on the presence of markers for stem cells, transit amplifying cells (TACs), immature enterocytes, mature enterocytes, colonocytes, T lymphocytes and mucosal mast cells (see Fig 1d and Suppl. Fig 1g). Similar to the first profiling dataset, many of the GFP<sup>+</sup> “non-EC cells” in the second dataset express Tph1, Chga, and Chgb, generally at lower levels than the “EC cells” (Suppl. Fig1i). It is possible that the stem cell and transit amplifying cell clusters are cells that are differentiating into EC cells. However, given that they have not fully committed to the lineage yet, we do not consider it appropriate to classify them as “EC cells”. With regards to the other “non-EC” clusters, we do not think that the expression of EC cell marker genes (Tph1, Chga, and Chgb) is evidence enough to call them genuine “EC cells” given the concurrent expression of markers of other lineages (e.g. enterocyte and mast cell markers Suppl. Fig 1g). The expression of Tph1 in murine mast cells is known, however the expression in enterocytes is unexpected and could be a result of imperfect/incomplete differentiation. Since the ileum was not included in the second profiling experiment we do not think the GFP<sup>+</sup> “non-EC cells” are an artifact from the ileum. 

      We have made some adjustments in the first section of the results to clarify some thoughts on this matter:

      “It is possible that some GFP is expressed in cells that have not yet fully committed to the EC lineage, or that there is some expression in cells outside this lineage, for example, in mast cells. Given the small sample size, we did not further investigate these cells in this dataset. In Supplementary Figures 1 d and f we refer to the GFP<sup>+</sup> cells that clustered with the GFP<sup>-</sup> cells as “non-EC cells”.”

      “It is possible that the stem cell and transit amplifying cell clusters include cells that are in the process of differentiating into EC cells. However, given that they have not fully committed to the lineage, we do not consider it appropriate to classify them as “EC cells” for the purposes of analyzing EC cell types in this study.”

      (2) The authors state: "Notably, OSR2 and HOXB13 were restricted to the ileum and rectum respectively in humans (Fig. 1f)." - the statement regarding OSR2 seems too strong, given that only the ileal part of the human small intestine was examined and that there is a small signal in the proximal colon in Figure 1f.

      Thanks, we have made the following amendment:

      "Notably, OSR2 and HOXB13 were preferentially enriched in the ileum and rectum respectively in these human samples (Fig. 1f)."

      (3) Please clarify Suppl Fig2g/h labelling as villus and crypt enrichment ("...enrichment in villus clusters (g) or crypt clusters (h)."), when enrichment for some genes in cluster 4 is shown in both g and h. Why was duodenal cluster 6 excluded from this subset of data?

      We suspect (although have not proven) that cluster 4 is at a later stage in maturation/migration than cluster, as indicated by a somewhat ‘middle ground’ level of Sct expression, and generally being ‘in between’ the villus clusters and cluster 5 in expression levels of differentially expressed genes shown in Suppl Fig 2g/h. We have added the following comment to the figure legend to clarify this. We have not included cluster 6 as it is transcriptionally quite distinct from the other clusters:

      “Note that cluster 4 shares some features in common with crypt and villus clusters and may represent cells at an intermediate stage of development.”

      (4) "Using smRNA-FISH, we further mapped Olfr558 and Il12a transcripts to a separate subset of EC cells expressing Cpb2 (Fig. 4b,c), confirming the presence of two subpopulations of EC cells associated with different physiological roles in the proximal colon." - Claiming populations with different physiological functionality seems a strong statement given the relatively weak Cpb2 signals observed and that mRNA detection necessarily is a transcriptomic time limited snap-shot. Please reformulate.

      We have made the following revision:

      “Using smRNA-FISH, we further mapped Olfr558 and Il12a transcripts to a separate subset of EC cells expressing Cpb2 (Fig. 4b,c), supporting the idea that there are subpopulations of EC cells in the proximal colon with gene transcripts associated with different physiological roles.”

      (5) What are the white signals in the overlay in Fig5a, given that the Piezo1 probe (white) apparently did not give any staining by itself? Please consider a positive control for the Piezo1 probe.

      The white signals in the overlay are Piezo1 staining that we do observe at what we consider background levels (also visible in the single-channel image).

      (6) "Systematic administration of DT led to lethality in the Piezo2-DTR mice within 12 hours, but not in the Rosa26LSL-DTR or Piezo2-cre mice (data not shown), likely due to the essential function of Piezo2 in respiration" - presumably this should be corrected to "Systemic administration ...".

      Thanks, this has been corrected to "Systemic administration ...".

      (7) "Although gastric emptying (GE) was not affected in the Piezo2-DTR animals after DT treatment, small intestine transit (SIT) time, a measurement to assess the motility of small intestine, presented a small but statistically significant slowdown in the former group (Fig. 6g,h), suggesting that some Piezo2+ cells in the small intestine were depleted." - alternatively there could, of course, be a slowing of SIT in response to slower colonic transit independent of small intestinal epithelial Piezo2 or 5HT - to me this seems more likely given that even proximal colonic cells are spared in Fig6c and this should be discussed.

      Thanks, that is a good point. We have made an amendment, which is shown in response to reviewer 1.

      (8) In the context of the Villin-Cre experiments it should be discussed that other colonic EECs although express Piezo2, which might contribute to the observed phenotypes.

      In our study, 97.7% of Piezo2+ cells in the distal colon had detectable Tph1 expression, suggesting that there is not a significant degree of overlap with other EEC types.

      (9) MC4R is several times referred to as a nutrient-sensing moeity (e.g. in the discussion: "...and receptors associated with nutrient sensing (Casr and Mc4r), ...") - whilst the melanocortin system is important for nutrient homeostasis, MC4R is itself not a "nutrient sensor", a term usually reserved for the detection of macronutrients, such as amino acids, fatty acids, and monosaccharides; please reformulate. 

      We have amended this to “nutrient sensing and homeostasis”.

    1. Author response:

      Public Reviews:

      Reviewer #1 (Public review):

      Summary:

      The objective of this study was to infer the population dynamics (rates of differentiation, division, and loss) and lineage relationships of clonally expanding NK cell subsets during an acute immune response.

      Strengths:

      A rich dataset and thorough analysis of a particular class of stochastic models.

      Weaknesses:

      The stochastic models used are quite simple; each population is considered homogeneous with first-order rates of division, death, and differentiation. In Markov process models such as these, there is no dependence of cellular behavior on its history of divisions. In recent years models of clonal expansion and diversification, in the settings of T and B cells, have progressed beyond this picture. So I was a little surprised that there was no mention of the literature exploring the role of replicative history in differentiation (e.g. Bresser Nat Imm 2022), nor of the notion of family 'division destinies' (either in division number or the time spent proliferating, as described by the Cyton and Cyton2 models developed by Hodgkin and collaborators; e.g. Heinzel Nat Imm 2017). The emerging view is that variability in clone (family) size may arise predominantly from the signals delivered at activation, which dictate each precursor's subsequent degree of expansion, rather than from the fluctuations deriving from division and death modeled as Poisson processes.

      As you pointed out, the Gerlach and Buchholz Science papers showed evidence for highly skewed distributions of family sizes and correlations between family size and phenotypic composition. Is it possible that your observed correlations could arise if the propensity for immature CD27+ cells to differentiate into mature CD27- cells increases with division number? The relative frequency of the two populations would then also be impacted by differences in the division rates of each subset - one would need to explore this. But depending on the dependence of the differentiation rate on division number, there may be parameter regimes (and time points) at which the more differentiated cells can predominate within large clones even if they divide more slowly than their immature precursors. One might not then be able to rule out the two-state model. I would like to see a discussion or rebuttal of these issues.

      We thank the reviewer for the insightful comment. We are currently in the process of developing alternate models based on the above comment and the references (Bresser Nat Imm 2022 and Heinzel Nat Imm 2017). We plan to include the results from the analysis in the revised version.

      Reviewer #2 (Public review):

      Summary:

      Wethington et al. investigated the mechanistic principles underlying antigen-specific proliferation and memory formation in mouse natural killer (NK) cells following exposure to mouse cytomegalovirus (MCMV), a phenomenon predominantly associated with CD8+ T cells. Using a rigorous stochastic modeling approach, the authors aimed to develop a quantitative model of NK cell clonal dynamics during MCMV infection.

      Initially, they proposed a two-state linear model to explain the composition of NK cell clones originating from a single immature Ly49+CD27+ NK cell at 8 days post-infection (dpi). Through stochastic simulations and analytical investigations, they demonstrated that a variant of the two-state model incorporating NK cell death could explain the observed negative correlation between NK clone sizes at 8 dpi and the percentage of immature (CD27+) NK cells (Page 8, Figure 1e, Supplementary Text 1). However, this two-state model failed to accurately reproduce the first (mean) and second (variance and covariance) moments of the measured CD27+ and CD27- NK cell populations within clones at 8 dpi (Figure 1g).

      To address this limitation, the authors increased the model's complexity by introducing an intermediate maturation state, resulting in a three-stage model with the transition scheme: CD27+Ly6C- → CD27-Ly6C- → CD27-Ly6C+. This three-stage model quantitatively fits the first and second moments under two key constraints: (i) immature CD27+ NK cells exhibit faster proliferation than CD27- NK cells, and (ii) there is a negative correlation (upper bound: -0.2) between clone size and the fraction of CD27+ cells. The model predicted a high proliferation rate for the intermediate stage and a high death rate for the mature CD27-Ly6C+ cells.

      Using NK cell reporter mice data from Adams et al. (2021), which tracked CD27+/- cell population dynamics following tamoxifen treatment, the authors validated the three-stage model. This dataset allowed discrimination between NK cells originating from the bone marrow and those pre-existing in peripheral blood at the onset of infection. To test the prediction that mature CD27- NK cells have a higher death rate, the authors measured Ly49H+ NK cell viability in the mice spleen at different time points post-MCMV infection. Experimental data confirmed that mature (CD27-) NK cells exhibited lower viability compared to immature (CD27+) NK cells during the expansion phase (days 4-8 post-infection).

      Further mathematical analyses using a variant of the three-stage model supported the hypothesis that the higher death rate of mature CD27- cells contributes to a larger proportion of CD27- cells in the dead cell compartment, as introduced in the new variant model.

      Altogether, the authors proposed a three-stage quantitative model of antigen-specific expansion and maturation of naïve Ly49H+ NK cells in mice. This model delineates a maturation trajectory: (i) CD27+Ly6C- (immature) → (ii) CD27-Ly6C- (mature I) → (iii) CD27-Ly6C+ (mature II). The findings highlight the highly proliferative nature of the mature I (CD27-Ly6C-) phenotype and the increased cell death rate characteristic of the mature II (CD27-Ly6C+) phenotype.

      Strengths:

      By designing models capable of explaining correlations, first and second moments, and employing analytical investigations, stochastic simulations, and model selection, the authors identified the key processes underlying antigen-specific expansion and maturation of NK cells. This model distinguishes the processes of antigen-specific expansion, contraction, and memory formation in NK cells from those observed in CD8+ T cells. Understanding these differences is crucial not only for elucidating the distinct biology of NK cells compared to CD8+ T cells but also for advancing the development of NK cell therapies currently under investigation.

      Weaknesses:

      The conclusions of this paper are largely supported by the available data. However, a comparative analysis of model predictions with more recent works in the field would be desirable. Moreover, certain aspects of the simulations, parameter inference, and modeling require further clarification and expansion, as outlined below:

      (1) Initial Conditions and Grassmann Data: The Grassmann data is used solely as a constraint, while the simulated values of CD27+/CD27- cells could have been directly fitted to the Grassmann data, which assumes a 1:1 ratio of CD27+/CD27- at t = 0. This approach would allow for an alternative initial condition rather than starting from a single CD27+ cell, potentially improving model applicability.

      We thank the reviewer for this comment. We are working on performing the above analysis and plan to include results from the analysis in the revised manuscript.

      (2) Correlation Coefficients in the Three-State Model: Although the parameter scan of the three-state model (Figure 2) demonstrates the potential for achieving negative correlations between colony size and the fraction of CD27+ cells, the authors did not present the calculated correlation coefficients using the estimated parameter values from fitting the three-state model to the data. Including these simulations would provide additional insight into the parameter space that supports negative correlations and further validate the model.

      We will include the above calculation in the revised manuscript.

      (3) Viability Dynamics and Adaptive Response: The authors measured the time evolution of CD27+/- dynamics and viability over 30 days post-infection (Figure 4). It would be valuable to test whether the three-state model can reproduce the adaptive response of CD27- cells to MCMV infection, particularly the observed drop in CD27- viability at 5 dpi (prior to the 8 dpi used in the study) and its subsequent rebound at 8 dpi. Reproducing this aspect of the experiment is critical to determine whether the model can simultaneously explain viability dynamics and moment dynamics. Furthermore, this analysis could enable sensitivity analysis of CD27- viability with respect to various model parameters.

      We will include some discussion of potential mechanisms of cell viability in this experiment.

    1. Author response:

      The following is the authors’ response to the original reviews.

      Public Reviews:

      Reviewer #1 (Public review):

      Summary:

      This study introduces a novel therapeutic strategy for patients with high-risk HER2-positive breast cancer and demonstrates that the incorporation of pyrotinib into adjuvant trastuzumab therapy can improve invasive disease-free survival.

      Strengths:

      The study features robust logic and high-quality data. Data from 141 patients across 23 centers were analyzed, thereby effectively mitigating regional biases and endowing the research findings with high applicability.

      Weaknesses:

      (1) Introduction and Discussion: Update the literature regarding the efficacy of pyrotinib combined with trastuzumab in treating HER2-positive advanced breast cancer.

      Thank you for this helpful suggestion. The literature regarding the efficacy of pyrotinib combined with trastuzumab in treating HER2-positive advanced breast cancer referenced in our manuscript was the PHILA study, but we mistakenly cited its corrections (reference 14). We revised this reference as suggested.

      Changes in the text: Page 6, line 347-353.

      (2) Did all the data have a normal distribution? Expand the description of statistical analysis.

      As the sample size increases, the sampling distribution of the mean follows a normal distribution even when the underlying distribution of the original variable is non-normal, allowing the use of a normal distribution to calculate their confidence interval. We believe it is unnecessary to specifically describe whether the data followed a normal distribution in this study. Therefore, we did not revise the statistical section.

      (3) The novelty and innovative potential of your manuscript compared to the published literature should be described in more detail in the abstract and discussion section.

      Thank you for your suggestion. The word count for abstracts recommended by eLife is around 250 words. Therefore, we did not compare the present study with published literature in detail in the abstract, as this might exceed the recommended word limit. We revised the discussion section to provide a more detailed comparison between published literature and our study, and to analyze the novelty of our findings accordingly.

      Changes in the text: Page 11, line 177-180.

      (4) Figure legend should provide a bit more detail about what readers should focus on.

      Thank you for this suggestion. We did not revise the figure legend of Figure 1, as it provides a common description. For the figure legend of Figure 2, we added the method used to estimate the invasive disease-free survival curve. For the figure legend of Figure 3, we added more details regarding methods and numbers of patients in different subgroups.

      Changes in the text: Page 7, line 463-472.

      (5) P-values should be clarified for the analysis.

      Thank you for this comment. All subgroup analyses were post-hoc and lacked predefined hypotheses. Kaplan-Meier curves were used to present the subgroup results with the aim of performing descriptive statistics rather than inferential statistics. Therefore, we did not calculate their p-values.

      (6) The order (A, B, and C) in Figure 3 should be labeled in the upper left corner of the Figure.

      Thanks for this comment. We revised Figure 3 accordingly.

      Changes in the text: Figure 3.

      Reviewer #2 (Public review):

      In this manuscript, Cao et al. evaluated the efficacy and safety of 12 months pyrotinib after trastuzumab-based adjuvant therapy in patients with high-risk, HER2-positive early or locally advanced breast cancer. Notably, the 2-year iDFS rate reached 94.59% (95% CI: 88.97-97.38) in all patients, and 94.90% (95% CI: 86.97-98.06) in patients who completed 1-year treatment of pyrotinib. This is an interesting and uplifting results, given that in ExteNET study, the 2-year iDFS rate was 93.9% (95% CI 92·4-95·2) in the 1-year neratinib group, and the 5-year iDFS survival was 90.2%, and 1-year treatment of neratinib in ExteNET study did not translate into OS benefit after 8-year follow-up. In this case, readers will be eagerly anticipating the long-term follow-up results of the current PERSIST study, as well as the results of the phase III clinical trial (NCT03980054).

      I have the following comments:

      (1) The introduction of the differences between pyrotinib and neratinib in terms of mechanism, efficacy, resistance, etc. is supposed to be included in the text so that authors could better highlight the clinical significance of the current trial.

      Thanks for this comment.

      In terms of mechanism, pyrotinib and neratinib are both irreversible pan-HER tyrosine kinase inhibitors that target HER1, HER2 and HER4 by covalently binding to ATP binding sites. Overall, the similarities between them far outweigh the differences. This is the reason why we referenced the ExteNET study, which used neratinib as extended adjuvant therapy, for the sample size calculation.

      Regarding efficacy, currently, no head-to-head studies comparing efficacy of pyrotinib and neratinib have been reported, and the comparison of the efficacy between them using historical data from different studies have inevitable bias due to differences in treatment regimens, study populations, assessment criteria, etc.

      Regarding resistance, only a few studies with small sample size and case reports have investigated their mechanisms of resistance, and the underlying mechanisms have not been fully understood.

      Collectively, we believe that the similarities in the mechanisms of these two drugs far outweigh their differences, and their efficacy and resistance cannot be reasonably compared. Moreover, the sample size calculation was conducted based on the premise that the two drugs are similar. After careful consideration, we believe that overanalyzing the differences between neratinib and pyrotinib would shift the focus of this manuscript. Therefore, we did not discuss their differences in the article.

      (2) Please make sure that a total of 141 patients were enrolled in the study, 38 patients had a treatment duration of less than or equal to 6 months, and a total of 92 and 31 patients completed 1-year and 6-month treatment of extended adjuvant pyrotinib, respectively, which means 7 patients had a treatment duration of fewer than 6 months.

      Thank you for raising this relevant question. There were 141 patients enrolled in the study and received study treatment, and a total of 92 and 31 patients completed 1-year and 6-month treatment of extended adjuvant pyrotinib. Of the remaining 18 patients, 16 patients had a treatment duration of fewer than 6 months, and 2 patients had a treatment duration longer than 6 months but less than 1 year.

      (3) The previous surgery history should be provided, and how many patients received lumpectomy, and mastectomy.

      Thank you for your suggestion. All patients in the present study underwent breast cancer surgery. Unfortunately, we did not collect data on the specific types of surgeries performed.

      Recommendations for the authors:

      Reviewing Editor:

      I have carefully reviewed the content and findings of your study, and while I recognize the potential impact of your research, there are several critical aspects that need to be addressed to fully appreciate the contribution of your work.

      Significance of Findings:

      Your study provides valuable insights into the efficacy and safety of pyrotinib as an extended adjuvant therapy following trastuzumab-based treatment in patients with high-risk HER2-positive breast cancer. The 2-year invasive disease-free survival (iDFS) rate of 94.59% is notably high and suggests that pyrotinib could be a promising option for patients who have completed trastuzumab therapy. This is particularly significant given the unmet need for effective therapies that can extend disease-free survival in this patient population.

      Strength of Evidence:

      The strength of the evidence presented is supported by the multicenter phase II trial design, which included a substantial number of patients across 23 centers in China. The rigorous methodology, including the use of the Kaplan-Meier method for estimating iDFS and the application of the Brookmeyer-Crowley method for confidence intervals, adds to the credibility of your findings. However, the single-arm study design without a control group limits the ability to draw definitive conclusions about the comparative effectiveness of pyrotinib.

      In conclusion, your study presents intriguing findings that contribute to the field of breast cancer therapy. However, the current evidence, while suggestive of pyrotinib's potential, requires further validation in controlled trials to confirm its efficacy and optimal use in clinical practice. I encourage you to address the issues raised and consider resubmitting a revised version of your work.

      Thank you for your comments. We acknowledge the limitation of our single-arm study design without a control group and agree that it restricts definitive conclusions about the comparative effectiveness of pyrotinib. This limitation was noted in our manuscript. Furthermore, we have revised our manuscript in response to the issues raised by the reviewers.

    1. Author response:

      The following is the authors’ response to the previous reviews.

      Public Reviews:

      Reviewer #1 (Public review):

      Summary:

      The authors aim to assess the effect of salt stress on root:shoot ratio, identify the underlying genetic mechanisms, and evaluate their contribution to salt tolerance. To this end, the authors systematically quantified natural variations in salt-induced changes in root:shoot ratio. This innovative approach considers the coordination of root and shoot growth rather than exploring biomass and the development of each organ separately. Using this approach, the authors identified a gene cluster encoding eight paralog genes with a domain-of-unknown-function 247 (DUF247), with the majority of SNPs clustering into SR3G (At3g50160). In the manuscript, the authors utilized an integrative approach that includes genomic, genetic, evolutionary, histological, and physiological assays to functionally assess the contribution of their genes of interest to salt tolerance and root development.

      Comments on revisions:

      As the authors correctly noted, variations across samples, genotypes, or experiments make achieving statistical significance challenging. Should the authors choose to emphasize trends across experiments to draw biological conclusions, careful revisions of the text, including titles and figure legends, will be necessary to address some of the inconsistencies between figures (see examples below). However, I would caution that this approach may dilute the overall impact of the work on SR3G function and regulation. Therefore, I strongly recommend pursuing additional experimental evidence wherever possible to strengthen the conclusions.

      (1) Given the phenotypic differences shown in Figures S17A-B, 10A-C, and 6A, the statement that "SR3G does not play a role in plant development under non-stress conditions" (lines 680-681) requires revision to better reflect the observed data.

      Thank you to the reviewer for the comment. We appreciate the acknowledgment that variations among experiments are inherent to biological studies. Figures 6A and S17 represent the same experiment, which initially indicated a phenotype for the sr3g mutant under salt stress. To ensure that growth changes were specifically normalized for stress conditions, we calculated the Stress Tolerance Index (Fig. 6B). In Figure 10, we repeated the experiment including all five genotypes, which supported our original observation that the sr3g mutant exhibited a trend toward reduced lateral root number under 75 mM NaCl compared to Col-0, although this difference was not significant (Fig. 10B). Additionally, we confirmed that the wrky75 mutant showed a significant reduction in main root growth under salt stress compared to Col-0, consistent with findings reported in The Plant Cell by Lu et al. 2023. For both main root length and lateral root number, we demonstrated that the double mutants of wrky75/sr3g displayed growth comparable to wild-type Col-0. This result suggests that the sr3g mutation compensates for the salt sensitivity of the wrky75 mutant.

      We completely agree with the reviewer that there is a variation in our results regarding the sr3g phenotype under control conditions, as presented in Fig. 6A/Fig. S17 and Fig. 10A-C. In Fig. 6A/Fig. S17, we did not observe any consistent trends in main root or lateral root length for the sr3g mutant compared to Col-0 under control conditions. However, in Fig. 10A-C, we observed a significant reduction in main root length, lateral root number, and lateral root length for the sr3g mutant under control conditions. We believe this may align with SR3G’s role as a negative regulator of salt stress responses. While loss of this gene benefits plants in coping with salt stress, it might negatively impact overall plant growth under non-stress conditions. This interpretation is further supported by our findings on the root suberization pattern in sr3g mutants under control conditions (Fig. 8B), where increased suberization in root sections 1 to 3, compared to Col-0, could inhibit root growth. While SR3G's role in overall plant fitness is intriguing, it is beyond the scope of this study. We cannot rule out the possibility that SR3G contributes positively to plant growth, particularly root growth. That said, we observed no differences in shoot growth between Col-0 and the sr3g mutant under control conditions (Fig. 7). Additionally, we calculated the Stress Tolerance Index for all aspects of root growth shown in Fig. 10 and presented it in Fig. S25.

      To address the reviewer request on rephrasing the lines 680-681 from"SR3G does not play a role in plant development under non-stress conditions" (lines 680-681) statement, this statement is found in lines 652-653 and corresponds to Fig. 7, where we evaluated rosette growth in the WT and sr3g mutant under both control and salt stress conditions. We did not observe any significant differences or even trends between the two genotypes under control conditions, confirming the accuracy of the statement. To clarify further, we have added “SR3G does not play a role in rosette growth and development under non-stress conditions”.

      (2) I agree with the authors that detecting expression differences in lowly expressed genes can be challenging. However, as demonstrated in the reference provided (Lu et al., 2023), a significant reduction in WRKY75 expression is observed in T-DNA insertion mutant alleles of WRKY75. In contrast, Fig. 9B in the current manuscript shows no reduction in WRKY75 expression in the two mutant alleles selected by the authors, which suggests that these alleles cannot be classified as loss-of-function mutants (line 745). Additionally, the authors note that the wrky75 mutant exhibits reduced main root length under salt stress, consistent with the phenotype reported by Lu et al. (2023). However, other phenotypic discrepancies exist between the two studies. For example, 1) Lu et al. (2023) report that w¬rky75 root length is comparable to WT under control conditions, whereas the current manuscript shows that wrky75 root growth is significantly lower than WT; 2) under salt stress, Lu et al. (2023) show that wrky75 accumulates higher levels of Na+, whereas the current study finds Na+ levels in wrky75 indistinguishable from WT. To confirm the loss of WRKY75 function in these T-DNA insertion alleles the authors should provide additional evidence (e.g., Western blot analysis).

      We sincerely appreciate the reviewer acknowledging the challenge of detecting expression differences in lowly expressed genes, such as transcription factors. Transcription factors are typically expressed at lower levels compared to structural or enzymatic proteins, as they function as regulators where small quantities can have substantial effects on downstream gene expression.

      That said, we respectfully disagree with the reviewer’s interpretation that there is no reduction in WRKY75 expression in the two mutant lines tested in Fig. 9C. Among the two independent alleles examined, wrky75-3 showed a clear reduction in expression compared to WT Col-0 under both control and salt stress conditions. Using the Tukey test to compare all groups, we observed distinct changes in the assigned significance letters for each case:

      Col/root/control (cd) vs wrky75-3/root/control (cd): Although the same significance letter was assigned, we still observed a clear reduction in WRKY75 transcript abundance. More importantly, the variation in expression is notably lower compared to Col-0.

      Col/shoot/control (bcd) vs wrky75-3/shoot/control (a): This is significant reduction compared to Col

      Col/root/salt (cd) vs wrky75-3/root/salt (bcd): Once again, the reduction in WRKY75 transcript levels corresponds to changes in the assigned significance letters.

      Col/shoot/salt (bc) vs wrky75-3/shoot/salt (ab): Once again, the reduction in WRKY75 transcript levels corresponds to changes in the assigned significance letters.

      To address the reviewer’s comment regarding the significant reduction in WRKY75 expression observed in T-DNA insertion mutant alleles of WRKY75 in the reference by Lu et al., 2023, we would like to draw the reviewer’s attention to the following points:

      a) Different alleles: The authors in The Plant Cell used different alleles than those used in our study, with one of their alleles targeting regions upstream of the WRKY75 gene. While we identified one of their described alleles (WRKY75-1, SALK_101367) on the T-DNA express website, which targets upstream of WRKY75, the other allele (wrky75-25) appears to have been generated through a different mechanism (possibly an RNAi line) that is not defined in the Plant Cell paper and does not appear on the T-DNA express website. The authors mentioned they have received these seeds as gifts from other labs in the acknowledgement ”We thank Prof. Hongwei Guo (Southern University of Science and Technology, China) and Prof. Diqiu Yu (Yunnan University, China) for kindly providing the WRKY75<sub>pro</sub>:GUS, 35S<sub>pro</sub>:WRKY75-GFP, wrky75-1, and wrky75-25 seeds. We thank Man-cang Zhang (Electrophysiology platform, Henan University) for performing the NMT experiment”.

      However, in our study, we selected two different T-DNAs that target the coding regions. While this may explain slight differences in the observed responses, both studies independently link WRKY75 to salt stress, regardless of the alleles used. For your reference, we have included a screenshot of the different alleles used.

      Author response image 1.

      b) Different developmental stages: They measured WRKY75 expression in 5-day-old seedlings. In our experiment, we used seedlings grown on 1/2x MS for 4 days, followed by transfer to treatment plates with or without 75 mM NaCl for one week. As a result, we analyzed older plants (12 days old) for gene expression analysis. Despite the difference in developmental stage, we were still able to observe a reduction in gene expression.

      c) Different tissues: The authors of The Plant Cell used whole seedlings for gene expression analysis, whereas we separated the roots and shoots and measured gene expression in each tissue type individually. This approach is logical, as WRKY75 is a root cell-specific transcription factor with higher expression in the roots compared to the shoots, as demonstrated in our analysis (Fig. 9C).

      Based on the reasoning above, we did work with loss-of-function mutants of WRKY75, particularly wrky75-3. To more accurately reflect the nature of the mutation, we have changed the term "loss-of-function" to "knock-down" in line 717.

      The reviewer mentioned phenotypic discrepancies between the two studies. We agree that there are some differences, particularly in the magnitude of responses or expression levels. However, despite variations in the alleles used, developmental stages, and tissue types, both studies reached the same conclusion: WRKY75 is involved in the salt stress response and acts as a positive regulator. We have discussed the differences between our study and The Plant Cell in the section above, summarizing them into three main points: different alleles, different developmental stages, and different tissue types.

      To address the reviewer’s comment regarding "Lu et al. (2023) report that wrky75 root length is comparable to WT under control conditions, whereas the current manuscript shows that wrky75 root growth is significantly lower than WT": We evaluated root growth differently than The Plant Cell study. In The Plant Cell (Fig. 5, H-J), root elongation was measured in 10-day-old plants with a single time point measurement. They transferred five-day-old wild-type, wrky75-1, wrky75-25, and WRKY75-OE plants to 1/2× MS medium supplemented with 0 mM or 125 mM NaCl for further growth and photographed them 5 days after transfer. In contrast, our study used 4-day-old seedlings, which were transferred to 1/2 MS with or without 0, 75, or 125 mM salt for additional growth (9 days). Rather than measuring root growth only at the end, we scanned the roots every other day, up to five times, to assess root growth rates. Essentially, the precision of our method is higher as we captured growth changes throughout the developmental process, compared to the approach used in The Plant Cell. We do not underestimate the significance of the work conducted by other colleagues in the field, but we also recognize that each laboratory has its own approach and specific practices. This variation in experimental setup is intrinsic to biology, and we believe it is important to study biological phenomena in different ways. Especially as the common or contrasting conclusions reached by different studies, performed by different labs and using different experimental setups are shedding more light on reproducibility and gene contribution across different conditions, which is intrinsic to phenotypic plasticity, and GxE interactions.

      The Plant Cell used a very high salt concentration, starting at 125 mM, while we were more cautious in our approach, as such a high concentration can inhibit and obscure more subtle phenotypic changes.

      To address the reviewer’s comment on "Lu et al. (2023) show that wrky75 accumulates higher levels of Na+, whereas the current study finds Na+ levels in wrky75 indistinguishable from WT," we would like to highlight the differences in the methodologies used in both studies. The Plant Cell measured Na+ accumulation in the wrky75 mutant using xylem sap (Supplemental Figure S10), which appears to be a convenient and practical approach in their laboratory. In their experiment, wild-type and wrky75 mutant plants were grown in soil for 3 weeks, watered with either a mock solution or 100 mM NaCl solution for 1 day, and then xylem sap was collected for Na+ content analysis. In contrast, our study employed a different method to measure Na+ and K+ ion content, using Inductively Coupled Plasma Atomic Emission Spectroscopy (ICP-AES) for root and shoot Na+ and K+ measurements. Additionally, we collected samples after two weeks on treatment plates and focused on the Na+/K+ ratio, which we consider more relevant than net Na+ or K+ levels, as the ratio of these ions is a critical determinant of plant salt tolerance. With this in mind, we observed a considerable non-significant increase in the Na+/K+ ratio in the shoots of the wrky75-3 mutant (assigned Tukey’s letter c) compared to the Col-0 WT (assigned Tukey’s letters abc) under 125 mM salt, suggesting that this mutant is salt-sensitive. Importantly, the Na+/K+ ratio in the double wrky75/sr3g mutants was reduced to the WT level under the same salt conditions, further indicating that the salt sensitivity of wrky75 is mitigated by the sr3g mutation.

      Based on the reasons mentioned above, we believe that conducting additional experiments, such as Western blot analysis, is unnecessary and would not contribute new insights or alter the context of our findings.

      Reviewer #2 (Public review):

      Summary:

      Salt stress is a significant and growing concern for agriculture in some parts of the world. While the effects of sodium excess have been studied in Arabidopsis and (many) crop species, most studies have focused on Na uptake, toxicity and overall effects on yield, rather than on developmental responses to excess Na, per se. The work by Ishka and colleagues aims to fill this gap.

      Working from an existing dataset that exposed a diverse panel of A. thaliana accessions to control, moderate, and severe salt stress, the authors identify candidate loci associated with altering the root:shoot ratio under salt stress. Following a series of molecular assays, they characterize a DUF247 protein which they dub SR3G, which appears to be a negative regulator of root growth under salt stress.

      Overall, this is a well-executed study which demonstrates the functional role played by a single gene in plant response to salt stress in Arabidopsis.

      Review of revised manuscript:

      The authors have addressed my point-by-point comments to my satisfaction. In the cases where they have changed their manuscript language, clarified figures, or added analyses I have no further comment. In some cases, there is a fruitful back-and-forth discussion of methodology which I think will be of interest to readers.

      I have nothing to add during this round of review. I think that the paper and associated discussion will make a nice contribution to the field.

      We sincerely appreciate the reviewer’s recognition of the significance of our work to the field.

      Recommendations for the authors:

      Reviewer #1 (Recommendations for the authors):

      Lines 518-519: The statement that other DUF247s exhibit similar expression patterns to SR3G, suggesting their responsiveness to salt stress, is not fully supported by Fig. S14. Please clarify the specific similarities (and differences) in the expression patterns of the DUF247s shown in Fig. S14, as their expression appears to be spatially and temporally diverse. Additionally, the scale is missing in Fig. S14.

      We thank the reviewer. We fixed the text and added expression scales to Figure S14.

      Line 684, Fig. 6A should be 7A.

      Thanks. It is fixed.

      Line 686, Fig. 7A should be 7B.

      Thanks. It is fixed.

      Lines 721-723: The signal quantification in Fig. 8B does not support the claim that "in section one,..., sr3g-5 showed more suberization compared to Col-0." Given the variability and noise often associated with histological dyes such as Fluorol Yellow staining, conclusions should be cautiously grounded in robust signal quantification. Additionally, please specify the number of biological replicates used in both Fig. 8B and C.

      We thank the reviewer for their comments. We believe the statement in the text accurately reflects our results presented in Figure 8B, where we stated “non-significant, but substantially higher levels of root suberization in sr3g-5 compared to Col-0 in sections one to three of the root under control condition (Fig. 8B).” Therefore, we kept the statement and have included the number of biological replicates in the figure legend.

      Lines 731-732: Please provide a more detailed explanation of how the significant changes in suberin monomer levels align with the Fluorol Yellow staining results, and clarify how these findings support the proposed negative role of SR3G in root suberization.

      Fluorol Yellow is a lipophilic dye widely used to label suberin in plant tissues, specifically in roots in this study. Given the inherent variability in histological assays, we confirmed the increase in suberization using an alternative method, Gas Chromatography–Mass Spectrometry (GC-MS). Both approaches revealed elevated suberin levels in the sr3g mutant compared to Col-0. Since the overall suberin content was higher in the mutant under both control and salt stress conditions, we proposed that SR3G acts as a negative regulator of root suberization.

      Lines 686-688 and Figure S24: The authors calculated water mass as FW-DW. A more standard approach for calculating water content is (FW-DW)/FW x 100. Please update the text or adjust the calculation accordingly. Additionally, if the goal is to test differences between WT and the mutant within each condition, a t-test would be a more appropriate statistical method.

      We thank the reviewer. We added water content % to the figure S24. We kept the statistical test as it is as we wanted to be able to observe changes across conditions and genotypes.

      Lines 633-635 states that "No significant difference was observed between sr3g-4 and Col-0 (Fig. S18), except for the Stress Tolerance Index (STI) calculated using growth rates of lateral root length and number." However, based on the Figure S18 legend and statistical analysis (i.e., ns), it appears that the sr3g-4 mutant shows no alterations in root system architecture compared to Col-0. Please revise the text to accurately reflect the results of the statistical analysis.

      We thank the reviewer. We now fixed the text to reflect the result.

      Lines 698-707: The statistical analysis does not support the reported differences in the Na+/K+ ratio for the single and double mutants of sr3g-5 and wrky75-3 (Fig. 10D, where levels connected by the same letters indicate they are not significantly different). Furthermore, the conclusion that "the SR3G mutation indeed compensated for the increased Na+ accumulation observed in the wrky75 mutant under salt stress" is also based on non-significant differences (Fig. S25B). Please revise the text to accurately reflect the results of the statistical analysis. Additionally, since each mutant is compared to the WT, I recommend using Dunnett's test for statistical analysis.

      We thank the reviewer for their feedback. We have carefully revised the text to better support our findings. As previously mentioned, variations among samples are evident and are well-reflected across all our datasets. We have presented all data and focused on identifying trends within our samples to guide interpretation.

      We observed that the SR3G mutation effectively compensated for the increased Na+ accumulation observed in the wrky75 mutant under salt stress. A closer examination of the shoot Na+/K+ ratio under 125 mM salt shows that the wrky75 single mutant has a higher Na+/K+ ratio (indicated by the letter "c") compared to Col-0 (indicated by "abc") and the two double mutants (also indicated by "abc"). Therefore, we have retained the statistical analysis as originally conducted, and maintain our conclusions as is.

      Figure 6: data in panel C present the Na/K ratio, not Na+ content. Based on the statistical analysis of root Na+ levels presented in Fig. S17C, there is no significant difference between sr3g-5 and WT. Please update the title of Fig. 6. In addition, in panel A, the title of the Y-axis and figure legend should be "Lateral root growth rate" without the word length, and in panel C, the statistical analysis is missing.

      We thank the reviewer. We updated Fig. 6 title and fixed the Y-axis in panel A, and added statistical letters to panel C. Legend was updated to reflect the changes.

      Figure 7: Please clearly label the time points where significant differences between genotypes are observed for both early and late salt treatments. Was there a significant difference recorded between WT and sr3g-5 on day 0 under early salt stress? Such differences may arise from initial variations in plant size within this experiment, as indicated by Fig. 7B, where significant differences in rosette area are evident starting from day 0. Additionally, please indicate the statistical analysis in panel E.

      We thank the reviewer for this suggestion. We updated the figure with a statistical test added to the panel E. Although the difference between sr3g mutant and Col-0 is indeed significant in its growth rate at day 0, we would like to draw the attention of the reviewer that this growth rate was calculated over the 24 hours after adding salt stress. Therefore, this difference in growth rate is related to exposure to salt stress. Moreover, the growth rate between Col-0 and sr3g mutant does not differ in two other treatments (Control and Late Salt Stress) further supporting the conclusion that sr3g is affecting rosette size and growth rate only under early salt stress conditions.

      We have also added the Salt Tolerance Index calculation to Figure S24 as additional evidence, controlling for potential differences in size between Col-0 and sr3g mutant.

      Figure S17: statistical analysis is not indicated in panels A, B, and D.

      We thank the reviewer for spotting that. We updated the figure with a statistical test.

      Figures S21-23: The quality of these figures is insufficient, hindering the ability to effectively interpret the authors' results and main message. Furthermore, a Dunnett's test, rather than a t-test, is the appropriate statistical method for this analysis.

      We thank the reviewer for this observation. We have now added a high resolution figures for all supplemental figures, which should increase the resolution of the figures. As we are comparing all of the genotypes to Col-0 one-by-one - the results of individual t-tests are sufficient for this analysis.

    1. Author response:

      The following is the authors’ response to the original reviews.

      Reviewer #1 (Public review):

      (1) The mechanism by which STAMBPL1 mediates GRHL3 transcription through its interaction with FOXO1 is not sufficiently discussed, especially in relation to how STAMBPL1 regulates FOXO1. Some reported effects are modest.

      We appreciate the reviewer’s comments. In response, we have added a discussion on the potential mechanisms by which STAMPBL1 regulates FOXO1 transcriptional activity in Discussion, highlighted in red on page 18, lines 342 to 352. The specific reply content is as follows: “The transcriptional activity of FOXO1 is primarily regulated by its nucleocytoplasmic shuttling process (Van Der Heide, Hoekman et al. 2004). The PI3K/AKT pathway promotes the phosphorylation of FOXO1, resulting in the formation of a complex with members of the 14-3-3 family (including 14-3-3σ, 14-3-3ε, and 14-3-3ζ), which facilitates its export from the nucleus and inhibits its transcriptional activity (Huang and Tindall 2007, Tzivion, Dobson et al. 2011). It’s reported that TDAG51 prevents the binding of 14-3-3ζ to FOXO1 in the nucleus by interacting with FOXO1, thereby enhancing its transcriptional activity through increased accumulation within the nucleus (Park, Jeon et al. 2023). Our results indicate that the overexpression of STAMBPL1 and STAMBPL1-E292A did not affect the protein levels of FOXO1 (Fig.7E and Fig.S5E), but STAMBPL1 co-localizes with FOXO1 in the nucleus (Fig.7M) and interacts with it (Fig.7N and Fig.S5I-J). This suggests that STAMBPL1 enhances the transcriptional activity of FOXO1 on GRHL3 by interacting with nuclear FOXO1.” The result was added to Supplementary Figure 5 as Fig.S5E.

      Reviewer #2 (Public review):

      (1) A potential limitation of the study is the reliance on specific cellular and animal models, which may constrain the extrapolation of these findings to the broader spectrum of human TNBC biology. Furthermore, while the study provides evidence for a novel regulatory axis involving STAMBPL1, FOXO1, and GRHL3, the multifaceted nature of angiogenesis may implicate additional regulatory factors not exhaustively addressed in this research.

      We appreciate the valuable suggestions provided by the reviewer. In Discussion, we have added an in-depth discussion of the limitations of the study, as well as an analysis of the regulatory factors related to tumor angiogenesis, which highlighted in red on pages 20 to 21, lines 396 to 412. The relevant content added is as follows: “In this study, we utilized two triple-negative breast cancer cell lines, HCC1806 and HCC1937, along with human primary umbilical vein endothelial cells (HUVECs) and a nude mouse breast orthotopic transplantation tumor model to investigate the regulatory mechanism by which STAMBPL1 activates the GRHL3/HIF1α/VEGFA signaling pathway through its interaction with FOXO1, thereby promoting angiogenesis in TNBC. The results of this study have certain limitations regarding their applicability to human TNBC biology. Furthermore, in addition to the HIF1α/VEGFA signaling pathway emphasized in this study, tumor cells can continuously release or upregulate various pro-angiogenic factors, such as Angiopoietin and FGF, which activate endothelial cells, pericytes (PCs), cancer-associated fibroblasts (CAFs), endothelial progenitor cells (EPCs), and immune cells (ICs). This leads to capillary dilation, basement membrane disruption, extracellular matrix remodeling, pericyte detachment, and endothelial cell differentiation, thereby sustaining a highly active state of angiogenesis (Liu, Chen et al. 2023). It is important to collect clinical TNBC tissue samples in the future to analyze the expression of the STAMBPL1/FOXO1/GRHL3/HIF1α/VEGFA signaling axis. Furthermore, patient-derived organoid and xenograft models are useful to elucidate the regulatory relationship of this axis in TNBC angiogenesis”

      Reviewer #3 (Public review):

      The main weaknesses of this work are that the relevance of this molecular axis to the pathogenesis of TNBC is not clear, and it is not clearly established whether this is a regulatory pathway that occurs in hypoxic conditions or independently of oxygen levels.

      (1) With respect to the first point, both FOXO1 and GRHL3 have been previously described as tumor suppressors, with reports of FOXO1 inhibiting tumor angiogenesis. Therefore, this works describes an apparently contradictory function of these proteins in TNBC. While it is not surprising that the same genes perform divergent functions in different tumor contexts, a stronger evidence in support of the oncogenic function of these two genes should be provided to make the data more convincing. As an example, the data in support of high STAMBPL1, FOXO and GRHL3 gene expression in TNBC TCGA specimens provided in Figure 8 is not very strong and it is not clear what the non-TNBC specimens are (whether other breast cancers or other tumors, perhaps those tumors whether these genes perform tumor suppressive functions). To strengthen the notion that STAMBPL1, FOXO and GRHL3 are overexpressed in TNCB, the authors could provide a comparison with normal tissue, as well as the analysis of other publicly available datasets (like the NCI Clinical Proteomic Tumor Analysis Consortium as an example). Finally, is it not clear what are the basal protein expression levels of STAMBPL1 in the cell lines used in this study, as based on the data presented in Figures 2D and F it appears that the protein is not expressed if not exogenously overexpressed. It would be helpful if the authors addressed this issue and provided further evidence of STAMBPL1 expression in TNBC cell lines.

      We appreciate the suggestions. In this study, we utilized the BCIP online tool to analyze the Metabric database, incorporating adjacent normal tissues as controls. Although the expression levels of STAMBPL1, FOXO1, and GRHL3 in breast cancer tissues are not uniformly higher than those in adjacent tissues, their expression levels in triple-negative breast cancer (TNBC) are significantly elevated compared to non-TNBC. The results of this re-analysis have been added in Supplementary Figure 6 as Fig.S6A-C.

      About the question of the basal protein expression levels of STAMBPL1 in the cell lines used in this study, our response is that Fig. 2A showed the endogenous level of STAMBPL1 in HCC1806 and HCC1937. For Fig. 2D and 2F, the overexpressed STAMBPL1 was fused with a 3xFlag tag, resulting in a higher molecular weight compared to the endogenous STAMBPL1. In the revised Figure 2, we have indicated the positions of the endogenous (Endo.) and exogenous (OE.) STAMBPL1 bands with arrows.

      (2) Linked to these considerations is the second major criticism, namely that it is not made clear if this new regulatory axis is proposed to act in normoxic or hypoxic conditions. The experiments presented in this paper are performed in both conditions but a clear explanation as to why cells are exposed to hypoxia is not given and would be necessary being that HIF-1a transcription and not protein stability is being analyzed. Also, different hypoxic conditions are sometimes used, resulting in different mRNA levels of HIF-1a and its downstream targets and quite significant fluctuations within the same cell line from one experimental setting to the next. The authors should provide an explanation as to why experimental conditions are changed and, more importantly, the experiments presented in Figure 2 should be performed also in normoxia.

      Thanks for the comments. Under normoxic conditions, HIF1α is recognized by pVHL due to hydroxylation and is rapidly degraded via the proteasomal pathway. In contrast, under hypoxic conditions, HIF1α protein is accumulated. To investigate the effect of STAMBPL1 knockdown on HIF1A gene transcription levels, we conducted experiments under hypoxic conditions to avoid interference from the rapid degradation of HIF1α at the protein level, as shown in Figures 2B-C. Furthermore, under normoxic conditions, the overexpression of STAMBPL1 had been demonstrated to significantly enhance the protein levels of HIF1α and upregulate the transcription of VEGFA through HIF1α. To avoid the potential impact of excessive accumulation of HIF1α protein under hypoxic conditions on its protein level detection and the transcription of downstream VEGFA, the related experiments shown in Figure 2D-G were performed under normoxic conditions. We have explained the corresponding experimental conditions in the “Result” and “Figure legends” according to the reviewer's comments, highlighted in red.

      (3) Another critical point is that necessary experimental controls are sometimes missing, and this is reducing the strength of some of the conclusions enunciated by the authors. As examples, experiments where overexpression of STAMBPL1 is coupled to silencing of FOXO1 to demonstrate dependency lack FOXO1 silencing the absence of STAMBPL1 overexpression. Because diminishing FOXO1 expression affects HIF-1a/VEGF transcription even in the absence of STAMBPL1 (shown in Figure 7C, D), it is not clear if the data presented in Figure 7G are significant. The difference between HIF-1a expression upon FOXO1 silencing should be compared in the presence or absence of STAMBPL1 overexpression to understand if FOXO1 impacts HIF-1a transcription dependently or independently of STAMBPL1.

      Thank you for this comment. For Fig.7G-H, our experimental objective was to determine whether the activation of HIF1A/VEGFA transcription by STAMBPL1 via FOXO1. Therefore, under STAMBPL1 overexpression, we knocked down FOXO1 to investigate whether FOXO1 silencing could reverse the upregulation of HIF1A/VEGFA transcription induced by STAMBPL1 overexpression.

      (4) In addition, some minor comments to improve the quality of this manuscript are provided.

      (4.1) As a general statement, the manuscript is extremely synthetic. While this is not necessarily a negative feature, sometimes results are discussed in the figure legends and not in the main text (as an example, western blots showing HIF-1a expression) and this makes it hard to read thought the data in an easy and enjoyable manner.

      Thank you for this suggestion. We have revised the figure legends to make them clearer and more concise, highlighted in red.

      (4.2) The effect of STAMBPL1 overexpression on HIF-1a transcription is minor (Figure 2) The authors should explain why they think this is the case and whether hypoxia may provide a molecular environment that is more permissive to this type of regulation.

      Thank you for the comment. Under normoxic conditions, we conducted WB to examine the protein expression of HIF1α after the overexpression of STAMBPL1 and the knockdown of HIF1α. To visually illustrate the impact of STAMBPL1 overexpression on HIF1A protein levels, as well as the effectiveness of HIF1α knockdown, we annotated the grayscale analysis results of the bands in Figures 2D and 2F. As the reviewer pointed out, under normoxic conditions, HIF1α is rapidly degraded, which may explain why the upregulation of HIF1α protein levels by STAMBPL1 overexpression is not very pronounced.

      (4.3) HIF-1a does not appear upregulated at the protein level protein by STAMBPL1 or GRLH3 overexpression, even though this is stated in the legends of Figures 2 and 6. The authors should show unsaturated western blots images and provide quantitative data of independent experiments to make this point.

      Thank you for this comment. We have added the unsaturated image of HIF1α into Fig.2D, and performed a grayscale analysis of the HIF1α bands in Fig.2D and Fig.6A to indicate the relative protein level of HIF1α.

      Reviewer #1 (Recommendations for the authors):

      (1) The authors previously reported that STAMBPL1 stabilizes MKP1 in TNBC. However, in this study, they focus on HIF1a. Given that STAMBPL1 affects HIF1a expression, it would be valuable to examine the levels of ROS in TNBC cells with or without STAMBPL1, as ROS is known to influence HIF1a stability.

      Thank you for your comments. It’s known that STAMBPL1 functions as a deubiquitinating enzyme. However, our study reveals that the upregulation of HIF1α by STAMBPL1 is independent of its deubiquitinating activity. This conclusion is supported by the observation that overexpression of the deubiquitinase active site mutant, STAMBPL1-E292A, also upregulated HIF1α expression (Figure 1F). Moreover, STAMBPL1 overexpression enhanced HIF1α transcription (Figures 4E and S3E), while STAMBPL1 knockdown was able to inhibit the transcription of HIF1α (Figures 2B-C). These results indicate that STAMBPL1 mediates the transcription of HIF1α but does not affect the stability of HIF1α. For these reasons, we think that it is unnecessary to examine the ROS levels.

      (2) Figure 1A: The regulation of HIF1a mRNA by STAMBPL1, but not its protein levels, could be better addressed by using MG132 to rule out the impact of protein degradation.

      Thanks for this comment. Under normoxic conditions, the oxygen-sensitive prolyl hydroxylases PHD1-3 act on HIF1α, specifically inducing hydroxylation at the proline 402 and 564 residues. These hydroxylated residues are recognized by the pVHL/E3 ubiquitin ligase complex, leading to ubiquitination and subsequent degradation via the proteasome pathway. Conversely, under hypoxic conditions, PHD1-3 are inactivated, and non-hydroxylated HIF1α is not recognized by the pVHL/E3 ubiquitin ligase complex, thereby avoiding ubiquitination and proteasomal degradation (DOI: 10.1073/pnas.95.14.7987, DOI: 10.1515/BC.2004.016, and DOI: 10.1042/BJ20040620). The mechanism of HIF1α accumulation under hypoxia is analogous to the action of the proteasome inhibitor MG132. When we treated cells with hypoxia, the ubiquitination and proteasomal degradation pathway of HIF1α was blocked. At this time, STAMBPL1 knockdown could downregulate the expression of HIF1α (Fig.1A). Meanwhile, since the knockdown of STAMBPL1 significantly downregulated the mRNA level of HIF1α under hypoxia (Fig.2B-C), we concluded that STAMBPL1 affects the expression of HIF1α by mediating its transcription. In addition, MG132 will block all proteasomal substrate degradation and may affect HIF1α mRNA levels indirectly.

      (3) Figure 2D and 2F: The effect of STAMBPL1 in promoting HIF1a expression is quite mild, and the effect of HIF1a knockdown is also modest. Given the high levels of STAMBPL1 in TNBC cell lines (Figure 2A), it would be better to repeat these experiments in a STAMBPL1-knockdown setting for clearer insights.

      We appreciate this insightful suggestion. Considering that the regulation of HIF1α expression by STAMBPL1 occurs at the transcriptional level, and to prevent excessive accumulation of HIF1a during hypoxia that could confound the effect of STAMBPL1 overexpression on HIF1α regulation, we opted to overexpress STAMBPL1 under normoxic conditions and subsequently knock down HIF1α, as shown in Fig.2D and Fig.2F. This approach allowed us to observe that STAMBPL1 overexpression can upregulate HIF1a expression to some extent. Additionally, in response to the reviewer's suggestion to knock down STAMBPL1, we have conducted the corresponding experiments, with results presented in Fig.1A-E and Fig.2B-C.

      (4) Figure 4A: Why does the RNA-seq pattern differ significantly between the two siRNAs? Additionally, the authors should clarify why they focus primarily on transcription factors, as other mechanisms, such as mRNA stability and RNA modification, could also influence gene transcription.

      Thank you for this comment. Two siRNAs for STAMBPL1 were designed and synthesized by a biotechnology company. Although both siRNAs target STAMBPL1, they target different sequences. While both siRNAs effectively knocked down STAMBPL1 (Fig. 1A and Fig. 2A), the possibility of off-target effects cannot be completely ruled out. Therefore, we needed to use two siRNAs simultaneously for RNA-seq, ensuring that the gene expression changes observed are due to the knockdown of STAMBPL1 by focusing on genes downregulated by both two siRNAs. Additionally, among the 27 genes downregulated by both two siRNAs, only 18 genes were annotated. Of these 18 genes, except for GRHL3, which is a transcription factor reported to be involved in gene transcription regulation, the remaining 17 genes have no documented association with RNA transcription, stability, or modification. Therefore, we focused on the GRHL3 gene.

      (5) Figure 5G: To investigate whether STAMBPL1 and GRHL3 function epistatically in the pathway, a double knockdown of STAMBPL1 and GRHL3 should be examined. Additionally, a double knockdown of STAMBPL1 and FOXO1 should be assessed.

      Thank you for your comment. In Figure 5G, we aimed to assess the knockdown efficiency of GRHL3 using siRNAs. To determine whether STAMBPL1 upregulates the HIF1a/VEGFA axis via GRHL3, we overexpressed STAMBPL1 and subsequently knocked down GRHL3. Our findings indicated that STAMBPL1 overexpression indeed enhanced the HIF1a/VEGFA axis, which was rescued by the knockdown of GRHL3, as shown in Figures 4E-F and S3E-F. Similarly, upon overexpressing STAMBPL1 and knocking down FOXO1, we observed that STAMBPL1 overexpression increased the GRHL3/HIF1a/VEGFA axis, which could also be rescued by knocking down FOXO1, as shown in Figures 7F-H. These results suggest that STAMBPL1 upregulates the GRHL3/HIF1a/VEGFA axis through FOXO1. We do not think it is a right way to double knock down STAMBPL1 and FOXO1 or GRHL3.

      (6) Figure 7: It remains unclear how STAMBPL1 regulates FOXO1. The authors show that STAMBPL1 increases the transcriptional activation of FOXO1 at the GRHL3 promoter, but it is not clear if STAMBPL1 is required for FOXO1 binding to the GRHL3 promoter. To address this, STAMBPL1-knockdown should be included to examine its effect on FOXO1 binding to the GRHL3 promoter. Furthermore, it would be important to determine whether the STAMBPL1-FOXO1 interaction is essential for GRHL3 transcription. Since the interaction sites of STAMBPL1-FOXO1 have been mapped, a mutant disrupting the interaction would provide better insight into how STAMBPL1 promotes GRHL3 transcription by interacting with FOXO1.

      Thank you for this comment. It has been reported that FOXO1 promotes the transcription of the GRHL3 gene by interacting with its promoter (DOI: 10.1093/nar/gkw1276). We also verified through ChIP assay that FOXO1 can bind to the promoter of GRHL3 gene (Fig.7I) and mediate its transcription. Specifically, knocking down FOXO1 significantly down-regulated the mRNA level of GRHL3 (Fig.7B), and the GRHL3 promoter lacking FOXO1 binding site almost completely lost transcriptional activity (Fig.7J), indicating that FOXO1 is crucial for the transcriptional activity of the GRHL3 promoter. Overexpression of STAMBPL1 enhances the activating effect of FOXO1 on the transcriptional activity of the GRHL3 promoter (Fig.7K). However, the up-regulation of GRHL3 transcription by overexpression of STAMBPL1 is completely blocked by FOXO1 knockdown (Fig.7F), and the knockdown of FOXO1 essentially blocks the binding of STAMBPL1 to the GRHL3 promoter (Fig.7L), suggesting that STAMBPL1 affects the transcriptional expression of GRHL3 based on FOXO1. As we added in Discussion, the transcription factor activity of FOXO1 is mainly regulated by its nucleoplasm shuttling process, and the accumulation of FOXO1 in nucleus can enhance its transcription factor activity (DOI: 10.1042/BJ20040167; DOI: 10.15252/embj.2022111867). In our research, neither STAMBPL1 nor its mutant of deubiquitinating enzyme site affected the expression of FOXO1 (Fig.S5E), but STAMBPL1 and FOXO1 co-located in the nucleus (Fig.7M), and they interacted with each other (Fig.7N, Fig.S5I-J). Therefore, we speculate that STAMBPL1 interacts with FOXO1 in the nucleus, obstructs the binding of FOXO1 with the members of 14-3-3 family, inhibits the export of FOXO1, thereby enhancing its transcriptional activity. This interaction between STAMBPL1 and FOXO1 does not necessarily affect the binding of FOXO1 with DNA, including the GRHL3 promoter.

      (7) Figure 8 A-C: What is the correlation among the expressions of STAMBPL1, FOXO1, and GRHL3 in TNBC tumors compared to non-TNBC tumors?

      Thank you for your comment. In Figure 8A-C, we analyzed the expression levels of STAMBPL1, FOXO1, and GRHL3 in both TNBC and non-TNBC samples using the BCIP. The results indicate that the expression levels of these three genes are significantly higher in TNBC compared to non-TNBC samples. To investigate the correlation among the expressions of STAMBPL1, FOXO1, and GRHL3 in TNBC versus non-TNBC, we further utilized the Metabric data. Besides the positive correlation trend between STAMBPL1 and GRHL3 expression in TNBC clinical samples (Pearson R = 0.27), no significant correlation was observed in the expression levels of STAMBPL1, FOXO1, and GRHL3 in TNBC and non-TNBC clinical samples (as shown in Author response image 1 below). Since STAMBPL1 and FOXO1 are involved as protein molecules in the transcriptional regulation of GRHL3 gene, and the data obtained from the Metabric database are the transcriptional levels of these three genes, this might be the reason why the correlation between their expressions was not observed.

      Author response image 1.

      Reviewer #2 (Recommendations for the authors):

      The authors have thoroughly elucidated the role of STAMBPL1 in TNBC. However, it would be beneficial to discuss the potential clinical implications of these findings, such as how targeting STAMBPL1 or FOXO1 might impact current treatment strategies for TNBC. However, several issues need to be addressed.

      Major:

      (1) While the study provides an exhaustive analysis of the molecular mechanisms, a comparison with other subtypes of breast cancer could enhance our understanding of the specificity of the STAMBPL1/FOXO1/GRHL3/HIF1α/VEGFA axis in TNBC.

      Thank you for your comment. According to report, STAMBPL1 is significantly associated with the mesenchymal characteristics of breast cancer (DOI: 10.1038/s41416-020-0972-x). We utilized cBioPortal (http://www.cbioportal.org/) to analyze the expression of STAMBPL1 across various clinical subtypes of breast cancer. The results indicated that STAMBPL1 is highly expressed in invasive breast cancer, which has been added to Supplementary Figure 6 as Fig.S6D. Given that TNBC is an aggressive type of invasive breast cancer, we further examined the expression of STAMBPL1 in TNBC compared to non-TNBC using BCIP (http://omicsnet.org/bcancer/database). Our findings revealed that the expression level of STAMBPL1 in TNBC was elevated relative to its levels in non-TNBC (Fig.8A). Additionally, since tumor angiogenesis is a critical factor influencing the metastasis of cancer cells, our study focused specifically on the pro-angiogenic effects of STAMBPL1 in TNBC.

      (2) The authors might consider discussing any potential off-target effects of the siRNA and shRNA used in the study to bolster the conclusions drawn from the knockdown experiments.

      We appreciate the reviewer's suggestion. It is well-known that siRNA or shRNA have off-target effects. To address this concern, we employed two siRNAs for each gene knockdown in our study. Specifically, we knocked down genes such as STAMBPL1, FOXO1, GRHL3, and HIF1A in two TNBC cell lines, HCC1806 and HCC1937, using two siRNAs. Except for siRNA#1 targeting HIF1A, which did not show a significant knockdown effect in HCC1806 cells (Fig.2D and Fig.6A), the knockdown effects of other siRNAs on their respective genes were effective, and the resulting phenotypes were consistent. As shown in Fig.2F and Fig.S4H, siRNA#1 targeting HIF1A had a significant knockdown effect in HCC1937 cells. The lower knockdown efficiency of this siRNA in HCC1806 cell line might be attributed to cell-specific factors.

      (3) It would be advantageous if the authors could provide further details on the patient demographics and tumor characteristics in the TCGA database analysis to better comprehend the clinical relevance of their findings.

      Thanks for the reviewer's suggestions. We have now indicated the number of clinical samples in each group in the legend of Fig.8A-C. Since we utilized the BCIP online database to analyze and compare the expression levels of the three genes STAMBPL1, FOXO1, and GRHL3 in TNBC and non-TNBC, we are unable to obtain more specific information regarding the tumor characteristics of each sample. However, our analysis clearly shows that the expression levels of these three genes are significantly higher in TNBC compared to non-TNBC.

      (4) The authors should consider discussing any limitations regarding the generalizability of their findings, such as potential variations among different TNBC subtypes or the specificity of their observations to certain stages of the disease.

      We appreciate the reviewer's comment. Accordingly, we have added a discussion on the limitation of this study in Discussion, highlighted in red font on pages 20 to 21, lines 396 to 412. In addition, we utilized the bc-GenExMiner online database to conduct a comparative analysis of STAMBPL1 expression in different subtypes of non-TNBC and TNBC. The result indicates that STAMBPL1 is highly expressed in mesenchymal-like and basal-like TNBC, which has been added into Supplementary Figure 6 as Fig.S6E. Since these two subtypes of TNBC are highly invasive and metastatic, it suggests that targeting the signaling pathway of STAMBPL1/FOXO1/GRHL3/HIF1α/VEGFA may offer clinical benefits for patients with invasive TNBC.

      Minor:

      The paper is generally well-written, but it's crucial to maintain vigilance for subject-verb agreement, proper use of tense, and consistent terminology.

      Thank you for this suggestion. We have thoroughly revised the article for issues such as grammar, including tense, subject-verb agreement, and terminology.

    1. Author response:

      The following is the authors’ response to the original reviews.

      Recommendations for the authors:

      Reviewing Editor Note:

      The two reviewers have provided thoughtful and constructive feedback that we hope will be of use to the authors to improve their manuscript.

      Reviewer #1 (Recommendations For The Authors):

      The section on "Circuit evolution by duplication and divergence" (starting on line 622) should cite:

      Chakraborty, Mukta, and Erich D. Jarvis. "Brain evolution by brain pathway duplication." Philosophical Transactions of the Royal Society B: Biological Sciences 370, no. 1684 (2015): 20150056.

      and

      Roberts, Ruairí JV, Sinziana Pop, and Lucia L. Prieto-Godino. "Evolution of central neural circuits: state of the art and perspectives." Nature Reviews Neuroscience 23, no. 12 (2022): 725-743.

      It should also reference that the concept originated from genetics:

      Ohno, Susumu. Evolution by gene duplication. Springer Science & Business Media, 1970

      These papers have now been cited: “Duplication and divergence of circuits was also proposed as a possible mechanism for the evolution of brain pathways for vocal learning in song-learning birds, spoken language in humans [@chakraborty2015brain] and other circuits [@roberts2022evolution].”

      and: Our reconstructions identified a potential case for circuit evolution by duplication and divergence [@tosches2017developmental; @roberts2022evolution], a concept that originated from genetics [@ohno1970evolution].

      The terms outgoing and incoming synapses were confusing. The more common terminology is pre and postsynaptic elements. For example, in Fig 1, the label Sensory neuron outgoing and incoming was confusing because I mistakenly thought it was referring to the neurons and I could not figure out what an outgoing sensory neuron was.

      We have now changed ‘incoming’ to ‘postsynaptic’ and ‘outgoing’ to ‘presynaptic’.

      In L-O, there should be an indicator on the figures that they refer to the locations of synaptic sites, as it does in F.

      We have now replaced the labels ‘incoming’ and ‘outgoing’ with ‘presyn’ and ‘postsyn’ for Figure 1 panels L-O to make it clear that these are synaptic sites.

      Figure 2. - last panel of muscle motor - it would be helpful to have names of muscles instead of just having 5 'muscle motor' of different colors

      Each muscle-motor module contains a large number and type of muscles and motor neurons. Labelling them by the name of individual muscle types is therefore not practical at this resolution. The three-day-old Platynereis larvae has 53 different muscle cell types. Their anatomy and classification, together with the details of motoneuron innervation have been described in detail elsewhere (Jasek et al 2022 https://doi.org/10.7554/eLife.71231).

      Figure 3. D and E are hard to understand from the figure; The shading is the number of neurons; that scale should be shown somewhere.

      We are not sure we understand the comment. These plots are histograms that show the distribution of the number of cells across categories. The y axis is the number of neuronal or non-neuronal cell types in each bin.

      PageRank is an algorithm that Google uses. In Figure 4, it seems to be used to indicate centrality. A brief explanation in the text would be useful.

      We have now added an explanation of the centrality measures used. “PageRank is an algorithm used by Google to rank webpages and scores the number and quality of the incoming links of a node [@page1999pagerank], betweenness centrality measures the number of shortest paths that pass through a node in a graph [@freeman1977set],  and authority measures the extent of inputs to a node by hubs in a network [@kleinberg1999authoritative].”

      Figure 5. The labels on some images are not clear. They are on top of each other and elements of the figure

      We have now moved the position of the labels to minimise overlap. We have also added an interactive html file with the network shown in Figure 5 panel A to help the exploration of the network. Added: “Figure 5—source data 1. Interactive html file with the network shown in panel A.”

      There are differences in line thickness in several figures, such as Figure 9 (A and B) and Figure 12 (D and I and N) that presumably means numbers of synaptic contacts. It would be useful to know what the scale is.

      We have now added labels of line thickness to the networks in Figure 4, Figure 5 – figure supplement 2, Figure 9, Figure 12, Figure 7 – figure supplement 1, Figure 15 and Figure 16.

      Reviewer #2 (Recommendations For The Authors):

      (1) Suggestions for improved or additional experiments, data, or analyses.

      (2) Recommendations for improving the writing and presentation.

      Perhaps we require a comprehensive inventory detailing all the innovations compared to previous, more limited publications, particularly in relation to the 2017 publication and 2020 preprint.

      We have provided this detail in Supplementary table 1 that lists all cell types. We included the reference for previously published cell types in the ‘reference’ column except for those that were also described in the 2020 preprint. The current manuscript is a greatly revised and extended version of the original 2020 preprint. In addition, in the online connectome database (https://catmaid.jekelylab.ex.ac.uk), all cell types that were previously published are annotated with the notation ‘FirstAuthor_et_al_year’.

      It is a bit frustrating given the huge amount of graphs, analyses, tables, and networks that are presented in the manuscript, we do not see much of the original EM pictures except for a few examples of cell type blow-ups. It would be useful for future workers in the field to have eventually a sort of compendium of how the authors actually recognized each cell type, without having to connect to the original CATMAID annotation.

      Most neuronal cell types (with the exception of some characteristic sensory neurons such as photoreceptor cells and mechanosensory cells) were not classified based on ultrastructural features, but on features of neurite morphology, body position and synaptic connectivity. It would be therefore not possible to represent most of the cell types with a single layer of an original EM picture. However, in order to make the morphological skeleton characteristics more accessible to the reader, we have now added a comprehensive website ( https://jekelylab.github.io/Platynereis_connectome/)  including all cell types together with their interactive 3D rendering.

      “Interactive 3D morphological renderings of each cell type together with their main annotations can also be explored on a webpage (https://jekelylab.github.io/Platynereis_celltype_compendium.html).”

      The Platynereis 3-day larva is obviously only one transient stage in the developmental cycle of the animal, and it is a very specialized stage (called metatrochophore in annelid jargon), during which the animal does not yet feed, relying instead on its copious yolk. Moreover, it is a stage whose purpose is limited to dispersion, with no complex behavior or social interaction that later stages are going to display. While this work represents a substantial leap forward in understanding neural integration in a whole animal, it must be kept in mind that compared to an adult or growing juvenile, there are likely a considerable number of cells, cell types, and neural modules missing in this larva. This is clearly not a weakness of this study per se, but readers may find it interesting to be presented with this perspective and therefore more biological details about the Platynereis life cycle and associated behaviors.

      Obviously, understanding how the constantly developing nervous system of a worm-like Platynereis gets reshuffled in time will be a great subject to investigate. The authors mention that the 3-day larva displays more than 4000 neuronal cells not yet differentiated. Readers may be interested in their location. Are there niches of neural stem cells? A description of what may be missing from the larva in terms of cell types compared to the adult may be useful.

      We have now added further explanation into the Introduction about the early nectochaete larval stage: “The early nectochaete larva represents a transient dispersing stage in the life cycle of Platynereis. During this stage the larvae do not feed yet but rely on maternally provided yolk. Compared to the juvenile and adult stages it is expected that a considerable number of cell types will be only developing or completely missing at this stage. Three-day-old larvae do not yet have sensory palps and other sensory appendages (cirri), they do not crawl or feed and lack visceral muscles and an enteric nervous system.”

      The location of developing neurons is shown in Figure 3—figure supplement 1 panel I.

      Juvenile or adult cell types have not yet been described in any detail that is close to the level of detail we now provide for the nectochaete larva, therefore a meaningful comparison of cell-type complements across stages is not yet feasible.

      (3) Minor corrections to the text and figures.

      Figure 1: "outgoing" not "outgoung" in panels M, O, Q.

      Corrected

      Line 128: We may need a precise definition of "cable length".

      We have included a definition of cable length in the Methods section under a new subheading ‘Quantitative analysis of neuron morphologies’.

      In all Figures: information on the orientation of the worm's view is sometimes missing in figures, which could make interpretation difficult for the reader, especially for anterior views with no D/V indication. The authors should indicate the orientation for each panel or provide a general orientation in the figure if all panels are oriented the same.

      We have now added D/V or A/P indication to all figures.

      Figure 23: "right view, left side" is confusing.

      We have changed this to “ Each panel shows a ventral (left panel) and a left-side view (right panel).”

      Line 406 : the first mention of the Platynereis cryptic segment, as far as I know, is Saudemont et al, 2008.

      Thank you for pointing this out. We added the citation.

      Figure 45: descending and decussating, 2nd and 3rd line of the legend.

      Corrected

      The format of data source tables is not homogeneized with some files in Excel format and others in plain comma format.

      We have homogeneized the file formats of the supplements and source data. We have .csv files or .rds (R data format) files for the more complex data, such as tibble graphs that cannot be represented in a simple .csv format.

    1. Author Response:

      Reviewer #1 (Public review):

      […] Strengths:

      The strategies used for increasing PCR sensitivity offer the potential for enhancing treatment monitoring and understanding the dynamics of parasite-host interactions in chronic Chagas disease.

      Weaknesses:

      While the study offers valuable insights for research in T.cruzi infection dynamics and monitoring of trypanocidal drugs efficacy, its broader adoption depends on the development of cost-effective and scalable alternatives to labor-intensive techniques such as sonication, currently required for DNA fragmentation. Additionally, the reliance on blood cell pellets and the DNA fragmentation protocol introduces extra processing steps, which may not be feasible for many clinical laboratories, particularly in resource-limited endemic areas that require simpler and more streamlined procedures.

      We agree that this methodology is likely to be used primarily as a research tool and for selective use in the field (e.g. drug trials) and unlikely to be standard in many clinical labs, irrespective of resources. We note the protocol does not require cell pellets (although that fraction provides the highest sensitivity) and that the fragmentation step is not at all labor-intensive. But to achieve consistent detection across the range of parasite burden known to occur in chronic T. cruzi infection, appropriately processed DNA from higher volumes of blood than are now routinely used for detection of T. cruzi, will be required.

      Reviewer #2 (Public review):

      […] Strengths:

      The primary strength of this study lies in its methodological novelty, particularly the combination of multiple parallel PCR reactions and DNA fragmentation to enhance sensitivity. It is a sort of brute-force method for detecting the parasite. This approach promises the detection of parasitic DNA at levels significantly lower than those achievable with standard qPCR methods. Additionally, the authors demonstrate the utility of this method in tracking parasitemia dynamics and post-treatment responses in macaques and dogs, providing valuable insights for both research and clinical applications.

      Weaknesses:

      (1) Methodological Concerns on detection and quantification limits

      Some methodological inconsistencies and limitations were observed that merit consideration. In Figure 1, there is a clear lack of consistency with theoretical expectations and with the trends observed in Figure 4A. Based on approximate calculations, having 10^-7 parasite equivalents with 100,000 target copies per parasite implies an average of 0.01 target copies per reaction. This would suggest an amplification rate of approximately 1 in 100 reactions, yet the observed 30% amplification appears disproportionately high. In addition, Figure 4A (not fragmented) shows lower values of positivity than Figure 1 for 10^-5 and 10^-6 dilutions showing this inconsistency among experiments. Some possible explanations could account for this inconsistency: (1) an inaccurate quantification of the starting number of parasites used for serial dilutions, or (2) random contamination not detected by negative controls, potentially due to a low number of template molecules.

      Similarly, Figure 5B presents another inconsistency in theoretical expectations for amplification. The authors report detecting amplification in reactions containing 10^-9 parasites after DNA fragmentation. Based on the figure, at least 3 positives (as I can see because raw data is not available) out of 388 PCRs are observed at this dilution. Assuming 100,000 copies of satellite DNA per parasite, the probability of a single copy being present in a 10^-9 dilution is approximately 1/10,000. If we assume this as the probability of amplification of a PCR (an approximation), by using a simple binomial calculation, the probability of at least 3 positive reactions out of 388 is approximately 9.39 x 10^-6 (in ideal conditions, likely lower in real-world scenarios). This translates to a probability of about 1 in 100,000 to observe such frequency of positives, which is highly improbable and suggests either inaccuracies in the initial parasite quantification or issues with contamination. In addition, at 10^-6 PE/reactions (the proposed limit of quantification) it is observed that 40% of repetitions are amplified. The number of repetitions is not specified but probably more than 50 according to the graph. Such dilution implies 0.1 targets per reaction (assuming 100.000 copies divided by 10^6), which means a total of 5 target molecules to distribute among the reactions (0.1 targets multiplied by 50 reactions). It seems highly improbable that 40% of the reactions (20/50) would amplify under the described conditions. Even considering 200.000 target copies per parasite implies 0.2 targets per reaction and an average of 10 molecules to distribute among 50 reactions. The approximate probability of the observation of at least 20/50 positives can be calculated by determining the probability of a reaction to receive targets by assuming a random distribution of the targets among the tubes, p= 1 - (1 - 1/50)^10, and then by using a binomial distribution to determine the probability that at least 20 reactions receive at least one target copy. The probability of at least 20/50 positive reactions in a dilution of 10^-6 parasites (200.000 target copies per parasite) is 0.00028. Consequently, the observed result is highly unlikely.

      We disagree with the reviewer on both of these points. 

      First, the mean (S.D.) Cq values of the 10-3 PE unfragmented dataset in Figure 1 (40 replicates) and Figure 4a (88 replicates) are nearly identical at 30.02 (0.5813) and 30.21 (1.071), respectively, demonstrating a highly accurate initial quantification of parasites to make these 2 separate dilution series (reviewer’s point 1.1).  At this concentration of parasites in blood, and with unfragmented DNA, each aliquot for PCR has an equal chance of receiving some parasite DNA (hence all reactions are positive) and a reasonably good chance of receiving similar amounts of parasite DNA (the Cq values cluster with relatively low S.D.).  However further dilutions from this parasite input result in some aliquots that receive no parasite DNA and a much wider variation in the amount of parasite DNA/aliquot in samples that are positive (Cq mean (SD) of 34.47 (2.732) for 10-4 in Figure 1).  This result demonstrates that these dilution series do not follow binomial distribution as suggested by the reviewer. This is likely because each template for amplification is not independently distributed. Instead, they are known to be clustered (on individual chromosomes or chromosome fragments) in the DNA. Indeed, this observation of widely varying Cq values in dilutions below 10-3 strongly suggested this clustering and was the impetus for fragmenting the DNA (see manuscript line 209).  The impact of declustering achieved by DNA fragmentation supports this conclusion (when the DNA is fragmented, 100% of aliquots are positive at 10-4 PE, 10X less than in unfragmented samples, and the Cq values are tightly grouped (mean 33.47, S.D. 0.3358), indicating the unequal distribution of targets upon dilution, rather than counting, pipetting errors or contamination as responsible for the lack of a binomial distribution of targets with increasing dilution. Thus, when entities are clustered and can’t be fully declustered, a simple binomial (or Poisson) distribution of counts cannot be assumed in the serial dilutions.  Clustering results in more complicated distribution patterns, and it becomes difficult to predict precisely how these clusters will distribute from one dilution to the next (and thus differences in proportions of positives in different dilution series, as observed herein).

      This clustering and unequal distribution of amplification targets also addresses the reviewer’s second comment with respect to the unlikelihood of detecting at least one positive at a high dilution.  If we accept the reviewer’s estimate of 100,000 copies of target per parasite, then at 10-4 PE/aliquot - a dilution at which all aliquots are PCR positive in the fragmented samples (Figures 4a and 5b) – each aliquot would be expected to have on average 10 target sequences and the chances of detecting at least one positive reaction from 400 aliquots would be respectively 98% for the 10-7 dilution, 33% for 10-8 and 4% for 10-9 PE per aliquot. These percentages would change (increase) with a higher copy number of targets per genome, and if the targets are still clustered to some degree (which we would expect they would be even in the fragmented DNA).  Thus, the chances of detecting positive PCRs at 10-9 PE is low, but it is not “highly improbable”. 

      Taking the reviewer’s second example of the frequency of positive reactions at 10-6 PE and the assumption of 200,000 target copies per genome (referring to Fig 5B, we believe), the mean template copies per aliquot would be 0.2 at this dilution. Assuming a negative binomial distribution of the still clustered templates (although mechanically fragmented, it would be highly unlikely that they would be completely declustered), then the probability of an aliquot being positive at the 10-6 PE dilution would be 16.7%.  Our results in Figure 4A (26%) and Figure 5B (37.5%) are slightly higher but not “highly unlikely” as suggested.

      We do not know the target copy number in the parasites used to make these serial dilution profiles herein but that is certainly different from the copy number in the parasites infecting each of the hosts from which we have analyzed blood.  Thus, we do not propose that this assay can quantify the absolute parasite burden in a host nor do we see a benefit in trying to do so (see paragraph beginning line 384). Such quantification requires assumptions about not only the target copy number in the parasites in a host, but also that fragmentation is 100% efficient, and particularly, that a single or multiple blood samples accurately reflects the whole host parasite burden (clearly shown not to be the case with the data from serial bleeds presented in Figures 3 and 5). But we standby the conclusion that deep-sampling PCR when employed as presented herein, gives an accurate assessment of the presence of infection and relative parasite burden differences between hosts, and in the same hosts over time or under treatment and that the results presented are not compromised by inaccuracies in quantifying parasites for spiked samples or by sample contamination.

      (2) Lack of details on contamination detection

      Additionally, the manuscript does not provide enough details on how cross-contamination was detected or managed. It is unclear how the negative controls (NTCs) and no-template controls were distributed across plates, in terms of both quantity and placement. This omission is critical, as the low detection thresholds targeted in this study increase the risk of false positives by contamination. To ensure reliability and reproducibility, future uses of the technique would benefit from more standardized and clearly documented protocols for control placement and handling.

      We present a section in the Materials and Methods on preventing contamination and a case example when these precautions failed when preparing the dilution standards containing very high numbers of parasites. Directly responding to the reviewer, sixteen no template controls were included in every 384 well assay plate and we never obtained amplification products from those reactions. Additionally, as noted in the manuscript, uninfected macaques were negative on a collective >15,000 PCR reactions.

      We understand the concern about contamination but we believe that we have taken the appropriate precautions and our data fully support that the positives we detect are real positives, not contaminations. It would be reckless to depend on a single positive PCR reaction out of hundreds to conclude that a host is infected; multiple samples must be obtained and analyzed to be certain in such cases, as we show exhaustively with the NHP samples here.

      Rather than adding additional technical protocols such as plate layouts to this manuscript, we believe publishing a STAR Protocol or a similar detailed, step-by-step method paper would be more useful and that is our plan.

      (3) Unclear relevance for treatment monitoring in Humans

      In Figure 7A, the results suggest that the deep-sampling PCR method does not provide a clearly significant improvement over conventional qPCR in humans. Of the 9 samples tested, 6 (56%) were consistently amplified in all or nearly all reactions, indicating these samples could also be reliably detected with standard PCR protocols. Two additional samples were detected only with the deep-sampling approach, increasing sensitivity to 78%; however, these detections might be attributable to random chance given the limited sample size. While the authors acknowledge the small sample size in the discussion, they do not address the fact that a similar increase in sensitivity was reported in citation 5, where only 3 samples were tested with 3 replicates each. This raises an important question: how many PCR reactions are needed in human samples to reach a plateau in detection rates? This issue should be further discussed to contextualize the results and their implications.

      We disagree with the reviewer’s conclusion here.  First, it is not known how the “conventional” PCR would have performed in the human samples used herein as this was not done.  However, it is very likely that it would have performed significantly worse for the following reasons.  “Conventional” PCR for T. cruzi has a number of variations, but the most common approach is to mix whole blood 1:1 with a guanidine:EDTA solution, and then extract DNA for PCR from 100-300 ul of this mix.  Thus, at best, one has the equivalent of 150 ul of blood that is being analyzed for the presence of T. cruzi DNA.  In contrast, in the protocol described herein, we extract DNA from ~5 ml of blood and use aliquots from that DNA for PCR.  Thus, even before fragmenting or deep-sampling, the approach described herein is sampling 33X more blood that the conventional protocol, thus likely increasing by over 30-fold the chances of detecting parasite DNA in blood from an infected subject. The smaller the volume of blood sampled as well as the number of samples obtained greatly impact the ability to detect T. cruzi infection in some hosts.  This is clearly demonstrated in the extensive screening done in NHPs in this study and there is no reason to believe that the situation will be different in humans and dogs.  So the relevance of these enhancements are clear for any host with T. cruzi infection; humans are not unique in this regard.

      We don’t believe there will be a “plateau in detection rates”; individuals are either infected or not and the ability to detect that infection (whether with T. cruzi or any other pathogen) depends on the sensitivity of the test and the quantity of the sample available to be screened.    Perhaps what is being asked is ‘how many PCR reactions have to be performed to be sure that someone is NOT infected?’.  There is not a discrete answer to this and related questions, but by making some assumptions, one can make some estimates.  The approach described herein is approaching single copy target detection and if this is true then one would need to PCR amplify ALL of the DNA from a blood sample to assure detection of that single template copy (so for a 200ug of DNA one might obtain from 5-10 ml of blood, 1600 PCR reactions of 125 ng each; 95% and 99% confidence could be obtained with 1520 and 1584 PCRs, respectively). But any conclusion from this testing applies only to that individual blood sample and we show clearly in the NHP studies that multiple samples have to be analyzed to detect parasite DNA in hosts with very low parasite burden – some samples contain parasite DNA and others do not. Thus hundreds of negative PCRs from a single or even multiple samples is unfortunately not definitive. 

      Such limitations exist for detection of any pathogen.  A more important question for the future may be ‘is there a level of infection below which the risk of disease development is sufficiently low as to not be of concern clinically?’.  Such is the standard in drug-controlled HIV infections, for example. The improvements we document in this work provides the means to answer such questions and additional improvements may be possible as well. But to be absolutely certain that a host is not infected by T. cruzi, one would have to sample some subjects (likely a small minority of the entire pool) multiple times and perform 1000’s of PCR reactions – as we done for the most difficult to detect macaques in this study.

      Despite these limitations, this work represents a promising step forward in the development of highly sensitive diagnostic tools for T. cruzi. It offers a novel foundation for advancing the detection and monitoring of parasitemia, which could significantly benefit Chagas disease research community and clinicians focused on neglected tropical diseases. While addressing the methodological inconsistencies and improving robustness will be critical, this study provides valuable insights and data that could lead to future innovations in parasitological research and diagnostics.

      As discussed in detail above, we do not agree that this study has any methodological inconsistencies nor that it lacks robustness.

    1. Author response:

      The following is the authors’ response to the original reviews.

      Reviewer #1:

      Weaknesses:

      (1) The authors themselves propose in their Introduction that the "ECM-associated changes are increasingly perceived as causative, rather than consequential"; however, they have not conducted mechanistic (gain of function/loss of function) studies either in vitro or in vivo from any of their identified targets to truly prove causality. This remains one of the limitations of this study. Thus, future studies should investigate this point in detail. For instance, it would have been intriguing to dissect if knocking out specific genes involved in one specific model or genes common to both would yield distinct phenotypic outcomes.

      We agree with the reviewer that our study does not provide mechanistic verification of the function of identified targets with suggested role in the development and/or resolution of fibrosis. The current study was primarily conducted in order to identify these possible targets with focus on the identification of differences in extracellular matrix deposited in two selected models of liver fibrosis with different modes of action. To conduct further studies using knock-out/in models for verification of causality of proposed targets was at this point well beyond our intention. However, we are fully aware of the potential of identified molecules and further studies to disect their roles in liver diseases are part of future plans.

      (2) The majority of the conclusions are derived primarily from the proteomic analyses. Although well conducted, it would strengthen the study to corroborate some of the major findings by other means such as IHC/IF with the corresponding quantifications and not only representative images.

      We have now provided additional IF images and their quantifications in accordance with the Reviewer’s suggestions to our major MS findings to strenghten the significance of the MS data (see detailed answer below).

      Reviewer #2:

      Weaknesses:

      (1) As it currently stands, the data, whilst extensive, is primarily focussed on the proteomic data which is fairly descriptive and I am not clear on the additional insight gained in their approach that is not already detailed from the extensive transcriptomic studies. The manuscript overall would benefit from some mechanistic functional insight to provide new additional modes of action relevant to fibrosis progression.  

      We agree with the reviewer that our study could initially appear descriptive. However, this characteristics is inherent to most omics studies, which tend to provide hypothesis-free testing of a large number of analytes in order to find a multitude of candidate biomarkers(1). Importantly, we believe our study provides insights that go beyond the scope of previously published transcriptomic analyses.

      Specifically, our work focuses on compartment-specific changes in the liver proteome, with an emphasis on the extracellular matrix (ECM) composition and alterations in protein solubility—features that cannot be captured by transcriptomic studies. The matrisome is more than a structural scaffold; it functions as a reservoir for secreted factors, including growth factors and cytokines, which modulate the local cellular microenvironment. Transition dynamics between the insoluble matrisome and soluble protein pools influence the signaling capabilities and bioavailability of these factors. Moreover, fibrous ECM assemblies directly impact tissue mechanics, providing cells embedded within the matrix with spatially distinct biochemical and biomechanical contexts. The current understanding of matrisome composition in the context of specific liver disease etiologies is limited. Dr. Friedman, in his 2022 review on hepatic fibrosis, highlights the unmet need to elucidate etiology-specific protein signatures of the cirrhotic liver matrisome, which could serve as disease staging or prognostic biomarkers(2). Our study addresses this gap by characterizing the distinct matrisome profiles associated with hepatotoxic- versus cholestasis-driven liver injury. We believe our findings lay the groundwork for identifying etiology-specific biomarkers and potential therapeutic targets for antifibrotic interventions, offering a novel layer of insight beyond what transcriptomic data alone can provide.

      (2) Whilst there is some human data presented it is a minimal analysis without quantification that would imply relevance to disease state. Although studying disease progression in animals is a fundamental aspect of understanding the full physiological response of fibrotic disease, without more human insight makes any analysis difficult to fulfil their suggestion that these targets identified will be of use to treat human disease.

      We thank the reviewer for this comment. Our study primarily focuses on utilizing animal models to explore the fundamental physiological processes underlying the development and resolution of fibrotic liver disease. To address the translational relevance of our findings, we concentrated on clusterin, one of the key target proteins identified during our analysis of the insoluble proteome. Specifically, we investigated its localization in human liver samples, focusing on its association with collagen deposits (Figure 6F). To this end, we analyzed human liver samples of diverse etiologies and varying degrees of fibrotic damage, including samples representing four distinct stages of HCV-induced fibrosis (Figure 6F, lower panel). While this analysis highlights the presence and localization of clusterin in fibrotic deposits, we acknowledge that our study does not include extensive quantification or mechanistic insight into clusterin's role in human liver fibrosis. We believe that the data presented in this manuscript provide a valuable foundation for future investigations into clusterin’s involvement in liver fibrosis across different etiologies. Recognizing the translational importance of this work, we have already initiated a prospective study involving human patients, which aims to conduct a more comprehensive analysis of clusterin's function and its potential as a therapeutic target.

      To further support our findings on clusterin's role in fibrosis development and resolution and to address the reviewer's concern, we quantified clusterin deposits in the available human samples representing four distinct stages of HCV-induced fibrotic disease. Using immunofluorescence (IF) images at a 20x field of view, we measured both clusterin and collagen deposits to illustrate changes in clusterin abundance during fibrosis progression (stages F1–F4) in relation to collagen deposition dynamics. The quantified data have been included for the reviewer's consideration (Figure 1). However, it is important to emphasize that this quantification was conducted on a single human sample per fibrotic stage, which limits the statistical robustness of the analysis. A more comprehensive evaluation involving additional patient samples would be necessary for a more definitive conclusion. For this reason, we propose to include these results solely in our rebuttal letter and to incorporate a more extensive analysis in our intended follow-up study, where larger cohorts will allow for a thorough investigation of clusterin's role in human liver fibrosis.

      Author response image 1.

      Dynamics of clusterin abundance with the development of HCV-induced fibrotic disease in comparison to the changes in collagen deposits. IF images of human liver sections from different stages of chronic HCV infection were immunolabeled for clusterin and collagen 1. Clusterin- and collagenpositive (<sup>+</sup>) areas (as %) from three to eight fields of view (20x objective) were evaluated for each fibrosis stage (F1-F4). 

      (3) Some of the terminology is incorrect while discussing these models of injury used and care should be taken. For example - both models are toxin-induced and I do not think these data have any support that the DDC model has a higher carcinogenic risk. An investigation into the tumour-induced risk would require significant additional models. These types of statements are incorrect and not supported by this study.

      We are grateful to the reviewer for drawing our attention to the incorrect use of the term "toxin-induced". In two instances, where the wording was incorrect, we have corrected the term to hepatotoxin-induced as it was originally intended. While we believe that our proteomic signature data and identified signaling pathways suggest a potential carcinogenic risk associated with the cholestatic, but not the hepatotoxic model, we have toned down the statements on this issue in the article to respect the reviewer's perspective. These changes, which are highlighted in the track changes mode of the article, aim to make the conclusions of the study more precise and thus improve the clarity of our conclusions.

      Reviewer #1 (Recommendations for the authors): 

      (1) In the Discussion, the authors could consider pointing out that one limitation of the study is a lack of mechanistic (gain of function/loss of function) studies either in vitro or in vivo from any of their identified targets to truly prove causality. 

      As noted earlier, we fully agree with both reviewers that a limitation of this study is its descriptive nature, which is an inherent characteristic of omics-based research. In our manuscript, we aimed to "determine compartment-specific proteomic landscapes of liver fibrosis and delineate etiology-specific ECM components," with the overarching goal of providing a foundation for future antifibrotic therapies.

      The insights gained from our study will indeed serve as a critical basis for subsequent research, where we will prioritize mechanistic investigations to elucidate the roles of the identified targets. While we acknowledge the importance of gain- or loss-of-function studies to establish causality, we believe this falls outside the primary scope of the current manuscript. Instead, we envision these mechanistic approaches as key elements of our future research efforts. For this reason, we feel it is not necessary to further expand on this limitation in the current discussion.

      (2) The majority of the conclusions are derived primarily from the proteomic analyses. Although well conducted, it would strengthen the study to corroborate some of the major findings by other means such as IHC/IF with the corresponding quantifications and not only representative images. For example, the IF stainings for ECM1 should also be quantified - ECM1. 

      To strengthen our MS findings on ECM1 expression and to address the reviewer's concern, we have now included quantification of ECM1 using IF staining at selected time points in Figure S7E and we refer to these data in the Results section (p. 12 of the current manuscript). The IF quantification data correspond well to the MS data showing increase in ECM1 expression with fibrosis development and decline with partial fibrosis resolution.

      (3) S1 - it would be important to show Sirius Red images over the time course, especially for CCl4 T4 where fibrosis resolution is occurring. Proteomics data also show this group clusters more closely with control mice and seeing a representative image would add further credibility to this point. 

      Requsted Sirius Red images are now part of the Figure S1B, documenting partial fibrosis resolution and overall parenchyma healing in T4 in both models.

      (4) How comparable are the periods of the two models? 2 weeks in one model may not be the same as 2 weeks in the other depending on the severity of the pathogenesis. 

      We appreciate the reviewer’s comment regarding the comparability of time points between the two models. Indeed, the temporal dynamics of fibrosis development differ between the models employed in our study, and we have carefully considered this aspect to ensure the validity of our comparative analysis. To address this, we started our comparisons at a stage corresponding to the onset of fibrosis in each model. Specifically, quantification of Sirius Red-positive areas, indicative of collagen deposition (Figure S1B), revealed that 2 weeks of DDC treatment produced a comparable extent of fibrosis to that observed after 3 weeks of CCl₄ treatment. This point was designated as the initial fibrosis time point (T1, Figure S1B), from which further treatment was applied to induce more advanced fibrosis. This approach allowed us to standardize the comparison of fibrosis progression between the two models.

      (5) Figure 4A-D - cell-type-specific signatures should be corroborated by actual IHC or IF stainings if possible. HNF4a (hepatocytes), CK19 (cholangiocytes), aSMA (activated fibrogenic HSCs), immune cells (B220, F4/80, Cd11b, CD11c etc).

      We thank the reviewer for this valuable suggestion. To strengthen our analysis, we have now complemented the box plots of cell type-specific signatures derived from the MS data (Figure 4A-D) with immunofluorescence (IF) staining, which has been included in the Supplemental Data (Figure S6). Specifically, we provide representative IF images from control and T1-T4 time points for each model, documenting the changes in abundance with treatment in:

      A) Hepatocytes (HNF4α), activated hepatic stellate cells (αSMA), and cholangiocytes (CK19).

      B) Immune cell populations, including B cells (B220) and macrophages/monocytes/Kupffer cells (F4/80), as these immune cell groups were not only identified in our MS analysis but also have established roles in the selected models(3, 4, 5). 

      The representative images shown in Figure S6 show the dynamics of the cellular populations in each of the models, which correspond well with the MS data (compare Figures 4A-D and S5). These additional data further validate our findings and enhance the robustness of our conclusions.

      References:

      (1) Thiele M, Villesen IF, Niu L, et al. Opportunities and barriers in omics-based biomarker discovery for steatotic liver diseases. J Hepatol 2024;81:345-359.

      (2) Friedman SL, Pinzani M. Hepatic fibrosis 2022: Unmet needs and a blueprint for the future. Hepatology 2022;75:473-488.

      (3) Best J, Verhulst S, Syn WK, et al. Macrophage Depletion Attenuates Extracellular Matrix Deposition and Ductular Reaction in a Mouse Model of Chronic Cholangiopathies. PLoS One 2016;11:e0162286.

      (4) Aoyama T, Inokuchi S, Brenner DA, et al. CX3CL1-CX3CR1 interaction prevents carbon tetrachlorideinduced liver inflammation and fibrosis in mice. Hepatology 2010;52:1390-400.

      (5) Yang W, Chen L, Zhang J, et al. In-Depth Proteomic Analysis Reveals Phenotypic Diversity of Macrophages in Liver Fibrosis. J Proteome Res 2024;23:5166-5176.

    1. Author response:

      The following is the authors’ response to the original reviews.

      Reviewer #1 (Public Review):

      Major concerns:

      For studies investigating capsaicin binding to KEAP1, the authors used capsaicin concentrations that are toxic to cells (Figures S1D and 4F, G). In vivo studies were performed only in 3 rats per group. The T-test was used for the comparison of more than two groups. Given the well-known issues with the specificity of the NRF2 antibody, the authors should provide appropriate controls, especially for IF and IHC staining.

      We sincerely appreciate your valuable comments. We repeated the experiments about CCK8 (Figure S1d) and Pull-down (Figure 4g), and then updated the results. In September 2022, GES-1 cells were more sensitive to capsaicin (CAP) because Gibco serum from North America was used. Later, in 2024, we changed the serum from Australia(Gibco: 10099-141), and we found that such GES-1 cells raised better, so we re-ran the test, and the IC50 was seen to be 304.8 μM, so concentrations used in this paper has no obvious toxicity to cells. What’s more, we repeated the Pull-down experiment with more reasonable concentrations of 32 μM and 100 μM, and the results were still in line with expectations. In summary, we concluded that the effect of CAP on GES-1 cells is closely related to the cell state, and that treatments of CAP from 32 to 100 μM can hinder the interaction between NRF2 and the Kelch domain of KEPA1. What’s more, at the cellular level, the experimental concentration of CAP was not more than 32 μM, which is a relatively safe concentration for cells.

      Thank you very much for your comments. We also pay attention to using more repetitions to increase the reliability of the experimental results in animal experiments. Therefore, recently we supplemented the experiment of Nfe2l2Knockout mice in Figure 9 (6 mice per group). Additionally, thank you very much for your comments on the use of T-test analysis, we reviewed the statistics and changed them by one-way ANOVA.

      Finally, thanks to your concern about the specificity of NRF2 antibody, we used commercialized NRF2 antibody which have been KO/KD validated (Cat No. 16396-1-AP, Proteintech) and can be used for IF and IHC staining. Each of our fluorescence result was equipped with Western Blotting in its active form at the size of 105-110 KDa for statistical analysis, the trend was consistent with the experimental results of IF and IHC, which fully proves the correctness of the results presented (Figure 2c and Figure S8j).

      Reviewer #2 (Public Review):

      Weaknesses:

      One major weakness of the study is that plausibility is taken as proof for causality. The finding that capsaicin directly binds to Keap1 and releases Nrf2 from its fate of degradation (in vitro) is taken for granted as the sole explanation for the observed improved gastric health upon alcohol exposure (in vivo). There is no consideration or exclusion of any potential unrelated off-target effect of capsaicin, or proteins other than Nrf2 that are also controlled by Keap1. 

      Another point that hampers full appreciation of the capsaicin effect in cells is that capsaicin is not investigated alone, but mostly in combination with alcohol only.

      Thank you very much for this comment. In the introduction, we clarified as follows: “Currently, experiments conducted in rats have demonstrated that red pepper/capsaicin (CAP) had significant protective effects on ethanol-induced gastric mucosal damage, and the mechanism may be related to the promotion of vasodilation(6,7), increased mucus secretion(8) and the release of calcitonin gene-related peptide (CGRP)(9,10). However, it is noteworthy that whether the antioxidant activity of CAP works has not been fully investigated.” Therefore, we also recognize that CAP does not exert its effects through the KEAP1-NRF2 pathway alone. Your advice is very useful. We further explored the TRPV1 and DPP3 to detect the potential off-target effects of CAP respectively. Capsazepine (CAPZ), which is TRPV1 receptor antagonist did not affect the protection of CAP against GES-1 (Fig S4f and S4g), which may indicate that CAP activation of NRF2 does not have to depend on TRPV1. The binding of CAP with DPP3, containing an ETGE motif and can bind to KEPA1, was detected by BLI, and we found that the K<sub>D</sub> between CAP and DPP3 was 1.653 mM(>100 μM), which may indicate the potential off-target effect of CAP is low because CAP had a strong binding force with KEAP1 about 31.45 μM (Fig S4h and S4i).

      Thank you very much for the comment of another point. Multiple experiments have shown that CAP significantly up-regulates NRF2 in the presence of additional stimuli such as EtOH (Figure 1i),  H<sub>2</sub>O<sub>2</sub> (Figure 1l), PS-341(Figure 2e) and DTT (Figure 4d), which pattern is consistent with our understanding of allosteric regulation and as expected. Especially for the experiments of PS-341 and DTT, we had a group that only adds CAP, and it can be seen that the addition of CAP alone did not significantly up-regulate NRF2, which is completely different from traditional NRF2 activators (especially artificially designed covalent binding peptides which have serious side effects).  

      Reviewer #3 (Public Review):

      Weaknesses:

      While the study provides valuable insights into the molecular mechanisms and in vivo effects of CAP, further clinical studies are needed to validate its efficacy and safety in human subjects. The study primarily focuses on the acute effects of CAP on ethanol-induced gastric mucosa damage. Long-term studies are necessary to assess the sustained therapeutic effects and potential side effects of CAP treatment.

      Furthermore, the study primarily focuses on the interaction between CAP and the KEAP1-NRF2 axis in the context of ethanol-induced gastric mucosa damage. It may be beneficial to explore the broader effects of CAP on other pathways or conditions related to oxidative stress. CAP has been known for its interaction with the Transient Receptor Potential Vanilloid type 1 (TRPV1) channel and subsequent NRF2 signaling pathway activation. Those receptors are also expressed within the gastric mucosa and could potentially cross-react with CAP leading to the observed outcome. Including experiments to investigate this route of activation could strengthen the present study.

      While the design of CAP nanoparticles is innovative, further research is needed to optimize the nanoparticle formulation for enhanced efficacy and targeted delivery to specific tissues.

      Addressing these weaknesses through additional research and clinical trials can strengthen the validity and applicability of CAP as a therapeutic agent for oxidative stress-related conditions.

      Thank you very much for these suggestions. We also believe that CAP is very valuable and promising for protecting EtOH induced gastric mucosal injury, and actively promote patent applications and if conditions permit, longer drug research for biosecurity is essential. Because of the inherently new discovery of the binding of CAP and KEAP1, and the important role of NRF2 in various oxidative stress-related diseases, we used Human umbilical cord mesenchymal stem cells (HUC-MSCs) and  H<sub>2</sub>O<sub>2</sub> to explore the potential broader effects of CAP related to oxidative stress in cells (Figure 1l and 1m). At the same time, we also explored TRPV1 related experiments, and we were surprised to find that inhibiting TRPV1 did not affect the effect of CAP (Supplementary Figure 4f and 4g). We hope that more people can read this article and do more interesting research together.

      Recommendations for the authors:

      Reviewing Editor (Recommendations For The Authors):

      Although this study has been conducted in rats, a direct proof that albumin-coated capsaicin nanoparticles act through activation of Nrf2 in protecting gastric mucosa against alcohol toxicity could be well conducted in commercially available Nrf2-deficient mice.

      Thank you very much for your suggestion and the comment is very constructive for us to improve this paper. We purchased Nrf2-deficient mice (Cat. NO. NM-KO-190433) and performed experiments, and the results showed that knockout mice with Nrf2 were more sensitive to EtOH and the effects of CAP were partially eliminated (Figure 9), which further validated the role of Nrf2-related signaling pathway in EtOH-induced gastric mucosal injury and the therapeutic effect of CAP.

      Reviewer #1 (Recommendations For The Authors):

      Minor concerns include proofreading the paper. Actinomycin is not an inhibitor of translation.

      Thank you for your comment. We have revised “Actinomycin” to “Cycloheximide”.

      Reviewer #2 (Recommendations For The Authors):

      - Please have a careful look at your conclusions: just because two effects happen at the same time and may be plausible explanations for each other, it does not mean that they are really in a causative relationship in your given test system (unless unambiguously proven by additional experiments).

      Your suggestions are very constructive for us to improve this paper.

      We further discussed the role of capsaicin with TRPV1, DPP3 and Nrf2deficient mice, hoping to make our conclusions more credible to some extent. 

      - You may want to frankly discuss other targets of capsaicin (e.g. the TrpV1 receptor) that possibly could also account for your observations, and that binding to Keap1 not only releases Nrf2 from proteasomal degradation.

      Thank you for your comment. As a result, we further explored the TRPV1 and DPP3 to detect the potential off-target effects of CAP respectively. Capsazepine (CAPZ), which is TRPV1 receptor antagonist does not affect the protection of CAP against GES-1 (Fig S4f and S4g). DPP3 with an ETGE motif was detected by BLI, and we found that the K<sub>D</sub> between CAP and DPP3 was 1.653 mM, which may indicate the potential off-target effect of CAP is low (Fig S4h and S4i). At the same time, the activation of NRF2 by non-classical pathways such as CAP regulation of DPP3 or other proteins also deserves more discussion and experimental verification.

      - For Figure 1G it does not become entirely clear what has been done (and thus deduction of conclusions is hampered).

      Thank you for your comment. Network targets analysis (Figure 1g) was performed to obtain the potential mechanism of effects of CAP on ROS. Biological effect profile of CAP was predicted based our previous networkbased algorithm:drug CIPHER. Enrichment analysis was conducted based on R package ClusterProfiler v4.9.1 and pathways or biological processes enriched with significant P value less than 0.05 (Benjamini-Hochberg adjustment) were remained for further studies. Then pathways or biological processes related to ROS and significantly enriched were filtered and classified into three modules, including ROS, inflammation and immune expression. Network targets of CAP against ROS were constructed based on above analyses, and finally we combined proteomics to determine the research idea of this paper

      -  Figure 1L: is there a reason/explanation why UC.MSC needs a comparably very high concentration of capsaicin.

      Thank you for your comment. Because the experimental results of 8 μM and 32 μM on this cell were more stable, and the activation effect of NRF2 downstream was more obvious.

      -  Figure 2C: it is surprising that naïve (unstressed /untreated cells) already show a rather high nuclear abundance of Nrf2 (shouldn´t Nrf2 be continuously tagged for degradation by Keap1).

      Thank you for your comment. This is a real experimental result, and we have found in many experiments that the untreated group can also show NRF2 when immunoblotting. We think that this phenomenon may be related to the cell state at that time.

      -  Figure 2E: the claim of synergy between CAP and the proteasome inhibitor is not justified with this single figure.

      Thank you for your comment. Multiple experiments have shown that CAP significantly up-regulates NRF2 in the presence of additional stimuli such as EtOH (Figure 1i),  H<sub>2</sub>O<sub>2</sub> (Figure 1l), PS-341 (Figure 2e) and DTT (Figure 4d), which pattern is consistent with our understanding of allosteric regulation and as expected. However, this synergy does warrant more research.

      -  CHX is cycloheximide (in the main text it is referred to as actinomycin).

      Thank you very much for your comment. We have revised “Actinomycin” to “Cycloheximide”.

      -  Figures 2G-H: why switch to rather high concentrations? Is it due to the overexpression of Keap1?

      Thank you for your comment. At the time of this part of the experiment, we had obtained in vitro data on the interaction of CAP and the Kelch domain of KEAP1 (about 32 μM). To keep the results uniform and valid, we chose a relatively higher concentration.

      -  Figure 2I: in the pics of mitochondria the control mitochondria look way more punctuated (likely fissed) than the ones treated with EtOH or EtOH + CAP. Wouldn´t one expect that EtOH leads to mitochondrial fission and CAP can prevent it?

      Thank you for your comment. MitoTracker® Red CMXRos (M9940, Solarbio, China) is a cell-permeable X-rosamine derivative containing weakly sulfhydryl reactive chloromethyl functional groups that label mitochondria. This product is an oxidized red fluorescent stain (Ex=579 nm, Em=599 nm) that simply incubates the cell and can be passively transported across the cell membrane and directly aggregated on the active mitochondria. Therefore, red does not represent broken mitochondria, but active mitochondria. Quantitative analysis of the mean branch length of mitochondria was calculated using MiNA software (https://github.com/ScienceToolkit/MiNA) developed by ImageJ.

      -  Figure 3C: figure legend is somewhat poor.

      Thank you for your comment. We have revised: “KEAP1-NRF2 interaction was detected with Surface plasmon resonance (SPR) in vitro.”

      -  Figure 3E: given that CAP disrupts Nrf2/Keap1- PPI, why is there no Nrf2 stabilization seen in the fourth lane (input/lysate)?

      Thank you for your comment. The fourth lane may promote the degradation of NRF2 due to overexpression of KEAP1.

      -  Figure 3H: high basal Nrf2 levels in unstressed/untreated HEK WT cells, why?

      Thank you for your comment. This is a real experimental result, and we have found in many experiments that the untreated group can also show NRF2 when immunoblotting in 293T cells. We think that this phenomenon may be related to the cell state at that time.

      -  Figure 3G/I: this data suggests to me that the alcohol-mediated toxicity is Keap1-dependent (rather than the protection by CAP), doesn´t it?

      Thank you for your comment. We can see that KEAP1-KO cells had a high expression of NRF2, which was also in line with our expectations, and EtOH-induced GES-1 damage may be closely related to oxidative stress.

      -  Figure 4a: the inclusion of an additional Keap1 binding protein (one with an ETGE motif) would have been desirable (to get information on specificity/risks of off-target (unwanted) effects of CAP). 

      Thank you for your comment. DPP3 with an ETGE motif was detected by BLI, and we found that the K<sub>D</sub> between CAP and DPP3 was 1.653 mM, which may indicate the potential off-target effect of CAP is low (Fig S4h and S4i).

      -  Figure 4D: why is there no stabilization of Nrf2 by CAP in lane 2 ? How can the DTT-mediated boost on Nrf2 levels be explained?

      Thank you for your comment. Multiple experiments have shown that CAP significantly up-regulates NRF2 in the presence of additional stimuli such as EtOH (Figure 1i),  H<sub>2</sub>O<sub>2</sub> (Figure 1l), PS-341 (Figure 2e) and DTT (Figure 4d), which pattern is consistent with our understanding of allosteric regulation and as expected. However, this synergy does warrant more research.

      -  Figure 4f: 5% DMSO is a rather high solvent concentration, why so high (the solvent alone seems to have quite marked effects).

      Thank you for your comment. Because our maximum concentration was set relatively high, we have also recognized relevant problems and resupplemented the more critical Pull-down experiment (Figure 4g). The current DMSO of 0.2% had no effect on the experimental results.

      -  Figure 5: it should be described in the figure legend which mutant is used. Based on the previous data, I would expect an investigation of mutants carrying amino acid exchanges at the newly identified allosteric site.

      Thank you for your comment. The mutated version involved substitutions at residues Y334A, R380A, N382A, N414A, R415A, Y572A, and S602A (the orthostatic site), which are residues reported to engage NRF2 and classic Keap1 inhibitors. The exploration of newly discovered allosteric sites is worthy of further study.

      -  Figure 6/7: I am not expert enough to judge formulations and histology scores. However, the benefit of the encapsulated capsaicin does not become entirely clear to me, as CAP and IRHSA@CAP mostly do not significantly differ in their elicited response.

      Thank you for your comment. On the one hand, nanomedicine improves the safety of administration: it helps to reduce the intense spicy irritation of CAP itself when administered in the stomach; On the other hand, the dosage of drugs is reduced to a certain extent to achieve better therapeutic effect.

      -  Figure 7: rebamipide was introduced as positive control in the text with an activating effect on Nrf2, but there is no induction of hmox and nqo in Figure 7f, why?

      Thank you for your comment. The effect of addition of positive control drug (Rebamipide) on NRF2 activation is not the focus of this paper. We speculate that the transcription and translation of related genes may not be completely synchronized when Rebamipide was taken at the same time.

      -  Figure 8: the CAP effect on inflammation is visible, however, a clear causal connection between ROS/Nrf2/KEap1 is not given in the presented experiments.

      Thank you for your comment. The simple mechanics of this paper are illustrated in the Graphic diagram. The activation of NRF2 exerts both antiinflammatory and antioxidant functions, which has been reported in many articles, but the causal relationship is still open to exploration.

      Points related to presentation:  

      -  The data with the encapsulated CAP appear a little as a sidearm that does not bolster your main message (maybe take out and elaborate on this topic more extensively in another manuscript).

      -  Revise the introduction on the Nrf2 signaling pathway as it is written at the moment, someone outside the Nrf2 field might have trouble understanding it.

      -  The use of language requires proofreading and revision.

      Thank you for your comment. We rearranged and proofread it.

      Reviewer #3 (Recommendations For The Authors):

      Overall, the manuscript is well-written and the results are presented in a concise and comprehensible manner.

      Some recommendations on the experimental evidence and further suggestions:

      • The authors should state how they assessed the distribution of the data. Description of data with mean and standard deviation as well as comparisons between different groups with t-test assumes that the underlying data is normally distributed.

      Your suggestions are very constructive for us to improve the paper.  The differences in the mean values between the two groups were analyzed using the student’s t-test, while the differences among multiple groups were analyzed using a one-way ANOVA test in the GraphPad Prism software.

      Therefore, we checked and proofread the statistical analysis.

      • Additional experiments further characterising and validating the activation of CAP via direct KELCH1-binding could include parallel experiments with similar agonists like dimethyl fumarate. It would be interesting to know how CAP activation compares to DMF activation.

      Thank you very much for your comment. We believe that the activation of NRF2 by DMF has been widely reported and well-studied, so we did not purchase this drug for comparative study here. If it can be promoted clinically in the future, we may consider comparing with DMF.

      • Also, the knock-down of NRF2 would be a suggested experiment to do because it rules out that the benefit of CAP is independent of KEAP1-NRF2 binding and activation.

      Thank you very much for your suggestions. We purchased Nrf2-deficient mice and performed experiments, and the results showed that knockout mice with Nrf2 were more sensitive to ethanol and the effects of CAP were partially eliminated (Figure 9), which further validated the role of Nrf2-related signaling pathway in alcohol-induced gastric mucosal injury and the therapeutic effect of CAP.

      Some corrections on text and figures:

      • Figure 1b: incorrect spelling of DNA stain. Should be Hoechst33324.

      Thank you very much for your comment. We have revised.

      • Figure 1c: don't put the label inside the plot.

      Thank you very much for your comment. We have revised.

      • Figure 1d: choose less verbose axes titles (this also applies to other figures).

      Thank you very much for your comment. We have revised.

      • Figures 1e and 1f: please state the units.

      Thank you very much for your comment. The enzyme activity of SOD and the content of MDA were compared with that of the control group.

      • Heading 2.2: NRF2-ARE instead of NRF-ARE.

      Thank you very much for your comment. We have revised.

      • Line 118: missing expression after immune.

      Thank you very much for your comment. We have revised.

      • Figure 1g: names of proteins are not readable.

      Thank you very much for your comment. We have revised.

      • Line 120: You performed transcriptomic analyses to identify differentially expressed GENES not proteomic.

      Thank you very much for your comment. This part of the work we do is proteomics.

      • Line 122: Fold change should be stated in both directions, i.e. absolute FC like |FC| > 1. Or did you select only upregulated DEGs? Is it not log2 FC?

      Thank you very much for your comment. We have revised.

      • Figure 1h (and Supplementary Figure 1a): Missing heatmap legend for FC.

      What do the colors show? Sample (column) description missing.

      Thank you very much for your comment. We used red to indicate up-regulation, blue to indicate down-regulation, and the vertical coordinate on the right side were antioxidant genes such as GSS and SOD1, respectively, and the proportion between the treatment group and the model group (CAP + EtOH/EtOH) had been calculated and labeled.

      • Line 145: A Western blot is not a proteomic analysis.

      Thank you very much for your comment. We have revised: “Concurrently, the elevated expression levels of GSS and Trx proteins, which were also downstream targets of NRF2, further validated by western blotting (Figure 1j).”

      • Supplementary Figure 2e-j: expression fold change is not the right quantity. The signal of the actual protein was quantified. And what are you comparing to with the statistics? The stars on one bar are not clear.

      Thank you very much for your comment. The expression level of this part was normalized compared with that of the control group. The significance differentiation analysis is compared with the model group.

      • What was the concentration of  H<sub>2</sub>O<sub>2</sub> used?

      Thank you very much for your comment. 200 μM  H<sub>2</sub>O<sub>2</sub> was used.

      • Figure 2d: use a more precise y-axis label.

      Thank you very much for your comment. We do want to compare the amount of NRF2 entering the nucleus, so the relative expression is compared to the internal reference

      • Figure 2g: missing molecular weight markers.

      Thank you very much for your comment. Since the ubiquitination modification is a whole membrane, and only marking the size of HA and GAPDH is not beautiful enough here.

      • Line 221: lactate is the endproduct of the anaerobic glycolytic pathway.

      Thank you very much for your comment. We have revised.

      • Supplementary Figure 3d: should it be PKM2 (instead of PKM) and LDHA (instead of LDH). Should fit with the text in the manuscript.

      Thank you very much for your comment. We have revised.

      • Supplementary Figures 3 e-f: brackets in y-axis labels are too bold.

      Thank you very much for your comment. We have revised.

      • Figures 3a and b. Brackets should only be used if two conditions are being compared statistically. Remove the one line with ns as it could imply that you have compared the first with the last condition only.

      Thank you very much for your comment. We have revised.

      • Consistent labeling of kDa in figures (no capital K in KDa).

      Thank you very much for your comment. We have revised.

      • Figure 4a. Move kDa on top of 70.

      Thank you very much for your comment. We have revised.

      • Figure 3 g-h: Why 2% EtOH. Used 5% previously?

      Thank you very much for your comment. Because here we changed the 293T cell line, 5% EtOH concentration is too high on this cell.

      • Supplementary Figure b-e: correct typo in y-axis label: expression.

      Thank you very much for your comment. We have revised.

      • Figure 4a: correct x-axis label for temperature unit. Too bold. Not readable.

      Add a clear label and unit for y-axis.

      Thank you very much for your comment. We have revised.

      • Figure 4 b-c: should have a legend explaining colors.

      Thank you very much for your comment. Our Figure legend already contains the meaning of colors: “(b) Computational docking of CAP molecule to KEAP1 surface pockets. The Keap1 protein is represented in gray, while the CAP molecule is shown in yellow. The seven key amino acids predicted to be crucial for the interaction are highlighted in blue. (c) Partial overlap of CAPbinding pocket with KEAP1-NRF2 interface. The KEAP1-NRF2 interaction interface is represented in purple.”

      • Supplementary Figure 5a. Add axis units.

      Thank you very much for your comment. We have revised.

      • Figure 4e: Missing b ions value for number 19.

      Thank you very much for your comment. This part is not missing, but corresponds to 19 of y ions.

      • Figure 7f: adjust brackets - they are too bold.

      Thank you very much for your comment. We have revised.

      • Supplementary Figure 8b-i: labels not readable. c should be spleen.

      Thank you very much for your comment. We have revised.

      • Line 787: specify BH adjustment to Benjamini-Hochberg.

      Thank you very much for your comment. We have revised.

      • Check spelling of µl throughout the Methods section e.g. line 854 - shouldn't be "ul".

      Thank you very much for your comment. We have revised.

      • Line 974: correct spelling of species names: E. coli should be in italics.

      Thank you very much for your comment. We have revised all of these corrections on text and figures. For me, the writing of papers will be more rigorous and careful in the future.

    1. Author response:

      We sincerely thank the reviewers for their thorough and constructive evaluation of our manuscript. We particularly appreciate their recognition of our comprehensive characterization approach, which integrates immunohistochemistry, transcriptomics, morphological assessments, and electrophysiology to understand psilocin's effects on human neurons. The reviewers highlighted that our findings closely align with and validate prior work on rat cortical neurons, while importantly extending these insights to human cells. We are encouraged by their acknowledgment that our study demonstrates the value of using iPSC-derived human cortical neurons for testing potentially translatable effects of psychedelic compounds. Their positive assessment of our work's implications for psychedelic drug development is particularly valuable, as it supports our goal of advancing the understanding of these compounds' therapeutic potential and their possible application in treating neuropsychiatric disorders.

      We are also very grateful for the reviewers' constructive criticism which will help strengthen our manuscript significantly. Based on their detailed feedback, we plan to perform several additional experiments for inclusion in the revised manuscript.

      The most important concern raised by both reviewers is about the specificity of the antibody used to detect the expression pattern and abundance of 5-HT2A receptors at the cells' surface. We acknowledge that GPCR antibodies, including those targeting 5-HT2A receptors, can be challenging in terms of specificity and reliability, particularly given the structural similarities within this receptor family. To address these concerns comprehensively, we propose the following systematic validation strategy:

      (1) Cell-Type Specific Expression Analysis: We will systematically evaluate the antibody across different developmental stages and cell lines. The results from the stainings will be correlated with RNA sequencing data to provide quantitative validation of expression patterns. Cell types to be included will be:

      · iPSCs (expected negative)

      · Neural progenitors (expected positive)

      · Mature neurons (expected positive)

      · HEK cells (expected negative) This multi-stage analysis will allow us to track receptor expression through development and verify antibody specificity across distinct cellular contexts.

      (2) Peptide Competition Study: We will perform blocking experiments using the specific peptide sequence against which the antibody was raised. By pre-incubating the antibody with its cognate peptide at established working concentration, followed by detailed documentation of signal reduction in peptide-blocked condition versus standard staining, we can demonstrate binding specificity. This approach will provide direct evidence of antibody selectivity for its intended target.

      (3) Sequence Analysis and Specificity: We will perform a comprehensive protein BLAST analysis of the antigenic peptide sequence, assess potential cross-reactivity with related receptors, and evaluate species conservation and specificity. This in silico approach will complement our experimental validation and help identify any potential off-target binding sites.

      (4) Additional Validation: While technically challenging, we will attempt knockdown studies using siRNA/shRNA approaches to provide additional validation of antibody specificity. This molecular intervention will offer another layer of validation through targeted reduction of the receptor.

      We plan to present these results in a new supplementary figure that will provide a comprehensive overview of our validation efforts. Should we not be able to convincingly demonstrate the specificity of the antibody, we will discuss with the editors and reviewers to modify Figure 1 and exclude critical parts from the manuscript. While we find the results interesting and important to communicate, an omission would not critically impact the key message of the manuscript, which is the structural and molecular changes elicited by psilocin on human neurons. The strength of our multi-modal approach means that our core findings are supported by several independent lines of evidence beyond antibody-based detection.

    1. Author response:

      The following is the authors’ response to the original reviews.

      Public Reviews:

      Reviewer #1 (Public review):

      Summary:

      The authors aimed to quantify feral pig interactions in eastern Australia to inform disease transmission networks. They used GPS tracking data from 146 feral pigs across multiple locations to construct proximity-based social networks and analyse contact rates within and between pig social units.

      Strengths:

      (1) Addresses a critical knowledge gap in feral pig social dynamics in Australia.

      (2) Uses robust methodology combining GPS tracking and network analysis.

      (3) Provides valuable insights into sex-based and seasonal variations in contact rates.

      (4) Effectively contextualizes findings for disease transmission modeling and management.

      (5) Includes comprehensive ethical approval for animal research.

      (6) Utilizes data from multiple locations across eastern Australia, enhancing generalizability.

      Weaknesses:

      (1) Limited discussion of potential biases from varying sample sizes across populations

      This is a really good comment, and we will address this in the discussion as one of the limitations of the study

      (2) Some key figures are in supplementary materials rather than the main text.

      We will move some of our supplementary material to the main text as suggested.

      (3) Economic impact figures are from the US rather than Australia-specific data.

      We included the impact figures that are available for Australia (for FDM), and we will include the estimated impact of ASF in Australia in the introduction.

      (4) Rationale for spatial and temporal thresholds for defining contacts could be clearer.

      We will improve the explanation of why we chose the spatial and temporal thresholds based on literature, the size of animals and GPS errors.

      (5) Limited discussion of ethical considerations beyond basic animal ethics approval.

      This research was conducted under an ethics committee's approval for collaring the feral pigs. This research is part of an ongoing pest management activity, and all the ethics approvals have been highlighted in the main manuscript.

      The authors largely achieved their aims, with the results supporting their conclusions about the importance of sex and seasonality in feral pig contact networks. This work is likely to have a significant impact on feral pig management and disease control strategies in Australia, providing crucial data for refining disease transmission models.

      Reviewer #2 (Public review):

      Summary:

      The paper attempts to elucidate how feral (wild) pigs cause distortion of the environment in over 54 countries of the world, particularly Australia.

      The paper displays proof that over $120 billion worth of facilities were destroyed annually in the United States of America.

      The authors have tried to infer that the findings of their work were important and possess a convincing strength of evidence.

      Strengths:

      (1) Clearly stating feral (wild) pigs as a problem in the environment.

      (2) Stating how 54 countries were affected by the feral pigs.

      (3) Mentioning how $120 billion was lost in the US, annually, as a result of the activities of the feral pigs.

      (4) Amplifying the fact that 14 species of animals were being driven into extinction by the feral pigs.

      (5) Feral pigs possessing zoonotic abilities.

      (6) Feral pigs acting as reservoirs for endemic diseases like brucellosis and leptospirosis.

      (7) Understanding disease patterns by the social dynamics of feral pig interactions.

      (8) The use of 146 GPS-monitored feral pigs to establish their social interaction among themselves.

      Weaknesses:

      (1) Unclear explanation of the association of either the female or male feral pigs with each other, seasonally.

      This will be better explained in the methods.

      (2) The "abstract paragraph" was not justified.

      We have justified the abstract paragraph as requested by the reviewer.

      (3) Typographical errors in the abstract.

      Typographical errors have been corrected in the Abstract.

      Reviewer #3 (Public review):

      Summary:

      The authors sought to understand social interactions both within and between groups of feral pigs, with the intent of applying their findings to models of disease transmission. The authors analyzed GPS tracking data from across various populations to determine patterns of contact that could support the transmission of a range of zoonotic and livestock diseases. The analysis then focused on the effects of sex, group dynamics, and seasonal changes on contact rates that could be used to base targeted disease control strategies that would prioritize the removal of adult males for reducing intergroup disease transmission.

      Strengths:

      It utilized GPS tracking data from 146 feral pigs over several years, effectively capturing seasonal and spatial variation in the social behaviors of interest. Using proximity-based social network analysis, this work provides a highly resolved snapshot of contact rates and interactions both within and between groups, substantially improving research in wildlife disease transmission. Results were highly useful and provided practical guidance for disease management, showing that control targeted at adult males could reduce intergroup disease transmission, hence providing an approach for the control of zoonotic and livestock diseases.

      Weaknesses:

      Despite their reliability, populations can be skewed by small sample sizes and limited generalizability due to specific environmental and demographic characteristics. Further validation is needed to account for additional environmental factors influencing social dynamics and contact rates.

      This is a really good point, and we thank the reviewer for pointing out this issue. We will discuss the potential biases due to sample size in our discussion. We agree that environmental factors need to be incorporated and tested for their influence on social dynamics, and this will be added to the discussion as we have plans to expand this research and conduct, the analysis to determine if environmental factors are influencing social dynamics.

      Recommendations for the authors:

      Reviewer #1 (Recommendations for the authors):

      (1) Consider moving some key figures from supplementary materials to the main text to strengthen the presentation of results.

      We included a new figure to strengthen the presentation of results (Figure 3a-b), which shows the node level measures by sex and for direct and indirect networks.

      (2) Expand discussion of limitations, particularly addressing potential biases from varying sample sizes across populations.

      We added more detail and clarity about this potential bias into the limitation section within the discussion: “Different populations in our study had varying numbers of collared individuals, with some populations having only two individuals at certain times. This variability in sample size across populations is a limitation when interpreting the results. Small populations are often the result of a few individuals being trapped and collared, and this does not necessarily reflect the actual number of individuals in those groups.” Moreover, while reviewing the effect of the potential bias, we found that a General Linear Mixed Effect Model (Table 1) was not optimal for analysing the effect of sex on the network measures, and therefore this analysis has been done again using a non-parametric test (Wilcoxon rank-sum test)  for direct and indirect networks based on a 5 metres threshold (Table 1).

      (3) If available, include Australia-specific economic impact data in the introduction.

      We included the impact figures that are available for Australia (for FDM) in the introduction.

      (4) Clarify the rationale for chosen spatial and temporal thresholds for defining contacts.

      This has been added in the methodology: “Direct contact was defined when two individuals interacted either at 2, 5, or 350-metre buffers within a five-minute interval [36]. A previous study used 350 metres as a spatial threshold [16], while others use the approximate average body length of an individual [36]”

      (5) Consider adding a brief discussion of ethical considerations beyond basic animal ethics approval, addressing aspects like animal welfare during collaring and potential environmental impacts.

      Feral pigs are an invasive species in Australia, and managing their population is crucial to protecting native ecosystems. The trapping and collaring of these animals have been conducted following the stringent animal welfare requirements necessary to obtain animal ethics approval in Australia. However, it is important to consider the broader ethical implications. Animal welfare during collaring is a critical aspect and involves minimising stress and physical harm to the animals. The collars used are lightweight and properly fitted only on adults due to welfare issues collaring juveniles.

      (6) Add a statement about data availability/accessibility.

      The GPS data cannot be shared; however, the R codes will be deposited in GitHub (https://github.com/Tatianaproboste/Feral-Pig-Interactions) and the link has been added in the final version.

      (7) Expand on the implications of seasonal variation in contact rates for disease management strategies in the discussion.

      We have added this information in the discussion: “For example, controlling an outbreak during summer would potentially require more resources than an outbreak in other seasons due to the higher number of contact between individuals during summer.”

      Reviewer #2 (Recommendations for the authors):

      The typographical errors in the abstract to be corrected are:

      (1) Line 22: Remove the "are" before "threaten".

      This has been corrected.

      (2) Line 24: Replace the "to" before "extinction" with "into".

      This has been corrected.

      (3) Line 28: Rephrase the sentence.

      ‘Yet social dynamics are known to vary enormously from place to place, so knowledge generated for example in USA and Europe might not easily transfer to locations such as Australia.’

      (3) Line 29: Insert a "comma" after "Here".

      This has been corrected.

      (4) Lines 33 -34: Explain, clearly, the contact rates; is it between females to females or females to males?

      We have improved this phrase and now it reads: “…. with females demonstrating higher group cohesion (female-female) and males acting as crucial connectors between independent groups.”

      (5) Line 36: Make yourselves clear about what you mean by "targeting adult male".

      We believe “targeting adult males” is correct in this context.

      Reviewer #3 (Recommendations for the authors):

      (1) Line 22 and 44, I think are threaten "are" should be removed for better clarity.

      This has been corrected.

      (2) Line 71, the source and not "force" of infection.

      The force of infection is correct here.

      (3) Line 72, population "of".

      This has been corrected.

      (4) Under statistical analysis, the software version should be included.

      R has changed to multiple versions since we started this analysis.

      (5) Terminological consistency: as far as possible try to be consistent with the terms used in the text, such as using "contact rate" instead of "interaction rate" in order not to puzzle the readers.

      We have changed most of the “interactions” to “contact” instead as suggested.

      (6) Correct Typos: Identify typos and grammatical inconsistencies of any kind, especially in those complex sentences that may be hard to follow.

      The typos have been checked.

      (7) Under the methodology, briefly describe why specific thresholds were chosen and any limitations.

      We added the following into the method: “Direct contact was defined when two individuals interacted either at 2, 5, or 350-metre buffers within a five-minute interval [36]. A previous study used 350 metres as a spatial threshold [16], while others use the approximate average body length of an individual [36]”

      (8) The discussion should be strengthened by drawing clear links between the findings and actionable management strategies.

      We have strengthened the discussion by adding more specific actionable management strategies. For example, controlling an outbreak during summer would potentially require more resources than an outbreak in other seasons due to the higher number of contacts between individuals during summer.

      (9) Did you consider additional environmental factors, such as rainfall, food availability, or habitat features, to better understand how these influence seasonal variations in pig interactions and contact rates?

      This is something that we have in mind and will explore in future research. This has been partially explored but is based on how environmental factors and seasons affect the home range (Wilson et al 2023).

      (10) Figure Legends: Add more detailed descriptions in figure legends, especially for those figures showing network metrics or contact rates.

      More information has been added to the figure legends.

      (11) The paper includes too many figures, and thus, it is recommended to simplify or merge some figures where appropriate. In particular, this is recommended for those figures that plot more network measures across thresholds. Adding clear, summarized captions with interpretation on threshold and measure significance would be a great help in interpreting complicated visualizations.

      The figure that shows the comparison between global network measures, including average local transitivity, edge density, global transitivity, mean distance and number of edges for direct and indirect networks has been moved to supplementary material (Figure S3). We also included direct and indirect model-level measures by sex as in Figure 3 and improved the captions of the figures presented in the main document.

    1. Author response:

      The following is the authors’ response to the original reviews.

      We thank the reviewers for their comments and provide answers /clarifications and new data; There were 3 important recurrent points we already address here: 

      (a) The reviewers were concerned that the observed motor defects (measured by startle induced negative geotaxis- “SING”) where a reasonable behavioral measure of DAN function.

      Previously, Riemensperger et al., 2013 (PMID: 24239353) already linked synaptic loss of the dopaminergic PAM neurons to SING impairments. Furthermore, in a separate paper that we recently posted on BioRxiv, we show that the SING defects in PD mutants are rescued when the flies are fed L-DOPA (Kaempf et al 2024; BioRxiv). In this same paper we also show a very strong correlation between SING defects and defects in dopaminergic synaptic innervation of PAM DAN onto Mushroom body neurons. Both experiments suggest that the motor defects are the result of defects in dopamine release. Altogether, these data suggest that the combination of the SING assay and a quantification of the synaptic region of PAM DAN onto Mushroom body neurons is a suitable measure for DAN function.

      (b) The reviewers asked if the OPN dysfunction in young animals is connected to dopaminergic neuron (DAN) dysfunction in later life; 

      We have conducted additional experiments and have included the results (new Figure 6): Our young PD mutants (we included Aux<sup>R927G</sup>, Synj<sup>R258Q</sup> and LRRK2<sup>G2019S</sup>) show olfactory defects, but normal DAN function (measured by assessing the TH-labeled synaptic area onto the Mushroom body neurons and by SING). Aged PD mutants show both olfactory defects and DAN dysfunction. When we express the wildtype PD gene in (a.o.) OPN of PD mutants using the GH146-Gal4 (that does not drive expression in DAN) we are able to rescue the DAN defects (synaptic area and SING) that occur later in life. This indeed suggests there is a cell non-autonomous positive effect on DAN dysfunction that occurs at later stages in the life of our PD mutants (new Figure 6a). 

      In a set of independent experiments, we also fed one of our mutants (LRRK2<sup>G2019S</sup>) nicotine, activating Nicotinic acetylcholine receptors (that are also activated by the release of acetylcholine from cholinergic neurons such as OPN). While nicotine does not rescue the olfactory preference defect, the OPN synapse morphology defect or the OPN-associated defects in Ca<sup>2+</sup>-imaging in LRRK2<sup>G2019S</sup> mutants (Figure 6b), it does rescue the DAN-associated defects, including SING, synapse loss and defects in Ca<sup>2+</sup>-imaging (Figure 6c).

      Finally, we generated human induced dopaminergic neurons derived from iPSC with a LRRK2<sup>G2019S</sup> mutation and incubated these neurons with nicotine. Again, this induced a rescue of a LRRK2-mutant-induced defect in neuronal activity measured by Ca<sup>2+</sup>-imaging. This is specific to nicotine since the rescue was absent when cells were also incubated with mecamylamine, a non-competitive antagonist of nicotinic acetylcholine receptors, trumping the effects of nicotine (Figure 6d-e").

      (c) The reviewers indicated that the GH146 Gal 4 driver is expressed in other cells than OPN and thus, they noted that the defects we observe may not only be the result of OPN dysfunction. 

      It is correct that GH146-dependent Gal expression includes OPNs (that are cholinergic) and one pair of inhibitory APL neurons (that are GABAergic) (Li et al., 2017 (PMID: 29149607), Lui et al., 2009 (PMID: 19043409)). We have adapted the text to explicitly state this. There are only 2 APL per fly brain and our single cell sequencing experiment does not have the resolution to allow us to test if these neurons had a significant number of DEG. However, as indicated above (in (b)), we are able to rescue DAN dysfunction by mimicking cholinergic output (application of nicotine). These data do not exclude that APL-neuron problems contribute to the defects we observe in our PD mutants, but they do suggest that cholinergic output is critical to maintain normal DAN function.

      Public Reviews:  

      Reviewer #1 (Public Review):  

      This is a fantastic, comprehensive, timely, and landmark pan-species work that demonstrates the convergence of multiple familial PD mutations onto a synaptic program. It is extremely well written and I have only a few comments that do not require additional data collection. 

      Thank you for this enthusiastic endorsement.

      Major Comments:  

      neurons and the olfactory system are acutely impacted by these PD mutations. However, I wonder if this is the case:  

      (1) In the functional experiments performing calcium imaging on projection neurons I could not find a count of cell bodies across conditions. Since the loss of OPNs could explain the reduced calcium signal, this is a critical control to perform. A differential abundance test on the single-cell data would also suffice here and be easy for the authors to perform with their existing data. 

      This is indeed an important number, and we had included this in the Supplemental figure 2a.

      Also, the number of DAN and Visual projection neurons were not significantly different between the genotypes (Supplemental Figure 2a in the manuscript). 

      (2) One of the authors' conclusions is that cholinergic

      a. Most Drosophila excitatory neurons are cholinergic

      and only a subpopulation appear to be dysregulated by these mutations. The authors point out that visual neurons also have many DEGs, couldn't the visual system also be dysregulated in these flies? Is there something special about these cholinergic neurons versus other cholinergic neurons in the fly brain? I wonder if they can leverage their nice dataset to say something about vulnerability. 

      Yes, the reviewer is right, and we have changed our wording to be more specific. The reviewer also noted correctly that neurons in the visual system rank high in terms of number of DEGs, but we did not conduct elaborate experiments to assess if these visual system neurons are functional. Of note, several of our mutants show (subtle) electroretinogram defects, that are a measure of visual system integrity, but further work is needed to determine the origin of these defects. 

      The question about the nature of the underlying vulnerability pathways is interesting. In preliminary work we have selected a number of DEGs common to vulnerable cells in several PD mutants, and conducted a screen where we manipulated the expression of these DEGs and looked for rescue of the olfactory preference defects in our PD mutants. The strongest genetic interaction was with genes encoding proteins involved in proteostasis (Atg8/LC3, Lamp1 and Hsc70-4) (Reviewer Figure 3). While interesting, these results require further work to understand the underlying molecular mechanisms. We present these preliminary data here but have not included them in the main manuscript. 

      b. As far as I can tell, the cross-species analysis of DEGs (Figure 3) is agnostic to neuronal cell type, although the conclusion seems to suggest only cholinergic neurons were contrasted. Is this correct? Could you please clarify this in the text as it's an important detail. If not, Have the authors tried comparing only cholinergic neuron DEGs across species? That would lend strength to their specificity argument. The results for the NBM are impressive. Could the authors add more detail to the main text here about other regions to the main text? 

      The reviewer is correct that we compiled the DEG of all affected cells, the majority of which are cholinergic neurons. 

      For the human data we focused on the NBM samples, because it contained the highest fraction of cholinergic neurons (as compared to the other 2 regions), but even so, it was not possible to analyze the cholinergic neurons alone because the fraction of cholinergic neurons in the human material was too low to be statistically analyzed independently. Note that both wildtype and PD samples contained a low number of cholinergic neurons (i.e. the DEG differences we detected were not the result of sequencing different types of cells - see also Supplemental Figure 3b and d). We have indicated this more clearly in the text.

      c. Uniquely within the human data, are cholinergic neurons more dysregulated than others? I understand this is not an early timepoint but would still be useful to discuss. 

      As indicated in the previous point, unfortunately the fraction of cholinergic neurons in the human material was low and we were not able to analyze these cells on their own. 

      Author response image 1.

      Upregulation of protein homeostasis rescues hyposmia across familial models of PD. Results of a behavioral screen for cell-specific rescue of olfactory preference defects of young PD fly models using up and downregulation of deregulated genes in affected cell types. Genes implicated in the indicated pathways are over expressed or knocked down using GH146-Gal4 (OPN>) and UAS-constructs (over expression or RNAi) . UAS-only (-) and OPN>UAS (+) were scored in parallel and are compared to each other. n.d. not determined; Bars represent mean ± s.e.m.; grey zone indicates the variance of controls; n≥5 independent experiments per genotype, with ~50 flies each; red bars: p<0.05 in ANOVA and Bonferroni-corrected comparison to UAS-only control.

      d. In the discussion, the authors say that olfactory neurons are uniquely poised to be dysregulated as they are large and have high activity. Is this really true compared to other circuits? I didn't find the references convincing and I am not sure this has been borne out in electron microscopy reconstructions for anatomy.  

      We agree and have toned down this statement.

      Reviewer #2 (Public Review):  

      Summary:  

      Pech et al selected 5 Parkinson's disease-causing genes, and generated multiple

      Drosophila lines by replacing the Drosophila lrrk, rab39, auxilin (aux), synaptojanin

      (synj), and Pink1 genes with wild-type and pathogenic mutant human or Drosophila cDNA sequences. First, the authors performed a panel of assays to characterize the phenotypes of the models mentioned above. Next, by using single-cell RNA-seq and comparing fly data with human postmortem tissue data, the authors identified multiple cell clusters being commonly dysregulated in these models, highlighting the olfactory projection neurons. Next, by using selective expression of Ca<sup>2+</sup>-sensor GCaMP3 in the OPN, the authors confirmed the synaptic impairment in these models, which was further strengthened by olfactory performance defects.  

      Strengths:  

      The authors overall investigated the functionality of PD-related mutations at endogenous levels and found a very interesting shared pathway through singlecell analysis, more importantly, they performed nice follow-up work using multiple assays.  

      Weaknesses:  

      While the authors state this is a new collection of five familial PD knock-in models, the Aux<sup>R927G</sup> model has been published and carefully characterized in Jacquemyn et al., 2023. ERG has been performed for Aux R927G in Jacquemyn et al., 2023, but the findings are different from what's shown in Figure 1b and Supplementary Figure 1d, which the authors should try to explain. 

      We should have explained this better: the ERG assay in Jacquemyn et al., and here, in Pech et al., are different. While the ERGs in our previous publication were recorded under normal endogenous conditions, the flies in our current study were exposed to constant light for 7 days. This is often done to accelerate the degeneration phenotype. We have now indicated this in the text (and also refer to the different experimental set up compared to Jacquemyn et al).

      Moreover, according to the authors, the hPINK1control was the expression of human PINK1 with UAS-hPINK1 and nsyb-Gal4 due to technical obstacles. Having PINK1 WT being an overexpression model, makes it difficult to explain PINK1 mutant phenotypes. It will be strengthened if the authors use UAS-hPINK1 and nsyb-Gal4 (or maybe ubiquitous Gal4) to rescue hPink1L347P and hPink1P399L phenotypes.

      The UAS-hPink1 was originally created by the Lu lab (Yang et al., 2003, PMID: 12670421) and has been amply used before in Pink1 loss-of-function backgrounds (e.g. in Yang et al., 2006, PMID: 16818890). In our work, the control we refer to was UAS-hPink1 expression (driven by nSyb-gal4) in a Pink1 knock-out background. For unknown reasons we were unable to replace the fly Pink1 with a human pink1 cDNA, we explained this in the methods section and added a remark in the new manuscript.

      In addition, although the authors picked these models targeting different biology/ pathways, however, Aux and Synj both act in related steps of Clathrin-mediated endocytosis, with LRRK2 being their accessory regulatory proteins. Therefore, is the data set more favorable in identifying synaptic-related defects? 

      We picked these particular mutants, as they were the first we created in the context of a much larger collection of “PD flies” (see also Kaempf et al 2024, BioRxiv). We have made adaptations to the text to tone down the statement on the broad selection of mutants. 

      GH146-GAL4+ PNs are derived from three neuroblast lineages, producing both cholinergic and GABAergic inhibitory PNs (Li et al, 2017). Therefore, OPN neurons have more than "cholinergic projection neurons". How do we know from singlecell data that cholinergic neurons were more vulnerable across 5 models? 

      The reviewer is correct that GH146 drives expression in other cells than OPN and we now clearly state this in the text. We do present additional arguments that substantiate our conclusion that cholinergic neurons are affected: (1) our single cell sequencing identifies the most DEGs in cholinergic neurons. (2) nicotine (a compound activating cholinergic receptors) rescues dopamine-related problems in old PD-mutant flies. (3) Likewise, nicotine also alleviates problems we observed in LRRK2 mutant human induced dopaminergic neurons and this is blocked by mecamylamine, a non-competitive antagonist of nicotinic acetylcholine receptors.

      In Figure 1b, the authors assumed that locomotion defects were caused by dopaminergic neuron dysfunction. However, to better support it, the author should perform rescue experiments using dopaminergic neuron-specific Gal4 drivers. Otherwise, the authors may consider staining DA neurons and performing cell counting. Furthermore, the authors stated in the discussion, that "We now place cholinergic failure firmly ahead of dopaminergic system failure in flies", which feels rushed and insufficient to draw such a conclusion, especially given no experimental evidence was provided, particularly related to DA neuron dysfunction, in this manuscript. 

      Previously, Riemensperger et al., 2013 (PMID: 24239353) already linked synaptic loss of the dopaminergic PAM neurons to locomotion impairments (measured by SING). Furthermore, in a separate paper we show that the motor defects (SING) observed in PD mutants are rescued when the flies are fed L-DOPA, but not D-DOPA (Kaempf et al 2024; BioRxiv). In this same paper, we also show a significant correlation between SING defects and defects in dopaminergic synaptic innervation of PAM DAN onto Mushroom body neurons. We have referred to both articles in the revised manuscript.

      The statement on cholinergic failure ahead of dopaminergic failure was made in the context of the sequence of events: young flies did not show DAN defects, but they did display olfactory defects. The statement was indeed not meant to imply causality. However, we have now conducted new experiments where we express wild type PD genes using GH146-Gal4 (that does not express in DAN) in the PD mutants and assess dopaminergic-relevant phenotypes later in life (see also new Figure 6 in the manuscript). This shows that GH146Gal4-specific rescue is sufficient to alleviate the DAN-dependent SING defects in old flies. Likewise, as indicated above, application of nicotine is also sufficient to rescue the DAN-associated defects (in PD mutant flies and human induced mutant dopaminergic neurons).  

      It is interesting to see that different familial PD mutations converge onto synapses. The authors have suggested that different mechanisms may be involved directly through regulating synaptic functions, or indirectly through mitochondria or transport. It will be improved if the authors extend their analysis on Figure 3, and better utilize their single-cell data to dissect the mechanisms. For example, for all the candidates listed in Figure 3C, are they all altered in the same direction across 5 models?  

      This is indeed the case: the criteria for "commonly deregulated" included that the DEGs are changed in the same direction across several mutants. We ranked genes according to their mean gene expression across the mutants as compared it to the wildtype control: i.e. only if the DEGs are all up- or all down-regulated they end up on the top or bottom of our list. We added a remark in the revised manuscript. In preliminary work we also selected a number of the DEGs and conducted a screen where we manipulated the expression of these genes looking for rescue of the olfactory preference defects in our PD mutants. The strongest genetic interaction was with genes encoding proteins involved in proteostasis (Atg8/LC3, Lamp1 and Hsc70-4; and we also show a genetic interaction between EndoA and Lrrk in this work and in Matta et al., 2012) (Author response image 1 above). While interesting, these results require further work to understand the underlying molecular mechanisms. We present these preliminary data here, but have not included them in the main manuscript. 

      While this approach is carefully performed, the authors should state in the discussions the strengths and the caveats of the current strategy. For example, what kind of knowledge have we gained by introducing these mutations at an endogenous locus? Are there any caveats of having scRNAseq at day 5 only but being compared with postmortem human disease tissue?  

      We have included a “strengths and caveats section” in the discussion addressing these points.

      Reviewer #3 (Public Review):  

      Summary:  

      This study investigates the cellular and molecular events leading to hyposmia, an early dysfunction in Parkinson's disease (PD), which develops up to 10 years prior to motor symptoms. The authors use five Drosophila knock-in models of familial PD genes (LRRK2, RAB39B, PINK1, DNAJC6 (Aux), and SYNJ1 (Synj)), three expressing human genes and two Drosophila genes with equivalent mutations.  

      The authors carry out single-cell RNA sequencing of young fly brains and singlenucleus RNA sequencing of human brain samples. The authors found that cholinergic olfactory projection neurons (OPN) were consistently affected across the fly models, showing synaptic dysfunction before the onset of motor deficits, known to be associated with dopaminergic neuron (DAN) dysfunction.  

      Single-cell RNA sequencing revealed significant transcriptional deregulation of synaptic genes in OPNs across all five fly PD models. This synaptic dysfunction was confirmed by impaired calcium signalling and morphological changes in synaptic OPN terminals. Furthermore, these young PD flies exhibited olfactory behavioural deficits that were rescued by selective expression of wild-type genes in OPNs.  

      Single-nucleus RNA sequencing of post-mortem brain samples from PD patients with LRRK2 risk mutations revealed similar synaptic gene deregulation in cholinergic neurons, particularly in the nucleus basalis of Meynert (NBM). Gene ontology analysis highlighted enrichment for processes related to presynaptic function, protein homeostasis, RNA regulation, and mitochondrial function.  

      This study provides compelling evidence for the early and primary involvement of cholinergic dysfunction in PD pathogenesis, preceding the canonical DAN degeneration. The convergence of familial PD mutations on synaptic dysfunction in cholinergic projection neurons suggests a common mechanism contributing to early non-motor symptoms like hyposmia. The authors also emphasise the potential of targeting cholinergic neurons for early diagnosis and intervention in PD.  

      Strengths:  

      This study presents a novel approach, combining multiple mutants to identify salient disease mechanisms. The quality of the data and analysis is of a high standard, providing compelling evidence for the role of OPN neurons in olfactory dysfunction in PD. The comprehensive single-cell RNA sequencing data from both flies and humans is a valuable resource for the research community. The identification of consistent impairments in cholinergic olfactory neurons, at early disease stages, is a powerful finding that highlights the convergent nature of PD progression. The comparison between fly models and human patients' brains provides strong evidence of the conservation of molecular mechanisms of disease, which can be built upon in further studies using flies to prove causal relationships between the defects described here and neurodegeneration.  

      The identification of specific neurons involved in olfactory dysfunction opens up potential avenues for diagnostic and therapeutic interventions.  

      Weaknesses:  

      The causal relationship between early olfactory dysfunction and later motor symptoms in PD remains unclear. It is also uncertain whether this early defect contributes to neurodegeneration or is simply a reflection of the sensitivity of olfactory neurons to cellular impairments. The study does not investigate whether the observed early olfactory impairment in flies leads to later DAN deficits. Additionally, the single-cell RNA sequencing analysis reveals several affected neuronal populations that are not further explored. The main weakness of the paper is the lack of conclusive evidence linking early olfactory dysfunction to later disease progression.

      We agree that this is an interesting avenue to pursue and as indicated above in Figure 6 and in the reworked manuscript, we have now included data that strengthens the connection between early OPN defects and the later DAN dependent problems. Additional future work will be needed to elucidate the mechanisms of this cell-non autonomous effect. 

      The rationale behind the selection of specific mutants and neuronal populations for further analysis could be better qualified. 

      We have added further explanation in the reworked text.

      Recommendations for the authors:

      Reviewer #1 (Recommendations For The Authors):  

      Minor Comments:  

      (1) Questions about the sequencing methods and analysis approaches. From reading the methods and main text, I was confused about aspects of the Drosophila single-cell profiling. Firstly, did the authors multiplex their fly samples? 

      No, we did not. Genotypes were separately prepared and sequenced, but they were all processed in parallel to avoid batch effects. 

      Secondly, it seems like there are two rounds of dataset integration performed, Harmony and Seurat's CCA-based method. This seems unorthodox. Could the authors comment on why they perform two integrations? 

      Thanks for pointing this out, this was a mistake in the methods section (copied from a much older version of the manuscript). In this manuscript, we only used harmony for dataset integration and removed the methods on Seurat-CCA. 

      Finally, for all dataset integrations please state in the main text how datasets were integrated (by age, genotype, etc). 

      Datasets were integrated by sample id, corresponding to individual libraries.

      (2) The authors focus on OPNs with a really nice set of experiments. I noticed however that Kenyon cells were also dysregulated. What about Olfactory sensory neurons? Could the authors provide comments on this? 

      Olfactory sensory neurons are located in the antennae of the fly brain and were not captured by our analysis. However, the GH146-Gal4-specific rescue experiments indicate these sensory neurons are likely not severely functionally impaired. Kenyon cells are an interesting affected cell type to look at in future experiments, as they are directly connected to DANs.

      (3) There are several citations of Jenett et al 2012 that seem wrong (related to single-cell datasets).

      We are sorry for this and have corrected this in the text.  

      Reviewer #2 (Recommendations For The Authors):  

      (1) In the key resources table, a line called CG5010k.o. (chchd2k.o.) was mentioned, but was not used in the paper. The authors should remove it. 

      Sorry, this was from a previous older version of the manuscript. We fixed this.

      (2) Why did the authors use human CDS for LRRK2, Rab39B, and PINK1, but fly CDS for Aux and Synj1? Is it based on the conservation of amino acid residues? Although the authors cited a review (Kalia & Lang, 2015) to justify the selection of the mutations, for the interest of a broad audience, it is recommended that the authors expand their introduction for the rationale of their selection, including the pathogenicity of each selected mutation, original human genetics evidence, conservation between fly and human. 

      (a) We used Drosophila cDNA for rescue experiments with aux and synj since knockin of the human homologues at the locus of these genes did not rescue its loss-offunction (lethality). 

      (b) We expanded the introduction to provide further explanation on the selection of our mutants we analyzed in this work. We picked these particular mutants, as they were the first we created in the context of a much larger collection of “PD flies” (see also Kaempf et al 2024, BioRxiv). We have made adaptations to the text to tone down the statement on the broad selection of mutants. 

      (3) Supplemental Figure 1a, is mRNA level normalized to an internal control? If not, it is not appropriate to compare the results directly from two primer sets, since each primer set may have different amplification efficiency. 

      We are sorry for the lack of information. Indeed, mRNA levels were determined using the Δ-Δ-CT method, where Ct values were first normalized to the housekeeping gene Rp49, and next expressed as a percent of endogenous Drosophila gene expression. We expanded the methods section and now also enlist the primers for Rp49 along with the other qPCR primers in Supplemental File 1.

      (4) For Figure 2, it may be helpful to have a supplemental table or figure showcasing the clusters with significant changes (based on cell number-adjusted DEGs) for each model, i.e., what are those black cell clusters in Figure 2? "Thus, cellular identity and cellular composition are preserved in young PD fly models." In Figure S2A, the authors only show cell composition percentages for 3 cell clusters, are the bars 95% standard error? 

      The error bars in Supplemental Figure 2a represent the 95 % CI. We have included a new supplemental table with the number of cells per cell cluster for each mutant (Supplemental File 3).

      What about the remaining 183 cell clusters? Are there any KI-model cell clusters that are statistically different than controls? What about the annotated cell types (e.g., the 81 with cell identities)? Please consider at least providing or pointing to a table to state how many have significant differences, or if there are truly none. 

      As mentioned above, we have included a new supplemental table with the number of cells per cell cluster for each mutant (Supplemental File 3).

      (5) What are the rows in the sunburst plot in Figure 3a? Please be more descriptive in the figure legend or label the figure. 

      We have expanded on this in the figure legend and now also include a summary of the SynGO analysis in Supplemental File 7. In Figure 3a, a summary sunburst plot is presented, reflecting the GO terms (inner rings, indicated in a) with their subdivided levels (the complete list is provided in Supplemental File 7). In Figure 3a’ and a” the DEG data acquired from the different datasets (human vs fly) are applied to the sunburst plot where rings are color-coded according to enrichment Q-value.

      (6) In Table S4, which clusters (in the table) have normalized residuals that are outside of the 95% confidence interval of the regression model displayed in Figure S2e? They use this analysis to adjust for cell number bias and point out the "most significant cell clusters" affected in each model. This may be helpful for readers who want to grab a full list of responsive clusters. 

      We have included this information in Supplemental File 5 (Tab “Cell types outside of CIs”) in the supplemental data of the manuscript.

      (7) The human samples used all have different LRRK2 variants: for the crossspecies comparisons, do Lrrk flies have greater similarity to the human PD cases compared to the other fly models?

      No, comparing the vulnerable gene signatures from each of the fly mutants to the DEGs from the human samples does not show any greater similarity between the LRRK mutants compared to the other mutants.

      Reviewer #3 (Recommendations For The Authors):  

      Clarifications required:  

      Some of the mutations used are not common PD-associated genes, the authors should explain the rationale behind using these particular mutants, and not using well-established fly models of PD (like for example GBA flies) or SNCA overexpression.

      We opted to use knock-ins of mutations that are causal to Parkinsonism. Given flies do not express an alpha-synuclein homologue we were not able to add this ‘as such’ to our collection. Future work can indeed also include expression models or risk factor models (like GBA). As also requested by another reviewer, we did add further rationale and explanation to the genes we chose to analyze in this work.

      Why starvation rather than lifespan for PD models? For the lifespan data shown there are no error bars, if the stats test is a log-rank or Cox proportional hazards (usually used in survival analysis, this should be stated), it would also be good to have the survival plots for all the survival during starvation, not just PINK1. 

      While starvation assays can provide valuable insights into acute metabolic and physiological stress responses, we acknowledge that lifespan is a critical parameter and would provide a more comprehensive understanding of the PD models in our study. Based on this consideration and the reviewer’s feedback we have removed the starvation data from the manuscript. Unfortunately, we did not perform lifespan experiments, which is why these data were not included in the manuscript. However, based on our observations (though not detailed analysis), all genotypes tested—except for the PINK1 mutants—appeared to have a normal lifespan. For PINK1 mutants, most flies died by 25 days of age. Therefore, we conducted our assays using 15-day-old PINK1 mutant flies.

      Do the fly models used have different lifespans, and how close to death was the SING assay performed? Different mutations show different effects, most phenotypes are really mild (hRab39BG192R has no phenotype), and PINK1 has the strongest, are these simply reflections of how strong the model is?  

      The ages of flies we analyzed are indicated in the legend. As mentioned before, all but PINK1 mutants- had a normal life span: i.e. we did not detect abnormal low number of flies or premature death at 50 days of age, except for the PINK1 mutants tested in this manuscript where most flies died by 25 days of age. Therefore, we conducted our assays using 15-day-old PINK1 mutant flies.

      Rab39G192R has no phenotype in the tests presented, suggesting no degeneration, why use RabG192R for scRNA seq? Seems an odd choice, the authors should explain. 

      Single-cell sequencing was initiated before the full phenotypic characterization of all mutants was completed. Although basic characterization of the Rab39<sup>G192R</sup> mutant PD flies revealed either no significant phenotypes or only mild effects in the assays performed (Figure 1), the sequencing data provided additional insights into potential cellular and molecular alterations. Furthermore, all PD-mutant knock-ins, including Rab39<sup>G192R</sup> mutant PD flies, show dysfunctional synaptic terminals of their OPN neurons as they had significantly weaker Ca<sup>2+</sup>-responses, even though their synaptic area was increased (Figure 4 g-h). Furthermore, all mutants also had olfactory behavior defects (Figure 5 a). 

      When the authors state that “For example, in the NBM, an area associated with PD (Arendt et al., 1983), 20% of the DEG that has an orthologous gene in the fly are also found among the most deregulated genes across PD fly models" a test should be performed to confirm this is a significant overlap (such as a hypergeometric test). 

      We have performed this test, of the 2486 significantly differential human genes, 1149 have a fly orthologue, and of these, 28.46 % overlap with the deregulated fly genes (5 % top and bottom gene as shown in Supplemental Table 7). Performing a hypergeometric test confirms that this overlap is significant, with a p-value of 9.06e<sup>76</sup>. We have included this in the text.

      The authors speak of deregulation when speaking of the overlap between human and fly DE genes, but do the over-expressed genes in flies overlap with overexpressed genes in humans, or is the direction of transcription deregulation not concordant? If it is mostly not concordant, can the authors please comment as to why they might think that is the case? 

      In our fly experiments, we identified DEG in affected cell types and then defined common DEG by looking at the average change across the fly mutants. Genes that show a consistent change (all or mostly up, or all or mostly down) in the different mutants will end at the top of our list while genes that are up in some mutants and downregulated in others will average out and not end up in our commonly deregulated gene list. For comparison to the human data, we only looked for the presence of the human homologue, but did not assess if the change occurred in the same direction. More work will be needed to define the most relevant changes, but in a mini-screen we did select a number of DEG present in fly and human datasets from different functional categories and tested if they genetically interact with our PD mutants. As shown in Reviewer Figure 3, we find that modulating proteostasis pathway-encoding genes rescue the olfactory preference defect across many PD mutants. 

      Can the authors explain why only the NMB region was used for comparison with the fly data?  

      We used the NMB because this region has the highest number of cholinergic neurons to compare the deregulation in those neurons to the deregulation in the cholinergic OPN of mutant PD flies.

      In Figure 4, can the genotypes please be stated in full and why is the hPINK1 fly giving no detectable signal? 

      Despite several attempts, we failed to knock-in wild type hPink1 in the fly pink1 locus. Therefore, the hPink1 control used throughout the manuscript was the nSybGal4>UAS-hPink1 in Pink1 knock-out background, except for Figure 4. Particularly, for experiments in this figure, we could not use UAS-hPink1 with nSyb-Gal4, since we needed OPN-specific expression of Gal4 to drive UAS-GCamP expression.

      Therefore, this was labeled as “not determined” (“n.d.”), as indicated in the figure and the legend. We explained this better in the methods section, added a remark in the new manuscript and expanded the legend of Figure 4.

      The paper states that" These findings imply that factors affecting the function of cholinergic neurons might, by the absence of insufficient innervation, lead to DAN problems and degeneration, warranting further exploration of the underlying molecular mechanisms", this should be less strong, the paper never looks at DAN, only at OPN neurons. Fly neurons are mostly cholinergic, and human neurons are mostly glutamatergic, so jumping from one system to the other might not be as straightforward, the authors should comment on this. 

      We now included a new exciting experiment where we assessed DAN function in aged PD mutants where the wildtype gene was expressed in OPN using GH146-Gal4. We find this manipulation rescued DAN defects (measured by SING) in older flies. We further corroborated our observation by “replacing” cholinergic innervation with nicotine feeding in PD mutants. Also, this rescues the SING defect as well as the defects in neuronal activity in PAM DAN (based on live synaptic calcium imaging). Finally, we also show that incubating LRRK2<sup>G2019S</sup> mutant human induced dopaminergic neurons with nicotine is sufficient to rescue functional defects in these neurons (measured using calcium imaging). We included this data in the new manuscript and show them also in Figure 6 above (new Figure 6 in the revised manuscript). 

      Experiments that would improve the manuscript:  

      Does rescue of OPN function also rescue later progressive symptoms (geotaxis response)?  

      It does, as indicated in the previous point and shown in Figure 6.

      Do the fly PD models used show DAN degeneration? This could be assessed by stains with anti-TH stains. 

      We quantified DAN cell bodies using anti-TH, but see very little or no loss. There is, however, loss of synaptic innervation of the PAM onto the mushroom bodies. We included the data in a new Figure 6 (see also Figure 6). Furthermore, we have quantified this across the genetic space of familial Parkinsonism in Kaempf et al., 2024, BioRxiv. Note that this phenotype is also rescued by expressing wildtype CDS in their OPN using GH146-Gal4.

      Minor issues: 

      The final sentence on page 5 is repetitive with the introduction. 

      Indeed, we removed the redundant sentence.

      First line of the new section on page 6, the authors probably mean cholinergic olfactory projection neurons, not just cholinergic neurons. 

      Yes, and corrected.

      At the top of page 7 the authors state: "Additionally, we also found enrichment of genes involved in RNA regulation and mitochondrial function that are also important for the functioning of synaptic terminals", where is the data showing this? The authors should point to the supplemental file showing this.  

      We now included a reference to Supplemental File 7 that includes a summary of those data. Additionally, we also included references to back this claim.

      Just before the discussion, Rab39BG193R should be Rab39BG192R.  

      Sorry for this, it is now corrected.

      Stating "fifth row" in Fig 5c and d is confusing, can the figure be labelled more clearly?  

      We modified the figure (including extra marks and colors) and expanded the legend and the main text to differentiate better between expression of the rescues in OPN versus T1 neurons revealing that only expression in OPN neurons rescues the olfactory defects while expression in T1 neurons does not.

      In the methods, the authors describe clustering done both in Scanpy and Seurant, why were both run? Which clustering was used for further analysis?

      We only used Scanpy with Harmony and removed the methods on Seurat-CCA. Thanks for pointing this out, this was a mistake in the methods section (copied from a previous version of the manuscript).

    1. Author response:

      The following is the authors’ response to the original reviews.

      Public Reviews:

      Reviewer #1 (Public Review):

      Vision is a highly active process. Humans move their eyes 3-4 times per second to sample information with high visual acuity from our environment, and where eye movements are directed is critical to our understanding of active vision. Here, the authors propose that the cost of making a saccade contributes critically to saccade selection (i.e., whether and where to move the eyes). The authors build on their own recent work that the effort (as measured by pupil size) that comes with planning and generating an eye movement varies with saccade direction. To do this, the authors first measured pupil size for different saccade directions for each participant. They then correlated the variations in pupil size obtained in the mapping task with the saccade decision in a free-choice task. The authors observed a striking correlation: pupil size in the mapping task predicted the decision of where to move the eyes in the free choice task. In this study, the authors provide a number of additional insightful analyses (e.g., based on saccade curvature, and saccade latency) and experiments that further support their claim that the decision to move the eyes is influenced by the effort to move the eyes in a particular direction. One experiment showed that the same influence of assumed saccade costs on saccade selection is observed during visual search in natural scenes. Moreover, increasing the cognitive load by adding an auditory counting task reduced the number of saccades, and in particular reduced the costly saccades. In sum, these experiments form a nice package that convincingly establishes the association between pupil size and saccade selection.

      We thank the reviewer for highlighting the novelty and cogency of our findings.

      In my opinion, the causal structure underlying the observed results is not so clear. While the relationship between pupil size and saccade selection is compelling, it is not clear that saccade-related effort (i.e., the cost of a saccade) really drives saccade selection. Given the correlational nature of this relationship, there are other alternatives that could explain the finding. For example, saccade latency and the variance in landing positions also vary across saccade directions. This can be interpreted for instance that there are variations in oculomotor noise across saccade directions, and maybe the oculomotor system seeks to minimize that noise in a free-choice task. In fact, given such a correlational result, many other alternative mechanisms are possible. While I think the authors' approach of systematically exploring what we can learn about saccade selection using pupil size is interesting, it would be important to know what exactly pupil size can add that was not previously known by simply analyzing saccade latency. For example, saccade latency anisotropies across saccade directions are well known, and the authors also show here that saccade costs are related to saccade latency. An important question would be to compare how pupil size and saccade latency uniquely contribute to saccade selection. That is, the authors could apply the exact same logic to their analysis by first determining how saccade latencies (or variations in saccade landing positions; see Greenwood et al., 2017 PNAS) vary across saccade directions and how this saccade latency map explains saccade selection in subsequent tasks. Is it more advantageous to use one or the other saccade metric, and how well does a saccade latency map correlate with a pupil size map?

      We thank the reviewer for the detailed comment. 1) The reviewer first points out the correlational nature of many of our results. Thereafter, 2), the reviewer asks whether saccade latencies and landing precision also predict saccade selection, and could be these potential predictors be considered alternative explanations to the idea of effort driving saccade selection? Moreover, what can pupil size add to what can be learned from saccade latency?

      In brief, although we report a combination of correlational and causal findings, we do not know of a more parsimonious explanation for our findings than “effort drives saccade selection”. Moreover, we demonstrate that oculomotor noise cannot be construed as an alternative explanation for our findings.

      (1) Correlational nature of many findings.

      We acknowledge that many of our findings are predominantly correlational in nature. In our first tasks, we correlated pupil size during saccade planning to saccade preferences in a subsequent task. Although the link between across tasks was correlational, the observed relationship clearly followed our previously specified directed hypothesis. Moreover, experiments 1 and 2 of the visual search data replicated and extended this relationship. We also directly manipulated cognitive demand in the second visual search experiment. In line with the hypothesis that effort affects saccade selection, participants executed less saccades overall when performing a (primary) auditory dual task, and even cut the costly saccades most – which actually constitutes causal evidence for our hypothesis. A minimal oculomotor noise account would not directly predict a reduction in saccade rate under higher cognitive demand. To summarize, we have a combination of correlational and causal findings, although mediators cannot be ruled out fully for the latter. That said, we do not know of a more fitting and parsimonious explanation for our findings than effort predicting saccade selection (see following points for saccade latencies). We now address causality in the discussion for transparency and point more explicitly to the second visual search experiment for causal evidence.

      “We report a combination of correlational and causal findings. Despite the correlational nature of some of our results, they consistently support the hypothesis that saccade costs predicts saccade selection [which we predicted previously, 33]. Causal evidence was provided by the dual-task experiment as saccade frequencies - and especially costly saccades were reduced under additional cognitive demand. Only a cost account predicts 1) a link between pupil size and saccade preferences, 2) a cardinal saccade bias, 3) reduced saccade frequency under additional cognitive demand, and 4) disproportional cutting of especially those directions associated with more pupil dilation. Together, our findings converge upon the conclusion that effort drives saccade selection.”

      (2) Do anisotropies in saccade latencies constitute an alternative explanation?

      First of all, we would like to to first stress that differences in saccade latencies are indeed thought to reflect oculomotor effort (Shadmehr et al., 2019; TINS). For example, saccades with larger amplitudes and saccades where distractors need to be ignored are associated with longer latencies. Therefore, even if saccade latencies would predict saccade selection, this would not contrast the idea that effort drives saccade selection. Instead, this would provide convergent evidence for our main novel conclusion: effort drives saccade selection. There are several reasons why pupil size can be used as a more general marker of effort (see responses to R2), but ultimately, our conclusions do not hinge on the employed measure of effort per se. As stressed above in 1), we see no equally parsimonious explanation besides the cost account. Moreover, we predicted this relationship in our previous publication before running the currently reported experiments and analyses (Koevoet et al., 2023). That said, we are open to discuss further alternative options and would be looking forward to test these accounts in future work against each other – we are welcoming the reviewers’ (but also the reader’s) suggestions.

      We now discuss this in the manuscript as follows:

      “We here measured cost as the degree of effort-linked pupil dilation. In addition to pupil size, other markers may also indicate saccade costs. For example, saccade latency has been proposed to index oculomotor effort [100], whereby saccades with longer latencies are associated with more oculomotor effort. This makes saccade latency a possible complementary marker of saccade costs (also see Supplemen- tary Materials). Although relatively sluggish, pupil size is a valuable measure of attentional costs for (at least) two reasons. First, pupil size is a highly established as marker of effort, and is sensitive to effort more broadly than only in the context of saccades [36–45, 48]. Pupil size therefore allows to capture not only the costs of saccades, but also of covert attentional shifts [33], or shifts with other effectors such as head or arm movements [54, 101]. Second, as we have demonstrated, pupil size can measure saccade costs even when searching in natural scenes (Figure 4). During natural viewing, it is difficult to disentangle fixation duration from saccade latencies, complicating the use of saccade latency as a measure of saccade cost.

      Together, pupil size, saccade latency, and potential other markers of saccade cost could fulfill complementary roles in studying the role of cost in saccade selection.”

      Second, we followed the reviewer’s recommendation in testing whether other oculomotor metrics would predict saccade selection. To this end, we conducted a linear regression across directions. We calculated pupil size, saccade latencies, landing precision and peak velocities maps from the saccade planning task. We then used AICbased backward model selection to determine the ‘best’ model model to determine which factor would predict saccade selection best. The best model included pupil size, latency and landing precision as predictors (Wilkinson notation: saccade preferences ~ pupil size + saccade latency + landing precision). Pupil size (b \=-42.853, t \= 4.791, p < .001) and saccade latency (b \=-.377, t \= 2.106, p \= .043; see Author response image 1) predicted saccade preferences significantly. In contrast, landing precision did not reach significance (b \= 23.631, t \= 1.675, p \= .104). This analysis shows that although saccade latency also predicts saccade preferences, pupil size remains a robust predictor of saccade selection. These findings demonstrate that minimizing oculomotor noise cannot fully explain the pattern of results.

      Author response image 1.

      The relationship between saccade latency (from the saccade planning task) and saccade preferences averaged across participants. Individual points reflect directions and shading represents bootstrapped 95% confidence intervals.

      We have added this argument into the manuscript, and discuss the analysis in the discussion. Details of the analysis have been added to the Supporting Information for transparency and further detail.

      “A control analysis ruled out that the correlation between pupil size and saccade preferences was driven by other oculomotor metrics such as saccade latency and landing precision (see Supporting Information).”

      “To ascertain whether pupil size or other oculomotor metrics predict saccade preferences, we conducted a multiple regression analysis. We calculated average pupil size, saccade latency, landing precision and peak velocity maps across all 36 directions. The model, determined using AIC-based backward selection, included pupil size, latency and landing precision as predictors (Wilkinson notation: saccade preferences  pupil size + saccade latency + landing precision). The analysis re- vealed that pupil size (β = -42.853, t = 4.791, p < .001) and saccade latency (β = -.377, t = 2.106, p = .043) predicted saccade preferences. Landing precision did not reach significance (β = 23.631, t = 1.675, p = .104). Together, this demonstrates that although other oculomotor metrics such as saccade latency contribute to saccade selection, pupil size remains a robust marker of saccade selection.”

      In addition to eye-movement-related anisotropies across the visual field, there are of course many studies reporting visual field anisotropies (see Himmelberg, Winawer & Carrasco, 2023, Trends in Neuroscience for a review). It would be interesting to understand how the authors think about visual field anisotropies in the context of their own study. Do they think that their results are (in)dependent on such visual field variations (see Greenwood et al., 2017, PNAS; Ohl, Kroell, & Rolfs, 2024, JEP:Gen for a similar discussion)?

      We agree that established visual field anisotropies are fascinating to be discussed in context of our own results. At the reviewer’s suggestion, we now expanded this discussion.

      The observed anisotropies in terms of saccade costs are likely related to established anisotropies in perception and early visual cortex. However, the exact way that these anisotropies may be linked remains elusive (i.e. what is cause, what is effect, are links causal?), and more research is necessary to understand how these are related.

      “The observed differences in saccade costs across directions could be linked to established anisotropies in perception [80–86], attention [87–92], saccade charac- teristics [87, 88, 92, 93], and (early) visual cortex [94–98] [also see 99]. For example, downward saccades are more costly than upward saccades, which mimics a similar asymmetry in early visual areas wherein the upper visual field is relatively under- represented [94–98]; similarly stronger presaccadic benefits are found for down- compared with upward saccades [87, 88]. Moreover, upward saccades are more pre- cise than downward saccades [93]. Future work should elucidate where saccade cost or the aforementioned anisotropies originate from and how they are related - something that pupil size alone cannot address.”

      We also added that the finding that more precise saccades are coupled with worse performance in a crowding task might be attributed to the increased effort associated with more precise saccades (Greenwood et al., 2017).

      “Adaptive resource allocation from, and to the oculomotor system parsimoniously explains a number of empirical observations. For example, higher cognitive demand is accompanied by smooth pursuits deviating more from to-be tracked targets [137], reduced (micro)saccade frequencies [Figure 4; 63, 64, 138, 139], and slower peak saccade velocities [140–142]. Relatedly, more precise saccades are accompanied with worse performance in a crowding task [93].”

      Finally, the authors conclude that their results "suggests that the eye-movement system and other cognitive operations consume similar resources that are flexibly allocated among each other as cognitive demand changes. The authors should speculate what these similar resources could mean? What are the specific operations of the auditory task that overlap in terms of resources with the eye movement system?

      We agree that the nature of joint resources is an interesting question. Our previous discussion was likely too simplistic here (see also responses to R3). We here specifically refer to the cognitive resources that one can flexibly distribute between tasks.

      Our data do not directly speak to the question of what the shared resources between the auditory and oculomotor tasks are. Nevertheless, both tasks charge working memory as saccade targets are mandatorily encoded into working memory prior to saccade onset (Van der Stigchel & Hollingworth, 2018), and the counting task clearly engages working memory. This may indicate some domain-generality between visual and auditory working memory during natural viewing (see Nozari & Martin, 2024 for a recent review), but this remains speculative. Another possibility is that not the working memory encoding associated with saccades per se, but that the execution of overt motor actions itself also requires cognitive processing as suggested by Beatty (1982): “the organization of an overt motor act places additional demands on informationprocessing resources that are reflected in the task-evoked pupillary response”.

      We have added upon this in more detail in the results and discussion sections.

      “Besides the costs of increased neural activity when exerting more effort, effort should be considered costly for a second reason: Cognitive resources are limited. Therefore, any unnecessary resource expenditure reduces cognitive and behavioral flexibility [22, 31, 36, 116]. As a result, the brain needs to distribute resources between cognitive operations and the oculomotor system. We found evidence for the idea that such resource distribution is adaptive to the general level of cognitive demand and available resources: Increasing cognitive demand through an additional pri- mary auditory dual task led to a lower saccade frequency, and especially costly sac- cades were cut. In this case, it is important to consider that the auditory task was the primary task, which should cause participants to distribute resources from the ocu- lomotor system to the counting task. In other situations, more resources could be distributed to the oculomotor system instead, for example to discover new sources of reward [22, 136]. Adaptive resource allocation from, and to the oculomotor system parsimoniously explains a number of empirical observations. For example, higher cognitive demand is accompanied by smooth pursuits deviating more from to-be tracked targets [137], reduced (micro)saccade frequencies [Figure 4; 63, 64, 138, 139], and slower peak saccade velocities [140–142]. Relatedly, more precise saccades are accompanied with worse performance in a crowding task [93]. Furthermore, it has been proposed that saccade costs are weighed against other cognitive operations such as using working memory [33, 143–146]. How would the resources between the oculomotor system and cognitive tasks (like the auditory counting task) be related? One possibility is that both consume from limited working memory resources [147, 148]. Saccades are thought to encode target objects in a mandatory fashion into (vi- sual) working memory [79], and the counting task requires participants to keep track of the auditory stream and maintain count of the instructed digit in working mem- ory. However, the exact nature of which resources overlap between tasks remain open for future investigation [also see 149]. Together, we propose that cognitive re- sources are flexibly (dis)allocated to and from the oculomotor system based on the current demands to establish an optimal balance between performance and cost minimization.”

      Reviewer #2 (Public Review):

      The authors attempt to establish presaccadic pupil size as an index of 'saccade effort' and propose this index as one new predictor of saccade target selection. They only partially achieved their aim: When choosing between two saccade directions, the less costly direction, according to preceding pupil size, is preferred. However, the claim that with increased cognitive demand participants would especially cut costly directions is not supported by the data. I would have expected to see a negative correlation between saccade effort and saccade direction 'change' under increased load. Yet participants mostly cut upwards saccades, but not other directions that, according to pupil size, are equally or even more costly (e.g. oblique saccades).

      Strengths:

      The paper is well-written, easy to understand, and nicely illustrated.

      The sample size seems appropriate, and the data were collected and analyzed using solid and validated methodology.

      Overall, I find the topic of investigating factors that drive saccade choices highly interesting and relevant.

      We thank the reviewer for pointing out the strengths of our paper.

      Weaknesses:

      The authors obtain pupil size and saccade preference measures in two separate tasks. Relating these two measures is problematic because the computations that underly saccade preparation differ. In Experiment 1, the saccade is cued centrally, and has to be delayed until a "go-signal" is presented; In Experiment 2, an immediate saccade is executed to an exogenously cued peripheral target. The 'costs' in Experiment 1 (computing the saccade target location from a central cue; withholding the saccade) do not relate to Experiment 2. It is unfortunate, that measuring presaccadic pupil size directly in the comparatively more 'natural' Experiment 2 (where saccades did not have to be artificially withheld) does not seem to be possible. This questions the practical application of pupil size as an index of saccade effort

      This is an important point raised by the reviewer and we agree that a discussion on these points improves the manuscript. We reply in two parts: 1) Although the underlying computations during saccade preparation might differ, and are therefore unlikely to be fully similar (we agree), we can still predict saccade selection between (Saccade planning to Saccade preference) and within tasks (Visual search). 2) Pupil size is a sluggish physiological signal, but this is outweighed by the advantages of using pupil size as a general marker of effort, also in the context of visual selection compared with saccade latencies.

      (1) Are delayed saccades (cost task) and the much faster saccades (preference task) linked?

      As the reviewer notes the underlying ‘type’ of oculomotor program may differ between voluntarily delayed-saccades and those in the saccade preference task. There are, however, also considerable overlaps between the oculomotor programs as the directions and amplitudes are identical. Moreover, the different types of saccades have considerable overlap in their underlying neural circuitry. Nevertheless, the underlying oculomotor programs likely still differ in some regard. Even despite these differences, we were able to measure differences across directions in both tasks, and costs and preferences were negatively and highly correlated between tasks. The finding itself therefore indicates that the costs of saccades measured during the saccade planning task generalize to those in the saccade preference task. Note also that we predicted this finding and idea already in a previous publication before starting the present study (Koevoet et al., 2023).

      We now address this interesting point in the discussion as follows:

      “We observed that aOordable saccades were preferred over costly ones. This is especially remarkable given that the delayed saccades in the planning task likely differ in their oculomotor program from the immediate saccades in the preference task in some regard.”

      (2) Is pupil size a sensible measure of saccade effort?

      As the reviewer points out, the pupillary signal is indeed relatively sluggish and therefore relatively slow and more artifical tasks are preferred to quantify saccade costs. This does not preclude pupil size from being applied in more natural settings, as we demonstrate in the search experiments – but a lot of care has to be taken to control for many possible confounding factors and many trials will be needed.

      That said, as saccade latencies may also capture differences in oculomotor effort (Shadmehr et al., 2019) they are a possible alternative option to assess effort in some oculomotor tasks (see below on why saccade latencies do not provide evidence for an alternative to effort driving saccade selection, but converging evidence). Whilst we do maintain that pupil size is an established and versatile physiological marker of effort, saccade latencies provide converging evidence for our conclusion that effort drives saccade selection.

      As for the saccade preference task, we are not able to analyze the data in a similar manner as in the visual search task for two reasons. First, the number of saccades is much lower than in the natural search experiments. Second, in the saccade preference task, there were always two possible saccade targets. Therefore, even if we were able to isolate an effort signal, this signal could index a multitude of factors such as deciding between two possible saccade targets. Even simple binary decisions go hand in hand with reliable pupil dilations as they require effort (e.g. de Gee et al., 2014).

      There are three major reasons why pupil size is a more versatile marker of saccade costs than saccade latencies (although as mentioned, latencies may constitute another valuable tool to study oculomotor effort). First, pupil size is able to quantify the cost of attentional shifts more generally, including covert attention as well as other effector systems such as head and hand movements. This circumvents the issue of different latencies of different effector systems and also allows to study attentional processes that are not associated with overt motor movements. Second, saccade latencies are difficult to interpret in natural viewing data, as fixation duration and saccade latencies are inherently confounded by one another. This makes it very difficult to separate oculomotor processes and the extraction of perceptual information from a fixated target. Thus, pupil size is a versatile marker of attentional costs in a variety of settings, and can measure costs that saccade latencies cannot (i.e. covert attention). Lastly, pupil size is highly established as a marker of effort which has been demonstrated across wide range of cognitive tasks and therefore not bound to eye movements alone (Bumke, 1911; Koevoet et al., 2024; Laeng et al., 2012; Loewenfeld, 1958; Mathôt, 2018; Robison & Unsworth, 2019; Sirois & Brisson, 2014; Strauch et al., 2022; van der Wel & van Steenbergen, 2018).

      We now discuss this as follows:

      “We here measured cost as the degree of effort-linked pupil dilation. In addition to pupil size, other markers may also indicate saccade costs. For example, saccade latency has been proposed to index oculomotor effort [100], whereby saccades with longer latencies are associated with more oculomotor effort. This makes saccade latency a possible complementary marker of saccade costs (also see Supplemen- tary Materials). Although relatively sluggish, pupil size is a valuable measure of attentional costs for (at least) two reasons. First, pupil size is a highly established as marker of effort, and is sensitive to effort more broadly than only in the context of saccades [36–45, 48]. Pupil size therefore allows to capture not only the costs of saccades, but also of covert attentional shifts [33], or shifts with other effectors such as head or arm movements [54, 101]. Second, as we have demonstrated, pupil size can measure saccade costs even when searching in natural scenes (Figure 4). During natural viewing, it is difficult to disentangle fixation duration from saccade latencies, complicating the use of saccade latency as a measure of saccade cost. Together, pupil size, saccade latency, and potential other markers of saccade cost could fulfill complementary roles in studying the role of cost in saccade selection.”

      The authors claim that the observed direction-specific 'saccade costs' obtained in Experiment 1 "were not mediated by differences in saccade properties, such as duration, amplitude, peak velocity, and landing precision (Figure 1e,f)". Saccade latency, however, was not taken into account here but is discussed for Experiment 2.

      The final model that was used to test for the observed anisotropies in pupil size across directions indeed did not include saccade latencies as a predictor. However, we did consider saccade latencies as a potential predictor originally. As we performed AICbased backward model selection, however, this predictor was removed due to the marginal predictive contribution of saccade latency beyond other predictors explaining pupil size.

      For completeness, we here report the outcome of a linear mixed-effects that does include saccade latency as a predictor. Here, saccade latencies did not predict pupil size (b \= 1.859e-03, t \= .138, p \= .889). The asymmetry effects remained qualitatively unchanged: preparing oblique compared with cardinal saccades resulted in a larger pupil size (b \= 7.635, t \= 3.969, p < .001), and preparing downward compared with upward saccades also led to a larger pupil size (b \= 3.344, t \= 3.334, p \= .003).

      The apparent similarity of saccade latencies and pupil size, however, is striking. Previous work shows shorter latencies for cardinal than oblique saccades, and shorter latencies for horizontal and upward saccades than downward saccades - directly reflecting the pupil sizes obtained in Experiment 1 as well as in the authors' previous study (Koevoet et al., 2023, PsychScience).

      As the reviewer notes, there are substantial asymmetries across the visual field in saccade latencies. These assymetries in saccade latency could also predict saccade preferences. We will reply to this in three points: 1) even if saccade latency is a predictor of saccade preferences, this would not constitute as an alternative explanation to the conclusion of effort driving saccade selection, 2) saccade latencies show an up-down asymmetry but oblique-cardinal effects in latency may not be generalizable across saccade tasks, 3) pupil size remains a robust predictor of saccade preferences even when saccade latencies are considered as a predictor of saccade preferences.

      (1) We want to first stress that saccade latencies are thought to reflect oculomotor effort (Shadmehr et al., 2019). For example, saccades with larger amplitudes and saccades where distractors need to be ignored are associated with longer latencies. Therefore, even if saccade latencies predict saccade selection, this would not contrast the idea that effort drives saccade selection. Instead, this would provide convergent evidence for our main conclusion – effort predicting saccade selection (rather than pupil size predicting saccade selection per se).

      “We here measured cost as the degree of effort-linked pupil dilation. In addition to pupil size, other markers may also indicate saccade costs. For example, saccade latency has been proposed to index oculomotor effort [100], whereby saccades with longer latencies are associated with more oculomotor effort. This makes saccade latency a possible complementary marker of saccade costs (also see Supplemen- tary Materials). Although relatively sluggish, pupil size is a valuable measure of attentional costs for (at least) two reasons. First, pupil size is a highly established as marker of effort, and is sensitive to effort more broadly than only in the context of saccades [36–45, 48]. Pupil size therefore allows to capture not only the costs of saccades, but also of covert attentional shifts [33], or shifts with other effectors such as head or arm movements [54, 101]. Second, as we have demonstrated, pupil size can measure saccade costs even when searching in natural scenes (Figure 4). During natural viewing, it is difficult to disentangle fixation duration from saccade latencies, complicating the use of saccade latency as a measure of saccade cost. Together, pupil size, saccade latency, and potential other markers of saccade cost could fulfill complementary roles in studying the role of cost in saccade selection.”

      (2) We first tested anisotropies in saccade latency in the saccade planning task (Wilkinson notation: latency ~ obliqueness + updownness + leftrightness + saccade duration + saccade amplitude + saccade velocity + landing error + (1+obliqueness + updownness|participant)). We found upward latencies to be shorter than downward saccade latencies (b \= -.535, t \= 3.421, p \= .003). In addition, oblique saccades showed shorter latencies than cardinal saccades (b \= -1.083, t \= 3.096, p \= .002) – the opposite of what previous work has demonstrated.

      We then also tested these latency anisotropies in another dataset wherein participants (n \= 20) saccaded toward a single peripheral target as fast as possible (Koevoet et al., submitted; same amplitude and eccentricity as in the present manuscript). There we did not find a difference in saccade latency between cardinal and oblique targets, but we did observe shorter latencies for up- compared with downward saccades. We are therefore not sure in which situations oblique saccades do, or do not differ from cardinal saccades in terms of latency, and even in which direction the effect occurs.

      In contrast, we have now demonstrated a larger pupil size prior to oblique compared with cardinal saccades in two experiments. This indicates that pupil size may be a more reliable and generalizable marker of saccade costs than saccade latency. However, this remains to be investigated further.

      (3) To gain further insights into which oculomotor metrics would predict saccade selection, we conducted a linear regression across directions. We created pupil size, saccade latencies, landing precision and peak velocities maps from the saccade planning task. We then used AIC-based model selection to determine the ‘best’ model to determine which factor would predict saccade selection best. The selected model included pupil size, latency and landing precision as predictors (Wilkinson notation: saccade preferences ~ pupil size + saccade latency + landing precision). Pupil size (b \=-42.853, t \= 4.791, p < .001) and saccade latency (b \=-.377, t \= 2.106, p \= .043) predicted saccade preferences significantly. In contrast, landing precision did not reach significance (b \= 23.631, t \= 1.675, p \= .104). This analysis shows that although saccade latency predicts saccade preferences, pupil size remains a robust predictor of saccade selection.

      “To ascertain whether pupil size or other oculomotor metrics predict saccade preferences, we conducted a multiple regression analysis. We calculated average pupil size, saccade latency, landing precision and peak velocity maps across all 36 directions. The model, determined using AIC-based backward selection, included pupil size, latency and landing precision as predictors (Wilkinson notation: saccade preferences  pupil size + saccade latency + landing precision). The analysis re- vealed that pupil size (β = -42.853, t = 4.791, p < .001) and saccade latency (β = -.377, t = 2.106, p = .043) predicted saccade preferences. Landing precision did not reach significance (β = 23.631, t = 1.675, p = .104). Together, this demonstrates that although other oculomotor metrics such as saccade latency contribute to saccade selection, pupil size remains a robust marker of saccade selection.”

      The authors state that "from a costs-perspective, it should be eOicient to not only adjust the number of saccades (non-specific), but also by cutting especially expensive directions the most (specific)". However, saccade targets should be selected based on the maximum expected information gain. If cognitive load increases (due to an additional task) an effective strategy seems to be to perform less - but still meaningful - saccades. How would it help natural orienting to selectively cut saccades in certain (effortful) directions? Choosing saccade targets based on comfort, over information gain, would result in overall more saccades to be made - which is non-optimal, also from a cost perspective.

      We thank the reviewer for this comment. Although we do not fully agree, the logic is quite close to our rationale and it is worth adding a point of discussion here. A vital part of the current interpretation is the instruction given to participants. In our second natural visual search task, participants were performing a dual task, where the auditory task was the primary task, whilst the search task was secondary. Therefore, participants are likely to adjust their resources to optimize performance on the primary task – at the expense of the secondary task. Therefore, less resources are made available and used to searching in the dual than in the single task, because these resources are needed for the auditory task. Cutting expensive directions does not help search in terms of search performance, but it does reduce the cost of search, so that more resources are available for the prioritized auditory task. Also note that the search task was rather difficult – participants did it, but it was tough (see the original description of the dataset for more details), which provides another reason to go full in on the auditory task at expense of the visual task. This, however, opens up a nice point of discussion: If one would emphasize the importance of search (maybe with punishment or reward), we would indeed expect participants to perform whichever eye movements are getting them to their goal fastest – thus reducing the relative influence of costs on saccade behavior. This remains to be tested however - we are working on this and are looking forward to discussing such findings in the future.

      Together, we propose that there is a trade-off between distributing resources either towards cognitive tasks or the oculomotor system (also see Ballard et al., 1995; Van der Stigchel, 2020). How these resources are distributed depends highly on the current task demands (also see Sahakian et al., 2023). This allows for adaptive behavior in a wide range of contexts.

      We now added these considerations to the manuscript as follows (also see our previous replies):

      “Do cognitive operations and eye movements consume from a similar pool of resources [44]? If so, increasing cognitive demand for non-oculomotor processes should result in decreasing available resources for the oculomotor system. In line with this idea, previous work indeed shows altered eye-movement behavior un- der effort as induced by dual tasks, for example by making less saccades under increased cognitive demand [62–64]. We therefore investigated whether less sac- cades were made as soon as participants had to count the occurrence of a specific digit in the auditory number stream in comparison to ignoring the stream (in Exp. 2; Figure 4a). Participants were instructed to prioritize the auditory digit-counting task over finding the visual search target. Therefore, resources should be shifted from the oculomotor system to the primary auditory counting task. The additional cognitive demand of the dual task indeed led to a decreased saccade frequency (t(24) = 7.224, p < .001, Cohen’s d = 1.445; Figure 4h).”

      I would have expected to see a negative correlation between saccade effort and saccade direction 'change' under increased load. Yet participants mostly cut upwards saccades, but not other directions that, according to pupil size, are equally or even more costly (e.g. oblique saccades).

      The reviewer’s point is taken from the initial comment, which we will address here. First, we’d like to point out that is it not established that saccade costs in different directions are always the same. Instead, it is possible that saccade costs could be different in natural viewing compared with our delayed-saccade task. Therefore, we used pupil size during natural viewing for the search experiments. Second, the reviewer correctly notes that oblique saccades are hardly cut when under additional cognitive demand. However, participants already hardly execute oblique saccades when not confronted with the additional auditory task (Figure 4b, d), making it difficult to reduce those further (i.e. floor effect). Participants chose to cut vertical saccades, possibly because these are more costly than horizontal saccades.

      We incorporated these point in our manuscript as follows:

      “To test this, we analyzed data from two existing datasets [63] wherein participants (total n = 41) searched for small targets (’Z’ or ’H’) in natural scenes (Figure 4a; [64]). Again, we tested whether pupil size prior to saccades negatively linked with saccade preferences across directions. Because saccade costs and preferences across directions could differ for different situations (i.e. natural viewing vs. saccade preference task), but should always be negatively linked, we established both cost and preferences independently in each dataset.”

      “We calculated a saccade-adjustment map (Figure 4g) by subtracting the saccade preference map in the single task (Figure 4f) from the dual task map (Fig- ure 4d). Participants seemingly cut vertical saccades in particular, and made more saccades to the top right direction. This pattern may have emerged as vertical saccades are more costly than horizontal saccades (also see Figure 1d). Oblique saccades may not have been cut because there were very little oblique saccades in the single condition to begin with (Figure 4d), making it difficult to observe a further reduction of such saccades under additional cognitive demand (i.e. a floor effect).”

      Overall, I am not sure what practical relevance the relation between pupil size (measured in a separate experiment) and saccade decisions has for eye movement research/vision science. Pupil size does not seem to be a straightforward measure of saccade effort. Saccade latency, instead, can be easily extracted in any eye movement experiment (no need to conduct a separate, delayed saccade task to measure pupil dilation), and seems to be an equally good index.

      There are two points here.

      (1) What is the practical relevance of a link between effort and saccade selection for eyemovement research and vision science?

      We see plenty – think of changing eye movement patterns under effort (be it smooth pursuits, saccade rates, distributions of gaze positions to images etc.) which have substantial implications for human factors research, but also neuropsychology. With a cost account, one may predict (rather than just observe) how eye movement changes as soon as resources are reduced/ non-visual demand increases. With a cost account, we can explain such effects (e.g. lower saccade rates under effort, cardinal bias, perhaps also central bias) parsimoniously that cannot be explained by what is so far referred to as the three core drivers of eye movement behavior (saliency, selection history, goals, e.g., Awh et al., 2012). Conversely, one must wonder why eye-movement research/vision science simply accepts/dismisses these phenomena as such, without seeking overarching explanations.

      (2) What is the usefulness of using pupil size to measure effort?

      We hope that our replies to the comments above illustrate why pupil size is a sensible, robust and versatile marker of attentional costs. We briefly summarize our most important points here.

      - Pupil size is an established measure of effort irrespective of context, as demonstrated by hundreds of original works (e.g. working memory load, multiple object tracking, individual differences in cognitive ability). This allows pupil size to be a versatile marker of the effort, and therefore costs, of non-saccadic attentional shifts such as covert attention or those realized by other effector systems (i.e. head or hand movements).

      - Our new analysis indicates that pupil size remains a strong and robust predictor of saccade preference, even when considering saccade latency.

      - Pupil size allows to study saccade costs in natural viewing. In contrast, saccade latencies are difficult to assess in natural viewing as fixation durations and saccade latencies are intrinsically linked and very difficult to disentangle.

      - Note however, that we think that it is interesting and useful so study effects of effort/cost on eye movement behavior. Whichever index is used to do so, we see plenty potential in this line of research, this paper is a starting point to do so.

      Reviewer #3 (Public Review):

      This manuscript extends previous research by this group by relating variation in pupil size to the endpoints of saccades produced by human participants under various conditions including trial-based choices between pairs of spots and search for small items in natural scenes. Based on the premise that pupil size is a reliable proxy of "effort", the authors conclude that less costly saccade targets are preferred. Finding that this preference was influenced by the performance of a non-visual, attentiondemanding task, the authors conclude that a common source of effort animates gaze behavior and other cognitive tasks.

      Strengths:

      Strengths of the manuscript include the novelty of the approach, the clarity of the findings, and the community interest in the problem.

      We thank the reviewer for pointing out the strengths of our paper.

      Weaknesses:

      Enthusiasm for this manuscript is reduced by the following weaknesses:

      (1) A relationship between pupil size and saccade production seems clear based on the authors' previous and current work. What is at issue is the interpretation. The authors test one, preferred hypothesis, and the narrative of the manuscript treats the hypothesis that pupil size is a proxy of effort as beyond dispute or question. The stated elements of their argument seem to go like this:

      PROPOSITION 1: Pupil size varies systematically across task conditions, being larger when tasks are more demanding.

      PROPOSITION 2: Pupil size is related to the locus coeruleus.

      PROPOSITION 3: The locus coeruleus NE system modulates neural activity and interactions.

      CONCLUSION: Therefore, pupil size indexes the resource demand or "effort" associated with task conditions.

      How the conclusion follows from the propositions is not self-evident. Proposition 3, in particular, fails to establish the link that is supposed to lead to the conclusion.

      We inadvertently laid out this rationale as described above, and we thank the reviewer for pointing out this initial suboptimal structure of argumentation. The notion that the link between pupil size and effort is established in the literature because of its neural underpinnings is inaccurate. Instead, the tight link between effort and pupil size is established based on covariations of pupil diameter and cognition across a wide variety of tasks and domains. In line with this, we now introduce this tight link predominantly based on the relationships between pupil size and cognition instead of focusing on putative neural correlates of this relationship.

      As reviewed previously (Beatty, 1982; Bumke, 1911; Kahneman, 1973; Kahneman & Beatty, 1966; Koevoet et al., 2024; Laeng et al., 2012; Mathôt, 2018; Sirois & Brisson, 2014; Strauch et al., 2022; van der Wel & van Steenbergen, 2018), any increase in effort is consistently associated with an increase in pupil size. For instance, the pupil dilates when increasing load in working memory or multiple object tracking tasks, and such pupillary effects robustly explain individual differences in cognitive ability and fluctuations in performance across trials (Alnæs et al., 2014; Koevoet et al., 2024; Robison & Brewer, 2020; Robison & Unsworth, 2019; Unsworth & Miller, 2021). This extends to the planning of movements as pupil dilations are observed prior to the execution of (eye) movements (Koevoet et al., 2023; Richer & Beatty, 1985). The link between pupil size and effort has thus been firmly established for a long time, irrespective of the neural correlates of these effort-linked pupil size changes.

      We again thank the reviewer for spotting this logical mistake, and now revised the paragraph where we introduce pupil size as an established marker of effort as follows:

      “We recently demonstrated that the effort of saccade planning can be measured with pupil size, which allows for a physiological quantification of saccade costs as long as low-level visual factors are controlled for [33]. Pupil size is an established marker of effort [36–44]. For instance, loading more in working memory or tracking more objects results in stronger pupil dilation [44–52]. Pupil size not only reflects cognitive (or mental) effort but also the effort of planning and executing movements [37, 53, 54]. We leveraged this to demonstrate that saccade costs can be captured with pupil size, and are higher for oblique compared with cardinal directions [33]. Here, we addressed whether saccade costs predict where to saccade.”

      We now mention the neural correlates of pupil size only in the discussion. Where we took care to also mention roles for other neurotransmitter systems:

      “Throughout this paper, we have used cost in the limited context of saccades.

      However, cost-based decision-making may be a more general property of the brain [31, 36, 114–116]. Every action, be it physical or cognitive, is associated with an in- trinsic cost, and pupil size is likely a general marker of this [44]. Note, however, that pupil dilation does not always reflect cost, as the pupil dilates in response to many sensory and cognitive factors which should be controlled for, or at least considered, when interpreting pupillometric data [e.g., see 39, 40, 42, 117]. Effort-linked pupil dilations are thought to be, at least in part, driven by activity in the brainstem locus coeruleus (LC) [40, 118–120] [but other neurotransmitters also affect pupil size, e.g. 121, 122]. Activity in LC with its widespread connections throughout the brain [120, 123–127] is considered to be crucial for the communication within and between neu- ral populations and modulates global neural gain [128–132]. Neural firing is costly [22, 133], and therefore LC activity and pupil size are (neuro)physiologically plausible markers of cost [40]. Tentative evidence even suggests that continued exertion of effort (accompanied by altered pupil dilation) is linked to the accumulation of glutamate in the lateral prefrontal cortex [134], which may be a metabolic marker of cost [also see 116, 134, 135]. “

      (2) The authors test one, preferred hypothesis and do not consider plausible alternatives. Is "cost" the only conceivable hypothesis? The hypothesis is framed in very narrow terms. For example, the cholinergic and dopamine systems that have been featured in other researchers' consideration of pupil size modulation are missing here. Thus, because the authors do not rule out plausible alternative hypotheses, the logical structure of this manuscript can be criticized as committing the fallacy of aOirming the consequent.

      As we have noted in the response to the reviewer’s first point, we did not motivate our use of pupil size as an index of effort clearly enough. For the current purpose, the neural correlates of pupil size are less relevant than the cognitive correlates (see previous point). We reiterate that the neuromodulatory underpinnings of the observed pupil size effects (which indeed possibly include effects of the cholinergic, dopaminergic and serotonergic systems), while interesting for the discussion on the neural origin of effects, are not crucial to our conclusion. We hope the new rationale (without focusing too much on the (irrelevant) exact neural underpinnings) convinces the reviewer and reader.

      Our changes to the manuscript are shown in our reply to the previous comment.

      The reviewer notes that other plausible alternative hypotheses could explain the currently reported results. However, we did not find a more parsimonuous explanation for our data than ‘Effort Drives Saccade Selection’. Effort explains why participants prefer saccading toward specific directions in (1) highly controlled and (2) more natural settings. Note that we also predicted this effect previously (Koevoet et al., 2023). Moreover, this account explains (3) why participants make less saccades under additional cognitive demand, and (4) why especially costly saccades are reduced under additional cognitive demand. We are very open to the reviewer presenting other possible interpretations of our data so these can be discussed to be put to test in future work.

      (3) The authors cite particular publications in support of the claim that saccade selection is influenced by an assessment of effort. Given the extensive work by others on this general topic, the skeptic could regard the theoretical perspective of this manuscript as too impoverished. Their work may be enhanced by consideration of other work on this general topic, e.g, (i) Shenhav A, Botvinick MM, Cohen JD. (2013) The expected value of control: an integrative theory of anterior cingulate cortex function. Neuron. 2013 Jul 24;79(2):217-40. (ii) Müller T, Husain M, Apps MAJ. (2022) Preferences for seeking effort or reward information bias the willingness to work. Sci Rep. 2022 Nov 14;12(1):19486. (iii) Bustamante LA, Oshinowo T, Lee JR, Tong E, Burton AR, Shenhav A, Cohen JD, Daw ND. (2023) Effort Foraging Task reveals a positive correlation between individual differences in the cost of cognitive and physical effort in humans. Proc Natl Acad Sci U S A. 2023 Dec 12;120(50):e2221510120.

      We thank the reviewer for pointing us toward this literature. These papers are indeed relevant for our manuscript, and we have now incorporated them. Specifically, we now discuss how the costs of effort are weighed in relation to possible rewards during decision-making. We have also incorporated work that has investigated how the biomechanical costs of arm movements contribute to action selection.

      “Our findings are in line with established effort-based models that assume costs to be weighed against rewards during decision-making [102–107]. In such studies, reward and cognitive/physical effort are often parametrically manipulated to as- sess how much effort participants are willing to exert to acquire a given (monetary) reward [e.g. 108, 109]. Whereas this line of work manipulated the extrinsic costs and/or rewards of decision options (e.g. perceptual consequences of saccades [110, 111] or consequences associated with decision options), we here focus on the intrin- sic costs of the movement itself (in terms of cognitive and physical effort). Relatedly, the intrinsic costs of arm movements are also considered during decision-making: biomechanically aOordable movements are generally preferred over more costly ones [26–28]. We here extend these findings in two important ways. First, until now, the intrinsic costs of saccades and other movements have been inferred from gaze behavior itself or by using computational modelling [23, 25–28, 34, 35, 112]. In con- trast, we directly measured cost physiologically using pupil size. Secondly, we show that physiologically measured saccade costs predict where saccades are directed in a controlled binary preference task, and even during natural viewing. Our findings could unite state-of-the-art computational models [e.g. 23, 25, 34, 35, 113] with physiological data, to directly test the role of saccade costs and ultimately further our understanding of saccade selection.”

      (4) What is the source of cost in saccade production? What is the currency of that cost? The authors state (page 13), "... oblique saccades require more complex oculomotor programs than horizontal eye movements because more neuronal populations in the superior colliculus (SC) and frontal eye fields (FEF) [76-79], and more muscles are necessary to plan and execute the saccade [76, 80, 81]." This statement raises questions and concerns. First, the basis of the claim that more neurons in FEF and SC are needed for oblique versus cardinal saccades is not established in any of the publications cited. Second, the authors may be referring to the fact that oblique saccades require coordination between pontine and midbrain circuits. This must be clarified. Second, the cost is unlikely to originate in extraocular muscle fatigue because the muscle fibers are so different from skeletal muscles, being fundamentally less fatigable. Third, if net muscle contraction is the cost, then why are upward saccades, which require the eyelid, not more expensive than downward? Thus, just how some saccades are more effortful than others is not clear.

      Unfortunately, our current data do not allow for the specification of what the source is of differences in saccade production, nor what the currency is. We want to explicitly state that while pupil size is a sensitive measure of saccade costs, pupil size cannot directly inform what underlying mechanisms are causing differences in saccade costs across conditions (e.g. directions). Nevertheless, we do speculate about these issues because they are important to consider. We thank the reviewer for pointing out the shortcomings in our initial speculations.

      Broadly, we agree with the reviewer that a neural source of differences in costs between different types of saccades is more likely than a purely muscular account (also see Koevoet et al., 2023). Furthermore, we think that the observed differences in saccade costs for oblique vs. cardinal and up vs. down could be due to different underlying mechanisms. While we caution against overinterpreting single directions, tentative evidence for this may also be drawn by the different time course of effects for up/down versus cardinal/oblique, Figure 1c.

      Below we speculate about why some specific saccade directions may be more costly than others:

      Why would oblique saccades be more costly than cardinal saccades? We thank the reviewer for pointing out that oblique saccades additionally require coordination between pontine and midbrain circuits (Curthoys et al., 1984; King & Fuchs, 1979; Sparks, 2002). This point warrants more revised discussion compared to our initial version. We have incorporated this as follows:

      “The complexity of an oculomotor program is arguably shaped by its neural underpinnings. For example, oblique but not cardinal saccades require communication between pontine and midbrain circuits [73–75]. Such differences in neural complexity may underlie the additional costs of oblique compared with cardinal saccades. Besides saccade direction, other properties of the ensuing saccade such as its speed, distance, curvature, and accuracy may contribute to a saccade’s total cost [22, 33, 53, 76, 77] but this remains to be investigated directly.”

      Why would downward saccades be more costly than upward saccades? As the reviewer points out: from a net muscular contraction account of cost, one would expect the opposite pattern due to the movement of the eyelid. Instead, we speculate that our findings may be associated with the well-established anisotropy in early visual cortex along the vertical meridian. Specifically, the upper vertical meridian is represented at substantially less detail than the lower vertical meridian (Himmelberg et al., 2023; Silva et al., 2018). Prior to a saccade, attention is deployed towards the intended saccadic endpoint (Deubel & Schneider, 1996; Kowler et al., 1995). Attention tunes neurons to preferentially process the attended location over non-attended locations. Due to the fact that the lower visual field is represented at higher detail than the upper visual field, attention may tune neuronal responses differently when preparing up- compared with downward saccades (Hanning et al., 2024; Himmelberg et al., 2023). Thus, it may be more costly to prepare down- compared with upward saccades. This proposition, however, does not account for the lower costs associated horizontal compared with up- and downward saccades as the horizontal meridian is represented at a higher acuity than the vertical merdian. This makes it unlikely that this explains the pattern of results completely. Again, at this point we can only speculate why costs differ, yet we demonstrate that these differences in cost are decisive for oculomotor behavior. We now explicitly state the speculative nature of these ideas that would all need to be tested directly.

      We have updated our discussion of this issue as follows:

      “The observed differences in saccade costs across directions could be linked to established anisotropies in perception [80–86], attention [87–92], saccade charac- teristics [87, 88, 92, 93], and (early) visual cortex [94–98] [also see 99]. For example, downward saccades are more costly than upward saccades, which mimics a similar asymmetry in early visual areas wherein the upper visual field is relatively under- represented [94–98]; similarly stronger presaccadic benefits are found for down- compared with upward saccades [87, 88]. Moreover, upward saccades are more pre- cise than downward saccades [93]. Future work should elucidate where saccade cost or the aforementioned anisotropies originate from and how they are related - something that pupil size alone cannot address.”

      (5) The authors do not consider observations about variation in pupil size that seem to be incompatible with the preferred hypothesis. For example, at least two studies have described systematically larger pupil dilation associated with faster relative to accurate performance in manual and saccade tasks (e.g., Naber M, Murphy P. Pupillometric investigation into the speed-accuracy trade-off in a visuo-motor aiming task. Psychophysiology. 2020 Mar;57(3):e13499; Reppert TR, Heitz RP, Schall JD. Neural mechanisms for executive control of speed-accuracy trade-off. Cell Rep. 2023 Nov 28;42(11):113422). Is the fast relative to the accurate option necessarily more costly?

      We thank the reviewer for this interesting point that we will answer in two ways. First, we discuss the main point: the link between pupil size, effort, and cost. Second, we discuss the findings described specifically in these two papers and how we interpret these from a pupillometric account.

      First, one may generally ask whether 1) any effort results in pupil dilation, 2) whether any effort is costly, and 3) whether this means that pupil dilation always reflects effort and cost respectively. Indeed, it has been argued repeatedly, prominently, and independently (e.g., Bumke, 1911; Mathôt, 2018) that any change in effort (no matter the specific origin) is associated with an evoked pupil dilation. Effort, in turn, is consistently and widely experienced as aversive, both across tasks and cultures (David et al., 2024). Effort minimization may therefore be seen as an universal law of human cognition and behavior with effort as a to-be minimized cost (Shadmehr et al., 2019; Hull 1943, Tsai 1932). However, this does not imply that any pupil dilation necessarily reflects effort or that, as a consequence thereof, any pupil dilation is always signaling cost. For instance, the pupil dark response, the pupil far response and changes in baseline pupil size are not associated with effort. Baseline and task-evoked pupil dilation responses have to be interpreted differently (see below), moreover, the pupil also changes (and dilates) due to other factors (see Strauch et al., 2022; Mathôt, 2018, Bumke 1911, Loewenfeld, 1999 for reviews).

      Second, as for Naber & Murphy (2020) & Reppert at al. (2023) specifically: Both Reppert et al. (2023) and Naber & Murphy (2020) indeed demonstrate a larger baseline pupil size when participants made faster, less accurate responses. However, baseline pupil size is not an index of effort per-se, but task-evoked pupil dilation responses are (as studied in the present manuscript) (Strauch et al., 2022). For work on differences between baseline pupil diameter and task-evoked pupil responses, and their respective links with exploration and exploitation please see Jepma & Nieuwenhuis (2011). Indeed, the link between effort and larger pupil size holds for task evoked responses, but not baseline pupil size per se (also see Koevoet et al., 2023).

      Still, Naber (third author of the current paper) & Murphy (2020) also demonstrated larger task-evoked pupil dilation responses when participants were instructed to make faster, less accurate responses compared with making accurate and relatively slow responses. However, this difference in task-evoked response gains significance only after the onset of the movement itself, and peaks substantially later than response offset. Whilst pupil dilation may be sluggish, it isn’t extremely sluggish either. As feedback to the performance of the participant was displayed 1.25s after performing the movement and clicking (taking about 630ms), we deem it possible that this effect may in part result from appraising the feedback to the participant rather than the speed of the response itself (in fact, Naber and Murphy also discuss this option). In addition to not measuring saccades but mouse movements, it is therefore possible that the observed evoked pupil effects in Naber & Murphy (2020) are not purely linked to motor preparation and execution per se. Therefore, future work that aims to investigate the costs of movements should isolate the effects of feedback and other potential factors that may drive changes in pupil size. This will help clarify whether fast or more accurate movements could be linked to the underlying costs of the movements.

      Relatedly, we do not find evidence that pupil size during saccade planning predicts the onset latency of the ensuing saccade (please refer to our second response to Reviewer 2 for a detailed discussion).

      Together, we therefore do not see the results from Reppert et al. (2023) and Naber & Murphy (2020) to be at odds with our interpretation of evoked pupil size reflecting effort and cost in the context of planning saccades.

      We think that these are considerations important to the reader, which is why we now added them to the discussion as follows:

      “Throughout this paper, we have used cost in the limited context of saccades.

      However, cost-based decision-making may be a more general property of the brain [31, 36, 114–116]. Every action, be it physical or cognitive, is associated with an in- trinsic cost, and pupil size is likely a general marker of this [44]. Note, however, that pupil dilation does not always reflect cost, as the pupil dilates in response to many sensory and cognitive factors which should be controlled for, or at least considered, when interpreting pupillometric data [e.g., see 39, 40, 42, 117].”

      (6) The authors draw conclusions based on trends across participants, but they should be more transparent about variation that contradicts these trends. In Figures 3 and 4 we see many participants producing behavior unlike most others. Who are they? Why do they look so different? Is it just noise, or do different participants adopt different policies?

      We disagree with the transparency point of the reviewer. Note that we deviated from the norm here by being more transparent than common: we added individual data points and relationships rather than showing pooled effects across participants with error bars alone (see Figures 2c, 3b,c, 4c,e,f).

      Moreover, our effects are consistent and stable across participants and are highly significant. To illustrate, for the classification analysis based on cost (Figure 2E) 16/20 participants showed an effect. As for the natural viewing experiments (total > 250,000 fixations), we also find that a majority of participants show the observed effects: Experiment 1: 15/16 participants; Experiment 2: 16/25 participants; Experiment 2 – adjustment: 22/25 participants.

      We fully agree that it’s interesting to understand where interindividual variation may originate from. We currently have too little data to allow robust analyses across individuals and zooming in on individual differences in cost maps, preference maps, or potential personalized strategies of saccade selection. That said, future work could study this further. We would recommend to hereby reduce the number of directions to gain more pupil size data per direction and therefore cleaner signals that may be more informative on the individual level. With such stronger signals, studying (differences in) links on an individual level may be feasible and would be interesting to consider – and will be a future direction in our own work too. Nonetheless, we again stress that the reported effects are robust and consistent across participants, and that interindividual differences are therefore not extensive. Moreover, our results from four experiments consistently support our conclusion that effort drives saccade selection.

      Recommendations for the authors:  

      Reviewer #1 (Recommendations For The Authors):

      - Based on the public review, I would recommend that the authors carefully review and correct the manuscript with regard to the causal conclusions. The study is largely correlational (i.e. the pupil was only observed, not manipulated) and therefore does not allow causal conclusions to be drawn about the relationship between pupil size and saccade selection. These causal conclusions become even more confusing when pupil size is equated with effort and saccade cost. As a consequence, an actual correlation between pupil size and saccade selection has led to the title that effort drives saccade selection. It would also be helpful for the reader to summarize in an additional section of the discussion what they consider to be a causal or correlational link based on their results.

      We agree with the reviewer, and we have indeed included more explicitly which findings are correlational and which causal in detail now. As outlined before we do not see a more parimanious explanation for our findings than our title, but we fully agree that the paper benefits from making the correlational/causal nature of evidence for this idea explicitly transparent.

      “We report a combination of correlational and causal findings. Despite the correlational nature of some of our results, they consistently support the hypothesis that saccade costs predicts saccade selection [which we predicted previously, 33]. Causal evidence was provided by the dual-task experiment as saccade frequencies - and especially costly saccades were reduced under additional cognitive demand. Only a cost account predicts 1) a link between pupil size and saccade preferences, 2) a cardinal saccade bias, 3) reduced saccade frequency under additional cognitive demand, and 4) disproportional cutting of especially those directions associated with more pupil dilation. Together, our findings converge upon the conclusion that effort drives saccade selection.”

      - Can the authors please elaborate in more detail on how they transformed the predictors of their linear mixed model for the visualization in Figure 1f? It is difficult to see how the coeOicients in the table and the figure match.

      We used the ‘effectsize’ package to provide effect sizes of for each predictor of the linear mixed-effects model (https://cran.r-project.org/web/packages/effectsize/index.html). We report absolute effect sizes to make it visually easier to compare different predictors. These details have now been included in the Methods section to be more transparent about how these effect sizes were computed.

      “Absolute effect sizes (i.e. r) and their corresponding 95% confidence intervals for the linear mixed-effects models were calculated using t and df values with the ’effectsize’ package (v0.8.8) in R.”

      - Could the authors please explain in more detail why they think that a trial-by-trial analysis in the free choice task adds something new to their conclusions? In fact, a trialby-trial analysis somehow suggests that the pupil size data would enter the analysis at a single trial level. If I understand correctly, the pupil size data come from their initial mapping task. So there is only one mean pupil size for a given participant and direction that goes into their analysis to predict free choice in a single trial. If this is the case, I don't see the point of doing this additional analysis given the results shown in Figure 2c.

      The reviewer understands correctly that pupil size data is taken from the initial mapping task. We then used these mean values to predict which saccade target would be selected on a trial-by-trial basis. While showing the same conceptual result as the correlation analysis, we opted to include this analysis to show the robustness of the results across individuals. Therefore we have chosen to keep the analysis in the manuscript but now write more clearly that this shows the same conceptual finding as the correlation analysis.

      “As another test of the robustness of the effect, we analyzed whether saccade costs predicted saccade selection on a trial-by-trial basis. To this end, we first determined the more aOordable option for each trial using the established saccade cost map (Figure 1d). We predicted that participants would select the more aOordable option. Complementing the above analyses, the more aOordable option was chosen above chance level across participants (M = 56.64%, 95%-CI = [52.75%-60.52%], one-sample t-test against 50%: t(19) = 3.26, p = .004, Cohen’s d = .729; Figure 2e). Together, these analyses established that saccade costs robustly predict saccade preferences.”

      Reviewer #2 (Recommendations For The Authors):

      The authors report that "Whenever the difference in pupil size between the two options was larger, saccades curved away more from the non-selected option (β = .004, SE = .001, t = 4.448, p < .001; Figure 3b), and their latencies slowed (β = .050, SE = .013, t = 4.323, p < .001; Figure 3c)". I suspect this effect might not be driven by the difference but by a correlation between pupil size and latency.

      The authors correlate differences in pupil size (Exp1) with saccade latencies (Exp2), I recommend correlating pupil size with the latency directly, in either task. This would show if it is actually the difference between choices or simply the pupil size of the respective individual option that is linked to latency/effort. Same for curvature.

      The reviewer raises a good point. Please see the previous analyses concerning the possible correlations between pupil size and saccade latency, and how they jointly predict saccade selection.

      Our data show that saccade curvature and latencies are linked with the difference in pupil size between the selected and non-selected options. Are these effects driven by a difference in pupil size or by the pupil size associated with the chosen option?

      To assess this, we conducted two linear mixed-effects models. We predicted saccade curvature and latency using pupil size (from the planning task) of the selected and nonselected options while controlling for the chosen direction (Wilkinson notation: saccade curvature/latency ~ selected pupil size + non-selected pupil size + obliqueness + vertical + horizontal + (1+ selected pupil size + non-selected pupil size|participant). We found that saccades curved away more from costlier the non-selected targets (β \=1.534, t \= 8.151, p < .001), and saccades curved away from the non-selected target less when the selected target was cheaper (β \=-2.571, t \= -6.602, p < .001). As the costs of the selected and non-selected show opposite effects on saccade curvature, this indicates that the difference between the two options drives oculomotor conflict.

      As for saccade latencies, we found saccade onsets to slow when the cost of the selected target was higher (b \= .068, t \= 2.844, p \= .004). In contrast, saccade latencies were not significantly affected by the cost of the non-selected target (β \= -.018, t \= 1.457, p \= .145), although numerically the effect was in the opposite direction. This shows that latencies were primarily driven by the cost of the selected target but a difference account cannot be fully ruled out.

      Together, these analyses demonstrate that the difference in costs between two alternatives reliably affects oculomotor conflict as indicated by the curvature analysis. However, saccade latencies are predominantly affected by the cost of the selected target – even when controlling for the obliqueness, updownness and leftrightness of the ensuing saccade. We have added these analyses here for completeness, but because the findings seem inconclusive for saccade latency we have chosen to not include these analyses in the current paper. We are open to including these analyses in the supplementary materials if the reviewer and/or editor would like us to, but have chosen not to do so due to conciseness and to keep the paper focused.

      I was wondering why the authors haven't analyzed the pupil size in Experiment 2. If the pupil size can be assessed during a free viewing task (Experiment 3), shouldn't it be possible to also evaluate it in the saccade choice task?

      We did not analyze the pupil size data from the saccade preference task for two reasons. First, the number of saccades is much lower than in the natural search experiments (~14.000 vs. ~250.000). Second, in the saccade preference task, there were always two possible saccade targets. Therefore, even if we were able to isolate an effort signal, this signal could index a multitude of factors such as deciding between two possible saccade targets (de Gee et al., 2014), and has the possibility of two oculomotor programs being realized instead of only a single one (Van der Stigchel, 2010).

      Discussion: "due to stronger presaccadic benefits for upward compared with downward saccades [93,94]". I think this should be the other way around.

      We thank the reviewer for pointing this out. We have corrected our mistake in the revised manuscript.

      Saccade latencies differ around the visual field; to account for that, results / pupil size should be (additionally) evaluated relative to saccade onset (rather than cue offset). It is interesting that latencies were not accounted for here (Exp1), since they are considered for Exp2 (where they correlate with a pupil size difference). I suspect that latencies not only correlate with the difference in pupil size, but directly with pupil size itself.

      We agree with the reviewer that locking the pupil size signal to saccade onset instead of cue offset may be informative. We included an analysis in the supporting information that investigates this (see Figure S1). The results of the analysis were conceptually identical.

      The reviewer writes that latencies were not accounted for in Experiment 1. Although saccade latency was not included in the final model reported in the paper, it was considered during AIC-based backward model selection. As saccade latency did not predict meaningful variance in pupil size, it was ultimately not included in the analysis as a predictor. For completeness, we here report the outcome of a linear mixed-effects that does include saccade latency as a predictor. Here, saccade latencies did not predict pupil size (β \= 1.859e-03, t \= .138, p \= .889). The assymetry effects remained qualitatively unchanged: preparing oblique compared with cardinal saccades resulted in a larger pupil size (β \= 7.635, t \= 3.969, p < .001), and preparing downward compared with upward saccades also led to a larger pupil size (β \= 3.344, t \= 3.334, p \= .003).

      In addition, we have included a new analysis in the supporting information that directly addresses this issue. We will reiterate the main results here:

      “To ascertain whether pupil size or other oculomotor metrics predict saccade preferences, we conducted a multiple regression analysis. We calculated average pupil size, saccade latency, landing precision and peak velocity maps across all 36 directions. The model, determined using AIC-based backward selection, included pupil size, latency and landing precision as predictors (Wilkinson notation: saccade preferences  pupil size + saccade latency + landing precision). The analysis re- vealed that pupil size (β = -42.853, t = 4.791, p < .001) and saccade latency (β = -.377, t = 2.106, p = .043) predicted saccade preferences. Landing precision did not reach significance (β = 23.631, t = 1.675, p = .104). Together, this demonstrates that although other oculomotor metrics such as saccade latency contribute to saccade selection, pupil size remains a robust marker of saccade selection.”

      We have also added this point in our discussion:

      “We here measured cost as the degree of effort-linked pupil dilation. In addition to pupil size, other markers may also indicate saccade costs. For example, saccade latency has been proposed to index oculomotor effort [100], whereby saccades with longer latencies are associated with more oculomotor effort. This makes saccade latency a possible complementary marker of saccade costs (also see Supplemen- tary Materials). Although relatively sluggish, pupil size is a valuable measure of attentional costs for (at least) two reasons. First, pupil size is a highly established as marker of effort, and is sensitive to effort more broadly than only in the context of saccades [36–45, 48]. Pupil size therefore allows to capture not only the costs of saccades, but also of covert attentional shifts [33], or shifts with other effectors such as head or arm movements [54, 101]. Second, as we have demonstrated, pupil size can measure saccade costs even when searching in natural scenes (Figure 4). During natural viewing, it is difficult to disentangle fixation duration from saccade latencies, complicating the use of saccade latency as a measure of saccade cost. Together, pupil size, saccade latency, and potential other markers of saccade cost could fulfill complementary roles in studying the role of cost in saccade selection.”

      References

      Alnæs, D., Sneve, M. H., Espeseth, T., Endestad, T., van de Pavert, S. H. P., & Laeng, B. (2014). Pupil size signals mental eFort deployed during multiple object tracking and predicts brain activity in the dorsal attention network and the locus coeruleus. Journal of Vision, 14(4), 1. https://doi.org/10.1167/14.4.1

      Awh, E., Belopolsky, A. V., & Theeuwes, J. (2012). Top-down versus bottom-up attentional control: A failed theoretical dichotomy. Trends in Cognitive Sciences, 16(8), 437–443. https://doi.org/10.1016/j.tics.2012.06.010

      Ballard, D. H., Hayhoe, M. M., & Pelz, J. B. (1995). Memory Representations in Natural Tasks. Journal of Cognitive Neuroscience, 7(1), 66–80. https://doi.org/10.1162/jocn.1995.7.1.66

      Beatty, J. (1982). Task-evoked pupillary responses, processing load, and the structure of processing resources. Psychological Bulletin, 91(2), 276–292. https://doi.org/10.1037/0033-2909.91.2.276

      Bumke, O. (1911). Die Pupillenstörungen bei Geistes-und Nervenkrankheiten (2nd ed.). Fischer.

      Curthoys, I. S., Markham, C. H., & Furuya, N. (1984). Direct projection of pause neurons to nystagmusrelated excitatory burst neurons in the cat pontine reticular formation. Experimental Neurology, 83(2), 414–422. https://doi.org/10.1016/S0014-4886(84)90109-2

      David, L., Vassena, E., & Bijleveld, E. (2024). The unpleasantness of thinking: A meta-analytic review of the association between mental eFort and negative aFect. Psychological Bulletin, 150(9), 1070–1093. https://doi.org/10.1037/bul0000443

      de Gee, J. W., Knapen, T., & Donner, T. H. (2014). Decision-related pupil dilation reflects upcoming choice and individual bias. Proceedings of the National Academy of Sciences, 111(5), E618–E625. https://doi.org/10.1073/pnas.1317557111

      Deubel, H., & Schneider, W. X. (1996). Saccade target selection and object recognition: Evidence for a common attentional mechanism. Vision Research, 36(12), 1827–1837. https://doi.org/10.1016/0042-6989(95)00294-4

      Greenwood, J. A., Szinte, M., Sayim, B., & Cavanagh, P. (2017). Variations in crowding, saccadic precision, and spatial localization reveal the shared topology of spatial vision. Proceedings of the National Academy of Sciences, 114(17), E3573–E3582. https://doi.org/10.1073/pnas.1615504114

      Hanning, N. M., Himmelberg, M. M., & Carrasco, M. (2024). Presaccadic Attention Depends on Eye Movement Direction and Is Related to V1 Cortical Magnification. Journal of Neuroscience, 44(12). https://doi.org/10.1523/JNEUROSCI.1023-23.2023

      Himmelberg, M. M., Winawer, J., & Carrasco, M. (2023). Polar angle asymmetries in visual perception and neural architecture. Trends in Neurosciences, 46(6), 445–458. https://doi.org/10.1016/j.tins.2023.03.006

      Jepma, M., & Nieuwenhuis, S. (2011). Pupil Diameter Predicts Changes in the Exploration–Exploitation Trade-oF: Evidence for the Adaptive Gain Theory. Journal of Cognitive Neuroscience, 23(7), 1587– 1596. https://doi.org/10.1162/jocn.2010.21548

      Kahneman, D. (1973). Attention and Effort. Prentice-Hall.

      Kahneman, D., & Beatty, J. (1966). Pupil diameter and load on memory. Science (New York, N.Y.), 154(3756), 1583–1585. https://doi.org/10.1126/science.154.3756.1583

      King, W. M., & Fuchs, A. F. (1979). Reticular control of vertical saccadic eye movements by mesencephalic burst neurons. Journal of Neurophysiology, 42(3), 861–876. https://doi.org/10.1152/jn.1979.42.3.861

      Koevoet, D., Strauch, C., Naber, M., & Van der Stigchel, S. (2023). The Costs of Paying Overt and Covert Attention Assessed With Pupillometry. Psychological Science, 34(8), 887–898. https://doi.org/10.1177/09567976231179378

      Koevoet, D., Strauch, C., Van der Stigchel, S., Mathôt, S., & Naber, M. (2024). Revealing visual working memory operations with pupillometry: Encoding, maintenance, and prioritization. WIREs Cognitive Science, e1668. https://doi.org/10.1002/wcs.1668

      Kowler, E., Anderson, E., Dosher, B., & Blaser, E. (1995). The role of attention in the programming of saccades. Vision Research, 35(13), 1897–1916. https://doi.org/10.1016/0042-6989(94)00279-U

      Laeng, B., Sirois, S., & Gredebäck, G. (2012). Pupillometry: A Window to the Preconscious? Perspectives on Psychological Science, 7(1), 18–27. https://doi.org/10.1177/1745691611427305

      Loewenfeld, I. E. (1958). Mechanisms of reflex dilatation of the pupil. Documenta Ophthalmologica, 12(1), 185–448. https://doi.org/10.1007/BF00913471

      Mathôt, S. (2018). Pupillometry: Psychology, Physiology, and Function. Journal of Cognition, 1(1), 16. https://doi.org/10.5334/joc.18

      Naber, M., & Murphy, P. (2020). Pupillometric investigation into the speed-accuracy trade-oF in a visuomotor aiming task. Psychophysiology, 57(3), e13499. https://doi.org/10.1111/psyp.13499

      Nozari, N., & Martin, R. C. (2024). Is working memory domain-general or domain-specific? Trends in Cognitive Sciences, 0(0). https://doi.org/10.1016/j.tics.2024.06.006

      Reppert, T. R., Heitz, R. P., & Schall, J. D. (2023). Neural mechanisms for executive control of speedaccuracy trade-oF. Cell Reports, 42(11). https://doi.org/10.1016/j.celrep.2023.113422

      Richer, F., & Beatty, J. (1985). Pupillary Dilations in Movement Preparation and Execution. Psychophysiology, 22(2), 204–207. https://doi.org/10.1111/j.1469-8986.1985.tb01587.x

      Robison, M. K., & Brewer, G. A. (2020). Individual diFerences in working memory capacity and the regulation of arousal. Attention, Perception, & Psychophysics, 82(7), 3273–3290. https://doi.org/10.3758/s13414-020-02077-0

      Robison, M. K., & Unsworth, N. (2019). Pupillometry tracks fluctuations in working memory performance. Attention, Perception, & Psychophysics, 81(2), 407–419. https://doi.org/10.3758/s13414-0181618-4

      Sahakian, A., Gayet, S., PaFen, C. L. E., & Van der Stigchel, S. (2023). Mountains of memory in a sea of uncertainty: Sampling the external world despite useful information in visual working memory. Cognition, 234, 105381. https://doi.org/10.1016/j.cognition.2023.105381

      Shadmehr, R., Reppert, T. R., Summerside, E. M., Yoon, T., & Ahmed, A. A. (2019). Movement Vigor as a Reflection of Subjective Economic Utility. Trends in Neurosciences, 42(5), 323–336. https://doi.org/10.1016/j.tins.2019.02.003

      Silva, M. F., Brascamp, J. W., Ferreira, S., Castelo-Branco, M., Dumoulin, S. O., & Harvey, B. M. (2018). Radial asymmetries in population receptive field size and cortical magnification factor in early visual cortex. NeuroImage, 167, 41–52. https://doi.org/10.1016/j.neuroimage.2017.11.021

      Sirois, S., & Brisson, J. (2014). Pupillometry. WIREs Cognitive Science, 5(6), 679–692. https://doi.org/10.1002/wcs.1323

      Sparks, D. L. (2002). The brainstem control of saccadic eye movements. Nature Reviews Neuroscience, 3(12), Article 12. https://doi.org/10.1038/nrn986

      Strauch, C., Wang, C.-A., Einhäuser, W., Van der Stigchel, S., & Naber, M. (2022). Pupillometry as an integrated readout of distinct attentional networks. Trends in Neurosciences, 45(8), 635–647. https://doi.org/10.1016/j.tins.2022.05.003

      Unsworth, N., & Miller, A. L. (2021). Individual DiFerences in the Intensity and Consistency of Attention. Current Directions in Psychological Science, 30(5), 391–400. https://doi.org/10.1177/09637214211030266

      Van der Stigchel, S. (2010). Recent advances in the study of saccade trajectory deviations. Vision Research, 50(17), 1619–1627. https://doi.org/10.1016/j.visres.2010.05.028

      Van der Stigchel, S. (2020). An embodied account of visual working memory. Visual Cognition, 28(5–8), 414–419. https://doi.org/10.1080/13506285.2020.1742827

      Van der Stigchel, S., & Hollingworth, A. (2018). Visuospatial Working Memory as a Fundamental Component of the Eye Movement System. Current Directions in Psychological Science, 27(2), 136–143. https://doi.org/10.1177/0963721417741710

      van der Wel, P., & van Steenbergen, H. (2018). Pupil dilation as an index of eFort in cognitive control tasks: A review. Psychonomic Bulletin & Review, 25(6), 2005–2015. https://doi.org/10.3758/s13423-018-1432-y

    1. Author response:

      The following is the authors’ response to the original reviews.

      Public Reviews:

      Reviewer #1 (Public Review):

      Summary:

      In this valuable study, the authors found that the macrolide drug rapamycin, which is an important pharmacological tool in the clinic and the research lab, is less specific than previously thought. They provide solid functional evidence that rapamycin activates TRPM8 and develop an NMR method to measure the specific binding of a ligand to a membrane protein.

      Strengths:

      The authors use a variety of complementary experimental techniques in several different systems, and their results support the conclusions drawn.

      Weaknesses:

      Controls are not shown in all cases, and a lack of unity across the figures makes the flow of the paper disjointed. The proposed location of the rapamycin binding pocket within the membrane means that molecular docking approaches designed for soluble proteins alone do not provide solid evidence for a rapamycin binding pocket location in TRPM8, but the authors are appropriately careful in stating that the model is consistent with their functional experiments.

      Impact:

      This work provides still more evidence for the polymodality of TRP channels, reminding both TRP channel researchers and those who use rapamycin in other contexts that the adjective "specific" is only meaningful in the context of what else has been explicitly tested.

      Reviewer #2 (Public Review):

      Summary:

      Tóth and Bazeli et al. find rapamycin activates heterologously-expressed TRPM8 and dissociated sensory neurons in a TRPM8-dependent way with Ca2+-imaging. With electrophysiology and STTD-NMR, they confirmed the activation is through direct interaction with TRPM8. Using mutants and computational modeling, the authored localized the binding site to the groove between S4 and S5, different than the binding pocket of cooling agents such as menthol. The hydroxyl group on carbon 40 within the cyclohexane ring in rapamycin is indispensable for activation, while other rapalogs with its replacement, such as everolimus, still bind but cannot activate TRPM8. Overall, the findings provide new insights into TRPM8 functions and may indicate previously unknown physiological effects or therapeutic mechanisms of rapamycin.

      Strengths:

      The authors spent extensive effort on demonstrating that the interaction between TRPM8 and rapamycin is direct. The evidence is solid. In probing the binding site and the structural-function relationship, the authors combined computational simulation and functional experiments. It is very impressive to see that "within" a rapamycin molecule, the portion shared with everolimus is for "binding", while the hydroxyl group in the cyclohexane ring is for activation. Such detailed dissection represents a successful trial in the computational biology-facilitated, functional experiment-validated study of TRP channel structuralactivity relationship. The research draws the attention of scientists, including those outside the TRP channel field, to previously neglected effects of rapamycin, and therefore the manuscript deserves broad readership.

      Weaknesses:

      The significance of the research could be improved by showing or discussing whether a similar binding pocket is present in other TRP channels, and hence rapalogs might bind to or activate these TRP channels. Additionally, while the finding on TRPM8 is novel, it is worthwhile to perform more comprehensive pharmacological characterization, including single-channel recording and a few more mutant studies to offer further insight into the mechanism of rapamycin binding to S4~S5 pocket driving channel opening. It is also necessary to know if rapalogs have independent or synergistic effects on top of other activators, including cooling agents and lower temperature, and their dependence on regulators such as PIP2.

      Additional discussion that might be helpful:

      The authors did confirm that rapamycin does not activate TRPV1, TRPA1 and TRPM3. But other TRP channels, particularly other structurally similar TRPM channels, should be discussed or tested. Alignment of the amino acid sequences or structures at the predicted binding pocket might predict some possible outcomes. In particular, rapamycin is known to activate TRPML1 in a PI(3,5)P2-dependent manner, which should be highlighted in comparison among TRP channels (PMID: 35131932, 31112550).

      Reviewer #3 (Public Review):

      Summary:

      Rapamycin is a macrolide of immunologic therapeutic importance, proposed as a ligand of mTOR. It is also employed as in essays to probe protein-protein interactions.

      The authors serendipitously found that the drug rapamycin and some related compounds, potently activate the cationic channel TRPM8, which is the main mediator of cold sensation in mammals. The authors show that rapamycin might bind to a novel binding site that is different from the binding site for menthol, the prototypical activator of TRPM8. These solid results are important to a wide audience since rapamycin is a widely used drug and is also employed in essays to probe protein-protein interactions, which could be affected by potential specific interactions of rapamycin with other membrane proteins, as illustrated herein.

      Strengths:

      The authors employ several experimental approaches to convincingly show that rapamycin activates directly the TRPM8 cation channel and not an accessory protein or the surrounding membrane. In general, the electrophysiological, mutational and fluorescence imaging experiments are adequately carried out and cautiously interpreted, presenting a clear picture of the direct interaction with TRPM8. In particular, the authors convincingly show that the interactions of rapamycin with TRPM8 are distinct from interactions of menthol with the same ion channel.

      Weaknesses:

      The main weakness of the manuscript is the NMR method employed to show that rapamycin binds to TRPM8. The authors developed and deployed a novel signal processing approach based on subtraction of several independent NMR spectra to show that rapamycin binds to the TRPM8 protein and not to the surrounding membrane or other proteins. While interesting and potentially useful, the method is not well developed (several positive controls are missing) and is not presented in a clear manner, such that the quality of data can be assessed and the reliability and pertinence of the subtraction procedure evaluated.

      Recommendations for the authors:

      Reviewer #1 (Recommendations For The Authors):

      Major points

      (1) Given the novelty of the STTD NMR approach, please provide more details and data for the reader.

      • I would like to see all of the collected spectra so that readers can see and judge the effect sizes for themselves, perhaps as an additional supplementary figure.

      We agree with the reviewer that the data transparency of the NMR measurements should be improved. We changed panel C of Figure 2 in the main text and provided all the STD and the computed STDD and STTD spectra recorded on one set of experiments. We carried out additional experimental replicas on new samples and addressed the variability of cell samples by rescaling the STD effects based on reference <sup>1</sup>H measurements. We provided supplementary spectra of the reference experiments without saturation (Figure S5) and the obtained STTD spectra from the three parallel NMR sessions (Figure S6).

      • I appreciate the labels for STDD-1, STDD-2, and STTD on the lower two spectra of Figure 2C. Is the top spectrum from STD-1 or is it prior to saturation? In Figure 2C, what do the x1 and x2 notations on the right-hand side of the spectra indicate?

      We showed the top spectrum as an overview and a demonstration of the spectral complexity of the samples. <sup>1</sup>H experiments were run before the STD measurements to assess the sample quality and stability. The demonstrated spectrum on sample 1 (TRPM8 with rapamycin in HEK cells) was recorded with more transients than the corresponding STDs, thus it is only visually comparable with the difference spectra after scaling (2x). Figure 2 was changed and all the spectra were replaced as mentioned before. All the recorded <sup>1</sup>H-experiments without saturation including the one removed are now available in the supplementary information (Figure S5).

      • The STTD NMR results with WT TRPM8 are consistent with rapamycin binding directly to the channel. Testing whether rapamycin binding observed with STTD NMR is disrupted by one of the most compelling mutations (D796A, D802A, G805A, or Q861A) would be a further test of this direct interaction.

      We thank the reviewer for the suggestion and agree that testing the most compelling mutants would be a promising next step. These mutations were generated in plasmid vectors and only transiently transfected into HEK cells. For NMR analysis we would need a high amount of cells stably overexpressing the mutant channels which were not available for experimentation.

      • Given that this is not a methods paper, it is probably outside the scope to further validate the STTD NMR measurements by performing parallel ITC, SPR, MST, or radiolabeled ligand experiments. Nevertheless, I would be excited to see such a comparison since STTD NMR appears to have promise as an experimental technique for assessing ligand binding to membrane proteins that does not require large amounts of purified protein or radioactive isotopes.

      We agree with the reviewer that additional independent biophysical measurements on the interactions are necessary to further validate the STTD methodology. This paper is a preliminary demonstration of the STTD concept and our group is currently working on the challenges of on-cell NMR (e.g., sample and spectral complexity) and the standardization of the proposed workflow.     

      (2) Please clarify the methods used to model of rapamycin binding. Docking can be imprecise in TRP channels, even with a sophisticated docking scheme (Hughes et al., 2019, doi: https://doi.org/10.7554/eLife.49572.001).  

      Thank you for mentioning this point and providing the reference. We have further clarified our methods and included the reference in our discussion, indicating the limitations of our approach.

      • As a positive control, does the docking strategy accurately predict binding of known compounds (menthol, icilin, etc.) to TRPM8 consistent with cryo-EM structures?  

      Yes, the binding site for menthol, based on a similar docking strategy as for rapamycin, is also presented, and matches with predictions from other publications. This is now clarified in the revised manuscript.

      • Why was homology modeling to the human sequence used with the mouse structure but not the avian structure?  

      At this onset of the project, only the avian structure was available, and it was used in the primary docking. Later, to get more precise docking relevant for human TRPM8 pharmacology, we did revert to the then available structure of the mouse ortholog.  

      • How many rapamycin structural clusters were built, and how many structures were there in each cluster? How many were used? "most populated" is unspecific.  

      Thank you for your comment. We have added the following highlighted information to the methods section to address your comment:

      “Representative conformations of rapamycin were identified by clustering of the 1000-membered pools, having the macrocycle backbone atoms compared with 1.0 Å RMSD cut-off. Middle structures of the ten most populated clusters, accounting for more than 90% of the total conformational ensemble generated by simulated annealing, were used for further docking studies. To refine initial docking results and to identify plausible binding sites, the above selected rapamycin structures were docked again, following the same protocol as above, except for the grid spacing which was set to 0.375 Å in the second pass. The resultant rapamycin-TRPM8 complexes were, again, clustered and ranked according to the corresponding binding free energies. Selected binding poses were subjected to further refinement. The three most populated and plausible binding poses were further refined by a third pass of docking, where amino acid side chains of TRPM8, identified in the previous pass to be in close contact with rapamycin (< 4 Å), were kept flexible. Grid volumes were reduced to these putative binding sites including all flexible amino acid side chains (21.0-26.2 Å x 26.2-31.5 Å x 24.8-29.2 Å).”

      However, it is important to clarify that the clusters are not built and their number is not specified by the user. The number of clusters found depends on how similar the structures are in the structural ensemble analyzed by clustering. A high number of clusters indicates a diverse, whereas a low number suggests a uniform structural ensemble. Furthermore, it is arbitrarily controlled by the similarity cutoff specified by the user. If the cutoff is selected well, then the number of structures is different in each cluster. There are some highly populated clusters and a few which only have one structure. The selection of how many cluster representatives are used is usually based on the decision of whether or not the sum of the population of selected clusters sufficiently covers the mapped conformational space.

      • Additionally, the rapamycin poses were generated using a continuum solvent model that is unlikely to replicate the conditions existing in the lipid bilayer or in a lipid-exposed binding pocket as is predicted here. It is therefore possible that the rapamycin poses chosen for docking do not represent the physiological rapamycin binding pose, hampering the ability of the docking algorithm to find an appropriate docking pocket.  

      • Furthermore, accurately docking that may bind to membrane-exposed pockets is a challenging problem, particularly because many scoring algorithms, including those employed by Autodock, do not distinguish between solvent-exposed and membrane-exposed faces of the protein. This affects the predicted binding energies.  

      We appreciate the reviewer's insightful comments. We add a note in discussion part, mentioning these important limitations.  

      • In Figure 4, it appears that the proposed rapamycin binding pocket is located at the interface between two subunits, but only one is shown. Is there any contact with residues in the neighboring subunit? Based on Figure S4, I assume not, but am unsure.

      Based on the estimated distances, we do not think that there are any relevant interactions with residues from neighboring subunits. This is now indicated in the results section.

      • Consider uploading the rapamycin-docked model to a public repository such as Zenodo for readers to examine and manipulate themselves  

      As suggested, the model will be uploaded in a public repository. A link to the file on Zenodo is now included.

      (3) Please discuss the spatial location of the proposed rapamycin binding pocket relative to the vanilloid binding pocket in TRPV1.

      • The mutagenesis indicates that D745, D802, G805, and Q861 are most important for rapamycin sensitivity in TRPM8. Interestingly, the proposed rapamycin binding pocket appears to overlap spatially with the vanilloid binding pocket in TRPV1. Consistent with this, Q861 aligns with E570 in TRPV1, which is a critical residue for resiniferatoxin sensitivity. Indeed, similar to Q861's modeled proximity to the cyclohexyl ring, the hydroxyl group of the vanillyl moity of capsaicin (4DY in 7LR0, for example) is in proximity to E750 in TRPV1. Additionally, searching PubChem by structural similarity suggests that vanillyl head group of the TRP channel modulators capsaicin and eugenol are similar structurally to the trans-2Methoxycyclohexan-1-ol ring. Without overlaying the two structures myself, it is difficult to say more than that, but I encourage the authors to comment on any similarities and differences they observe.

      • If the proposed rapamycin pocket is indeed similar to the location of the vanilloid binding site, the authors may wish to discuss other TRPM channel structures that show ligands and lipids bound to this pocket because this provides evidence that this pocket influences TRPM channel function. For example, how does the proposed rapamycin binding pocket compare to TRPM8 bound to agonist AITC (PDBID 8e4l), TRPM5 bound to inhibitor NDNA (7mbv), and TRPM2 bound to phosphatidylcholine (6co7)?

      • Other TRP channel structures with ligands or lipids modeled in this region include TRPV1 bound to resiniferatoxin, capsaicin, or phosphatidylinositol (7l2j, 7l24, 7l2s, 7l2t, 7l2u, 7lp9, 7lpc, 7lqy, 7mz6, 7mz9, 7mza); TRPV3 bound to phosphatidylcholine (7mij, 7mik, 7mim, 7min, 7ugg); TRPV5 bound to econazole (6b5v) or ZINC9155 (6pbf); TRPV6 bound to piperazine (7d2k, 7k4b, 7k4c, 7k4d, 7k4e, 7k4f) or cholesterol hemisuccinate (7s8c); TRPC6 bound to BTDM (7dxf) or phosphatidylcholine (6uza); and TRP1 bound to PIP2 (6pw5).

      We thank the reviewer for these valuable insights. We have included some additional discussion highlighting the similarities between the proposed rapamycin binding site and some of the other ligandchannel interactions in the TRP superfamily, in particular the well-known vanilloid binding site in TRPV1. However, to keep the discussion focused, we have not fully discussed all the indicated interactions, to best serve the clarity and scope of the manuscript.  

      (4) I would like to see negative control calcium imaging and electrophysiology data with untransfected HEK cells to confirm that the observed activation is mediated by TRPM8 to parallel the TRPM8 KO sensory neuron experiments.  

      This important information is now included in the revised manuscript (Figure S2).

      (5) The DM-nitrophen Ca uncaging experiments are an interesting method to test Ca sensitivity of rapamycin, but the results make these experiments more complex to interpret. Ca has been shown to be an obligate cofactor for icilin sensitivity in TRPM8 under conditions where both the internal and external Ca concentrations are tightly controlled (Kuhn et al., 2009, doi: https://doi.org/10.1074/jbc.M806651200), which is necessary because TRPM8 allows Ca permeation through the pore when open. The large icilin-evoked currents in Figure 5A and 5B indicate that the effective intracellular calcium concentration is not zero prior to calcium uncaging, which may be high enough to mask any Ca-dependence of rapamycin that occurs at low Ca concentrations. Given this ambiguity, the inside-out patch clamp configuration would provide more control over the internal and external Ca concentration than is achieved in the Ca uncaging experiments. Because the authors have already demonstrated their ability to perform such experiments (Figure 2 panel B), it would be nice to see tests of Ca dependence using inside-out patch clamp.

      As was already shown in Figure 2, Rapamycin activates TRPM8 in inside-out patches, and these experiments were performed using calcium-free cytosolic and extracellular solutions. Note that earlier studies have already shown that icilin activates outward TRPM8 currents in the full absence of calcium: see e.g. Janssens et al. eLife, 2016. Chuang et al. 2004. In the case of Icilin, increased calcium further potentiates the current, which is more prominent for the inward current.

      In the Ca uncaging experiments, considering the Kd of DM-nitrophen of 5 nM, we expect that the intracellular calcium concentration before the UV flash would be approximately 15 nM. Taken together, both the inside-out experiments and the flash uncaging experiments confirm that rapamycin responses are not directly regulated by intracellular calcium, contrary to icilin.

      (6) Sequence conservation within TRPM channels could be used in combination with the binding pocket model and mutagenesis to predict rapamycin selectivity for TRPM8 over other TRPMs. For example, some important residues, specifically G805 and Q861, are not conserved in TRPM3, which agrees with the lack of rapamycin sensitivity observed in TRPM3 (Figure S1). Further sequence comparison would provide testable hypotheses for future exploration of rapamycin sensitivity in other TRPMs that could validate the proposed binding pocket.

      Thank you for the suggestion. We now indicate in the discussion that only some of the key residues are conserved and make suggestions for future studies.  

      (7) Please unify the color scheme across the figures to improve clarity.

      • The authors frequently use the colors blue, red, and green to represent menthol and rapamycin in the figures, but they are inconsistent in which one represents menthol and which represents rapamycin. It would be clearer for the audience if, for example, rapamycin is always represented with red and menthol is always represented with blue.  

      Thank you for pointing this out. We have made the coloring schemes more uniform.

      • In Figure 1, panel E, the coloring for Menthol and Pregnenolone Sulfate changes between the TRPM8+/+ and TRPM8-/- panels.  

      Thank you for pointing this out. We have updated the coloring schemes to ensure consistency between the TRPM8+/+ and TRPM8-/- panels.

      • Figure 3 B and E, perhaps color the plot background as a 3-color gradient (blue to white to red) rather than yellow and aqua. Center the white at the WT ratio, keeping the dashed line, with diverging gradients to, for example, blue for mutations that selectively affect menthol sensitivity and red for rapamycin.

      Thank you for the suggestion – we have changed the figure accordingly.  

      • Figure 4 panels A and B use the same color (green) to show two different things (menthol molecule and mutated residues that affect rapamycin sensitivity). It would be clearer for readers to change these colors to agree with a unified color scheme such that, for example, the menthol molecule is colored blue and the rapamycin-neighboring residues are colored red.

      Thank you for the suggestion. We have updated the figure to use a unified color scheme, with the menthol molecule now colored green and the rapamycin-neighboring residues colored cyan, to enhance clarity for readers.

      • I recommend adding a figure or panel that shows side chains for all mutations, colored by menthol/rapamycin selectivity, as indicated by the functional data in Figure 3B and 3E. This will highlight spatial patterns of the selective residues that are discussed in the text.

      Thank you for your suggestion, we added all the side residues in Figure S10.

      Minor points

      (1) It would be nice to have one more concentration data point in the middle of the dose response curve shown in Figure 1 panel B. The response is not saturating at the top or foot of the curve in Figure 1 panel D, precluding a confident fit to a two-state Boltzmann function.

      Instead of adding a single data point to this figure, we performed independent measurements on a plate reader system, comparing concentration responses at room temperature and 37 degrees. These data are now included as Figure S1.   

      (2) The cartoon in Figure 2 panel B should be made more accurate. For example, only the transmembrane helices should be depicted embedded in the membrane, not the whole protein including the intracellular domain. Because the experiment was performed with cells, change the orientation of TRPM8 in the cartoon to show the intracellular domain of the protein facing away from the extracellular side of the membrane where the rapamycin is applied.

      Thank you for this comment. We have corrected the cartoon accordingly

      (3) Perhaps put the yellow circles under or around the carbon atoms to which the identified hydrogen atoms belong in Figure 2 panel E and Figure 4 panel C. I found it difficult to visualize and compare the STTD NMR results with the predicted binding pocket.

      Thank you for the feedback. We have added yellow circles around the carbon atoms corresponding to the identified hydrogen atoms in Figure S9.  

      (4) Regarding the sentence on p. 12 beginning "In agreement with this notion..."

      • Include icilin, Cooling Agent-10, and WS-3 as other cooling agents whose sensitivity has been modulated by mutation of Y745

      • Cryosim-3 responses were not tested in either of the two papers cited; please add citation to Yin et al., 2022, doi: https://doi.org/10.1126/science.add1268 .

      • Other relevant papers include:

      – Malkia et al., 2009, doi: https://doi.org/10.1186/1744-8069-5-62 which includes molecular docking showing the hydroxyl group of menthol interacting with Y745

      – Beccari et al., 2017, doi: https://doi.org/10.1038/s41598-017-11194-0 Figure 5 shows disruption of icilin and Cooling Agent-10 sensitivity by Y745A

      – Palchevskyi et al., 2023, doi: https://doi.org/10.1038/s42003-023-05425-6 Figure 3 shows disruption of icilin, cooling agent-10, WS-3, and menthol sensitivity by Y745A o Plaza-Cayon et al., 2022, https://doi.org/10.1002%2Fmed.21920 Review of TRPM8 mutations

      • typo: Y754H should be Y745H

      Thank you for these suggestions. We have added the above references to the text and corrected the typo.

      (5) The authors use the competitive action of everolimus on rapamycin activation as evidence that the different macrolides are binding to the same binding pocket. In addition, prior work showed that Y745H and N799A mutations (which render TRPM8 insensitive to menthol and icilin, respectively) do not affect TRPM8 sensitivity to the structurally-related compound tacrolimus (Arcas et al., 2019). This is consistent with the docking and mutagenesis results presented here.

      Thank you for this valuable suggestion. We discuss these data in the revised version.

      (6) Rapamycin sensitivity has also been observed in TRPML1 (Zhang et al. 2019, doi: https://doi.org/10.1371/journal.pbio.3000252).

      We added a short reference to this interesting finding in the discussion.

      (7) The whole-cell currents are very large in several of the electrophysiology experiments (for example Figure 3 panel D and Figure S1), which could lead to artifacts of voltage errors as well as ion accumulation/depletion. However, because this paper is not relying on reversal potential measurements or trying to quantify V1/2, these errors are unlikely to affect the qualitative conclusions drawn.

      This is a fair point, but indeed unlikely to affect our main conclusions. Note that we compensated between 70 and 90% of the series resistance, so we don’t expect voltage errors exceeding ~10 mV.

      (8) Ligand sensitivity is frequently species-dependent in TRP channels, so it is interesting that multiple species were used here and that both human and mouse isoforms exhibit rapamycin sensitivity. It should be emphasized that human TRPM8 was used in the calcium imaging and electrophysiology experiments, as well as some docking models, while the mouse isoform was used in the sensory neuron experiments and a mutated avian isoform was used for some docking models.

      This information is available in the Methods and we believe it is clear for the readers.

      (9) Perhaps discuss the unclear mechanism of G805A action in icilin (but not menthol, cold, or praziquantel) sensitivity because it is not in direct contact with the ligand. For example, Yin et al., 2019 propose flexibility allowing Ca binding site and larger binding site for icilin.

      Yin et al. (2019) suggests that the G805A mutation impacts icilin sensitivity by influencing the flexibility of the binding site and possibly affecting calcium binding. In our study, we found that G805A significantly reduces rapamycin sensitivity, likely due to its direct role in the rapamycin binding pocket rather than affecting calcium binding. This is now briefly mentioned in the results section.

      (10) The Figure S1 legend indicates that n=5 for all panels, so please show normalized population IV curves rather than individual examples. Additionally, it would be interesting to see what happens when each agonist is co-applied with rapamycin. Does rapamycin potentiate or inhibit agonist activation in these channels and/or TRPM8?

      We believe that normalized population IVs are not ideal for representing whole-cell currents, considering the substantial variation in current densities. We therefore prefer to show example traces in Figure S3 of the revised version but include mean values of current densities for all tested cells in the text.

      While the effects of co-application of rapamycin with activating ligands could be of interest, we consider this somewhat outside the scope of the present manuscript. The combination of HEK293 cell experiments, along with results obtained in WT and TRPM8-deficient mice does, in our opinion, sufficiently describe the selectivity of rapamycin towards TRPM8 compared to other sensory TRP channels.

      (11) Figure S1 panel A does not contain units for Rapamycin or AITC concentrations.

      Thank you for pointing this out. The units were added to the figure.  

      (12) It would be nice if the authors characterized the different mutations as predicted to contribute to site 1 (D796, H845, Q861, based on Figure S4), site 2 (D796, M801, F847, and R851), and/or site 3 (F847, V849, and R851).

      The indicated mutants were all tested, as shown in Figure 3.

      (13) The numbering scheme in Figure S4 does not appear to match the residue numbers in the rest of the paper for certain residues (HIS-844 rather than H845, PHE-846 rather than F847, VAL-848 rather than V849, ARG-850 rather than R851, and GLN-860 rather than Q861), and labels are often overlapping and difficult to see. I also find the transparent spheres very difficult to distinguish from the transparent background, which makes it difficult to appreciate the STTD NMR data overlay.

      We apologize for the confusing numbering scheme. The lower numbers refer to the initial docking that was done using the avian TRPM8 ortholog. We have made a newer, clearer version of Figure S4 and inserted as Figure S9.  

      (14) Please superpose the Ligplots in Figure S5 panels E and F as described in the LigPlus manual (https://www.ebi.ac.uk/thornton-srv/software/LigPlus/manual/manual.html) to facilitate easier comparison.

      Thank you for the suggestion. We followed the suggestion to superpose the Ligplots as described but found that the result was visually cluttered and difficult to interpret. To avoid confusion, we instead decided to remove panels E and F from Figure S5, as we believe that the visualization in panels A-D is clear and informative.

      (15) Some n values are missing in figure legends.

      We checked all legends, and added n numbers were missing.

      (16) There is an inconsistent specification of error bars as SEM in the figure legends, though it is specified in methods.

      A question for my own edification: Here, you have looked at ligand interactions with the protein by saturating the protein resonances and observing transfer to the ligand. Would it be possible to instead saturate lipid or solute resonances and observe transfer to a ligand? I am curious whether this would be one way to measure equilibrium partitioning of ligand into a membrane and/or determine the effective concentration of a ligand in the membrane. Additionally, could one determine whether the compound is fully partitioned into the center of the membrane or just sitting on the surface?

      The reviewer highlights an interesting aspect. The widely used WaterLOGSY NMR experiment (doi: 10.1023/a:1013302231549) saturates water molecules then the magnetization is transferred to the ligand of interest. Characteristic changes in ligand resonances are observed in the case of a binding event with proteins. On the other hand, the selective saturation of lipids is -while theoretically possible –technically challenging mainly because of the inherent low signal-dispersion of lipids and peak overlapping with ligand resonances. Additionally, lipid systems are more dynamic compared to proteins and ligand-lipid interactions could be weaker and less specific, significantly affecting the sensitivity of STD experiments.

      Reviewer #2 (Recommendations For The Authors):

      Major:

      • Is it feasible to test rapamycin on TRPM8 with single-channel recording? This will allow us to better probe the mechanism of rapamycin activation and compare it with menthol, with parameters of singlechannel conductance and maximal open probability.

      In our experience, it is very difficult to obtain single-channel recordings from TRPM8. The channel expresses at high densities, typically leading to patches contain multiple channels, making a proper analysis of mean open and closed times very difficult. Therefore, we have decided not to include such measurements in the manuscript.

      • The authors classified rapamycin as a type I agonist, the type that stabilizes the open conformation, same as menthol but more prominent. Does that indicate that rapamycin work synergistically (rather than independently) with menthol, because co-application of them can allow them to add to each other in stabilizing the open conformation? I wonder if the authors agree that this could be tested with experiments as in Figure S3, by showing a much more prolonged deactivation with co-application of menthol and rapamycin than applying each alone.

      Thank you for the insightful suggestion. We conducted co-application experiments, and our results show that the deactivation time is indeed significantly prolonged when both compounds are applied together compared to each alone. In fact, very little deactivation is seen when both compounds are co-applied, which made it virtually impossible to perform reliable fits to the deactivation time course for the Menthol+Rapamycin condition. Instead, we have now included summary results showing the percentage of deactivation after 100 ms. We included these findings in FigureS8.  

      • It could be tested whether rapamycin activation of TRPM8 requires or overrides the requirement of PIP2 with inside-out patch by briefly exposing the patch to poly-lysine to sequester PIP2.

      This is certainly a good suggestion for further follow-up studies. However, we considered that examination of the (potential) interaction between ligands and PIP2 was outside the scope of the current manuscript.

      • Figure 1C suggests that the authors test rapamycin when there is a relatively high baseline TRPM8 activation (prior to rapamycin) activation. This raises the possibility that rapamycin is more a potentiator than an activator. I wonder if the following two experiments could address it: (1) perfuse rapamycin while holding at different membrane potentials, wash-off rapamycin in the solution and quickly (in a few seconds) test the activated current magnitude (before rapamycin dissociation), to compare whether a more depolarized membrane potential (high baseline open probability) allows rapamycin to potentiate more. (2) Perform the experiment at a higher temperature (low baseline open probability) and test whether rapamycin EC50 shifts to the right.

      Thank you for the thoughtful suggestion. Overall, we are not really in favor of making a distinction between a potentiator and an activator since it is not really feasible to create a situation where TRPM8 activity is zero. As suggested, we performed the dose response experiment at a higher temperature (37 °C) and observed that rapamycin’s EC<sub>50</sub> shifts to the right FigureS2. This is similar to what has been observed for menthol on TRPM8 and for many other ligands on other temperature-sensitive TRP channels.

      Minor:

      (1) The author should report hill coefficient together with EC50 when showing dose-responses.

      We have added Hill coefficients for all the fits.

      (2) In Figure 1 (E, F), it might be clearer to use Venn-diagram to show whether there is overlapping among rapamycin-, menthol-, and cinnamaldehyde-responsive neurons. According to the authors' explanation, we can predict that rapamycin-insensitive, menthol-sensitive neurons should predominantly be cinnamaldehyde-responsive.

      Thank you for your suggestion. In these experiments, we applied several agonists and the combination of them would result in a visually crowded Venn diagram difficult to interpret. However, we agree, with the reviewer’s suggestion, and discuss the percentage of the cinnamaldehyde+ neurons in the rapa- menthol+ population in Trpm8<sup>-/-</sup> neurons.

      (3) In Figure 3(C), since F847 does not respond to either menthol or rapamycin, it should be excluded from (B). Otherwise it is misleading.

      Thank you for pointing this out. To clarify, we have included a calcium imaging trace for the F847 mutant, demonstrating a clear response to rapamycin in FigureS9. This additional data highlights that F847 does respond to rapamycin, albeit with a more modest response amplitude. This is now also clarified in the results section.  

      (4) The word "potency" in pharmacology usually refers to a smaller EC50 number in dose-dependent experiments. In "Effect of rapamycin analogs on TRPM8" session, the authors use "potency" to refer to response to a single-dose experiment of different compounds. The experiment does not measure potency.

      Thank you for pointing out this mistake. We have corrected the text and replaced “potency” with “efficacy”.

      (5)  "2-methoxyl-" is misspelled in the text body.

      We have corrected the typo.

      (6) It will be nice to include "vehicle" in Figure 6B, or alternatively normalize all individual traces to vehicle. In Figure 6C and D, everolimus has almost no effect with compared to vehicle, and should not be shown as if it had ~8% in Figure 6B.

      We have added the vehicle values to Figure 6B from the same experiments.

      Reviewer #3 (Recommendations For The Authors):

      (1) The NMR method presented here as novel and employed to identify a proposed molecule bound to a membrane protein (TRPM8 in this case) is not well explained and presented. Since several spectra need to be subtracted, the authors should present the raw data and the results of the subtractions step by step. Also, it seems that the height of the peaks in each spectra will be highly variable and thus a reliable criterion employed to scale spectra before subtraction. None of these problems are discussed of described.

      The reviewer is right, that the data transparency should be improved and due to the high molecular complexity of the samples the size of the STD effects should be carefully scaled. We carried out additional experimental replicas on new samples and addressed the inherent sample/peak height variability by rescaling the STD effects based on reference <sup>1</sup>H measurements. We provided supplementary spectra of the reference experiments without saturation (Figure S5) and the computed STTD spectra from three parallel NMR sessions (Figure S6). We changed panel C of Figure 2 in the main text and provided all the STD and the computed STDD and STTD spectra recorded on one set of NMR experiments. We added the following paragraph to the main text: “To address the effect of the inherent variability of cellular samples on peak heights, STD effects were normalized based on the comparison of independent <sup>1</sup>H experiments (Figure S5). Three STTD replicates were computed, unambiguously confirming direct binding to TRPM8 in two datasets (Figure S6 A,B)”.

      Importantly since this signal subtraction method is proposed as a new development, control experiments employing well-established pairs of ligand and membrane protein receptor should be performed to demonstrate the reliability of the method.

      We agree with the reviewer, that the STTD experiment as a new development needs further validation, however, this paper is a preliminary demonstration of a new strategy building on the well-established STD and STDD NMR methodologies. Our group is actively engaged in studying additional biological samples to enhance our understanding of the applicability of STTD NMR. These efforts also aim to address challenges such as sample and spectral complexity by refining and standardizing the proposed workflow.

      (2) The tail currents shown in supplementary figure 3 are clearly not monoexponential. The fit to a single exponential can be seen to be inadequate and thus the comparison of kinetics of control, rapamycin and menthol is incorrect. At least two exponentials should be fitted and their values compared.

      We agree that the decay in the (combined) presence of agonists deviates from a simple monoexponential behavior. While we agree that fitting with two (or more) exponentials would provide a better fit, this also comes with greater variations/uncertainties in the fit parameters. This is particularly the case when inactivation is very slow and incomplete, or when the difference between slow and fast exponential time constants is <5, as seen with rapamycin and rapamycin +menthol. Therefore, we decided to provide monoexponential time constants as a proxy to describe the clear slowing down of activation and deactivation time courses in the presence of Type I agonists.   

      Also related to this aspect, recordings of TRPM8 currents can not be leak subtracted with a p/n protocol, thus a large fraction of the initial tail current must be the capacitive transient. There is no indication in the methods of how was this dealt with for the fitting of tail currents.

      As explained in the methods, capacitive transients and series resistance were maximally compensated. Therefore, we do not agree that a large fraction of the initial tail current must be capacitive. This can also be clearly seen in experiment such as Figure 1C, where the inward tail current is fully abolished in the presence of a TRPM8 antagonist. Likewise, very small and rapidly inactivating tail currents can be seen during voltage steps under control conditions (e.g. Figure S7  and S8 in the revised version).  

      (3) The docking procedure employed, as the authors show, is not appropriate for membrane proteins since it does not include a lipid membrane. It is not clear in the methods section if the MD minimization described applies only to the rapamycin molecule or to rapamycin bound to TRPM8.  

      It is also not clear if the important residue Q861 (and other residues that are identified as interacting with rapamycin) were identified from dockings or proposed based on other evidence.

      (4) Identifying amino acid residues that diminish the response to a ligand, does not uniquely imply that they form a binding site or even interact with said ligand. It is entirely possible that they can be involved in the allosteric networks involved in the activating conformational change. This caveat should be clearly posited by the authors when discussing their results.

      In our study, we identified several residues that significantly reduce the response to rapamycin when mutated, while retaining robust responses to menthol, which indicates that these mutations do not affect crucial conformational changes leading to channel gating. While our cumulative data suggest that these residues may be involved in direct interaction with rapamycin, we recognize the alternative possibility that they allosterically affect rapamycin-induced channel gating. This is now clearly stated in the first paragraph of the discussion.

    1. Author response:

      The following is the authors’ response to the original reviews.

      Reviewer 1 (Public Review):

      • While the title is fair with respect to the data shown, in the summary and the rest of the paper, the comparison between anesthetized and awake conditions is systematically stated, while more caution should be used.

      First, isoflurane is one of the (many) anesthetics commonly used in pre-clinical research, and its effect on the brain vasculature cannot be generalized to all the anesthetics. Indeed, other anesthesia approaches do not produce evident vasodilation; see ketamine + medetomidine mixtures. Second, the imaged awake state is head-fixed and body-constrained in mice. A condition that can generate substantial stress in the animals. In this study, there is no evaluation of the stress level of the mice. In addition, the awake imaging sessions were performed a few minutes after the mouse woke up from isoflurane induction, which is necessary to inject the MB bolus. It is known that the vasodilator effects of isoflurane last a long time after its withdrawal. This aspect would have influenced the results, eventually underestimating the difference with respect to the awake state.

      These limitations should be clearly described in the Discussion.

      Looking at Figure 2e, it takes more than 5' to reach the 5 Millions MB count useful for good imaging. However, the MB count per pixel drops to a few % at that time. This information tells me that (i) repeated measurements are feasible but with limited brain coverage since a single 'wake up' is needed to acquire a single brain section and (ii) this approach cannot fit the requirements of functional ULM that requires to merge the responses to multiple stimuli to get a complete functional image. Of course, a chronic i.v. catheter would fix the issue, but this configuration is not trivial to test in the experimental setup proposed by the authors, hindering the extension of the approach to fULM.

      Thank you for highlighting these limitations, as they address aspects that were not fully considered during the experimental design and manuscript writing. In response, we have added the following paragraphs to the discussion section, addressing these limitations of our study:

      (Line 310) “Although isoflurane is widely used in ultrasound imaging because it provides long-lasting and stable anesthetic effects, it is important to note that the vasodilation observed with isoflurane is not representative of all anesthetics. Some anesthesia protocols, such as ketamine combined with medetomidine, do not produce significant vasodilation and are therefore preferred in experiments where vascular stability is essential, such as functional ultrasound imaging(47). Therefore, in future studies, it would be valuable to design more rigorous control experiments with larger sample sizes to systematically compare the effects of isoflurane anesthesia, awake states, and other anesthetics that do not induce vasodilation on cerebral blood flow.

      Our proposed method enabled repeatable longitudinal brain imaging over a three-week period, addressing a key limitation of conventional ULM imaging and offering potential for various preclinical applications. However, there are still some limitations in this study. 

      One of the limitations is the lack of objective measures to assess the effectiveness of head-fix habituation in reducing anxiety. This may introduce variability in stress levels among mice. Recent studies suggest that tracking physiological parameters such as heart rate, respiratory rate, and corticosterone levels during habituation can confirm that mice reach a low stress state prior to imaging(48). This approach would be highly beneficial for future awake imaging studies. Furthermore, alternative head-fixation setups, such as air-floated balls or treadmills, which allow the free movement of limbs, have been shown to reduce anxiety and facilitate natural behaviors during imaging(30). Adopting these approaches in future studies could enhance the reliability of awake imaging data by minimizing stress-related confounds.

      Another limitation of this study is the potential residual vasodilatory effect of isoflurane anesthesia on awake imaging sessions. The awake imaging sessions were conducted shortly after the mice had emerged from isoflurane anesthesia, required for the MB bolus injections. The lasting vasodilatory effects of isoflurane may have influenced vascular responses, potentially contributing to an underestimation of differences in vascular dynamics between anesthetized and awake state. Future applications of awake ULM in functional imaging using an indwelling jugular vein catheter presents a promising alternative to enable more accurate functional imaging in awake animals, addressing current limitations associated with anesthesia-induced vascular effects.”

      • Statistics are often poor or not properly described. 

      The legend and the text referring to Figure 2 do not report any indication of the number of animals analyzed. I assume it is only one, which makes the findings strongly dependent on the imaging quality of THAT mouse in THAT experiment. Three mice have been displayed in Figure 3, as reported in the text, but it is not clear whether it is a mouse for each shown brain section. Figure 5 reports quantitative data on blood vessels in awake VS isoflurane states but: no indication about the number of tested mice is provided, nor the number of measured blood vessels per type and if statistics have been done on mice or with a multivariate method.

      Also, a T-test is inappropriate when the goal is to compare different brain regions and blood vessel types.

      Similar issues partially apply to Figure 6, too.

      Thank you for bringing this to our attention. 

      We acknowledge that the statistical analyses were not clearly explained in the original version. In the revised manuscript, we have ensured that the statistical methods are clearly described. 

      (Fig.4 caption) “b,c, Comparisons of vessel diameter (b) and flow velocity (c) for the selected arterial and venous segments. Statistical analysis was conducted using t-test at each measurement point along the segments.”

      (Fig.6 caption) “b,c, Comparisons of vessel diameter (b) and flow velocity (c) for the selected arterial and venous segments. Statistical analysis was conducted using the two one-sided test (TOST) procedure, which evaluates the null hypothesis that the difference between the two weeks is larger than three times the standard deviation of one week.”

      Additionally, we corrected an error in the previous comparison of the violin plots on flow velocities, where a t-test was incorrectly applied; this has now been removed.

      We acknowledge that the original version did not clearly indicate the numbers of animals in the statistical analysis. In the revised manuscript, we have added Supplementary Figure 1 to specify the mice used, and we have labeled each mouse accordingly in the figures or captions. In the revised Figures 4 and 6, we have ensured that each quantitative analysis figure or its caption clearly indicate the specific mice.

      For original Figures 1 and 2, these are presented as case studies to illustrate the methodology. Since the anesthesia time required for tail vein injection for each animal varies slightly, it is challenging to have the consistent time taken for each mouse to recover from anesthesia across all mice. For instance, in Figure 1, the mouse took nearly 500 seconds to recover from anesthesia, but this duration is not consistent across all animals, which is a limitation of the bolus injection technique. We have noted this point in the discussion (discussion on the limitation of bolus injection), and we have also clarified in the results section and figure captions that these figures represent a case study of a single mouse rather than a standardized recovery time for all animals.

      We further clarified this point in the end of the Figure 2 caption:

      (Fig.2 caption) “This figure presents a case study based on the same mouse shown in Fig 1. The x-axis for d-f begins at 500 seconds because, at this point, the mouse’s pupil size stabilized, indicating it had recovered to an awake state. Consequently, ULM images were accumulated starting from this time. It is important to note that not every mouse requires 500 seconds to fully awaken; the time to reach a stable awake state varies across individual mice.” We added the following statement before introducing Figure 1e:

      (Line 93) “Due to differences in tail vein injection timing and anesthesia depth, the time required for each mouse to fully awaken varied. Although it was not feasible to get pupil size stabilized just after 500 seconds for each animal, ULM reconstruction only used the data that acquired after the animal reached full pupillary dilation, to ensure that ULM accurately captures the cerebrovascular characteristics in the awake state.”

      We added the following statement before introducing Figure 2d:

      (Line 139) “To further verify that the proposed MB bolus injection method can help to achieve ULM image saturation shortly after mice awaken from anesthesia, an analysis on the change in MB concentration over time was conducted once pupil size had stabilized (T = 500s).”

      For Figures 3, 4, and 5 (in the revised version, Figures 4 and 5 have been combined into a single Figure 4), the data represents results from three individual mice, with each coronal plane corresponding to a different mouse. In the revised version, we have added labels to indicate the specific mouse in each image to improve clarity. We also recognize that some analyses in the original submission (original Figure 5) may have lacked sufficient statistical power due to the small sample size. Therefore, in the revised version, we have focused only on findings that were consistently observed across the three mice to ensure robust conclusions.

      Reviewer 1 (Recommendations For the Authors):

      • If the study's main goal is to compare awake vs anesthetized ULM, the authors should test at least another anesthetic with no evident vasodilator effect.

      Thank you for this valuable suggestion. We would like to clarify that the primary aim of our study is not to comprehensively compare the effects of anesthesia versus the awake state, as a rigorous comparison would indeed require a more controlled experimental design, including additional anesthetics, a larger cohort of mice, and broader controls to ensure sufficient statistical power. We also add the following statement in the Discussion to clarify this point:

      (Line 314) “Therefore, in future studies, it would be valuable to design more rigorous control experiments with larger sample sizes to systematically compare the effects of isoflurane anesthesia, awake states, and other anesthetics that do not induce vasodilation on cerebral blood flow.”

      We acknowledge that the initial organization of Figures 3–5 placed excessive emphasis on comparisons between the awake and anesthetized states, but without yielding consistently significant findings. Meanwhile, our longitudinal observations in original Figure 6 were underrepresented, despite their potential importance.

      In the revised version, we shifted our focus toward the main goal of awake longitudinal imaging. By consolidating the previous Figures 4 and 5 into the new Figure 4, we emphasize conclusions that are both more consistent and broadly applicable, avoiding areas that may lack sufficient rigor or consensus. Additionally, we expanded the quantitative analysis related to longitudinal imaging, highlighting its role as the ultimate objective of this study. The awake vs. anesthetized ULM comparison was intended to demonstrate the value of awake imaging and introduce the importance of awake longitudinal imaging. In the revised text, we have reframed this comparison to emphasize the specific response to isoflurane rather than a general response to anesthesia. For example, in Figures 3 and 4, we have replaced the original term "Anesthetized" with "Isoflurane". We have also added a discussion noting that isoflurane may induces more vasodilation than other anesthetic agents.

      (Line 310) “Although isoflurane is widely used in ultrasound imaging because it provides long-lasting and stable anesthetic effects, it is important to note that the vasodilation observed with isoflurane is not representative of all anesthetics. Some anesthesia protocols, such as ketamine combined with medetomidine, do not produce significant vasodilation and are therefore preferred in experiments where vascular stability is essential, such as functional ultrasound imaging(47).”

      • The claims made about the proposed experimental protocol to be suitable for the "long-term" (line 255) are not supported by the data and should be modified according to the presented evidence.

      Thank you for your valuable feedback. We agree that our current three-week experimental results do not yet fulfill the requirements for extended longitudinal imaging that may span several months. We have revised the relevant text accordingly. For instance, the phrase “Our proposed method enabled long-term, repeatable longitudinal brain imaging” has been modified to “Our proposed method enabled repeatable longitudinal brain imaging over a threeweek period.” (Similar changes also in Line 67, Line 318, and Line 337) Additionally, we have added the following paragraph in the discussion section to indicate that extending the monitoring period to several months is a meaningful direction for future exploration:

      (Line 337) “In our longitudinal study, consistent imaging results were obtained over a three-week period, demonstrating the feasibility of awake ULM imaging for this duration. However, for certain research applications, a monitoring period of several months would be valuable. Extending the duration of longitudinal awake ULM imaging to enable such long-term studies is a potential direction for future development.”

      Recommendations for improving the writing and presentation:

      • Reporting the number of mice and blood vessels and statistics for each quantitative figure.

      Thank you for highlighting this issue. We acknowledge that the quantitative figures in the previous version lacked clarity in specifying the number of mice, vessels, and associated statistics. In the revised version, we have ensured that each quantitative figure or its caption clearly indicate the specific mice, vessels, and statistical methods used. To further minimize any potential confusion, we have also added Supplementary Figure 1 to clearly label and reference each individual mouse included in the study.

      Minor corrections to the text and figures.

      • Line 22: "vascularity reduction from anesthesia" is not clear, nor it is a codified property of brain vasculature. Explain or rephrase.

      Thank you for your comment. We apologize for any confusion caused by the phrase “vascularity reduction from anesthesia” in the abstract. We agree that this phrasing was unclear without context. To improve clarity, we have revised this statement in the abstract to make it more straightforward and easier to understand. 

      (Line 24) “Vasodilation induced by isoflurane was observed by ULM. Upon recovery to the awake state, reductions in vessel density and flow velocity were observed across different brain regions.” 

      Additionally, we have added a section in the Methods titled Quantitative Analysis of ULM Images to provide a clear definition of vascularity. This section outlines how vascularity is quantified in our study, ensuring that our terminology is well-defined. 

      The following sentence shows the definition of vascularity:

      (Line 547) “Vascularity was defined as the proportion of the pixel count occupied by blood vessels within each ROI, obtained by binarizing the ULM vessel density maps and calculating the percentage of the pixels with MB signal.”

      We have also added an instant definition when it was firstly used in Results part:

      (Line 161) “When comparing vessel density maps, ULM images that are acquired in the awake state demonstrate a global reduction of vascularity, which refers to percentage of pixels that occupied by blood vessels.”

      • Line 76: putting the mice in a tube is also intended "To further reduce animal anxiety and minimize tissue motion" I agree with tissue motion, not with animal anxiety, which, indeed, I expect to be higher than if it could, for example, run on a ball or a treadmill.

      Thank you for pointing this out. We acknowledge the limitations of our setup regarding reducing animal anxiety. We have replaced the original phrase “to further reduce animal anxiety and minimize tissue motion” with “to further minimize tissue motion.” (Line 78) Additionally, we have added the following paragraph in Discussion section to address the limitations of our setup in reducing anxiety.

      (Line 321) “One of the limitations is the lack of objective measures to assess the effectiveness of head-fix habituation in reducing anxiety. This may introduce variability in stress levels among mice. Recent studies suggest that tracking physiological parameters such as heart rate, respiratory rate, and corticosterone levels during habituation can confirm that mice reach a low stress state prior to imaging(48). This approach would be highly beneficial for future awake imaging studies. Furthermore, alternative head-fixation setups, such as air-floated balls or treadmills, which allow the free movement of limbs, have been shown to reduce anxiety and facilitate natural behaviors during imaging(30). Adopting these approaches in future studies could enhance the reliability of awake imaging data by minimizing stress-related confounds.”

      • Line 79: PMP has been used by Sieu et al., Nat Methods, 2015; it should be acknowledged.

      Thank you for highlighting this. We have now included the reference to Sieu et al. Nat Methods, 2015 to appropriately acknowledge their use of PMP. (Line 81)

      • Figure: is there a reason why the plots start at 500 sec? What happened before that time?

      Thank you for your question regarding the starting time in the plots. Figures 1 and 2 are case studies using a single mouse to demonstrate the feasibility of our method. The “zero” timepoint was defined as the moment when anesthesia was stopped, and the microbubble injection began. However, the mouse does not fully recover immediately after anesthesia is stopped. As shown in Figure 1e, there is a period of approximately 500 seconds during which the pupil gradually dilates, indicating recovery. Only after this period does the mouse reach a relatively stable physiological state suitable for ULM imaging, which is why the plots in Figure 2 begin at T = 500 seconds.

      We recognize that this was not sufficiently explained in the main text and figure captions. In the revised manuscript, we have clarified this timing rationale in both the results section and the figure captions. We added the following sentence to the result section to introduce Fig.2d:

      (Line 139) “To further verify that the proposed MB bolus injection method can help to achieve ULM image saturation shortly after mice awaken from anesthesia, an analysis on the change in MB concentration over time was conducted once pupil size had stabilized (T = 500s).”

      We also added the following statement to note that this recover time varies across individual mice:

      (Line 154, Fig.2 caption) “This figure presents a case study based on the same mouse shown in Fig 1. The x-axis for d-f begins at 500 seconds because, at this point, the mouse’s pupil size stabilized, indicating it had recovered to an awake state. Consequently, ULM images were accumulated starting from this time. It is important to note that not every mouse requires 500 seconds to fully awaken; the time to reach a stable awake state varies across individual mice.”

      Reviewer 2 (Public Review):

      • The only major comment (calling for further work) I would like to make is the relative weakness of the manuscript regarding longitudinal imaging (mostly Figure 6), compared to the exhaustive review of the effect of isoflurane on the vasculature (3 rats, 3 imaging planes, quantification on a large number of vessels, in 9 different brain regions). The 6 cortical vessels evaluated in Figure 6 feel really disappointing. As longitudinal imaging is supposed to be the salient element of this manuscript (first word appearing in the title), it should be as good and trustworthy as the first part of the paper. Figure 6c. is of major importance, and should be supported by a more extensive vessel analysis, including various brain areas, and validated on several animals to validate the robustness of longitudinal positioning with several instances of the surgical procedure. Figure 6d estimates the reliability of flow measurements on 3 vessels only. Therefore I recommend showing something similar to what is done in Figures 4 and 5: 3 animals, and more extensive quantification in different brain regions.

      We thank the reviewer for pointing out this issue. We acknowledge that the first version of the manuscript lacked in-depth quantitative analysis in the section on the longitudinal study, which should have been a focal point. It also did not provide a sufficient number of animals to demonstrate the reproducibility of the technique. In this revised version, we have included results from more animals and conducted a more comprehensive quantitative analysis, with the corresponding text updated accordingly. Specifically, we combined the previous Figures 4 and 5 into the current Figure 4 (corresponding revised text from Line 169 to Line 207). The revised Figures 5 and 6

      compare the results of the longitudinal study, presenting data from three mice (corresponding revised text from

      Line 224 to Line 258). Detailed information about the mice used has been added to Supplementary Figure 1, and Supplementary Figure 4 further provides a detailed display of the results for the three mice in longitudinal study. We hope that these adjustments will provide a more thorough validation of the longitudinal imaging.

      Reviewer 2 (Recommendations For The Authors):

      Minor comments:

      • The statistical analyses are not always explained: could they be stated briefly in the legends of each figure, or gathered in a statistical methods section with details for each figure? Be sure to use the appropriate test (e.g. student t-test is used in Fig 5 k whereas normality of distribution is not guaranteed.)

      Thank you for pointing this out. We acknowledge that the statistical analyses were not clearly explained in the original version. In the revised manuscript, we have ensured that the statistical methods are clearly described. 

      (Fig.4 caption) “b,c, Comparisons of vessel diameter (b) and flow velocity (c) for the selected arterial and venous segments. Statistical analysis was conducted using t-test at each measurement point along the segments.”

      (Fig.6 caption) “b,c, Comparisons of vessel diameter (b) and flow velocity (c) for the selected arterial and venous segments. Statistical analysis was conducted using the two one-sided test (TOST) procedure, which evaluates the null hypothesis that the difference between the two weeks is larger than three times the standard deviation of one week.”

      Additionally, we corrected an error in the previous comparison of the violin plots on flow velocities, where a t-test was incorrectly applied; this has now been removed.

      • The authors use early in the manuscript the term vascularity, e.g. in "vascularity reduction", it is not exactly clear what they mean by vascularity, and would require a proper definition at that moment. If I am correct, a quantification of that "vascularity reduction" (page 5 line 132), is then done in Figures 5 d e f and j.

      Thank you for highlighting this issue. We acknowledge that our initial use of the term “vascularity” may have been unclear and potentially confusing. In the revised manuscript, we have included a clear definition of “vascularity” in the Methods section under Quantitative Analysis of ULM Images (Line 534). 

      The following sentence shows the definition of vascularity:

      (Line 547) “Vascularity was defined as the proportion of the pixel count occupied by blood vessels within each ROI, obtained by binarizing the ULM vessel density maps and calculating the percentage of the pixels with MB signal.”

      We have also added an instant definition when it was firstly used in Results part:

      (Line 161) “When comparing vessel density maps, ULM images that are acquired in the awake state demonstrate a global reduction of vascularity, which refers to percentage of pixels that occupied by blood vessels.”

      • There is very little motion in the images presented, except for the awake "Bregma -4.2 mm" (Figure 3, directional maps), especially in the area including colliculi and mesencephalon, while the cortical vessels do not move. Can you comment on that?

      Thank you for highlighting this important aspect of motion in awake animal imaging. Motion correction is indeed a critical factor in such studies. In the original version of our discussion, we briefly addressed this issue (from Line 342 to Line 346), but we agree that a more detailed discussion is needed.

      To minimize motion artifacts, we conducted habituation to acclimate the animals to the head-fixation setup, which helps reduce anxiety during imaging. With thorough head-fixed habituation, the imaging quality is generally well-preserved. We also applied correlation-based motion correction techniques based on ULM images, which can partially correct for overall brain motion, as stated in the previous version. However, this ULM-images-based correction is limited to addressing only rigid motion.

      In the revised discussion, we have expanded on the limitations of our current motion correction approach and referenced recent work about more advanced motion correction methods:

      (Line 346) “While rigid motion correction is often effective in anesthetized animals, awake animal imaging presents greater challenges due to the more prominent non-rigid motion, particularly in deeper brain regions. This is evidenced in Supplementary Fig. 1 (Mouse 7), where cortical vessels remain relatively stable, but regions around the colliculi and mesencephalon exhibit more noticeable motion artifacts, indicating that displacement is more pronounced in deeper areas. To address these deeper, non-rigid motions, recent studies suggest estimating nonrigid transformations from unfiltered tissue signals before applying corrections to ULM vascular images(16,50). Such advanced motion correction strategies may be more effective for awake ULM imaging, which experiences higher motion variability. The development of more robust and effective motion correction techniques will be crucial to reduce motion artifacts in future awake ULM applications.”

      • Figure 1f maybe flip the color bar to have an upward up and downward down.

      Thank you for your suggestion. This display method indeed makes the images more intuitive. In the revised manuscript, all directional flow color bars have been flipped to ensure that upward flow is displayed as ‘up’ and downward flow as ‘down.’

      • Figure 2b the figure is a bit confusing in what is displayed between dashed lines, solid lines, dots... maybe it would be easier to read with

      - bigger dots and dashed lines in color for each of the 4 series

      - and so in the legend, thin solid lines in the corresponding color for the fit, but no solid line in the legend (to distinguish data/fit)

      - no lines for FWHM as they are not very visible, and the FWHM values are not mentioned for these examples.

      Thank you for your detailed suggestions. We agree that the original Fig. 2b appeared messy and confusing. Based on this feedback and other comments, we decided to replace the FWHM-based vessel diameter measurement with a more stable binarization-based approach. In the revised version, we selected a specific segment of each vessel and measured the diameter by calculating the distance from the vessel’s centerline to both side after binarization. Each point on the centerline of this segment provides a diameter measurement, which can be further used to calculate the mean and standard error. This updated method is more stable and reproducible, providing reliable measurements even for vessels that are not fully saturated. It also facilitates comparison across more vessels, helping to further demonstrate the generalizability of our saturation standard. We believe these adjustments make the revised Fig. 2b clearer and more readable.

      • Page 7, lines 144-147. This passage is not really clear when linking going up or down and going from the stem to the branches that it is specific to Figure 4a (and therefore to this particular location).

      Thank you for your insightful comments on our vessel classification method. We recognize the limitations of the previous approach and, in order to enhance the rigor of the study, we have opted not to continue using this method in the revised manuscript. We have removed all content related to vessel classification based on branchin and branch-out criteria. This includes the original Classification of Cerebral Vessels section in the Methods, the relevant descriptions in the Results section under “ULM reveals detailed cerebral vascular changes from anesthetized to awake for the full depth of the brain”, limitation of this classification method in Discussion section, as well as related content in the original Figures 4 and 5.

      In the revised analysis, for the comparison between arteries and veins, we focus solely on penetrating vessels in the cortex. For these vessels, it is generally accepted that downward-flowing vessels are arterioles, while upwardflowing vessels are venules. Accordingly, in the revised Figures 4 and 6, we analyze arterioles and venules exclusively in the cortex, without relying on the previous classification method that could be considered controversial.

      • Page 11 line 222 "higher vascular density" seems unprecise.

      Thank you for pointing this out. We have revised the sentence to more precisely convey our observations regarding changes in vascular diameter and vascularity within the ROI. We present these findings as evidence of the vasodilation effect under isoflurane, in alignment with existing research. The revised statement is as follows:

      (Line 275) “Statistical analysis from Fig. 4 shows that certain vessels exhibit a larger diameter under isoflurane anesthesia, and the vascularity, calculated as the percentage of vascular area within selected brain region ROIs, is also higher in the anesthetized state. These findings suggest a vasodilation effect induced by isoflurane, consistent with existing research(20,40,41,43,44).

      • Discussion: page 12, lines 257-267: it is not exactly clear how 3D imaging will help for the differentiation of veins/arteries. However, some methods have already been proposed to discriminate between arteries and veins using pulsatility (Bourquin et al., 2022) or 3D positioning when vessels are overlapped (Renaudin et al., 2023). The latter can also help estimate the out-of-plane positioning during longitudinal imaging.

      Bourquin, C., Poree, J., Lesage, F., Provost, J., 2022. In Vivo Pulsatility Measurement of Cerebral Microcirculation in Rodents Using Dynamic Ultrasound Localization Microscopy. IEEE Trans. Med. Imaging 41, 782-792. https://doi.org/10.1109/TMI.2021.3123912

      Renaudin, N., Pezet, S., Ialy-Radio, N., Demene, C., Tanter, M., 2023. Backscattering amplitude in ultrasound localization microscopy. Sci. Rep. 13, 11477. https://doi.org/10.1038/s41598-023-38531-w

      Thank you for pointing this out. We have revised the relevant paragraph in the discussion to clarify the potential advantages of advances in ULM imaging methods, such as those based on pulsatility (as described by Bourquin et al., 2022) or backscattering amplitude (as demonstrated by Renaudin et al., 2023). These established methods could be helpful for longitudinal imaging. Below is the revised text in the discussion section:

      (Line 370) “Advances in ULM imaging methods can benefit longitudinal awake imaging. For instance, dynamic ULM can differentiate between arteries and veins by leveraging pulsatility features(51). 3D ULM, with volumetric imaging array(52,53), enables the reconstruction of whole-brain vascular network, providing a more comprehensive understanding of vessel branching patterns. Meanwhile, 3D ULM also helps to mitigate the challenge of aligning the identical coronal plane for longitudinal imaging, a process that requires precise manual alignment in 2D ULM to ensure consistency. Additionally, this alignment issue can also be alleviated in 2D imaging using backscattering amplitude method, which may assist in estimating out-of-plane positioning during longitudinal imaging(54).”

      Reviewer 3 (Public Review):

      • It is unclear whether multiple animals were used in the statistical analysis.

      Thank you for bringing this to our attention. We acknowledge that the original version did not clearly indicate the use of animals in the statistical analysis. In the revised manuscript, we have added Supplementary Figure 1 to specify the mice used, and we have labeled each mouse accordingly in the figures or captions. In the revised Figures 4 and 6, we have ensured that each quantitative analysis figure or its caption clearly indicate the specific mice.

      • Generalizations are sometimes drawn from what seems to be the analysis of a single vessel.

      Thank you for pointing this out. To enhance the generalizability of our conclusions, we have expanded our analysis beyond single vessels in several parts of the study. For instance, in Figure 2, we analyzed three vessels at different depths within the same brain region of a single mouse, and we have included additional results in the Supplementary Figure 2 to further support these findings. Additionally, we have revised the language in the manuscript to ensure that conclusions are appropriately qualified and avoid overgeneralization.

      In Figures 4 and 6, we extended the analysis from single vessels to larger region-of-interest (ROI) analyses across entire brain regions. Unlike single-vessel measurements, which are susceptible to bias based on specific measurement locations, ROI-based analyses are less influenced by the operator and provide more objective, generalizable insights.

      • The description of the statistical analysis is mostly qualitative.

      We recognize that some aspects of the original statistical analysis (Figures 4 and 5 in the previous version) lacked rigor and description is more qualitative. The revised version of statistical analysis (Figure 4 and Figure 6) presents our findings from multiple dimensions, ranging from individual vessels to individual cortical ROI of arteries and veins, and ultimately to broader brain regions. For instance, as illustrated in the revised Figure 4f, the average cortical arterial flow speed decreases by approximately 20% from anesthesia to wakefulness, while venous flow speed decreases by an average of 40%, with the reduction in venous flow speed being significantly greater than that of arterial flow. We believe that this kind of description offers more quantitative analysis.

      For more examples, please refer to the Results section where Figure 4 (Line 169 to Line 207) and Figure 6 (Line 224 to Line 258) are described. These sections have been extensively rewritten to emphasize quantitative interpretation of the data. Each part of the analysis now focuses more heavily on quantitative analyses that consistently show similar trends across all animals.

      • Some terms used are insufficiently defined.

      • Additional limitations should be included in the discussion.

      • Some technical details are lacking. 

      Thank you for highlighting these issues. In response, we have made several improvements in the revised manuscript to address these issues. We have clarified terms such as “vascularity” (Line 547) and “saturation point” (Line 112) to ensure precision and prevent ambiguity. We have expanded the discussion (Line 310 to Line 377) to include limitations such as motion correction challenges and advances in ULM imaging methods, including dynamic ULM and backscattering amplitude techniques. We have added further details on interleaved sampling (Line 494 to Line 497), ULM tracking (Line 517 to Line 529), and quantitative analysis (Line 535 to Line 551) in the Methods section to provide a clearer understanding of our approach. 

      Please refer to our other responses for more specific adjustments.

      • Without information about whether the results obtained come from multiple animals, it is difficult to conclude that the authors generally achieved their aim. They do achieve it in a single animal. The results that are shown are interesting and could have an impact on the ULM community and beyond. In particular, the experimental setup they used along with the high reproducibility they report could become very important for the use of ULM in larger animal cohorts.

      We thank the reviewer for recognizing the impact of our work. We also acknowledge that there were some issues—specifically, we did not provide sufficient proof of reproducibility. In the revised version, we have included additional animal experiment results to ensure that the conclusions were not drawn from a single animal but are generally representative of our aim. (See supplementary figure 1 for detailed use of the animals) 

      Reviewer 3 (Recommendations For The Authors):

      • The manuscript would be more convincing by removing some of the superlatives used in the text. For instance, shouldn't "super-resolution ultrasound localization microscopy" simply be "ultrasound localization microscopy"? Expressions such as "first study", "essential", and "invaluable", etc could be replaced by more factual terms. The word "significant" is also used sometimes with statistics to back it up and sometimes without.

      Thank you for highlighting this issue. We have removed the superlatives throughout the manuscript to make the language more precise. For instance, we have simplified “super-resolution ultrasound localization microscopy” to “ultrasound localization microscopy” throughout the main text and removed expressions such as “first study” and “invaluable”. We also reviewed all uses of “essential” and “significant,” replacing “essential” with more modest alternatives where it does not indicate a strict requirement. Similarly, where “significant” does not refer to statistical significance, we have used other terms to avoid any ambiguity.

      • The section "Microbubble count serves as a quantitative metric for awake ULM image reconstruction" had several issues that I think should be addressed. Mainly, the authors make the case that after detecting 5 million microbubbles, there is no clear gain in detecting more. The argument is not very convincing as we know many vessels will not have had a microbubble circulate in them within that timeframe, which will be especially true in smaller vessels. While the analysis in Figure 2 shows nicely that the diameter estimate for vessels in the 20-30 um range is stable at 5 million microbubbles, it is not necessarily the case for smaller vessels. A better approach here might be to select, e.g., a total of 5 million detected microbubbles for practical reasons and then to determine which vessel parameters estimation (e.g., diameter, flow velocity) remain stable. In addition:

      a. Terms such as 'complete ULM reconstruction', 'no obvious change', 'ULM image saturation' are not well defined within the manuscript.

      Thank you for pointing out these issues and for offering a more rigorous approach. We completely agree with your suggestion. While our analysis demonstrated stable diameter estimates for vessels with diameter around 20 µm at 5 million microbubbles, this does not necessarily ensure stability for smaller vessels. Therefore, the choice of 5 million microbubbles was primarily for practical reasons. In the revised version, we have provided a more objective description and clarification of this limitation. We also recognize that terms such as “complete ULM reconstruction,” “no obvious change,” and “ULM image saturation” were not well defined and may have caused confusion, reducing the rigor of this manuscript. Based on your feedback, we have clearly defined “ULM image saturation” within the context of our study, removed absolute and ambiguous terms like “complete ULM reconstruction” and “no obvious change”. We revised the entire section accordingly:

      (Line 109) “To facilitate equitable comparison of brain perfusion at different states, a practical saturation point enabling stable quantification of most vessels needs to be established. Our observations indicated that when the cumulative MB count reached 5 million, ULM images achieved a relatively stable state. Accordingly, in this study, the saturation point was defined as a cumulative MB count of 5 million. There are also possible alternatives for ULM image normalization. For example, different ULM images can be normalized to have the same saturation rate. However, the proposed method of using the same number of cumulative MB count for normalization enables the analysis of blood flow distribution across different brain regions from a probabilistic perspective. The following analysis substantiates this criterion.

      Fig. 2a compares ULM directional vessel density maps and flow speed maps generated with 1, 3, 5, and 6 million MBs, using the same animal as shown in Fig. 1. To quantitatively confirm saturation, multiple vessel segments were selected for further analysis. Fig. 2b presents the measured vessel diameter for a specific segment at various MB counts. After binarizing the ULM map, the vessel diameter was measured by calculating the distance from the vessel centerline to the edge. Each point along the centerline of the segment provided a diameter measurement, enabling calculation of the mean and standard error. At low MB counts, vessels appeared incompletely filled, leading to inaccurate estimation of vessel diameter due to incomplete profiles. For example, at 1–2 million MBs, the binarized ULM map displayed a width of only one or two pixels along the segment. As a result, the measurements always yielded the same diameter values (two pixels, ~10um) with a consistently low standard error of the mean across the entire segment. With increased MB counts, the measured vessel diameter gradually rose, ultimately reaching saturation. The plots in Fig. 2b show that vessel diameter stabilized at 5 million MB count. Additionally, Fig. 2c illustrates the changes in flow velocity measured at different cumulative MB counts. The violin plots display the distribution of flow speed estimates for all valid centerline pixels within the selected segment. At low MB counts (1–3 million), flow velocity estimates fluctuated, but they stabilized as the MB count increased (4–6 million MBs). At 5 million MBs, flow velocity estimates were nearly identical to those at 6 million MBs, corroborating previous findings that vessel velocity measurements stabilize as MB count grows(39). To assess the generalizability of the 5 million MB saturation condition, vessel segments from three different mice across various brain regions were examined. The results, shown in Supplementary Fig. 2, confirm that this saturation criterion applies broadly. Although the 5 million MB threshold may not ensure absolute saturation for all vessels, it is generally effective for vessels larger than 15 μm. This MB count threshold was therefore adopted as a practical criterion.” 

      b. The choice of 10 consecutive tracking frames is arbitrary and should be described as such unless a quantitative optimization study was conducted. Was there a gap-filling parameter? What was the maximum linking distance and what is its impact on velocity estimation?

      Thank you for your comment. We acknowledge that the choice of 10 consecutive tracking frames was based on our common practice rather than a specific quantitative optimization. Additionally, with the uTrack algorithm, we set both the gap-filling parameter and maximum linking distance to 10 pixels. Setting these parameters too high could potentially overestimate velocity. These details have now been added to the Methods section for clarity:

      (Line 517) “The choice of 10 consecutive frames (10 ms) was based on established practice but can be adjusted as needed. For the uTrack algorithm, two additional key parameters were specified: the maximum linking distance and the gap-filling distance, both set to 10 pixels (~50 microns). This configuration means that only bubble centroids within 10 pixels of each other across consecutive frames are considered part of the same bubble trajectory. Additionally, when the start and end points of two tracks fall within this threshold, the gap-filling parameter merges them into a single, continuous track. It is important to select these parameters carefully, as overly large values could lead to an overestimation of flow velocity. By setting the maximum linking distance to 10 pixels, we effectively limited the measurable velocity to 50 mm/s, under the assumption that no bubble would exceed a 50-micron displacement within the 1 ms interval between frames. After determining bubble tracks with the specified parameters for uTrack algorithm, accumulating the MB tracks resulted in the flow intensity map. Considering the velocity distribution across the mouse brain, this 50 mm/s limit ensures that the vast majority of blood flow is captured accurately.”

      c. 'The plots (Figure 2b) clearly indicate that the vessel diameter stabilized beyond 5 million MB count.' This is true for one vessel. To generalize that claim, the analysis should be performed quantitatively on a larger sample of vessels in various areas of the brain, across multiple animals.

      Thank you for pointing out this limitation. We agree that conclusions drawn from a single vessel cannot be generalized across all regions. Following your suggestion, we have added Supplementary Figure 2, where we analyzed multiple vessels from different brain regions across three mice. This expanded analysis further confirms that a 5 million MB count is sufficient to stabilize vessel diameter measurements across various samples.

      (Line 133) “To assess the generalizability of the 5 million MB saturation condition, vessel segments from three different mice across various brain regions were examined. The results, shown in Supplementary Fig. 2, confirm that this saturation criterion applies broadly. Although the 5 million MB threshold may not ensure absolute saturation for all vessels, it is generally effective for vessels larger than 15 μm. This MB count threshold was therefore adopted as a practical criterion.” 

      • "Statistical analysis validates the increase in blood flow induced by anesthesia" is a very interesting section but even though a quantitative analysis was conducted in Figure 5, the language used remains mostly qualitative. I think this section should include quantitative conclusions from the statistical analysis to increase the impact of this work.

      Thank you for your valuable feedback. We recognize that some aspects of the original quantitative analysis (Figures 4 and 5 in the previous version) lacked rigor, such as the classification of arteries, veins, and capillaries, and that the data presented in each row of Figure 5 represented only one mouse per coronal section, limiting the generalizability of statistical conclusions.

      In response to the reviewers’ feedback, the revised version incorporates a new approach by merging the previous Figure 4 and Figure 5 into a single, consolidated figure (now Figure 4). This updated figure aims to present our findings from multiple dimensions, ranging from individual vessels to individual cortical ROI of arteries and veins, and ultimately to broader brain regions. We have focused on quantitative analyses that consistently show similar trends across all animals. For instance, as illustrated in the revised Figure 4f, the average cortical arterial flow speed decreases by approximately 20% from anesthesia to wakefulness, while venous flow speed decreases by an average of 40%, with the reduction in venous flow speed being significantly greater than that of arterial flow. We believe that this approach offers more insightful analysis and enhances the overall impact of the study.

      For more examples, please refer to the revised Results section where Figure 4 are described (from Line 169 to Line 212). These sections have been extensively rewritten to emphasize quantitative interpretation of the data. Each part of the analysis now focuses more heavily on quantitative analyses that consistently show similar trends across all animals.

      • In the methods, it is claimed that 6 healthy female C57 mice were used in the study, but it is hard to tell whether more than one animal is shown in the figures. It is also unclear whether the statistics were performed within or across animals. Since one of the major strengths of the manuscript is that it shows the feasibility of performing reproducible measurements using ULM, most figures should be repeated for each individual animal and provided in supplementary data and statistics should be performed across animals.

      Thank you for bringing this to our attention. We acknowledge that the original version did not clearly indicate the use of individual animals. In the revised manuscript, we have added Supplementary Figure 1 to specify the mice used, and we have labeled each mouse accordingly in the figures or captions. Additionally, we included statistics across animals in the revised Figures 4 and 6, and detailed data for each individual mouse are now provided in Supplementary Figures 3 and 4.

      • The effect of aliasing should be discussed given that 1) a high-frequency probe is used along with a correspondingly relatively low frame rate (1000 fps) and 2) Doppler filtering is used to separate upward from downward-moving microbubbles. There will be microbubbles that circulate faster than the Nyquist limit, which will thus appear as moving in the opposite direction in the Doppler spectrum. It would be important to double-check that the effect is not too important and to report this as a limitation in the discussion.

      Thank you for highlighting this important point. Aliasing is indeed a relevant issue to consider, especially for higher flow velocities in large vessels. We have added a discussion on this limitation in the revised manuscript:

      (Line 359) “Based on the maximum linking distance and gap closing parameters outlined in the Methods section, blood flow with velocities below 50 mm/s can be detected. However, the use of a directional filter to estimate flow direction may introduce aliasing. MBs moving at higher velocities may be subject to incorrect flow direction estimation due to aliasing effects. Given that the compounded frame rate is 1000 Hz, with an ultrasound center frequency of 20 MHz and a sound speed of 1540 m/s, the relationship between Doppler frequency and the axial blood flow velocity(12) indicates that aliasing will not occur for axial flow velocities below 19.25 mm/s. In all flow velocity maps presented in this study, the range is limited to a maximum of 15 mm/s, remaining below the critical threshold for aliasing. Additionally, all vessels analyzed in the violin plots for arteriovenous flow comparisons fall within this range. While cortical arterioles and venules generally exhibit moderate flow speeds, aliasing remains a factor to consider when combining directional filtering with velocity analysis.”

      • The method used to classify vessels may be incorrect and may not be needed. I would recommend the authors not use it and describe the vessels as vessels that branch in or out, etc. Applying an arbitrary threshold of 2 to detect capillaries is also not very convincing. I understand that the authors might decide to maintain this nomenclature, in which case I would recommend clearly explaining it at the beginning of the manuscript along with some of the caveats that are already reported in the discussion.

      Thank you for your comments on our vessel classification method. We recognize the limitations of the previous approach and, in order to enhance the rigor of the study, we have opted not to continue using this method in the revised manuscript.

      In the revised analysis regarding artery and vein, we focus solely on penetrating vessels in the cortex. For these vessels, it is generally accepted that downward-flowing vessels are arterioles, while upward-flowing vessels are venules. Accordingly, in the revised Figures 4 and 6, we analyze arterioles and venules exclusively in the cortex, without relying on the previous classification method that could be considered controversial.

      Additionally, we agree that classifying vessels with values below 2 as capillaries was not a robust approach. Thus, we have removed all related analyses from the revised manuscript.

      Minor comments:

      • Line 16: "resolves capillary-scale ..."; it is not clear that the resolution that is achieved in this work is at the capillary scale.

      Thank you for your valuable feedback. We understand that “capillary-scale” may overstate the achieved resolution in our work. To clarify, we have revised the sentence as follows:

      (Line 18) “Ultrasound localization microscopy (ULM) is an emerging imaging modality that resolves microvasculature in deep tissues with high spatial resolution.” 

      This adjustment more accurately reflects the resolution capabilities of ULM as used in our study.

      • Line 22: 'vascularity' is not well defined in the manuscript. Consider defining or using another term.

      Thank you for pointing out the need for clarification on vascularity. We acknowledge that our initial use of the term “vascularity” may have been unclear and potentially confusing. In the revised manuscript, we have included a clear definition of “vascularity” in the Methods section under Quantitative Analysis of ULM Images (Line 534). 

      The following sentence shows the definition of vascularity:

      (Line 547) “Vascularity was defined as the proportion of the pixel count occupied by blood vessels within each ROI, obtained by binarizing the ULM vessel density maps and calculating the percentage of the pixels with MB signal.”

      We have also added an instant definition when it was firstly used in Results part:

      (Line 161) “When comparing vessel density maps, ULM images that are acquired in the awake state demonstrate a global reduction of vascularity, which refers to percentage of pixels that occupied by blood vessels.”

      • Line 30: I'm not convinced the first two sentences are useful.

      Thank you for pointing out this issue. The opening sentence of the article lacked focus and was too broad. We have rewritten the sentence as follows:

      (Line 34) “Sensitive imaging of correlates of activity in the awake brain is fundamental for advancing our understanding of neural function and neurological diseases.”

      • Line 37: 'micron-scale capillaries': this expression is unclear. Capillaries are typically micron-scaled, so it gives the impression that ULM can image ULM at the one-micron scale, which is not the case.

      Thank you for your helpful comment. We agree that “micron-scale capillaries” could be misleading, as it might imply a resolution at the single-micron level. To clarify, we have revised the sentence as follows:

      (Line 40) “ULM is uniquely capable of imaging microvasculature situated in deep tissue (e.g., at a depth of several centimeters).”

      This revised wording more accurately describes ULM’s capability without implying single-micron level resolution.

      • Line 74: I don't think motion-free imaging is possible in the context of awake animals. Consider 'limiting motion' instead.

      Thank you for pointing out the potential issue with the term “motion-free”. We agree that achieving entirely motion-free imaging is challenging, especially in the context of awake animals. In response to your suggestion, we have revised the sentence to better reflect this limitation:

      (Line 76) “To achieve consistent ULM brain imaging while allowing limited movement in awake animals, a headfixed imaging platform with a chronic cranial window was used in this study.”

      This revised wording more accurately conveys our approach to minimizing motion without implying that motion is completely eliminated.

      • Line 134:'clearly reveals decreased vessel diameter' How was that demonstrated?

      • Line 153: 'significant' according to which statistical test?

      • Line 167: 'slight increase', by how much, is it significant?

      • Line 183: 'smaller vessels' the center of the distribution is not at 10mm/s, and velocity is not necessarily correlated with diameter.

      • Line 184: 'more large vessels', see above. What is a large vessel, and how was this measured?

      • Line 205: 'significantly lower', according to which statistical test?

      We acknowledge that the original version did not properly use the terms of statistical analysis. In the revised manuscript, we have deleted the related points, and rewritten the statistical analysis part to ensure the terms are used correctly. Please refer to the revised part of “ULM reveals an increase in blood flow induced by isoflurane anesthesia” (From Line 169 to Line 209). In the revised Figures 4 and 6, we have also ensured that each quantitative analysis figure or its caption is clearly explained.

      •    Line 398: the interleaved sampling scheme should be described in more detail.

      Thank you for pointing out this issue. The previous version did not clearly explain the details of interleaved sampling. We have now added the following paragraph to the Ultrasound imaging sequence section in Methods:

      (Line 494) “Interleaved sampling is employed to capture high-frequency echoes more effectively. With the system’s sampling rate limited to 62.5 MHz, the upper limit of the center frequency of the transducer passband is 15.625 MHz. To mitigate aliasing, two transmissions are sent per angle, staggered in time. This approach effectively doubles the sampling rate, ensuring more accurate image reconstruction.”

      • Figure 1: Which mouse is it? Are these results consistent across all animals?

      • Figure 2: Which mouse is it? Are these results consistent across all animals?

      • Figure 3: Which mouse is it? Are these results consistent across all animals?

      • Figure 4: Which mouse is it? Are these results consistent across all animals?

      • Figure 5: Is it a single mouse or multiple mice? Are these results consistent across all animals?

      We acknowledge that the original version did not clearly indicate the numbers of animals in the statistical analysis. In the revised manuscript, we have added Supplementary Figure 1 to specify the mice used, and we have labeled each mouse accordingly in the figures or captions. In the revised Figures 4 and 6, we have ensured that each quantitative analysis figure or its caption clearly indicate the specific mice.

      For original Figures 1 and 2, these are presented as case studies to illustrate the methodology. Since the anesthesia time required for tail vein injection for each animal varies slightly, it is challenging to have the consistent time taken for each mouse to recover from anesthesia across all mice. For instance, in Figure 1, the mouse took nearly 500 seconds to recover from anesthesia, but this duration is not consistent across all animals, which is a limitation of the bolus injection technique. We have noted this point in the discussion (discussion on the limitation of bolus injection), and we have also clarified in the results section and figure captions that these figures represent a case study of a single mouse rather than a standardized recovery time for all animals.

      We further clarified this point in the end of the Figure 2 caption:

      (Fig.2 caption) “This figure presents a case study based on the same mouse shown in Fig 1. The x-axis for d-f begins at 500 seconds because, at this point, the mouse’s pupil size stabilized, indicating it had recovered to an awake state. Consequently, ULM images were accumulated starting from this time. It is important to note that not every mouse requires 500 seconds to fully awaken; the time to reach a stable awake state varies across individual mice.” We added the following statement before introducing Figure 1e:

      (Line 93) “Due to differences in tail vein injection timing and anesthesia depth, the time required for each mouse to fully awaken varied. Although it was not feasible to get pupil size stabilized just after 500 seconds for each animal, ULM reconstruction only used the data that acquired after the animal reached full pupillary dilation, to ensure that ULM accurately captures the cerebrovascular characteristics in the awake state.”

      We added the following statement before introducing Figure 2d:

      (Line 139) “To further verify that the proposed MB bolus injection method can help to achieve ULM image saturation shortly after mice awaken from anesthesia, an analysis on the change in MB concentration over time was conducted once pupil size had stabilized (T = 500s).”

      For Figures 3, 4, and 5 (in the revised version, Figures 4 and 5 have been combined into a single Figure 4), the data represents results from three individual mice, with each coronal plane corresponding to a different mouse. In the revised version, we have added labels to indicate the specific mouse in each image to improve clarity. We also recognize that some analyses in the original submission (original Figure 5) may have lacked sufficient statistical power due to the small sample size. Therefore, in the revised version, we have focused only on findings that were consistently observed across the three mice to ensure robust conclusions.

      Minor corrections and typos from all reviewers:

      We would like to sincerely thank the reviewers for their careful reading of our manuscript. We appreciate the time and effort taken to point out the minor typographical errors. We have carefully addressed and corrected all the identified typos, as listed below:

      From Reviewer #1:

      • Line 316: "insensate": correct, please.

      (Line 409) “After confirming that the mouse was anesthetized, the head of the animal was fixed in the stereotaxic frame.”

      From Reviewer #3:

      • Line 15: Super-resolution ultrasound localization microscopy -- consider removing super-resolution as it gives the impression that it is different from standard ULM.

      (Line 18) “Ultrasound localization microscopy (ULM) is an emerging imaging modality that resolves microvasculature in deep tissues with high spatial resolution.”

      • Line 39: typo: activities should be activity.

      (Line 41) “ULM can also be combined with the principles of functional ultrasound (fUS) to image whole-brain neural activity at a microscopic scale.”

      • Line 47: typo: over under.

      (Line 50) “Therefore, in neuroscience research, brain imaging in the awake state is often preferred over imaging under anesthesia.”

      Once again, we are grateful for the reviewers’ thorough review and valuable input, which have helped us improve the clarity and precision of the manuscript.

    1. Author response:

      The following is the authors’ response to the original reviews.

      Public Reviews:

      Reviewer #1 (Public Review):

      Summary:

      This paper investigates the neural mechanisms underlying the change in perception when viewing ambiguous figures. Each possible percept is related to an attractor-like brain state and a perceptual switch corresponds to a transition between these states. The hypothesis is that these switches are promoted by bursts of noradrenaline that change the gain of neural circuits. The authors present several lines of evidence consistent with this view: pupil diameter changes during the time point of the perceptual change; a gain change in neural network models promotes a state transition; and large-scale fMRI dynamics in a different experiment suggests a lower barrier between brain states at the change point. However, some assumptions of the computational model seem not well justified and the theoretical analysis is incomplete. The paper would also benefit from a more in-depth analysis of the experimental data.

      Strengths:

      The main strength of the paper is that it attempts to combine experimental measurements - from psychophysics, pupil measurements, and fMRI dynamics - and computational modeling to provide an emerging picture of how a perceptual switch emerges. This integrative approach is highly useful because the model has the potential to make the underlying mechanisms explicit and to make concrete predictions.

      Weaknesses:

      A general weakness is that the link between the three parts of the paper is not very strong. Pupil and fMRI measurements come from different experiments and additional analysis showing that the two experiments are comparable should be included. Crucially, the assumptions underlying the RNN modeling are unclear and the conclusions drawn from the simulation may depend on those assumptions.

      With this comment in mind we have made substantial effort to better integrate the three different aspects of our paper. On the pupillometry side, we now show that the dynamic uncertainty associated with perceptual categorisation shares a similar waveform with the observed fluctuations in pupil diameter around the switch point (Fig 2B). To better link the modelling to the behaviour we have also made the gain of the activation function of each sigmoidal unit change dynamically as a function of the uncertainty (i.e. the entropy) of the network’s classification generating phasic changes in gain that mimic the observed phasic changes in pupil dilation explicitly linking the dynamics of gain in the RNN to the observed dynamics of pupil diameter (our non-invasive proxy for neuromodulatory tone). Finally we note that the predictions of the RNN (flattened egocentric landscape and peaks in low-dimensional brain state velocity at the time point of the perceptual switch) were tested directly in the whole-brain BOLD data, which links the modelling and BOLD analysis. Finally we note that whilst we agree that an experiment in which pupilometry and BOLD data were collected simultaneously would be ideal, these data were not available to us at the time of this study.

      Main points:

      Perceptual tasks in pupil and fMRI experiments: how comparable are these two tasks? It seems that the timing is very different, with long stimulus presentations and breaks in the fMRI task and a rapid sequence in the pupil task. Detailed information about the task timing in the pupil task is missing. What evidence is there that the same mechanisms underlie perceptual switches at these different timescales? Quantification of the distributions of switching times/switching points in both tasks is missing. Do the subjects in the fMRI task show the same overall behavior as in the pupil task? More information is needed to clarify these points.

      We recognize the need for a more detailed and comparative analysis of the perceptual tasks used in our pupil and fMRI experiments, particularly regarding differences in timing, task structure, and instructions. The fMRI task incorporates jittered inter-trial intervals (ITIs) of 2, 4, 6, and 8 seconds, designed to enable effective deconvolution of the BOLD response (Stottinger et al., 2018). In contrast, the pupil task presents a more rapid sequence of stimuli without ITIs. These timing differences are reflected in the mean perceptual switch points: the 8th image in the fMRI task and the 9th image in the pupil task. This small yet consistent difference suggests subtle influences of task design on behavior.

      Despite these structural and instructional differences, our analyses indicate that overall behavioral patterns remain consistent across the two modalities. The distributions of switching times align closely, and no significant behavioral deviations were observed that might suggest a fundamental difference in the underlying mechanisms driving perceptual switches. These findings suggest that the additional time and structural differences in the fMRI task do not significantly alter the behavioral outcomes compared to the pupil task.

      To address these issues, we have added paragraphs in the Results, Methods, and Limitations sections of the manuscript. In the Results section, we provide a detailed comparison of switching point distributions across the two tasks, emphasizing behavioral consistencies and any observed variations. In the Methods section, we include an expanded description of task timing, instructions, and the presence or absence of catch trials to ensure clarity regarding the experimental setups. Finally, in the Limitations section, we acknowledge the structural differences between the tasks, particularly the lack of catch trials and rapid stimulus presentation in the pupil task, and discuss how these differences may influence perceptual dynamics.

      These additions aim to clarify how task-specific factors, such as timing, instructions, and catch trials, influence perceptual dynamics while highlighting the consistency in behavioral outcomes across both experimental setups. We believe these revisions address the concerns raised and enhance the manuscript’s transparency and rigor.

      Computational model:

      (1) Modeling noradrenaline effects in the RNN: The pupil data suggests phasic bursts of NA would promote perceptual switches. But as I understand, in the RNN neuromodulation is modeled as different levels of gain throughout the trial. Making the neural gain time-dependent would allow investigation of whether a phasic gain change can explain the experimentally observed distribution of switching times.

      We thank the reviewer for this very helpful suggestion. We updated the RNN so that, post-training, gain changes dynamically as a function of the network's classification uncertainty (i.e. the entropy of the network's output). Specifically, the gain dynamics of each unit in the neural network are governed by a linear ODE with a forcing function given by the entropy of the network’s classification (i.e. the uncertainty of the classification). This explicitly tests the hypothesis that uncertainty driven increases in gain near the perceptual switch (when the input is maximally ambiguous) speeds perceptual switches, and allows us to distinguish between tonic and phasic increases in gain (in the absence of uncertainty forcing gain decays exponentially to a tonic value of 1). Importantly, in line with our hypothesis, we found that switch times decreased as we increased the impact of uncertainty on gain (i.e. switch times decreased as the magnitude of uncertainty forcing increased). Finally, we wish to note that although making gain dynamical is relatively simple conceptually, actually implementing it and then analysing the dynamics turned out to be highly non-trivial. To our knowledge our model is the first RNN of reasonable size to implement dynamical gain requiring us to push the RNN modelling beyond the current state of the art (see Fig 2 - 4).

      (2) Modeling perceptual switches: in the results, it is described that the networks were trained to output a categorical response, but the firing rates in Fig 2B do not seem categorical but rather seem to follow the input stimulus. The output signals of the network are not shown. If I understand correctly, a trivial network that would just represent the two input signals without any internal computation and relay them to the output would do the task correctly (because "the network's choice at each time point was the maximum of the two-dimensional output", p. 22). This seems like cheating: the very operation that the model should perform is to signal the change, in a categorical manner, not to represent the gradually changing input signals.

      The output of the network was indeed trained to be categorical via a cross entropy loss function with the output defined by the max of the projection of the excitatory hidden units onto the output weights which is boilerplate RNN modelling practice. As requested we now show the output in Fig 2B. On the broader question of whether a trivially small network could solve the task we are in total agreement that with the right set of hand-crafted weights a two neuron sigmoidal network with winner-take-all readout could solve the task. We disagree, however, that using an RNN is cheating in any way. Many tasks in neuroscience can be trivially solved with a very small number of recurrent units (e.g. basically all 2AF tasks). The question we were interested in is how the brain might solve the task, and more specifically how neuromodulator control of gain changes the dynamics of our admittedly very simple task. We could have done this by hand crafting a small network to solve the task but we wanted to use the RNN modelling as a means of both hypothesis testing and hypothesis generation. We now expand on and justify this modelling choice in the second paragraph of the discussion:

      “We chose to use an RNN, instead of a simpler (more transparent) model as we wanted to use the RNN as a means of both hypothesis generation and hypothesis testing. Specifically, unlike more standard neuronal models which are handcrafted to reproduce a specific effect, when building an RNN the modeller only specifies the network inputs, labels, and the parameter constraints (e.g. Dale’s law) in advance. The dynamics of the RNN are entirely determined by optimisation. Post-training manipulations of the RNN are not built in, or in any way guaranteed to work, making them more analogous to experimental manipulations of an approximately task-optimal brain-like system. Confirmatory results are arguably, therefore, a first steps towards an in vitro experimental test.”

      (3) The mechanism of how increased gain leads to faster switches remains unclear to me. My first intuition was that increasing the gain of excitatory populations (the situation shown in Fig. 2E) in discrete attractor models would lead to deeper attractor wells and this would make it more difficult to switch. That is, a higher gain should lead to slower decisions in this case. However, here the switching time remains constant for a gain between 1 and 1.5. Lowering the gain, on the other hand, leads to slower switching. It is, of course, possible that the RNN behaves differently than classical point attractor models or that my intuition is incorrect (though I believe it is consistent with previous literature, e.g. Niyogi & Wong-Lin 2013 (doi:10.1371/journal.pcbi.1003099) who show higher firing rates - more stable attractors - for increased excitatory gain).

      We thank the reviewer for the astute observation, which we entirely agree with. The energy landscape analysis is a method still under active development within our group and we are still learning how to best explain it and its relationship to more traditional ways of quantifying potential-like energy functions of dynamical systems which we think the reviewer has in mind. We have now included a second type of energy landscape analysis which gives a complementary perspective on the RNN dynamics and is more straightforwardly comparable to typical potential functions. We describe the new analysis in the section “Large-scale neural predictions of recurrent neural network model” as follows:

      “Crucially, there are two complementary viewpoints from which we can construct an energy landscape; the first allocentric (i.e., third-person view) perspective quantifies the energy associated with each position in state space, whereas the second egocentric (i.e., first person view) perspective quantifies the energy associated relative changes independent of the direction of movement or the location in state space. The allocentric perspective is straightforwardly comparable to the potential function of a dynamical system but can only be applied to low dimensional data in settings where a position-like quantity is meaningfully defined. The egocentric perspective is analogous to taking the point of view of a single particle in a physical setting and quantifying the energy associated with movement relative to the particles initial location. An egocentric framework is thus more applicable, when signal magnitude is relative rather than absolute. See materials and methods, and (see Fig S4 for an intuitive explanation of the allocentric and egocentric energy landscape analysis on a toy dynamical system).”

      From the allocentric perspective it is entirely true that increasing gain increases the depth of the landscape, equivalent to increasing the depth of the attractor. However, because the input to the network changes dynamically the location of the approximate fixed-point attractor changes and the network state “chases” this attractor over the course of the trial. Importantly, the location of the energy minima changes more rapidly as gain increases, effectively forcing the network to rapidly change course at the point of the perceptual switch (see Fig 4). To quantify this effect we constructed a new measure - neural work - which describes the amount of “force” exerted on the low-dimensional neural trajectory by the vector field quantified by the allocentric landscape. Specifically we treat the allocentric landscape as analogous to a potential function and then leverage the fact that force is equal to the negative gradient of potential energy to calculate the work (force x displacement) done on the low dimensional trajectory at each time point. This showed that as gain increases the amount of work done on the neuronal trajectory at turning points increases analogous to the application of an external force transiently increasing the kinetic energy of an object. From the perspective of the egocentric landscape this results in a flattening of the landscape as there is a lower energy (i.e. higher probability) assigned to large deviations in the neuronal trajectory around the perceptual switch.

      Because of the novelty of the analyses we went to great lengths to carefully explain the methods in the updated manuscript. In addition we wrote a short tutorial style MATLAB script implementing both the allocentric and egocentric landscape analysis on a toy dynamical system with a known potential function (a supercritical pitchfork bifurcation).

      (4) From the RNN model it is not clear how changes in excitatory and inhibitory gain lead to slower/faster switching. In order to better understand the role of inhibitory and excitatory gain on switching, I would suggest studying a simple discrete attractor model (a rate model, for example as in Wong and Wang 2006 or Roxin and Ledberg, Plos Comp. Bio 2008) which will allow to study these effects in terms of a very few model parameters. The Roxin paper also shows how to map rate models onto simplified one-dimensional systems such as the one in Fig S3. Setting up the model using this framework would allow for making much stronger, principled statements about how gain changes affect the energy landscape, and under which conditions increased inhibitory gain leads to faster switching.

      One possibility is that increasing the excitatory gain in the RNN leads to saturated firing rates. If this is the reason for the different effects of excitatory and inhibitory gain changes, it should be properly explained. Moreover, the biological relevance of this effect should be discussed (assuming that saturation is indeed the explanation).

      We thank the reviewer for this excellent suggestion. After some consideration we decided that studying a reduced model would likely not do justice to the dynamical mechanisms of RNN especially after making gain dynamical rather than stationary. Still we very much share the reviewer’s concern that we need a stronger link between the (now dynamical) gain alterations and energy landscape dynamics. To this end we now describe and interrogate the dynamics of the RNN at a circuit level through selectivity and lesion based analyses, at a population level through analysis of the dynamical regime traversed by the network, and finally, through an extended energy landscape framework which has far stronger links to traditional potential based descriptions of low-dimensional dynamical systems (also see to comment 3. above).

      At a circuit level the speeding of perceptual switches is mediated by inhibition of the initially dominant population we describe in paragraphs 7 and 8 of the section “Computational evidence for neuromodulatory-mediated perceptual switches in a recurrent neural network” as follows:

      “Having confirmed our hypothesis that increasing gain as a function of the network uncertainty increased the speed of perceptual switches, we next sought to understand the mechanisms governing this effect starting with the circuit level and working our way up to the population level (c.f. Sheringtonian and Hopfieldian modes of analysis(66)). Because of the constraint that the input and output weights are strictly positive, we could use their (normalised) value as a measure of stimulus selectivity. Inspection of the firing rates sorted by input weights revealed that the networks had learned to complete the task by segregating both excitatory and inhibitory units into two stimulus-selective clusters (Fig 2C). As the inhibitory units could not contribute to the networks read out, we hypothesised that they likely played an indirect role in perceptual switching by inhibiting the population of excitatory neurons selective for the currently dominant stimulus allowing the competing population to take over and a perceptual switch to occur.

      To test this hypothesis, we sorted the inhibitory units by the selectivity of the excitatory units they inhibit (i.e. by the normalised value of the readout weights). Inspecting the histogram of this selectivity metric revealed a bimodal distribution with peaks at each extreme strongly inhibiting a stimulus selective excitatory population at the exclusion of the other (Fig S2). Based on the fact that leading up to the perceptual switch point both the input and firing rate of the dominant population are higher than the competing population, we hypothesized that gain likely speeds perceptual switches by actively inhibiting the currently dominant population rather than exciting/disinhibiting the competing population. We predicted, therefore, that lesioning the inhibitory units selective for the stimulus that is initially dominant would dramatically slow perceptual switches, whilst lesioning the inhibitory units selective for the stimulus the input is morphing into would have a comparatively minor slowing effect on switch times since the population is not receiving sufficient input to take over until approximately half way through the trial irrespective of the inhibition it receives. As selectivity is not entirely one-to-one, we expect both lesions to slow perceptual switches but differ in magnitude. In line with our prediction, lesioning the inhibitory units strongly selective for the initially dominant population greatly slowed perceptual switches (Fig 3F upper), whereas lesioning the population selective for the stimulus the input morphs into removed the speeding effect of gain but had a comparatively small slowing effect on perceptual switches (Fig 3F lower).”

      At the population level we characterised the dynamics of the 2D parameter space (defined by gain and the difference between the input dimensions) traversed by the network over the course of a trial as input and gain dynamically change. We describe this paragraphs 9-14 of the section “Computational evidence for neuromodulatory-mediated perceptual switches in a recurrent neural network” which we reprint below for the reviewers convenience :

      “Based on the selectivity of the network firing rates we hypothesised that the dynamics were shaped by a fixed-point attractor whose location and existence were determined by gain and  and thus changed dynamically over the course of a single trial(67-70). Because of the large size of the network, we could not solve for the fixed points or study their stability analytically. Instead we opted for a numerical approach and characterised the dynamical regime (i.e. the location and existence of approximate fixed-point attractors) across all combinations of gain and  visited by the network. Specifically, for each combination of elements in the parameter space  we ran 100 simulations with initial conditions (firing rates) drawn from a uniform distribution between [0,1], and let the dynamics run for 10 seconds of simulation time (10 times the length of the task - longer simulation times did not qualitatively change the results) without noise. As we were interested in the existence of fixed-point attractors rather than their precise location, at each time point we computed the difference in firing rate between successive time points across the network. For each simulation we computed both the proportion of trials that converged to a value below  10^-2 giving us proxy for the presence of fixed points, and the time to convergence, giving us a measure of the “strength” of the attractor.

      Across gain values when input had unambiguous values, the network rapidly converged across all initialisations (Fig 3A & 3C-H). When input became ambiguous, however, the dynamics acquired a decaying oscillation and did not converge within the time frame of the simulation. As gain increased, the range of  values characterised by oscillatory dynamics broadened. Crucially, for sufficiently high values of gain, ambiguous  values transitioned the network into a regime characterised by high amplitude inhibition-driven oscillations (Fig 3D & 3G). Each trial can, therefore, be characterised by a trajectory through this 2-dimensional parameter space, with dynamics shaped by the dynamical regimes of each location visited (Fig 3A-B).

      When uncertainty has a small impact on gain the network has a trajectory through an initial regime characterised by the rapid convergence to a fixed point where the population representing the initial stimulus dominated whilst the other was silent (Fig 3C), an uncertain regime characterised by oscillations with all neurons partially activated (Fig 3D), and after passing through the oscillatory regime, the network once again enters a new fixed-point regime where the population representing the initial stimulus is now silent and the other is dominant (Fig 3E).

      For high gain trails, the network again started and finished in states characterised by a rapid convergence to a fixed point representing the dominant input dimension (Fig 3F-H), but differed in how it transitioned between these states. Uncertain inputs now generated high amplitude oscillations with the network flip-flopping between active and silent states (Fig 3G). We hypothesised that, within the task, this has the effect of silencing the initially dominant population, and boosting the competing population. To test this we initialised each network with parameter values well inside the oscillatory regime (u = [ .5, .5]  , gain = 1.5) with initial conditions determined by the selectivity of each unit. Excitatory units selective for input dimension 1, as well as the associated inhibitory units projecting to this population, were fully activated, whilst the excitatory units selective for  input dimension 2 and the associated inhibitory units were silenced. As we predicted, when initialised in this state the network dynamics displayed an out of phase oscillation where the initially dominant population was rapidly silenced and the competing population was boosted after a brief delay (219 (ms), +/-114 Fig S3).”

      From this we concluded that at a population level, heightened gain leading up to the perceptual switch speeds the switch by transiently pushing the dynamics into an unstable dynamical regime replacing the fixed-point attractor representing the input with an oscillatory regime that actively inhibits the currently dominant population and boosts the competing population before transitioning back into a regime with a stable (approximate) fixed-point attractor representing the new stimulus (Fig 3F-H & Fig S3).

      As we describe in the our response to comment 3 above our extended energy-landscape analysis framework now includes an explicit link between the potential of the dynamical system and allocentric landscape, whilst also explaining how a transient deepening of the allocentric landscape (which can be essentially thought of analogous to a traditional potential function) relates to the flattening of the egocentric landscape.

      Finally, whilst we appreciate the interest in further characterising the effect of inhibitory gain compared with excitatory gain the topic is is largely orthogonal the aims of our paper so we have removed the discussion of inhibitory vs excitatory gain. Still, we understand that we need to do our due diligence and check that our results do not break down when we manipulate either inhibitory or excitatory gain in isolation. To this end we checked that dynamical gain still speeded perceptual switches when the effect was isolated to inhibitory or excitatory cells in isolation. We show the behavioural plots below for the reviewer’s interest.

      Author response image 1.

      Switch time as a function of uncertainty forcing

      Alternative mechanisms:

      It is mentioned in the introduction that changes in attention could drive perceptual switches. A priori, attention signals originating in the frontal cortex may be plausible mechanisms for perceptual switches, as an alternative to LC-controlled gain modulation. Does the observed fMRI dynamics allow us to distinguish these two hypotheses? In any case, I would suggest including alternative scenarios that may be compatible with the observed findings in the discussion.

      We agree with the reviewer, in that attention is itself a confound and a process that is challenging to disentangle from the perceptual switching process in the current task. Importantly, we were not arguing for exclusivity in our manuscript, but merely testing the veracity of the hypothesis that the ascending arousal system may play a causal role in mediating and/or speeding perceptual switches. Future work with experiments that more specifically aim to dissociate these different features will be required to tease apart these different possibilities.

      Reviewer #2 (Public Review):

      Strengths

      - the study combines different methods (pupillometry, RNNs, fMRI).

      - the study combines different viewpoints and fields of the scientific literature, including neuroscience, psychology, physics, dynamical systems.

      - This combination of methods and viewpoints is rarely done, it is thus very useful.

      - Overall well-written.

      Weaknesses

      - The study relies on a report paradigm: participants report when they identify a switch in the item category. The sequence corresponds to the drawing of an object being gradually morphed into another object. Perceptual switches are therefore behaviorally relevant, and it is not clear whether the effect reported correspond to the perceptual switch per se, or the detection of an event that should change behavior (participant press a button indicating the perceived category, and thus switch buttons when they identify a perceptual change). The text mentions that motor actions are controlled for, but this fact only indicates that a motor action is performed on each trial (not only on the switch trial); there is still a motor change confounded with the switch. As a result, it is not clear whether the effect reported in pupil size, brain dynamics, and brain states is related to a perceptual change, or a decision process (to report this change).

      We agree with the reviewer that the coupling of the motor change with the perceptual switch is confounded to some degree, but since motor preparation occurs on every trial we suspect that it is more accurate to describe it as confounded with task-relevance more than motor preparation per se.  While it is possible that pupil diameter, network topology and energy landscape features are all related to motor change rather than the perceptual switch, we note that the weight of evidence is against this interpretation, given the simple mechanistic explanation created by the coupling of perceptual uncertainty to network gain.

      - The study presents events that co-occur (perceptual switch, change in pupil size, energy landscape of brain dynamics) but we cannot identify the causes and consequences. Yet, the paper makes several claims about causality (e.g. in the abstract "neuromodulatory tone ... causally mediates perceptual switches", in the results "the system flattening the energy landscape ... facilitated an updating of the content of perception").

      We have made an effort to soften the causal language, where appropriate. In addition, we note that we have changed the title to “Gain neuromodulation mediates task-relevant perceptual switches: evidence from pupillometry, fMRI, and RNN Modelling” to reflect the fact that our claims do not extent to cases of perceptual switches where the stimulus is only passively observed.

      - Some effects may reflect the expectation of a perceptual switch, rather than the perceptual switch per se. Given the structure of the task, participants know that there will be a perceptual switch occurring once during a sequence of morphed drawings. This change is expected to occur roughly in the middle of the sequence, making early switches more surprising, and later switches less surprising. Differences in pupil response to early, medium, and late switches could reflect this expectation. The authors interpret this effect very differently ("the speed of a perceptual switch should be dependent on LC activity").

      The task includes catch trials designed to reduce the expectation of a perceptual switch. In these trials, a perceptual switch occurs either earlier or later than usual. While these trials are valuable for mitigating predictability, we did not focus extensively on them, as they were thoroughly discussed in the original paper. Additionally, due to the limited number of catch trials, it is difficult—if not impossible—to calculate a reliable mean surprise per image set.

      It is also worth noting that the pupil study does not include catch trials, which could contribute to differences in how perceptual switches are processed and interpreted between the fMRI and pupil experiments.

      - The RNN is far more complex than needed for the task. It has two input units that indicate the level of evidence for the two categories being morphed, and it is trained to output the dominant category. A (non-recurrent) network with only these two units and an output unit whose activity is a sigmoid transform of the difference in the inputs can solve the task perfectly. The RNN activity is almost 1-dimensional probably for this reason. In addition, the difficult part of the computation done by the human brain in this task is already solved in the input that is provided to the network (the brain is not provided with the evidence level for each category, and in fact, it does not know in advance what the second category will be).

      We agree that a simpler model could perform the task. We opted to use an RNN rather than hand craft a simpler model as we wanted to use the model as both a method of hypothesis testing and hypothesis generation. We now expand on and justify this modelling choice in the second paragraph of the discussion (also see our response to Reviewer 1 comment 4):

      “We chose to use an RNN, instead of a simpler (more transparent) model as we wanted to use the RNN as a means of both hypothesis generation and hypothesis testing. Specifically, unlike more standard neuronal models which are handcrafted to reproduce a specific effect, when building an RNN the modeller only specifies the network inputs, labels, and the parameter constraints (e.g. Dale’s law) in advance. The dynamics of the RNN are entirely determined by optimisation. Post-training manipulations of the RNN are not built in, or in any way guaranteed to work, making them more analogous to experimental manipulations of an approximately task-optimal brain-like system. Confirmatory results are arguably, therefore, a first steps towards an in vitro experimental test.”

      In other words, a simpler model would not have been appropriate to the aims. In addition we note that low dimensional dynamics are extremely common in the RNN literature and are in no way unique to our model. 

      - Basic fMRI results are missing and would be useful, before using elaborate analyses. For instance, what are the regions that are more active when a switch is detected?

      We explicitly chose to not run a standard voxelwise statistical parametric approach on these data, as the results were reported extensively in the original study (Stottinger et al., 2018).

      - The use of methods from physics may obscure some simple facts and simpler explanations. For instance, does the flatter energy landscape in the higher gain condition reflect a smaller number of states visited in the state space of the RNN because the activity of each unit gets in the saturation range? If correct, then it may be a more straightforward way of explaining the results.

      We appreciate the reviewer's concern as this would indeed be a problem. However, this is not the case for our network. At the time point of the perceptual switch where the egocentric landscape dynamics are at their flattest the RNN firing rates are approximately 50% activated nowhere near the saturation point. In addition, a flatter landscape in the egocentric and allocentric landscape analyses only occurs - mathematically speaking - when there are more states visited not less.

      In addition, we note that we are very sympathetic to the complexity of our physics based analyses and have gone to great lengths to describe them in an accessible manner in both the main text and methods. We have also included tutorial style code demonstrating how the analysis can be used on a toy dynamical system in the supplementary material.

      - Some results are not as expected as the authors claim, at least in the current form of the paper. For instance, they show that, when trained to identify which of two inputs u1 and u2 is the largest (with u2=1-u1, starting with u1=1 and gradually decreasing u1), a higher gain results in the RNN reporting a switch in dominance before the true switch (e.g. when u1=0.6 and u2=0.4), and vice et versa with a lower gain. In other words, it seems to correspond to a change in criterion or bias in the RNN's decision. The authors should discuss more specifically how this result is related to previous studies and models on gain modulation. An alternative finding could have been that the network output is a more (or less) deterministic function of its inputs, but this aspect is not reported.

      We appreciate this comment but it is simply not applicable to our network. There is no criterion in the RNN. We could certainly add one but this would be a significant departure from how decisions are typically modelled in RNNs. The (deterministic) readout is the max of the projection of the (instantaneous) excitatory firing rate onto the readout weights. A shift in criterion would imply that the dynamics are unaffected and the effect can be explained by a shift in the readout weights; this cannot be the case because the readout weights are stationary the change occurs at the level of the activation function.

      We are aware that there is a large literature in decision making and psychophysics that uses the term gain in a slightly different way. Here we are strictly referring to the gain of the activation function. Although we agree that it would be interesting and important to discuss the differing uses of the term gain, this is beyond the scope of the present paper.

    1. Author response:

      The following is the authors’ response to the original reviews.

      Public Reviews:

      Reviewer #1 (Public Review):

      This study reports that spatial frequency representation can predict category coding in the inferior temporal cortex.

      Thank you for taking the time to review our manuscript. We greatly appreciate your valuable feedback and constructive comments, which have been instrumental in improving the quality and clarity of our work.

      The original conclusion was based on likely problematic stimulus timing (33 ms which was too brief). Now the authors claim that they also have a different set of data on the basis of longer stimulus duration (200 ms).

      One big issue in the original report was that the experiments used a stimulus duration that was too brief and could have weakened the effects of high spatial frequencies and confounded the conclusions. Now the authors provided a new set of data on the basis of a longer stimulus duration and made the claim that the conclusions are unchanged. These new data and the data in the original report were collected at the same time as the authors report.

      The authors may provide an explanation why they performed the same experiments using two stimulus durations and only reported one data set with the brief duration. They may also explain why they opted not to mention in the original report the existence of another data set with a different stimulus duration, which would otherwise have certainly strengthened their main conclusions.

      Thank you for your comments regarding the stimulus duration used in our experiments. We appreciate the opportunity to clarify and provide further details on our methodology and decisions.

      In our original report, we focused on the early phase of the neuronal response, which is less affected by the duration of the stimulus. Observations from our data showed that certain neurons exhibited high firing rates even with the brief 33 ms stimulus duration, and the results we obtained were consistent across different durations. To avoid redundancy, we initially chose not to include the results from the 200 ms stimulus duration, as they reiterated the findings of the 33 ms duration.

      However, we acknowledge that the brief stimulus duration could raise concerns regarding the robustness of our conclusions, particularly concerning the effects of high spatial frequencies. Upon reflecting on the reviewer’s comments during the first revision, we recognized the importance of addressing these potential concerns directly. Therefore, we have included the data from the 200 ms stimulus duration in our revised manuscript.

      Furthermore, Our team is actively investigating the differences between fast (33 ms) and slow (200 ms) presentations in terms of SF processing. Our preliminary observations suggest similar processing of HSF in the early phase of the response for both fast and slow presentations, but different processing of HSF in the late phase. This was another reason we initially opted to publish the results from the brief stimulus duration separately, as we intended to explore the different aspects of SF processing in fast and slow presentations in subsequent studies.

      I suggest the authors upload both data sets and analyzing codes, so that the claim could be easily examined by interested readers.

      Thank you for your suggestion to make both data sets and the analyzing codes available for examination by interested readers.

      We have created a repository that includes a sample of the dataset along with the necessary codes to output the main results. While we cannot provide the entire dataset at this time due to ongoing investigations by our team, we are committed to ensuring transparency and reproducibility. The data and code samples we have provided should enable interested readers to verify our claims and understand our analysis process.

      Repository: https://github.com/ramintoosi/spatial-frequency-selectivity

      Reviewer #2 (Public Review):

      Summary:

      This paper aimed to examine the spatial frequency selectivity of macaque inferotemporal (IT) neurons and its relation to category selectivity. The authors suggest in the present study that some IT neurons show a sensitivity for the spatial frequency of scrambled images. Their report suggests a shift in preferred spatial frequency during the response, from low to high spatial frequencies. This agrees with a coarse-to-fine processing strategy, which is in line with multiple studies in the early visual cortex. In addition, they report that the selectivity for faces and objects, relative to scrambled stimuli, depends on the spatial frequency tuning of the neurons.

      Strengths:

      Previous studies using human fMRI and psychophysics studied the contribution of different spatial frequency bands to object recognition, but as pointed out by the authors little is known about the spatial frequency selectivity of single IT neurons. This study addresses this gap and shows spatial frequency selectivity in IT for scrambled stimuli that drive the neurons poorly. They related this weak spatial frequency selectivity to category selectivity, but these findings are premature given the low number of stimuli they employed to assess category selectivity.

      Thank you for your thorough review and insightful feedback on our manuscript. We greatly appreciate your time and effort in providing valuable comments and suggestions, which have significantly contributed to enhancing the quality of our work.

      The authors revised their manuscript and provided some clarifications regarding their experimental design and data analysis. They responded to most of my comments but I find that some issues were not fully or poorly addressed. The new data they provided confirmed my concern about low responses to their scrambled stimuli. Thus, this paper shows spatial frequency selectivity in IT for scrambled stimuli that drive the neurons poorly (see main comments below). They related this (weak) spatial frequency selectivity to category selectivity, but these findings are premature given the low number of stimuli to assess category selectivity.

      While we acknowledge that the number of instances per condition is relatively low, the overall dataset is substantial. Specifically, our study includes a total of 180 stimuli (6 spatial frequencies × 2 scrambled/non-scrambled conditions × 15 instances, including 9 fixed and 6 non-fixed) and 5400 trials (180 stimuli × 2 durations × 15 repetitions). Conducting these trials requires approximately one hour of experimental time per session.

      Extending the number of stimuli, while potentially addressing this limitation, would significantly compromise the quality of the experiment by increasing the duration and introducing potential fatigue effects in the subjects. Despite this limitation, our findings lay important groundwork by offering novel insights into object recognition through the lens of spatial frequency. We believe this work can serve as a foundation for future experiments designed to further explore and validate these theories with expanded stimulus sets.

      Main points.

      (1) They have provided now the responses of their neurons in spikes/s and present a distribution of the raw responses in a new Figure. These data suggest that their scrambled stimuli were driving the neurons rather poorly and thus it is unclear how well their findings will generalize to more effective stimuli. Indeed, the mean net firing rate to their scrambled stimuli was very low: about 3 spikes/s. How much can one conclude when the stimuli are driving the recorded neurons that poorly? Also, the new Figure 2- Appendix 1 shows that the mean modulation by spatial frequency is about 2 spikes/s, which is a rather small modulation. Thus, the spatial frequency selectivity the authors describe in this paper is rather small compared to the stimulus selectivity one typically observes in IT (stimulus-driven modulations can be at least 20 spikes/s).

      To address the concerns regarding the firing rates and the modulation of neuronal responses by spatial frequency (SF), we emphasize several key points:

      (1) Significance of Firing Rate Differences: While it is true that the mean net firing rate to our scrambled stimuli was relatively low, the firing rate differences observed were statistically significant, with p-values approximately at 1e-5. This indicates that despite the low firing rates, the observed differences are reliable and unlikely to have occurred by chance.

      (2) Classification Rate and Modulation by SF: Our analysis showed that the difference between various SF responses led to a classification rate of 44.68%, which is 24.68% higher than the chance level. This substantial increase above the chance level demonstrates that SF significantly modulates IT responses, even if the overall firing rates are modest.

      (3) Effect Size and SF Modulation: While the effect size in terms of firing rate differences may be small, it is significant. The significant modulation of IT responses by SF, as evidenced by our statistical analyses and classification rate, supports our conclusions regarding the role of SF in driving IT responses.

      (4) Expectations for Noise-like Pure SF Stimuli: We acknowledge that IT responses are typically higher for various object stimuli. Given the nature of our pure SF stimuli, which resemble noise-like patterns, we did not anticipate high responses in terms of spikes per second. The low firing rates are consistent with the expectation for such stimuli and do not undermine the significance of the observed modulation by SF.

      We believe that these points collectively support the validity of our findings and the significance of SF modulation in IT responses, despite the low firing rates. We appreciate your insights and hope this clarifies our stance on the data and its implications.

      We added the following description to the Appendix 1 - “Strength of SF selectivity” section:

      “While the firing rates and net responses to scrambled stimuli were modest (e.g., 2.9 Hz in T1), the differences across spatial frequency (SF) bands were statistically significant (p ≈ 1e-5) and led to a classification accuracy 24.68\% above chance. This demonstrates the robustness of SF modulation in IT neurons despite low firing rates. The modest responses align with expectations for noise-like stimuli, which are less effective in driving IT neurons, yet the observed SF selectivity highlights a fundamental property of IT encoding.”

      (2) Their new Figure 2-Appendix 1 does not show net firing rates (baseline-subtracted; as I requested) and thus is not very informative. Please provide distributions of net responses so that the readers can evaluate the responses to the stimuli of the recorded neurons.

      We understand the reviewer’s concern about the presentation of net firing rates. In T2 (the late time interval), the average response rate falls below the baseline, resulting in negative net firing rates, which might confuse readers. To address this, we have added the net responses to the text for clarity. Additionally, we have included the average baseline response in the figure to provide a more comprehensive view of the data.

      “To check the SF response strength, the histogram of IT neuron responses to scrambled, face, and non-face stimuli is illustrated in this figure. A Gamma distribution is also fitted to each histogram. To calculate the histogram, the neuron response to each unique stimulus is calculated for each neuron in spike/seconds (Hz). In the early phase, T1, the average firing rate to scrambled stimuli is 26.3 Hz which is significantly higher than the response in -50 to 50ms which is 23.4 Hz. In comparison, the mean response to intact face stimuli is 30.5 Hz, while non-face stimuli elicit an average response of 28.8 Hz. The average net responses to the scrambled, face, and non-face stimuli are 2.9 Hz, 7.1 Hz, and 5.4 Hz, respectively. Moving to the late phase, T2, the responses to scrambled, face, and object stimuli are 19.5 Hz, 19.4 Hz, and 22.4 Hz, respectively. The corresponding average net responses are 3.9 Hz, 4.0 Hz, and 1.0 Hz below the baseline response.”

      (3) The poor responses might be due to the short stimulus duration. The authors report now new data using a 200 ms duration which supported their classification and latency data obtained with their brief duration. It would be very informative if the authors could also provide the mean net responses for the 200 ms durations to their stimuli. Were these responses as low as those for the brief duration? If so, the concern of generalization to effective stimuli that drive IT neurons well remains.

      The firing rates for the 200 ms stimulus duration are as follows: 27.7 Hz, 30.7 Hz, and 30.4 Hz for scrambled, face, and object stimuli in T1), respectively; and 26.2 Hz, 29.1 Hz, and 33.9 Hz in T2. The average baseline firing rate (−50 to 50 ms) is 23.4 Hz. Therefore, the net responses are 4.3 Hz, 7.3 Hz, and 7.0 Hz for T1; and 2.8 Hz, 5.7 Hz, and 10.5 Hz for T2 for scrambled, face, and object stimuli, respectively.

      Notably, the impact of stimulus duration is more pronounced in T2, which is consistent with the time interval of the T2 compared to T1. However, the firing rates in T1 do not show substantial changes with the longer duration. As we discussed in our response to the first comment, it is important to note that high net responses are not typically expected for scrambled or noise-like stimuli in IT neurons. Instead, the key findings of this study lie in the statistical significance of these responses and their meaningful relationship to category selectivity. These results highlight the broader implications for understanding the role of spatial frequency in object recognition.

      We added the firing rates to the, Appendix 1, “Extended stimulus duration supports LSF-preferred tuning” part as follows.

      “For the 200 ms stimulus duration, the firing rates were 27.7 Hz, 30.7 Hz, and 30.4 Hz for scrambled, face, and object stimuli in T1, respectively, and 26.2 Hz, 29.1 Hz, and 33.9 Hz in T2. The corresponding net responses were 4.3 Hz, 7.3 Hz, and 7.0 Hz in T1, and 2.8 Hz, 5.7 Hz, and 10.5 Hz in T2. While the longer stimulus duration did not substantially increase firing rates in T1, its impact was more pronounced in T2.”

      (4) I still do not understand why the analyses of Figures 3 and 4 provide different outcomes on the relationship between spatial frequency and category selectivity. I believe they refer to this finding in the Discussion: "Our results show a direct relationship between the population's category coding capability and the SF coding capability of individual neurons. While we observed a relation between SF and category coding, we have found uncorrelated representations. Unlike category coding, SF relies more on sparse, individual neuron representations.". I believe more clarification is necessary regarding the analyses of Figures 3 and 4, and why they can show different outcomes.

      Figure 3 explores the relationship between SF coding and category coding at both the single-neuron and population levels.

      ● Figures 3(a) and 3(b) examine the relationship between a single neuron’s response pattern and object decoding in the population.

      ● Figure 3(c) investigates the relationship between a single neuron’s SF decoding capabilities and object decoding in the population.

      ● Figure 3(d) assesses the relationship between a single neuron’s object decoding capabilities and SF decoding in the population.

      In summary, Figure 3 demonstrates a relation between SF coding/response pattern at the single level and category coding at the population level.

      Figure 4, on the other hand, addresses the uncorrelated nature of SF and category coding.

      ● Figure 4(a) shows the uncorrelated relation between a single neuron’s SF decoding capability and its object decoding capability. This suggests that a neuron's ability to decode SF does not predict its ability to decode object categories.

      ● Figure 4(b) illustrates that the contribution of a neuron to the population decoding of SF is uncorrelated with its contribution to the population decoding of object categories. This further supports the idea that the mechanisms behind SF coding and object coding are uncorrelated.

      In summary, Figure 4 suggests that while there is a relation between SF coding and category coding as illustrated in Figure 3, the mechanisms underlying SF coding and object coding operate independently (in terms of correlation), highlighting the distinct nature of these processes.

      We hope this explanation clarifies why the analyses in Figures 3 and 4 present different outcomes. Figure 3 provides insight into the relationship between SF and category coding, while Figure 4 emphasizes the uncorrelated nature of these processes. We also added the following explanation in the “Uncorrelated mechanisms for SF and category coding” section.

      Based on your command, to clarify the presentation of the work, we added the following description to the “Uncorrelated mechanisms for SF and category coding” section:

      “Figures 3 and 4 examine different aspects of the relationship between SF and category coding. Figure 3 highlights a relationship between SF coding at the single-neuron level and category coding at the population level. Conversely, Figure 4 demonstrates the uncorrelated mechanisms underlying SF and category coding, showing that a neuron’s ability to decode SF is not predictive of its ability to decode object categories. This distinction underscores that while SF and category coding are related at broader levels, their underlying mechanisms are independent, emphasizing the distinct processes driving each form of coding.”

      (5) The authors found a higher separability for faces (versus scrambled patterns) for neurons preferring high spatial frequencies. This is consistent for the two monkeys but we are dealing here with a small amount of neurons. Only 6% of their neurons (16 neurons) belonged to this high spatial frequency group when pooling the two monkeys. Thus, although both monkeys show this effect I wonder how robust it is given the small number of neurons per monkey that belong to this spatial frequency profile. Furthermore, the higher separability for faces for the low-frequency profiles is not consistent across monkeys which should be pointed out.

      We appreciate the reviewer’s concern regarding the relatively small number of neurons in the high spatial frequency group (16 neurons, 6% of the total sample across the two monkeys) and the consistency of the results. While we acknowledge this limitation, it is important to note that findings involving sparse subsets of neurons can still be meaningful. For example, Dalgleish et al. (2020) demonstrated that perception can arise from the activity of as few as ~14 neurons in the mouse cortex, supporting the sparse coding hypothesis. This underscores the potential robustness of results derived from small neuronal populations when the activity is statistically significant and functionally relevant.

      Regarding the higher separability for faces among neurons preferring high spatial frequencies, the consistency of this finding across both monkeys suggests that this effect is robust within this subgroup. For neurons preferring low spatial frequencies, we agree that the lack of consistency across monkeys should be explicitly noted. These differences may reflect individual variability or differences in sampling across subjects and merit further investigation in future studies.

      To address this concern, we have updated the text to explicitly discuss the small size of the high spatial frequency group, its implications, and the observed inconsistency in the low spatial frequency profiles between monkeys. We have added the following description to the discussion.

      “Next, according to Figure 3(a), 6% of the neurons are HSF-preferred and their firing rate in HSF is comparable to the LSF firing rate in the LSF-preferred group. This analysis is carried out in the early phase of the response (70-170ms). While most of the neurons prefer LSF, this observation shows that there is an HSF input that excites a small group of neurons. Importantly, findings involving small neuronal populations can still be meaningful, as studies like Dalgleish et al. (2020) have demonstrated that perception can arise from the activity of as few as ~14 neurons in the mouse cortex, emphasizing the robustness of sparse coding.”

      Regarding the separability of faces for the low-frequency profiles, we added the following to the appendix section,

      “For neurons preferring LSF, LP profile, it is important to note the lack of consistency in responses across monkeys. This variability may reflect individual differences in neural processing or variations in sampling between subjects.”

      And in the discussion:

      “Our results are based on grouping the neurons of the two monkeys; however, the results remain consistent when looking at the data from individual monkeys as illustrated in Appendix 2. However, for neurons preferring LSF, we observed inconsistency across monkeys, which may reflect individual differences or sampling variability. These findings highlight the complexity of SF processing in the IT cortex and suggest the need for further research to explore these variations.”

      * Henry WP Dalgleish, Lloyd E Russel, lAdam M Packer, Arnd Roth, Oliver M Gauld, Francesca Greenstreet, Emmett J Thompson, Michael Häusser (2020) How many neurons are sufficient for perception of cortical activity? eLife 9:e58889.

      (6) I agree that CNNs are useful models for ventral stream processing but that is not relevant to the point I was making before regarding the comparison of the classification scores between neurons and the model. Because the number of features and trial-to-trial variability differs between neural nets and neurons, the classification scores are difficult to compare. One can compare the trends but not the raw classification scores between CNN and neurons without equating these variables.

      We appreciate the reviewer’s follow-up comment and agree that differences in the number of features and trial-to-trial variability between IT neurons and CNN units make direct comparisons of raw classification scores challenging. As the reviewer suggests, it is more appropriate to focus on comparing trends rather than absolute scores when analyzing the similarities and differences between these systems. In light of this, we have revised the text to clarify that our intention was not to equate raw classification scores but to highlight the qualitative patterns and trends observed in spatial frequency encoding between IT and CNN units.

      “SF representation in the artificial neural networks

      We conducted a thorough analysis to compare our findings with CNNs. To assess the SF coding capabilities and trends of CNNs, we utilized popular architectures, including ResNet18, ResNet34, VGG11, VGG16, InceptionV3, EfficientNetb0, CORNet-S, CORTNet-RT, and CORNet-z, with both pre-trained on ImageNet and randomly initialized weights. Employing feature maps from the four last layers of each CNN, we trained an LDA model to classify the SF content of input images. Figure 5(a) shows the SF decoding accuracy of the CNNs on our dataset (SF decoding accuracy with random (R) and pre-trained (P) weights, ResNet18: P=0.96±0.01 / R=0.94±0.01, ResNet34 P=0.95±0.01 / R=0.86±0.01, VGG11: P=0.94±0.01 / R=0.93±0.01, VGG16: P=0.92±0.02 / R=0.90±0.02, InceptionV3: P=0.89±0.01 / R=0.67±0.03, EfficientNetb0: P=0.94±0.01 / R=0.30±0.01, CORNet-S: P=0.77±0.02 / R=0.36±0.02, CORTNet-RT: P=0.31±0.02 / R=0.33±0.02, and CORNet-z: P=0.94±0.01 / R=0.97±0.01). Except for CORNet-z, object recognition training increases the network's capacity for SF coding, with an improvement as significant as 64\% in EfficientNetb0. Furthermore, except for the CORNet family, LSF content exhibits higher recall values than HSF content, as observed in the IT cortex (p-value with random (R) and pre-trained (P) weights, ResNet18: P=0.39 / R=0.06, ResNet34 P=0.01 / R=0.01, VGG11: P=0.13 / R=0.07, VGG16: P=0.03 / R=0.05, InceptionV3: P=<0.001 / R=0.05, EfficientNetb0: P=0.07 / R=0.01). The recall values of CORNet-Z and ResNet18 are illustrated in Figure 5(b). However, while the CNNs exhibited some similarities in SF representation with the IT cortex, they did not replicate the SF-based profiles that predict neuron category selectivity. As depicted in Figure 5(c) although neurons formed similar profiles, these profiles were not associated with the category decoding performances of the neurons sharing the same profile.”

      Discussion:

      “Finally, we compared SF's representation trends and findings within the IT cortex and the current state-of-the-art networks in deep neural networks.”

      Recommendations for the authors:

      Reviewer #2 (Recommendations For The Authors):

      The mean baseline firing rate of their neurons (23.4 Hz) was rather high for single IT neurons (typically around 10 spikes/s or lower). Were these well-isolated units or mainly multiunit activity?

      We confirm that the recordings in our study were from both well-isolated single units and multi-unit activities (remaining after isolation neurons) sorted based on our spike sorting toolbox. The higher baseline firing rate is likely due to the experimental design, particularly the inclusion of the responsive neurons from the selectivity phase. We added the following statement to the methods section.

      “In our analysis, we utilized both well-isolated single units and multi-unit activities (which represent neural activities that could not be further sorted into single units), ensuring a comprehensive representation of neural responses across the recorded population.”

    1. Author response:

      The following is the authors’ response to the original reviews.

      We thank the reviewers for their thoughtful comments.

      Based on their suggestions we will:

      (1) Use more accurate language to describe the hypothalamus regions under investigation in this study. While we aimed to primarily investigate the medial preoptic area (MPOA), our dissections and sequencing data in fact capture several regions of the anterior hypothalamus including the anteroventral periventricular (AVPV), paraventricular (PVN), supraoptic (SON), suprachiasmatic nuclei (SCN), and more. We will revise the language in our manuscript to reflect that our study in fact investigates the cellular evolution of the anterior hypothalamus across behaviorally divergent deer mice.

      (2) Revise our language to clarify that while our study provides a rich dataset for generating hypotheses about which cell types may contribute to behavioral differences, it does not provide any evidence of causal relationships. We hope to investigate this further in future work.

      (3) Clarify specific methodological choices for which reviewers had questions, especially about the hypothalamic regions for which we did histology to validate cell abundance differences and methodological choices related to mapping our cell clusters to Mus cell types.

      Our responses to each reviewer’s specific comments are below.

      Reviewer #1:

      The major limitation of the study is the absence of causal experiments linking the observed changes in MPOA cell types to species-specific social behaviors. While the study provides valuable correlational data, it lacks functional experiments that would demonstrate a direct relationship between the neuronal differences and behavior. For instance, manipulating these cell types or gene expressions in vivo and observing their effects on behavior would have strengthened the conclusions, although I certainly appreciate the difficulty in this, especially in non-musculus mice. Without such experiments, the study remains speculative about how these neuronal differences contribute to the evolution of social behaviors.

      Yes, we agree the study lacks functional experiments. We hope that the dataset is of value for generating hypotheses about how hypothalamic neuronal cell types may govern species-specific social behaviors, and for these hypotheses to be functionally tested by us and others in future work.

      Reviewer #2:

      Some methodology could be further explained, like the decision of a 15% cutoff value for cell type assignment per cluster, or the necessity of a multi-step analysis pipeline for gene enrichment studies.

      A 15% cutoff value for cell type assignment was chosen to include all known homology correspondences between our dataset and the Mus atlas. For example, i14:Avp/Cck cells from the Mus atlas represent Avp cells from the suprachiasmatic nuclei (SCN). Though only 17.3% of cluster 15 maps to i14:Avp/Cck, we know these two clusters correspond based on the expression of Avp and additional SCN marker genes in cluster 15 (Supp Fig 6). We will further explain this cutoff in the revised manuscript.

      Our gene enrichment study includes a multi-step analysis pipeline because we wanted to control for confounders that may be introduced because of gene expression level. Genes that are more highly expressed are more accurately quantified and thus more likely to be identified as differentially expressed. Therefore, we wanted to test for gene enrichments in our set of DE genes against a background of genes with similar expression levels. We will clarify this motivation in the revised manuscript.

      The authors should exercise strong caution in making inferences about these differences being the basis of parental behavior. It is possible, given connections to relevant research, but without direct intervention, direct claims should be avoided. There should be clear distinctions of what to conclude and what to propose as possibilities for future research.

      Yes, we agree that we are unable to make direct claims about neuronal differences being the basis of parental behavior. We will revise our language to be clearer about which relationships we are hypothesizing and what we propose as possibilities for future research.

      Histology is not performed on all regions included in the sequencing analysis.

      We apologize that our language describing the hypothalamic regions included in the sequencing analysis and those included in the histology is unclear. We aimed to dissect the medial preoptic region for the sequencing analysis, but additionally captured parts of the anterior hypothalamus including the paraventricular (PVN), supraoptic (SON), and suprachiasmatic nuclei (SCN), and more.  Our histology was performed across the entire hypothalamus and includes all regions included in the sequencing data. We will revise the manuscript to more accurately describe the hypothalamic regions for which we investigated.

      Reviewer #3:

      My primary concern is that the dataset is limited: 52,121 neuronal nuclei across 24 samples, which does not provide many cells per cluster to analyze comparatively across sex and species, particularly given the heterogeneity of the region dissected. The Supplementary table reports lower UMIs/genes per cell than is typically seen as well. Perhaps additional information could be obtained from the data by not restricting the analyses to cells that can be assigned to Mus types. A direct comparison of the two Peromyscus species could be valuable as would a more complete Peromyscus POA atlas.

      Our dataset reports ~1,500 genes and ~1,000 UMIs per nuclei which is indeed lower than is typically reported in other single nuclei datasets. Some of this discrepancy is due to a lower quality genome and annotated transcriptome available for Peromyscus compared to Mus musculus, which results in a lower mapping rate than is typically reported in Mus studies. However, our dataset was sufficient to identify known peptidergic cell types (Supp Fig 6) and to map homology to Mus cell types for 34 (64%) of our 53 clusters. Additionally, although some of our clusters contain small numbers of cells, our differential abundance analysis accounts for the variance in cell numbers observed across samples and should be robust against any increase in variance due to small numbers. In fact, even differential abundance of very small cell clusters such as oxytocin neurons (cell type 40) was validated by histology.

      We would like to clarify that all analyses were performed on all cell clusters, regardless of whether or not they could be assigned homology to a Mus cell type. All the cell types that we identified as differentially abundant or contained significant sex differences happened to be cell types for which homology to a Mus cell type could be defined. This may arise for a relatively uninteresting reason: cell types that have more distinct transcriptional signatures will be more accurately clustered, leading to more accurate identification of homology as well as more accurate measurements of differential abundance / expression. We will revise language to make this more clear in our manuscript.

      In Supplement 7, it appears that most neurons can be assigned as excitatory or inhibitory, but then so many of these cells remain in the unassigned "gray blob" seen in panel 1E. Clustering of excitatory and inhibitory neurons separately, as in prior cited work in Mus POA (refs 31 and 57) may boost statistical power to detect sex and species differences in cell types. Perhaps the cells that cannot be assigned to Mus contain too few reads to be useful, in which case they should be filtered out in the QC. The technical challenges of a comparative single-cell approach are considerable, so it benefits the scientific community to provide transparency about them.

      We are not certain about why we are unable to cluster and assign homology to many of our cells (i.e. cells in the unassigned “gray blob”). However, we note that even in the Mus atlas, many cells did not belong to obvious clusters by UMAP visualization and that several clusters lacked notable marker genes and were designated simply as “Gaba” and “Glut” clusters. Therefore, it is unsurprising that our own dataset also contains cells that lack the transcriptional signatures needed to be clustered and/or mapped to Mus cell types. We do know, however, that the median number of reads/nuclei is uniform across cell clusters and does not explain why some clusters could not be assigned to Mus. We will add this information to our revised manuscript.

      We do not think that a two-stage clustering (i.e. clustering first by excitatory vs. inhibitory neurons) is expected to gain power to resolve cell types in this case. Excitatory vs. inhibitory neurons are clearly separable on our UMAP (Supp Fig 7) so that information is already being used by our clustering procedure. However, we will explore this further in our revised manuscript to see if doing so will boost statistical power.

      The Calb1 dimorphism as observed by immunostaining, appears much more extensive in P. maniculatus compared to P. polionotus (Figures 3 E and F). This finding is not reflected in the counts of the i20:Gal/Moxd1 cluster. The use of Calb1 staining as a proxy for the Gal/Moxd1 cluster would be strengthened if the number of POA Calb1+ neurons that are found in each cluster was apparent. There may be additional Calb+ neurons in the cells that are not annotated to a Mus cluster. This clarification would add support to the overall conclusion that there is reduced sexual dimorphism in P. polionotus.

      From the Mus MPOA atlas (which includes both single-cell sequencing data and imaging-based spatial information), it is known that the i20:Gal/Moxd1 cluster comprises sexually dimorphic cells that make up both the BNST and the SDN-POA. These sexually dimorphic cells are well-studied and known to be marked by Calb1, which we used in immunostaining as a proxy for i20:Gal/Moxd1.

      However, we would like to clarify that in our study, the immunostaining of Calb1+ neurons and the sequencing counts of the i20:Gal/Moxd1 cluster are not completely reflective of each other because our sequencing dataset only captured the ventral portion of the BNST. Therefore our i20:Gal/Moxd1 counts contain a combination of some Calb1+ BNST cells and likely all Calb1+ SDN-POA cells and is difficult to interpret on its own. Our histology, however, covers the entire hypothalamus and is more reliable for identifying sex and species differences in each region. We will clarify this in the revised manuscript.

      The relationship between the sex steroid receptor expression and the sex bias in gene expression would be improved if the sex bias in sex steroid receptor expression was included in Supplementary Figure 10.

      We will include this in the revised manuscript.

      There is no explanation for the finding that there is a female bias in gene expression across all cell types in P. polionotus.

      We also find this observation interesting but don’t have a good explanation for why at this point. We plan to follow this up in future work.

    1. Author Response:

      We appreciate the reviewers' detailed feedback, which has highlighted several areas where our study could be strengthened. Although we acknowledge the relatively limited scope of our CRISPR-based gene-deletion screen, we successfully demonstrated the immunogenic role of Pccb in our syngenetic pancreatic cancer mouse model. Specifically, loss of PCCB in our mutant KRAS/p53 PIK3CA-null (αKO) cells blocked host T cell killing of tumor cells.

      Furthermore, blocking the PD1/PD-L1 interaction reverses this anti-tumor immunogenic effect. We agree with the reviewers regarding the limitations of our study, such as the sample size in our scTCR sequencing and the lack of direct cytotoxicity assays to confirm tumor-specific T cell clones. However, our results are consistent across multiple experimental approaches that strongly suggest meaningful differences in host T cell response to the three implanted tumor types, KPC, αKO and p-αKO. We agree that future mechanistic studies will be important to determine how PCCB is involved in this immunogenic response. We also agree with the reviewers that future additional studies with other KPC cell lines will strength our conclusion regarding PCCB. Finally, we acknowledge the inherent limitations of IHC techniques to assess the involvement of other T cell checkpoints that might also be involved in this anti-tumor immunogenic effect. In summary, despite these limitations, our findings provide novel insight into the role of PCCB in pancreatic tumor immunogenicity and contribute to the ongoing discussion of how to improve therapeutic strategies for this deadly cancer.

      Reviewer 1:

      Weaknesses:

      (1) Clonal expansion of cytotoxic T cells infiltrating the pancreatic αKO tumors

      a. Only two tumor-bearing hosts were evaluated by single-cell TCR sequencing, thus limiting conclusions that may be drawn regarding repertoire diversity and expansion.

      We agree with the reviewer that possible repertoire diversity and expansion could be observed by sequencing more tumor-bearing hosts. However, our current data reveal a marked consistency in the transcriptional expression within the two tumors analyzed per group. Importantly, these features are significantly divergent between the αKO and p-αKO groups. While recognizing the limited sample size, the observed within-group consistency and the clear distinction between groups strongly support the validity of the reported trends.

      b. High abundance clones in the TME do not necessarily have tumor specificity, nor are they necessarily clonally expanded. They may be clones which are tissue-resident or highly chemokine-responsive and accumulate in larger numbers independent of clonal expansion. Please consider softening language to clonal enrichment or refer to clone size as clonal abundance throughout the paper.

      We agree with the reviewer that it’s possible that the high abundance clones are not necessarily tumor specific. Our previous work (N. Sivaram 2019) demonstrated the critical role of increased pancreatic CD8+ T cells in αKO tumor regression within B6 mice. Therefore, antigen specific CD8+ T cell clonal expansion within the pancreas is an anticipated observation. However, as the reviewer pointed out, a portion of this expansion may be attributable to factors independent of tumor antigens. While the low T cell infiltration observed in KPC-implanted mice argues against a purely tissue-resident explanation, further investigation is required to definitively establish the tumor specificity of individual clones. We have revised the manuscript to reflect this nuance, replacing "clonal expansion" with "clonal enrichment".

      c. The whole story would be greatly strengthened by cytotoxicity assays of abundant TCR clones to show tumor antigen specificity.

      As mentioned above, we agree with the reviewer that future studies are needed to investigate each of the specific clones. Due to the extended timeframe required, it’s beyond the scope of the present study.

      (2) A genome-wide CRISPR gene-deletion screen to identify molecules contributing to Pik3camediated pancreatic tumor immune evasion"

      a. CRISPR mutagenesis yielded outgrowth of only 2/8 tumors. A more complete screen with an increased total number of tumors would yield much stronger gene candidates with better statistical power. It is unsurprising that candidates were observed in only one of the two tumors. Nevertheless, the authors moved forward successfully with Pccb.

      We agree that by including more mice in the CRISPR screen, it’s possible that we could have identified more candidates. Regardless, we have successfully demonstrated PCCB’s role in pancreatic tumorgenicity with our mouse model.

      (3) T cells infiltrate p-αKO tumors with increased expression of immune checkpoint

      *a. In Figure 4D, cell counts are not normalized to totalCD8+ T cell counts making it difficult to directly compare aKO to p-aKO tumors. Based on quantifications from Figure 4D, I suspect normalization will strengthen the conclusion that CD8+ infiltrate is more exhausted in p-aKO tumors. *

      Due to the use of distinct tumor sections for quantifying CD8+ cells and T cell checkpoint inhibitory receptor expression, direct normalization of these counts is challenging. However, we observed comparable CD8+ cell numbers between αKO and p-αKO tumors, with p-αKO tumors exhibiting nearly double the expression of immune checkpoint receptors. Therefore, even accounting for potential normalization discrepancies, we anticipate that p-αKO tumors would still demonstrate a significantly higher percentage of immune checkpoint receptorpositive cells compared to αKO tumors.

      b. Flow cytometric analysis to further characterize the myeloid compartment is incomplete (single replicate) and does not strengthen the argument that p-aKO TME is more immunosuppressive. It could, however, strengthen the argument that TIL has less anti-tumor potential if effector molecule expression in CD8+ infiltrating cells were quantified.

      We agree that including more tumor samples will strengthen the argument that p-αKO TME is more immunosuppressive. Future studies need to be done to characterize CD8+ T cells.

      (4) Inhibition of PD1/PD-L1 checkpoint leads to elimination of most p-αKO tumors

      a. It is reasonable to conclude that p-aKO tumors are responsive to immune checkpoint blockade. However, there is no data presented to support the statement that checkpoint blockade reactivates an existing anti-tumor CD8+ T cell response and does not induce a de novo response

      We agree that future studies exploring the clonotypes of T cells infiltrating tumors in PD-1treated mice are necessary to determine whether observed T cell response represents reactivation of existing clones, a de novo response, or a combination of both.

      b. The discussion of these data implies that anti-PD-1 would not improve aKO tumor control, but these data are not included. As such, it is difficult to compare the therapeutic response in aKO versus p-aKO. Further, these data are at best an indirect comparison of the T cell responsiveness against tumor, as the only direct comparison is infiltrating cell count in Figure 4 and there are no public TCR clones with confirmed anti-tumor specificity to follow in the aKO versus p-aKO response.

      Since αKO tumors completely regress with 100% animal survival, we deemed anti-PD1 treatment in this group unnecessary. While we did assess anti-PD1 treatment in KPCimplanted mice, no survival benefit was observed (data not shown). The p-αKO tumor model was the only one in which anti-PD1 treatment improved survival. The complexity of the in vivo tumor microenvironment likely contributes to the lack of shared TCR clones between αKO and p-αKO tumors, even within the same tumor group. Future studies aimed at identifying tumorspecific clones may involve transferring in vivo models to in vitro assays or the generation of novel mouse strains expressing identified TCRs. However, these approaches require substantial time and resources and are beyond the scope of the present study.

      Reviewer 2:

      Weaknesses:

      (1) A major issue is that it seems these data are based on the use of a single tumor cell clone with PIK3CA deleted. Therefore, there could be other changes in this clone in addition to the deletion of PIK3CA that could contribute to the phenotype.

      We have previously tested a different KPC cell line (DT10022) with genetically downregulated PIK3CA and found mice implanted with αKO cells also showed tumor regression. However, we have not tested if deletion of Pccb in the DT10022-aKO cell line will have the same effect.

      2) The conclusion that the change in the PCCB-deficient tumor cell line is unrelated to mitochondrial metabolic changes may be incorrect based on the data provided. While it is true that in the experiments performed, there was no statistically significant change in the oxygen consumption rate or metabolite levels, this could be due to experimental error. There is a trend in the OCR being higher in the PCCB-deficient cells, although due to a high standard deviation, the change is not statistically significant. There is also a trend for there being more aKG in this cell line, but because there were only 3 samples per cell line, there is no statistically significant difference.

      Although PCCB is known to cause metabolic changes, in the context of this study, we are comparing PCCB-deficient to PCCB & PIK3CA double-deficient cells. We did not address if PCCB loss alone would cause metabolic alteration. We suspect that is the case.

      (3) More data are required to make the authors' conclusion that there are myeloid changes in the PCCB-deficient tumor cells. There is only flow data from shown from one tumor of each type.

      We agree that including more tumor samples will strengthen the argument that p-αKO TME is more immunosuppressive.

      (4) The previous published study demonstrated increased MHC and CD80 expression in the PIK3CA-deficient tumors and these differences were suggested to be the reason the tumors were rejected. However, no data concerning the levels of these proteins were provided in the current manuscript.

      Our previous hypothesis for altered MHC and CD80 levels is based on the observation that there is a dramatic increase in the number of infiltrating T cells upon Pik3ca deletion. In this study, similar levels of infiltrating T cells were observed when Pccb was deleted in αKO cells, therefore we do not expect any changes in MHC and CD80 levels since these tumors appears to be still recognized by the T cells. Indeed, we are able detect clonal enrichment in p-αKO tumors.

      Reviewer 3:

      Weaknesses:

      The IHC technique that was used to stain and characterize the exhaustion status of the tumorinfiltrating T cells.

      We agree with the reviewer that incorporating multi-color IHC or flow cytometry to characterize the exhaustion status of specific T cell subtypes would provide more comprehensive information. Unfortunately, we do not have the resources to perform these studies currently.

    1. Author response:

      Reviewer #1 (Public review):

      Summary:

      This manuscript by Guo and Uusisaari describes a series of experiments that employ a novel approach to address long-standing questions on the inferior olive in general and the role of the nucleoolivary projection specifically. For the first time, they optimized the ventral approach to the inferior olive to facilitate imaging in this area that is notoriously difficult to reach. Using this approach, they are able to compare activity in two olivary regions, the PO and DAO, during different types of stimulation. They demonstrate the difference between the two regions, linked to Aldoc-identities of downstream Purkinje cells, and that there is co-activation resulting in larger events when they are clustered. Periocular stimulation also drives larger events, related to co-activation. Using optogenetic stimulation they activate the nucleoolivary (N-O) tract and observe a wide range of responses, from excitation to inhibition. Zooming in on inhibition they test the assumption that N-O activation can be responsible for suppression of sensoryevoked events. Instead, they suggest that the N-O input can function to suppress background activity while preserving the sensory-driven responses.

      Strengths:

      This is an important study, tackling the long-standing issue of the impossibility to do imaging in the inferior olive and using that novel method to address the most relevant questions. The experiments are technically very challenging, the results are presented clearly and the analysis is quite rigorous. There is quite a lot of room for interpretation, see weaknesses, but the authors make an effort to cover many options.

      Weaknesses:

      The heavy anesthesia that is required during the experiment could severely impact the findings. Because of the anesthesia, the firing rate of IO neurons is found to be 0.1 Hz, significantly lower than the 1 Hz found in non-anesthetized mice. This is mentioned and discussed, but what the consequences could be cannot be understated and should be addressed more. Although the methods and results are described in sufficient detail, there are a few points that, when addressed, would improve the manuscript.

      We sincerely thank the reviewer for their encouraging comments and recognition of our study’s significance. We fully acknowledge the confounding effects of the deep anesthesia used in our experiments, which was necessary to ensure the animals’ welfare while establishing this technically demanding methodology. We elaborate on these effects below and will further clarify them in the revised manuscript.

      Ultimately, the full resolution of this issue will require recordings in awake animals, as we consider our approach an advancement from acute slice preparations but not yet a complete representation of in vivo IO function. However, key findings from our study—such as amplitude modulation with co-activation and the potential role of IO refractoriness in complex spike generation—could be further explored in existing cerebellar cortical recordings from awake, behaving animals. We hope our work will motivate re-examination of such datasets to assess whether these mechanisms contribute to overall cerebellar function.

      Reviewer #1 (Recommendations for the authors):

      On page 10 the authors indicate that 2084 events were included for DAO and 1176 for PO. Is that the total number of events? What was the average and the range per neuron and the average recording duration?

      Thank you for pointing out lack of clarity. The sentence should say "in total, 2084 and 1176 detected events from DAO and PO were included in the study". We will add the averages and ranges of events detected per neuron in different categories, as well as the durations of the recordings (ranging from 120s to 270s) to the tables.

      On page 10 it is also stated that: "events in PO reached larger values than those in DAO even though the average values did not differ". Please clarify that statement. Which parameter + p-value in the table indicates this difference?

      Apologies for omission. Currently the observation is only visible in the longer tail to the right in the PO data in Figure 2B2. We will add the range of values (3.0-75.2 vs 3.1-39.6 for PO and DAO amplitudes, respectively) in text and the tables in the revision.

      Abbreviating airpuff to AP is confusing, I would suggest not abbreviating it.

      Understood. We will change AP to airpuff in the text. In figure labels, at least in some panels, the abbreviation will be necessary due to space constraints.

      What type of pulse was used to drive ChrimsonR? Could it be that the pulse caused a rebound-like phenomenon with the pulse duration that drove the excitation?

      As described on line 229 and in the Methods, we used 5-second trains of 5-ms LED light pulses. Importantly, these stimulation parameters were informed by our extensive in vitro examination of various stimulation patterns (Lefler et al., 2014), which consistently produced stable postsynaptic responses without inducing depolarization or rebound effects. Additionally, Loyola et al. (2024) reported no evidence of rebound activity in IO cells following optogenetic activation of N-O axons in the absence of direct neuronal depolarization. We will incorporate these considerations into the discussion, while also acknowledging that unequivocal confirmation of “direct” rebound excitation would require intracellular recordings, such as patch clamp experiments.

      The authors indicate that the excitatory activity was indistinguishable in shape from other calcium activity, but can anything be said about the timing (the scale bar in Figure 4A2 has no value, is it the same 2s pulse)?

      Apologies for oversight in labeling the scale bar in Figure 4A2 (it is 2s). While we deliberately refrain from making strong claims regarding the origin of the NO-evoked spikes, their timing can be examined in more detail in Figure 4 - Supplement 1, panels C and D. We will make sure this is clearly stated in the revised text.

      Did the authors check for accidental sparse transfection with ChrimsonR of olivary neurons in the post-mortem analysis?

      Good point! However, we have never seen this AAV9-based viral construct to drive trans-synaptic expression in the IO, nor is this version of AAV known to have the capacity for transsynaptic expression in general.

      No sign of retrograde labeling (via the CF collaterals in the cerebellar nuclei) was seen either. Notably, the hSyn promoter used to drive ChrimsonR expression is extremely ineffective in the IO. Thus, we doubt that such accidental labeling could underlie the excitatory events seen upon N-O stimulation. We will add these mentions with relevant references to the discussion of the revised manuscript.

      On page 18 the authors state that: "The lower SS rate was attributed to intrinsic factors of PNs, while the reduced frequency of CSs was speculated to result from increased inhibition of the IO via the nucleo-olivary (N-O) pathway targeting the same microzone." I think I understand what you mean to say, but this is a bit confusing.

      Agreed. We will rephrase this sentence to clarify that a lower SS rate in a given microzone may lead to increased activation of inhibitory N-O axons that target the region of IO that sends CF to the same microzone.

      Is airpuff stimulation not more likely to activate PO dan DAO because of the related modalities (more face vs. more trunk/limbs?), and thereby also more likely to drive event co-activation (as it is stated in the abstract).

      We agree that the specific innervation patterns of different IO regions likely explain the discrepancy between previous reports of airpuff-evoked complex spikes in cerebellar cortical regions targeted by DAO and the absence of airpuff responses in the particular region of DAO accessible via our surgical approach. As in the present dataset virtually no airpuff-evoked events were seen in DAO regions, we are unable to directly compare airpuff-evoked event co-activation between PO and DAO. The higher co-activation for PO was observed for "spontaneous" activity.

      The Discussion addresses the question of why N-O pathway activation does not remove the airpuff response.

      Given the potentially profound effect, I would propose to expand the discussion on the role of aneasthesia, including longer refractory periods but also potential disruption of normal network interactions (even though individually the stimulations work). Briefly indicating what is known about alpha-chloralose would help interpret the results as well.

      We fully agree that the anesthetic state introduces confounding factors that must be considered when interpreting our results. We will expand the discussion to address how anesthesia, particularly alphachloralose as well as tissue cooling, may contribute to prolonged refractory periods and potential disruptions in normal network interactions. However, we recognize that certain aspects cannot be fully resolved without recordings in awake animals. For this reason, we characterize our preparation as an "upgraded" in vitro approach rather than a fully representative in vivo model.

      Please clearly indicate that the age range of P35-45 is for the moment of virus injection and specify the age range for the imaging experiment.

      Apologies for the oversight. We will indicate these age ranges in the results (as they are currently only specified in Methods). The P35-45 range refers to moment of virus injection.

      The methods indicate that a low-pass filter of 1Hz was used. I am sure this helps with smoothing, but does it not remove a lot of potentially interesting information. How would a higher low-pass filter affect the analysis and results?

      We acknowledge that applying a 1 Hz low-pass filter inevitably removes high-frequency components, including potential IO oscillations and fine details such as spike "doublets." However, given the temporal resolution constraints of our recording approach, we prioritized capturing robust, interpretable events over attempting to extract finer features that might be obscured by both the indicator kinetics and imaging speed.

      While a higher cut-off frequency could, in principle, allow more precise measurement of rise times and peak timings, it would also amplify high-frequency noise, complicating automated event detection and reducing confidence in distinguishing genuine neural signals from artifacts. Given these trade-offs, we opted for a conservative filtering approach to ensure stable event detection. Future work, particularly with faster imaging rates and improved sensors (GCaMP8s) will be used to explore the finer temporal structure of IO activity. We will deliberate on these matters more extensively in the revised discussion.

      Reviewer #2 (Public review):

      The authors developed a strategy to image inferior olive somata via viral GCaMP6s expression, an implanted GRIN lens, and a one-photon head-mounted microscope, providing the first in vivo somatic recordings from these neurons. The main new findings relate to the activation of the nucleoolivary pathway, specifically that: this manipulation does not produce a spiking rebound in the IO; it exerts a larger effect on spontaneous IO spiking than stimulus (airpuff)-evoked spiking. In addition, several findings previously demonstrated in vivo in Purkinje cell complex spikes or inferior olivary axons are confirmed here in olivary somata: differences in event sizes from single cells versus co-activated cells; reduced coactivation when activating the NO pathway; more coactivation within a single zebrin compartment.

      The study presents some interesting findings, and for the most part, the analyses are appropriate. My two principal critiques are that the study does not acknowledge major technical limitations and their impact on the claims; and the study does not accurately represent prior work with respect to the current findings.

      We thank the reviewer for recognising the value of the findings in our "reduced" in vivo preparation, and apologize for omissions in the work that led to critique. We will elaborate on these matters below and prepare a revised manuscript.

      The authors use GCaMP6s, which has a tau1/2 of >1 s for a normal spike, and probably closer to 2 s (10.1038/nature12354) for the unique and long type of olivary spikes that give rise to axonal bursts (10.1016/j.neuron.2009.03.023). Indeed, the authors demonstrate as much (Fig. 2B1). This affects at least several claims:

      a. The authors report spontaneous spike rates of 0.1 Hz. They attribute this to anesthesia, yet other studies under anesthesia recording Purkinje complex spikes via either imaging or electrophysiology report spike rates as high as 1.5 Hz (10.1523/JNEUROSCI.2525-10.2011). This discrepancy is not acknowledged and a plausible explanation is not given. Citations are not provided that demonstrate such low anesthetized spike rates, nor are citations provided for the claim that spike rates drop increasingly with increasing levels of anesthesia when compared to awake resting conditions.

      We fully acknowledge that anesthesia is a major confounding factor in our study. Given the unusually invasive nature of our surgical preparation, we prioritized deep anesthesia to ensure the animals’ welfare. This, along with potential cooling effects from tissue removal and GRIN lens contact, likely contributed to the observed suppression of IO activity.

      We recognize that reported complex spike rates under anesthesia vary considerably across studies, and we will expand our discussion to provide a more comprehensive comparison with prior literature. Notably, different anesthetic protocols, levels of anesthesia, and recording methodologies can lead to widely different estimates of firing rates. While we cannot resolve this issue without recordings in awake animals, we will clarify that our observed rates likely reflect both the effects of anesthesia and specific methodological constraints. We will also incorporate additional references to studies examining cerebellar activity under different anesthetic conditions.

      More likely, this discrepancy reflects spikes that are missed due to a combination of the indicator kinetics and low imaging sensitivity (see (2)), neither of which are presented as possible plausible alternative explanations.

      We acknowledge that the combination of slow indicator kinetics and limited optical power in our miniature microscope setup constrains the temporal resolution of our recordings. However, we are confident that we can reliably detect events occurring at intervals of 1 second or longer. This confidence is based on data from another preparation using the same viral vector and optical system, where we observed spike rates an order of magnitude higher.

      That said, we do not make claims regarding the presence or absence of somatic events occurring at very short intervals (e.g., 100-ms "doublets," as described by Titley et al., 2019), as these would likely fall below our temporal resolution. We will clarify this limitation in the revised manuscript to ensure that the constraints of our approach are fully acknowledged.

      While GCaMP6s is not as sensitive as more recent variants (Zhang et al., 2023, PMID 36922596), our previous work (Dorgans et al., 2022) demonstrated that its dynamic range and sensitivity are sufficient to detect both spikes and subthreshold activity in vitro. Although the experimental conditions differ in the current miniscope experiments, we took measures to optimize signal quality, including excluding recordings with a low signal-to-noise ratio (see Methods). This need for high signal fidelity also informed our decision to limit the sampling rate to 20 fps. In future work, we plan to adopt newer GCaMP variants that were not available at the start of this project, which should further improve sensitivity and temporal resolution.

      Many claims are made throughout about co-activation ("clustering"), but with the GCaMP6s rise time to peak (0.5 s), there is little technical possibility to resolve co-activation. This limitation is not acknowledged as a caveat and the implications for the claims are not engaged with in the text.

      As noted in the manuscript (L492-), "interpreting fluorescence signals relative to underlying voltage changes is challenging, particularly in IO neurons with unusual calcium dynamics." We acknowledge that the slow rise time of GCaMP6s ( 0.5 s) limits our ability to precisely resolve the timing of co-activation at very short intervals. However, given the relatively slow timescales of IO event clustering and the inherent synchrony in olivary network dynamics, we believe that the observed co-activation patterns remain meaningful, even if finer temporal details cannot be fully resolved.

      To ensure clarity, we will expand this section to explicitly acknowledge the temporal resolution limitations of our approach and discuss their implications for interpreting co-activation. While the precise timing of individual spikes within a cluster may not be resolvable, the observed increase in event magnitude with coarse co-activation suggests that clustering effects remain functionally relevant even when exact spike synchrony is not detectable at millisecond resolution.

      This finding is consistent with the idea that co-activation enhances calcium influx, leading to larger amplitude events — a relationship that does not require perfect temporal resolution to be observed. The fact that this effect persists across a broad range of clustering windows (as shown in Figure 2 Supplement 2) further supports its robustness. While we cannot make strong claims about precise spike timing within these clusters nor about the mechanism underlying enhanced calcium signal, our results demonstrate that co-activation may influence IO activity in a quantifiable way. We will clarify these points in the revised manuscript to ensure that our findings are appropriately framed given the temporal constraints of our imaging approach.

      The study reports an ultralong "refractory period" (L422-etc) in the IO, but this again must be tempered by the possibility that spikes are simply being missed due to very slow indicator kinetics and limited sensitivity. Indeed, the headline numeric estimate of 1.5 s (L445) is suspiciously close to the underlying indicator kinetic limitation of 1-2 s.

      Our findings suggest a potential refractory period limiting the frequency of events in the inferior olive under our recording conditions. This interpretation is supported by the observed inter-event interval distribution, the inability of N-O stimulation to suppress airpuff-evoked events, and lower bounds reported in earlier literature on complex spike intervals recorded in awake animals under various behavioral contexts. Taking into account the likely cooling of tissue, a refractory period of 1.5s is not unreasonable. Of course, we recognize that the slow decay kinetics of GCaMP6s may cause overlapping fluorescence signals, potentially obscuring closely spaced events. This is in line with data presented in the Chen et al 2013 manuscript describing GCaMp6s (PMID: 36922596; Figure 3b showing events detected with intervals less than 500 ms).

      The consideration of refractoriness only arose late in the project while we were investigating the explanations for lack of inhibition of airpuff-evoked spikes. Future experiments, particularly in awake animals, will be instrumental in validating this interpretation. To ensure that the refractory period is understood as one possible mechanism rather than a definitive explanation, we will rephrase the discussion to clarify that while our data are compatible with a refractory period, they do not establish it conclusively.

      The study uses endoscopic one-photon miniaturized microscope imaging. Realistically, this is expected to permit an axial point spread function (z-PSF) on the order of 40um, which must substantially reduce resolution and sensitivity. This means that if there *is* local coactivation, the data in this study will very likely have individual ROIs that integrate signals from multiple neighboring cells. The study reports relationships between event magnitude and clustering, etc; but a fluorescence signal that contains photons contributed by multiple neighboring neurons will be larger than a single neuron, regardless of the underlying physiology - the text does not acknowledge this possibility or limitation.

      We acknowledge that the use of one-photon endoscopic imaging imposes limitations on axial resolution, potentially leading to signal contributions from neighboring neurons. To mitigate this, we applied CNMFe processing, which allows for the deconvolution of overlapping signals and the differentiation of multiple neuronal sources within shared pixels. However, as the reviewer points out, if two neurons are perfectly overlapping in space, they may be treated as a single unit.

      To clarify this limitation, we will expand the discussion to explicitly acknowledge the impact of one-photon imaging on signal separation and to emphasize that, while CNMFe helps resolve some overlaps, perfect separation is not always possible. As already noted in the manuscript (L495-), "the absence of optical sectioning in the whole-field imaging method can lead to confounding artifacts in densely labeled structures such as the IO’s tortuous neuropil." We will further elaborate on how this factor was considered in our analysis and interpretation.

      Second, the text makes several claims for the first multicellular in vivo olivary recordings. (L11; L324, etc).

      I am aware of at least two studies that have recorded populations of single olivary axons using two-photon Ca2+ imaging up to 6 years ago (10.1016/j.neuron.2019.03.010; 10.7554/eLife.61593). This technique is not acknowledged or discussed, and one of these studies is not cited. No argument is presented for why axonal imaging should not "count" as multicellular in vivo olivary recording: axonal Ca2+ reflects somatic spiking.

      We appreciate the reviewer’s point and acknowledge the important prior work using two-photon imaging to record olivary axonal activity in the cerebellar cortex. However, while axonal calcium signals do reflect somatic spiking, these recordings inherently lack information about the local network interactions within the inferior olive itself.

      A key motivation for our study was to observe neuronal activity within the IO at the level of its gap-junctioncoupled local circuits, rather than at the level of its divergent axonal outputs. The fan-like spread of climbing fibers across rostrocaudal microzones in the cerebellar cortex makes them relatively easy to record in vivo, but it also means that individual imaging fields contain axons from neurons that may be distributed across different IO microdomains. As a result, while previous work has provided valuable insight into olivary output patterns, it has not allowed for the examination of coordinated somatic activity within localized IO neuron clusters.

      With apologies, we recognize that this distinction was not sufficiently emphasized in our introduction. We will clarify this key point and ensure that the important climbing fiber imaging studies are properly cited and contextualized in the revised manuscript.

      Reviewer #2 (Recommendations for the authors):

      The authors state: "we found no reports that examined coactivation levels between Z+ and Z- microzones in cerebellar complex spike recordings" (L359). Multiple papers (that are not cited) using AldolaceC-tdTomato mice with two photon Purkinje dendritic calcium imaging showed synchronization (at similar levels) within but not across z+/z- bands. (2015 10.1523/JNEUROSCI.2170-14.2015, 2023 https://doi.org/10.7554/eLife.86340).

      We apologize for the misleading phrasing. We will rephrase this statement to: "While complex spike coactivation within individual zebrin zones has been extensively studied (references), we found no reports directly comparing the levels of intra-zone co-activation between Z+ and Z microzones."

      Additionally, we will ensure that the relevant studies demonstrating synchronization within zebrin zones, as well as (lack of) interactions between neighboring zones, are properly cited and discussed in the revised manuscript.

      The figures could use more proofreading, and several decisions should be reconsidered:

      Normalizing the amplitude to maximum is not a good strategy, as it can overemphasize noise or extremely small-magnitude signals, and should instead follow standard convention and present in fixed units (3A2, 4B2, and even 2C).

      As noted earlier, we have excluded recordings and cells with high noise or a low signal-to-noise ratio for event amplitudes, ensuring that such data do not influence the color-coded panels. Importantly, all quantitative analyses and traces presented in the manuscript are normalized to baseline noise level, not to maximal amplitude, ensuring that noise or low-magnitude signals do not skew the analysis.

      The decision to use max-amplitude normalization in color-coded panels was made specifically to aid visualization of temporal structure across recordings. This approach allows for clearer comparisons without the distraction of inter-cell variability in absolute signal strength. However, we recognize the potential for confusion and will revise the Results text to explicitly clarify that the color-coded visualizations use a different scaling method than the quantitative analyses.

      x axes with no units: Figures 2B2, 2E1, 3B2, 3C2, 5B2, 5C2, 5D2.

      No colorbar units: 5A3 (and should be shown in real not normalized units).

      No y axis units: 5D1.

      No x axis label or units: 5E1.

      5E3 says "stim/baseline" for the y-axis units and then the first-panel title says "absolute frequencies" meaning it’s *not* normalized and needs a separate (accurate) y-axis with units.

      Illegibly tiny fonts: 2E1, 3E1, etc.

      We will correct all these in the revised manuscript. Thank you for careful reading.

    1. Author response:

      Public Reviews:

      Reviewer #1 (Public review):

      This study provides a thorough analysis of Nup107's role in Drosophila metamorphosis, demonstrating that its depletion leads to developmental arrest at the third larval instar stage due to disruptions in ecdysone biosynthesis and EcR signaling. Importantly, the authors establish a novel connection between Nup107 and Torso receptor expression, linking it to the hormonal cascade regulating pupariation.

      However, some contradictory results weaken the conclusions of the study. The authors claim that Nup107 is involved in the translocation of EcR from the cytoplasm to the nucleus. However, the evidence provided in the paper suggests it more likely regulates EcR expression positively, as EcR is undetectable in Nup107-depleted animals, even below background levels.

      We appreciate the concern raised in this public review. However, we must clarify that we do not claim that Nup107 regulates the translocation of EcR from the cytoplasm. It is important to note that we posited this hypothesis if Nup107 will regulate EcR nuclear translocation (9<sup>th</sup> line of 2<sup>nd</sup> paragraph on page 6). We have spelled this out more clearly as the 3<sup>rd</sup> sub-section title of the Results section, and in the discussion (8<sup>th</sup> line of 2<sup>nd</sup> paragraph on page 11). Overall, we have expressed surprise that Nup107 is not directly involved in the nuclear translocation of EcR.

      Ecdysone hormone acts through the EcR to induce the transcription of EcR also and creates a positive autoregulatory loop that enhances the EcR level through ecdysone signaling (1). Since Nup107 depletion leads to a reduction in ecdysone levels, it disrupts the transcription autoregulatory EcR expression loop. This can contribute to the reduced EcR levels seen in Nup107-depleted animals.

      Additionally, the link between Nup107 and Torso is not fully substantiated. While overexpression of Torso appears to rescue the lack of 20E production in the prothoracic gland, the distinct phenotypes of Torso and Nup107 depletion-developmental delay in the former versus complete larval arrest in the latter complicate understanding of Nup107's precise role.

      We understand that there are differences in the developmental delay when Tosro and Nup107 depletion is analyzed. However, the two molecules being compared here are very different, and the extent of Torso depletion is not evident in other studies (2). Even if the extent of depletion of Torso and Nup107 is similar, we believe that Nup107, being a more widely expressed protein, induces stronger defects owing to its importance in cellular physiology. We think that RNAi-mediated depletion of Nup107 causes a defect in 20E biosynthesis through the Halloween genes, inducing a developmental arrest.

      To clarify these discrepancies, further investigation into whether Nup107 interacts with other critical signaling pathways related to the regulation of ecdysone biosynthesis, such as EGFR or TGF-β, would be beneficial and could strengthen the findings.

      In summary, although the study presents some intriguing observations, several conclusions are not well-supported by the experimental data.

      We agree with the reviewer’s suggestion. As noted in the literature, five RTKs-torso, InR, EGFR, Alk, and Pvr-stimulate the PI3K/Akt pathway, which plays a crucial role in the PG functioning and controlling pupariation and body size (3). We have checked the torso and EGFR signaling. We rescued Nup107 defects with the torso overexpression, however, constitutively active EGFR (BL-59843) did not rescue the phenotype (data was not shown). Nonetheless, we plan to examine the EGFR pathway activation by measuring the pERK levels in Nup107-depleted PGs.

      Reviewer #2 (Public review):

      Summary:

      The manuscript by Kawadkar et al investigates the role of Nup107 in developmental progression via the regulation of ecdysone signaling. The authors identify an interesting phenotype of Nup107 whole-body RNAi depletion in Drosophila development - developmental arrest at the late larval stage. Nup107-depleted larvae exhibit mis-localization of the Ecdysone receptor (EcR) from the nucleus to the cytoplasm and reduced expression of EcR target genes in salivary glands, indicative of compromised ecdysone signaling. This mis-localization of EcR in salivary glands was phenocopied when Nup107 was depleted only in the prothoracic gland (PG), suggesting that it is not nuclear transport of EcR but the presence of ecdysone (normally secreted from PG) that is affected. Consistently, whole-body levels of ecdysone were shown to be reduced in Nup107 KD, particularly at the late third instar stage when a spike in ecdysone normally occurs. Importantly, the authors could rescue the developmental arrest and EcR mislocalization phenotypes of Nup107 KD by adding exogenous ecdysone, supporting the notion that Nup107 depletion disrupts biosynthesis of ecdysone, which arrests normal development. Additionally, they found that rescue of the Nup107 KD phenotype can also be achieved by over-expression of the receptor tyrosine kinase torso, which is thought to be the upstream regulator of ecdysone synthesis in the PG. Transcript levels of the torso are also shown to be downregulated in the Nup107KD, as are transcript levels of multiple ecdysone biosynthesis genes. Together, these experiments reveal a new role of Nup107 or nuclear pore levels in hormone-driven developmental progression, likely via regulation of levels of torso and torso-stimulated ecdysone biosynthesis.

      Strengths:

      The developmental phenotypes of an NPC component presented in the manuscript are striking and novel, and the data appears to be of high quality. The rescue experiments are particularly significant, providing strong evidence that Nup107 functions upstream of torso and ecdysone levels in the regulation of developmental timing and progression.

      Weaknesses:

      The underlying mechanism is however not clear, and any insight into how Nup107 may regulate these pathways would greatly strengthen the manuscript. Some suggestions to address this are detailed below.

      Major questions:

      (1) Determining how specific this phenotype is to Nup107 vs. to reduced NPC levels overall would give some mechanistic insight. Does knocking down other components of the Nup107 subcomplex (the Y-complex) lead to similar phenotypes? Given the published gene regulatory function of Nup107, do other gene regulatory Nups such as Nup98 or Nup153 produce these phenotypes?

      We thank this public review to raise this concern. Working with a Nup-complex like the Nup107 complex, this concern is anticipated but difficult to address as many Nups function beyond their complex identity. Our observations with all other members of the Nup107-complex, including dELYS, suggest that except Nup107, none of the other Nup107-complex members could induce larval developmental arrest.

      In this study, we primarily focused on the Nup107 complex (outer ring complex) of the NPC. We have not examined other nucleoporins outside of this complex, such as Nup98 and Nup153. However, previous studies have reported that Nup98 and Nup153 interact with chromatin, with these investigations conducted in Drosophila S2 cells (4, 5, 6). In the future, we may check whether Nup98 and Nup153 depletion can produce the arrest phenotype.

      (2) In a related issue, does this level of Nup107 KD produce lower NPC levels? It is expected to, but actual quantification of nuclear pores in Nup107-depleted tissues should be added. These and the above experiments would help address a key mechanistic question - is this phenotype the result of lower numbers of nuclear pores or specifically of Nup107?

      We agree with the concern raised here, and we plan to assess nucleoporin intensity using mAb414 antibody (exclusively FG-repeat Nup recognizing antibody) in the Nup107 depletion background. Our past observations suggest that Nup107-depletion does not affect the overall nuclear pore complex assembly in Drosophila salivary glands (Data is not shown).

      (3) Additional experiments on how Nup107 regulates the torso would provide further insight. Does Nup107 regulate transcription of the torso or perhaps its mRNA export? Looking at nascent levels of the torso transcript and the localization of its mRNA can help answer this question. Or alternatively, does Nup107 physically bind the torso?

      While the concern regarding torso transcript level is genuine, we have already reported in the manuscript that Nup107 levels directly regulate torso expression. When Nup107 is depleted torso levels go down, which in turn controls ecdysone production and subsequent EcR signaling (Figure 6B of the manuscript). However, the exact nature of Nup107 regulation on torso expression is still unclear. Since the Nup107 is known to interact with chromatin (7), it may affect torso transcription. The possibility of a physiologically relevant interaction between Nup107 and the torso in a cellular context is unlikely due to their distinct sub-cellular localizations. If we investigate this further, it will require a significant amount of time for having reagents and experimentation, and currently stands beyond the scope of this manuscript.

      (4) The depletion level of Nup107 RNAi specifically in the salivary gland vs. the prothoracic gland should be compared by RT-qPCR or western blotting.

      Although we know that the Nup107 protein signal is reduced in SG upon knockdown (Figure 3B), we have not compared the Nup107 transcript level in these two tissues (SG and PG). As suggested here, we will knock down Nup107 using SG and PG-specific drivers and quantify the Nup107 depletion level by RT-qPCR.

      (5) The UAS-torso rescue experiment should also include the control of an additional UAS construct - so Nup107; UAS-control vs Nup107; UAS-torso should be compared in the context of rescue to make sure the Gal4 driver is functioning at similar levels in the rescue experiment.

      This is a very valid point, and we took this into account while planning the experiment. To maintain the GAL4 function, we used the Nup107<sup>KK</sup>;UAS-GFP as control alongside the Nup107<sup>KK</sup>;UAS-torso. This approach ensures that GAL4 dilution does not affect observations made in the experiments. It can be noticed in Figure S7 that the presence of GFP signal in prothoracic glands and their reduced size indicates genes downstream to both UAS sequences are transcribed, and GAL4 dilution does not play a role here.

      Minor:

      (6) Figures and figure legends can stand to be more explicit and detailed, respectively.

      We will revisit all figures and their corresponding legends to ensure appropriate and explicit details are provided.

      Reviewer #3 (Public review):

      Summary:

      In this study by Kawadkar et al, the authors investigate the developmental role of Nup107, a nucleoporin, in regulating the larval-to-pupal transition in Drosophila through RNAi knockdown and CRISPR-Cas9-mediated gene editing. They demonstrate that Nup107, an essential component of the nuclear pore complex (NPC), is crucial for regulating ecdysone signaling during developmental transitions. The authors show that the depletion of Nup107 disrupts these processes, offering valuable insights into its role in development.

      Specifically, they find that:

      (1) Nup107 depletion impairs pupariation during the larval-to-pupal transition.

      (2) RNAi knockdown of Nup107 results in defects in EcR nuclear translocation, a key regulator of ecdysone signaling.

      (3) Exogenous 20-hydroxyecdysone (20E) rescues pupariation blocks, but rescued pupae fail to close.

      (4) Nup107 RNAi-induced defects can be rescued by activation of the MAP kinase pathway.

      Strengths:

      The manuscript provides strong evidence that Nup107, a component of the nuclear pore complex (NPC), plays a crucial role in regulating the larval-to-pupal transition in Drosophila, particularly in ecdysone signaling.

      The authors employ a combination of RNAi knockdown, CRISPR-Cas9 gene editing, and rescue experiments, offering a comprehensive approach to studying Nup107's developmental function.

      The study effectively connects Nup107 to ecdysone signaling, a key regulator of developmental transitions, offering novel insights into the molecular mechanisms controlling metamorphosis.

      The use of exogenous 20-hydroxyecdysone (20E) and activation of the MAP kinase pathway provides a strong mechanistic perspective, suggesting that Nup107 may influence EcR signaling and ecdysone biosynthesis.

      Weaknesses:

      The authors do not sufficiently address the potential off-target effects of RNAi, which could impact the validity of their findings. Alternative approaches, such as heterozygous or clonal studies, could help confirm the specificity of the observed phenotypes.

      This is a very valid point raised, and we are aware of the consequences of the off-target effects of RNAi. To assert the effects of authentic RNAi and reduce the off-target effects, we have used two RNAi lines (Nup107<sup>GD</sup> and Nup107<sup>KK</sup>) against Nup107. Both RNAi induced comparable levels of Nup107 reduction, and using these lines, ubiquitous and PG specific knockdown produced similar phenotypes. Although the Nup107<sup>GD</sup> line exhibited a relatively stronger knockdown compared to the Nup107<sup>KK</sup> line, we preferentially used the Nup107<sup>KK</sup> line because the Nup107<sup>GD</sup> line is based on the P-element insertion, and the exact landing site is unknown. Furthermore, there is an off-target predicted for the Nup107<sup>GD</sup> line, where a 19bp sequence aligns with the bifocal (bif) sequence. The bif-encoded protein is involved in axon guidance and regulation of axon extension. However, the Nup107<sup>KK</sup> line does not have a predicted off-target molecule, and we know its precise landing site on the second chromosome. Thus, the Nup107<sup>KK</sup> line was ultimately used in experimentation for its clearer and more reliable genetic background.

      We are also investigating Nup107 knockdown in the prothoracic gland, which exhibits polyteny. Additionally, the number of cells in the prothoracic gland is quite limited, approximately 50-60 cells (8). Given this, there is a possibility that a clonal study may not yield the phenotype. However, we will consider moving forward with this approach also.

      NPC Complex Specificity: While the authors focus on Nup107, it remains unclear whether the observed defects are specific to this nucleoporin or if other NPC components also contribute to similar defects. Demonstrating similar results with other NPC components would strengthen their claims.

      We thank this public review to raise this concern. Working with a Nup-complex like the Nup107 complex, this concern is anticipated but difficult to address as many Nups function beyond their complex identity. Our observations with all other members of the Nup107-complex, including dELYS, suggest that except Nup107, none of the other Nup107-complex members could induce larval developmental arrest. Since the study is primarily focused on the Nup107 complex (outer ring complex) of the NPC, we have not examined other nucleoporins outside of this complex.

      Although the authors show that Nup107 depletion disrupts EcR signaling, the precise molecular mechanism by which Nup107 influences this process is not fully explored. Further investigation into how Nup107 regulates EcR nuclear translocation or ecdysone biosynthesis would improve the clarity of the findings.

      We appreciate the concern raised. Through our observation, we have proposed the upstream effect of Nup107 on the PTTH-torso-20E-EcR axis regulating developmental transitions. We know that Nup107 regulates torso levels, but we do not know if Nup107 directly interacts with torso. We would like to address whether Nup107 exerts control on PTTH levels also.

      We must emphasize that Nup107 does not directly regulate the translocation of EcR. On the contrary, we have demonstrated that EcR translocation is 20E dependent and Nup107 independent. Through our observations, we have argued that Nup107 regulates the expression of Halloween genes required for ecdysone biosynthesis. We are interested in identifying if Nup107 associates directly or through some protein to chromatin to bring about the changes in gene expression required for normal development.

      There are some typographical errors and overly strong phrases, such as "unequivocally demonstrate," which could be softened. Additionally, the presentation of redundant data in different tissues could be streamlined to enhance clarity and flow.

      We thank the reviewer for this observation. We will remove all typographical errors and make reasonable statements based on our conclusions.

      References:

      (1) Varghese, Jishy, and Stephen M Cohen. “microRNA miR-14 acts to modulate a positive autoregulatory loop controlling steroid hormone signaling in Drosophila.” Genes & development vol. 21,18 (2007): 2277-82. doi:10.1101/gad.439807

      (2) Rewitz, Kim F et al. “The insect neuropeptide PTTH activates receptor tyrosine kinase torso to initiate metamorphosis.” Science (New York, N.Y.) vol. 326,5958 (2009): 1403-5. doi:10.1126/science.1176450

      (3) Pan, Xueyang, and Michael B O'Connor. “Coordination among multiple receptor tyrosine kinase signals controls Drosophila developmental timing and body size.” Cell reports vol. 36,9 (2021): 109644. doi:10.1016/j.celrep.2021.109644

      (4) Pascual-Garcia, Pau et al. “Metazoan Nuclear Pores Provide a Scaffold for Poised Genes and Mediate Induced Enhancer-Promoter Contacts.” Molecular cell vol. 66,1 (2017): 63-76.e6. doi:10.1016/j.molcel.2017.02.020

      (5) Pascual-Garcia, Pau et al. “Nup98-dependent transcriptional memory is established independently of transcription.” eLife vol. 11 e63404. 15 Mar. 2022, doi:10.7554/eLife.63404

      (6) Kadota, Shinichi et al. “Nucleoporin 153 links nuclear pore complex to chromatin architecture by mediating CTCF and cohesin binding.” Nature communications vol. 11,1 2606. 25 May. 2020, doi:10.1038/s41467-020-16394-3

      (7) Gozalo, Alejandro et al. “Core Components of the Nuclear Pore Bind Distinct States of Chromatin and Contribute to Polycomb Repression.” Molecular cell vol. 77,1 (2020): 67-81.e7. doi:10.1016/j.molcel.2019.10.017

      (8) Shimell, MaryJane, and Michael B O'Connor. “Endoreplication in the Drosophila melanogaster prothoracic gland is dispensable for the critical weight checkpoint.” microPublication biology vol. 2023 10.17912/micropub.biology.000741. 21 Feb. 2023, doi:10.17912/micropub.biology.000741

    1. Author response:

      Reviewer #1:

      Summary:

      In this study, the authors propose a "unifying method to evaluate inter-areal interactions in different types of neuronal recordings, timescales, and species". The method consists of computing the variance explained by a linear decoder that attempts to predict individual neural responses (firing rates) in one area based on neural responses in another area.

      The authors apply the method to previously published calcium imaging data from layer 4 and layers 2/3 of 4 mice over 7 days, and simultaneously recorded Utah array spiking data from areas V1 and V4 of 1 monkey over 5 days of recording. They report distributions over "variance explained" numbers for several combinations: from mouse V1 L4 to mouse V1 L2/3, from L2/3 to L4, from monkey V1 to monkey V4, and from V4 to V1. For their monkey data, they also report the corresponding results for different temporal shifts. Overall, they find the expected results: responses in each of the two neural populations are predictive of responses in the other, more so when the stimulus is not controlled than when it is, and with sometimes different results for different stimulus classes (e.g., gratings vs. natural images).

      Strengths:

      (1) Use of existing data.

      (2) Addresses an interesting question.

      Unfortunately, the method falls short of the state of the art: both generalized linear models (GLMs), which have been used in similar contexts for at least 20 years (see the many papers, both theoretical and applied to neural population data, by e.g. Simoncelli, Paninsky, Pillow, Schwartz, and many colleagues dating back to 2004), and the extension of Granger causality to point processes (e.g. Kim et al. PLoS CB 2011). Both approaches are substantially superior to what is proposed in the manuscript, since they enforce non-negativity for spike rates (the importance of which can be seen in Figure 2AB), and do not require unnecessary coarse-graining of the data by binning spikes (the 200 ms time bins are very long compared to the time scale on which communication between closely connected neuronal populations within an area, or between related areas, takes place).

      We thank the reviewer for this suggestion. Our goal was to use a simple and unified linear ridge regression framework that can be applied to both calcium imaging (mouse) and MUAe (monkey) data.

      We will perform a GLM-based analysis enforcing non-negativity as suggested, including in the GLM any additional available variables that may contribute to the neuronal responses.

      We also would like to note that:

      ● Macaque data: Our MUAe data are binned at 25 ms, not 200 ms. We used the envelope

      of multi-unit activity as reported in the original study [1]. We did not perform spike sorting on these data and therefore, strictly speaking, this is not a point process and methods developed for point processes are not directly applicable.

      ● Mouse data: The Stringer et al. dataset [2,3] uses two-photon calcium imaging sampled at 2.5 or 3 Hz. Additionally, responses were computed by averaging two frames per stimulus (yielding an effective bin size of 666 ms or 800 ms), dictated by acquisition constraints. We will emphasize the low temporal resolution of these signals as a limitation in the discussion section, but we cannot improve the temporal resolution with our analyses. These signals are not point processes either (although there is a correlation between two-photon calcium signals and spike rates).

      Regardless of these considerations, the reviewer’s points are well taken, and we will conduct additional analyses as described above.

      In terms of analysis results, the work in the manuscript presents some expected and some less expected results. However, because the monkey data are based on only one monkey (misleadingly, the manuscript consistently uses the plural ‘monkeys’), none of the results specific to that monkey, nor the comparison of that one monkey to mice, are supported by robust data.

      We will add data from at least two more monkeys, as suggested by the reviewer:

      ● First, we will include a second monkey from the same dataset [1]. The reason this monkey was not included in the original submission is that the dataset for this second monkey consisted of much less data than the original. For example, for the lights-off condition, the number of V4 channels with signal-to-noise ratio greater than 2 (recommended electrodes to use by dataset authors) is 9-12 in this second monkey, compared to 68-74 in the first monkey [1]. However, we will still add results for this second monkey.

      ● Additionally, we will include data from a new monkey by collaborating with the Ponce lab who will collect new data for this study.

      One of the main results for mice (bimodality of explained variance values, mentioned in the abstract) does not appear to be quantified or supported by a statistical test.

      We appreciate this point. We will conduct statistical tests to quantify the degree of bimodality and clarify these findings in the results.

      Moreover, the two data sets differ in too many aspects to allow for any conclusions about whether the comparisons reflect differences in species (mouse vs. monkey), anatomy (L2/3-L4 vs. V1-V4), or recording technique (calcium imaging vs. extracellular spiking).

      We agree that the methodological and anatomical differences between the mouse and monkey datasets make any direct cross-species comparisons hard to interpret. We explicitly discuss this point in the Discussion section. We will add a section within the Discussion entitled “Limitations of this study”. We will further emphasize that our goal is not to attempt a direct quantitative comparison across species. We will further emphasize that the two experiments differ in terms of: (i) differences in recording modalities (calcium vs. electrophysiology) and associated differences in temporal resolution, neuronal types, and SNR, (ii) cortical targets (layers vs. areas), (iii) sample size, (iv) stimuli, (v) task conditions. In the revised manuscript, we will further highlight that our primary aim is to investigate inter-areal interactions within each species rather than to draw comparisons across species.

      Reviewer #2:

      Summary:

      In this work, the authors investigated the extent of shared variability in cortical population activity in the visual cortex in mice and macaques under conditions of spontaneous activity and visual stimulation. They argue that by studying the average response to repeated presentations of sensory stimuli, investigators are discounting the contribution of variable population responses that can have a significant impact at the single trial level. They hypothesized that, because these fluctuations are to some degree shared across cortical populations depending on the sources of these fluctuations and the relative connectivity between cortical populations within a network, one should be able to predict the response in one cortical population given the response of another cortical population on a single trial, and the degree of predictability should vary with factors such as retinotopic overlap, visual stimulation, and the directionality of canonical cortical circuits.

      To test this, the authors analyzed previously collected and publicly available datasets. These include calcium imaging of the primary visual cortex in mice and electrophysiology recordings in V1 and V4 of macaques under different conditions of visual stimulation. The strength of this data is that it includes simultaneous recordings of hundreds of neurons across cortical layers or areas. However, the weaknesses of calcium dynamics (which has lower temporal resolution and misses some non-linear dynamics in cortical activity) and multi-unit envelope activity (which reflects fluctuations in population activity rather than the variance in individual unit spike trains), underestimate the variability of individual neurons. The authors deploy a regression model that is appropriate for addressing their hypothesis, and their analytic approach appears rigorous and well-controlled.

      We agree that both calcium imaging and multi-unit envelope recordings have inherent limitations in capturing the variability of individual neuron spiking. Among other factors, the slower temporal resolution of calcium signals can blur fast spiking events, and multi-unit envelopes can mask single-unit heterogeneity. In the Discussion, we will explicitly mention these modality-specific caveats and note that our approach is meant to capture shared variability at the population level rather than the fine temporal structure of individual neurons and individual spikes.

      From their analysis, they found that there was significant predictability of activity between layer II/III and layer IV responses in mice and V1 and V4 activity in macaques, although the specific degree of predictability varied somewhat with the condition of the comparison with some minor differences between the datasets. The authors deployed a variety of analytic controls and explored a variety of comparisons that are both appropriate and convincing that there is a significant degree of predictability in population responses at the single trial level consistent with their hypothesis. This demonstrates that a significant fraction of cortical responses to stimuli is not due solely to the feedforward response to sensory input, and if we are to understand the computations that take place in the cortex, we must also understand how sensory responses interact with other sources of activity in cortical networks. However, the source of these predictive signals and their impact on function is only explored in a limited fashion, largely due to limitations in the datasets. Overall, this work highlights that, beyond the traditionally studied average evoked responses considered in systems neuroscience, there is a significant contribution of shared variability in cortical populations that may contextualize sensory representations depending on a host of factors that may be independent of the sensory signals being studied.

      We will include a section within the Discussion to emphasize the limitations in the datasets used in this study. We also agree and appreciate the reviewer’s description and will borrow some of the reviewer’s terminology to provide context in the Discussion section.

      The different recording modalities and comparisons (within vs. across cortical areas) limit the interpretability of the inter-species comparisons.

      We agree that the methodological and anatomical differences between the mouse and monkey datasets make any direct cross-species comparisons hard to interpret. We explicitly discuss this point in the Discussion section. We will add a section within the Discussion entitled “Limitations of this study”. We will further emphasize that our goal is not to attempt a direct quantitative comparison across species. We will further emphasize that the two experiments differ in terms of: (i) differences in recording modalities (calcium vs. electrophysiology) and associated differences in temporal resolution, neuronal types, and SNR, (ii) cortical targets (layers vs. areas), (iii) sample size, (iv) stimuli, (v) task conditions. In the revised manuscript, we will further highlight that our primary aim is to investigate inter-areal interactions within each species rather than to draw comparisons across species.

      Strengths:

      This work considers a variety of conditions that may influence the relative predictability between cortical populations, including receptive field overlap, latency that may reflect feed-forward or feedback delays, and stimulus type and sensory condition. Their analytic approach is well-designed and statistically rigorous. They acknowledge the limitations of the data and do not over-interpret their findings.

      Weaknesses:

      The different recording modalities and comparisons (within vs. across cortical areas) limit the interpretability of the inter-species comparisons.The mechanistic contribution of known sources or correlates of shared variability (eye movements, pupil fluctuations, locomotion, whisking behaviors) were not considered, and these could be driving or a reflection of much of the predictability observed and explain differences in spontaneous and visual activity predictions.

      We also appreciate this important point. We agree that multiple behavioral factors may significantly contribute to shared variability. In our analyses of the mouse data, we addressed non-visual influences by projecting out “non-visual ongoing neuronal activity” (as shown in Figure 6C, following the approach in Stringer et al. 2019). Additionally, we will further evaluate the contribution of behavioral measures available in the open dataset—such as running speed, whisking, pupil area, and “eigenface” components– to predictivity of neuronal responses.

      For the macaque data, the head-fixed and eye-fixation conditions help minimize some of these other potential behavioral contributions. Moreover, we have performed comparisons of eyes-open versus eyes-closed conditions (see Figure 5D). We will also analyze pupil size specifically for the lights-off condition. We do not have access to any other behavioral data from monkeys.

      Previous work has explored correlations in activity between areas on various timescales, but this work only considered a narrow scope of timescales.

      We appreciate this suggestion. We will perform additional analyses to evaluate predictivity at different temporal scales, as suggested.

      The observation that there is some degree of predictability is not surprising, and it is unclear whether changes in observed predictability with analysis conditions are informative of a particular mechanism or just due to differences in the variance of activity under those conditions. Some of these issues could be addressed with further analysis, but some may be due to limitations in the experimental scope of the datasets and would require new experiments to resolve.

      Our initial analyses in Fig.6A examined the effect of variance in activity and predictability in mice. As the reviewer intuited, there is a correlation between variance and predictability, at least when presenting a stimulus. Importantly, however, this is not the case when predicting activity in the absence of any stimulus. In the macaque, we cannot compute the variance across stimuli in the checkerboard case (single stimulus), but we will compute it for the conditions of the 4 moving bars. In addition, inspired by the reviewer’s question, we will perform an analysis where we further normalize the variance in activity.

      We would like to note that our key contribution is not to merely show that some degree of predictability is possible (which we agree is not surprising) but rather: (i) to use a simple approach to quantify this predictability, (ii) to assess directional differences in predictability, (iii) to evaluate how this predictability depends on neuronal properties and receptive field overlap, (iv) how it depends on the stimuli, and, importantly, (v) to compare predictability during visual stimulation versus absence of visual input.

      We agree with the limitations in the datasets. We will include a section within the Discussion to emphasize these limitations.

      Reviewer #3:

      Neural activity in the visual cortex has primarily been studied in terms of responses to external visual stimuli. While the noisiness of inputs to a visual area is known to also influence visual responses, the contribution of this noisy component to overall visual responses has not been well characterized.

      In this study, the authors reanalyze two previously published datasets - a Ca++ imaging study from mouse V1 and a large-scale electrophysiological study from monkey V1-V4. Using regression models, they examine how neural activity in one layer (in mice) or one cortical area (in monkeys) predicts activity in another layer or area. Their main finding is that significant predictions are possible even in the absence of visual input, highlighting the influence of non-stimulus-related downstream activity on neural responses. These findings can inform future modeling work of neural responses in the visual cortex to account for such non-visual influences.

      A major weakness of the study is that the analysis includes data from only a single monkey. This makes it hard to interpret the data as the results could be due to experimental conditions specific to this monkey, such as the relative placement of electrode arrays in V1 and V4.

      We will add data from at least two more monkeys, as suggested by the reviewer:

      ● First, we will include a second monkey from the same dataset [1]. The reason this monkey was not included in the original submission is that the dataset for this second monkey consisted of much less data than the original. For example, for the lights-off condition, the number of V4 channels with signal-to-noise ratio greater than 2 (recommended electrodes to use by dataset authors) is 9-12 in this second monkey, compared to 68-74 in the first monkey [1]. However, we will still add results for this second monkey.

      ● Additionally, we will include data from a new monkey by collaborating with the Ponce lab who will collect new data for this study.

      The authors perform a thorough analysis comparing regression-based predictions for a wide variety of combinations of stimulus conditions and directions of influence. However, the comparison of stimulus types (Figure 4) raises a potential concern. It is not clear if the differences reported reflect an actual change in predictive influence across the two conditions or if they stem from fundamental differences in the responses of the predictor population, which could in turn affect the ability to measure predictive relationships. The authors do control for some potential confounds such as the number of neurons and self-consistency of the predictor population. However, the predictability seems to closely track the responsiveness of neurons to a particular stimulus. For instance, in the monkey data, the V1 neuronal population will likely be more responsive to checkerboards than to single bars. Moreover, neurons that don't have the bars in their RFs may remain largely silent. Could the difference in predictability be just due to this? Controlling for overall neuronal responsiveness across the two conditions would make this comparison more interpretable.

      This is also a valid concern. As the reviewer noted, we controlled for the number of neurons and degree of self-consistency (Fig. 3A, 3C), and this was always done within their respective stimulus type.

      As the reviewer intuits, in Fig. 6A in mice, we show that predictability correlates with neuronal responsiveness. This observation only held during the stimulus condition and not during the gray screen condition. We also showed correlations with self-consistency metrics as a proxy for responsiveness in Fig. 6A and 6C. However, we will directly assess the impact of responsiveness in two ways: (i) by correlating predictability directly with neuronal responsiveness and (ii) by following the same subsampling approach in Fig. 3 to normalize the degree of responsiveness and recompute the predictability metrics.

      REFERENCES

      (1) Chen, X., Morales-Gregorio, A., Sprenger, J., Kleinjohann, A., Sridhar, S., van Albada, S.J., Grün, S., and Roelfsema, P.R. (2022). 1024-channel electrophysiological recordings in macaque V1 and V4 during resting state. Sci Data 9, 77. https://doi.org/10.1038/s41597-022-01180-1.

      (2) Stringer, C., Pachitariu, M., Steinmetz, N., Carandini, M., and Harris, K.D. (2019). High-dimensional geometry of population responses in visual cortex. Nature 571, 361–365. https://doi.org/10.1038/s41586-019-1346-5.

      (3) Stringer, C., Pachitariu, M., Carandini, M., and Harris, K. (2018). Recordings of 10,000 neurons in visual cortex in response to 2,800 natural images. (Janelia Research Campus). https://doi.org/10.25378/janelia.6845348.v4 https://doi.org/10.25378/janelia.6845348.v4.

    1. Author response:

      The following is the authors’ response to the original reviews.

      Although the reviewers found our work interesting, they raised several important concerns about our study. To address these concerns, mostly we performed new experiments. The most important changes are highlighted in the summary paragraphs.

      First, in response to Reviewer 1’s suggestions, we have conducted the SFN experiments systematically, e.g., we further confirmed the mechanism of SFN-activated TFEB in HeLa NPC1 cells with new experiments including: the effect of BAPTA-AM (a calcium chelator), FK506+CsA (calcineurin inhibitors) and NAC (ROS scavenger) on SFN-induced TFEB-nuclear translocation in HeLa NPC1 cells (New Fig. S3). The effect of SFN on NPC1 expression (New Fig. S5). Particularly, we examined the colocalization of DiO (a PM marker) staining and surface LAMP1 staining in HeLa NPC1 cells under SFN treatment to confirm the PM exocytosis. In main text and figure legends, accuracy of sentence is thoroughly checked and defined. Hence, we have significantly improved the presentation and clarity in the revision.

      Second, in response to Reviewer 2’s suggestions, we have performed additional experiments to demonstrate that the role of TFEB in SFN-evoked the lysosomal exocytosis by using TFEB-KO cells (New Fig. S7B). In TFEB KO cells, this increase of surface LAMP1 signal by SFN treatment was significantly reduced, suggestive of SFN-induced exocytosis in a TFEB-dependent manner. We also investigated the effect of U18666A on CF555-dextran endocytosis. By examining the localization of CF-dex and Lamp1, we found that CF555 is present in the lysosome with U18666A treatment (Fig for reviewers only A,B), suggesting that NPC1 deficiency/U18666A treatment has no effect on CF-dex endocytosis.

      Third, in response to Reviewer 3’s suggestions, we have performed experiments in addition to response to other reviewers’ suggestion ie. the cytotoxicity of the concentration of SFN used in this study in various cell lines (New Fig.S10).

      In addition, according to the reviewers’ suggestions, we made clarifications and corrections wherever appropriate in the manuscript.

      Reviewer #1 (Public review):

      Summary:

      The authors are trying to determine if SFN treatment results in dephosphorylation of TFEB, subsequent activation of autophagy-related genes, exocytosis of lysosomes, and reduction in lysosomal cholesterol levels in models of NPC disease.

      Strengths:

      (1) Clear evidence that SFN results in translocation of TFEB to the nucleus.

      (2) In vivo data demonstrating that SFN can rescue Purkinje neuron number and weight in NPC1<sup>-/-</sup> animals.

      Thank you for the support!

      Weaknesses:

      (1) Lack of molecular details regarding how SFN results in dephosphorylation of TFEB leading to activation of the aforementioned pathways. Currently, datasets represent correlations.

      Thank you for raising this critical point! The reviewer is right that in this manuscript we did not talk too much about the molecular mechanism of SFN-evoked TFEB activation. Because in our previous study (Li, Shao et al. 2021), we explored the mechanism of SFN-induced TFEB activation. We show that SFN-evoked TFEB activation via a ROS-Ca<sup>2+</sup>-calcineurin dependent but MTOR -independent pathway (Li, Shao et al. 2021). In the current manuscript, we cited this paper, but did not talk the details of the mechanism, which obviously confused the reviewers. Therefore, in the revision manuscript we added more details of the molecular mechanism of SFN-activated TFEB. Also, we further confirmed this mechanism in HeLa NPC1 cells with new experiments including: the effect of BAPTA-AM (a calcium chelator), FK506+CsA (calcineurin inhibitors) and NAC (ROS scavenger) on SFN-induced TFEB-nuclear translocation in NPC cells (New Fig.S3).

      (2) Based on the manuscript narrative, discussion, and data it is unclear exactly how steady-state cholesterol would change in models of NPC disease following SFN treatment. Yes, there is good evidence that lysosomal flux to (and presumably across) the plasma membrane increases with SFN. However, lysosomal biogenesis genes also seem to be increasing. Given that NPC inhibition, NPC1 knockout, or NPC1 disease mutations are constitutively present and the cell models of NPC disease contain lysosomes (even with SFN) how could a simple increase in lysosomal flux decrease cholesterol levels? It would seem important to quantify the number of lysosomes per cell in each condition to begin to disentangle differences in steady state number of lysosomes, number of new lysosomes, and number of lysosomes being exocytosed.

      Thank you for this constructive comment. From our data, in NPC1 cells SFN reduced the cholesterol levels by inducing lysosomal exocytosis and increasing lysosomal biogenesis. We understand the reviewer’s point that it would be really helpful to differentiate the exact three states of original number of lysosomes, number of new lysosomes, and number of lysosomes being exocytosis. Unfortunately, due to the technique limitation, so far seems there is no appropriate method that could clearly differentiate the lysosomes exactly come from which state. In the future, hopefully we will have technique to explore this mechanism.

      (3) Lack of evidence supporting the authors' premise that "SFN could be a good therapeutic candidate for neuropathology in NPC disease".

      Suggestion was taken! We removed this sentence. Thanks!

      Reviewer #2 (Public review):

      (4) The in vivo experiments demonstrate the therapeutic potential of SFN for NPC. A clear dose response analysis would further strengthen the proposed therapeutic mechanism of SFN.

      Thank you for this constructive suggestion. We examined the effect of two doses of SFN30 and 50mg/kg on NPC mice. As shown in Fig.6, SFN (50mg/kg), but not 30mg/kg prevents a degree of Purkinje cell loss in the lobule IV/V of cerebellum, suggesting a dose-correlated preventive effect of SFN. In the future study, we will continue optimizing the dosage form and amount of SFN and do a dose-responsive analysis.

      (5) Additional data supporting the activation of TFEB by SFN for cholesterol clearance in vivo would strengthen the overall impact of the study.

      Thank the reviewer for this constructive comment. We have detected a significant decrease of pS211-TFEB protein in brain tissues of NPC mice upon SFN treatment compared to vehicle, suggesting that SFN activates TFEB in brain tissue for the first time. It is worth to further examine the lysosomal cholesterol levels in brain tissues to show the direct effect of SFN. However, in our hands and in the literatures Filipin seems not suitable for detecting lysosomal cholesterol accumulation in brain tissue. So far there isn’t a good method to directly measure lysosomal cholesterol in tissue.

      (6) In Figure 4, the authors demonstrate increased lysosomal exocytosis and biogenesis by SFN in NPC cells. Including a TFEB-KO/KD in this assay would provide additional validation of whether these effects are TFEB-dependent.

      Great suggestion! We investigated the role of TFEB in SFN-evoked the lysosomal exocytosis by using TFEB-KO cells. As shown in New Suppl. Fig. 7B, in TFEB KO cells, this increase of surface LAMP1 signal by SFN (15 μM, 12 h) treatment was significantly reduced, suggestive of SFN induced exocytosis in a TFEB-dependent manner.

      (7) For lysosomal pH measurement, the combination of pHrodo-dex and CF-dex enables ratiometric pH measurement. However, the pKa of pHrodo red-dex (according to Invitrogen) is ~6.8, while lysosomal pH is typically around 4.7. This discrepancy may account for the lack of observed lysosomal pH changes between WT and U18666A-treated cells. Notably, previous studies (PMID: 28742019) have reported an increase in lysosomal pH in U18666A-treated cells.

      We understand the reviewer’s point. But as stated in the methods and main text, we used pHrodo™ Green-Dextran (P35368, Invitrogen), rather than pHrodo Red-dextran. According to the product information from Invitrogen, pHrodo Green-dex conjugates are non-fluorescent at neural pH, but fluorescence bright green at acidic pH around 4, such as those in endosomes and lysosomes. Therefore, pHrodo Green-dex is suitable to monitor the acidity of lysosome (Hu, Li et al. 2022). We also used LysoTracker Red DND-99 (Thermo Scien fic, L7528) to measure lysosomal pH (Fig. 4G, H), which is consistent with results from pHrodo Green/CF measurement.

      The reviewer mentioned that previous studies have reported an increase in lysosomal pH in U18666Atreated cells. We understood this concern. But in our hands, from our data with two lysosomal pH sensors, we have not detected lysosomal pH change in U18666A-treated NPC1 cell models.

      (7) The authors are also encouraged to perform colocalization studies between CF-dex and a lysosomal marker, as some researchers may be concerned that NPC1 deficiency could reduce or block the trafficking of dextran along endocytosis.

      Thank you for raising this important point and suggestion was taken! We investigated the effect of NPC1 deficiency on CF555-dextran trafficking into lysosome by examining the localization of CF-dex and Lamp1. To clearly define whether CF555-dex is present in the lysosome, we first used apilimod to enlarge lysosomes and then examined the relative posi on of CF555-dex and lamp1. As shown in Author response image 1A,B, in HeLa cells treated with U18666A, CF555 signals (red) clearly present inside lysosome (LAMP1 labelled lysosomal membrane, green signal), suggesting that CF555dex endocytosis is not affected by NPC1 deficiency (U18666A treatment).

      Author response image 1.

      The effect of NPC1 deficiency on CF555 endocytosis. HeLa cells were transiently transfected with LAMP1-GFP plasmid for 24 h. Cells were then treated with apilimod (100 nM) for 2 h to enlarge the lysosomes, and followed by co- treatment of U18666A (2.5 μM, 24 h) and CF555 (12 h). (A)Each panel shows fluorescence images taken by confocal microscopes. (B) Each panel shows the fluorescence intensity of a line scan (white line) through the double labeled object indicated by the white arrow. Scale bar, 20 μm or 2 μm (for zoom-in images).

      (9) In vivo data supporting the activation of TFEB by SFN for cholesterol clearance would significantly enhance the impact of the study. For example, measuring whole-animal or brain cholesterol levels would provide stronger evidence of SFN's therapeutic potential.

      We really appreciate the reviewer’s comments. Please see response to point #5.

      Reviewer #3 (Public review):

      (10) The manuscript is extremely hard to read due to the writing; it needs careful editing for grammar and English.

      Sorry for the defects in the writing and grammar. We had thoroughly checked grammar and polished the English to improve the manuscript.

      (11) There are a number of important technical issues that need to be addressed.

      We will address the technical issues mentioned in the following ques ons.

      (12) The TFEB influence on filipin staining in Figure 1A is somewhat subtle. In the mCherry alone panels there is a transfected cell with no filipin staining and the mCherry-TFEBS211A cells still show some filipin staining.

      Thank you for raising this point. The reviewer is right that not all the mCherry alone cells with the same level of filipin signal and not all mCherry-TFEBS211 transfected cells show completely no filipin signal. The statistical results were from randomly selected cells from 3 independent experiments. To avoid the confusion, we have included more cells in the statistical analysis to cover all the conditions as shown in the new Fig. 1B. Hopefully this helps to clarify the confusion.

      (13) Figure 1C is impressive for the upregulation of filipin with U18666A treatment. However, SFN is used at 15 microM. This must be hitting multiple pathways. Vauzour et al (PMID: 20166144) use SFN at 10 nM to 1microM. Other manuscripts use it in the low microM range. The authors should repeat at least some key experiments using SFN at a range of concentrations from perhaps 100 nM to 5 microM. The use of 15 microM throughout is an overall concern.

      The reason that we use this concentration of SFN is based on our previous study (Li, Shao et al. 2021). We had shown that SFN (10–15 μM, 2–9 h) induces robust TFEB nuclear translocation in a dose- and time-dependent manner in HeLa cells as well as in other human cell lines without cytotoxicity (Li, Shao et al. 2021). Also, tissue concentrations of SFN can reach 3–30 μM upon broccoli consumption (Hu, Khor et al. 2006), so we used low micromolar concentrations of SFN (15 μM) in our study. Moreover, we further confirmed that SFN (15 μM) induces TFEB nuclear translocation in HeLa NPC1 cells (Fig. 1F, G Fig. 2B, G) and this concentration of SFN has no cytotoxicity (New Fig.S10).

      Recommendations for the authors:

      Reviewer #1 (Recommendations for the authors):

      The following comments are designed to improve and focus the authors' work.

      (14) Related to data in Figure 1. The mechanism through which TFEB can reduce Filipin in U18 conditions is unclear. Inhibi on of NPC1 results in hyperactivation of mTOR through cholesterol transport at ER-Lysosome contacts (see Zoncu group publications). If mTORC is hyperac ve in NPC disease models, TFEB would be expected to remain cytoplasmic and not enter the nucleus as the representative image in Figure 1A demonstrates.

      In our previous study (Li, Shao et al. 2021), we have shown that SFN induces TFEB nuclear translocation in a mTOR-independent manner (Li, Shao et al. 2021). Consistent with this result, in this study we confirmed that SFN-induced TFEB nuclear translocation is mTor-independent in NPC1 cells (Now Fig. S4A, B). Thus, SFN induced TFEB nuclear translocation in various NPC cells (Fig. 1F, G, Fig. 2B, G). Please also see the discussion about the mechanism of SFN in response to point #1.

      (15) Therefore, how does overexpression of TFEB, which remains in the cytoplasm, result in a decreased filipin signal? Similar ques ons relate to Figure 1C-H.

      Medina et. al (Medina, Fraldi et al. 2011) show that TFEB overexpression (not activation, so overexpressed TFEB is in the cytoplasm) increases the pool of lysosomes in the proximity of the plasma membrane and promotes their fusion with PM by raising intracellular Ca<sup>2+</sup> levels through lysosomal Ca<sup>2+</sup> channel MCOLN1, leading to increased lysosomal exocytosis. Hence, TFEB overexpression only (TFEB is not activated) could reduce filipin signal via increasing lysosomal exocytosis. And with TFEB agonist treatment such as TFEB could further boost this increase.

      (16) It would seem appropriate to measure the NPC1 and NPC2 proteins using western blot to ensure that SFN-dependent clearance of cholesterol is not due to enhanced expression of the native protein in U18-treated cells or enhanced folding of the protein in patient fibroblasts.

      Thank you for this constructive comment! Because NPC1 gene mutation takes about 95% of NPC cases and NPC2 mutation takes about 5% of NPC cases. And in this study we focused on NPC1 deficiency cases. Thus, we measured the effect of SFN on the expression of NPC1 in human NPC1-patient fibroblasts. Western blot analysis showed that SFN (15 μM, 24 h) treatment did not affect NPC1 expression in human NPC1-patient fibroblasts (new Fig. S5).

      (17) Related to data in Figures 1C-E. Controls are missing related to the effect SFN has on steady-state cholesterol levels. This may be insightful in providing information on the mode of action of this compound.

      Suggestion was taken! We have supplemented the control- SFN only in new Fig. 1C-E.

      (18) The mechanism that links SFN to TFEB-dependent translocation is suggested to involve calcineur independent dephosphorylation of TFEB. However, no data is provided. It would seem important to iden fy the mechanism(s) through which SFN positively regulates TFEB location. This would shift the manuscript and its model from correlations to causation. Experiments involving calcineurin inhibitors, or agonists of TRPML1 that have been reported as being a key source of Ca<sup>2+</sup> for calcineurin activation, may provide molecular insight.

      Please see the paragraph in response to point #1.

      (19) Related to Figure 4. Using a plasma membrane counterstain to quantify plasma membrane LAMP1 would increase the rigor of the analysis.

      Great idea! We examined the colocalization of DiO (a PM marker) staining and LAMP1 staining in HeLa NPC1 cells under SFN treatment. As shown in new Fig.4A, surface LAMP1 signal(red) colocalized with DiO (green), a PM marker.

      (20) Related to Figure 5. How do the authors explain the kinetic disparity between SFN treatment for 24 vs 72 hrs? IF TFEB is activated and promoting lysosomal biogenesis and increased lysosomal flux across the PM, why does cholesterol accumulation lag? Perhaps related to this point. Are other cholesterol metabolizing enzymes that may have altered activity in NPC sensitive to SFN? A similar comment applies to the Sterol regulatory element binding protein pathway, which has been shown to be activated in models of NPC disease.

      We understand the reviewer’s point. As shown in Fig. 5C, D, in NPC1<sup>-/-</sup> MEF cells, SFN treatment for 24 h showed relative weaker cholesterol clearance compared to the effects in human cells (Fig.1C, D, Fig.2.E, I). Thus, we explored a longer treatment of SFN for 72 h (fresh SFN in medium was added every 24 h), and 72h treatment of SFN exhibited substantial cholesterol reduction (Fig. 5C, D). This different effect could be attributed to the continuous action of SFN, which could prolong the exocytosis, leading to more effective cholesterol clearance. As shown in the DMSO-treated MEF cells, the cholesterol levels are similar in both 24 and 72 h, thus 24 h U18666A treatment has reached the upper limit of the accumulated cholesterol, longer treatment me would not change the cholesterol levels. Thus, cholesterol accumulation has no lag.

      We did not investigate whether SFN regulates other cholesterol metabolizing enzymes or sterol regulatory element binding proteins although we cannot rule out this possibility. In this study we mainly focus on the cholesterol clearance effect by SFN via TFEB-mediated pathways. From our data, TFEB KO could significantly diminish SFN-evoked cholesterol clearance. Hence, the effect of other cholesterol metabolizing enzymes or sterol regulatory element binding proteins maybe not as important as TFEB, thus out of scope of this study. In the future, we may explore the involvement of possible other pathways on SFN’s effects.

      (21) Related to Figure 7. The western blots for pS211-TFEB are poor. It's suggested that whole blots are shown to increase rigor.

      Thank you for the comments. We have represented the blots with more spare space to increase the rigor.

      (22) Data demonstrating the ability of SFN to improve Purkinje cell survival are exci ng and pair well with the weight analysis, however, to address the overall goal of determining if "SFN could be a good therapeutic candidate for neuropathology in NPC disease" survival analysis should be tested as well.

      Please see the paragraph in response to point #3.

      Minor

      (23) Throughout the manuscript many different Fonts and font sizes are used. This is very jarring to readers. It is suggested that a more uniform approach is taken to presenting these nice datasets.

      We are so sorry and apologize for these oversights. We have thoroughly checked all the manuscript to make sure that Fonts and sizes of font are synchronized.

      (24) Related to data presentation. In general, there is a lack of alignment and organization of the figures.

      So sorry about this. We have reorganized the figures to get them better aligned.

      (25) Line 149, SFN is missing.

      Corrected!

      Reviewer #3 (Recommendations for the authors):

      (26) In Figure 3 the authors should use multiple single siRNAs or perform a functional rescue to determine specificity.

      We understand the reviewer’s point. We did design several siRNAs and the efficiency of these siRNAs were validated. Finally, we decide use this siRNA whose knockdown efficiency is best in the study and the specificity of the siTFEB has been validated by Western blot as shown in Fig. 3A. Furthermore, we used TFEB knockout cells constructed by CRISPR/Cas9 to further examine the role of TFEB in SFN-induced cholesterol clearance (Fig. 3D). Consistently with the results in the siTFEB-transfected HeLa NPC1 cells (Fig. 3B, C), SFN failed to diminish cholesterol in HeLa TFEB KO cells. The result from TFEB KO cells is even convincing than siRNA experiment. We also performed a functional rescue of re-expressing TFEB in TFEB KO cells, in which SFN-induced cholesterol clearance was restored (Fig. 3E, F). Collectively, these data indicate that TFEB is required for lysosomal cholesterol reduction upon SFN treatment. Thus, we did not repeat this rescue experiment in the siTFEB-transfected HeLa NPC1 cells.

      (27) The label for 3D is missing.

      Corrected! Thanks!

      (28) Figure 4, although the authors use an an body against the luminal domain of LAMP1 there could s ll be some permeabilization. A marker of the plasma membrane would be helpful.

      Please see the response to point #19.

      (29) Figure 4, cholesterol in the media because of lysosome exocytosis. This is where the high concentration of SFN is of concern. Is there any cell death that could explain the result? The authors should test for cell death with the SFN treatment.

      Thank you for raising this important point! We have measured the cytotoxicity of SFN of the concentrations used in this study in various cell lines (New Fig.S10). Please also see the paragraph in response to point #13.

      (30) The blot in Figure 6A is unclear. It is very hard to see any change in pS211-TFEB levels, and, the blurry signal is the detection of phospho-TFEB is uncertain.

      Please see the summary paragraph in response to point #21.

      References:

      Hu, M. Q., P. Li, C. Wang, X. H. Feng, Q. Geng, W. Chen, M. Marthi, W. L. Zhang, C. L. Gao, W. Reid, J. Swanson, W. L. Du, R. Hume and H. X. Xu (2022). "Parkinson's disease-risk protein TMEM175 is a proton-activated proton channel in lysosomes." Cell 185(13): 2292-+.

      Hu, R., T. O. Khor, G. Shen, W. S. Jeong, V. Hebbar, C. Chen, C. Xu, B. Reddy, K. Chada and A. N. Kong (2006). "Cancer chemoprevention of intestinal polyposis in ApcMin/+ mice by sulforaphane, a natural product derived from cruciferous vegetable." Carcinogenesis 27(10): 2038-2046.

      Li, D., R. Shao, N. Wang, N. Zhou, K. Du, J. Shi, Y. Wang, Z. Zhao, X. Ye, X. Zhang and H. Xu (2021). "Sulforaphane Activates a lysosome-dependent transcriptional program to mitigate oxidative stress." Autophagy 17(4): 872-887.

      Medina, D. L., A. Fraldi, V. Bouche, F. Annunziata, G. Mansueto, C. Spampanato, C. Puri, A. Pignata, J. A. Martina, M. Sardiello, M. Palmieri, R. Polishchuk, R. Puertollano and A. Ballabio (2011). "Transcriptional activation of lysosomal exocytosis promotes cellular clearance." Dev Cell 21(3): 421-430.

    1. Author response:

      The following is the authors’ response to the original reviews.

      Reviewer #1 (Public review):

      Fuchs describes a novel method of enzymatic protein-protein conjugation using the enzyme Connectase. The author is able to make this process irreversible by screening different Connectase recognition sites to find an alternative sequence that is also accepted by the enzyme. They are then able to selectively render the byproduct of the reaction inactive, preventing the reverse reaction, and add the desired conjugate with the alternative recognition sequence to achieve near-complete conversion. I agree with the authors that this novel enzymatic protein fusion method has several applications in the field of bioconjugation, ranging from biophysical assay conduction to therapeutic development. Previously the author has published on the discovery of the Connectase enzymes and has shown its utility in tagging proteins and detecting them by in-gel fluorescence. They now extend their work to include the application of Connectase in creating protein-protein fusions, antibody-protein conjugates, and cyclic/polymerized proteins. As mentioned by the author, enzymatic protein conjugation methods can provide several benefits over other non-specific and click chemistry labeling methods. Connectase specifically can provide some benefits over the more widely used Sortase, depending on the nature of the species that is desired to be conjugated. However, due to a similar lengthy sequence between conjugation partners, the method described in this paper does not provide clear benefits over the existing SpyTag-SpyCatcher conjugation system.  Additionally, specific disadvantages of the method described are not thoroughly investigated, such as difficulty in purifying and separating the desired product from the multiple proteins used. Overall, this method provides a novel, reproducible way to enzymatically create protein-protein conjugates.

      The manuscript is well-written and will be of interest to those who are specifically working on chemical protein modifications and bioconjugation.

      I'd like to comment on two points.

      (1) The benefits over the SpyTag-SpyCatcher system. Here, the conjugation partners are fused via the 12.3 kDa SpyCatcher protein, which is considerably larger than the Connectase fusion sequence (19 aa). This is mentioned in the introduction (p. 1 ln 24-26). Furthermore, SpyTag-SpyCatcher fusions are truly irreversible, while Connectase/BcPAP fusions may be reversed (p. 8, ln 265-273). For example, target proteins (e.g., AGAFDADPLVVEI-Protein) may be covalently fused to functionalized magnetic beads (e.g., Bead-ELASKDPGAFDADPLVVEI) in order to perform a pulldown assay. After the assay, the target protein and any bound interactors could be released from the beads by the addition of a Connectase / peptide (AGAFDAPLVVEI) mixture.

      In a related technology, the SpyTag-SpyCatcher system was split into three components, SpyLigase, SpyTag and KTag  (Fierer et al., PNAS 2014). The resulting method introduces a sequence between the fusion partners (SpyTag (13aa) + KTag (10aa)), which is similar in length to the Connectase fusion sequence (p. 8, ln 297 - 298). Compared to the original method, however, this approach seems to require longer incubation times, while yielding less fusion product (Fierer et al., Figure 2).

      (2) Purification of the fusion product. The method is actually advantageous in this respect, as described in the discussion (p. 8, ln 258-264). Examples are now provided in Figure 6.

      Reviewer #2 (Public review):

      Summary:

      Unlike previous traditional protein fusion protocols, the author claims their proposed new method is fast, simple, specific, reversible, and results in a complete 1:1 fusion. A multi-disciplinary approach from cloning and purification, biochemical analyses, and proteomic mass spec confirmation revealed fusion products were achieved.

      Strengths:

      The author provides convincing evidence that an alternative to traditional protein fusion synthesis is more efficient with 100% yields using connectase. The author optimized the protocol's efficiency with assays replacing a single amino acid and identification of a proline aminopeptidase, Bacilius coagulans (BcPAP), as a usable enzyme to use in the fusion reaction. Multiple examples including Ubiquitin, GST, and antibody fusion/conjugations reveal how this method can be applied to a diverse range of biological processes.

      Weaknesses:

      Though the ~100% ligation efficiency is an advancement, the long recognition linker may be the biggest drawback. For large native proteins that are challenging/cannot be synthesized and require multiple connectase ligation reactions to yield a complete continuous product, the multiple interruptions with long linkers will likely interfere with protein folding, resulting in non-native protein structures. This method will be a good alternative to traditional approaches as the author mentioned but limited to generating epitope/peptide/protein tagged proteins, and not for synthetic protein biology aimed at examining native/endogenous protein function in vitro.

      The assessment is fair, and I have no further comments to add.

      Reviewer #1 (Recommendations for the authors):

      Major/Experimental Suggestions:

      (1) Throughout the paper only one reaction shown via gels had 100% conversion to desired product (Figure 3C). It is misleading to title a paper with absolutes such as "100% product yield", when the majority of reactions show >95% product yield, without any purification. Please change the title of the manuscript to something along the lines of "Novel Irreversible Enzymatic Protein Fusions with Near-Complete Product Yield".

      The conjugation reaction is thermodynamically favored. It is driven by the hydrolysis of a peptide bond (P|GADFDADPLVVEI), which typically releases 8 - 16 kJ/mol energy. This should result in a >99.99% complete reaction (DG° = -RT ln (Product/Educt)). In line with this, 99% - 100% of the less abundant educts (LysS, Figure 3A; MBP, Figure 3B; Ub-Strep, Figure 3C) are converted in the time courses (Figure 3D-F show different reaction conditions, which slow down conjugate formation). 100% conversion are also shown in Figure 5, Figure 6, and Figure S4. Likewise, 99.6% relative fusion product signal intensity in an LCMS analysis (Figure S2) after 4h reaction time (0.13% and 0.25% educts). In this experiment, the proline had been removed from 99.8% of the peptide byproducts (P|GADFDADPLVVEI). It is clear that this reaction is still ongoing and that >99.99% of the prolines will be removed from the peptides in time. These findings suggest that the conjugation reaction gradually slows down the less educt is available, but eventually reaches completion.

      For some experiments, lower product yields (e.g. 97% in Figure 3B) are reported in the paper. These were calculated with Yield = 100% x Product / (Educt1 + Educt 2 + Product). With this formula, 100% conjugation can only be achieved with exactly equimolar educt quantities, because both educt 1 and educt 2 need to be converted entirely. If one educt 1 is available in excess, for example because of protein concentration measurement inaccuracies or pipetting errors, some of it will be left without fusion partner. In case of Figure 3B, 3% more GST seemed to have been in the mixture. These are methodological inaccuracies.

      (2) Please provide at least one example of a purified desired product, and mention the difficulties involved as a disadvantage to this particular method. Separating BcPAP, Connectase, and the desired protein-protein conjugate may prove to be quite difficult, especially when Connectase cleaves off affinity tags.

      Examples are now provided in Figure 6. As described in the discussion (p. 8, ln 258-264), the simple product purification is one of the advantages of the method.

      (3) For the antibody conjugate, please provide an example of conjugating an edduct that would prove to be more useful in the context of antibodies. For example, as you mention in the introduction, conjugation of fluorophores, immobilization tags such as biotin, and small molecule linker/drugs are useful bioconjugates to antibodies.

      Antibody-biotinylation is now shown in Figure S6; Antibody-fluorophore conjugates are part of Figures S5 and S7.

      (4) Please assess the stability of these protein-protein conjugates under various conditions (temperature, pH, time) to ensure that the ligation via Connectase is stable over a broad array of conditions. In particular, a relevant antibody-conjugate stability assay should be done over the period of 1-week in both buffer and plasma to show applicability for potential therapeutics.

      The stability of an antibody-biotin conjugate in blood plasma over 7 days at different temperatures is now shown in Figure S7.

      Generally, Connectase introduces a regular peptide bond (Asp-Ala) with a high chemical and physical stability (e.g. 10 min incubation at 95°C in SDS-PAGE loading buffer; H2O-formic acid / acetonitrile gradients for LC-MS). The sequence may be susceptible to proteases, although this is not the case in HEK293 cells (antibody expression), E. coli, or blood plasma (Figure S7).

      (5) Please conduct functional assays with the antibody-protein/peptide conjugates to show that the antibody retains binding capabilities to the HER-2 antigen and the modification was site-selective, not interfering with the binding paratope or binding ability of the antibody in any way. This can be done through bio-layer interferometry, surface plasmon resonance, ELISA, etc.

      We plan the immobilization of the HER2 antibody on microplates and its use in an ELISA. However, this experiment requires significant testing and optimizations. It will be part of a future paper on the use of Connectase for protein immobilization.

      For now, the mass spectrometry data provide clear evidence of a single site-selective conjugation, as the C-terminal ELASKDPGAFDADPLVVEI-Strep sequence is replaced by ELASKDAGAFDADPLVVEI(-Ub). Given that the conjugation sites at the C-termini are far from the antigen binding sites, and have already been used in a number of other approaches (e.g., SpyTag, SnapTag, Sortase), it appears unlikely that these conjugations interfere with antigen binding.

      (6) Please include gels of all proteins used in ligation reactions after purification steps in the SI to show that each species was pure.

      The pure proteins are now shown in Figure S9.

      (7) Please provide the figures (not just tables) of LC/MS deconvoluted mass spectra graphs for all conjugates, either in the main text or the SI.

      Please specify which spectra you are missing. I believe all relevant spectra are shown in Figures 4, 5, and S3. The primary data can be found in Dataset S2.

      (8) Please provide more information in the methods section on exactly how the densitometry quantification of gel bands was performed with ImageJ.

      Details on the quantification with Image Studio Lite 5.2 were added in the method section (p. 17, ln 461-463).

      Minor Suggestions:

      (1) Page 1, line 19: can include one sentence on what assays these particular bioconjugations are usefule for (e.g. internalization cell studies, binding assays, etc.)

      I prefer not to provide additional details here to keep the text concise and focused.

      (2) Page 1, line 22: "three to ten equivalents" instead of 3x-10x.

      Done.

      (3) Page 1, line 23: While NHS labeling is widely considered non-specific, maleimide conjugation to free cysteines is generally considered specific for engineered free cysteine residues, since native proteins often do not have free cysteine residues available for conjugation. If you are referring to the potential of maleimides to label lysines as well, that should be specifically stated.

      I modified the sentence, now stating that these methods are "can be" unspecific.

      As pointed out, it is possible to achieve specificity by eliminating all other free cysteines and/or engineering a cysteine in an appropriate position. In many other cases, however (e.g., natural antibodies), several cysteines are available, or the sample contains other proteins/peptides. I did not want to go into more detail here and refer to the cited review.

      (4) Page 1, line 31: "and an oligoglycine G(1-5)-B"

      Done.

      (5) Page 1, line 34: It is not clear where in the source these specific Km values are coming from, considering these are variable based on specific conditions/substrates and tend to be reaction-specific.

      I cited another review, which lists the same values, along with a few other measurements (Jacobitz et al., Adv Protein Chem Struct Biol 2017, Table 2). It is clear that each of these measurements differs somewhat, but they are generally comparable (K<sub>M</sub>(LPETG) = 5500 - 8760 µM; K<sub>M</sub>(GGGGG) = 140 - 196 µM). I chose the cited study (Frankel et al., Biochemistry 2005), because it also investigated hydrolysis rates. In this study, the measurements are derived from the plots in Figure 2.

      (6) Page 1, line 47: the comparison to western blots feels a little like apples to oranges, even though this comparison was made in previous literature. Engineering an expressed protein to have this tag and then using the tag to detect and quantify it, feels more akin to a tagging/pull down assay than a western blot in which unmodified proteins are easily detected.

      It is akin to a frequently used type of western blots with tag-specific antiboies, e.g. Anti-His<sub>6</sub>, -Streptavidin, -His<sub>6</sub>, -HA ,-cMyc, -Flag. I modified the sentence to clarify this.

      (7) Page 2, line 51: "Connectase cleaves between the first D and P amino acids in the recognition sequence, resulting in an N-terminal A-ELASKD-Connectase intermediate and a C-terminal PGAFDADPLVVEI peptide."

      I prefer the current sentence, because we assume that a bond between the aspartate and Connectase is formed before PGAFDADPLVVEI is cleaved off.

      (8) Page 3, line 94: "Exact determination is not possible due to reversibility of the reaction", the way it is stated now sounds like it is a flaw in the methods. Also, update Figure 2 to read "Estimated relative ligation rate".

      Done.

      (9) Page 3, lines 101-107: This is worded in a confusing way. It can either be X<sub>1</sub> or X<sub>2</sub> that is inactivated depending on if the altered amino acid is on the original protein sequence or on the desired edduct to conjugate. You first give examples of how to render other amino acids inactive, but then ultimately state that proline made inactive, so separate the two distinct possibilities a bit more clearly.

      The reaction requires the inactivation of X<sub>1</sub>, without affecting X<sub>2</sub> (ln 100 - 102). This is true, no matter whether it is X<sub>1</sub> = A, C, S, or P that is inactivated. I added a sentence to clarify this (ln 102 – 103).

      (10) Page 4, line 118: Give a one-sentence justification for why these proteins were chosen to work with (easy to express, stable, etc).

      Done.

      (11) Page 5, line 167: "payload molecules".

      Done.

      (12) Page 5, lines 170-173: Word this more clearly- "full conversion with many of these methods is difficult on antibodies due to each heavy and light chain being modified separately, resulting in only a total yield of 66% DAR4 even when 90% of each chain is conjugated."

      I rephrased the section.

      (13) Page 8, line 290: Discuss other disadvantages of this method including difficulties purifying and in incorporating such a long sequence into proteins of interest.

      Product purification is shown in the new Figure 6. As stated above, I consider the simple purification process an advantage of the method.  The genetic incorporation of the sequence into proteins is a routine process and should not make any difficulties. The disadvantages of long linker sequences between fusion partners are now discussed (p.8 – 9, ln 300-302).

      (14) Page 10, line 341: 'The experiment is described and discussed in detail in a previously published paper.31"

      Done.

      Reviewer #2 (Recommendations for the authors):

      Minor Points:

      (1) It's unclear how the author derived 100% ligation rate with X = Proline in Figure 2 when there is still residual unligated UB-Strep at 96h. Please provide an expanded explanation for those not familiar with the protocol. Is the assumption made that there will be no UB-Strep if the assay was carried out beyond 96h?

      I clarified the figure legend. The assay shows the formation of an equilibrium between educts and products. Therefore, only ~50% Ub-Strep is used with X = Proline (see p. 2, ln 79 - 81). The "relative ligation rate" refers to the relative speed with which this equilibrium is established. The highest rate is seen with X = Proline, and it is set to 100%. The other rates are given relative to the product formation with X = Proline.

      (2) Though the qualitative depiction of the data in Figure 3 is appreciated, an accompanying graphical representation of the data in the same figure will greatly enhance reception and better comprehension of several of the author's conclusions.

      Graphs are now shown in Figure S1.

      (3) Figure 3 panel E is misaligned. Please align it with panel B above it.

      Done, thank you.

      (4) The author refers to 'The resulting circular assemblies (37% UB2...)' in the text but identifies it as UB-C2 in Figure 5B. Is this a mistake or does UB2 refer to another assembly not mentioned in the Figures? Please check for inconsistencies.

      All circular assemblies are now labeled Ub-C <sub>1-6</sub>.

      (5) Finishing with a graphical schematic that depicts the entire protocol in a simple image would be much appreciated and well-received by readers. Including the scheme with A and B proteins, the recognition linkers, the addition of connectase and BcPAP, etc. to the final resulting protein with connected linker.

      A graphical summary of the reaction is now included in Figure 6.

    1. Author response:

      The following is the authors’ response to the original reviews.

      Public Reviews:

      Reviewer #1 (Public Review):

      Summary:

      In this manuscript, Fuchsberger et al. demonstrate a set of experiments that ultimately identifies the de novo synthesis of GluA1-, but not GluA2-containing Ca2+ permeable AMPA receptors as a key driver of dopamine-dependent LTP (DA-LTP) during conventional post-before-pre spike-timing dependent (t-LTD) induction. The authors further identify adenylate cyclase 1/8, cAMP, and PKA as the crucial mitigators of these actions. While some comments have been identified below, the experiments presented are thorough and address the aims of the manuscript, figures are presented clearly (with minor comments), and experimental sample sizes and statistical analyses are suitable. Suitable controls have been utilized to confirm the role of Ca2+ permeable AMPAR. This work provides a valuable step forward built on convincing data toward understanding the underlying mechanisms of spike-timing-dependent plasticity and dopamine.

      Strengths:

      Appropriate controls were used.

      The flow of data presented is logical and easy to follow.

      The quality of the data, except for a few minor issues, is solid.

      Weaknesses:

      The drug treatment duration of anisomycin is longer than the standard 30-45 minute duration (as is the 500uM vs 40uM concentration) typically used in the field. Given the toxicity of these kinds of drugs long term it's unclear why the authors used such a long and intense drug treatment.

      In an initial set of control experiments (Figure S 1C-D) we wanted to ensure that protein synthesis was definitely blocked and therefore used a relatively high concentration of anisomycin and a relatively long pre-incubation period. We agree with the Reviewer that we cannot exclude the possibility that this treatment could compromise cell health in addition to the protein synthesis block. Therefore, we carried out an additional experiment with an alternative protein synthesis inhibitor cycloheximide at a lower standard concentration (10 µM) which confirmed a significant reduction in the puromycin signal (Figure S 1A-B). Together these results support the conclusion that puromycin signal is specific to protein synthesis in our labelling assay.

      Furthermore, in the electrophysiology experiments, we used 500 μM anisomycin in the patch pipette solution. Under these conditions, we recorded a stable EPSP baseline for 60 minutes, indicating that the treatment did not cause toxic effects to the cell (Figure S1F). This high concentration would ensure an effective block of local translation at dendritic sites. Nevertheless, we also carried out this experiment with cycloheximide at a lower standard concentration (10 µM) and observed a similar result with both protein synthesis inhibitors (Figure 1F).

      With some of the normalizations (such as those in S1) there are dramatic differences in the baseline "untreated" puromycin intensities - raising some questions about the overall health of slices used in the experiments.

      We agree with the Reviewer that there is a large variability in the normalised puromycin signal which might be due to variability in the health of slices. However, we assume that the same variability would be present in the treated slices, which showed, despite the variability, a significant inhibition of protein synthesis. To avoid any bias by excluding slices with low puromycin signal in the control condition, we present the full dataset.

      The large set of electrophysiology experiments carried out in our study (all recorded cells were evaluated for healthy resting membrane potential, action potential firing, and synaptic responses) confirmed that, generally, the vast majority of our slices were indeed healthy. 

      Reviewer #2 (Public Review):

      Summary:

      The aim was to identify the mechanisms that underlie a form of long-term potentiation (LTP) that requires the activation of dopamine (DA).

      Strengths:

      The authors have provided multiple lines of evidence that support their conclusions; namely that this pathway involves the activation of a cAMP / PKA pathway that leads to the insertion of calcium-permeable AMPA receptors.

      Weaknesses:

      Some of the experiments could have been conducted in a more convincing manner.

      We carried out additional control experiments and analyses to address the specific points that were raised.

      Reviewer #3 (Public Review):

      The manuscript of Fuchsberger et al. investigates the cellular mechanisms underlying dopamine-dependent long-term potentiation (DA-LTP) in mouse hippocampal CA1 neurons. The authors conducted a series of experiments to measure the effect of dopamine on the protein synthesis rate in hippocampal neurons and its role in enabling DA-LTP. The key results indicate that protein synthesis is increased in response to dopamine and neuronal activity in the pyramidal neurons of the CA1 hippocampal area, mediated via the activation of adenylate cyclases subtypes 1 and 8 (AC1/8) and the cAMP-dependent protein kinase (PKA) pathway. Additionally, the authors show that postsynaptic DA-induced increases in protein synthesis are required to express DA-LTP, while not required for conventional t-LTP.

      The increased expression of the newly synthesized GluA1 receptor subunit in response to DA supports the formation of homomeric calcium-permeable AMPA receptors (CP-AMPARs). This evidence aligns well with data showing that DA-LTP expression requires the GluA1 AMPA subunit and CP-AMPARs, as DA-LTP is absent in the hippocampus of a GluA1 genetic knock-out mouse model. Overall, the study is solid, and the evidence provided is compelling. The authors clearly and concisely explain the research objectives, methodologies, and findings. The study is scientifically robust, and the writing is engaging. The authors' conclusions and interpretation of the results are insightful and align well with the literature. The discussion effectively places the findings in a meaningful context, highlighting a possible mechanism for dopamine's role in the modulation of protein-synthesis-dependent hippocampal synaptic plasticity and its implications for the field. Although the study expands on previous works from the same laboratory, the findings are novel and provide valuable insights into the dynamics governing hippocampal synaptic plasticity.

      The claim that GluA1 homomeric CP-AMPA receptors mediate the expression of DA-LTP is fascinating, and although the electrophysiology data on GluA1 knock-out mice are convincing, more evidence is needed to support this hypothesis. Western blotting provides useful information on the expression level of GluA1, which is not necessarily associated with cell surface expression of GluA1 and therefore CP-AMPARs. Validating this hypothesis by localizing the protein using immunofluorescence and confocal microscopy detection could strengthen the claim. The authors should briefly discuss the limitations of the study.

      Although it would be possible to quantify the surface expression of GluA1 using immunofluorescence, it would not be possible to distinguish  between GluA1 homomers and GluA1-containing heteromers. It would therefore not be informative as to whether these are indeed CP-AMPARs. This is an interesting problem, which we have briefly discussed in the Discussion section.

      Additional comments to address:

      (1) In Figure 2A, the representative image with PMY alone shows a very weak PMY signal. Consequently, the image with TTX alone seems to potentiate the PMY signal, suggesting a counterintuitive increase in protein synthesis.

      We agree with the Reviewer that the original image was not representative and have replaced it with a more representative image.

      (2) In Figures 3A-B, the Western blotting representative images have poor quality, especially regarding GluA1 and α-actin in Figure 3A. The quantification graph (Figure 3B) raises some concerns about a potential outlier in both the DA alone and DA+CHX groups. The authors should consider running a statistical test to detect outlier data. Full blot images, including ladder lines, should be added to the supplementary data.

      We have replaced the western blot image in Figure 3A and have also presented full blot images including ladder lines in supplementary Figure S3.

      Using the ROUT method (Q=1%) we identified one outlier in the DA+CHX group of the western blot quantification. The quantification for this blot was then removed from the dataset and the experiment was repeated to ensure a sufficient number of repeats.

      Recommendations for the authors:

      Reviewer #1 (Recommendations For The Authors):

      (1) How the authors perform these experiments with puromycin, these are puromycilation experiments - not SuNSET. The SuNSET protocol (surface sensing of translation) specifically refers to the detection of newly synthesized proteins externally at the plasma membrane. I'd advise to update the terminology used.

      We thank the Reviewer for pointing this out. We have updated this to ‘puromycin-based labelling assay’.

      (2) The legend presented in Figure 2F suggests WT is green and ACKO is orange, however, in Figure 2G the WT LTP trace is orange, consider changing this to green for consistency.

      We thank the Reviewer for this suggestion and agree that a matching colour scheme makes the Figure clearer. This has been updated.

      (3) In the results section, it is recommended to include units for the values presented at the first instance and only again when the units change thereafter.

      The units of the electrophysiology data were [%], this is included in the Results section. Results of western blots and IHC images were presented as [a.u.]. While we included this in the Figures, we have not specifically added this to the text of individual results. 

      (4) Two hours pre-treatment with anisomycin vs 30 minutes pretreatment with cycloheximide seems hard to directly compare - as the pharmokinetics of translational inhibition should be similar for both drugs. What was the rationale for the extremely long anisomycin pretreatment? What controls were taken to assess slice health either prior to or following fixation? This is relevant to the below point (5).

      In an initial set of control experiments (Figure S 1C-D) we wanted to ensure that protein synthesis was definitely blocked and therefore used a relatively high concentration of anisomycin and a relatively long pre-incubation period. We agree with the Reviewer that we cannot exclude the possibility that this treatment could compromise cell health in addition to the protein synthesis block. Therefore, we carried out an additional experiment with an alternative protein synthesis inhibitor cycloheximide at a lower standard concentration (10 µM) which confirmed a significant reduction in the puromycin signal (Figure S1A-B). Together these results support the conclusion that puromycin signal is specific to protein synthesis in our labelling assay.

      IHC slices were visually assessed for health. The large set of electrophysiology experiments carried out in our study (all recorded cells were evaluated for healthy resting membrane potential, action potential firing, and synaptic responses) also confirmed that, generally, the vast majority of our slices were indeed healthy. 

      (5) In Supplementary Figure 1, there is a dramatic difference in the a.u. intensities across CHX (B) and AM (D), please explain the reason for this. It is understood these are normalised values to nuclear staining, please clarify if this is a nuclear area.

      We agree with the Reviewer that there is a large variability in normalised puromycin signal which may be due to variability in the health of the slices. However, we assume that the same variability would be present in the treated slices, which showed, despite the variability, a significant effect of protein synthesis inhibition. To prevent introducing bias by excluding slices with low puromycin signal in the control condition, we present the full dataset.

      The CA1 region of the hippocampus contains of a dense layer of neuronal somata (pyramidal cell layer). We normalized against the nuclear area as it provides a reliable estimate of the number of neurons present in the image. This approach minimizes bias by accounting for variation in the number of neurons within the visual field, ensuring consistency and accuracy in our analysis.

      (6) Please clarify the decision to average both the last 5 minutes of baseline recordings and the last 5 minutes of the recording for the normalisation of EPSP slopes.

      The baseline usually stabilises after a few minutes of recording, thus the last 5 minutes were used for baseline measurement, which are the most relevant datapoints to compare synaptic weight change to. After induction of STDP, potentiation or depression of synaptic weights develops gradually. Based on previous results, evaluating the EPSP slopes at 30-40 minutes after the induction protocol gives a reliable estimate of the amount of plasticity.

      Reviewer #2 (Recommendations For The Authors):

      The concentration of anisomycin used (0.5 mM) is very high.

      As described above, in an initial set of control experiments (Figure S 1C-D) we wanted to ensure that protein synthesis was definitely blocked and therefore used a relatively high concentration of anisomycin and a relatively long pre-incubation period. We agree with the Reviewer that this is higher than the standard concentration used for this drug and we cannot exclude the possibility that this treatment could compromise cell health in addition to the protein synthesis block. Therefore, we carried out an additional experiment with an alternative protein synthesis inhibitor cycloheximide at a lower standard concentration (10 µM) which confirmed a significant reduction in the puromycin signal (Figure S1A-B). Together these results support the conclusion that puromycin signal is specific to protein synthesis in our labelling assay.

      Furthermore, in the electrophysiology experiments, we also used 500 µM anisomycin in the patch pipette solution. Under these conditions, we recorded a stable EPSP baseline for 60 minutes, indicating that the treatment did not cause toxic effects to the cell (Figure S1F). This high concentration would ensure an effective block of local translation at dendritic sites. Nevertheless, we also carried out this experiment with cycloheximide at a lower standard concentration (10 µM) and observed a similar result with both protein synthesis inhibitors (Figure 1F).

      The authors conclude that the effect of DA is mediated via D1/5 receptors, which based on previous work seems likely. But they cannot conclude this from their current study which used a combination of a D1/D5 and a D2 antagonist.

      We thank the Reviewer for pointing this out. We agree and have updated this in the Discussion section to ‘dopamine receptors’, without specifying subtypes.

      There is no mention that I can see that the KO experiments were conducted in a blinded manner (which I believe should be standard practice). Did they verify the KOs using Westerns?

      Only a subset of the experiments was conducted in a blinded manner. However, the results were collected by two independent experimenters, who both observed significant effects in KO mice compared to WTs (TF and ZB).

      We received the DKO mice from a former collaborator, who verified expression levels of the KO mice (Wang et al., 2003). We verified DKO upon arrival in our facility using genotyping.

      Maybe I'm misunderstanding but it appears to me that in Figure 1F there is LTP prior to the addition of DA. (The first point after pairing is already elevated). I think the control of pairing without DA should be added.

      We thank the Reviewer for pointing this out. Based on previous results (Brzosko et al., 2015) we would expect potentiation to develop over time once DA is added after pairing, however, it indeed appears in the Figure here as if there was an immediate increase in synaptic weights after pairing. It should be noted, however, that when comparing the first 5 minutes after pairing to the baseline, this increase was not significant (t(9)=1.810, p =0.1037). Nevertheless, we rechecked our data and noticed that this initial potentiation was biased by one cell with an increasing baseline, which had both the test and control pathway strongly elevated. We had mistakenly included this cell in the dataset, despite the unstable conditions (as stated in the Methods section, the unpaired control pathway served as a stability control). We apologise for the error and this has now been corrected (Figure 1F). In addition, we present the control pathway in Figure S1G and I.

      We have also now included the control for post-before-pre pairing (Δt = -20 ms) without dopamine in a supplemental figure (Figure S1E and F).

      The Westerns (Figure 3A) are fairly messy. Also, it is better to quantify with total protein. Surface biotinylation of GluA1 and GluA2 would be more informative.

      We carried out more repeats of Western blots and have exchanged blots in Figure 3A.

      We observed that DA increases protein synthesis, we therefore cannot exclude the possibility that application of DA could also affect total protein levels. Thus quantifying with total protein may not be the best choice here. Quantification with actin is standard practice.

      While we agree with the Reviewer that surface biotinylation of GluA1 and GluA2 could in principle be more informative, we do not think it would work well in our experimental setup using acute slice preparation, as it strictly requires intact cells. Slicing generates damaged cells, which would take up the surface biotin reagents. This would cause unspecific biotinylation of the damaged cells, leading to a strong background signal in the assay.

      In Figure 4 panels D and E the baselines are increasing substantially prior to induction. I appreciate that long stable baselines with timing-dependent plasticity may not be possible but it's hard to conclude what happened tens of minutes later when the baseline only appears stable for a minute or two. Panels A and B show that relatively stable baselines are achievable.

      We agree with the Reviewer that the baselines are increasing, however, when looking at the baseline for 5 minutes prior to induction (5 last datapoints of the baseline), which is what we used for quantification, the baselines appeared stable. Unfortunately, longer baselines are not suitable for timing-dependent plasticity. In addition, all experiments were carried out with a control pathway which showed stable conditions throughout the recording.

      In general, the discussion could be better integrated with the current literature. Their experiments are in line with a substantial body of literature that has identified two forms of LTP, based on these signalling cascades, using more conventional induction patterns.

      We thank the Reviewer for this suggestion and have added more discussion of the two forms of LTP in the Discussion section.

      It would be helpful to include the drug concentrations when first described in the results.

      Drug concentration have now been included in the Results section.

      It is now more common to include absolute t values (not just <0.05 etc).

      While we indicate significance in Figures using asterisks when p values are below the indicated significance levels, we report absolute values of p and t values in the Results section.

      Similarly full blots should be added to an appendix / made available.

      We have now included full blot images in Supplementary Figure S3.

      A 30% tolerance for series resistance seems generous to me. (10-20% would be more typical).

      We thank the Reviewer for their suggestion, and will keep this in mind for future studies. However, the error introduced by the higher tolerance level is likely to be small and would not influence any of the qualitative conclusions of the manuscript.

      Whereas series resistance is of course extremely important in voltage-clamp experiments, changes in series resistance would be less of a concern in current-clamp recordings of synaptic events. We use the amplifier as a voltage follower, and there are two problems with changes in the electrode, or access, resistance. First, there is the voltage drop across the electrode resistance. Clearly this error is zero if no current is injected and is also negligible for the currents we use in our experiments to maintain the membrane voltage at -70 mV. For example, the voltage drop would be 0.2 mV for 20 pA current through a typical 10 MOhm electrode resistance, and a change in resistance of 30% would give less than 0.1 mV voltage change even if the resistance were not compensated. The second problem is distortion of the EPSP shape due to the low-pass filtering properties of the electrode set up by the pipette capacitance and series resistance (RC). This can be a significant problem for fast events, such as action potentials, but less of a problem for the relatively slow EPSPs recorded in pyramidal cells. Nevertheless, we take on board the advice provided by the Reviewer and will use the conventional tolerance of 20% in future experiments.

      Reviewer #3 (Recommendations For The Authors):

      In the references, the entry for Burnashev N et al. has a different font size. Please ensure that all references are formatted consistently.

      We thank the Reviewer for spotting this and have updated the font size of this reference.

    1. Author response:

      eLife Assessment

      Birdsong production depends on precise neural sequences in a vocal motor nucleus HVC. In this useful biophysical model, Daou and colleagues identify specific biophysical parameters that result in sparse neural sequences observed in vivo. While the model is presently incomplete because it is overfit to produce sequences and therefore not robust to real biological variation, the model has the potential to address some outstanding issues in HVC function.

      We are grateful for the extensive supportive comments from the reviewers, including broad, strong appreciation of the novel aspects of our manuscript. We believe these will be only strengthened in the next submission.

      Public Reviews:

      Reviewer #1 (Public review):

      Summary:

      The paper presents a model for sequence generation in the zebra finch HVC, which adheres to cellular properties measured experimentally. However, the model is fine-tuned and exhibits limited robustness to noise inherent in the inhibitory interneurons within the HVC, as well as to fluctuations in connectivity between neurons. Although the proposed microcircuits are introduced as units for sub-syllabic segments (SSS), the backbone of the network remains a feedforward chain of HVC_RA neurons, similar to previous models.

      Strengths:

      The model incorporates all three of the major types of HVC neurons. The ion channels used and their kinetics are based on experimental measurements. The connection patterns of the neurons are also constrained by the experiments.

      Weaknesses:

      The model is described as consisting of micro-circuits corresponding to SSS. This presentation gives the impression that the model's structure is distinct from previous models, which connected HVC_RA neurons in feedforward chain networks (Jin et al 2007, Li & Greenside, 2006; Long et al 2010; Egger et al 2020). However, the authors implement single HVC_RA neurons into chain networks within each micro-circuit and then connect the end of the chain to the start of the chain in the subsequent micro-circuit. Thus, the HVC_RA neuron in their model forms a single-neuron chain. This structure is essentially a simplified version of earlier models.

      In the model of the paper, the chain network drives the HVC_I and HVC_X neurons. The role of the micro-circuits is more significant in organizing the connections: specifically, from HVC_RA neurons to HVC_I neurons, and from HVC_I neurons to both HVC_X and HVC_RA neurons.

      We thank Reviewer 1 for their thoughtful comments.

      While the reviewer is correct about the fact that the propagation of sequential activity in this model is primarily carried by HVC<sub>RA</sub> neurons in a feed-forward manner, we need to emphasize that this is true only if there is no intrinsic or synaptic perturbation to the HVC network. For example, we showed in Figures 10 and 12 how altering the intrinsic properties of HVC<sub>X</sub> neurons or for interneurons disrupts sequence propagation. In other words, while HVC<sub>RA</sub> neurons are the key forces to carry the chain forward, the interplay between excitation and inhibition in our network as well as the intrinsic parameters for all classes of HVC neurons are equally important forces in carrying the chain of activity forward. Thus, the stability of activity propagation necessary for song production depend on a finely balanced network of HVC neurons, with all classes contributing to the overall dynamics. Moreover, all existing models that describe premotor sequence generation in the HVC either assume a distributed model (Elmaleh et al., 2021) that dictates that local HVC circuitry is not sufficient to advance the sequence but rather depends upon momentto-moment feedback through Uva (Hamaguchi et al., 2016), or assume models that rely on intrinsic connections within HVC to propagate sequential activity. In the latter case, some models assume that HVC is composed of multiple discrete subnetworks that encode individual song elements (Glaze & Troyer, 2013; Long & Fee, 2008; Wang et al., 2008), but lacks the local connectivity to link the subnetworks, while other models assume that HVC may have sufficient information in its intrinsic connections to form a single continuous network sequence (Long et al. 2010). The HVC model we present extends the concept of a feedforward network by incorporating additional neuronal classes that influence the propagation of activity (interneurons and HVC<sub>X</sub> neurons). We have shown that any disturbance of the intrinsic or synaptic conductances of these latter neurons will disrupt activity in the circuit even when HVC<sub>RA</sub> neurons properties are maintained.

      In regard to the similarities between our model and earlier models, several aspects of our model distinguish it from prior work. In short, while several models of how sequence is generated within HVC have been proposed (Cannon et al., 2015; Drew & Abbott, 2003; Egger et al., 2020; Elmaleh et al., 2021; Galvis et al., 2018; Gibb et al., 2009a, 2009b; Hamaguchi et al., 2016; Jin, 2009; Long & Fee, 2008; Markowitz et al., 2015), all the models proposed either rely on intrinsic HVC circuitry to propagate sequential activity, rely on extrinsic feedback to advance the sequence or rely on both. These models do not capture the complex details of spike morphology, do not include the right ionic currents, do not incorporate all classes of HVC neurons, or do not generate realistic firing patterns as seen in vivo. Our model is the first biophysically realistic model that incorporates all classes of HVC neurons and their intrinsic properties. We tuned the intrinsic and the synaptic properties bases on the traces collected by Daou et al. (2013) and Mooney and Prather (2005) as shown in Figure 3. The three classes of model neurons incorporated to our network as well as the synaptic currents that connect them are based on HodgkinHuxley formalisms that contain ion channels and synaptic currents which had been pharmacologically identified. This is an advancement over prior models that primarily focused on the role of synaptic interactions or external inputs. The model is based on a feedforward chain of microcircuits that encode for the different sub-syllabic segments and that interact with each other through structured feedback inhibition, defining an ordered sequence of cell firing. Moreover, while several models highlight the critical role of inhibitory interneurons in shaping the timing and propagation of bursts of activity in HVC<sub>RA</sub> neurons, our work offers an intricate and comprehensive model that help understand this critical role played by inhibition in shaping song dynamics and ensuring sequence propagation.

      How useful is this concept of micro-circuits? HVC neurons fire continuously even during the silent gaps. There are no SSS during these silent gaps.

      Regarding the concern about the usefulness of the 'microcircuit' concept in our study, we appreciate the comment and we are glad to clarify its relevance in our network. While we acknowledge that HVC<sub>RA</sub> neurons interconnect microcircuits, our model's dynamics are still best described within the framework of microcircuitry particularly due to the firing behavior of HVC<sub>X</sub> neurons and interneurons. Here, we are referring to microcircuits in a more functional sense, rather than rigid, isolated spatial divisions (Cannon et al. 2015). A microcircuit in our model reflects the local rules that govern the interaction between all HVC neuron classes within the broader network, and that are essential for proper activity propagation. For example, HVC<sub>INT</sub> neurons belonging to any microcircuit burst densely and at times other than the moments when the corresponding encoded SSS is being “sung”. What makes a particular interneuron belong to this microcircuit or the other is merely the fact that it cannot inhibit HVC<sub>RA</sub> neurons that are housed in the microcircuit it belongs to. In particular, if HVC<sub>INT</sub> inhibits HVC<sub>RA</sub> in the same microcircuit, some of the HVC<sub>RA</sub> bursts in the microcircuit might be silenced by the dense and strong HVC<sub>INT</sub> inhibition breaking the chain of activity again. Similarly, HVC<sub>X</sub> neurons were selected to be housed within microcircuits due to the following reason: if an HVC<sub>X</sub> neuron belonging to microcircuit i sends excitatory input to an HVC<sub>INT</sub> neuron in microcircuit j, and that interneuron happens to select an HVC<sub>RA</sub> neuron from microcircuit i, then the propagation of sequential activity will halt, and we’ll be in a scenario similar to what was described earlier for HVC<sub>INT</sub> neurons inhibiting HVC<sub>RA</sub> neurons in the same microcircuit.

      We agree that there are no sub-syllabic segments described during the silent gaps and we thank the reviewer to pointing this out. Although silent gaps are integral to the overall process of song production, we have not elaborated on them in this model due to the lack of a clear, biophysically grounded representation for the gaps themselves at the level of HVC. Our primary focus has been on modeling the active, syllable-producing phases of the song, where the HVC network’s sequential dynamics are critical for song. However, one can think the encoding of silent gaps via similar mechanisms that encode SSSs, where each gap is encoded by similar microcircuits comprised of the three classes of HVC neurons (let’s called them GAP rather than SSS) that are active only during the silent gaps. In this case, the propagation of sequential activity is carried throughout the GAPs from the last SSS of the previous syllable to the first SSS of the subsequent syllable. We’ll make sure to emphasize this mechanism more in the revised version of the manuscript.

      A significant issue of the current model is that the HVC_RA to HVC_RA connections require fine-tuning, with the network functioning only within a narrow range of g_AMPA (Figure 2B). Similarly, the connections from HVC_I neurons to HVC_RA neurons also require fine-tuning. This sensitivity arises because the somatic properties of HVC_RA neurons are insufficient to produce the stereotypical bursts of spikes observed in recordings from singing birds, as demonstrated in previous studies (Jin et al 2007; Long et al 2010). In these previous works, to address this limitation, a dendritic spike mechanism was introduced to generate an intrinsic bursting capability, which is absent in the somatic compartment of HVC_RA neurons. This dendritic mechanism significantly enhances the robustness of the chain network, eliminating the need to fine-tune any synaptic conductances, including those from HVC_I neurons (Long et al 2010).

      Why is it important that the model should NOT be sensitive to the connection strengths?

      We thank the reviewer for the comment. While mathematical models designed for highly complex nonlinear biological processes tangentially touch the biological realism, the current network as is right now is the first biologically realistic-enough network model designed for HVC that explains sequence propagation. We do not include dendritic processes in our network although that increases the realistic dynamics for various reasons. 1) The ion channels we integrated into the somatic compartment are known pharmacologically (Daou et al. 2013), but we don’t know about the dendritic compartment’s intrinsic properties of HVC neurons and the cocktail of ion channels that are expressed there. 2) We are able to generate realistic bursting in HVC<sub>RA</sub> neurons despite the single compartment, and the main emphasis in this network is on the interactions between excitation and inhibition, the effects of ion channels in modulating sequence propagation, etc. 3) The network model already incorporates thousands of ODEs that govern the dynamics of each of the HVC neurons, so we did not want to add more complexity to the network especially that we don’t know the biophysical properties of the dendritic compartments.

      Therefore, our present focus is on somatic dynamics and the interaction between HVC<sub>RA</sub> and HVC<sub>INT</sub> neurons, but we acknowledge the importance of these processes in enhancing network resiliency. Although we agree that adding dendritic processes improves robustness, we still think that somatic processes alone can offer insightful information on the sequential dynamics of the HVC network. While the network should be robust across a wide range of parameters, it is also essential that certain parameters are designed to filter out weaker signals, ensuring that only reliable, precise patterns of activity propagate. Hence, we specifically chose to make the HVC<sub>RA</sub>-to-HVC<sub>RA</sub> excitatory connections more sensitive (narrow range of values) such that only strong, precise and meaningful stimuli can propagate through the network representing the high stereotypy and precision seen in song production.

      First, the firing of HVC_I neurons is highly noisy and unreliable. HVC_I neurons fire spontaneous, random spikes under baseline conditions. During singing, their spike timing is imprecise and can vary significantly from trial to trial, with spikes appearing or disappearing across different trials. As a result, their inputs to HVC_RA neurons are inherently noisy. If the model relies on precisely tuned inputs from HVC_I neurons, the natural fluctuations in HVC_I firing would render the model non-functional. The authors should incorporate noisy HVC_I neurons into their model to evaluate whether this noise would render the model non-functional.

      We acknowledge that under baseline and singing settings, interneurons fire in an extremely noisy and inaccurate manner, although they exhibit time locked episodes in their activity (Hahnloser et al 2002, Kozhinikov and Fee 2007). In order to mimic the biological variability of these neurons, our model does, in fact, include a stochastic current to reflect the intrinsic noise and random variations in interneuron firing shown in vivo (and we highlight this in the Methods). If necessary and to make sure the network is resilient to this randomness in interneuron firing, we will investigate different approaches to enhance the noise representation even further and check its effect on sequence propagation.

      Second, Kosche et al. (2015) demonstrated that reducing inhibition by suppressing HVC_I neuron activity makes HVC_RA firing less sparse but does not compromise the temporal precision of the bursts. In this experiment, the local application of gabazine should have severely disrupted HVC_I activity. However, it did not affect the timing precision of HVC_RA neuron firing, emphasizing the robustness of the HVC timing circuit. This robustness is inconsistent with the predictions of the current model, which depends on finely tuned inputs and should, therefore, be vulnerable to such disruptions.

      We thank the reviewer for the comment. The differences between the Kosche et al. (2015) findings and the predictions of our model arise from differences in the aspect of HVC function we are modeling. Our model is more sensitive to inhibition, which is a designed mechanism for achieving precise song patterning. This is a modeling simplification we adopted to capture specific characteristics of HVC function. Hence, Kosche et al. (2015) findings do not invalidate the approach of our model, but highlights that HVC likely operates with several, redundant mechanisms that overall ensure temporal precision.Nevertheless, we will investigate further the effects of the degree of inhibition on song patterning.

      Third, the reliance on fine-tuning of HVC_RA connections becomes problematic if the model is scaled up to include groups of HVC_RA neurons forming a chain network, rather than the single HVC_RA neurons used in the current work. With groups of HVC_RA neurons, the summation of presynaptic inputs to each HVC_RA neuron would need to be precisely maintained for the model to function. However, experimental evidence shows that the HVC circuit remains functional despite perturbations, such as a few degrees of cooling, micro-lesions, or turnover of HVC_RA neurons. Such robustness cannot be accounted for by a model that depends on finely tuned connections, as seen in the current implementation.

      Our model of individual HVC<sub>RA</sub> neurons and as stated previously is reductive model that focuses on understanding the mechanisms that govern sequential neural activity. We agree that scaling the model to include many of HVC<sub>RA</sub> neurons poses challenges, specifically concerning the summation of presynaptic inputs. However, our model can still be adapted to a larger network without requiring the level of fine-tuning currently needed. In fact, the current fine-tuning of synaptic connections in the model is a reflection of fundamental network mechanisms rather than a limitation when scaling to a larger network. Besides, one important feature of this neural network is redundancy. Even if some neurons or synaptic connections are impaired, other neurons or pathways can compensate for these changes, allowing the activity propagation to remain intact.

      The authors examined how altering the channel properties of neurons affects the activity in their model. While this approach is valid, many of the observed effects may stem from the delicate balancing required in their model for proper function.

      In the current model, HVC_X neurons burst as a result of rebound activity driven by the I_H current. Rebound bursts mediated by the I_H current typically require a highly hyperpolarized membrane potential. However, this mechanism would fail if the reversal potential of inhibition is higher than the required level of hyperpolarization. Furthermore, Mooney (2000) demonstrated that depolarizing the membrane potential of HVC_X neurons did not prevent bursts of these neurons during forward playback of the bird's own song, suggesting that these bursts (at least under anesthesia, which may be a different state altogether) are not necessarily caused by rebound activity. This discrepancy should be addressed or considered in the model.

      In our HVC network model, one goal with HVC<sub>X</sub> neurons is to generate bursts in their underlying neuron population. Since HVC<sub>X</sub> neurons in our model receive only inhibitory inputs from interneurons, we rely on inhibition followed by rebound bursts orchestrated by the IH and the I<sub>CaT</sub> currents to achieve this goal. The interplay between the T-type Ca<sup>++</sup> current and the H current in our model is fundamental to generate their corresponding bursts, as they are sufficient for producing the desired behavior in the network. Due to this interplay, we do not need significant inhibition to generate rebound bursts, because the T-type Ca<sup>++</sup> current’s conductance can be stronger leading to robust rebound bursting even when the degree of inhibition is not very strong. We will highlight this with more clarity in the revised version.

      Some figures contain direct copies of figures from published papers. It is perhaps a better practice to replace them with schematics if possible.

      We will replace the relevant figures with schematic representations where possible.

      Reviewer #2 (Public review):

      Summary:

      In this paper, the authors use numerical simulations to try to understand better a major experimental discovery in songbird neuroscience from 2002 by Richard Hahnloser and collaborators. The 2002 paper found that a certain class of projection neurons in the premotor nucleus HVC of adult male zebra finch songbirds, the neurons that project to another premotor nucleus RA, fired sparsely (once per song motif) and precisely (to about 1 ms accuracy) during singing.

      The experimental discovery is important to understand since it initially suggested that the sparsely firing RA-projecting neurons acted as a simple clock that was localized to HVC and that controlled all details of the temporal hierarchy of singing: notes, syllables, gaps, and motifs. Later experiments suggested that the initial interpretation might be incomplete: that the temporal structure of adult male zebra finch songs instead emerged in a more complicated and distributed way, still not well understood, from the interaction of HVC with multiple other nuclei, including auditory and brainstem areas. So at least two major questions remain unanswered more than two decades after the 2002 experiment: What is the neurobiological mechanism that produces the sparse precise bursting: is it a local circuit in HVC or is it some combination of external input to HVC and local circuitry?

      And how is the sparse precise bursting in HVC related to a songbird's vocalizations?

      The authors only investigate part of the first question, whether the mechanism for sparse precise bursts is local to HVC. They do so indirectly, by using conductance-based Hodgkin-Huxley-like equations to simulate the spiking dynamics of a simplified network that includes three known major classes of HVC neurons and such that all neurons within a class are assumed to be identical. A strength of the calculations is that the authors include known biophysically deduced details of the different conductances of the three major classes of HVC neurons, and they take into account what is known, based on sparse paired recordings in slices, about how the three classes connect to one another. One weakness of the paper is that the authors make arbitrary and not well-motivated assumptions about the network geometry, and they do not use the flexibility of their simulations to study how their results depend on their network assumptions. A second weakness is that they ignore many known experimental details such as projections into HVC from other nuclei, dendritic computations (the somas and dendrites are treated by the authors as point-like isopotential objects), the role of neuromodulators, and known heterogeneity of the interneurons. These weaknesses make it difficult for readers to know the relevance of the simulations for experiments and for advancing theoretical understanding.

      Strengths:

      The authors use conductance-based Hodgkin-Huxley-like equations to simulate spiking activity in a network of neurons intended to model more accurately songbird nucleus HVC of adult male zebra finches. Spiking models are much closer to experiments than models based on firing rates or on 2-state neurons.

      The authors include information deduced from modeling experimental current-clamp data such as the types and properties of conductances. They also take into account how neurons in one class connect to neurons in other classes via excitatory or inhibitory synapses, based on sparse paired recordings in slices by other researchers.

      The authors obtain some new results of modest interest such as how changes in the maximum conductances of four key channels (e.g., A-type K<sup>+</sup> currents or Ca-dependent K<sup>+</sup> currents) influence the structure and propagation of bursts, while simultaneously being able to mimic accurately current-clamp voltage measurements.

      Weaknesses:

      One weakness of this paper is the lack of a clearly stated, interesting, and relevant scientific question to try to answer. In the introduction, the authors do not discuss adequately which questions recent experimental and theoretical work have failed to explain adequately, concerning HVC neural dynamics and its role in producing vocalizations. The authors do not discuss adequately why they chose the approach of their paper and how their results address some of these questions.

      For example, the authors need to explain in more detail how their calculations relate to the works of Daou et al, J. Neurophys. 2013 (which already fitted spiking models to neuronal data and identified certain conductances), to Jin et al J. Comput. Neurosci. 2007 (which already discussed how to get bursts using some experimental details), and to the rather similar paper by E. Armstrong and H. Abarbanel, J. Neurophys 2016, which already postulated and studied sequences of microcircuits in HVC. This last paper is not even cited by the authors.

      We thank the reviewer for this valuable comment, and we agree that we did not clarify enough throughout the paper the utility of our model or how it advanced our understanding of the HVC dynamics and circuitry. To that end, we will revise several places of the manuscript and make sure to cite and highlight the relevance and relatedness of the mentioned papers.

      In short, and as mentioned to Reviewer 1, while several models of how sequence is generated within HVC have been proposed (Cannon et al., 2015; Drew & Abbott, 2003; Egger et al., 2020; Elmaleh et al., 2021; Galvis et al., 2018; Gibb et al., 2009a, 2009b; Hamaguchi et al., 2016; Jin, 2009; Long & Fee, 2008; Markowitz et al., 2015; Jin et al., 2007), all the models proposed either rely on intrinsic HVC circuitry to propagate sequential activity, rely on extrinsic feedback to advance the sequence or rely on both. These models do not capture the complex details of spike morphology, do not include the right ionic currents, do not incorporate all classes of HVC neurons, or do not generate realistic firing patterns as seen in vivo. Our model is the first biophysically realistic model that incorporates all classes of HVC neurons and their intrinsic properties.

      No existing hypothesis had been challenged with our model, rather; our model is a distillation of the various models that’s been proposed for the HVC network. We go over this in detail in the Discussion. We believe that the network model we developed provide a step forward in describing the biophysics of HVC circuitry, and may throw a new light on certain dynamics in the mammalian brain, particularly the motor cortex and the hippocampus regions where precisely-timed sequential activity is crucial. We suggest that temporally-precise sequential activity may be a manifestation of neural networks comprised of chain of microcircuits, each containing pools of excitatory and inhibitory neurons, with local interplay among neurons of the same microcircuit and global interplays across the various microcircuits, and with structured inhibition as well as intrinsic properties synchronizing the neuronal pools and stabilizing timing within a firing sequence.

      The authors' main achievement is to show that simulations of a certain simplified and idealized network of spiking neurons, which includes some experimental details but ignores many others, match some experimental results like current-clamp-derived voltage time series for the three classes of HVC neurons (although this was already reported in earlier work by Daou and collaborators in 2013), and simultaneously the robust propagation of bursts with properties similar to those observed in experiments. The authors also present results about how certain neuronal details and burst propagation change when certain key maximum conductances are varied.

      However, these are weak conclusions for two reasons. First, the authors did not do enough calculations to allow the reader to understand how many parameters were needed to obtain these fits and whether simpler circuits, say with fewer parameters and simpler network topology, could do just as well. Second, many previous researchers have demonstrated robust burst propagation in a variety of feed-forward models. So what is new and important about the authors' results compared to the previous computational papers?

      A major novelty of our work is the incorporation of experimental data with detailed network models. While earlier works have established robust burst propagation, our model uses realistic ion channel kinetics and feedback inhibition not only to reproduce experimental neural activity patterns but also to suggest prospective mechanisms for song sequence production in the most biophysical way possible. This aspect that distinguishes our work from other feed-forward models. We go over this in detail in the Discussion. However, the reviewer is right regarding the details of the calculations conducted for the fits, we will make sure to highlight this in the Methods and throughout the manuscript with more details.

      We believe that the network model we developed provide a step forward in describing the biophysics of HVC circuitry, and may throw a new light on certain dynamics in the mammalian brain, particularly the motor cortex and the hippocampus regions where precisely-timed sequential activity is crucial. We suggest that temporally-precise sequential activity may be a manifestation of neural networks comprised of chain of microcircuits, each containing pools of excitatory and inhibitory neurons, with local interplay among neurons of the same microcircuit and global interplays across the various microcircuits, and with structured inhibition as well as intrinsic properties synchronizing the neuronal pools and stabilizing timing within a firing sequence.

      Also missing is a discussion, or at least an acknowledgment, of the fact that not all of the fine experimental details of undershoots, latencies, spike structure, spike accommodation, etc may be relevant for understanding vocalization. While it is nice to know that some models can match these experimental details and produce realistic bursts, that does not mean that all of these details are relevant for the function of producing precise vocalizations. Scientific insights in biology often require exploring which of the many observed details can be ignored and especially identifying the few that are essential for answering some questions. As one example, if HVC-X neurons are completely removed from the authors' model, does one still get robust and reasonable burst propagation of HVC-RA neurons? While part of the nucleus HVC acts as a premotor circuit that drives the nucleus RA, part of HVC is also related to learning. It is not clear that HVC-X neurons, which carry out some unknown calculation and transmit information to area X in a learning pathway, are relevant for burst production and propagation of HVC<sub>RA</sub> neurons, and so relevant for vocalization. Simulations provide a convenient and direct way to explore questions of this kind.

      One key question to answer is whether the bursting of HVC-RA projection neurons is based on a mechanism local to HVC or is some combination of external driving (say from auditory nuclei) and local circuitry. The authors do not contribute to answering this question because they ignore external driving and assume that the mechanism is some kind of intrinsic feed-forward circuit, which they put in by hand in a rather arbitrary and poorly justified way, by assuming the existence of small microcircuits consisting of a few HVC-RA, HVC-X, and HVC-I neurons that somehow correspond to "sub-syllabic segments". To my knowledge, experiments do not suggest the existence of such microcircuits nor does theory suggest the need for such microcircuits.

      Recent results showed a tight correlation between the intrinsic properties of neurons and features of song (Daou and Margoliash 2020, Medina and Margoliash 2024), where adult birds that exhibit similar songs tend to have similar intrinsic properties. While this is relevant, we acknowledge that not all details may be necessary for every aspect of vocalization, and future models could simplify concentrate on core dynamics and exclude certain features while still providing insights into the primary mechanisms.

      The question of whether HVC<sub>X</sub> neurons are relevant for burst propagation given that our model includes these neurons as part of the network for completeness, the reviewer is correct, the propagation of sequential activity in this model is primarily carried by HVC<sub>RA</sub> neurons in a feed-forward manner, but only if there is no perturbation to the HVC network. For example, we have shown how altering the intrinsic properties of HVC<sub>X</sub> neurons or for interneurons disrupts sequence propagation. In other words, while HVC neurons are the key forces to carry the chain forward, the interplay between excitation and inhibition in our network as well as the intrinsic parameters for all classes of HVC neurons are equally important forces in carrying the chain of activity forward. Thus, the stability of activity propagation necessary for song production depend on a finely balanced network of HVC neurons, with all classes contributing to the overall dynamics.

      We agree with the reviewer however that a potential drawback of our model is that its sole focus is on local excitatory connectivity within the HVC (Kornfeld et al., 2017; Long et al., 2010), while HVC neurons receive afferent excitatory connections (Akutagawa & Konishi, 2010; Nottebohm et al., 1982) that plays significant roles in their local dynamics. For example, the excitatory inputs that HVC neurons receive from Uvaeformis may be crucial in initiating (Andalman et al., 2011; Danish et al., 2017; Galvis et al., 2018) or sustaining (Hamaguchi et al., 2016) the sequential activity. While we acknowledge this limitation, our main contribution in this work is the biophysical insights onto how the patterning activity in HVC is largely shaped by the intrinsic properties of the individual neurons as well as the synaptic properties where excitation and inhibition play a major role in enabling neurons to generate their characteristic bursts during singing. This is true and holds irrespective of whether an external drive is injected onto the microcircuits or not. We will however elaborate on and investigate this more during the next submission.

      Another weakness of this paper is an unsatisfactory discussion of how the model was obtained, validated, and simulated. The authors should state as clearly as possible, in one location such as an appendix, what is the total number of independent parameters for the entire network and how parameter values were deduced from data or assigned by hand. With enough parameters and variables, many details can be fit arbitrarily accurately so researchers have to be careful to avoid overfitting. If parameter values were obtained by fitting to data, the authors should state clearly what the fitting algorithm was (some iterative nonlinear method, whose results can depend on the initial choice of parameters), what the error function used for fitting (sum of least squares?) was, and what data were used for the fitting.

      The authors should also state clearly the dynamical state of the network, the vector of quantities that evolve over time. (What is the dimension of that vector, which is also the number of ordinary differential equations that have to be integrated?) The authors do not mention what initial state was used to start the numerical integrations, whether transient dynamics were observed and what were their properties, or how the results depended on the choice of the initial state. The authors do not discuss how they determined that their model was programmed correctly (it is difficult to avoid typing errors when writing several pages or more of a code in any language) or how they determined the accuracy of the numerical integration method beyond fitting to experimental data, say by varying the time step size over some range or by comparing two different integration algorithms.

      We thank the reviewer again. The fitting process in our model occurred only at the first stage where the synaptic parameters were fit to the Mooney and Prather as well as the Kosche results. There was no data shared and we merely looked at the figures in those papers and checked the amplitude of the elicited currents, the magnitudes of DC-evoked excitations etc, and we replicated that in our model. While this is suboptimal, it was better for us to start with it rather than simply using equations for synaptic currents from the literature for other types of neurons (that are not even HVC’s or in the songbird) and integrate them into our network model. However, we will certainly highlight the details of this fitting process in the new submission. We will also highlight more technical details in the Methods regarding the exact number of ODEs, the initial conditions to run them, etc.

      Also disappointing is that the authors do not make any predictions to test, except rather weak ones such as that varying a maximum conductance sufficiently (which might be possible by using dynamic clamps) might cause burst propagation to stop or change its properties. Based on their results, the authors do not make suggestions for further experiments or calculations, but they should.

      We agree that making experimental testable predictions is crucial for the advancement of the model. Our predictions include testing whether eradication of a class of neurons such as HVC<sub>X</sub> neurons disrupts activity propagation which can be done through targeted neuron elimination. This also can be done through preventing rebound bursting in HVC<sub>X</sub> by pharmacologically blocking the I<sub>h</sub> channels. Others include down regulation of certain ion channels (pharmacologically done through ion blockers) and testing which current is fundamental for song production (and there a plenty of test based our results, like the SK current, the T-type Ca<sup>++</sup> current, the A-type K<sup>+</sup> current, etc). We will incorporate these into the revised manuscript to better demonstrate the model's applicability and to guide future research directions.

    1. Author response:

      Public Reviews:

      Reviewer #1 (Public review):

      Summary:

      Structural colors (SC) are based on nanostructures reflecting and scattering light and producing optical wave interference. All kinds of living organisms exhibit SC. However, understanding the molecular mechanisms and genes involved may be complicated due to the complexity of these organisms. Hence, bacteria that exhibit SC in colonies, such as Flavobacterium IR1, can be good models.

      Based on previous genomic mining and co-occurrence with SC in flavobacterial strains, this article focuses on the role of a specific gene, moeA, in SC of Flavobacterium IR1 strain colonies on an agar plate. moeA is involved in the synthesis of the molybdenum cofactor, which is necessary for the activity of key metabolic enzymes in diverse pathways.

      The authors clearly showed that the absence of moeA shifts SC properties in a way that depends on the nutritional conditions. They further bring evidence that this effect was related to several properties of the colony, all impacted by the moeA mutant: cell-cell organization, cell motility and colony spreading, and metabolism of complex carbohydrates. Hence, by linking SC to a single gene in appearance, this work points to cellular organization (as a result of cell-cell arrangement and motility) and metabolism of polysaccharides as key factors for SC in a gliding bacterium. This may prove useful for designing molecular strategies to control SC in bacterial-based biomaterials.

      Strengths:

      The topic is very interesting from a fundamental viewpoint and has great potential in the field of biomaterials.

      Thank you for your comments.

      The article is easy to read. It builds on previous studies with already established tools to characterize SC at the level of the flavobacterial colony. Experiments are well described and well executed. In addition, the SIBR-Cas method for chromosome engineering in Flavobacteria is the most recent and is a leap forward for future studies in this model, even beyond SC.

      We appreciate these comments.

      Weaknesses:

      The paper appears a bit too descriptive and could be better organized. Some of the results, in particular the proteomic comparison, are not well exploited (not explored experimentally). In my opinion, the problem originates from the difficulty in explaining the link between the absence of moeA and the alterations observed at the level of colony spreading and polysaccharide utilization, and the variation in proteomic content.

      We will look at the organisation of the manuscript carefully in the coming, detailed revision, as suggested. In terms of the proteomics, there are clearly a large number of proteins affected by the moeA deletion. In terms of experimental exploration, we chose spreading, structural colour formation and starch degradation to test phenotypically, as the most relevant. For example, in L615-617, we discuss the downregulation of GldL (which is known to be involved Flavobacterial gliding motility [Shrivastava et al., 2013]) in the _moe_A KO as a possible explanation for the reduced colony spreading of moeA mutant. Changes in polysaccharide (starch) utilization were seen on solid medium, as well as in the proteomic profile where we observed the upregulation of carbohydrate metabolism proteins linked to PUL (polysaccharide utilisation locus) operons (Terrapon et al., 2015), such as PAM95095-90 (Figure 8), and other carbohydrate metabolism-related proteins, including a pectate lyase (Table S7) which is involved in starch degradation (Aspeborg et al., 2012). And as noted in L555-566 and Figure 9, starch metabolism was tested experimentally.

      First, the effect of moeA deletion on molybdenum cofactor synthesis should be addressed.

      MoeA is the last enzyme in the MoCo synthesis pathway, thus if only MoeA is absent the cell would accumulate MPT-AMP (molybdopterin-adenosine monophosphatase) (Iobbi-Nivol & Leimkühler, 2013), and the expressed molybdoenzymes would not be functional. In L582-585, we commented how the lack of molybdenum cofactor may affect the synthesis of molybdoenzymes. However, if you meant to analyse the presence of the small molecules, the cofactors, involved in these pathways, that was an assay we were not able to perform. Moreover, in L585-587, we addressed how the deletion of _moe_A affected the proteins encoded by the rest of genes in the operon.

      Second, as I was reading the entire manuscript, I kept asking myself if moeA (and by extension molybdenum cofactor) was really involved in SC or it was an indirect effect. For example, what if the absence of moeA alters the cell envelope because the synthesis of its building blocks is perturbed, then subsequently perturbates all related processes, including gliding motility and protein secretion? It would help to know if the effects on colony spreading and polysaccharide metabolism can be uncoupled. I don't think the authors discussed that clearly.

      The message of the paper is that the moeA gene, as predicted from a previous genomics analysis, is important in SC. This is based on the representation of the _moe_A gene in genomes of bacteria that display SC. This analysis does not predict the mechanism. When knocked out, a significant change in structural colour occurred, supporting this hypothesis. Whether this effect is direct or indirect is difficult to assess, as this referee rightly suggests. In order to follow up this central result, we performed proteomics (both intra- and extracellular). As we observed, the deletion of a single gene generated many changes in the proteomic profile, thus in the biological processes. Based on the known functions of molybdenum cofactor, we could only hypothesize that pterin metabolism is important for SC, not exactly how.

      We intend to discuss the links between gliding/spreading and polysaccharide metabolism more clearly, with reference to the literature, as quite a bit is known here including possible links to SC.

      Reviewer #2 (Public review):

      Summary:

      The authors constructed an in-frame deletion of moeA gene, which is involved in molybdopterin cofactor (MoCo) biosynthesis, and investigated its role in structural colors in Flavobacterium IR1. The deletion of moeA shifted colony color from green to blue, reduced colony spreading, and increased starch degradation, which was attributed to the upregulation of various proteins in polysaccharide utilization loci. This study lays the ground for developing new colorants by modifying genes involved in structural colors.

      Major strengths and weaknesses:

      The authors conducted well-designed experiments with appropriate controls and the results in the paper are presented in a logical manner, which supports their conclusions.

      We appreciate your comment.

      Using statistical tests to compare the differences between the wild type and moeA mutant, and adding a significance bar in Figure 4B, would strengthen their claims on differences in cell motility regarding differences in cell motility.

      Thank you. Figure 4B contains the significance bars that represent the standard deviation of the mean value of the three replicates, but we will modify it to make them more clear.

      Additionally, in the result section (Figure 6), the authors suggest that the shift in blue color is "caused by cells which are still highly ordered but narrower", which to my knowledge is not backed up by any experimental evidence.

      Thanks. We mentioned that the mutant cells are narrower than the wild type based on the estimated periodicity resulting from the goniometry analysis (L427-430). We will now say “likely to be narrower based on the estimated periodicity from the optical analysis” rather than just “narrower” in the revision.

      Overall, this is a well-written paper in which the authors effectively address their research questions through proper experimentation. This work will help us understand the genetic basis of structural colors in Flavobacterium and open new avenues to study the roles of additional genes and proteins in structural colors.

      Much appreciated.

      REFERENCES

      Aspeborg, Henrik, Pedro M. Coutinho, Yang Wang, Harry Brumer, and Bernard Henrissat. "Evolution, substrate specificity and subfamily classification of glycoside hydrolase family 5 (GH5)." BMC evolutionary biology 12 (2012): 1-16.

      lobbi-Nivol, Chantal, and Silke Leimkühler. "Molybdenum enzymes, their maturation and molybdenum cofactor biosynthesis in Escherichia coli." Biochimica et Biophysica Acta (BBA)-Bioenergetics 1827, no. 8-9 (2013): 1086-1101.

      Shrivastava, Abhishek, Joseph J. Johnston, Jessica M. Van Baaren, and Mark J. McBride. "Flavobacterium johnsoniae GldK, GldL, GldM, and SprA are required for secretion of the cell surface gliding motility adhesins SprB and RemA." Journal of bacteriology 195, no. 14 (2013): 3201-3212.

      Terrapon, Nicolas, Vincent Lombard, Harry J. Gilbert, and Bernard Henrissat. "Automatic prediction of polysaccharide utilization loci in Bacteroidetes species." Bioinformatics 31, no. 5 (2015): 647-655.

    1. Author response:

      The following is the authors’ response to the original reviews.

      eLife assessment

      This important study explored a molecular comparison of smooth muscle and neighboring fibroblast cells found in lung blood vessels afflicted by a disease called pulmonary arterial hypertension. In doing so, the authors described distinct disease-associated states of each of these cell types with further insights into the cellular communication and crosstalk between them. The strength of evidence was convincing through the use of complementary and sophisticated tools, accompanied by rare isolation of human diseased lung blood vessel cells that were source-matched to the same donor for direct comparison.

      We thank the editors and reviewers in their highly positive and encouraging assessment of our manuscript detailing the cell state changes of arterial smooth muscle cells and fibroblasts in the pulmonary bed. We addressed reviewers’ major comments in the revised manuscript by providing validation of key in vitro findings, such as preserved marker localization and increased GAG deposition in IPAH pulmonary arteries. We additionally provide comparison of transcriptomic profiles spanning fresh, very early and late passage cells. Finally, we present expanded experimental data in support of cellular crosstalk, including testing of additional PAAF ligands on donor PASMC and influence of PTX3/HGF on IPAH PASMC.

      Public Reviews:

      Reviewer #1 (Public Review):

      Summary:

      The authors isolated and cultured pulmonary artery smooth muscle cells (PASMC) and pulmonary artery adventitial fibroblasts (PAAF) of the lung samples derived from the patients with idiopathic pulmonary arterial hypertension (PAH) and the healthy volunteers. They performed RNA-seq and proteomics analyses to detail the cellular communication between PASMC and PAAF, which are the main target cells of pulmonary vascular remodeling during the pathogenesis of PAH. The authors revealed that PASMC and PAAF retained their original cellular identity and acquired different states associated with the pathogenesis of PAH, respectively.

      Strengths:

      Although previous studies have shown that PASMC and PAAF cells each have an important role in the pathogenesis of PAH, there have been scarce reports focusing on the interactions between PASMC and PAAF. These findings may provide valuable information for elucidating the pathogenesis of pulmonary arterial hypertension.

      We appreciate the reviewer’s positive view of our study.

      Weaknesses:

      The results of proteome analysis using primary culture cells in this paper seem a bit insufficient to draw conclusions. In particular, the authors described "We elucidated the involvement of cellular crosstalk in regulating cell state dynamics and identified pentraxin-3 and hepatocyte growth factor as modulators of PASMC phenotypic transition orchestrated by PAAF." However, the presented data are considered limited and insufficient.

      We thank the reviewer for drawing our attention to this point and have accordingly modified the conclusion section to read: “We investigated the involvement of cellular crosstalk….” Moreover, we provide further experimental evidence demonstrating the effect of both PTX3 and HGF on cell state marker expression in IPAH-PASMC cells (Figure 7H). In addition, we clarify the selection strategy applied to investigate particular PAAF-secreted ligands and test three additional ligands on donor PASMC (Figure S8), supporting the original focus on PTX3 and HGF.

      Reviewer #2 (Public Review):

      Summary:

      Utilizing a combination of transcriptomic and proteomic profiling as well as cellular phenotyping from source-matched PASMC and PAAFs in IPAH, this study sought to explore a molecular comparison of these cells in order to track distinct cell fate trajectories and acquisition of their IPAH-associated cellular states. The authors also aimed to identify cell-cell communication axes in order to infer mechanisms by which these two cells interact and depend upon external cues. This study will be of interest to the scientific and clinical communities of those interested in pulmonary vascular biology and disease. It also will appeal to those interested in lung and vascular development as well as multi-omic analytic procedures.

      We thank the reviewer for overall highly positive assessment of our study.

      Strengths:

      (1) This is one of the first studies using orthogonal sequencing and phenotyping for the characterization of source-matched neighboring mesenchymal PASMC and PAAF cells in healthy and diseased IPAH patients. This is a major strength that allows for direct comparison of neighboring cell types and the ability to address an unanswered question regarding the nature of these mesenchymal "mural" cells at a precise molecular level.

      We value the reviewer’s kind and objective summary of our study.

      (2) Unlike a number of multi-omic sequencing papers that read more as an atlas of findings without structure, the inherent comparative organization of the study and presentation of the data were valuable in aiding the reader in understanding how to discern the distinct IPAH-associated cell states. As a result, the reader not only gleans greater insight into these two interacting cell types in disease but also now can leverage these datasets more easily for future research questions in this space.

      We thank the reviewer for this highly positive comment.

      (3) There are interesting and surprising findings in the cellular characterizations, including the low proliferative state of IPAH-PASMCs as compared to the hyperproliferative state in IPAH-PAAFs. Furthermore, the cell-cell communication axes involving ECM components and soluble ligands provided by PAAFs that direct cell state dynamics of PASMCs offer some of the first and foundational descriptions of what are likely complex cellular interactions that await discovery.

      We agree with the reviewer’s assessment that some of the novel data in our study helps to formulate testable hypothesis that can be followed through with more focused follow-up research.

      (4) Technical rigor is quite high in the -omics methodology and in vitro phenotyping tools used.

      We are grateful for reviewer’s assessment of our work and positive recognition.

      Weaknesses:

      There are some weaknesses in the methodology that should temper the conclusions:

      (1) The number of donors sampled for PAAF/PASMCs was small for both healthy controls and IPAH patients. Thus, while the level of detail of -omics profiling was quite deep, the generalizability of their findings to all IPAH patients or Group 1 PAH patients is limited.

      We appreciate the reviewers concerns regarding the generalizability of the findings and have acknowledged this as the study limitation in the discussion: “A low case number and end-stage disease samples used for omics characterization represents a study limitation that has to be taken into account before assuming similar findings would be evident in the entire PAH patient population over the course of the disease development and progression”. We have addressed this issue by performing validation of key in vitro findings using fresh cells or assessment of FFPE lung material from additional independent samples in the revised manuscript (Figures 2D, 3D, 3H, 4H). For transparency, we provide biological sample number in the result section of the modified manuscript.

      (2) While the study utilized early passage cells, these cells nonetheless were still cultured outside the in vivo milieu prior to analysis. Thus, while there is an assumption that these cells do not change fundamental behavior outside the body, that is not entirely proven for all transcriptional and proteomic signatures. As such, the major alterations that are noted would be more compelling if validated from tissue or cells derived directly from in vivo sources. Without such validation, the major limitation of the impact and conclusions of the paper is that the full extent of the relevance of these findings to human disease is not known.

      We thank the reviewer for this constructive and excellent suggestion. The comparison of fresh and cultured cells revealed a strong and early divergence of differentially regulated pathways for PAAF, while a more gradual transition for PASMC. The results of this analysis are included in the new Figures 2D, 3D, 3H, and 4H. Implications are discussed in the revised manuscript: “However, the same mechanism renders cells susceptible to phenotypic change induced simply by extended vitro culturing, testified by broad expression profile differences between fresh and cultured cells. This common caveat in cell biology research and represents a technical and practical tradeoff that requires cross validation of key findings. Using a combination of archived lung tissue and available single cell RNA sequencing dataset of human pulmonary arteries, we show that some of the key defining phenotypic features of diseased cells, such as altered proliferation rate and ECM production, are preserved and gradually lost upon prolonged culturing”.

      (3) While the presentation of most of the manuscript was quite clear and convincing, the terminology and conclusions regarding "cell fate trajectories" throughout the manuscript did not seem to be fully justified. That is, all of the analyses were derived from cells originating from end-stage IPAH, and otherwise, the authors were not lineage tracing across disease initiation or development (which would be impossible currently in humans). So, while the description of distinct "IPAH-associated states" makes sense, any true cell fate trajectory was not clearly defined.

      In accordance to reviewer’s comment, we have decided to modify the wording to exclude the “cell fate trajectory” phrase and replace it with “acquisition of disease cell state”.

      Recommendations for the authors:

      Reviewer #1 (Recommendations For The Authors):

      Major comments:

      (1) In Figure 1, PASMC and PAAF were collected from the lungs of healthy donors and analyzed for transcriptomics and proteomics; in Figure 1A, it can be taken as if both cells from IPAH patients were also analyzed, but this is not reflected in the results. In Figure1D, immunostaining of normal lungs confirms the localization of PASMC and PAAF markers found by transcriptomics. The authors describe a strong, but not perfect, correlation between the transcriptomics and proteomics data from Figure S1, but the gene names of each cellular marker they found should also be listed. In addition, the authors have observed the expression of markers characteristic of PASMC and PAAF in pulmonary vessels of healthy subjects by IH, but is there any novelty in these markers? Furthermore, are the expression sites of these markers altered in IPAH patients?

      In the revised manuscript we have adjusted the schematic to reflect the fact that only donor cells are compared in Figure 1. We additionally provide a correlation of cell type markers between proteomic and transcriptomic data sets for those molecules that are detected in both datasets (Figure S1B).

      We provide clarification on the novelty aspect in the result section: “Some of the molecules were previously associated with predominant SMC, such as RGS5 and CSPR1 (Crnkovic et al., 2022; Snider et al., 2008), or adventitial fibroblast, such as SCARA5, CFD and MGST1 (Crnkovic et al., 2022; Sikkema et al., 2023) expression”. Except for RGS5, expression and localization of other markers in IPAH was previously unknown.

      The conservation of expression sites for reported markers was validated in IPAH in the revised manuscript (Figure 2D), with IGFBP5 showing dual localization in both cell types. Moreover, results in Figure 1D, 1E and 2D support the validity of omics findings and preservation of key markers during passaging.

      (2) In Figure 2, the authors compare PASMC and PAAF derived from IPAH patients and donors. The results show that transcriptomics and proteomics changes are clearly differentiated by cell type and not by pathological state. In the pathological state, transcriptional changes are more pronounced. The GO analysis of the factors that showed significant changes in each cell type is shown in Figure 2E, but the differences between the GO analysis of the transcriptomics and proteomics results are not clearly shown. The reviewer believes that the advantages of a combined analysis of both should be indicated. Also, in Figure 2G, the GAG content in PA appears to be elevated in only 3 cases, while the other 5 cases appear to be at the same level as the donor; is there a characteristic change in these 3 cases? Figure 2I shows that the phenotype of PAAF changes with cell passages. Since this phenomenon would be interesting and useful to the reader, additional discussion regarding the mechanism would be desired.

      We have integrated both data sets in order to achieve stronger and meaningful analysis due to weaker and uncomplete correlation between transcriptomic and protein dataset as indicated in the results section: “Comparative analysis of transcriptomic and proteomic data sets revealed a strong, but not complete level of linear correlation between the gene and protein expression profiles (Figure S1B, C). We therefore decided to use an integrative dataset and analyzed all significantly enriched genes and proteins (-log10(P)>1.3) between both cell types to achieve stronger and more robust analysis”. In general, proteomic profile showed fewer significant differences and extent of change was lesser compared with transcriptomics, likely due to technical limitations of the method and sensitivity, testified by the complete lack of top transcriptomic molecules (RGS5, ADH1C, IGFBP5, CFD, SCARA5) in the protein dataset.

      To strengthen the findings of increased GAG in IPAH pulmonary arteries, we have performed compartment-specific, quantitative image analysis of Alcian blue staining on additional donor and patient samples (n=10 for each condition). The new analysis totaling around 40 PA confirmed significantly increased deposition of GAG in IPAH pulmonary arteries.

      We have addressed the issue of phenotypic change with prolonged cell culture in the revised manuscript by systematically comparing enrichment for biological processes between fresh (Crnkovic et al., 2022: GSE210248), very early (this study: GSE255669) and later passage cells (Chelladurai et al., 2022: GSE144932; Gorr et al., 2020: GSE144274). We observed cell type differences in the rate of change of phenotypic features, with PAAF showing faster shift early on during culturing that could for some of the features be due to isolation from immunomodulatory environment or presence of hydrocortisone supplement in the PAAF cell media. These points have been described in the revised results section and mentioned in the discussion.

      (3) The authors claim that one feature of this paper is the use of "very early passage (p1)" of pulmonary artery smooth muscle cells (PASMC). Since there are other existing (previouly reported) data that are publicly available, such as RNA-seq data using cells with 2-4 cell passages, it may be possible to show that fewer passages are better in primary culture by comparing the data presented in this paper.

      Following reviewers’ comments, we have performed systematic comparison (Crnkovic et al., 2022: GSE210248), very early (this study: GSE255669) and later passage cells (Chelladurai et al., 2022: GSE144932; Gorr et al., 2020: GSE144274). in the revised manuscript in order to comprehensively address the issue and define changes occurring as a result of prolonged in vitro conditions (Figure 3H). The results showed that the expression profile of early passage cells retains some of the key phenotypic features displayed by cells in their native environment, with PASMC displaying a more gradual loss of phenotypic characteristics compared to PAAF. Interestingly, PAAF displayed a striking inverse enrichment for inflammatory/NF-kB signaling between fresh and cultured PAAF, which could potentially be caused by the hydrocortisone supplement in the PAAF cell media or due to the isolation from its highly immunomodulatory enviroment. These points have been described in the revised results section and mentioned in the discussion.

      (4) The authors describe a study characterized by decreased expression of "cytoskeletal contractile elements" in pulmonary artery smooth muscle cells (PASMC) derived from patients with IPAH. What are the implications of this result, and does it arise from the use of smooth muscle in patients resistant to pulmonary artery smooth muscle dilating agents? A discussion on this issue needs to be made in a way that is easy for the reader to understand.

      The reviewer raises an interesting point regarding the loss the contractile markers and response to vasodilating therapy. We would speculate that isolated decrease in contractile machinery, without concomitant change in ECM and other PASMC features, would dampen both the contraction and relaxation properties of the single PASMC, affecting not only its response to dilating agents, but also to vasoconstrictors. Clinical consequences and responsiveness to dilating agents are more difficult to predict, since the vasoactive response would additionally depend on mechanical properties of the pulmonary artery defined by cellular and ECM composition. Nevertheless, we believe that decreased expression of contractile machinery reflects an intrinsic, “programmed” response of SMC to remodeling, rather than vasodilator therapy-induced selection pressure, since similar phenotypic change is observed in SMC from systemic circulation and in various animal models without exposure to PAH medication. These considerations have been included in the revised discussion section.

      (5) There are a lot of secreted proteins that increase or decrease in Figure 6G, but there is scant reason to focus on PTX3 and HGF among them. The authors need to elaborate on the above issue.

      We regret the lack of clarity and provide improved explanation of the ligand selection strategy in the revised manuscript. In order to prioritize the potential hits, we first used hierarchical clustering to group co-regulated ligands into smaller number of groups. We then prioritized for the ligands that lacked or had limited information with respect to IPAH. Based on these results, we analyzed the effect of three additional ligands on PASMC cell state marker expression (Figure S8). This additional data supported the initial focus on PTX3 and HGF.

      Minor comments:

      (1) Regarding the number of specimens used in the Result, it would be more helpful to the reader if the number of samples were also mentioned in the text.

      We have included the number of used samples in manuscript text.

      (2) There is no explanation of what R2Y represents in Figure 2B. This reviewer is not able to understand the statistical analysis of Figure 2H. The detailed results should be explained.

      We apologize for the oversight in labeling of Figure 2B and modify the figure legend: “Orthogonal projection to latent structures-discriminant analysis (OPLS-DA) T score plots separating predictive variability (x-axis), attributed to biological grouping, and non-predictive variability (technical/inter-individual, y-axis). Monofactorial OPLS-DA model for separation according to cell type or disease. C) Bifactorial OPLS-DA model considering cell type and disease simultaneously. Ellipse depicting the 95% confidence region, Q2 denoting model’s predictive power (significance: Q2>50%) and R2Y representing proportion of variance in the response variable explained by the model (higher values indicating better fit)”.

      We also modified figure legend wording for the analysis in Figure 2H (new Figure 3E) to clarify the independent factors whose interaction was investigated using 3-way ANOVA: “Interaction effects of stimulation, cell type, and disease state on cellular proliferation were analyzed by 3-way ANOVA. Significant interaction effects are indicated as follows: * for stimulation × cell type interactions and # for cell type × disease state interactions (both *, # p<0.05)”.

      (3) In Figure 3, the authors examined whether there were molecular abnormalities common to IPAH-PASMC and IPAH-PAAF and found that the number of commonly regulated genes and proteins was limited to 47. Further analysis of these regulators by STRING analysis revealed that factors related to the regulation of apoptosis are commonly altered in both cells. On the other hand, the authors focused on mitochondria, as SOD2 is downregulated, and found an increase in ROS production specific to PASMC, indicating that mitochondrial dysfunction is common to PASMC and PAAF in IPAH, but downstream phenomena are different between cell types. Factors associated with apoptosis regulation have been found to be both upward and downward regulated, but the actual occurrence of apoptosis in both cell types has not been addressed.

      We have performed TUNEL staining on FFPE lung tissue from donors and IPAH patients that revealed apoptosis as a rare event in both conditions in PASMC and PAAF. Therefore, no meaningful quantification could be conducted. An example of pulmonary artery where rare positive signal in either PAAF or PASMC could be found is provided in Figure 4H.

      Unfortunately, association of a particular gene with a pathway is by default arbitrary and potentially ambiguous. In particular, factors identified as associated in apoptosis are also involved in regulation of inflammatory signaling (BIRC3, DDIT3) and amino acid metabolism (SHMT1). Nevertheless, mitochondria represent a crucial cellular hub for apoptosis regulation and, as shown in the current study, display significant functional alterations in IPAH in both cell types, aligning with reduced mitochondrial superoxide dismutase (SOD2) expression.

      (4) The meaning of the gray circle in Figure 3C should be clarified. Similarly, the meaning of the color in Fig. 3D should be clearly explained. In Figure 3E-G, each cell is significantly different from 18-61 cells, and the number of each cell and the reason should be described.

      We regret the confusion and provide better explanation of the figure legend: “gray nodes representing their putative upstream regulators”, “with color coding reflecting the IPAH dependent regulation”. In the revised Figure panels 4E-G (old 3E-G) we provide the exact number of cells measured in each condition. Although we tried to have comparable cell confluency at the time of measurement, different proliferation rates between cells from different cell type and condition led to different number of measured cells per donor/patient.

      (5) In Figure 4, the authors focus on factors that vary in different directions between cells, revealing fingerprints of molecular changes that differ between cell types, particularly IPAH-PASMC, which acquires a synthetic phenotype with enhanced regulation of chemotaxis elements, whereas IPAH-PAAF, a fast cycling cell characteristics. Next, focusing on the ECM components that were specifically altered in IPAH-PASMC, Nichenet analysis in Figure 5 suggested that ligands from PAAF may act on PASMC, and the authors focused on integrin signaling to examine ECM contact and changes in cell function. The results indicate that adhesion to laminin is poor in PASMC. Although no difference was observed between donor and IPAH PASMCs, a discussion of the reasons for this would be desired and helpful to the readers.

      Both donor and IPAH PASMCs respond similarly to laminin. However, our key finding is the downregulation of laminin in IPAH PAAF, which likely leads to a skewed laminin-to-collagen ratio and altered ECM composition in remodeled arteries. This shift in the ECM class results in altered PASMC behavior, affecting both donor and IPAH cells similarly. In the revised manuscript, we demonstrate that PASMC largely retain the expression pattern of integrin subunits that serve as high-affinity collagen and laminin receptors, with higher levels compared to PAAF (Figure 6F, G). Furthermore, we speculate that the distinct cellular phenotypic responses to collagen versus laminin coatings may arise from different downstream signaling pathways activated by the various integrin subunits (Nguyen et al., 2000). These considerations have been included in the revised discussion: “The comparable responses of donor and IPAH PASMC likely result from their shared integrin receptor expression profiles. Meanwhile, ECM class switching engages different high-affinity integrin receptors, which activate alternative downstream signaling pathways (Nguyen et al., 2000) and lead to differential responses to collagen and laminin matrices. We thus propose a model in which laminins and collagens act as PAAF-secreted ligands, regulating PASMC behavior through their ECM-sensing integrin receptors.”

      (6) Since Figure 3B and Figure 4A seem to show the same results, why not combine them into one?

      Indeed, these figure panels show the same results, but the focus of the investigations in each Figure is different. We therefore opted to keep the panels separate for better clarity and logical link to other panels in the same figure

      (7) In Figure 6, the interaction analysis of scRNAseq data with respect to signaling between PASMC and PAAF was performed using Nichenet and CellChat, showing that signaling from PAAF to PASMC is biased toward secreted ligands and that a functionally relevant set of soluble ligands is impaired in the IPAH state. From there, they proceeded with co-culture experiments and showed that co-culture healthy PASMC with PAAF of IPAH patients abolished PASMC markers in the healthy state. Furthermore, the authors attempted to identify ligands that induce functional changes in PASMCs produced from IPAH PAAFs and found that HGF is a factor that downregulates the expression of contractile markers in PASMCs. Further insights may be gained by co-culturing IPAH-derived cells in co-culture experiments. Also, no beneficial effect of pentraxin3 was found in Figure 6H. The authors should examine the effect of pentraxin3 on PASMC cells derived from IPAH patients, rather than healthy donors.

      We tested the influence of IPAH-PASMC on donor-PAAF and found no effect on the expression of the selected markers. We thank the reviewer for the suggestion to conduct the experiments on IPAH-PASMC. The new data show that both PTX3 and HGF have a significant effect, but differential effect on IPAH-PASMC as compared to donors-PASMC. Whereas PTX lacks effect on donor PASMC, it leads to downregulation of some of the contractile markers in IPAH PASMC, while HGF upregulates VCAN synthetic marker in IPAH PASMC. These results are now included in Figure 7H.

      Reviewer #2 (Recommendations For The Authors):

      The authors should double-check for grammar and typos in the manuscript. I caught a few such as "therefor" and others, but there could be more.

      We thank the reviewer for the effort and time in reading and evaluating the manuscript. To the best of our knowledge, we have corrected the grammatical errors in the revised manuscript.

    1. Author response:

      The following is the authors’ response to the original reviews.

      Public Reviews:

      Reviewer #1 (Public review):

      (1) Although there are many citations acknowledging relevant previous work, there often isn't a very granular attribution of individual previous findings to their sources. In the results section, it's sometimes ambiguous when the paper is recapping established background and when it is breaking new ground. For example, around equation 8 in the results (sv = r - rho*t), it would be good to refer to previous places where versions of this equation have been presented. Offhand, McNamara 1982 (Theoretical Population Biology) is one early instance and Fawcett et al. 2012 (Behavioural Processes) is a later one. Line 922 of the discussion seems to imply this formulation is novel here.

      We would like to clarify that original manuscript equation 8, , as we derive, is not new, as it is similarly expressed in prior foundational work by McNamara (1982), and we thank the reviewer for drawing our attention to the extension of this form by Fawcett, McNamara, Houston (2012).

      We now so properly acknowledge this foundational work and extension in the results section…

      “This global reward-rate equivalent immediate reward (see Figure 4) is the subjective value of a pursuit, svPursuit (or simply, sv, when the referenced pursuit can be inferred), as similarly expressed in prior foundational work (McNamara 1982), and subsequent extensions (see (Fawcett, McNamara, Houston (2012)).”

      …and in the Discussion section at the location referenced by the reviewer:

      “From it, we re-expressed the pursuit’s worth in terms of its global reward rate-equivalent immediate reward, i.e., its ‘subjective value’, reprising McNamara’s foundational formulation (McNamara 1982).”

      (2) The choice environments that are considered in detail in the paper are very simple. The simplicity facilitates concrete examples and visualizations, but it would be worth further consideration of whether and how the conclusions generalize to more complex environments. The paper considers "forgo" scenario in which the agent can choose between sequences of pursuits like A-B-A-B (engaging with option B at all opportunities, which are interleaved with a default pursuit A) and A-A-A-A (forgoing option B). It considers "choice" scenarios where the agent can choose between sequences like A-B-A-B and A-C-A-C (where B and C are larger-later and smaller-sooner rewards, either of which can be interleaved with the default pursuit). Several forms of additional complexity would be valuable to consider. [A] One would be a greater number of unique pursuits, not repeated identically in a predictable sequence, akin to a prey-selection paradigm. It seems to me this would cause t_out and r_out (the time and reward outside of the focal prospect) to be policy-dependent, making the 'apportionment cost' more challenging to ascertain. Another relevant form of complexity would be if there were [B] variance or uncertainty in reward magnitudes or temporal durations or if [C] the agent had the ability to discontinue a pursuit such as in patch-departure scenarios.

      A) We would like to note that the section “Deriving Optimal Policy from Forgo Decision-making worlds”, addresses the reviewer’s scenario of n-number of pursuits”, each occurring at their own frequency, as in prey selection, not repeating identically in a predictable sequence. Within our subsection “Parceling the world…”, we introduce the concept of dividing a world (such as that) into the considered pursuit type, and everything outside of it. ‘Outside’ would include any number of other pursuits currently part of any policy, as the reviewer intuits, thus making t<sup>out</sup> and r<sup>out</sup> policy dependent. Nonetheless, a process of excluding (forgoing) pursuits by comparing the ‘in’ to the ‘out’ reward rate (section “Reward-rate optimizing forgo policy…”) or its equivalent sv (section “The forgo decision can also be made from subjective value), would iteratively lead to the global reward rate maximizing policy. This manner of parceling into ‘in’ and ‘out’ thus simplifies visualization of what can be complex worlds. Simpler cases that resemble common experimental designs are given in the manuscript to enhance intuition.

      We thank the reviewer for this keen suggestion. We now include example figures (Supplemental 1 & 2) for multi-pursuit worlds which have the same (Supplemental 1) and different pursuit frequencies (Supplemental 2), which illustrate how this evaluation leads to reward-rate optimization. This addition demonstrates how an iterative policy would lead to reward rate maximization and emphasizes how parcellating a world into ‘in’ and ‘out’ of the pursuit type applies and is a useful device for understanding the worth of any given pursuit in more complex worlds. The policy achieving the greatest global reward rate can be realized through an iterative process where pursuits with lower reward rates than the reward rate obtained from everything other than the considered pursuit type are sequentially removed from the policy.

      B) We would also emphasize that the formulation here contends with variance or uncertainty in the reward magnitudes or temporal durations. The ‘in’ pursuit is the average reward and the average time of the considered pursuit type, as is the ‘out’ the average reward and average time outside of the considered pursuit type.

      C) In this work, we consider the worth of initiating one-or-another pursuit (from having completed a prior one), and not the issue of continuing within a pursuit (having already engaged it), as in patch/give-up. Handling worlds in which the agent may depart from within a pursuit, which is to say ‘give-up’ (as in patch foraging), is outside the scope of this work.

      (3) I had a hard time arriving at a solid conceptual understanding of the 'apportionment cost' around Figure 5. I understand the arithmetic, but it would help if it were possible to formulate a more succinct verbal description of what makes the apportionment cost a useful and meaningful quality to focus on.

      We thank the reviewer for pressing for a succinct and intuitive verbal description.

      We added the following succinct verbal description of apportionment cost… “Apportionment cost is the difference in reward that can be expected, on average, between a policy of taking versus a policy of not taking the considered pursuit, over a time equal to its duration.” This definition appears in new paragraphs (as below) describing apportionment cost in the results section “Time’s cost: opportunity & apportionment costs determine a pursuit’s subjective value”, and is accompanied by equations for apportionment cost, and a figure giving its geometric depiction (Figure 5). We also expanded original figure 5 and its legend (so as to illustrate the apportionment scaling factor and the apportionment cost), and its accompanying main text, to further illustrate and clarify apportionment cost, and its relationship to opportunity cost, and time’s cost.

      “What, then, is the amount of reward by which the opportunity cost-subtracted reward is scaled down to equal the sv of the pursuit? This amount is the apportionment cost of time. The apportionment cost of time (height of the brown vertical bar, Figure 5F) is the global reward rate after taking into account the opportunity cost (slope of the magenta-gold dashed line in Figure 5F) times the time of the considered pursuit. Equally, the difference between the inside and outside reward rates, times the time of the pursuit, is the apportionment cost when scaled by the pursuit’s weight, i.e., the fraction that the considered pursuit is to the total time to traverse the world (Equation 9, right hand side). From the perspective of decision-making policies, apportionment cost is the difference in reward that can be expected, on average, between a policy of taking versus a policy of not taking the considered pursuit, over a time equal to its duration (Equation 9 center, Figure 5F).

      Equation 9. Apportionment Cost.

      While this difference is the apportionment cost of time, the opportunity cost of time is the amount that would be expected from a policy of not taking the considered pursuit over a time equal to the considered pursuit’s duration. Together, they sum to Time’s Cost (Figure 5G). Expressing a pursuit’s worth in terms of the global reward rate obtained under a policy of accepting the pursuit type (Figure 5 left column), or from the perspective of the outside reward and time (Figure 5 right column), are equivalent. However, the latter expresses sv in terms that are independent of one another, conveys the constituents giving rise to global reward rate, and provides the added insight that time’s cost comprises an apportionment as well as an opportunity cost.”

      The above definition of apportionment cost adds to other stated relationships of apportionment cost found throughout the paper (original lines 434,435,447,450).

      I think Figure 6C relates to this, but I had difficulty relating the axis labels to the points, lines, and patterned regions in the plot.

      We thank the reviewer for pointing out that this figure can be made to be more easily understood.

      We have done so by breaking its key features over a greater number of plots so that no single panel is overloaded. We have also changed text in the legend to clarify how apportionment and opportunity costs add to constitute time’s cost, and also correspondingly in the main text.

      I also was a bit confused by how the mathematical formulation was presented. As I understood it, the apportionment cost essentially involves scaling the rest of the SV expression by t<sup>out</sup>/(t<sup>in</sup> + t<sup>out</sup>).

      The reviewer’s understanding is correct: the amount of reward of the pursuit that remains after subtracting the opportunity cost, when so scaled, is equivalent to the subjective value of that pursuit. The amount by which that scaling decreases the rest of the SV expression is equal to the apportionment cost of time.

      The way this scaling factor is written in Figure 5C, as 1/(1 + (1/t<sup>out</sup>) t<sup>in</sup>), seems less clear than it could be.

      To be sure, we present the formula in original Figure 5C in this manner to emphasize the opportunity cost subtraction as separable from the apportionment rescaling, expressing the opportunity cost subtraction and the apportionment scaling component of the equation as their own terms in parentheses.

      But we understand the reviewer to be referring to the manner by which we chose to express the scaling term. We presented it in this way in the original manuscript, (rather than its more elegant form recognized by the reviewer) to make direct connection to temporal discounting literature. In this literature, discounting commonly takes the same mathematical form as our apportionment cost scaling, but whereas the steepness of discounting in this literature is controlled by a free fit parameter, k, we show how for a reward rate maximizing agent, the equivalent k term isn’t a free fit parameter, but rather is the reciprocal of the time spent outside the considered pursuit type.

      We take the reviewer’s advice to heart, and now first express subjective value in the format that emphasizes opportunity cost subtraction followed by an apportionment downscaling, identifying the apportionment scaling term, t<sup>out</sup>/(t<sup>out</sup> + t<sup>in</sup>), ie the outside weight. Figure 5 now shows the geometric representation of apportionment scaling and apportionment cost. Only subsequently in the discounting function section then do we now in the revised manuscript rearrange this subjective value expression to resemble the standard discounting function form.

      Also, the apportionment cost is described in the text as being subtracted from sv rather than as a multiplicative scaling factor.

      What we describe in the original text is how apportionment cost is a component of time’s cost, and how sv is the reward less time’s cost. It would be correct to say that apportionment cost and opportunity cost are subtracted from the pursuit’s reward to yield the subjective value of the pursuit. This is what we show in the original Figure 5D graphically. Original Figure 5 and accompanying formulas at its bottom show the equivalence of expressing sv in terms of subtracting time’s cost as calculated from the global reward rate under a policy of accepting the considered pursuit, or, of subtracting opportunity cost and then scaling the opportunity cost subtracted reward by the apportionment scaling term, thereby accounting for the apportionment cost of time.

      The revision of original figure 5, its figure legend, and accompanying text now make clear the meaning of apportionment cost, how it can be considered a subtraction from the reward of a pursuit, or, equivalently, how it can be thought of as the result of scaling down of opportunity cost subtracted reward.

      It could be written as a subtraction, by subtracting a second copy of the rest of the SV expression scaled by t_in/(t_in + t_out). But that shows the apportionment cost to depend on the opportunity cost, which is odd because the original motivation on line 404 was to resolve the lack of independence between terms in the SV expression.

      On line 404 of the original manuscript, we point out that the simple equation―which is a reprisal of McNamara’s insight―is problematic in that its terms on the RHS are not independent: the global reward rate is dependent on the considered pursuit’s reward (see Fig5B). The alternative expression for subjective value that we derive expresses sv in terms that are all independent of one another. We may have unintentionally obscured that fact by having already defined rho<sup>in</sup> as r<sup>in</sup>/ t<sup>in</sup> and rho<sup>out</sup> as r<sup>out</sup>/t<sup>out</sup> on lines 306 and 307.

      Therefore, in the revision, Ap 8 is expressed so to keep clear that it uses terms that are all independent of one another, and only subsequently express this formula with the simplifying substitution, rho<sup>out</sup>.

      That all said, we understand the reviewer’s point to be that the parenthetical terms relating the opportunity cost and the apportionment rescaling both contain within them the parameter t<sup>out</sup>, and in this way these concepts we put forward to understand the alternative equation are non-independent. That is correct, but it isn’t at odds with our objective to express SV in terms that are independent with one another (which we do). Our motivation in introducing these concepts is to provide insight and intuition into the cost of time (especially now with a clear and simple definition of apportionment cost stated). We go to lengths to demonstrate their relationship to each other.

      (4) In the analysis of discounting functions (line 664 and beyond), the paper doesn't say much about the fact that many discounting studies take specific measures to distinguish true time preferences from opportunity costs and reward-rate maximization.

      We understand the reviewer’s comment to connote that temporal decision-making worlds in which delay time does not preclude reward from outside the current pursuit is a means to distinguish time preference from the impact of opportunity cost. One contribution of this work is to demonstrate that, from a reward-rate maximization framework, an accounting of opportunity cost is not sufficient to understand apparent time preferences as distinguishable from reward-rate maximization. The apportionment cost of time must also be considered to have a full appreciation of the cost of time. For instance, let us consider a temporal decision-making world in which there is no reward received outside the considered pursuit. In such a world, there is no opportunity cost of time, so apparent temporal discounting functions would appear as if purely hyperbolic as a consequence of the apportionment cost of time alone. Time preference, as revealed experimentally by the choices made between a SS and a LL reward, then, seem confounding, as preference can reverse from a SS to a LL option as the displacement of those options (maintaining their difference in time) increases (Green, Fristoe, and Myerson 1994; Kirby and Herrnstein 1995). While this shift, the so-called “Delay effect”, could potentially arise as a consequence of some inherent time preference bias of an agent, we demonstrate that a reward-rate maximal agent exhibits hyperbolic discounting, and therefore it would also exhibit the Delay effect, even though it has no time preference.

      In the revision we now make reference to the Delay Effect (in abstract, results new section “The Delay Effect” with new figure 14, and in the discussion), which is taken as evidence of time preference in human and animal literature, and note explicitly how a reward-rate maximizing agent would also exhibit this behavior as a consequence of apparent hyperbolic discounting.

      In many of the human studies, delay time doesn't preclude other activities.

      Our framework is generalizable to worlds in which being in pursuit does not preclude an agent from receiving reward during that time at the outside reward rate. Original Ap 13 solves for such a condition, and shows that in this context, the opportunity cost of time drops out of the SV equation, leaving only the consequences of the apportionment cost of time. We made reference to this case on lines 1032-1034 of the original manuscript: “In this way, such hyperbolic discounting models [models that do not make an accounting of opportunity cost] are only appropriate in worlds with no “outside” reward, or, where being in a pursuit does not exclude the agent from receiving rewards at the rate that occurs outside of it (Ap. 13).”

      The note and reference is fleeting in the original work. We take the reviewer’s suggestion and now add paragraphs in the discussion on the difference between humans and animals in apparent discounting, making specific note of human studies in which delay time doesn’t preclude receiving outside reward while engaged in a pursuit. Relatedly, hyperbolic discounting is oft considered to be less steep in humans than in animals. As the reviewer points out, these assessments are frequently made under conditions in which being in a pursuit does not preclude receiving reward from outside the pursuit. When humans are tested under conditions in which outside rewards are precluded, they exhibit far steeper discounting. We now include citation to that observation (Jimura et al. 2009). We handle such conditions in original AP 13, and show how, in such worlds, the opportunity cost of time drops out of the equation. The consequence of this is that the apparent discounting function would become less steep (the agent would appear as if more patient), consistent with reports.

      “Relating to the treatment of opportunity cost, we also note that many investigations into temporal discounting do not make an explicit distinction between situations in which 1) subjects continue to receive the usual rewards from the environment during the delay to a chosen pursuit, and 2) situations in which during a chosen pursuit’s delay no other rewards or opportunities will occur (Kable & Glimcher, 2007; Kirby & Maraković, 1996; McClure, Laibson, Loewenstein, & Cohen, 2004). Commonly, human subjects are asked to answer questions about their preferences between options for amounts they will not actually earn after delays they will not actually have to wait, during which it is unclear whether they are really investing time away from other options or not (Rosati et al., 2007). In contrast, in most animal experiments, subjects actually receive reward after different delays during which they do not receive new options or rewards. By our formulation, when a pursuit does not exclude the agent from receiving rewards at the rate that occurs outside, the opportunity cost of time drops out of the subjective value equation (Ap 12).

      Equation 10. The value of initiating a pursuit when pursuit does not exclude receiving rewards at the outside rate (Ap 12)

      Therefore, the reward-rate maximizing discounting function in these worlds is functionally equivalent to the situation in which the outside reward rate is zero, and will―lacking an opportunity cost―be less steep. This rationalizes why human discounting functions are often reported to be longer (gentler) than animal discounting functions: they are typically tested in conditions that negate opportunity cost, whereas animals are typically tested in conditions that enforce opportunity costs. Indeed, when humans are made to wait for actually received reward, their observed discounting functions are much steeper (Jimura et al. 2009). “

      In animal studies, rate maximization can serve as a baseline against which to measure additional effects of temporal discounting. This is an important caveat to claims about discounting anomalies being rational under rate maximization (e.g., line 1024).

      We agree that the purpose of this reward-rate maximizing framework is to serve as a point of comparison in which effects of temporal intervals and rewards that define the environment can be analyzed to better understand the manner in which animals and humans deviate from this ideal behavior. Our interest in this work is in part motivated by a desire to have a deeper understanding of what “true” time preference means. Using the reward-rate maximizing framework here provides a means to speak about time preferences (ie biases) in terms of deviation from optimality. From this perspective, a reward-rate maximal agent doesn’t exhibit time preference: its actions are guided solely by reward-rate optimizing valuation. Therefore, one contribution of this work is to show that purported signs of time preference (hyperbolic discounting, magnitude, sign, and (now) delay effect) can be explained without invoking time preference. What errors from optimality that remain following an proper accounting of reward-rate maximizing behavior should then, and only then, be considered from the lens of time preference (bias).

      (5) The paper doesn't feature any very concrete engagement with empirical data sets. This is ok for a theoretical paper, but some of the characterizations of empirical results that the model aims to match seem oversimplified. An example is the contention that real decision-makers are optimal in accept/reject decisions (line 816 and elsewhere). This isn't always true; sometimes there is evidence of overharvesting, for example.

      We would like to note that the scope of this paper is limited to examining the value of initiating a pursuit, rather than the value of continuing within a pursuit. The issue of continuing within a pursuit constitutes a third fundamental topology, which could be called give-up or patch-foraging, and is complex and warrants its own paper. In Give-up topologies, which are distinct from Forgo, and Choice topologies, the reviewer is correct in pointing out that the preponderance of evidence demonstrates that animals and humans are as if overpatient, adopting a policy of investing too much time within a pursuit, than is warranted_._ In Forgo instances, however, the evidence supports near optimality.

      (6) Related to the point above, it would be helpful to discuss more concretely how some of this paper's theoretical proposals could be empirically evaluated in the future. Regarding the magnitude and sign effects of discounting, there is not a very thorough overview of the several other explanations that have been proposed in the literature. It would be helpful to engage more deeply with previous proposals and consider how the present hypothesis might make unique predictions and could be evaluated against them.

      We appreciate the reviewer’s point that there are many existing explanations for these various ‘anomalous’ effects. We hold that the point of this work is to demonstrate that these effects are consistent with a reward-rate maximizing framework so do not require additional assumptions, like separate processes for small and large rewards, or the inclusion of a utility function.

      Nonetheless, there is a diversity of explanations for the sign and magnitude effect, and, (now with its explicit inclusion in the revision) the delay effect. Therefore, we now also include reference to additional work which proffers alternative explanations for the sign and magnitude effects, (as reviewed by (Kalenscher and Pennartz 2008; Frederick et al. 2002)), as well as a scalar timing account of non-stationary time preference (Gibbon, 1977).

      With respect to making predictions, this framework makes the following in regards to the magnitude, sign, and (now in the revision) delay effect: in Discussion, Magnitude effect subsection: “The Magnitude Effect should be observed, experimentally, to diminish when 1) increasing the outside time while holding the outside reward constant, (thus decreasing the outside reward rate), or when 2) decreasing the outside reward while holding the outside time constant (thus decreasing the outside reward rate). However, 3) the Magnitude Effect would exaggerate as the outside time increased while holding the outside reward rate constant.”, in Sign effect subsection: “…we then also predict that the size of the Sign effect would diminish as the outside reward rate decreases (and as the outside time increases), and in fact would invert should the outside reward rate turn negative (become net punishing), such that punishments would appear to discount more steeply than rewards.” Delay effect subsection: “...a sign of irrationality is that a preference reversal occurs at delays greater than what a reward-rate-maximizing agent would exhibit.”

      A similar point applies to the 'malapportionment hypothesis' although in this case there is a very helpful section on comparisons to prior models (line 1163). The idea being proposed here seems to have a lot in common conceptually with Blanchard et al. 2013, so it would be worth saying more about how data could be used to test or reconcile these proposals.

      We thank the reviewer for holding that the section of model comparisons to be very helpful. We believe the text previously dedicated to this issue to be sufficient in this regard. We have, however, adding substantively to the Malapportionment Hypothesis section (Discussion) and its accompanying figure, to make explicit a number of predictions from the Malapportionment hypothesis as it relates to Hyperbolic discounting, the Delay Effect, and the Sign and Magnitude Effects.

      Reviewer #1 Recommendations

      (1) As a general note about the figures, it would be helpful to specify, either graphically or in the caption, what fixed values of reward sizes and time intervals are being assumed for each illustration.

      Thank you for the suggestion. We attempted to keep graphs as uncluttered as possible, but agree that for original figures 4,5,16, and 17, which didn’t have numbered axes, that we should provide the amounts in the captions in the revised figures (4,5, and now 17,18). These figures did not have numerics as their shapes and display are to illustrate the form of the relationship between vectors, being general to the values they may take.

      We now include in the captions for these figures the parameter amounts used.

      (2) Should Equation 2 have t in the denominator instead of r?

      Indeed. We thank the reviewer for catching this typographical error.

      We have corrected it in the revision.

      (3) General recommendation:

      My view is that in order for the paper's eLife assessment to improve, it would be necessary to resolve points 1 through 4 listed under "weaknesses" in my public review, which pertain to clarity and acknowledgement of prior work. I think a lot hinges on whether the authors can respond to point #3 by making a more compelling case for the usefulness and generality of the 'apportionment cost' concept, since that idea is central to the paper's contribution.

      We believe these critical points (1-4) to improve the paper will now have been addressed to the reviewer’s satisfaction.

      Reviewer #2 (Public review):

      While the details of the paper are compelling, the authors' presentation of their results is often unclear or incomplete:

      (1) The mathematical details of the paper are correct but contain numerous notation errors and are presented as a solid block of subtle equation manipulations. This makes the details of the authors' approach (the main contribution of the paper to the field) highly difficult to understand.

      We thank the reviewers for having detected typographical errors regarding three equations. They have been corrected. The first typographical error in the original main text (Line 277) regards equation 2 and will be corrected so that equation 2 appears correctly as

      The second typo regards the definition of the considered pursuit’s reward rate which appear in the original main text (line 306), and has been corrected to appear as

      The third typographical error occurred in conversion from Google Sheets to Microsoft Word appearing in the original main text (line 703) and regards the subjective value expression when no reward is received in an intertrial interval (ITI). It has been corrected to appear as

      (2) One of the main contributions of the paper is the notion that time’s cost in decision-making contains an apportionment cost that reflects the allocation of decision time relative to the world. The authors use this cost to pose a hypothesis as to why subjects exhibit sub-optimal behavior in choice decisions. However, the equation for the apportionment cost is never clearly defined in the paper, which is a significant oversight that hampers the effectiveness of the authors' claims.

      We thank the reviewer for pressing on this critical point. Reviewers commonly identified a need to provide a concise and intuitive definition of apportionment cost, and to explicitly solve and provide for its mathematical expression.

      We added the following succinct verbal description of apportionment cost… “Apportionment cost is the difference in reward that can be expected, on average, between a policy of taking versus a policy of not taking the considered pursuit, over a time equal to its duration.” This definition appears in new paragraphs (as below) describing apportionment cost in the results section “Time’s cost: opportunity & apportionment costs determine a pursuit’s subjective value”, and is accompanied by equations for apportionment cost, and a figure giving its geometric depiction (Figure 5). We also expanded original figure 5 and its legend (so as to illustrate the apportionment scaling factor and the apportionment cost), and its accompanying main text, to further illustrate and clarify apportionment cost, and its relationship to opportunity cost, and time’s cost.

      “What, then, is the amount of reward by which the opportunity cost-subtracted reward is scaled down to equal the sv of the pursuit? This amount is the apportionment cost of time. The apportionment cost of time (height of the brown vertical bar, Figure 5F) is the global reward rate after taking into account the opportunity cost (slope of the magenta-gold dashed line in Figure 5F) times the time of the considered pursuit. Equally, the difference between the inside and outside reward rates, times the time of the pursuit, is the apportionment cost when scaled by the pursuit’s weight, i.e., the fraction that the considered pursuit is to the total time to traverse the world (Equation 9, right hand side). From the perspective of decision-making policies, apportionment cost is the difference in reward that can be expected, on average, between a policy of taking versus a policy of not taking the considered pursuit, over a time equal to its duration (Equation 9 center, Figure 5F).

      Equation 9. Apportionment Cost.

      While this difference is the apportionment cost of time, the opportunity cost of time is the amount that would be expected from a policy of not taking the considered pursuit over a time equal to the considered pursuit’s duration. Together, they sum to Time’s Cost (Figure 5G). Expressing a pursuit’s worth in terms of the global reward rate obtained under a policy of accepting the pursuit type (Figure 5 left column), or from the perspective of the outside reward and time (Figure 5 right column), are equivalent. However, the latter expresses sv in terms that are independent of one another, conveys the constituents giving rise to global reward rate, and provides the added insight that time’s cost comprises an apportionment as well as an opportunity cost.”

      (3) Many of the paper's figures are visually busy and not clearly detailed in the captions (for example, Figures 6-8). Because of the geometric nature of the authors' approach, the figures should be as clean and intuitive as possible, as in their current state, they undercut the utility of a geometric argument.

      We endeavored to make our figures as simple as possible. We have made in the revision changes to figures that we believe improve their clarity. These include: 1) breaking some figures into more panels when more than one concept was being introduced (such as in revised Figure 5 , 6, 7, and 8), 2) using the left hand y axis for the outside reward, and the right hand axis for the inside reward when plotting the “in” and “outside” reward, and indicating their respective numerics (which run in opposite directions), 3) adding a legend to the figures themselves where needed (revised figures 10, 11, 12, 14) 4) adding the values used to the figure captions, where needed, and 5) ensuring all symbols are indicated in legends.

      (4) The authors motivate their work by focusing on previously-observed behavior in decision experiments and tell the reader that their model is able to qualitatively replicate this data. This claim would be significantly strengthened by the inclusion of experimental data to directly compare to their model's behavior. Given the computational focus of the paper, I do not believe the authors need to conduct their own experiments to obtain this data; reproducing previously accepted data from the papers the authors' reference would be sufficient.

      Our objective was not to fit experimentally observed data, as is commonly the goal of implementation/computational models. Rather, as a theory, our objective is to rationalize the broad, curious, and well-established pattern of temporal decision-making behaviors under a deeper understanding of reward-rate maximization, and from that understanding, identify the nature of the error being committed by whatever learning algorithm and representational architecture is actually being used by humans and animals. In doing so, we make a number of important contributions. By identifying and analyzing reward-rate-maximizing equations, we 1) provide insight into what composes time’s cost and how the temporal structure of the world in which it is embedded (its ‘context’) impacts the value of a pursuit, 2) rationalize a diverse assortment of temporal decision-making behaviors (e.g., Hyperbolic discounting, the Magnitude Effect, the Sign Effect, and the Delay effect), explaining them with no assumed free-fit parameter, and then, by analyzing error in parameters enabling reward-rate maximization, 3) identify the likely source of error and propose the Malapportionment Hypothesis. The Malapportionment Hypothesis identifies the underweighting of a considered pursuit’s “outside”, and not error in pursuit’s reward rates, as the source of error committed by humans and animals. It explains why animals and humans can present as suboptimally ‘impatient’ in Choice, but as optimal in Forgo. At the same time, it concords with numerous and diverse observations in decision making regarding whether to initiate a pursuit. The nature of this error also, then, makes numerous predictions. These insights inform future computational and experimental work by providing strong constraints on the nature of the algorithm and representational architecture used to learn and represent the values of pursuits. Rigorous test of the Malapportionment Hypothesis will require wholly new experiments.

      In the revision, we also now emphasize and add predictions of the Malapportionment Hypothesis, updated its figure (Figure 21), its legend, and its paragraphs in the discussion.

      “We term this reckoning of the source of error committed by animals and humans the Malapportionment Hypothesis, which identifies the underweighting of the time spent outside versus inside a considered pursuit but not the misestimation of pursuit rates, as the source of error committed by animals and humans (Figure 21). This hypothesis therefore captures previously published behavioral observations (Figure 21A) showing that animals can make decisions to take or forgo reward options that optimize reward accumulation (Krebs et al., 1977; Stephens and Krebs, 1986; Blanchard and Hayden, 2014), but make suboptimal decisions when presented with simultaneous and mutually exclusive choices between rewards of different delays (Logue et al., 1985; Blanchard and Hayden, 2015; Carter and Redish, 2016; Kane et al., 2019). The Malapportionment Hypothesis further predicts that apparent discounting functions will present with greater curvature than what a reward-rate-maximizing agent would exhibit (Figure 21B). While experimentally observed temporal discounting would have greater curvature, the Malapportionment Hypothesis also predicts that the Magnitude (Figure 21C) and Sign effect (Figure 21D) would be less pronounced than what a reward-rate-maximizing agent would exhibit, with these effects becoming less pronounced the greater the underweighting. Finally, with regards to the Delay Effect (Figure 21E), the Malapportionment Hypothesis predicts that preference reversal would occur at delays greater than that exhibited by a reward-rate-maximizing agent, with the delay becoming more pronounced the greater the underweighting outside versus inside the considered pursuit by the agent.”

      (5) While the authors reference a good portion of the decision-making literature in their paper, they largely ignore the evidence-accumulation portion of the literature, which has been discussing time-based discounting functions for some years. Several papers that are both experimentally-(Cisek et al. 2009, Thurs et al. 2012, Holmes et al. 2016) and theoretically-(Drugowitsch et al. 2012, Tajima et al. 2019, Barendregt et al. 22) driven exist, and I would encourage the authors to discuss how their results relate to those in different areas of the field.

      In this manuscript, we consider the worth of initiating one or another pursuit having completed a prior one, and not the issue of continuing within a pursuit having already engaged in it. The worth of continuing a pursuit, as in patch-foraging/give-up tasks, constitutes a third fundamental time decision-making topology which is outside the scope of the current work. It engages a large and important literature, encompassing evidence accumulation, and requires a paper on the value of continuing a pursuit in temporal decision making, in its own right, that can use the concepts and framework developed here. The excellent works suggested by the reviewer will be most relevant to that future work concerning patch-foraging/give-up topologies.

      Reviewer #2 Recommendations:

      (1) In Equation 1, the term rho_d is referred to as the reward rate of the default pursuit, when it should be the reward of the default pursuit.

      Regarding Equation 1, it is formulated to calculate the average reward received and average time spent per unit time spent in the default pursuit. So, f<sub>i</sub> is the encounter rate of pursuit i for one unit of time spent in the default pursuit (lines 259-262). Added to the summation in the numerator, we have the average reward obtained in the default pursuit per unit time () and in the denominator we have the time spent in the default pursuit per unit time (1).

      We have added clarifying text to assist in meaning of the equation in Ap 1, and thank the reviewer for pointing out this need.

      (2) The notation for "in" and "out" of a considered pursuit type begins as being used to describe the contribution from a single pursuit (without inter-trial interval) towards global reward rate and the contribution of all other factors (other possible pursuits and inter-trial interval) towards global reward rate, respectively, but is then used to describe the pursuit's contribution and the inter-trial interval's contribution, respectively, to the global reward rate. This should be cleaned up to be consistent throughout, or at the very least, it should be addressed when this special case is considered the default.

      As understood by the reviewer, “in” and “out” of the considered pursuit type describes the general form by which a world can be cleaved into these two parts: the average time and reward received outside of the considered pursuit type for the average time and reward received within that pursuit type. A specific, simple, and common experimental instance would be a world composed of one or another pursuit and an intertrial interval.

      We now make clear how such a world composed of a considered pursuit and an inter trial interval would be but one special case. In example cases where t<sup>out</sup> represents the special case of an inter-trial interval, this is now stated clearly. For instance, we do so when discussing how a purely hyperbolic discounting function would apply in worlds in which no reward is received in t<sup>out</sup>, stating that this is often the case common to experimental designs where t<sup>out</sup> represents an intertrial interval with no reward. Importantly, by the new inclusion of illustrated worlds in the revision that have n-number pursuits that could occur from a default pursuit and 1) equal frequency (Supplemental 1), and 2) at differing frequencies (Supplemental 2), we make more clear the generalizability and utility of this t<sup>out</sup>/tin concept.

      (3) Figure 5 should make clear the decomposition of time's cost both graphically and functionally. As it stands, the figure does not define the apportionment cost.

      In the revision of original fig 5, we now further decompose the figure to effectively convey 1) what opportunity cost, and (especially) 2) the apportionment cost is, both graphically and mathematically, 3) how time’s cost is comprised by them, 4) how the apportionment scaling term scales the opportunity-cost-subtracted reward by time’s allocation to equal the subjective value, and 4) the equivalence between the expression of time’s cost using terms that are not independent of one another with the expression of time’s cost using terms that are independent of one another.

      (4) Figures 6-8 do not clearly define the dots and annuli used in panels B and C.

      We have further decomposed figures 6-8 so that the functional form of opportunity, apportionment, and time’s cost can be more clearly appreciated, and what their interrelationship is with respect to changing outside reward and outside time, and clearly identify symbols used in the corresponding legends.

      (5) The meaning of a negative subjective value should be specifically stated. Is it the amount a subject would pay to avoid taking the considered pursuit?

      As the reviewer intuits, negative subjective value can be considered the amount an agent ought be willing to pay to avoid taking the considered pursuit.

      We now include the following lines in “The forgo decision can also be made from subjective value” section in reference to negative subjective value…

      “A negative subjective value thus indicates that a policy of taking the considered pursuit would result in a global reward rate that is less than a policy of forgoing the considered pursuit. Equivalently, a negative subjective value can be considered the amount an agent ought be willing to pay to avoid having to take the considered pursuit.”

      (6) Why do you define the discounting function as the normalized subjective value? This choice should be justified, via literature citations or a well-described logical argument.

      The reward magnitude normalized subjective value-time function is commonly referred to as the temporal discounting function as it permits comparison of the discount rate isolated from a difference in reward magnitude and/or sign and is deeply rooted in historical precedent. As the reviewer points out, the term is overloaded, however, as investigations in which comparisons between the form of subjective value-time functions is not needed tend to refer to these functions as temporal discounting functions as well.

      We make clear in the revised text in the introduction our meaning and use of the term, the justification in doing so, and its historical roots.

      “Historically, temporal decision-making has been examined using a temporal discounting function to describe how delays in rewards influence their valuation. Temporal discounting functions describe the subjective value of an offered reward as a function of when the offered reward is realized. To isolate the form of discount rate from any difference in reward magnitude and sign, subjective value is commonly normalized by the reward magnitude when comparing subjective value-time functions (Strotz, 1956, Jimura, 2009). Therefore, we use the convention that temporal discounting functions are the magnitude-normalized subjective value-time function (Strotz, 1956).”

      Special addition. In investigating the historical roots of the discounting function prompted by the reviewer, we learned (Grüne-Yanoff 2015) that it was Mazur that simply added the “1+k” in the denominator of the hyperbolic discounting function. Our derivation for the reward-rate optimal agent makes clear why apparent temporal discounting functions ought have this general form.

      Therefore, we add the following to the “Hyperbolic Temporal Discounting Function section in the discussion…

      “It was Ainslie (Ainslie, 1975) who first understood that the empirically observed “preference reversals” between SS and LL pursuits could be explained if temporal discounting took on a hyperbolic form, which he initially conjectured to arise simply from the ratio of reward to delay (Grüne-Yanoff 2015). This was problematic, however, on two fronts: 1) as the time nears zero, the value curve goes to infinity, and 2) there is no accommodation of differences observed within and between subjects regarding the steepness of discounting. Mazur (Mazur, 1987) addressed these issues by introducing 1 + k into the denominator, providing for the now standard hyperbolic discounting function, . Introduction of “1” solved the first issue, though “it never became fully clear how to interpret this 1” (Grüne-Yanoff 2015; interviewing Ainslie). Introduction of the free-fit parameter, k, accommodated the variability observed across and within subjects by controlling the curvature of temporal discounting, and has become widely interpreted as a psychological trait, such as patience, or willingness to delay gratification (Frederick et al., 2002).”

      …continuing later in that section to explain why the reward-rate optimal agent would exhibit this general form…

      “Regarding form, our analysis reveals that the apparent discounting function of a reward-rate-maximizing agent is a hyperbolic function…

      …which resembles the standard hyperbolic discounting function, , in the denominator, where . Whereas Mazur introduced 1 + k to t in the denominator to 1) force the function to behave as t approaches zero, and 2) provide a means to accommodate differences observed within and between subjects, our derivation gives cause to the terms 1 and k, their relationship to one another, and to t in the denominator. First, from our derivation, “1” actually signifies taking t<sub>out</sub> amount of time expressed in units of t<sub>out</sub> (t<sub>out</sub>/t<sub>out</sub>=1) and adding it to t<sub>in</sub>  amount of time expressed in units of t<sub>out</sub> (ie, the total time to make a full pass through the world expressed in terms of how the agent apportions its time under a policy of accepting the considered pursuit).”

      Additional Correction. In revising the section, “Hyperbolic Temporal Discounting Functions” in the discussion, we also detected an error in our description of the meaning of suboptimal bias for SS. In the revision, the sentence now reads…

      More precisely, what is meant by this suboptimal bias for SS is that the switch in preference from LL to SS occurs at an outside reward rate that is lower—and/or an outside time that is greater —than what an optimal agent would exhibit.”

      (7) Figure 15B should have negative axes defined for the pursuit's now negative reward.

      Yes- excellent point.

      To remove ambiguity regarding the valence of inside and outside reward magnitudes, we have changed all such figures so that the left hand y-axis is used to signify the outside reward magnitude and sign, and so that the right hand y-axis is used to signify the inside reward magnitude and sign.

      With respect to the revision of original 15B, this change now makes clear that the inside reward label and numerics on the right hand side of the graph run from positive (top) to negative (bottom) values so that it can now be understood that the magnitude of the inside reward is negative in this figure (ie, a punishment). The left hand y-axis labeling the outside reward magnitude has numerics that run in the opposite direction, from negative (top) to positive (bottom). In this figure, the outside reward rate is positive whereas the inside reward rate is negative.

      (8) When comparing your discounting function to the TIMERR and Heuristic models, it would be useful to include a schematic plot illustrating the different obtainable behaviors from all models rather than just telling the reader the differences.

      We hold that the descriptions and references are sufficient to address these comparisons.

      (9) I would strongly suggest cleaning up all appendices for notation…

      The typographical errors that have been noted in these reviews have all been corrected. We believe the reviewer to be referring here to the manner that we had cross-referenced Equations in the appendices and main text which can lead to confusion between whether an equation number being referenced is in regard to its occurrence in the main text or its occurrence in the appendices.

      In the revision, we eliminate numbering of equations in the appendices except where an equation occurs in an appendix that is referenced within the main text. In the main text, important equations are numbered sequentially and note the appendix from which they derive. If an equation in an appendix is referenced in the main text, it is noted within the appendix it derives.

      …and replacing some of the small equation manipulations with written text describing the goal of each derivation.

      To increase clarity, we have taken the reviewer’s helpful suggestion, adding helper text in the appendices were needed, and have bolded the equations of importance within the Appendices (rather than removing equation manipulations making clear steps of derivation).

      (10) I would suggest moving the table in Appendix 11 to the main text where misestimation is referenced.

      So moved. This appendix now appears in the main text as table 1 “Definitions of misestimating global reward rate-enabling parameters”.

      Reviewer #3 (Public review):

      One broad issue with the paper is readability. Admittedly, this is a complicated analysis involving many equations that are important to grasp to follow the analyses that subsequently build on top of previous analyses.

      But, what's missing is intuitive interpretations behind some of the terms introduced, especially the apportionment cost without referencing the equations in the definition so the reader gets a sense of how the decision-maker thinks of this time cost in contrast with the opportunity cost of time.

      We thank the reviewer for encouraging us to formulate a succinct and intuitive statement as to the nature of apportionment cost. We thank the reviewer for pressing for a succinct and intuitive verbal description.

      We added the following succinct verbal description of apportionment cost… “Apportionment cost is the difference in reward that can be expected, on average, between a policy of taking versus a policy of not taking the considered pursuit, over a time equal to its duration.” This definition appears in a new paragraph (as below) describing apportionment cost in the results section “Time’s cost: opportunity & apportionment costs determine a pursuit’s subjective value”, and is accompanied by equations for apportionment cost, and a figure giving its geometric depiction (Figure 5). We also expanded original figure 5 and its legend (so as to illustrate the apportionment scaling factor and the apportionment cost), and its accompanying main text, to further illustrate and clarify apportionment cost, and its relationship to opportunity cost, and time’s cost.

      “What, then, is the amount of reward by which the opportunity cost-subtracted reward is scaled down to equal the sv of the pursuit? This amount is the apportionment cost of time. The apportionment cost of time (height of the brown vertical bar, Figure 5F) is the global reward rate after taking into account the opportunity cost (slope of the magenta-gold dashed line in Figure 5F) times the time of the considered pursuit. Equally, the difference between the inside and outside reward rates, times the time of the pursuit, is the apportionment cost when scaled by the pursuit’s weight, i.e., the fraction that the considered pursuit is to the total time to traverse the world (Equation 9, right hand side). From the perspective of decision-making policies, apportionment cost is the difference in reward that can be expected, on average, between a policy of taking versus a policy of not taking the considered pursuit, over a time equal to its duration (Equation 9 center, Figure 5F).

      Equation 9. Apportionment Cost.

      While this difference is the apportionment cost of time, the opportunity cost of time is the amount that would be expected from a policy of not taking the considered pursuit over a time equal to the considered pursuit’s duration. Together, they sum to Time’s Cost (Figure 5G). Expressing a pursuit’s worth in terms of the global reward rate obtained under a policy of accepting the pursuit type (Figure 5 left column), or from the perspective of the outside reward and time (Figure 5 right column), are equivalent. However, the latter expresses sv in terms that are independent of one another, conveys the constituents giving rise to global reward rate, and provides the added insight that time’s cost comprises an apportionment as well as an opportunity cost.”

      The above definition of apportionment cost adds to other stated relationships of apportionment cost found throughout the paper (original lines 434,435,447,450).

      Re-analysis of some existing empirical data through the lens of their presented objective functions, especially later when they describe sources of error in behavior.

      Our objective was not to fit experimentally observed data, as is commonly the goal of implementation/computational models. Rather, as a theory, our objective is to rationalize the broad, curious, and well-established pattern of temporal decision-making behaviors under a deeper understanding of reward-rate maximization, and from that understanding, identify the nature of the error being committed by whatever learning algorithm and representational architecture is actually being used by humans and animals. In doing so, we make a number of important contributions. By identifying and analyzing reward-rate-maximizing equations, we 1) provide insight into what composes time’s cost and how the temporal structure of the world in which it is embedded (its ‘context’) impacts the value of a pursuit, 2) rationalize a diverse assortment of temporal decision-making behaviors (e.g., Hyperbolic discounting, the Magnitude Effect, the Sign Effect, and the Delay effect), explaining them with no assumed free-fit parameter, and then, by analyzing error in parameters enabling reward-rate maximization, 3) identify the likely source of error and propose the Malapportionment Hypothesis. The Malapportionment Hypothesis identifies the underweighting of a considered pursuit’s “outside”, and not error in pursuit’s reward rates, as the source of error committed by humans and animals. It explains why animals and humans can present as suboptimally ‘impatient’ in Choice, but as optimal in Forgo. At the same time, it concords with numerous and diverse observations in decision making regarding whether to initiate a pursuit. The nature of this error also, then, makes numerous predictions. These insights inform future computational and experimental work by providing strong constraints on the nature of the algorithm and representational architecture used to learn and represent the values of pursuits. Rigorous test of the Malapportionment Hypothesis will require wholly new experiments.

      In the revision, we also now emphasize and add predictions of the Malapportionment Hypothesis, augmenting its figure (Figure 21), its legend, and its paragraphs in the discussion.

      “We term this reckoning of the source of error committed by animals and humans the Malapportionment Hypothesis, which identifies the underweighting of the time spent outside versus inside a considered pursuit but not the misestimation of pursuit rates, as the source of error committed by animals and humans (Figure 21). This hypothesis therefore captures previously published behavioral observations (Figure 21A) showing that animals can make decisions to take or forgo reward options that optimize reward accumulation (Krebs et al., 1977; Stephens and Krebs, 1986; Blanchard and Hayden, 2014), but make suboptimal decisions when presented with simultaneous and mutually exclusive choices between rewards of different delays (Logue et al., 1985; Blanchard and Hayden, 2015; Carter and Redish, 2016; Kane et al., 2019). The Malapportionment Hypothesis further predicts that apparent discounting functions will present with greater curvature than what a reward-rate-maximizing agent would exhibit (Figure 21B). While experimentally observed temporal discounting would have greater curvature, the Malapportionment Hypothesis also predicts that the Magnitude (Figure 21C) and Sign effect (Figure 21D) would be less pronounced than what a reward-rate-maximizing agent would exhibit, with these effects becoming less pronounced the greater the underweighting. Finally, with regards to the Delay Effect (Figure 21E), the Malapportionment Hypothesis predicts that preference reversal would occur at delays greater than that exhibited by a reward-rate-maximizing agent, with the delay becoming more pronounced the greater the underweighting outside versus inside the considered pursuit by the agent.”

      Reviewer #3 Recommendations:

      As mentioned above, the readability of this paper should be improved so that the readers can follow the derivations and your analyses better. To this end, careful numbering of equations, following consistent equation numbering formats, and differentiating between appendix referencing and equation numbering would have gone a long way in improving the readability of this paper. Some specific questions are noted below.

      To increase clarity, in the revision we eliminated numbering of equations in the appendices except where an equation occurs in an appendix that is referenced within the main text. In the main text, important equations are thus numbered sequentially as they appear and note the appendix from which they derive. If an equation in an appendix is referenced in the main text, it is noted within the appendix it derives.

      (1) In general, it is unclear what the default pursuit is. From the schematic on the left (forgo decision), it appears to be the time spent in between reward-giving pursuits. However, this schematic also allows for smaller rewards to be attained during the default pursuit as do subsequent equations that reference a default reward rate. Here is where an example would have really benefited the authors in getting their point across as to what the default pursuit is in practice in the forgo decisions and how the default reward rate could be modulated.

      (1) The description of the default pursuit has been modified in section “Forgo and Choice decision topologies” to now read… “After either the conclusion of the pursuit, if accepted, or immediately after rejection, the agent returns to a pursuit by default (the “default” pursuit). This default pursuit effectively can be a waiting period over which reward could be received, and reoccurs until the next pursuit opportunity becomes available.” (2) Additionally, helper text has been added to Ap1 regarding the meaning of time and reward spent in the default pursuit. Finally, (3) new figures concerning n-pursuits occurring at the same (Supplement 1) or different (Supplement 2) frequencies from a default pursuit is now added, providing examples as suggested by the reviewer.

      (2) I want to clarify my understanding of the topologies in Figure 1. In the forgo, do they roam in the "gold" pursuit indefinitely before they are faced with the purple pursuit? In general, comparing the 2 topologies, it seems like in the forgo decision, they can roam indefinitely in the gold topology or choose the purple but must return to the gold.

      The reviewer’s understanding of the topology is correct. The agent loops across one unit time in the default gold pursuit indefinitely, though the purple pursuit (or any pursuit that might exist in that world) occurs on exit from gold at its frequency per unit time. The default gold pursuit will then itself have an average duration in units of time spent in gold. As the reviewer states, the agent can re-enter into gold from having exited gold, and can enter gold from having exited purple, but cannot re-enter purple from having exited purple; rather, it must enter into the default pursuit.

      …Another point here is that this topology is highly simplified (only one considered pursuit). So it may be helpful to either add a schematic for the full topology with multiple pursuits or alternatively, provide the corresponding equations (at least in appendix 1 and 2) for the simplified topology so you can drive home the intuition behind derived expressions in these equations.

      We understand the reviewer to be noting that, while, the illustrated example is of the simple topology, the mathematical formulation handles the case of n-number pursuits, and that illustrating a world in which there are a greater number of pursuits, corresponding to original appendices 1&2, would assist readers in understanding the generality of these equations.

      An excellent suggestion. We have now n-pursuit world illustrations where each pursuit occurs at the same (Supplemental Figure 1) and at different frequencies (Supplemental Figure 2) to the manuscript, and have added text to assist in understanding the form of the equation and its relationship to unit time in the default pursuit in the main and in the appendices.

      (3) In Equation and Appendix 1, there are a few things that are unclear. Particularly, why is the expected time of the default option E(t_default )= 1/(∑_(i=1)^n f_i )? Similarly, why is the E(r_default )= ρ_d/(∑_(i=1)^n f_i )? Looking at the expression for E(r_default ), it implies that across all pursuits 1 through n, the default option is encountered only once. Ultimately, in Equation 1.4, (and Equation 1), the units of the two terms in the numerator don't seem to match. One is a reward rate (ρ_d) and the other is a reward value. This is the most important equation of the paper since the next several equations build upon this. Therefore, the lack of clarity here makes the reader less likely to follow along with the analysis in rigorous detail. Better explanations of the terms and better formatting will help alleviate some of these issues.

      The equation is formulated to calculate the average reward received and average time spent per unit time spent in the default pursuit. So, f<sub>i</sub> is the encounter rate of pursuit i for one unit of time spent in the default pursuit. Added to the summation in the numerator we have the average reward obtained in the default pursuit per unit time () and in the denominator we have the time spent in the default pursuit per unit time (1).

      Text explaining the above equation has been added to Ap 1.

      (4) In equation and appendix 2, I'm trying to relate the expressions for t_out and r_out to the definitions "average time spent outside the considered pursuit". If I understand the expression in Equation 2.4 on the right-hand side, the numerator is the total time spent in all of the pursuits in the environment and the denominator refers to the number of times the considered pursuit is encountered. It is unclear as to why this is the average time spent outside the considered pursuit. In my mind, the expression for average time spent outside the considered pursuit would look something like t_out=1+ ∑_(i≠in)〖p_i t_i 〗= 1+ ∑_(i≠in)〖f_i/(∑_(j=1)^n f_j ) * t_i 〗. It is unclear how these expressions are then equivalent.

      Regarding the following equation,

      f<sub>i</sub> is the probability that pursuit i will be encountered during a single unit of time spent in the default pursuit. The numerator of the expression is the average amount of time spent across all pursuits, excepting the considered pursuit, per unit time spent in the default pursuit. Note that the + 1 in the numerator is accounting for the unit of time spent in the default pursuit and is added outside of the sum. Since f<sub>in</sub> is the probability that the considered pursuit will be encountered per unit of time spent in the default pursuit, is the average amount of time spent in the default pursuit between encounters of the considered pursuit. By multiplying the average time spent across all outside pursuits per unit of time in the default pursuit by the average amount of time spent in the default pursuit between encounters of the considered pursuit, we get the average amount of time spent outside the considered pursuit per encounter of the considered pursuit. This is calculated as if the pursuit encounters are mutually exclusive within a single unit of time spent within the default pursuit, as this is the case as the length of our unit time (delta t) approaches zero.

      The above text explaining the equation has been added to Ap 2.

      (5) In Figure 3, one huge advantage of this separation into in-pursuit and out-of-pursuit patches is that the optimal reward rate maximizing rule becomes one that compares ρ_in and ρ_out. This contrasts with an optimal foraging rule which requires comparing to the global reward rate and therefore a circularity in solution. In practice, however, it is unclear how ρ_out will be estimated by the agent.

      How, in practice, a human or animal estimates the reward rates―be they the outside and/or global reward rate under a policy of accepting a pursuit―is the crux of the matter. This work identifies equations that would enable a reward-rate maximizing agent to calculate and execute optimal policies and emphasizes that the effective reward rates and weights of pursuits must be accurately appreciated for global reward rate optimization. In so doing, it makes a reckoning of behaviors commonly but erroneously treated as suboptimal. Then, by examining the consequences of misestimation of these enabling parameters, it identifies mis-weighting pursuits as the nature of the error committed by whatever algorithm and representational architecture is being used by humans and animals (the Malapportionment Hypothesis). This curious pattern identified and analyzed in this work thus provides a clue into the nature of the learning algorithm and means of representing the temporal structure of the environment that is used by humans and animals―the subject of future work.

      We note, however, that we do discuss existing models that grapple with how, in practice, how a human or animal may estimate the outside reward rate. Of particular importance is the TIMERR model, which estimates the outside reward rate from its past experience, and can make an accounting of many qualitative features widely observed. However, while appealing, it would mix prior ‘in’ and ‘outside’ experiences within that estimate, and so would fail to perform forgo tasks optimally. Something is still amiss, as this work demonstrates.

      (6) The apportionment time cost needs to be explained a little bit more intuitively. For instance, it is clear that the opportunity cost of time is the cost of not spending time in the rest of the environment relative to the current pursuit. But given the definition of apportionment cost here in lines 447- 448 "The apportionment cost relates to time's allocation in the world: the time spent within a pursuit type relative to the time spent outside that pursuit type, appearing in the denominator." The reference to the equation (setting aside the confusion regarding which equation) within the definition makes it a bit harder to form an intuitive interpretation of this cost. Please reference the equation being referred to in lines 447-448, and again, an example may help the authors communicate their point much better

      We thank the reviewer for pressing on this critical point.

      Action: We added the following succinct verbal description of apportionment cost… “Apportionment cost is the difference in reward that can be expected, on average, between a policy of taking versus a policy of not taking the considered pursuit, over a time equal to its duration.” This definition appears in a new paragraph (as below) describing apportionment cost in the results section “Time’s cost: opportunity & apportionment costs determine a pursuit’s subjective value”, and is accompanied by equations for apportionment cost, and a figure giving its geometric depiction (Figure 5).

      “What, then, is the amount of reward by which the opportunity cost-subtracted reward is scaled down to equal the sv of the pursuit? This amount is the apportionment cost of time. The apportionment cost of time (height of the brown vertical bar, Figure 5F) is the global reward rate after taking into account the opportunity cost (slope of the magenta-gold dashed line in Figure 5F) times the time of the considered pursuit. Equally, the difference between the inside and outside reward rates, times the time of the pursuit, is the apportionment cost when scaled by the pursuit’s weight, i.e., the fraction that the considered pursuit is to the total time to traverse the world (Equation 9, right hand side). From the perspective of decision-making policies, apportionment cost is the difference in reward that can be expected, on average, between a policy of taking versus a policy of not taking the considered pursuit, over a time equal to its duration (Equation 9 center, Figure 5F).

      Equation 9. Apportionment Cost.

      While this difference is the apportionment cost of time, the opportunity cost of time is the amount that would be expected from a policy of not taking the considered pursuit over a time equal to the considered pursuit’s duration. Together, they sum to Time’s Cost (Figure 5G). Expressing a pursuit’s worth in terms of the global reward rate obtained under a policy of accepting the pursuit type (Figure 5 left column), or from the perspective of the outside reward and time (Figure 5 right column), are equivalent. However, the latter expresses sv in terms that are independent of one another, conveys the constituents giving rise to global reward rate, and provides the added insight that time’s cost comprises an apportionment as well as an opportunity cost.”

      (7) The analyses in Figures 6 and 7 give a nice visual representation of how the time costs are distributed as a function of outside reward and time spent. However, without an expression for apportionment cost it is hard to intuitively understand these visualizations. This also relates to the previous point of requiring a more intuitive explanation of apportionment costs in relation to the opportunity cost of time. Based on my quick math, it seems that an expression for apportionment cost would be as follows: (r_in- ρ_out*t_in)*(t_in⁄t_out )/(t_in⁄t_out +1 ). The condition described in Figure 7 seems like the perfect place to compute the value of just apportionment cost when the opportunity cost is zero. It would be helpful to introduce the equation here.

      We designed original figure 7, as the reviewer appreciates, to emphasize that time has a cost even when there is no opportunity cost, being due entirely to the apportionment cost of time.

      We now provide the mathematical expression of apportionment cost and apportionment scaling in Figure 5, the point in the main text of its first occurrence.

      …and have expanded original figure 5, its legend (so as to illustrate the apportionment scaling factor and the apportionment cost), and its accompanying main text, to further illustrate and clarify apportionment cost, and its relationship to opportunity cost, and time’s cost.

      (8) The analysis regarding choice decisions is relatively straightforward, pending the concerns for the main equations listed above for the forgo decisions. Legends certainly would have helped me grasp Figures 10-12 better.

      We believe the reviewer is referring to missing labels for the Sooner Smaller pursuit, and the Larger Later Pursuit in these figures? We used the same conventions as in Figure 9, but we see now that adding these labels to these figures would be helpful, and add them in the revision.

      We have now added to the figures themselves figure legends indicating the Sooner Small Pursuit and the Larger Later Pursuit. We have also added to the main text to emphasize the points made in these figures regarding the impact of opportunity cost and apportionment cost.

      (9) The derivation of the temporal discounting function from subjective reward rate is much appreciated as it provides further evidence for potential equivalence between reward rate optimization and hyperbolic discounting, which is known to explain a slew of decision-making behaviors in the economics literature.

      We thank and greatly appreciate the reviewer for this recognition.

      In response to the reviewer’s comment, we have added text that further relates reward rate optimization to hyperbolic discounting…

      (1) We add discussion of how our normative derivation gives explanation to Mazur’s ad hoc addition of 1 + k to Ainslie’s reward/time hyperbolic discounting conception. See new first paragraph under “Hyperbolic Temporal Discounting Functions” for the historical origins of the standard hyperbolic equation (which are decidedly not normatively derived). And then see our discussion (new second paragraph in sections “The apparent discounting function of global….”) of how our normative derivation gives explanation to “1”, “k”, and their relationship to each other.

      (2) We add explicit treatment of the Delay Effect in a new “The Delay Effect” section of the results along with a figure, and in its corresponding Discussion section.

      Minor comments:

      (1) Typo in equation 2, should be t_i in the denominator within the summation, not r_i .

      We thank the reviewer for catching this typo, and have corrected it in the revision.

      (2) Before equation 6, typo when defining ρ_in= r_in/(t_in.). Should be t_in in the denominator, not r_out.

      We thank the reviewer for catching this typo, and have corrected it in the revision.

      (3) Please be consistent with equation numbers, placement of equation references, and the reason for placing appendix numbers. This will improve readability immensely.

      To increase clarity, in the revision we eliminated numbering of equations in the appendices except where an equation occurs in an appendix that is referenced within the main text. In the main text, important equations are thus numbered sequentially and note the appendix from which they derive. If an equation in an appendix is referenced in the main text, it is noted within the appendix it derives.

      (4) Line 505 - "dominants" should be dominates.

      Typo fixed as indicated

      (5) Figures 10-12: add legends to the figures.

      Now so included.

      (6) Lines 701-703: please rewrite the equation separately. It is highly unclear what rt is here.

      We thank the reviewer for bringing attention to this error. The error arose in converting from Google Sheets to Microsoft Word.

      The equation has now been corrected.

      Additional citations noted in reply and appearing in Main text

      Ainslie, George. 1975. “Specious Reward: A Behavioral Theory of Impulsiveness and Impulse Control.” Psychological Bulletin 59: 257–72.

      Frederick, Shane, George Loewenstein, Ted O. Donoghue, and T. E. D. O. Donoghue. 2002. “Time Discounting and Time Preference : A Critical Review.” Journal of Economic Literature 40: 351–401.

      Gibbon, John. 1977. “Scalar Expectancy Theory and Weber’s Law in Animal Timing.” Psychological Review 84: 279–325.

      Green, Leonard, Nathanael Fristoe, and Joel Myerson. 1994. “Temporal Discounting and Preference Reversals in Choice between Delayed Outcomes.” Psychonomic Bulletin & Review 1: 383–89.

      Grüne-Yanoff, Till. 2015. “Models of Temporal Discounting 1937-2000: An Interdisciplinary Exchange between Economics and Psychology.” Science in Context 28 (4): 675–713.

      Jimura, Koji, Joel Myerson, Joseph Hilgard, Todd S. Braver, and Leonard Green. 2009. “Are People Really More Patient than Other Animals? Evidence from Human Discounting of Real Liquid Rewards.” Psychonomic Bulletin & Review 16: 1071–75.

      Kalenscher, Tobias, and Cyriel M. A. Pennartz. 2008. “Is a Bird in the Hand Worth Two in the Future? The Neuroeconomics of Intertemporal Decision-Making.” Progress in Neurobiology 84 (3): 284–315.

      Kirby, Kris N., and R. J. Herrnstein. 1995. “Preference Reversals Due to Myopic Discounting of Delayed Reward.” Psychological Science 6 (2): 83–89.

      Mazur, James E. 1987. “An Adjusting Procedure for Studying Delayed Reinforcement.” In The Effect of Delay and of Intervening Events on Reinforcement Value., 55–73. Quantitative Analyses of Behavior, Vol. 5. Hillsdale, NJ, US: Lawrence Erlbaum Associates, Inc.

      McNamara, John. 1982. “Optimal Patch Use in a Stochastic Environment.” Theoretical Population Biology 21 (2): 269–88.

      Rosati, Alexandra G., Jeffrey R. Stevens, Brian Hare, and Marc D. Hauser. 2007. “The Evolutionary Origins of Human Patience: Temporal Preferences in Chimpanzees, Bonobos, and Human Adults.” Current Biology: CB 17: 1663–68.

      Strotz, R. H. 1956. “Myopia and Inconsistency in Dynamic Utility Maximization.” The Review of Economic Studies 23: 165–80.

    1. Author response:

      The following is the authors’ response to the original reviews.

      Public Reviews:

      Reviewer #1 (Public review):

      Summary:

      The authors investigate the role of HSPA2 during mouse preimplantation development. Knocking down HSPA2 in zygotes, the authors describe lower chances of developing into blastocysts, which show a reduced number of inner cell mass cells. They find that HSPA2 mRNA and protein levels show some heterogeneity among blastomeres at the 4-cell stage and propose that HSPA2 could contribute to skewing their relative contribution to embryonic lineages. To test this, the authors try to reduce HSPA2 expression in one of the 2-cell stage blastomere and propose that it biases their contribution to towards extra-embryonic lineages. To explain this, the authors propose that HSPA2 would interact with CARM1, which controls chromatin accessibility around genes regulating differentiation into embryonic lineage.

      Strengths:

      (1) The study offers simple and straightforward experiments with large sample sizes.

      Thanks for your kind recognition.

      (2) Unlike most studies in the field, this research often relies on both mRNA and protein levels to analyses gene expression and differentiation.

      Thanks for your kind recognition.

      Weaknesses:

      (1) Image and statistical analyses are not well described.

      Thanks for your advisable comment. We redescribe the image and statistical analyses in our revised version (line 255-257).

      (2) The functionality of the overexpression construct is not validated.

      Thanks for your kind suggestion. We validate the functionality of the overexpression construct in our revised version (Figure S3).

      (3) Tracking of KD cells in embryos injected at the 2-cell stage with GFP is unclear.

      Thanks for your kind suggestion. We randomly co-injected green fluorescent protein (Gfp) mRNA as a linage tracer with either Hspa2-siRNA or NC-FAM into one of the 2 -cell, and then monitored embryo development to the blastocyst stage (line 342-344).

      (4) A key rationale of the study relies on measuring small differences in the levels of mRNA and proteins using semi-quantitative methods to compare blastomeres. As such, it is not possible to know whether those subtle differences are biologically meaningful. For example, the lowest HSPA2 level of the embryo with the highest level is much higher than the top cell from the embryo with the lowest level. What does this level mean then? Does this mean that some blastomeres grafted from strong embryos would systematically outcompete all other blastomeres from weaker embryos? That would be very surprising. I think the authors should be more careful and consider the lack of quantitative power of their approach before reaching firm conclusions. Although to be fair, the authors only follow a long trend of studies with the same intrinsic flaw of this approach.

      Thanks for your advisable comment. Indeed, despite the approach drew on previous research (Zhou Cell 2018), we were clearly aware that this approach can only reflect relative comparisons. This means that the relative difference among the blastomeres from the same embryo were detected and compared. We did not compare the absolute levels of mRNA between different embryos. We also offered simple and straightforward experiments with large sample sizes to confirm this conclusion.

      (5) Some of the analyses on immunostaining do not take into account that this technique only allows for semi-quantitative measurements and comparisons.

      a) Some of the microscopy images are shown with an incorrect look-up table.

      b) Some of the schematics are incorrect and misleading.

      Thanks for your advisable comment. We revised microscopy images and schematics in our revised version.

      Reviewer #2 (Public review):

      Summary:

      In this study, Gao et al. use RNA-seq to identify Hspa2 as one of the earliest transcripts heterogeneously distributed between blastomeres. Functional studies are performed using siRNA knockdown showing Hspa2 may bias cells toward the ICM lineage via interaction with the known methyltransferase CARM1.

      Strengths:

      This study tackles an important question regarding the origins of the first cell fate decision in the preimplantation embryo. It provides novelty in its identification of Hspa2 as a heterogeneous transcript in the early embryo and proposes a plausible mechanism showing interactions with Carm1. Multiple approaches are used to validate their functional studies (FISH, WB, development rates, proteomics). Given only 4 other transcripts/RNA have been identified at or before the 4-cell stage (LincGET, CARM1, PRDM14, HMGA1), this would be an important addition to our understanding of how TE vs ICM fate is established.

      Thanks for your kind recognition.

      The RNA-seq results leading the authors to focus on Hspa2 are not included in the manuscript. This dataset would serve as an important resource but is neither included nor discussed. Nor is it mentioned whether Hspa2 was identified in prior RNA-seq embryos studies (for example Deng Science 2014).

      Thanks for your advisable comment. To identify genes that show a significantly high variability across blastomeres in the same embryo, we regressed out the embryo effect by established a new method, which will be published and uploaded to the database in the future. Thus, the RNA-seq results leading the we focus on Hspa2 are not included in the manuscript.   

      In addition, the functional studies are centered on Hspa2 knockdown at the zygote (1-cell) stage, which would largely target maternal transcript. Given the proposed mechanism relies on Hspa2 heterogeneity post-ZGA (late 2-cell stage), the knockdown studies don't necessarily test this and thus don't provide direct support to the authors' conclusions. The relevance of the study would be improved if the authors could show that zygotic knockdown leads to symmetric Hspa2 levels at the late 2-cell and/or 4-cell stage. It may be possible that zygotic knockdown leads to lower global Hspa2 levels, but that asymmetry is still generated at the 4-cell stage.

      Thanks for your advisable comment. We showed that the Hspa2 levels at the late 2-cell and 4cell stage after zygotic knockdown in our revised version (Figure S1 G-H, line 450-452).

      Furthermore, the authors show that Hspa2 knockdown at the 1-cell stage lowers total Carm1 levels at the 4-cell stage. However, it is unclear how total abundance within the embryo alters lineage specification within blastomeres. The authors go on to propose a plausible mechanism involving Hspa2 and Carm1 interaction, but do not discuss how expression levels may be involved.

      Thanks for your advisable comment. Previous research suggests that heterogeneous activity of the methyltransferase CARM1 results in differential methylation of histone H3R26 to modulate establishment of lineage specification (Zernicka-Goetz Cell 2018). Thus, we didn't discuss the total abundance within the embryo alters lineage specification.

      Recommendations for the authors:  

      Reviewer #1 (Recommendations for the authors):

      (1) Major issue with analyses:

      Image analysis needs to be much better explained than simply saying that ImageJ was used. Where are cells measured (at their equatorial plane? What is the size of the ROI?)? Ideally, the ROI and/or raw measurements should be provided.

      Thanks for your advisable comment. We redescribe the Image analysis in our revised version (line 187-194). 

      What are the objective criteria determining whether a cell is counted as GFP positive, CDX2 positive, or OCT4 positive? This is very unclear and key to the interpretation of many experiments.

      Thanks for your advisable comment. We think that the cell containing fluorescence signals above background noise were counted positive.

      Statistical analyses mention ANOVA in the methods but the student's t-test in the figure legend. Which is which? Most data are heavily normalized, which would unlikely fit the description for Student's t-test analyses.

      Thanks for your advisable comment. We redescribe the statistical analyses in our materials and methods (line 253-260).

      Figure 5H describes a relative fluorescence intensity with control at 1. The legend describes a normalization to "DNA" (I guess the authors meant DAPI), which is unlikely to give 1. This suggests that additional normalization was done and is not described. Is that the case? Also, since the authors propose that HSPA2 would control Histone modification and chromatin packing, I do not think that using DAPI is an appropriate way of normalizing the fluorescence signal.

      Thanks for your advisable comment. We replaced DNA with DAPI in our revised version. Based on previous studies, we adopted DAPI as a normalized fluorescence signal (Zhou Cell 2018, Zernicka-Goetz Cell 2018).

      Figure 1E shows data normalized to the lowest level while Figure 1H is normalized to the highest level. A consistent representation would be welcome.

      Thanks for your advisable comment. We revised the Figure 1H in our revised version.

      Is Figure 1C showing a t-test between correlations?

      Yes, Figure 1C shows the t-test between correlation.

      (2) Major issue with the interpretation of semi-quantitative methods and measurements:

      qPCR, WB, immunostaining are all semi-quantitative methods that require some kind of normalization due to non-linear bias in the way the molecules are picked up. Such normalization makes it difficult to know whether a detectable difference is meaningful biologically speaking i.e. if a difference of 1 CT between blastomeres can be detected after qPCR, is it meaningful? If that were the case, then embryos with lower CT than others (Figure 1D) would not be able to develop into blastocyst, like siRNA injected embryos, or grafting a blastomere with a high CT onto an embryo with low CT would lead to the systematic differentiation of these strong blastomeres into ICM.

      Thanks for your advisable comment. The CT values represent the relative mRNA levels of Hspa2 between blastomeres, and the higher CT value represents the lower expression of Hspa2 at mRNA level. Figure 1D shows the Hspa2 mRNA levels between blastomeres. The blastomere with lowlevel expression of the Hspa2 mRNA is not bias an ICM fates.  

      The same goes for fluorescence analyses (Figure 1F). Can the authors also provide the measurements for DAPI as they did for HSPA2? I am sure that with enough measurements, DAPI is variable enough to give a statistical difference among blastomeres with questionable biological meaning.

      I think the reasoning used here (unfortunately following the reasoning that has been used in a series of studies by other groups) of ranking blastomeres after semi-quantitative measurement is fundamentally flawed.

      Thanks for your advisable comment. The DAPI was determined by the maximal area using a custom Python script. Based on previous studies, we adopted DAPI as a normalized fluorescence signal (Zhou Cell 2018). This approach is to normalize embryo-to-embryo variance from the technical reason.

      (3) Major issue with overexpression experiment:

      While the siRNA experiment is partially validated by qPCR and WB measurements of HSPA2 after KD, the overexpression experiment is not. Do the authors have any evidence that the construct they use is produced into protein and functional? Can the authors check by WB? Can the authors rescue the siRNA with their overexpression?

      Thanks for your advisable comment. We verified the overexpression experiment by WB in in our revised version (Figure S3, line 360-361). Considering that siRNA degrades mRNA and prevents the mRNA translation process, we did not co-inject the siRNA with their overexpression.

      The lack of effect of HSPA2 overexpression on blastocyst formation is difficult to reconcile with the interpretation from the authors that levels of HSPA2 bias lineages.

      Have the authors tried lower concentrations? Have the authors tried FISH on their half-injected 2cell embryos? Of course, if the antibody against HSPA2 would work with immunostaining, that would be ideal.

      Thanks for your advisable comment. We chose the concentrations for our study based on previous research (Zernicka-Goetz Cell 2016). To verified Hspa2 was successfully inject into one blastomere at the 2-cell stage, we observed green fluorescence after co-injected GFP mRNA with either siRNA or NC-FAM into one blastomere of the two-cell embryos. Thus, we didn't try FISH on half-injected 2-cell embryos. We tried to perform immunostaining experiments with various HSPA2 antibodies (Proteintech: 12797-1-AP, Abcam: ab108416) and no good results were achieved.

      Author response image 1.

      (4) Major issue with tracking of injected cells:

      It is unclear what counts as a GFP-positive cell. In Figure 3D, most cells appear to have the same level of GFP.

      Thanks for your advisable comment. The cell containing green fluorescence signals above background noise were counted GFP-positive in Figure 3D. Most cells seem to have the same level of GFP because they are daughter cells of the blastomeres injected with GFP.

      In the images of GFP-expressing cells used to track the control of KD cells shown in Figure 3A, it seems that the control embryos have mostly GFP cells in the ICM. Is that the case, or just a bad example?

      Thanks for your advisable comment. The green fluorescent signals in Figure 3A represented OCT4 protein, an ICM marker.

      Can the authors do FISH against HSPA2 and visualize their GFP cells to validate the heterogeneous expression in situ?

      Thanks for your advisable comment. We have verified the heterogeneous expression of HSPA2 in Figure1.

      (5) Issue with fluorescent images:

      Many images are shown with inappropriate look-up tables with saturated DAPI, OCT4, CDX2, and FISH. This raises the doubt that analyses were made on saturated images, which would be incorrect.

      The LUT of Figure 5H should be adjusted similarly between the control and siRNA.

      Thanks for your advisable comment. We revised some images which showed inappropriate lookup tables in our revised version. The LUT of Figure 5H had been adjusted between the control and siRNA. 

      (6) Issue with schematics:

      Schematics of blastomere isolation grown into blastocyst-like structures are misleading since the final blastocyst-like structure should not have a zona pellucida and should have fewer cells than regular blastocysts.

      Thanks for your advisable comment. We revised schematics of blastomere grown into morula in our revised version (Figure 1A and Figure S1A).

      The summary schematics in the final figure should not state HSPA2 -/- since experiments in the study did not use KO but KD.

      Thanks for your advisable comment. We revised the summary schematics in our revised version.

      The blastocysts are the same sizes as the cleavage stage or morula embryos which implies that cells lose volume to the lumen, which is not the case.

      Thanks for your advisable comment. We revised the schematics in our revised version.

      (7) Issue with data presentation:

      In the tables within the figures, the number of decimals given should be the same for the mean and SE (one decimal should be more than enough).

      Thanks for your advisable comment. We revised the figure 2H in our revised version.

      The comparison of cell number and distribution within embryos (e.g. Figure 2B) would be best represented by a correlation analysis of TE vs ICM cells.

      Thanks for your advisable comment. We add the figure of a correlation analysis of TE vs ICM cells in our revised version (Figure 3B).

      The docking simulations are described in the main text as "experiments".

      Thanks for your advisable comment. We redescribed the docking simulations in our revised version.

      (8) Issue with data interpretation:

      The reduced number of ICM cells is interpreted as a slowed-down cell cycle. This could also be explained by failed cytokinesis and the generation of binucleated or polyploid cells. Have the authors checked for that? For example, by looking at their DAPI staining. 

      Thanks for your advisable comment. Our RNA-seq results revealed that the differentially expressed genes (DEGs) at blastocyst stage with HSPA2 knocking down are closely related to negative regulation of cell cycle, G1/S transition of mitotic cell cycle, mitotic cell cycle phase transition and regulation of mitotic cell cycle phase transition. Additionally, the previous study demonstrated that knockdown of HSPA2 reduced cell proliferation and led to G1/S phase cell cycle arrest (Hu Ann Transl Med 2019). Additionally, the lower cell number in ICM may also associated with failed cytokinesis and the generation of binucleated or polyploid cells. Thus, we guessed that HSPA2 has a role in ICM lineage establishment, although half of the ICM cells were able to survive with HSPA2 deficiency (line 463-472).

      It is unclear to me why reduced ICM should lead to fewer blastocysts. Blastocysts should be able to form as long as their TE is fine. In Figure 2G, embryos seem to be cultured in close proximity, which is fine if they are healthy but not if some of the embryos start dying and releasing toxic compounds (e.g. ROS). Have the authors tried removing the dying KD embryos to see if the development of the remaining embryos would improve?

      Thanks for your advisable comment. We think HSPA2 may affect blastocyst development by affecting other signaling pathways. And, the GO enriched terms was closely related to blastocyst development (Figure 2E). There was no significant difference in morula formation rate between Hspa2-KD group and NC group, thus the assumption that the toxic compounds released by some of the embryos that lead to downregulation of blastocyst rate may not be correct. Indeed, the rate of blastocyst formation in Hspa2-KD embryos was reduced significantly lower when few embryos was cultured separately. In addition, we discussed the possibility that the lower cell number in ICM may also associated with failed cytokinesis and the generation of binucleated or polyploid cells.

      Author response image 2.

      Reviewer #2 (Recommendations for the authors):

      One of the significant findings in the paper is the discovery portion where Hspa2 is identified as a heterogeneous transcript. To improve the logic and impact of the manuscript, it may benefit from reorganizing some of the figures and text. For example:

      (1) The paragraph in the introduction (Lines 56-68) should be moved to the discussion as the Hspa2 reveal should be in section 3.1, not prior to the RNA-seq results presented in Figure 1.

      Thanks for your advisable comment. We think it is more logical that HSPA2 needs to be introduced in the introduction.

      (2) Add text at the beginning of Section 3.1 to describe the rationale and results for the RNAseq. It would help the readers if the authors clearly stated why they chose the 4-cell stage.

      Thanks for your advisable comment. We explain why we chose the 4-cell stage in our revised version (line 272-273).

      (3) As this is the first time Hspa2 is identified, consider moving Figure S1C to the main figure to show expression throughout development.

      Thanks for your advisable comment. We moved Figure S1C to the main figure in our revised version (line 286-291).

      (4) Figure 1C: the correlation between Hspa2 and ICM markers would be strengthened if additional transcripts were used (Oct4, Sox2, Sox21). The graph in 1C would also be more informative if represented as a scatter plot with correlation coefficients (Nanog log2TPM vs Hspa2 log2TPM), rather than bar graphs.

      Thanks for your advisable comment. We chose Nanog as the correlation between Hspa2 and Nanog, a ICM markers, was showing the strongest correlation in result. And, the figure 1C shows the stronger positive correlation between Nanog and Hspa2 in gene expression than random gene pairs (n=100, n means the number of random gene pairs). Thus, the figure 1C with bar graphs is easier to understand.

      (5) Figure 1D: how were individual blastomeres grouped into B1-4? Individually run and then pooled based on relative expression?

      Thanks for your advisable comment. Blastomeres are named B1 to B4 according to increasing Hspa2 concentration in figure 1E.

      (6) Figures 1F, 1I, 5H: the DAPI channel appears to be saturated, but is used to normalize fluorescence intensity and may incorrectly account for light scattering within the embryo. Please clarify by adding more details regarding image analysis. Were partial stacks through the nucleus used for analysis, or max projections? Graph axes should be "relative fluorescence intensity."

      Thanks for your advisable comment. We added the details of fluorescence images analysis. The graph axes had revised in our revised version.

      (7) Line 278: the results in Figure S1C would benefit from more text regarding expression patterns throughout development. The maternal transcript appears to have a sharp downregulation by the early 2-cell stage, and is then upregulated coinciding with ZGA.

      Thanks for your advisable comment. We added more describe of the Figure in main text (LINE 285-290).

      (8) For the analyses in Figure 2 I-J and 2K-L, were arrested embryos excluded from analysis? This is an important detail as including arrested embryos would significantly bias the RNA-seq results. 

      Thanks for your advisable comment. The arrested embryos were excluded in Figure 2 I-J and 2K-L.

      (9) Figures 2G-H would be aided by converting the table in 2H to a bar graph and adding development rates for all stages (2-, 4-, 8-, morula, and blast). This would also show when an arrest occurs.

      Thanks for your advisable comment. We converted the table in 2H to a bar graph.

      (10) Blast rates are represented with too many significant digits (Figures 2H, 4B). They should only be reported to the closest ones given the unit of measure (number of blasts divided by number of zygotes). For instance, a blast rate of 81.63 {plus minus} 2.000 reflects excessive precision that is not measured in the data, it should rather read 82 {plus minus} 2%. This is also true for % cells (Figures 3E, 4H).

      Thanks for your advisable comment. Values were rounded down to the one decimal place (rounded down).

      (11) The clarity and impact of Figure 3A and 3D would benefit from 2D slices through the ICM. 

      Thanks for your advisable comment. In order to get more comprehensive understanding of the 3D structure of blastocyst of Figure 3A and 3D, we did not choose 2D slices.

      (12) To improve clarity and logic, separate the 1-cell and 2-cell knockdown experiments in the text and figures:

      a) 1-cell knockdown with RNA-seq results (Fig 2A-F).

      b) 1-cell knockdown showing less ICM/pluripotency markers in (combine Figures 2G-M and Figures 3A-B; "new Fig 3").

      c) 2-cell knockdown tracing lineage (Figures 2D-E; "new Fig 4").

      The new Figures 3 and 4 should mirror one another (i.e. for each knockdown experiment, development rates and cell counts should be included). For the 2-cell knockdown (Figures 2 D-E), what were the developmental rates (8-cell, morula, blast)?

      Thanks for your advisable comment. However, in order to the overall logical of the article, we do not separate the 1-cell and 2-cell knockdown experiments in the text and figures. And, we added the developmental rates (8-cell, morula, blast) of 2-cell knockdown group in our revised version (Figure S2).

      For the overexpression experiment (Figure 4), why were injections performed at the zygote stage versus the 2-cell stage? Given the significant downregulation of maternal transcript demonstrated in Figure S1C, it seems plausible that the injected RNA was also downregulated.

      Thanks for your advisable comment. For the overexpression experiment, we first chose to inject Hspa2 mRNA at the zygote stage and found that the overexpression of Hspa2 does not induce blastomere cells to bias an ICM fate. The qRT-PCR results indicated that the expression level of Hspa2 in overexpression group was significantly increased compared with normal group at 4cell and blastocyst stage (Figure 4C, 4D).  In addition, there is no guarantee that an equal amount of Hspa2 mRNA be injected into each blastomere in 2-cell stage. Thus, we did not microinject Hspa2 mRNA into the 2-cell stage.

      The 3.5 subheading overstates the results as the Hspa2-Carm1 interaction is not linked to lineage segregation. For example, a more specific subtitle might be, "Hspa2 interacts with Carm1 and alters H3R26me2 levels."

      Thanks for your advisable comment. We revised the subtitle in our revised version (line 376).

      Figures 5B-C and 5D-E. The qRT-PCR and WB analysis of knockdown blasts shows a correlation between Hspa2 downregulation and Carm1 downregulation. However, if the proposed mechanism is Hspa2 binding to Carm1 to mediate downstream methylation, why would it be expected to alter transcript levels at the 4-cell or blast stage? Please add further details and discussion in the results and discussion sections.

      Thanks for your advisable comment. The reason we chose to work at the 4-cell stage is because previous studies on CARM1 have focused on the 4-cell stage (Zernicka-Goetz Cell 2018,2016). 

      In the discussion, the statement in Lines 430-431 is an overinterpretation: "the heterogeneity of HSPA2... acts as an upstream factor to drive [the] first cell-fate decision." The knockdown experiments don't alter heterogeneity per se, but total abundance. Furthermore, the results do not show that heterogeneity drives heterogeneity in H3R26me2 patterns, for example.

      Thanks for your advisable comment. We redescribe the relevant statement in the discussion.

      More needs to be said regarding the ICM cells that persisted in the 1-cell KD experiment (Fig 3B). Lines 449-450 point out this result, but do not propose any plausible explanations. For instance, ICM cells may still form due to the incomplete knockdown achieved or the possibility that redundant pathways exist.

      Thanks for your advisable comment. We redescribe the relevant statement in our revised version (line 468-473).

      The 5th paragraph of the discussion seems incomplete. The authors point out a possible link between Hspa2 and Hippo and Wnt signaling pathways, but need to expand their discussion on how this may act as an additional mechanism incorporating Hspa2 with lineage segregation.

      Thanks for your advisable comment. We redescribe the 5th paragraph of the discussion (line 483-494).

      Statistics: all comparisons with greater than 2 groups should be performed with a one-way ANOVA and multiple comparisons, rather than Student's t-test (Figures 1B, 1D, 1E, 1F).

      All figure legends lack statistical test details.

      Thanks for your advisable comment. All figure legends added statistical test details in statistical analysis.

      Minor comments:

      In all graphs, individual blastomere expression levels should be represented as boxwhisker/bar/scatter/violin plots since the comparison is groups rather than time points (i.e. symbols should not be connected with a line in Figures 1B, 1D, 1F-G, 1I, S1D, S1F).

      Thanks for your advisable comment. Each colored line represents a single cell, and the dots of the same color represent the blastomere of the same cell. Thus, we use a line representation individual blastomere.

      For all fluorescent images, having two representative images may be confusing for the reader. Figures may be improved by just including one representative image for each stage/treatment (Figures 1F, 1I, S1F, 3A, 3D, 4E, 4G).

      Thanks for your advisable comment. The figures just including one representative image for each stage in our revised version. In addition, two representative images from each group were shown for each treatment (Figures 3A, 3D, 4E, 4G).

      The manuscript would be improved with thorough grammar and typo editing.

      For example:

      (1) Lines 18, 73, the wording is confusing, consider: "knockdown of Hspa2 in one of the two-cell blastomeres biased its progeny towards the trophectoderm lineage.".

      (2) Line 23, overstatement. Consider: "we demonstrated that HSPA2 levels correlate with ICMassociated genes and that it interacts with the CARM1.".

      (3) Line 25 confusing wording, "via the execution of commitment and differentiation phases.".

      (4) Line 37, replace "that" with "of;" replace "cell-fate decisions" with "cell-fate decision".

      (5) Line 40: needs space before (CARM1).

      (6) Line 43: the wording is confusing, consider "can result in higher expression levels of".

      (7) Line 45: wording, consider "Recent [studies have] further suggested".

      (8) Line 70: plurality, consider "analyzed gene expression pattern".

      (9) Line 73 typo: "prevents its".

      (10) Line 76-77 wording, consider "Hspa2 expression patterns can bias cell fate in the mouse embryo".

      (11) Line 276: remove "in whole embryos," since MII eggs are not embryos.

      (12) Line 617 "There" should be "Three".

      (13) Axis label in Fig 3b "Totle" should be "Total".

      (14) Lines 417, 419 missing spaces.

      (15) Line 448 missing word, "interfering [with] the cell cycle".

      (16) Line 462 incorrect word, "[a]polar cells being specified as ICM".

      (17) Line 469 incorrect plural, "cell differentiation".

      Thanks for your advisable comment. We revised the whole manuscript carefully according to the reviewers' suggestions.

    1. Author response:

      The following is the authors’ response to the current reviews.

      Reviewer #1:

      (1) To improve the clarity of the work, I suggest a final note to the authors to say more explicitly that objective accuracy has a finer resolution *due to the number of "special circles" per trial* in their task. This task detail got lost in my read of the manuscript, and confused me with respect to the resolution of each accuracy measure.

      We agree with the reviewer that this would be a useful clarification and have therefore added the following statement to the Methods section on p. 20:

      “It should be noted that the OIP has a slightly finer resolution due to the number of special circles per trial.”

      (2) Similarly for clarification, they could point out that their exclusion criteria removes subjects that have lower OIP than their AIP analysis allows (which is good for comparison between OIP and AIP). Thus, it removes the possibility that very poor performing subjects (OIP) are forced to have a higher than actual AIP due to the range).

      We agree this would be a useful statement to add and have included the following sentence in the Supplement on p. 8:

      “Such a restriction of the threshold parameter was intended to increase the comparability between AIP and OIP, and hence improved the calculation of the reminder bias.”


      The following is the authors’ response to the previous reviews.

      Reviewer #1:

      (1) Upon reading their response to the question I had regarding AIP and OIP, a few more questions came up regarding OIP, AIP, how they're calculations differ, and how the latter was computed in R. I hope these help readers to clarify how to interpret these key measures, and the hypotheses that rely upon them.

      Regarding fitting, and in relation to power, is16 queries adequate to estimate an AIP using the R's quickpsy? That is, assuming some noise in the choice process, how recoverable is a true indifference points from 16 trials? If there's a parameter recovery analysis (ie generating choice via the fitting parameters, which will have built-in stochasticity, and seeing how well you recover the parameter) of interest would be helpful. It may help to characterize why the present study might differ from prior studies (maybe a power issue here).

      The reviewer is absolutely correct that we should have provided more detail when describing our fitting procedure for the psychometric curves. We have now addressed this by adding the following statements to the Methods section and Supplement:

      Page 20 in the main manuscript: “Fitting was done using the quickpsy package in R and more detail is given in the Supplement.”

      Pages 8 and 9 in the Supplement: 

      “Psychometric curve fitting

      We used the quickpsy package in R to fit psychometric curves to each participant’s choice data to derive their actual indifference point (AIP), which was operationalised as the threshold parameter when predicting reminder choices from target values. We restricted the possible parameter ranges from 2 to 9 for the threshold parameter and from 1 to 500 for the slope parameter, based on the task’s properties and pilot data. Apart from those parameter ranges, we used only default settings of the quickpsy() function.

      Each participant has only 16 trials (2 for each target value) contribute to the curve fitting. To understand the robustness of the AIP based on such limited data, we conducted a parameter recovery analysis. We simulated 16 trials based on each psychometric function and re-ran the curve fitting based on those simulated choices. There was close correspondence between the actual and recovered threshold parameters (or AIPs) with a correlation of r = 0.97, p < 0.001 (see also Figure S1). In contrast, the slope parameter—which was not central to any of our analyses—exhibited greater variability during the initial fitting. This increased uncertainty likely contributed to its poor recovery in the simulation, as evidenced by a near-zero correlation (r = −0.01, p = 0.82).”

      (2) Along these lines, it would be helpful for the reader to actually see the individual psychometric curve, now how quickpsy was used (did you fit left and right asymptotes), etc, to understand how that fitting procedure works and how the assumptions of the fitting procedure compare to what can be gleaned through seeing the choice curves plotted.

      As stated above, we used default settings of the quickpsy() function and hence assumed symmetric asymptotes at 0 and 1. However, the reviewer mentions “left and right asymptotes”, so maybe this question is about restricting the possible parameter range for the threshold, which we restricted to values from 2 to 9, as described above.

      Regarding the individual curves, we have now include the following statement on page 9 in the Supplement: “Figures S2 to S31 show the individual psychometric curves that were estimated for each participant.” Please refer to the Supplement for the added figures.

      (3) A more full explanation of quickpsy, its parameters, and how choice curves look might also generate interesting further questions to think about with respect to biases and compulsivity. Two individuals might have similar indifference points, but an asymptote might reflect a bias to always have some percent chance of for example to take the reminders even at the lowest offer available for them.

      We agree that this is an interesting focus which we will keep in mind for future studies.

      (4) Regarding comparing OIP to AIP: 

      For OIP, as far as I can understand, the resolution of it is decreased compared to AIP.  Accuracies for OIP can only be 0/4,1/4,2/4,3/4, or 4/4. Yet, the resolution for AIP is the full range of offers (2 to 9) with respect to the parameter of interest (the indifference point). Could this bias the estimation of OIP (for instance, someone who scored 25% might actually be much closer to either 50 or 0, but we can't tell due to resolution?

      As mentioned in response to comment (1), we restricted the parameter range for the thresholds to 2 to 9 to increase comparability. The reviewer is right to point out that the OIP  still has lower resolution than the AIP, which is one of the downsides of having a shortened paradigm (cf. the longer version in Gilbert et al., 2019), which is optimised for online testing, especially if used in combination with additional questionnaires. We have no reason to believe though that this could have led to any bias, especially none that would contribute to the individual differences which are the main focus of our study.

      Gilbert, S. J., Bird, A., Carpenter, J. M., Fleming, S. M., Sachdeva, C., & Tsai, P.-C. (2020). Optimal use of reminders: Metacognition, effort, and cognitive offloading. Journal of Experimental Psychology: General, 149(3), 501–517. https://doi.org/10.1037/xge0000652

      (5) Additionally, it seems like the upper and lower bounds of OIP (0 and 10) differ from AIP (2 and 9). Could this also introduce bias (for example, if someone terrible performance, the mean would artificially be higher under AIP than OIP because the smallest indifference point is 2 under AIP, but could be 0 under OIP.

      See our response to comment (1), we fixed the range to 2 to 9 (which was the range of target values used in our study).

      (6) Finally seeing how CIT actually corresponds to accuracy overall (not a relative measure like AIP compared to OIP) I think would also be helpful as this is related to most points noted above.

      We included the suggested test as an exploratory analysis on pages 42-43 in the Supplement: “Third, we were interested in how the transdiagnostic phenotypes would correspond to performance. We therefore fitted a model which predicted internal accuracy (that is, unaided task performance on trials where no reminders could be used) from AD, CIT, and the other covariates (age, education and gender). We found that neither AD, β = -0.02, SE = 0.05, t = 0.44, p = 0.658, nor CIT, β = -0.03, SE = 0.05, t = -0.66, p = 0.510, predicted internal accuracy.

      The full results can be found in Table S13 as well as in Figure S32.”