14 Matching Annotations
  1. Mar 2023
    1. There are two main reasons to use logarithmic scales in charts and graphs.
      • respond to skewness towards large values / outliers by spreading out the data.
      • show multiplicative factors rather than additive (ex: b is twice that of a).

        The data values are spread out better with the logarithmic scale. This is what I mean by responding to skewness of large values.

      In Figure 2 the difference is multiplicative. Since 27 = 26 times 2, we see that the revenues for Ford Motor are about double those for Boeing. This is what I mean by saying that we use logarithmic scales to show multiplicative factors
  2. Apr 2020
    1. In the case of storing the data in log files, this is the case after seven days at the latest. Further storage is possible; in this case, the IP addresses of the users are erased or anonymized, so that an association of the calling client is no longer possible.
  3. Dec 2018
    1. Outliers : All data sets have an expected range of values, and any actual data set also has outliers that fall below or above the expected range. (Space precludes a detailed discussion of how to handle outliers for statistical analysis purposes, see: Barnett & Lewis, 1994 for details.) How to clean outliers strongly depends on the goals of the analysis and the nature of the data.

      Outliers can be signals of unanticipated range of behavior or of errors.

    2. Understanding the structure of the data : In order to clean log data properly, the researcher must understand the meaning of each record, its associated fi elds, and the interpretation of values. Contextual information about the system that produced the log should be associated with the fi le directly (e.g., “Logging system 3.2.33.2 recorded this fi le on 12-3-2012”) so that if necessary the specifi c code that gener-ated the log can be examined to answer questions about the meaning of the record before executing cleaning operations. The potential misinterpretations take many forms, which we illustrate with encoding of missing data and capped data values.

      Context of the data collection and how it is structured is also a critical need.

      Example, coding missing info as "0" risks misinterpretation rather than coding it as NIL, NDN or something distinguishable from other data

    3. Data transformations : The goal of data-cleaning is to preserve the meaning with respect to an intended analysis. A concomitant lesson is that the data-cleaner must track all transformations performed on the data .

      Changes to data during clean up should be annotated.

      Incorporate meta data about the "chain of change" to accompany the written memo

    4. Data Cleaning A basic axiom of log analysis is that the raw data cannot be assumed to correctly and completely represent the data being recorded. Validation is really the point of data cleaning: to understand any errors that might have entered into the data and to transform the data in a way that preserves the meaning while removing noise. Although we discuss web log cleaning in this section, it is important to note that these principles apply more broadly to all kinds of log analysis; small datasets often have similar cleaning issues as massive collections. In this section, we discuss the issues and how they can be addressed. How can logs possibly go wrong ? Logs suffer from a variety of data errors and distortions. The common sources of errors we have seen in practice include:

      Common sources of errors:

      • Missing events

      • Dropped data

      • Misplaced semantics (encoding log events differently)

    5. In addition, real world events, such as the death of a major sports fi gure or a political event can often cause people to interact with a site differently. Again, be vigilant in sanity checking (e.g., look for an unusual number of visitors) and exclude data until things are back to normal.

      Important consideration for temporal event RQs in refugee study -- whether external events influence use of natural disaster metaphors.

    6. Recording accurate and consistent time is often a challenge. Web log fi les record many different timestamps during a search interaction: the time the query was sent from the client, the time it was received by the server, the time results were returned from the server, and the time results were received on the client. Server data is more robust but includes unknown network latencies. In both cases the researcher needs to normalize times and synchronize times across multiple machines. It is common to divide the log data up into “days,” but what counts as a day? Is it all the data from midnight to midnight at some common time reference point or is it all the data from midnight to midnight in the user’s local time zone? Is it important to know if people behave differently in the morning than in the evening? Then local time is important. Is it important to know everything that is happening at a given time? Then all the records should be converted to a common time zone.

      Challenges of using time-based log data are similar to difficulties in the SBTF time study using Slack transcripts, social media, and Google Sheets

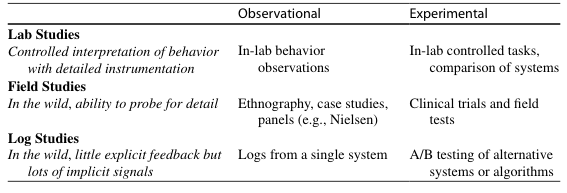
    7. Log Studies collect the most natural observations of people as they use systems in whatever ways they typically do, uninfl uenced by experimenters or observers. As the amount of log data that can be collected increases, log studies include many different kinds of people, from all over the world, doing many different kinds of tasks. However, because of the way log data is gathered, much less is known about the people being observed, their intentions or goals, or the contexts in which the observed behaviors occur. Observational log studies allow researchers to form an abstract picture of behavior with an existing system, whereas experimental log stud-ies enable comparisons of two or more systems.

      Benefits of log studies:

      • Complement other types of lab/field studies

      • Provide a portrait of uncensored behavior

      • Easy to capture at scale

      Disadvantages of log studies:

      • Lack of demographic data

      • Non-random sampling bias

      • Provide info on what people are doing but not their "motivations, success or satisfaction"

      • Can lack needed context (software version, what is displayed on screen, etc.)

      Ways to mitigate: Collecting, Cleaning and Using Log Data section

    8. Two common ways to partition log data are by time and by user. Partitioning by time is interesting because log data often contains signifi cant temporal features, such as periodicities (including consistent daily, weekly, and yearly patterns) and spikes in behavior during important events. It is often possible to get an up-to-the- minute picture of how people are behaving with a system from log data by compar-ing past and current behavior.

      Bookmarked for time reference.

      Mentions challenges of accounting for time zones in log data.

    9. An important characteristic of log data is that it captures actual user behavior and not recalled behaviors or subjective impressions of interactions.

      Logs can be captured on client-side (operating systems, applications, or special purpose logging software/hardware) or on server-side (web search engines or e-commerce)

    10. Table 1 Different types of user data in HCI research

    11. Large-scale log data has enabled HCI researchers to observe how information diffuses through social networks in near real-time during crisis situations (Starbird & Palen, 2010 ), characterize how people revisit web pages over time (Adar, Teevan, & Dumais, 2008 ), and compare how different interfaces for supporting email organi-zation infl uence initial uptake and sustained use (Dumais, Cutrell, Cadiz, Jancke, Sarin, & Robbins, 2003 ; Rodden & Leggett, 2010 ).

      Wide variety of uses of log data

    12. Behavioral logs are traces of human behavior seen through the lenses of sensors that capture and record user activity.

      Definition of log data