- Nov 2018
-
www.scienceintheclassroom.org www.scienceintheclassroom.org
-
19. Y. Lin, R. Jin, D. Cai, S. Yan, X. Li, in 2013 IEEE Conference on Computer Vision and Pattern Recognition (IEEE Computer Society, 2013), pp. 446–451.
Lin et al. address a known issue in hashing methods, which is that they often require a large number of hash tables to be effective.
To solve this problem, the authors propose a novel approach called compressed hashing. This approach uses sparse coding and is shown to be more effective than previously known hashing algorithms.
-
6. E. A. Hallem, J. R. Carlson, Cell 125, 143–160 (2006).
Hallem and Carlson analyze how the fly olfactory circuit encodes information about the specific qualities—such as quality, quantity, and duration–of an individual odor.
They test over 100 different odors and create an "odor space" that shows how the responses of olfactory receptors depend on an odor's chemical class, concentration, and molecular complexity.
-
4. A. C. Lin, A. M. Bygrave, A. de Calignon, T. Lee, G. Miesenböck, Nat. Neurosci. 17, 559–568 (2014).
Lin et al. consider the role of sparse coding in helping organisms remember specific odors.
They discover that sparsity in the olfactory circuit is controlled by a "negative feedback circuit" involving Kenyon cells and anterior paired lateral neurons. From their results, they suggest that sparse coding is important for helping flies store a large number of odor-specific memories without confusing or overlapping information.
-
strategies for similarity matching in the brain (21) and hashing algorithms for nearest-neighbors search in large-scale information retrieval systems.
In this paper, the authors were able to use their knowledge of the fly olfactory circuit to improve the performance of a standard LSH algorithm. This suggests that the brain uses computational strategies for similarity searches that are better than what are currently used in data science.
By studying the way the brain computes information, scientists can create faster and more efficient algorithms for solving the nearest-neighbor search problems that arise in everyday life (e.g. databases and search engines).
-
segregate
Set apart/isolate.
-
Replacing the dense Gaussian random projection of LSH with a sparse binary random projection did not hurt how precisely nearest neighbors could be identified
A typical LSH algorithm uses a dense Gaussian random projection, while the fly algorithm uses a sparse binary random projection. To test whether this made any difference in the performance of the two algorithms, the authors modified their LSH algorithm to use sparse binary random projections instead.
The result was that this made no noticeable difference in the performance of the two algorithms (see Figure 2A).
-
mean average precision
The mean average precision (MAP) is a way of measuring how well an algorithm is doing at a task.
Here, the authors took each algorithm (fly and LSH) and ran it against each data set (SIFT, GLOVE, and MNIST) for 1,000 different query inputs. This produced a list—also called a rank—of all the images or words that were similar to the query. Each item in the rank comes with a certain precision value that represents its accuracy.
Next, the authors added up all the precision values in the ranking (with the top-ranked values carrying the most weight) and divided the sum by the total number of items in the ranking to get the average precision (AP). They then took the average of all 1,000 APs (one for each query) to get the MAP.
Calculating a MAP for each algorithm and data set allowed the authors to compare the effectiveness of the algorithms.
-
Euclidean distance
The straight-line distance between two points in Euclidean space. Euclidean space is the traditional, three dimensional x,y,z space that is commonly used in geometry.
-
We compared the two algorithms for finding nearest neighbors in three benchmark data sets: SIFT (d = 128), GLOVE (d = 300), and MNIST (d = 784)
SIFT, GLOVE, and MNIST are three well-known data sets that researchers and computer scientists often use to test similarity search algorithms.
MNIST is the Modified National Standards of Instruments and Technology data set. It consists of handwritten digits, and each row of the matrix corresponds to an image.
SIFT stands for Scale-Invariant Feature Transform. It consists of reference images and can be used to extract specific features of those images (e.g. the corners of a door frame).
GLOVE, or Global Vectors for Word Representation, consists of word vectors. It is useful for measuring the linguistic or semantic similarity between two words.
-
empirically
By means of testing or observation rather than pure theory.
-
query
A question or search. A query image is the image "in question"—in other words, the image you want to find similar matches to.
-
Each KC receives and sums the firing rates from about six randomly selected PNs
Caron et al. developed a special tracing technique that allowed them to track the connections between KCs and PNs using a glowing, light-activated protein.
By observing the activity between the two, they found that KCs combine input information from a random combination of PNs. That is, they found no specific pattern or organization that relates the type of odor to the PNs that are activated. In addition, they didn't identify any preferred pathways between groups of PNs and individual KCs.
To learn more about the glowing, light-activated protein used in this research, check out this annotated resource from Science in the Classroom.
-
binary random connection matrix
A connection matrix is a table of rows and columns, each consisting of positions on a graph. In each entry, the matrix has a 1 or 0 depending on whether the row positions and column positions are adjacent (1) or not (0).
It is random because the connections (representing connections between PNs and KCs) are random, and it is binary because it uses only ones and zeros.
-
Kenyon cells
One of the types of cells found in the "mushroom bodies" of the olfactory system. Mushroom bodies are important for olfactory learning and memory and—you guessed it—look like mushrooms.
-
For the PNs, this concentration dependence is removed (7, 8); that is, the distribution of firing rates across the 50 PN types is exponential, with close to the same mean for all odors and all odor concentrations
In 2016, Stevens determined that PNs in the olfactory circuit use what's called a "maximum entropy code."
A maximum entropy distribution means that the olfactory circuit can encode the most number of stimuli using a fixed number of neurons. This means that even though the average firing rate of all the PNs will depend on the concentration of a specific odor, the response to all odors is statistically the same.
In other words, if you took 10 PNs and 10 odors, recorded the firing rate of each of the PNs in response to each of the odors, and created a histogram from the data, that histogram would always look the same—regardless of which 10 neurons and which 10 odors you chose.
-
only a small fraction of the neurons that receive odor information respond to each odor
Lin et al. discovered the neurological process that controls why so few olfactory neurons make up each odor "tag."
The reason is because when the cells that receive odor information, called Kenyon cells (KCs), become active, the anterior paired lateral neuron responds by slowing the activity of the KCs. The more active the KCs become, the harder the anterior paired lateral neuron works to block their activity. The few KCs that are left active after this process form the odor tag.
-
stimuli
Any thing or event that causes a neuron or set of neurons to become active.
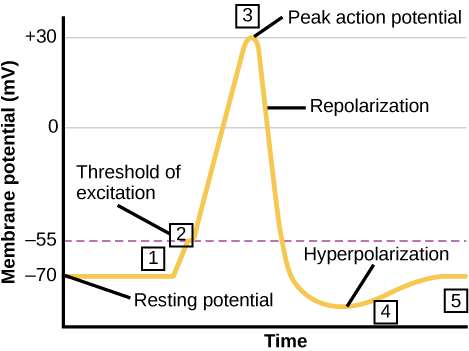
When a nerve cell is activated, it triggers an action potential, which is a temporary change in the electric charge of the cell relative to its surroundings. This depolarization causes nearby locations to similarly depolarize (think about a line of dominoes falling down) and an electrical signal travels through the brain.
On a graph, this action potential looks like a brief spike, which is why scientists sometimes refer to this process of neurons releasing action potentials as "spiking."
-
olfactory
Relating to the nose/sense of smell.
-
- Oct 2018
-
www.scienceintheclassroom.org www.scienceintheclassroom.org
-
9. S. J. Caron, V. Ruta, L. F. Abbott, R. Axel, Nature 497, 113–117 (2013).
Caron et al. investigate the specific process by which Kenyon cells integrate information sent to them from glomeruli.
Their results suggest that the input to KCs is random; that is, there is no discernible organization in how the glomeruli project information to individual KCs.
-
17. Z. Allen-Zhu, R. Gelashvili, S. Micali, N. Shavit, Proc. Natl. Acad. Sci. U.S.A. 111, 16872–16876 (2014).
Zhu et al. consider whether the physical properties of neural tissue are actually conducive to performing Johnson-Lindenstrauss (JL) calculations in the brain. For example, the fact that neurons are either inhibitory or excitatory has certain implications for the signs (+ or -) in a JL matrix.
They determine that it is indeed possible to construct JL matrices that accurately reflect the physical properties of the brain.
-
We then found the top 2% of predicted nearest neighbors in m-dimensional hash space
For the fly, the data is organized into a higher dimensional space. For LSH, it is organized in a lower dimensional space. But if the algorithms work effectively, the data should still be arranged so that similar features are near one another.
Instead of feature vectors, the algorithms arrange items in hashes or "tags" (just like the fly brain uses a tag to represent an odor, the algorithms use a tag to represent a specific image or word). Finding the hashes that are closest to each other in this new m-dimensional space should reveal the images/words that are most similar to each other (again, if the algorithm works correctly).
These nearby hashes are called "predicted nearest neighbors" because they predict which items in the data set are the most similar.
-
This proves that the fly’s circuit represents a previously unknown LSH family.
One of the properties of an LSH algorithm is that it can organize input points into a new, smaller-dimensional matrix while preserving the distances between points. The authors proved that the fly algorithm also has this property but uses a different approach than other known LSH options. The different approach, in part, is to expand the dimension, as opposed to contracting the dimension.
Therefore, the authors conclude that the fly's approach represents a completely new category of LSH algorithms.
-
we show analytically that sparse, binary random projections of the type in the fly olfactory circuit generate tags that preserve the neighborhood structure of input points.
In a mathematical proof, the authors took a matrix of input odors and multiplied it by a vector of projection values to create a new matrix of Kenyon Cell values. In this new matrix, the relative positions of the input odors were approximately the same as they were in the original matrix.
This shows that the fly algorithm preserves the distance between input points when sending information from PNs to KCs.
-
a mean that depends on the concentration of the odor
Hallem and Carlson conducted an analysis to determine how the fly's olfactory neurons would change their behavior in response to different types and concentrations of odor.
They found that the average strength of the receptors' response (i.e. the number of times the neurons were triggered) was dependent on the concentration of the odor. High concentrations brought on strong responses (a high rate of triggered neurons) from multiple receptor neurons, while low concentrations elicited a slower rate of neurons firing.
-
exponential
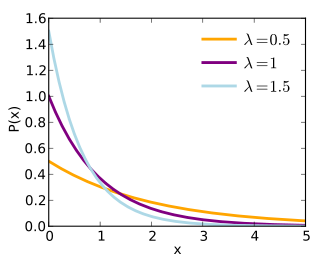
An exponential distribution is a type of probability distribution, In general, a probability distribution shows the probability that an event (such as a neuron firing) will occur over a given time interval. Specifically, an exponential distribution describes a situation where the probability that the event will occur is proportional to the length of the time interval.
Note: In the image, the x-axis is time, the y-axis is the probability, 1/λ is the mean (average) of the distribution. Each lamda(λ) curve represents an exponential distribution with a different mean.
-
glomeruli
Spherical structures located near the surface of the antennae lobe in the fly's brain.
-
sparse
Thinly populated. Here, it means that each tag consists of only a small percentage of the neurons present in the olfactory circuit. That is, only a small percentage of neurons fire action potentials in response to the odor.
-
The fly olfactory circuit generates a “tag” for each odor, which is a set of neurons that fire when that odor is presented
In 2015, Stevens identified a three-step code that the fly olfactory circuit uses to identify and respond to specific odors.
- Receptor neurons send odor information to specialized structures called glomeruli, which contain projection neurons.
- Projection neurons send the information to Kenyon cells in the mushroom body.
- These Kenyon cells form the odor label, or tag, and then pass the information along to another stage of neurons that then direct the fly's behavior.
-
approximate similarity (or nearest-neighbors) search
A type of algorithm that takes a point in a data set and then seeks to find other points in the set that are most similar to it.
-
fruit fly
Fruit flies have a long history of use in scientific (and especially medical) research. But why are they so popular? As insects, how do they contribute to our understanding of humans and other mammals?
Fruit flies can perform many of the same essential neural functions (albeit in a simpler form) as mammalian brains, and they are very tractable to study (there are genetic tools to measure and manipulate neural circuitry, and their brain size is order of magnitudes smaller than mice or other mammals). The hope is that by understanding fruit flies, it will offer researchers a basis or framework for studying more sophisticated brains.
Read more in The Guardian: https://www.theguardian.com/science/2016/sep/25/in-praise-of-the-humble-fruit-fly-genetics-research
-
- Sep 2018
-
www.scienceintheclassroom.org www.scienceintheclassroom.org
-
Johnson-Lindenstrauss
This is a mathematical statement that shows that you can take a small number of points in a high-dimensional space and transfer them to a lower-dimensional space while (very nearly) maintaining the distance between all the points.
You could think of this like taking all the points on a sculpture and projecting them onto a piece of paper while keeping every point in its proper position relative to all the other points on the sculpture.
-
we used 20k random projections for the fly to equate the number of mathematical operations used by the fly and LSH
As stated earlier in the article, the authors could only fairly compare the LSH and fly algorithms if each used the same number of mathematical operations.
They determined that if they used 20k random projections in the fly algorithm (where k is the length of the output tag, or hash) then the total number of operations for the fly and LSH algorithms would be equal.
For more detail, see the second paragraph under "Materials and Methods" in the Supplementary Materials document.
-
This led us to conjecture that the fly’s circuit produces tags that are locality-sensitive
AP Science Practices, Practice 6: The student can work with scientific explanations and theories.
Students should be able to articulate the authors' reasoning that led them to develop this theory. Looking at the results of the paper, students may also list specific conclusions that support or refute this theory.
https://apcentral.collegeboard.org/courses/resources/science-practices
-
inhibitory neuron
These cells send signals to surrounding neurons that make those cells less likely to fire.
-
feedforward
This describes an element in a system that passes information from a source (in this case, from odorant receptor neurons) forward to another element in the system (in this case, projection neurons).
-
The tag for an odor is computed by a three-step procedure
AP Science Practices, Practice 1: The student can use representations and models to communicate scientific phenomena and solve scientific problems.
Looking at the model in Figure 1A, students should be able to provide a verbal explanation of what the diagram is showing and what each shape and symbol represents.
https://apcentral.collegeboard.org/courses/resources/science-practices
-
circuit
A group of neurons connected by synapses (structures that allow electrical signals to pass between neurons) that carry out a specific function in the brain.
-
machine learning
A type of computer algorithm which relies on a large amount of input data to make a future decision about a new data point.
How do our brains use machine learning algorithms to make decisions? This article explores how machine learning affects everything from our belief systems to our online shopping habits.
Read more in Forbes magazine: https://www.forbes.com/sites/annapowers/2017/12/31/is-our-mind-a-machine-learning-algorithm/
-
Similarity search—for example, identifying similar images in a database or similar documents on the web—is a fundamental computing problem faced by large-scale information retrieval systems.
A Framework for K-12 Science Education: Disciplinary Core Ideas, Practice ETS1.A: Defining and Delimiting an Engineering Problem.
After reading and engaging with the article, students should be able to define:
- What a similarity search is
- What the limitations are with traditional LSH algorithms
- How the fly algorithm helps improve similarity searches
-
may also appear in other brain regions and species
AP Biology Practices Essential Knowledge 1.B.1: Students should be able to discuss how this statement supports the idea that "Organisms share many conserved core processes and features that evolved and are widely distributed among organisms today."
http://media.collegeboard.com/digitalServices/pdf/ap/10b_2727_AP_Biology_CF_WEB_110128.pdf
-
Our goal was to fairly compare two conceptually different approaches for the nearest-neighbors search problem
A Framework for K-12 Science Education: Science and Engineering Practices, Practice 7: Students should be able to evaluate whether the authors of this study accomplished their goal, citing specific evidence from the paper to support their argument.
-
Imagine that you are provided an image of an elephant and seek to find the 100 images—out of the billions of images on the web—that look most similar to your elephant image.
Common Core State Standards English Language Arts-Literacy, RST 11-12.6: Students should be able to explain why the authors provided this example in the paper, specifically addressing how it adds to the reader's understanding of the research.
-
we selected 1000 random query inputs from the 10,000 and compared true versus predicted nearest neighbors
From the 10,000 vectors, the authors randomly chose 1,000 of them to be query inputs (images or words that they would test against the rest of the feature vectors to find which ones represent similar images or words).
-
We used a subset of each data set with 10,000 inputs each, in which each input was represented as a feature vector in d-dimensional space
They chose 10,000 vectors of length d from each data set. Each vector represented an image (SIFT, MNIST), or word (GLOVE).
-
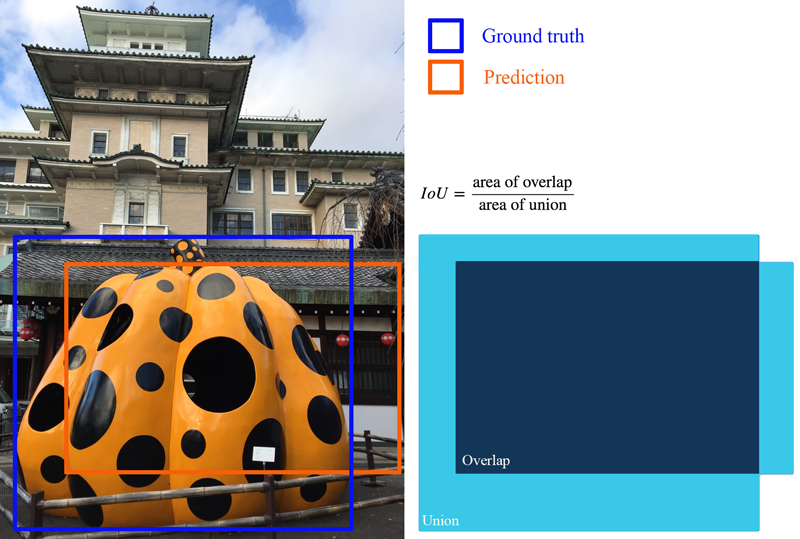
computed the overlap between the ranked lists of true and predicted nearest neighbors
This is a method of measuring how well an algorithm performed. The more overlap between the two lists, the more similar they are. If they are exactly the same, this means that the algorithm performed perfectly.
For example, it might mean that it found the closest match to all query images, or that it correctly found all the correct features that match part of an image (see picture below).
-
determined on the basis of Euclidean distance between feature vectors
Each feature vector contains a row of values representing features of an image or word (depending on the data set). Because the data is arranged so that similar features are near each other, measuring the straight-line (Euclidean) distance between two vectors allows the authors to determine the similarity between them.
That is, the closer the vectors, the more similar their features. The vectors closest to one another are the "true nearest neighbors," or the images/words in the data set most similar to one another.
-
synergy
An interaction between two elements that creates a combined effect greater than the sum of their parts.
-
Thus, locality-sensitive hashing may be a general principle of computation used in the brain
The authors note that the specific process that the fly olfactory circuit uses to identify odors is similar to what other researchers have seen in other animals and other parts of the brain (see Table 1).
From this observation, they conclude that the locality-sensitive hashing approach that they've identified in the fly olfactory circuit may not be limited to flies or even to odor recognition, but could be a standard processing technique that the brain uses for many different purposes.
-
With further expansion of the dimensionality (from 20k to 10d KCs, closer to the actual fly’s circuitry), we obtained further gains relative to LSH in identifying nearest neighbors across all data sets and hash lengths
For all three data sets (SIFT, MNIST, and GLOVE), the authors were able to improve the performance of the LSH algorithm by increasing the number of Kenyon cells that they used in the calculation. That is, using more KCs made it easier for the LSH algorithm to correctly identify the nearest neighbors (most similar images or words) in the data sets.
-
sparsifying the tag using WTA resulted in better performance than using random tag selection
The authors looked at how the LSH algorithm performed when using two different methods to create the tag:
- The tag is created from a random selection of Kenyon cells
- The tag is created from the Kenyon cells with the highest firing rates (this is the "winner takes all" or WTA approach)
The result was that the LSH performed better with the WTA approach. Note that the authors measured performance using the mean average precision (see Fig. 2B)
-
15. S. Dasgupta, A. Gupta, Random Structures Algorithms 22, 60–65 (2003).
Dasgupta and Gupta prove one result of the Johnson-Lindenstrauss theorem. This proof shows that a set of points in high-dimensional space can be mapped into a smaller dimensional space such that the distance between any two points changes only by a very small amount (1 ± ε).
This result forms the foundation of many LSH algorithms.
-
10. A. Andoni, P. Indyk, Commun. ACM 51, 117 (2008).
Andoni and Indyk provide an overview of efficient algorithms for nearest neighbor search problems.
They focus specifically on locality-sensitive hashing algorithms, highlighting one specific option within the LSH family that provides near-optimal performance on nearest neighbor search problems.
-
8. S. R. Olsen, V. Bhandawat, R. I. Wilson, Neuron 66, 287–299 (2010).
Olsen, Bhandawat, and Wilson describe one specific type of computation that occurs in olfactory processing in flies.
They show that this computation, known as divisive normalization, helps to equalize responses to different input stimuli. This same computation is also known to serve a similar purpose in many parts of the visual system.
-
2. D. Owald, S. Waddell, Curr. Opin. Neurobiol. 35, 178–184 (2015).
Owald and Waddell explore how memories of odors manifest in the fly's olfactory circuit and drive fly behavior
Specifically, they discover that dopamine plays a key role in this process. During learning, dopaminergic neurons reactivate Kenyon cells associated with specific odor tags. In this way, the fly recalls previously-learned odors.
-
1. C. F. Stevens, Proc. Natl. Acad. Sci. U.S.A. 112, 9460–9465 (2015).
Stevens outlines the three-layer architecture that makes up the fly's olfactory circuit.
He also presents the idea of a unique odor label, or "tag" that is comprised of a small set of neurons and helps the fly identify distinct odors.
-
the first step in the circuit essentially “centers the mean”—a standard preprocessing step in many computational pipelines
Olsen, Bhandawat, and Wilson showed that the fly olfactory circuit uses a specific type of processing known as divisive normalization. This process ensures that the strength of a neuron's output stays within a certain range.
This is important because a complex stimulus (e.g. one consisting of multiple odors) might elicit several different responses from a single neuron based on all the different aspects of the stimulus (type, concentration, molecular make-up, etc.). But thanks to divisive normalization, a neuron's response will look more like an average of all its responses rather than the sum of them.
-
all but the highest-firing 5% of KCs are silenced
Turner, Bazhenov, and Laurent quantified the sparsity of KCs by recording the spiking activity of the cells in response to input from the PNs. They discovered that at least three factors explain why such a small number (~5%) become active:
- The inputs from PNs last a very short time, which doesn't give KCs much time to build up their activity.
- Only a few PNs connect to each KC, so overall input levels are low.
- KC firing thresholds are high, meaning each KC must have very strong inputs in order to obtain the energy it needs to fire.
-
This is called the nearest-neighbors search problem, which is of fundamental importance in information retrieval, data compression, and machine learning
Andoni and Indyk explored how LSH algorithms can be applied to solving nearest-neighbor search problems. They showed that nearest-neighbor search problems are useful for any task where you want to find two similar objects, whether you're trying to retrieve information, recognize a pattern, or analyze data.
-
its many variants (16–18) provide strong theoretical bounds on how well locality is preserved when embedding data from d into m dimensions by using various types of random projections.
Achlioptas explored two specific applications of the Johnson-Lindenstrauss lemma that are particularly relevant to computer database applications. In doing so, he discovered a method of projecting points from a higher to lower dimensional space that was simpler and faster than other known methods. In fact, he showed that it was possible to perform this faster embedding process without affecting the quality of the results.
-
- Aug 2018
-
www.scienceintheclassroom.org www.scienceintheclassroom.org
-
This tag is critical for learning behavioral responses to different odors
Owald and Waddell discovered that the fly olfactory circuit is able to recall previously-learned odors through the help of specialized dopamine neurons. After a fly smells an odor, these dopamine neurons trigger changes in parts of the olfactory circuit that cause the specific neurons associated with the odor (aka the "tag") to fire.
Reactivating the tag causes the fly to remember the odor, as well as the values/meanings/context associated with it. The fly can then exhibit the appropriate behavior based on its prior learning (e.g. avoidance if the odor is associated with danger or approach if the odor is associated with a reward).
-
nearest neighbors
A "nearest neighbors" search takes a specific item and looks for other nearby items that are similar to it. This is a very common problem in everyday life (for example, a business owner who wants to find other coffee shops near hers, or a dating profile that wants to find compatible suitors nearby). But how exactly do nearest neighbors searches work? And how difficult are they to implement?
Read more in Quanta Magazine: https://www.quantamagazine.org/universal-method-to-sort-complex-information-found-20180813/
-
hashing
The process of taking a data set of any size and mapping (or organizing it) into a specific structure of a set size, such as a table. This makes it easy to find the data later if you need it.
A good example would be books in a library. By assigning each book a call number associated with its location, you can easily look up the book in a database and see where you should go in the library to find it.
-
discretizing
To represent by breaking up into individual, separate quantities.
-
motif
A distinctive, recurrent pattern of activity.
-
Gaussian random projections
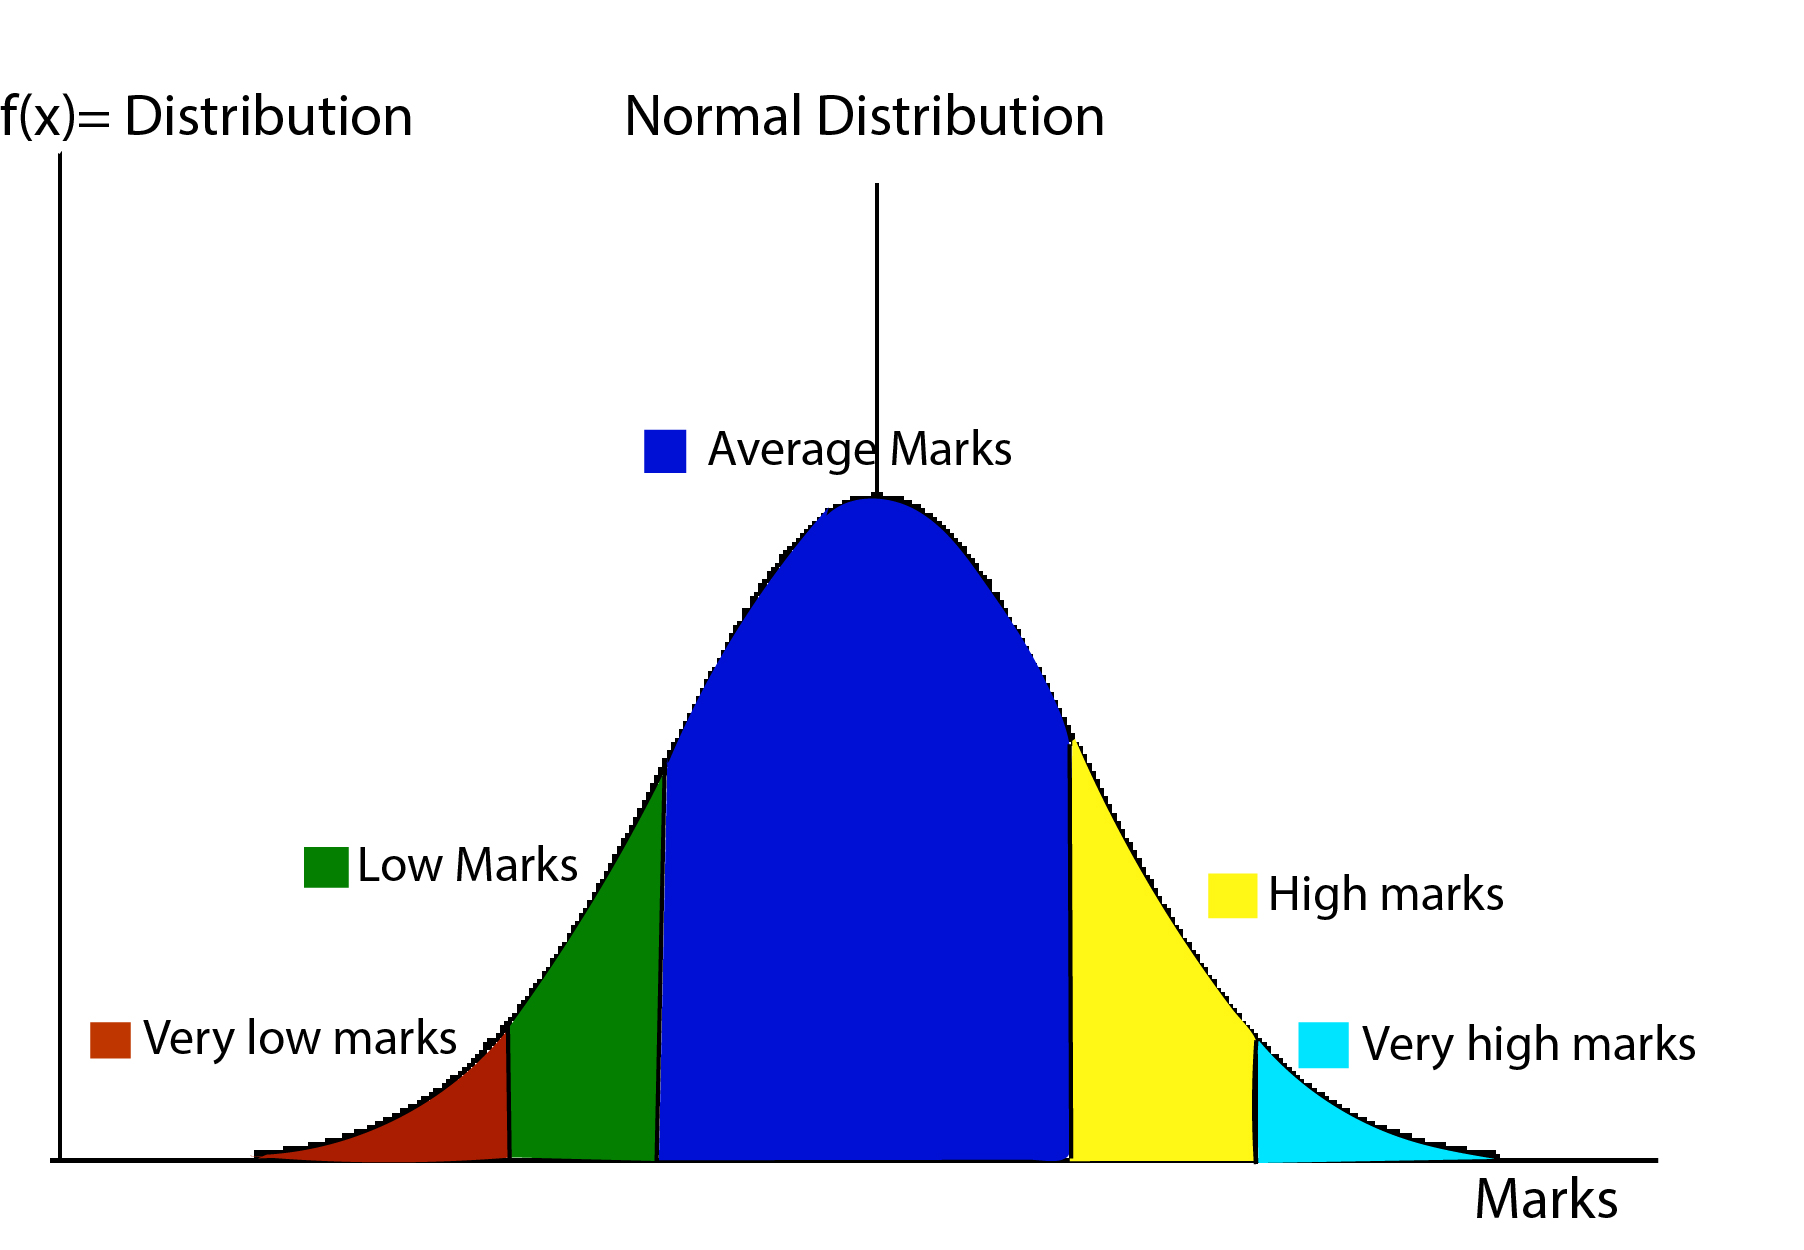
This is a matrix that is generated from a Gaussian distribution. In a Gaussian distribution, also called a normal distribution, the mean value has the highest probability of occurring, and values further away from the mean in both directions have a smaller chance of occurring. An example is a bell curve of grades, where most students get an average C grade and only a few students get either Fs or As.
-
divisive normalization
This is a common technique the brain uses in many different sensory systems (vision, hearing, smell, etc.). The calculation incorporates information about the neuron's receptive field (the area in which it is sensitive to a stimulus) as well as a measure of the contrast (difference) between local stimuli.
-
ported
Transferred.
-
clustering
In statistics, this is the process of organizing a set of objects (such as data points) into groups (or clusters) based on similar features.
-
semantic
Related to the meaning of words in a language.
-
lemma
Known in mathematics as a "helping theorem," this is a proposition that forms one part of a larger or more general theorem.
-
distance metric
A mathematical expression that defines the distance between any two elements in a set. Finding the distance between each of the elements in two feature vectors (each representing an image) would let you determine how similar those two images are. That is, the smaller the distance between the elements, the more similar the images are.
-
vector
A row of numbers.
-
inhibitory
Blocking an action or making it less likely to occur.
-
locality-sensitive
A type of hashing that aims to reduce the size of a large data set by mapping it into a table with fewer entries than pieces of data. To do this, similar pieces of data are assigned to the same entry in the table.
-
algorithm
A set of instructions that tells a computer how to carry out a task or solve a problem.
-