Dive into an underwater adventure with Mermaid Games! Explore magical oceans, solve puzzles, dress up mermaids, and uncover hidden treasures. Perfect for kids and fantasy lovers who dream of life beneath the waves. Start your journey today!
14 Matching Annotations
- Jun 2025
- Nov 2023
- Feb 2023
-
www.dandoescode.com www.dandoescode.com
Tags
Annotators
URL
-
-
jojozhuang.github.io jojozhuang.github.io
- Nov 2022
-
identity.foundation identity.foundation
Tags
Annotators
URL
-
- Aug 2022
-
mermaid-js.github.io mermaid-js.github.io
-
-
Mermaid allows even non-programmers to easily create detailed and diagrams through the Mermaid Live Editor.
-
- Feb 2022
-
about.gitlab.com about.gitlab.com
-
-
-
betterprogramming.pub betterprogramming.pub
-
Git Graph (Experimental)
Git graphs are a way to visualize your Git project commits, merges, and progress.
mermaid
gitGraph:
options
{
    "nodeSpacing": 150,
    "nodeRadius": 10
}
end
commit
branch newbranch
checkout newbranch
commit
commit
checkout master
commit
commit
merge newbranch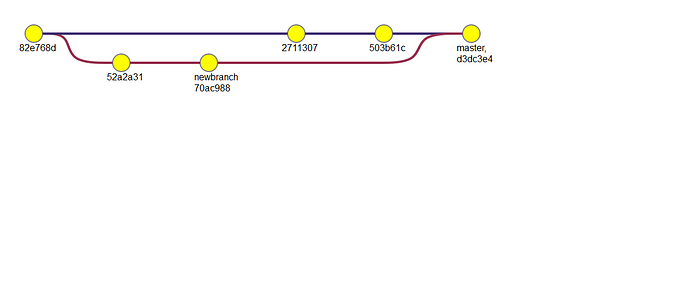
-
- Jan 2022
-
mermaid-js.github.io mermaid-js.github.io
-
Mermaid lets you create diagrams and visualizations using text and code.It is a Javascript based diagramming and charting tool that renders Markdown-inspired text definitions to create and modify diagrams dynamically.
Tags
Annotators
URL
-
-
github.com github.com
-
```mermaid
graph TD;
    A-->B;
    A-->C;
    B-->D;
    C-->D;
```

Tags
Annotators
URL
-