ANOVA
ANOVA is a collection of statistical models used to analyze the differences between group means.
ANOVA
ANOVA is a collection of statistical models used to analyze the differences between group means.
haplotype
Group of genes in the organism that was inherited from a single parent.
Monte Carlo Markov Chain
The Monte Carlo method is a tool used in statistics which can be applied to scientific research in which a distribution of the possible outcomes in a data set can be produced.
Since the same experiment can be repeated many times we must have outcomes that show the probabilities of different outcome happening.
STRUCTURE, version 2.3
A program developed by the Pritchord lab at Stanford uses genotype data to investigate population structure. Its uses include discovering distinct populations, assigning individuals to populations, studying hybrid zones, identifying migrants and mixed individuals, and estimating population allele frequencies.
We performed a x2 test on the proportions of individuals with the A or B chloroplast haplotype per site (table 1) to verify that our type designations, which were classified according to the results of the Williams studies (Williams et al. 2005, 2007) and following their site locality sampling, were correct.
Geiger et al. utilized the Pearson's chi-squared test (χ2), a statistical test applied to sets of categorical data to evaluate how likely it is that any observed difference between the sets arose by chance, to conclude the accuracy of the type designations given.
biomass
Biomass: Total mass of an organism or the mass of the organism in a a specific area.
The weight was taken when the plant was dry for the simple reason that different species can hold different amounts of water. In order to obtain a precise measurement and compare the different species, the plant had to be dried.
macerated
To soften or the use of liquids to soften.
USDA-ARS Invasive Plant Research Laboratory in Davie
The field laboratory is a branch of the University of Florida's Everglade Experiment Station. The objective of which is to conduct research on vegetables and forage crops on the sandy soils of lower east Florida.
Read more about the laboratory at https://www.ars.usda.gov/southeast-area/fort-lauderdale-fl/iprl/docs/history-of-the-iprl/
exocarps
Exocarp: The thin outer layer that covers the fruit.
An example of an exocarp would be the thin layer located on the outside of a grape or apple.
Mettler balance
Mettler balance is a laboratory balance used to measure small masses to the sub milligram range. It can measure from .1 mg to .0001 mg depending on the model.
as delineated by recent genetic analyses
Williams found that 51% (301) of Brazilian pepper trees analyzed had a eastern haplotype and 49% (291) had a western haplotype.
Haplotypes are a set of DNA variations that tend to be inherited together.
mesocarp
Fleshy middle layer of the fruit.
exocarp
The outer layer of the pericarp of the fruit. The skin of the fruit.
phenolic
Phenolic compounds are a class of plant secondary metabolites. These include a range of compounds such as phenolic acids, flavonoids, and other substances. They are responsible for fruit color.
perennial
A perennial is a plant that lives for two or more years. Most perennials flower multiple times during their life cycle.
that can destroy a significant proportion of the fruit
Wheeler's paper looked at the impact that Megastigmus transvaalensis had on the Brazillian Peppertree's Drupes. The wasp was found at all 18 sites surveyed containing the Brazilian Peppertree. The wasp damaged 23.5 ± 2.8% of the drupes during 1997–1998 and 38.5 ± 4.2% of the drupes during 1998–1999 in the winter. During the spring fruit production period, 76.3 ± 3.6% of the drupes were damaged by the wasp in 1998 and 74.8 ± 3.4% during the same period of 1999.
(Williams et. al 2007).
A survey of the Brazilian peppertree variance, was attained through spatial genetic and geostatistical research. Concluding with a history of dispersal, beginning with a short diffusive dispersal from South Florida, in where significant dispersal among intra-specific species is evidenced, instating long-distance jumps to North Florida.
dioecious
Dioecious refers to a plant or animal that has male and female reproductive organs in separate individuals.
with results showing there is often no proof of an inherent fitness advantage to these hybrids
Hardiman and Culley examined hybrid populations of the Callery Pear (Pyrus calleryana) in two different generations. They compared transpiration, stomatal conductance, and water use efficiency. In transpiration and stomatal conductance the advanced generation hybrids did better than the new hybrids but the advanced generation did worst in water use efficiency compared to the newer hybrids.
Current research has focused on hybridization, both inter- and intraspecific, as a means of promoting the evolution of invasiveness
Kolbe's paper looked at the evolutionary history regarding hybridization in lizards of the Galapagos islands.
Facon's study looked at the evolutionary history of snails.
Rieseberg's study looked at hybridization patterns in annual sunflowers.
intraspecific hybridization
Intraspecific hybridization occurs when the hybrid is born from parents of the same species that belong to different populations or breeds.
Dlugosch and Parker 2008
Dlugosch and Parker 2008- Surveyed the importance of or lack of genetic diversity among founding populations.
genetic variation
Genetic variation is variation in the alleles of genes both within and among populations.
This variation is brought about through mutations.
low-density
Founding populations of invasive species are often small, so they experience the founders effect. The founders effect is a loss of a genetic variation due to a smaller population size.
founding individuals
http://www.journaloffloridastudies.org/0102peppertree.html
Brazilian peppertree: a poster child for invasive plants in Florida
V. Manrique, University of Florida
J. P. Cuda, University of Florida
W. A. Overholt, University of Florida
This article provides an ample description of the impact that the Brazilian pepper tree is having on Floridian land. The article also provides information on measures being taken in order to control the species.
Stockwell et al. 2003
Stockwell et al. 2003- Discusses issues: (1) alternative perceptions of “evolutionary” and “ecological” time, (2) the role of contemporary evolution as an ecological process, (3) fitness as a bridge between evolution and conservation, and (4) challenges faced by conservation strategies based on gene flow estimation or manipulation.
progenitors
An ancestor or parent.
G. D. Gilfillan et al., Am. J. Hum. Genet. 82, 1003 (2008).
This study examines mutations in the SLC9A6 gene. Mutations in this gene have been linked to several neurological diseases, including X-linked intellectual impairment, microcephaly, epilepsy, and ataxia.
Through sequencing and linkage analysis, the authors determined that a deletion in the region of the gene that codes for the cation exchanger NHE6 is largely responsible for neurological symptoms.
G. A. Cox et al., Cell 91, 139 (1997).
This study describes the swe (slow-wave epilepsy) mouse mutant as a model for generalized epilepsy in humans.
The authors identified and mapped the mutation that caused epileptic symptoms, and discussed other effects the mutation might have.
A. E. West, E. C. Griffith, M. E. Greenberg, Nat. Rev. Neurosci. 3, 921 (2002).
This study examines the regulation of certain transcription factors by neural activity. It also investigated some of the mechanisms that regulate MEF2 activity.
M. L. Jacquemont et al., J. Med. Genet. 43, 843 (2006).
This study explored the heterogeneous nature of causes of autism, specifically using microarrays.
One of the major findings from this study was that patients with locus duplications have less severe symptoms than those with deletions.
J. Sebat et al., Science 316, 445 (2007).
This study looks at de novo copy number variations (CNVs) in autism.
They found that specific CNVs were present mostly in a single family out of their entire sample. They also showed differences in gene expression between simplex families (in which autism results from a de novo mutation) and multiplex families (in which autism is most likely inherited).
J. A. Vorstman et al., Mol. Psychiatry 11, 1 (2006).
This is a review of recent cytogenetic (the study of chromosomes) work on autism. The research discussed in this review looks as how large scale deletions, repetitions, and inversions in chromosomes may cause autism.
A small percentage (around 3%) of patients with autism have cytogenetic abnormalities. Vorstman et al. identify regions of different chromosomes that future researchers should focus on.
P. Szatmari et al., Nat. Genet. 39, 319 (2007).
This study showed that copy number variants (CNVs) are a risk factor for autism. The authors also suggest that autism could be caused by some oligogenic factors.
Oligogenically inherited traits are those that are determined mostly by a single gene, with other genes playing a smaller role in regulation and expression.
N. Risch et al., Am. J. Hum. Genet. 65, 493 (1999).
Risch et al. were among the first to propose that there may be multiple genetic abnormalities that can cause autism, and that these can affect different people in different ways.
E. Fombonne, J. Autism Dev. Disord. 33, 365 (2003).
A review of epidemiological surveys on autism.
The author concluded that autism is associated with intellectual impairment in about 70% of cases, and that it occurs more often in males. They also showed that there is no correlation between autism and social class, and that there is not enough evidence to conclude that race or ethnicity have an influence on incidence.
R. Canitano, Eur. Child Adolesc. Psychiatry 16, 61 (2006).
Canitano discusses the link between autism and epilepsy, showing that epileptic seizures are more frequent in patients who have autism with intellectual impairment.
The rate of comorbidity (simultaneous occurrence of both diseases) is 20-25%, meaning that around a quarter of people with autism also have seizures. This has to be taken into consideration for treatment plans.
a subset of seemingly heterogeneous autism-associated mutations
There are many different mutations that can cause autism. The mutations described in this paper are just one type.
Our finding that deletions of genes regulated by neuronal activity or regions potentially involved in regulation of gene expression in autism suggests that defects in activity-dependent gene expression may be a cause of cognitive deficits in patients with autism.
In some patients with autism, the authors found deletions of genes involved in postnatal brain development, which are normally regulated by neural activity. They also saw deletions in regions that are important to gene expression.
Taken together, these findings suggest that abnormalities in the expression of neural activity-dependent genes can lead to some of the symptoms associated with autism.
The connection between experience-dependent neural activity and gene expression in the postnatal period forms the basis of learning and memory, and autism symptoms typically emerge during these later stages of development.
The stages of brain development that occur after a child is born require input from the environment and regulation by neural activity. Some of this neural activity depends on a child's experiences. This is especially true during the later stages of development.
The regulation of expression of some autism candidate genes by neuronal membrane depolarization suggests the appealing hypothesis that neural activity–dependent regulation of synapse development may be a mechanism common to several autism mutations.
Several of the "candidate" genes (i.e., genes that may cause autism) the authors studied here are regulated by neural activity. Because of this, the authors suggest that disruptions in this regulation by neuron could be a potential cause of autism.
Endosomal trafficking and protein turnover
To function properly, cells are constantly creating, recycling, and transporting proteins. Interruptions in this process can be a cause of disease.
neuronal cell adhesion
Neurons express special proteins that allow them to adhere to each other and to other cell types. The ability to bind to each other is important for neurons' ability to communicate properly.
glutamatergic transmission
The release of glutamate, a common neurotransmitter.
Our data implicating noncoding elements in patients with shared ancestry, as well as the heterozygous nonsense changes in patients without shared ancestry, suggest that loss of proper regulation of gene dosage may be an important genetic mechanism in autism
In addition to disease-causing autosomal and recessive mutations, the authors showed that in some cases regulatory elements and gene dosage can contribute to autism.
homozygosity mapping provides an important approach to dissect this heterogeneity
Families that share a larger part of their genome are more likely to be homozygous for certain genes. Studying these families can make it easier to identify and isolate the effects of certain genes.
The heterozygous changes, in particular the nonsense mutation, likely affect gene dosage and suggest that the study of consanguineous pedigrees may identify genes of importance in nonconsanguineous populations as well.
Heterozygous mutations can be deleterious if two copies of the functional gene are required for a pathway. Even having one copy of the functional gene may not be enough.
The authors suggest that looking at consanguineous families may help identify genes of interest in nonconsanguineous pedigrees, where there is more diversity.
nonsense
A mutation that changes a codon that would normally correspond to an amino acid to a stop codon.
carried by two male siblings with autistic disorder as well as their mother
The authors found the NHE9 nonsense mutation in two male siblings with autism, as well as their mother, who showed childhood signs of intellectual disability.
In addition, one of the siblings had epilepsy and the other had symptoms of epilepsy (though no diagnosis).
The authors did not find the mutation in any of the controls, even on resequencing.
gene dosage-dependent
"Gene dosage" refers to the number of copies of a gene in a particular genotype. A gene is dosage-dependent if a certain number of copies is necessary for proper function.
Although there are many factors that influence gene expression, in general more copies of a gene will result in more protein product (either directly from the gene or as a result of regulatory mechanisms).
A similar nonsense mutation in the final extracellular loop has recently been found in the related NHE6 gene in a patient with an Angelman-like syndrome, which involves both autism symptoms and epilepsy
The mutation to NHE9 is also similar to a mutation in NHE6, which has been linked to a patient who exhibited symptoms of autism and epilepsy.
This nonsense change occurs within two amino acids of a similar nonsense mutation in Nhe1 that causes slow-wave epilepsy in mice
In the patients with epilepsy and autism, the authors found a NHE9 mutation that is similar to a mutation in Nhe1 that causes epilepsy in mice.
Mice with this mutation, called swe mice (which stands for slow-wave epilepsy mice), were the first mouse models of human generalized epilepsy.
we sequenced NHE9 in other patients with autism and epilepsy
The authors compared the genotypes of patients who have both autism and epilepsy to determine if these patients had similar mutations to NHE9 and surrounding genes.
stop codon
A stop codon (or termination codon) is a series of three nucleotides that stops the translation process.
It works by binding special proteins called "release factors." When these release factors reach the ribosome (the site of protein translation), they cause the new amino acid chain to separate from the ribosome, stopping translation.
pro-band
The term "pro-band" is used to refer to the patient being studied in biomedical research, especially research on genetics.
These transcriptional effects suggest that the homozygous deletions in autism patients may preferentially involve activity-regulated genes, either mutating their coding sequence (e.g., DIA1) or potentially affecting conserved DNA sequences (NHE9, PCDH10) that may be critical for proper transcriptional regulation.
The different ways that homozygous deletions affect the transcription of the three genes here suggests that abnormalities in neural-activity regulated genes may play a large role in autism.
Moreover, a separate screen using RNAi knock-down of NPAS4, a transcription factor activated in response to depolarization, showed that NHE9 was one of 292 out of 22,407 cDNAs (1.3%) whose transcription was significantly altered (in this case, increased) (Fig. 3D) (22), although NHE9 expression was not detectably altered by membrane depolarization alone
Unlike c3orf58 and PCDH10, expression of NHE9 was not significantly altered by changes in neural activity alone. However, NHE9 is among a small number of genes whose transcription was altered when the neural-activity regulated transcription factor NPAS4 was inhibited.
binomial test
A statistical measure of the probability that experimental results are due to chance. It is calculated by looking at the difference between the observed (experimental) results and the expected results (i.e. the results that would be expected if only chance were involved).
The results of the test are reported as a P value, which is a probability. In general, a P of less than 0.05 means that the results of an experiment are statistically significant (and not a result of chance).
transcriptional target of MEF2
MEF2 RNAi did not increase transcription of PCDH10 as much as it did c3orf58.
However, a fusion protein that contains MEF2 greatly increased transcription. This suggests that, even though MEF2 alone did not increase transcription, PCDH10 is a target of MEF2.
PCDH10
PCDH10 is a potential tumor suppressor protein. Abnormalities in PCDH10 have been found in many human tumor cells.
forward screen
A "forward" screen is used to identify the mutation(s) that leads to a given phenotype.
A "reverse" screen is used to identify the resulting phenotype from a given mutation.
We propose renaming this gene DIA1 (deleted in autism-1)
The authors propose renaming c3orf58 to deleted in autism-1 (DIA1) because they found evidence that it was causative of autism in patient AU-3101.
Genes are commonly renamed from "generic" names such as c3orf58 to more specific names that provide information about their function. Because there is no formal regulation of gene names, many genes have misleading names or multiple names.
which suggests that c3orf58 may be a direct or indirect MEF2 target
When the authors prevented MEF2 expression, they saw a corresponding inhibition of c3orf58 expression. This suggests that MEF2 either directly or indirectly mediates transcription of c3orf58.
MEF2 transcription factor
The myocyte enhancer factor 2 (MEF2) transcription factor is important to cell differentiation and embryonic development.
RNA interference (RNAi) knock-down
A biological pathway, found in many eukaryotes, in which RNA molecules inhibit gene expression. This is usually caused by the destruction of certain mRNA molecules.
This pathway is used by researchers to increase or decrease the activity of genes of interest.
neuronal membrane depolarization by elevated KCl
This technique is used to study enhanced neuronal activity that may result from changes in gene expression.
Elevated KCl (an increase in potassium outside the cell) results in a sustained depolarized state in three ways:
“neural activity–regulated” genes
Genes that are "activated" by neural activity will typically be transcribed more following a depolarization event (i.e., an action potential).
transcriptome
The portion of a cell's DNA that is transcribed. The transcriptome can be identified by looking at all of the mRNA in a cell.
blind to the genetic study
To increase the reliability of the results, the researchers may have removed information identifying samples as "experimental" or "control." This can decrease bias in the analysis of results.
hippocampal neurons
The hippocampus is a major component of the human brain and those of other vertebrates. It is part of the limbic system and has a crucial role in the consolidation of information, including short- and long-term memory and spatial navigation.
Rat and mouse hippocampal neurons are widely used in neurobiological studies. By isolating and growing individual neurons, researchers are able to analyze properties related to cellular trafficking, cellular structure, and individual protein localization.
microarray screens
An array is a grid of DNA samples that is used to identify and map genes.
In this experimental setup, the cDNA derived from the mRNA of known genes is immobilized. The expression pattern is then compared to the expression pattern of a gene responsible for a disease.
Neuronal activity induces a set of transcription factors (including MEF2, NPAS4, CREB, EGR, SRF, and others) with time courses of minutes to hours, and these transcription factors induce or repress specific target genes that mediate synaptic development and plasticity
A significant number of the genes identified by the authors in this study were transcription factors that are involved in the growth and development of the brain.
independently identified
Because the three genes were identified by independent screens, it increases the reliability of the authors' conclusions.
screens
A technique used to detect a mutation or abnormality and provide important information on its function. In this case, the authors screened for genes associated with autism.
There are many different types of screens depending on a researcher's needs, and they are widely used in scientific research.
Smaller deletions (also unique to the individual family) (table S5) were closest to CNTN3, encoding BIG-1, an immunogloglobulin super-family protein that stimulates axon outgrowth (32); RNF8, encoding a RING finger protein that acts as a ubiquitin ligase and transcriptional co-activator (33); and SCN7A (amid a cluster of voltage-gated sodium channels that also includes SCN1A, SCN2A, SCN3A, and SCN9A) on 2q
The authors found several smaller deletions in genes that are involved in the growth and development of the brain.
The authors point out that further evidence is needed to say these genes are causative of autism. However, they suggest that several of them are likely to be (specifically the larger deletions).
A second >300 kbp, linked, homozygous deletion (again not present in >2000 individuals other than this family) is closest to PCDH10 on 4q28 (Fig. 2 and table S5), which encodes a cadherin superfamily protein essential for normal forebrain axon outgrowth
Another deletion the authors found in patient AU-3101 is in a gene that codes for a protein involved in the growth of neurons.
previously reported to have been disrupted in a pedigree with a developmental neuropsychiatric disorder and mild mental retardation
Disrupted NHE9 has been found in a family with a developmental neuropsychiatric disorder and mild intellectual disability.
The fact that disrupted NHE9 has been found in multiple patients with neuropsychiatric disorders suggests it may be a cause of these.
transcription
The process of "reading" DNA to create mRNA, which then exits the cell nucleus to eventually be translated into a protein. This is the first step in protein synthesis.
The deletion completely removes c3orf58, which encodes an uncharacterized protein with a signal peptide that localizes to the Golgi (28). Moreover, the deletion is near the 5′ region of NHE9, such that only 60 to 85 kbp upstream
The deletion in patient AU-3101 removes c3orf58, which codes for a protein in the Golgi apparatus.
The deletion also removes part of the transcription initiation site for NHE9.
hemizygous
The deletion is homozygous (present on both chromosomes) in the boy, but present on only one chromosome from each parent.
Thus, the boy inherited the deletion from both parents.
we were surprised to see that several consanguineous pedigrees showed large, rare, inherited homozygous deletions within linked regions, some of which are very likely causative mutations
Although the authors did not sequence all linked regions (because of the time and cost associated with sequencing such large amounts of genetic material), they were surprised to find that several of the consanguineous families had rare inherited deletions.
The authors suggest that these large deletions may contribute to autism.
two families shared linkage to an overlapping region of chromosome 2q (AU-4500, lod = 2.41, and AU-4200, lod = 1.81) that has been previously implicated in other autism linkage studies
Only two families showed the same abnormality, in chromosome 2q. This abnormality has been previously found to contribute to autism.
Potentially linked loci were generally nonoverlapping between families, consistent with genetic heterogeneity
The results of the authors' homozygosity mapping showed that there is considerable diversity between different consanguineous autism families. They also found that the abnormalities in the chromosomes of patients with autism were not shared between families.
Taken together, these results suggest multiple genetic origins for autism.
The relatively reduced M/F ratio of affected children and the reduced rate of linked de novo CNVs in the consanguineous sample (not significantly different from rates in control) both suggest that consanguineous pedigrees with autism are enriched for autosomal recessive causes similar to other congenital neurological disorders in consanguineous populations
The higher proportion of affected women and the reduced rate of de novo CNVs in the consanguineous sample from this study both suggest a higher frequency of autosomal recessive causes for autism (and other neurological disorders) in consanguineous families.
A large study, using identical BAC arrays run in the same lab as our study, found 5.6% (84 of 1500) of patients referred to Signature Genomics with de novo or pathogenic CNVs (chi-square = 3.052, df = 1, P < 0.05) (25). The HMCA rate of de novo CNVs was similar to previously reported rates in multiplex pedigrees with autism [1.28% in the HMCA versus 2.6%, or 2 of 77, in multiplex autism (6), chi-square = 0.557, df = 1, P = 0.22] and in controls [1.28% HMCA versus 1.0%, or 2 of 196, in control subjects (6), chi-square = 0.001, df = 1, P = 0.49], despite the fact that the 500K platform used here has significantly higher coverage
Here, the authors compare their findings to other studies of de novo CNVs. They show that their results are similar to previous studies (such as Sebat et al.) that established the detection of de novo CNVs as a way to identify genes linked to autism.
overall rates of de novo CNVs that segregated with ASD were 0% in consanguineous multiplex (0 of 42 patients) and 1.9% in consanguineous simplex families (1 of 52 patients), which were considerably lower than reported for nonconsanguineous families
The data showed that de novo CNVs were much less frequent in consanguineous families (both simplex and multiplex) and the amount of inherited CNVs was high.
As stated above, the low rate of de novo CNVs that segregate with disease suggests that inherited factors have a larger role.
single-nucleotide polymorphism (SNP)
A variation of a single nucleotide in a DNA sequence. When less than 1% of a population carries the nucleotide at this position, this variation is classified as a SNP. Some SNPs are associated with certain diseases.
two sensitive methods for detecting them
Both the single nucleotide polymorphism array and BAC Comparative Genomic Hybridization arrays are used to detect the number of copies of a specific locus in a subject's DNA. This allows us to find out whether the locus is present on one or both chromosomes of a subject.
To do this, control DNA and experimental DNA are labeled with different fluorescent molecules of different colors (in the picture below, the control is red and the experimental is green).
If the experimental DNA and the control DNA are identical (i.e. the target variant is present on both chromosomes), the sample will appear orange. If the control DNA has deletions, the solution will appear red. It it has insertions, it will appear green.

the M/F ratio was 2.6:1 (34 males: 13 females) (fig. S1), compared to 7.4:1 (81 males: 11 females) for the other categories of families (i.e., nonconsanguineous and consanguineous simplex) (chi-square = 5.37, df = 1, P = 0.02)
The authors observed that the proportion of affected women from consanguineous multiplex families was double that of the HMCA as a whole, and triple that of simplex families.
This finding suggests an increased role of inherited autosomal mutations (as opposed to de novo mutations).
An increased role for inherited factors in autism families with shared ancestry was also suggested by a low rate of de novo CNVs that segregated with disease
The low rate of de novo CNVs suggests that abnormalities in autistic patients' genomes came from mutations that were already present in the parents, rather than new mutations.
what would be predicted if the prevalence of autism were doubled in these families
Hoodfar and Teebi studied the link between inbreeding and the prevalence of different genomic abnormalities.
IThey found that the prevalence of autosomal recessive disorders was more than doubled in consanguineous families.
we reasoned that a prominent involvement of autosomal recessive genes in autism would be signaled by differences in the male-to-female (M/F) ratio of affected children in consanguineous (related) versus nonconsanguineous marriages (although recessive causes of autism may still retain some gender-specific difference in penetrance)
Based on studies of other neurological birth defects, the authors hypothesized that differences between consanguineous and non-consanguineous families in the M/F ratio of affected children would suggest that autosomal recessive genes play a large part in incidence.
Marriage between first cousins increases the prevalence of neurological birth defects by about 100%
Because first cousins share a larger portion of their genome than two unrelated individuals, there is a higher chance that a child will inherit disease-causing mutations.
The Homozygosity Mapping Collaborative for Autism (HMCA) (21) has recruited 104 families (79 simplex and 25 multiplex) from the Arabic Middle East, Turkey, and Pakistan (table S1 and fig. S1), of which 88 pedigrees (69 simplex and 19 multiplex) have cousin marriages (i.e., parental consanguinity).
The authors selected families with one or more individuals affected by autism.
Among those families, about half have cousin marriages, which are referred to as consanguineous pedigrees.
A simplex family is one in which there is only one person with autism. A multiplex family has multiple people with autism.
Reliability between clinician assessments was high
In order to ensure that the results obtained from this study are reliable, the authors ensured that all of the teams were using the same clinical protocol in the same way.
homozygosity mapping
To improve the quality of results, the authors chose consanguineous families (families that share a very recent ancestor), because of their high risk of having autistic children.
Researchers at Johns Hopkins University reasoned that families with multiple females with autism must have special genetic variants for autism that can be more easily identified than when comparing other groups.
For more information, see the Hub at Johns Hopkins.
segregation analyses
A technique used to determine how a trait is inherited, and if it is inherited in a standard (Mendelian) way.
autosomal
Refers to the autosomes, or the 22 numbered chromosomes (which do not include the sex chromosomes).
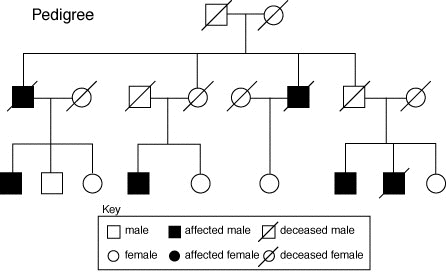
pedigrees
Refers to both the family tree and the ancestry of the subjects. In biology, pedigrees are represented with a standard set of symbols, such as those below:
The accumulating number of distinct, individually rare genetic causes in autism (5, 10, 11) suggests that the genetic architecture of autism resembles that of mental retardation and epilepsy, with many syndromes, each individually rare, as well as other cases potentially reflecting complex interactions between inherited changes (12).
Studies have shown that there are many unique combinations of mutations that can cause autism, as is the case with intellectual disability and epilepsy.
Unfortunately, given that there are so many ways for autism to occur, it is difficult to identify all of the mutations and changes that can lead to symptoms.
syndromic autism
Here, "syndromic" means common varieties of autism.
copy number variants
Phenomenon in which sections of the genome are repeated, deleted, or inverted. It has been shown that CNVs at specific locations increase the risk to develop autism.
chromosomal anomalies have been reported in 1 to 2% of cases of autism
Data supports the fact that autism is linked with several genomic regions. Nnew regions are still being identified today.
Autism includes mental retardation in up to 70%
Autism is associated with intellectual disability (formerly called mental retardation*) about 70% of the time, and males are more often diagnosed.
There is no evidence that social class has an impact on the incidence of the disease, but there is not enough data to know if race or ethnicity influence the incidence of autism.
There is also no available data to support the idea that incidence of autism is changing over time.
*For more on the movement to change the language of disability, see the Wall Street Journal.
de novo
In this article, the authors focus on patients who inherited long deletions or additions from their parents.
However, this is not the only approach to understanding the genetics of autism. Some look directly at the appearance of de novo single nucleotide polymorphisms (mutations to a single base).
de novo mutation
A mutation is de novo when it appears for the first time in an individual, rather than being inherited.
It is usually the result of a mutation in the germ line (the cells that produce sperm and eggs) of one of the parents, or a mutation that arises in the fertilized egg itself.
It is also known as a new mutation.
highly heritable, they exhibit wide clinical variability and heterogeneous genetic architecture, which have hindered gene identification
Several research teams have worked independently to identify loci that could be responsible for autism. However, this has been difficult due to the high number of genes that could be involved and the high variability between affected individuals.
neuropsychiatric
A mental health disorder that is caused by the nervous system.
heterogeneous disorders
Disorders like autism that can result from many different genetic anomalies.
Autism is difficult to characterize not only because there are many different genetic causes, but also because autism sometimes results when several otherwise benign mutations come together in the genome of an individual.
homozygosity mapping
A method for mapping genes involved in rare, recessive disorders. It is used in inbred populations (populations where many individuals are related to each other). Because these populations are very highly related, individuals will share large areas of their chromosomes in areas surrounding target genes.
level of expression changes in response to neuronal activity
Synapses (the electric signals that transfer information in the nervous system) regulate the expression of some genes.
Among the genes regulated by neuronal activity are those that are involved in learning.
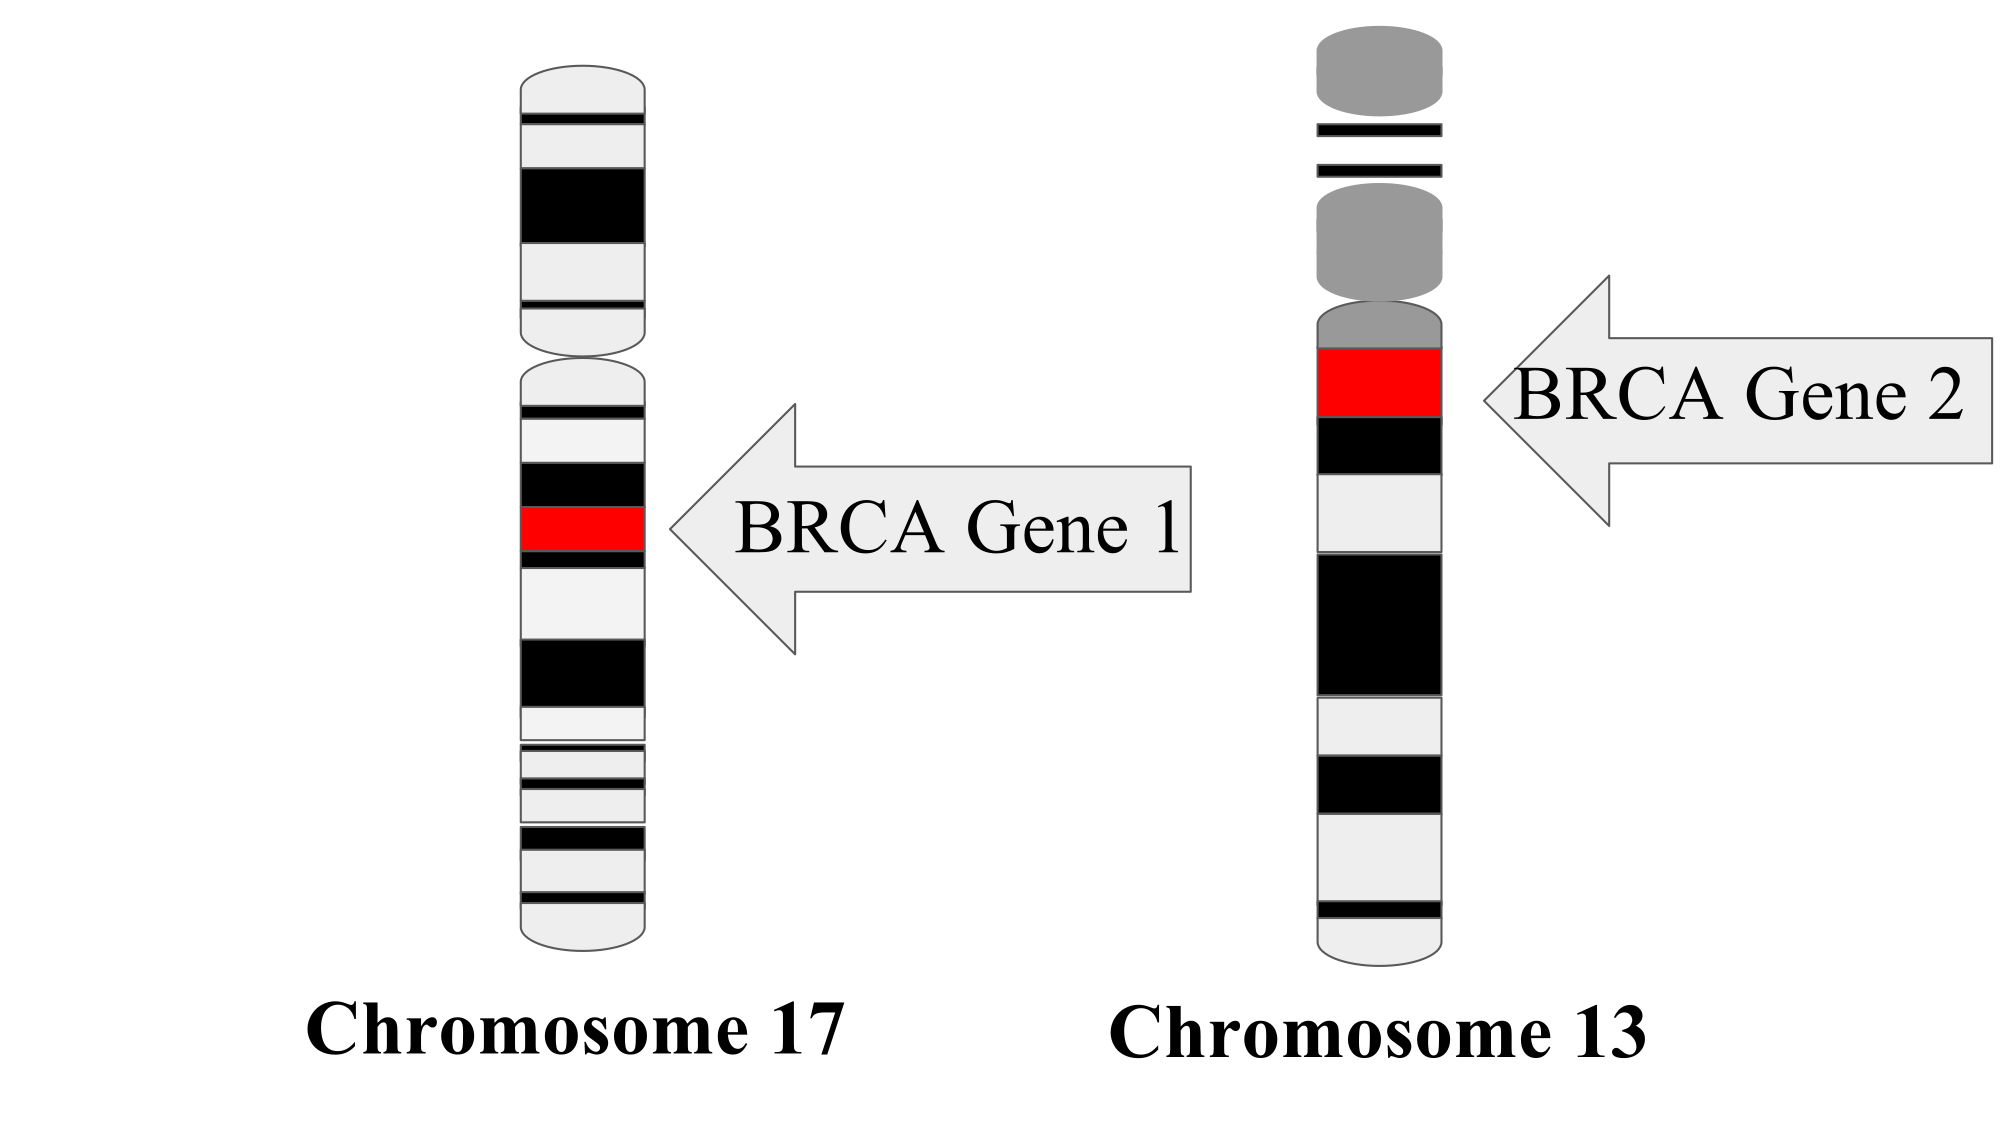
mapped several loci
Locus (pl. Loci.) : The locus of a gene is its physical location on a specific chromosome.
"Mapping" a locus means finding out where it is physically located on a chromosome.
Example: location of the genes BRCA 1 and BRCA 2:
autism-spectrum disorders
Autism-spectrum disorders (ASD), sometimes referred to collectively as "autism," are a family of developmental disorders that have different symptoms and intensities.
A. berteroi is effectively pollinated by two native solitary bees
The authors found that A. berteroi is best pollinated by bees.
This is drawn from the fact that other visitors did not carry or deposit pollen well.
Our results contrast with the findings of Moré et al. (2007) and de Araújo et al. (2014), who reported that flowers of Mandevilla spp. were pollinated exclusively by pollinators with long, thin proboscides. Additionally, de Araújo et al. (2014) reported that Agraulis vanillae and Ascia monuste are the effective pollinators of Mandevilla tenuifolia; coincidently, these two taxa were the same non-skipper butterfly visitors of A. berteroi in southern Florida.
Results were different from previous research who showed that one species were pollinated by long, thin mouth parts.
The principal pollinators of A. berteroi in the pine rocklands of south Florida are two native bees; bee pollination (mostly by Euglossine bees) has been previously reported for this family (Lopes and Machado 1999; de Moura et al. 2011).
The author is explaining that the pollination of the species "Euglossine" has been experimented on before. With this being said, the previous work tested these bees and how they interact with plants.
In the above article, the author is specifically experimenting on this family of bees and how they interact with A. berteroi in the pine rockland environment. The author is more concerned with how these bees interact with this specific plant.
Table 4. Proboscis measurements (mean and standard error) for flower visitors to A. berteroi. Proboscis width and length with the same letters are not significantly different with Tukey comparisons.
In this table, the author describes how the width and length of the insects proboscis play a role in pollination.
This chart was made to determine the differences in proboscis.
The complex flower morphology of A. berteroi is similar to the morphology described for other Apocynaceae (Barrios and Koptur 2011). The flowers restrict access to only those visitors with mouthparts long enough to reach the nectar at the base of the floral tube. Furthermore, the sugar concentration of the nectar (30–67 %) is within the range of values reported for flowers pollinated by long-tongued bees (∼40 %; Proctor et al. 1996). Although Pascarella et al. (2001) stated that A. berteroi is visited exclusively by Lepidoptera, our field observations showed that long-tongued bees were common floral visitors, as well as skippers. Skippers were the most frequent and constant visitors, often visiting numerous flowers of the same species in a row.
Apocynaceae flowers restrict visitors with mouthparts long enough to reach the base of the floral tube.
Previous data states that the A. berteroi species is only visited by skipper butterflies. However, the authors found they are also visited by long-tongued bees to the same extent.
appears that they were acting as nectar thieves.
These butterflies were taking the reward meant for true pollinators without actually aiding the plant in reproduction.
the width of the proboscis of the pollinators of A. berteroi is more important than the length in determining pollen transfer efficiency.
This study found a correlation between the thickness and effectiveness of feeding parts used by pollinators.
It is possible that a wide pollen receptacle results in a need to have thicker feeding parts.
The final test of pollinator effectiveness, whether flowers visited by the different pollinators set fruit, provided clear results. Placing potted plants in the field, observing visits, bagging, tagging and following subsequent fruit set showed that only flowers visited by long-tongued bees set fruit following a single visit. Of the 44 flowers visited by long-tongued bees, 16 (36.4 %) set fruit. None of the flowers visited by the other pollinator groups (4 by non-skippers butterflies, 19 by skippers and 2 by short-tongued bees) produced any fruit. Fruit set differed significantly among pollinator groups (Kruskal–Wallis test, χ23=111.7, P = 0.009, n = 69). Though the sample sizes were small for non-skipper butterflies and short-tongued bees due to their lower rate of visitation (Table 2), we also found that these groups of visitors do not carry significant amounts of pollen on their proboscides; consequently, we conclude that these two groups of visitors are much less effective pollinators of A. berteroi than are long-tongued bees.
The authors found that only flowers visited by long-tongued bees produced fruit after a single visit.
The authors also determined that non-skipper butterflies and short-tongued bees are less effective pollinators in comparison.
We then used monofilament nylon fishing line of four different diameters (4 lb, 0.20 mm diameter; 6 lb, 0.23 mm diameter; 8 lb, 0.28 mm diameter and 25 lb, 0.53 mm diameter) inserted into single flowers to simulate flower visits.
Fishing line was used to simulate repeatedly the collecting of nectar. This could then be used to see which line (stand-in for proboscis) collected the most pollen, and if it correlated with thickness.
Table 1. Flower visitors of A. berteroi observed in the study sites, and presence/absence of pollen on the proboscis.
In this table, the author describes various interactions the visitor encountered with plants.
Mann–Whitney test (post hoc)
Non-parametric (not assuming a normal distribution) statistical test that is used to compare two sample means that come from the same population, and used to test whether two sample means are equal or not. The authors conducted the Mann-Whitney test post hoc (after the Kruskal-Wallis test) in order to compare the groups (to investigate which groups significantly differ) but with corrections to control for inflation of type I error (false positive – determining differences in the dataset when there actually is none).
We chose the sites based on the presence of many individuals of the study species
This study site was a part of a previous experiment. In the previous experiment, the study site was chosen due to the abundance of individuals that were present. Essentially, the area with a higher abundance of individuals is beneficial to the experiment. It is beneficial to use previous work as a reference, especially if there is a common factor.
Angadenia berteroi bears large, showy, yellow, tubular flowers. They have the typical complex floral arrangement
This species that will be studied shows complex floral arrangements.
non-asclepiad
A plant that is not formally a part of the family Asclepiadaceae.
diversity and abundance
Diversity describes the number of species, while abundance describes how many individuals of each species.
The unusual flowers of the Apocynaceae vary in floral mechanisms (Endress and Bruyns 2000), and insects are the major floral visitors of Apocynaceae s.l.
The following conducted on Angadenia berteroi, a flower from the Apocynaceae family native to south Florida describe the pollination patterns of butterflies and bees.
http://2014.botanyconference.org/engine/search/index.php?func=detail&aid=116
tubular flowers
A type of flower that has a long, thin, tube-like structure. The tube-like structure is formed by the pedals and often separate the mouth into a flared shape.
In hawkmoth-pollinated plants, floral tube length determines which species may transfer pollen; hawkmoths with tongues that are too short or too long will not pick up pollen effectively
Floral tube length in hawkmoth-pollinated plants will determine which insect will transfer pollen. if it is too short or too long they will not be effective.
Several studies have reported that the body structure of floral visitors, especially the feeding apparatus associated with the dimensions and the morphology of the flowers, is one of the factors determining which visitors can effectively function as pollinators
The structure of the insect determines the effectiveness of the pollination as well as the shape of the flower like the length of mouth part and floral tube.
the majority of plant species are visited by a variety of pollinator groups, but visitation does not necessarily imply pollination; not all flower visitors are important and effective pollinators (Stebbins 1970; Waser et al. 1996; Fenster et al. 2004; Ne'eman et al. 2010).
Most plants show visitation from other insects but not all pollinate.
The natural geographic range of the genus in the New World is from northern Mexico to northern Argentina.
A new Piper species called Piper kelleyj was found in Equador by University of Cincinnati botanist Eric Tepe. The plant is now commonly known as "pink belly" pepper. This is because of the rosy underside of its leaves. It hosts 40 different species of insects (at least).
http://magazine.uc.edu/editors_picks/recent_features/herbarium.html
Finally, we assessed the degree to which Piperphylogenetic relationships are related to differences in secondary chemical composition and community assembly.
http://www.amjbot.org/content/102/2/273.long
The research by Martinez and his colleagues used fossil from Piper and compared them to angiosperm species (a plant that has flowers and produces seeds) in order to evaluate the age divergence of the taxa. The divergence was estimated at thirty millions years.
Most of the chemicals found by our analysis are well known to confer direct and indirect anti-herbivore protection to plants
The Piper species that were sampled were found to contain secondary chemicals that likely function to protect the plant from herbivores.
phylogeny
Evolutionary history that traces the relationship between organisms.
allelopathy
A mechanism plants use to ensure their survival.
The plant produces one or more biochemicals that affect neighboring competitors in their growth and/or reproduction.
Our results suggest that Piper species that are chemically dissimilar from those already present in a patch would be more likely to colonize and persist within the patch.
Species with different chemical properties are less likely to compete with one another, therefore tend to coexist with each other.
Nonetheless, phylogenetic underdispersion was significant for both -NRI and -NTI, a result that supports the idea that the effect of phylogeny on community assembly is associated with strongly conserved traits not measured in this study.
Species that are closely related tend to coevolve, which allows them to coexist together more easily than non-related species.
Sedio et al. 2013
Sedio describes the phylogenetic niche conservatism (PNC) phenomenon that occurs in plants.
In this phenomenon, a plant's microhabitat patterns are influenced by the biogeographical history of the plant's ancestors. He explains how related taxa are able to coexist since they were able to retain significant niche characteristics of their common ancestors.
Kursar et al. (2009)
The young leaves make large energy investments in chemical, developmental defenses, and floral nectar.
There were many variations among species suggesting that herbivory is a strong selective agent.
Cavender-Bares et al. 2004
The research performed by Cavender-Bares and his colleagues highlights the importance of evolutionary processes combined with community interactions in community dynamics.
The combination of phylogeny with their functional attributes help in better understanding communities.
MacArthur and Levins 1967
MacArthur and Levins explain that diversity of species living within the same environment can be explained as a result of limiting similarity.
(Götzenberger et al. 2012)
Götzenberger's research suggest that species distribution is largely influenced by intraspecific competition (competition within the same species)
As the number of superior competitors increases, diversity decreases. This holds true only until other species are excluded.
abiotic environment
Non-living physical and chemical components that affect living organisms and the surrounding ecosystem.
Hartmann 2007
Hartman's research focused on secondary metabolism in plants. These were associated with genes that have a high ability to change and adapt to the pressures of their environment.
Each plant population has unique secondary chemicals that have adapted to a plant's specific niche.
Swenson 2013
Swenson summarizes how to estimate the similarity between species by using both functional traits and phylogenetic trees.
He uses the data from these approaches to test the mechanistic community hypothesis.
we tested six sgRNAs targeting enhanced green fluorescent protein (EGFP)
The authors used sgRNAs to target enhanced green fluorescent protein (EGFP) cells.
The EGFP cells allow the cell to express fluorescent color. sgRNAs target these cells and destroy them. In cells where the sgRNA removed the EGFP gene, there is no fluorescent color.
Contrasting taxonomic and functional responses of a tropical tree community to selective logging
In logged habitats, does diversity of species, or their function in the ecosystem matter more?
crypt regions of the organ
See Dr. Bethany Radar and Dr. Ned Ruby use confocal images and immunocytochemistry to look at Vibrio fischeri in the crypts of the light organ:
46. Bhatt US et al. 2010 Circumpolar Arctic tundra vegetation change is linked to sea ice decline. Earth Interact. 14, 1 – 20. (doi:10.1175/ 2010EI315.1)
Sea ice decline due to global warming is affecting plant productivity in arctic regions.
16. Chapin III FS, Shaver GR. 1985 Arctic. In Physiological ecology of North American plant communities (eds BF Chabot, HA Mooney), pp. 16– 40. New York, NY: Chapman and Hall.
This paper explains the effects of low temperatures on the development of arctic plants.
15. Lambert AM, Miller-Rushing AJ, Inouye DW. 2010 Changes in snowmelt date and summer precipitation affect the flowering phenology of Erythronium grandiflorum (glacier lily; Liliaceae). Am. J. Bot. 97, 1431– 1437. (doi:10.3732/ajb. 1000095)
This paper talks about the implications that alterations in the phenology of E. grandiflorum might have on its surrounding environment specially pollinators and herbivores.
11. Arft AM et al. 1999 Responses of tundra plants to experimental warming: meta-analysis of the International Tundra Experiment. Ecol. Monogr. 69, 491– 511.
This source compiled the data from 13 ITEX sites and analyzed how the phenology, growth, and reproduction of plants in Tundra regions was affected by warming climate.
8. Xu L et al. In press. Temperature and vegetation seasonality diminishment over northern lands. Nat. Clim. Change. (doi:10.1038/nclimate1836)
This paper adds on by going more in depth on how an increase in temperature near the poles is affecting the photosynthetic activity in the plants living in these regions.
3. Cleland EE, Chuine I, Menzel A, Mooney HA, Schwartz MD. 2007 Shifting plant phenology in response to global change. Trends Ecol. Evol. 22, 357– 365. (doi:10.1016/j.tree.2007.04.003)
Changes in plant phrenology prove that plants are being influenced by environmental changes.
1. Maxwell B. 1992 Arctic climate: potential for change under global warming. In Arctic ecosystems in a changing climate: an ecophysiological perspective (eds FS Chapin, RL Jefferies, JF Reynolds, GR Shaver, J Svoboda), pp. 11–34. San Diego, CA: Academic Press.
Maxwell builds on this data by presenting the different models used to study the effect of climate change in the Arctic ecosystems.
[46]
Sea ice decline due to global warming is affecting plant productivity in arctic regions.
[12]
Heat sums have increased over time for flowering and senescence. Warming induced early leaf bud bursts, growth, and reproduction but did not affect senescence. Study was performed in multiple sites in the arctic region over a course of four years.
[11].
Warming induced early leaf bud bursts, growth, and reproduction but did not affect senescence. Study was performed in multiple sites in the arctic region over a course of four years.
Significance
Climate change will result in a shifting of where plants are usually located on the planet. Southern plants will move into higher latitudes, for example.
p = 0.013
P values greater than 0.001 are generally considered insignificant in statistics.
(H2) Flower and leaf bud break of high Arctic plants should be more sensitive to temperature increases than those of low Arctic and alpine plants.
The trends found indicated that high-elevation Arctic plants grew, flowered and aged at lower heat thresholds than low-elevation Arctic and alpine plants.
Flower and leaf bud break are occurring earlier as sites become warmer.
There was a strong negative relationship between the temporal trend of phenological events and the summer temperature trend for each species and site.
temporal trends of heat sums (βTDD_x_YEAR) showed significantly increased heat sums over time for greening but a tendency for lower heat sums over time for flowering and senescence.
The accumulated daily temperature required for plant growth has increased over time.
The accumulated daily temperature required for flowering and aging has decreased over time.
Trends in the timing of events as represented by βDOY_x_YEAR showed significantly later greening (positive slope) but tendencies for earlier flowering and earlier senescence (negative slopes) over the study.
With warmer temperatures, plants are growing at a later time in the year but flowering and aging at an earlier time in the year.
case-resampling bootstrap approach
"Bootstrapping" is a process that allows scientists to ensure that their statistical data sets are correct by doing hundreds of random samplings.
To determine whether observed trends in the timing of phenological events were associated with summer temperature trends, we tested the relationship between (βDOY_x_YEAR) with the summer temperature trend (βDOY_x_TAIRSUMMER) for each species at each subsite using linear mixed models, with site, subsite (nested within site) and species as random factors in JMP.
Statistical analysis such as linear mixed models were used to demonstrate if the trends in the timing of phenological events were associated with the temperature during the summer.
The slope of this relationship (β in days °C−1) has been termed the temperature sensitivity by other authors
Large species sampling size necessary (or interspecific variation in species may be too high)
Warming experiments underpredict the advance of spring events
Experimental results alone cannot be used for parameterizing species distribution and ecosystem models
Best (currently) measure: observational data
Because site effects such as latitude, elevation and species traits have strong influences on the calendar date that a phenological event occurs, we did not use the DOY associated with a phenological event as a direct measure of phenological response. Instead, we used two types of measures that are largely independent of the site-specific properties (table 2). First, we calculated the TDD from snowmelt until the occurrence of the phenological event for each species-plot combination. This measure reflects the amount of heat accumulated from snowmelt until the phenological event was observed. Second, for each species-subsite combination, we calculated the slopes (β) of the relationships between the timing of the phenological event (represented as DOY or TDD) and the calendar year or site temperature (measured as air temperature of the spring or summer).
Two types of measures were used to calculate the time of phenological events. One of them was thaw degree days (TDD) which was able to show how much heat was produced from snowmelt until the phenological response occurred. The other measure was done by comparing the slopes of each species-subsite. The slopes represented the time of the phenological event and the year or temperature it took place. One of the advantages of this measure is that it shows the comparison between species and sites.
To evaluate potential differences in species responses among locations, sites were categorized into climatic zones as in previous syntheses [11,22,23]: high Arctic, low Arctic or alpine. Subsites were categorized as dry, moist or wet, where dry refers to plant communities on well-drained, mineral soils typically located on ridges, moist refers to sites with some soil drainage, and wet refers to plant communities with water tables frequently near or above the surface.
The different locations used was categorized based on climate zones which were high Arctic, low Arctic, and alpine. They were also categorized as dry, moist, or wet.
Consequently, we used mean temperatures of month combinations (spring = April–May and summer = June–August temperatures) as the basis of the temperature analysis.
The average temperature for spring and summer times within a year were used to analyze temperature change throughout the experiment.
Mean monthly air temperatures for the months preceding the growing season and months of the growing season (April–August) were calculated for each study site each year for comparison with plant phenology.
The plant phenology was compared with the mean monthly air temperatures.
A cubic spline interpolation
Used to show the most accurate average of the temperatures.
The weather dataset was based on data collected at the sites
The data used for the weather was gathered from the specific site. However, in some places such as Finse, Norway, where the weather data was not available for a period of time, the averages from previous years was used.
A priority-ranking lumping scheme that accounted for differences in plant morphology was used to consolidate phenological variables, although for a given species at a subsite, the phenological definitions were consistent over time.
The plants were ranked based on the way they looked.
Flowering and leafing stages were compiled from most sites at an observation resolution of one to two times per week.
The plants' flowers and leafs were measured once or twice a week.
38. Ollerton J, Killick A, Lamborn E, Watts S, Whiston M. 2007. Multiple meanings and modes: on the many ways to be a generalist flower. Taxon 56:717–728. doi:10.2307/25065856
The meaning of a generalist flower can mean different things to different people. This review aims to assess these different meanings in the context of the ecological processes such as pollination.
36. Ne'eman G, Jürgens A, Newstrom-Lloyd L, Potts SG, Dafni A. 2010. A framework for comparing pollinator performance: effectiveness and efficiency. Biological Reviews 85:435–451.
Measuring pollinator performance is significant to conservation efforts. However, comparing pollinator performance among pollinator groups is difficult due to the differences in collection methods and the diversity of the pollinators. This review resolves vague concepts.
34. Moré M, Sérsic AN, Cocucci AA. 2007. Restriction of pollinator assemblage through flower length and width in three long-tongued hawkmoth–pollinated species of Mandevilla (Apocynaceae, Apocynoideae). Annals of the Missouri Botanical Garden 94:485–504. doi:10.3417/0026-6493(2007)94[485:ROPATF]2.0.CO;2
The author studied the way the species of insects obtain the flowers nectar. Specifically, the flowers that have a greater length to their nectar. This research was to determine how specific insects can obtain nectar and what specific plants they have to go to gain what they are looking for.
27. Inouye DW. 1980. The effect of proboscis and corolla tube lengths on patterns and rates of flower visitation by bumblebees. Oecologia 45:197–201. doi:10.1007/BF00346460
The Authore studied how length of mouth parts and tubes will affect the vistiation from bumble bees
22. Galetto L. 1997. Flower structure and nectar chemical composition in three Argentine Apocynaceae. Flora192:197–207.
The author researched the floral structure and what components are in their nectar in three different "Apocynaceae" species. Reviewing these components can verify the similarities each plant may have with each other.
10. Campbell DR, Waser NM, Price MV. 1996. Mechanisms of hummingbird-mediated selection for flower width in Ipomopsis aggregata. Ecology 77:1463–1472. doi:10.2307/2265543
The author studied how hummingbirds pollinate flowers
7. Barrios B, Koptur S. 2011. Floral biology and breeding system of Angadenia berteroi (Apocynaceae): why do flowers of the pineland golden trumpet produce few fruits? International Journal of Plant Sciences172:378–385. doi:10.1086/658153
The author studied the biology of flower plant "Angadenia berteroi" and how they breed.
4. Arbulo N, Santos E, Salvarrey S, Invernizzi C. 2011. Proboscis length and resource utilization in two Uruguayan bumblebees: Bombus atratus Franklin and Bombus bellicosus Smith (Hymenoptera: Apidae). Neotropical Entomology 40:72–77. doi:10.1590/S1519-566X2011000100010
Arbulo et. al. studies the proboscis length of two Uruguayan bumblebees in relation to the depth of the floral tube. The study found both species of bumblebees used the cultivated species of flowers. However, they did so in different amounts.
2. Alexandersson R, Johnson SD. 2002. Pollinator–mediated selection on flower–tube length in a hawkmoth–pollinated Gladiolus (Iridaceae). Proceedings of the Royal Society B: Biological Sciences 269:631–636. doi:10.1098/rspb.2001.1928
How tube length will determine the type of pollination
1. Adrienne B, Venables B, Barrows EM. 1985. Skippers: pollinators or nectar thieves? Journal of the Lepidopterist's Society 39:299–312.
The author researched other articles based on pollinators and nectary reward
species chemical dendrogram
An informal phylogenetic tree that represents clusters of species with similar characteristics.
induction
Secondary compounds that are only present after a stimulus occurs.
For instance, one stimulus could be leaf damage caused by herbivory.
gas chromatography mass spectroscopy (GC-MS)
Gas Chromatography: Used to separate and analyze compounds that do not decompose. Measures the content of multiple components in a sample.
Mass Spectroscopy: Measures the characteristics of individual molecules. This is done by converting the molecules into ions so they can be manipulated by magnetic and electrical fields.
GC-MS is a machine that does both.
community assembly
The factors that dictate the presence and amount of a species within a community.
sympatric
Species or populations that reside in the same geographic area.
ecologically divergent
Differences with species resulting from reproductive barriers.
“species-limiting similarity”
The most amount two species can share their living environments and still coexist.
trophic level
Level in the food chain an organism belongs to in an ecosystem. For instance, plants that are primary producers belong to the first trophic level.
congeneric taxa
Of related nature or origin. Of the same genus.
communities
A collection of plants or organisms in a specific geographical area that exist at a specific time.
secondary chemical composition
Compounds that play a role in a plant's ecological interaction with its environment.
For example, secondary compounds may function in protection against herbivores and/or pollinator attractants
sweet tastants
Synthetic (lab-made) sugars.