Author response:
Reviewer #1 (Public review):
Wang et al., recorded concurrent EEG-fMRI in 107 participants during nocturnal NREM sleep to investigate brain activity and connectivity related to slow oscillations (SO), sleep spindles, and in particular their co-occurrence. The authors found SO-spindle coupling to be correlated with increased thalamic and hippocampal activity, and with increased functional connectivity from the hippocampus to the thalamus and from the thalamus to the neocortex, especially the medial prefrontal cortex (mPFC). They concluded the brain-wide activation pattern to resemble episodic memory processing, but to be dissociated from task-related processing and suggest that the thalamus plays a crucial role in coordinating the hippocampal-cortical dialogue during sleep.
The paper offers an impressively large and highly valuable dataset that provides the opportunity for gaining important new insights into the network substrate involved in SOs, spindles, and their coupling. However, the paper does unfortunately not exploit the full potential of this dataset with the analyses currently provided, and the interpretation of the results is often not backed up by the results presented. I have the following specific comments.
Thank you for your thoughtful and constructive feedback. We greatly appreciate your recognition of the strengths of our dataset and findings Below, we address your specific comments and provide responses to each point you raised to ensure our methods and results are as transparent and comprehensible as possible. We hope these revisions address your comments and further strengthen our manuscript. Thank you again for the constructive feedback.
(1) The introduction is lacking sufficient review of the already existing literature on EEG-fMRI during sleep and the BOLD-correlates of slow oscillations and spindles in particular (Laufs et al., 2007; Schabus et al., 2007; Horovitz et al., 2008; Laufs, 2008; Czisch et al., 2009; Picchioni et al., 2010; Spoormaker et al., 2010; Caporro et al., 2011; Bergmann et al., 2012; Hale et al., 2016; Fogel et al., 2017; Moehlman et al., 2018; Ilhan-Bayrakci et al., 2022). The few studies mentioned are not discussed in terms of the methods used or insights gained.
We acknowledge the need for a more comprehensive review of prior EEG-fMRI studies investigating BOLD correlates of slow oscillations and spindles. However, these articles are not all related to sleep SO or spindle. Articles (Hale et al., 2016; Horovitz et al., 2008; Laufs, 2008; Laufs, Walker, & Lund, 2007; Spoormaker et al., 2010) mainly focus on methodology for EEG-fMRI, sleep stages, or brain networks, which are not the focus of our study. Thank you again for your attention to the comprehensiveness of our literature review, and we will expand the introduction to include a more detailed discussion of the existing literature, ensuring that the contributions of previous EEG-fMRI sleep studies are adequately acknowledged.
Introduction, Page 4 Lines 62-76
“Investigating these sleep-related neural processes in humans is challenging because it requires tracking transient sleep rhythms while simultaneously assessing their widespread brain activation. Recent advances in simultaneous EEG-fMRI techniques provide a unique opportunity to explore these processes. EEG allows for precise event-based detection of neural signal, while fMRI provides insight into the broader spatial patterns of brain activation and functional connectivity (Horovitz et al., 2008; Huang et al., 2024; Laufs, 2008; Laufs, Walker, & Lund, 2007; Schabus et al., 2007; Spoormaker et al., 2010). Previous EEG-fMRI studies on sleep have focused on classifying sleep stages or examining the neural correlates of specific waves (Bergmann et al., 2012; Caporro et al., 2012; Czisch et al., 2009; Fogel et al., 2017; Hale et al., 2016; Ilhan-Bayrakcı et al., 2022; Moehlman et al., 2019; Picchioni et al., 2011). These studies have generally reported that slow oscillations are associated with widespread cortical and subcortical BOLD changes, whereas spindles elicit activation in the thalamus, as well as in several cortical and paralimbic regions. Although these findings provide valuable insights into the BOLD correlates of sleep rhythms, they often do not employ sophisticated temporal modeling (Huang et al., 2024), to capture the dynamic interactions between different oscillatory events, e.g., the coupling between SOs and spindles.”
(2) The paper falls short in discussing the specific insights gained into the neurobiological substrate of the investigated slow oscillations, spindles, and their interactions. The validity of the inverse inference approach ("Open ended cognitive state decoding"), assuming certain cognitive functions to be related to these oscillations because of the brain regions/networks activated in temporal association with these events, is debatable at best. It is also unclear why eventually only episodic memory processing-like brain-wide activation is discussed further, despite the activity of 16 of 50 feature terms from the NeuroSynth v3 dataset were significant (episodic memory, declarative memory, working memory, task representation, language, learning, faces, visuospatial processing, category recognition, cognitive control, reading, cued attention, inhibition, and action).
Thank you for pointing this out, particularly regarding the use of inverse inference approaches such as “open-ended cognitive state decoding.” Given the concerns about the indirectness of this approach, we decided to remove its related content and results from Figure 3 in the main text and include it in Supplementary Figure 7. We will refocus the main text on direct neurobiological insights gained from our EEG-fMRI analyses, particularly emphasizing the hippocampal-thalamocortical network dynamics underlying SO-spindle coupling, and we will acknowledge the exploratory nature of these findings and highlight their limitations.
Discussion, Page 17-18 Lines 323-332
“To explore functional relevance, we employed an open-ended cognitive state decoding approach using meta-analytic data (NeuroSynth: Yarkoni et al. (2011)). Although this method usefully generates hypotheses about potential cognitive processes, particularly in the absence of a pre- and post-sleep memory task, it is inherently indirect. Many cognitive terms showed significant associations (16 of 50), such as “episodic memory,” “declarative memory,” and “working memory.” We focused on episodic/declarative memory given the known link with hippocampal reactivation (Diekelmann & Born, 2010; Staresina et al., 2015; Staresina et al., 2023). Nonetheless, these inferences regarding memory reactivation should be interpreted cautiously without direct behavioral measures. Future research incorporating explicit tasks before and after sleep would more rigorously validate these potential functional claims.”
(3) Hippocampal activation during SO-spindles is stated as a main hypothesis of the paper - for good reasons - however, other regions (e.g., several cortical as well as thalamic) would be equally expected given the known origin of both oscillations and the existing sleep-EEG-fMRI literature. However, this focus on the hippocampus contrasts with the focus on investigating the key role of the thalamus instead in the Results section.
We appreciate your insight regarding the relative emphasis on hippocampal and thalamic activation in our study. We recognize that the manuscript may currently present an inconsistency between our initial hypothesis and the main focus of the results. To address this concern, we will ensure that our Introduction and Discussion section explicitly discusses both regions, highlighting the complementary roles of the hippocampus (memory processing and reactivation) and the thalamus (spindle generation and cortico-hippocampal coordination) in SO-spindle dynamics.
Introduction, Page 5 Lines 87-103
“To address this gap, our study investigates brain-wide activation and functional connectivity patterns associated with SO-spindle coupling, and employs a cognitive state decoding approach (Margulies et al., 2016; Yarkoni et al., 2011)—albeit indirectly—to infer potential cognitive functions. In the current study, we used simultaneous EEG-fMRI recordings during nocturnal naps (detailed sleep staging results are provided in the Methods and Table S1) in 107 participants. Although directly detecting hippocampal ripples using scalp EEG or fMRI is challenging, we expected that hippocampal activation in fMRI would coincide with SO-spindle coupling detected by EEG, given that SOs, spindles, and ripples frequently co-occur during NREM sleep. We also anticipated a critical role of the thalamus, particularly thalamic spindles, in coordinating hippocampal-cortical communication.
We found significant coupling between SOs and spindles during NREM sleep (N2/3), with spindle peaks occurring slightly before the SO peak. This coupling was associated with increased activation in both the thalamus and hippocampus, with functional connectivity patterns suggesting thalamic coordination of hippocampal-cortical communication. These findings highlight the key role of the thalamus in coordinating hippocampal-cortical interactions during human sleep and provide new insights into the neural mechanisms underlying sleep-dependent brain communication. A deeper understanding of these mechanisms may contribute to future neuromodulation approaches aimed at enhancing sleep-dependent cognitive function and treating sleep-related disorders.”
Discussion, Page 16-17 Lines 292-307
“When modeling the timing of these sleep rhythms in the fMRI, we observed hippocampal activation selectively during SO-spindle events. This suggests the possibility of triple coupling (SOs–spindles–ripples), even though our scalp EEG was not sufficiently sensitive to detect hippocampal ripples—key markers of memory replay (Buzsáki, 2015). Recent iEEG evidence indicates that ripples often co-occur with both spindles (Ngo, Fell, & Staresina, 2020) and SOs (Staresina et al., 2015; Staresina et al., 2023). Therefore, the hippocampal involvement during SO-spindle events in our study may reflect memory replay from the hippocampus, propagated via thalamic spindles to distributed cortical regions.
The thalamus, known to generate spindles (Halassa et al., 2011), plays a key role in producing and coordinating sleep rhythms (Coulon, Budde, & Pape, 2012; Crunelli et al., 2018), while the hippocampus is found essential for memory consolidation (Buzsáki, 2015; Diba & Buzsá ki, 2007; Singh, Norman, & Schapiro, 2022). The increased hippocampal and thalamic activity, along with strengthened connectivity between these regions and the mPFC during SO-spindle events, underscores a hippocampal-thalamic-neocortical information flow. This aligns with recent findings suggesting the thalamus orchestrates neocortical oscillations during sleep (Schreiner et al., 2022). The thalamus and hippocampus thus appear central to memory consolidation during sleep, guiding information transfer to the neocortex, e.g., mPFC.”
(4) The study included an impressive number of 107 subjects. It is surprising though that only 31 subjects had to be excluded under these difficult recording conditions, especially since no adaptation night was performed. Since only subjects were excluded who slept less than 10 min (or had excessive head movements) there are likely several datasets included with comparably short durations and only a small number of SOs and spindles and even less combined SO-spindle events. A comprehensive table should be provided (supplement) including for each subject (included and excluded) the duration of included NREM sleep, number of SOs, spindles, and SO+spindle events. Also, some descriptive statistics (mean/SD/range) would be helpful.
We appreciate your recognition of our sample size and the challenges associated with simultaneous EEG-fMRI sleep recordings. We acknowledge the importance of transparently reporting individual subject data, particularly regarding sleep duration and the number of detected SOs, spindles, and SO-spindle events. To address this, we will provide comprehensive tables in the supplementary materials, contains descriptive information about sleep-related characteristics (Table S1), as well as detailed information about sleep waves at each sleep stage for all 107 subjects(Table S2-S4), listing for each subject:(1)Different sleep stage duration; (2)Number of detected SOs; (3)Number of detected spindles; (4)Number of detected SO-spindle coupling events; (5)Density of detected SOs; (6)Density of detected spindles; (7)Density of detected SO-spindle coupling events.
However, most of the excluded participants were unable to fall asleep or had too short a sleep duration, so they basically had no NREM sleep period, so it was impossible to count the NREM sleep duration, SO, spindle, and coupling numbers.
Supplementary Materials, Page 42-54, Table S1-S4
(Consider of the length, we do not list all the tables here. Please refer to the revised manuscript.)
(5) Was the 20-channel head coil dedicated for EEG-fMRI measurements? How were the electrode cables guided through/out of the head coil? Usually, the 64-channel head coil is used for EEG-fMRI measurements in a Siemens PRISMA 3T scanner, which has a cable duct at the back that allows to guide the cables straight out of the head coil (to minimize MR-related artifacts). The choice for the 20-channel head coil should be motivated. Photos of the recording setup would also be helpful.
Thank you for your comment regarding our choice of the 20-channel head coil for EEG-fMRI measurements. We acknowledge that the 64-channel head coil is commonly used in Siemens PRISMA 3T scanners; however, the 20-channel coil was selected due to specific practical and technical considerations in our study. In particular, the 20-channel head coil was compatible with our EEG system and ensured sufficient signal-to-noise ratio (SNR) for both EEG and fMRI acquisition. The EEG electrode cables were guided through the lateral and posterior openings of the head coil, secured with foam padding to reduce motion and minimize MR-related artifacts. Moreover, given the extended nature of nocturnal sleep recordings, the 20-channel coil allowed us to maintain participant comfort while still achieving high-quality simultaneous EEG-fMRI data.
We have made this clearer in the revised manuscript.
Methods, Page 20 Lines 385-392
“All MRI data were acquired using a 20-channel head coil on a research-dedicated 3-Tesla Siemens Magnetom Prisma MRI scanner. Earplugs and cushions were provided for noise protection and head motion restriction. We chose the 20-channel head coil because it was compatible with our EEG system and ensured sufficient signal-to-noise ratio (SNR) for both EEG and fMRI acquisition. The EEG electrode cables were guided through the lateral and posterior openings of the head coil, secured with foam padding to reduce motion and minimize MR-related artifacts. Moreover, given the extended nature of nocturnal sleep recordings, the 20-channel coil helped maintain participant comfort while still achieving high-quality simultaneous EEG-fMRI data.”
(6) Was the EEG sampling synchronized to the MR scanner (gradient system) clock (the 10 MHz signal; not referring to the volume TTL triggers here)? This is a requirement for stable gradient artifact shape over time and thus accurate gradient noise removal.
Thank you for raising this important point. We confirm that the EEG sampling was synchronized to the MR scanner’s 10 MHz gradient system clock, ensuring a stable gradient artifact shape over time and enabling accurate artifact removal. This synchronization was achieved using the standard clock synchronization interface of the EEG amplifier, minimizing timing jitter and drift. As a result, the gradient artifact waveform remained stable across volumes, allowing for more effective artifact correction during preprocessing. We appreciate your attention to this critical aspect of EEG-fMRI data acquisition.
We have made this clearer in the revised manuscript.
Methods, Page 19-20 Lines 371-383
“EEG was recorded simultaneously with fMRI data using an MR-compatible EEG amplifier system (BrainAmps MR-Plus, Brain Products, Germany), along with a specialized electrode cap. The recording was done using 64 channels in the international 10/20 system, with the reference channel positioned at FCz. In order to adhere to polysomnography (PSG) recording standards, six electrodes were removed from the EEG cap: one for electrocardiogram (ECG) recording, two for electrooculogram (EOG) recording, and three for electromyogram (EMG) recording. EEG data was recorded at a sample rate of 5000 Hz, the resistance of the reference and ground channels was kept below 10 kΩ, and the resistance of the other channels was kept below 20 kΩ. To synchronize the EEG and fMRI recordings, the BrainVision recording software (BrainProducts, Germany) was utilized to capture triggers from the MRI scanner. The EEG sampling was synchronized to the MR scanner’s 10 MHz gradient system clock, ensuring a stable gradient artifact shape over time and enabling accurate artifact removal. This was achieved via the standard clock synchronization interface of the EEG amplifier, minimizing timing jitter and drift.”
(7) The TR is quite long and the voxel size is quite large in comparison to state-of-the-art EPI sequences. What was the rationale behind choosing a sequence with relatively low temporal and spatial resolution?
We acknowledge that our chosen TR and voxel size are relatively long and large compared to state-of-the-art EPI sequences. This decision was made to optimize the signal-to-noise ratio (SNR) and reduce susceptibility-related distortions, which are particularly critical in EEG-fMRI sleep studies where head motion and physiological noise can be substantial. A longer TR allowed us to sample whole-brain activity with sufficient coverage, while a larger voxel size helped enhance BOLD sensitivity and minimize partial volume effects in deep brain structures such as the thalamus and hippocampus, which are key regions of interest in our study. We appreciate your concern and hope this clarification provides sufficient rationale for our sequence parameters.
We have made this clearer in the revised manuscript.
Methods, Page 20-21 Lines 398-408
“Then, the “sleep” session began after the participants were instructed to try and fall asleep. For the functional scans, whole-brain images were acquired using k-space and steady-state T2*-weighted gradient echo-planar imaging (EPI) sequence that is sensitive to the BOLD contrast. This measures local magnetic changes caused by changes in blood oxygenation that accompany neural activity (sequence specification: 33 slices in interleaved ascending order, TR = 2000 ms, TE = 30 ms, voxel size = 3.5 × 3.5 × 4.2 mm<sup>3</sup>, FA = 90°, matrix = 64 × 64, gap = 0.7 mm). A relatively long TR and larger voxel size were chosen to optimize SNR and reduce susceptibility-related distortions, which are critical in EEG-fMRI sleep studies where head motion and physiological noise can be substantial. The longer TR allowed whole-brain coverage with sufficient temporal resolution, while the larger voxel size helped enhance BOLD sensitivity and minimize partial volume effects in deep brain structures (e.g., the thalamus and hippocampus), which are key regions of interest in this study.”
(8) The anatomically defined ROIs are quite large. It should be elaborated on how this might reduce sensitivity to sleep rhythm-specific activity within sub-regions, especially for the thalamus, which has distinct nuclei involved in sleep functions.
We appreciate your insight regarding the use of anatomically defined ROIs and their potential limitations in detecting sleep rhythm-specific activity within sub-regions, particularly in the thalamus. Given the distinct functional roles of thalamic nuclei in sleep processes, we acknowledge that using a single, large thalamic ROI may reduce sensitivity to localized activity patterns. To address this, we will discuss this limitation in the revised manuscript, acknowledging that our approach prioritizes whole-structure effects but may not fully capture nucleus-specific contributions.
Discussion, Page 18 Lines 333-341
“Despite providing new insights, our study has several limitations. First, our scalp EEG did not directly capture hippocampal ripples, preventing us from conclusively demonstrating triple coupling. Second, the combination of EEG-fMRI and the lack of a memory task limit our ability to parse fine-grained BOLD responses at the DOWN- vs. UP-states of SOs and link observed activations to behavioral outcomes. Third, the use of large anatomical ROIs may mask subregional contributions of specific thalamic nuclei or hippocampal subfields. Finally, without a memory task, we cannot establish a direct behavioral link between sleep-rhythm-locked activation and memory consolidation. Future studies combining techniques such as ultra-high-field fMRI or iEEG with cognitive tasks may refine our understanding of subregional network dynamics and functional significance during sleep.”
(9) The study reports SO & spindle amplitudes & densities, as well as SO+spindle coupling, to be larger during N2/3 sleep compared to N1 and REM sleep, which is trivial but can be seen as a sanity check of the data. However, the amount of SOs and spindles reported for N1 and REM sleep is concerning, as per definition there should be hardly any (if SOs or spindles occur in N1 it becomes by definition N2, and the interval between spindles has to be considerably large in REM to still be scored as such). Thus, on the one hand, the report of these comparisons takes too much space in the main manuscript as it is trivial, but on the other hand, it raises concerns about the validity of the scoring.
We appreciate your concern regarding the reported presence of SOs and spindles in N1 and REM sleep and the potential implications. Our detection method for detecting SO, spindle, and coupling were originally designed only for N2&N3 sleep data based on the characteristics of the data itself, and this method is widely recognized and used in the sleep research (Hahn et al., 2020; Helfrich et al., 2019; Helfrich et al., 2018; Ngo, Fell, & Staresina, 2020; Schreiner et al., 2022; Schreiner et al., 2021; Staresina et al., 2015; Staresina et al., 2023). While, because the detection methods for SO and spindle are based on percentiles, this method will always detect a certain number of events when used for other stages (N1 and REM) sleep data, but the differences between these events and those detected in stage N23 remain unclear. We will acknowledge the reasons for these results in the Methods section and emphasize that they are used only for sanity checks.
Methods, Page 25 Lines 515-524
“We note that the above methods for detecting SOs, spindles, and their couplings were originally developed for N2 and N3 sleep data, based on the specific characteristics of these stages. These methods are widely recognized in sleep research (Hahn et al., 2020; Helfrich et al., 2019; Helfrich et al., 2018; Ngo, Fell, & Staresina, 2020; Schreiner et al., 2022; Schreiner et al., 2021; Staresina et al., 2015; Staresina et al., 2023). However, because this percentile-based detection approach will inherently identify a certain number of events if applied to other stages (e.g., N1 and REM), the nature of these events in those stages remains unclear compared to N2/N3. We nevertheless identified and reported the detailed descriptive statistics of these sleep rhythms in all sleep stages, under the same operational definitions, both for completeness and as a sanity check. Within the same subject, there should be more SOs, spindles, and their couplings in N2/N3 than in N1 or REM (see also Figure S2-S4, Table S1-S4).”
(10) Why was electrode F3 used to quantify the occurrence of SOs and spindles? Why not a midline frontal electrode like Fz (or a number of frontal electrodes for SOs) and Cz (or a number of centroparietal electrodes) for spindles to be closer to their maximum topography?
We appreciate your suggestion regarding electrode selection for SO and spindle quantification. Our choice of F3 was primarily based on previous studies (Massimini et al., 2004; Molle et al., 2011), where bilateral frontal electrodes are commonly used for detecting SOs and spindles. Additionally, we considered the impact of MRI-related noise and, after a comprehensive evaluation, determined that F3 provided an optimal balance between signal quality and artifact minimization. We also acknowledge that alternative electrode choices, such as Fz for SOs and Cz for spindles, could provide additional insights into their topographical distributions.
(11) Functional connectivity (hippocampus -> thalamus -> cortex (mPFC)) is reported to be increased during SO-spindle coupling and interpreted as evidence for coordination of hippocampo-neocortical communication likely by thalamic spindles. However, functional connectivity was only analysed during coupled SO+spindle events, not during isolated SOs or isolated spindles. Without the direct comparison of the connectivity patterns between these three events, it remains unclear whether this is specific for coupled SO+spindle events or rather associated with one or both of the other isolated events. The PPIs need to be conducted for those isolated events as well and compared statistically to the coupled events.
We appreciate your critical perspective on our functional connectivity analysis and the interpretation of hippocampus-thalamus-cortex (mPFC) interactions during SO-spindle coupling. We acknowledge that, in the current analysis, functional connectivity was only examined during coupled SO-spindle events, without direct comparison to isolated SOs or isolated spindles. To address this concern, we have conducted PPI analyses for all three ROIs(Hippocampus, Thalamus, mPFC) and all three event types (SO-spindle couplings, isolated SOs, and isolated spindles). Our results indicate that neither isolated SOs nor isolated Spindles yielded significant connectivity changes in all three ROIs, as all failed to survive multiple comparison corrections. This suggests that the observed connectivity increase is specific to SO-spindle coupling, rather than being independently driven by either SOs or spindles alone.
Results, Page 14 Lines 248-255
“Crucially, the interaction between FC and SO-spindle coupling revealed that only the functional connectivity of hippocampus -> thalamus (ROI analysis, t<sub>(106)</sub> = 1.86, p = 0.0328) and thalamus -> mPFC (ROI analysis, t<sub>(106)</sub> = 1.98, p = 0.0251) significantly increased during SO-spindle coupling, with no significant changes in all other pathways (Fig. 4e). We also conducted PPI analyses for the other two events (SOs and spindles), and neither yielded significant connectivity changes in the three ROIs, as all failed to survive whole-brain FWE correction at the cluster level (p < 0.05). Together, these findings suggest that the thalamus, likely via spindles, coordinates hippocampal-cortical communication selectively during SO-spindle coupling, but not isolated SOs or spindle events alone.”
(12) The limited temporal resolution of fMRI does indeed not allow for easily distinguishing between fMRI activation patterns related to SO-up- vs. SO-down-states. For this, one could try to extract the amplitudes of SO-up- and SO-down-states separately for each SO event and model them as two separate parametric modulators (with the risk of collinearity as they are likely correlated).
We appreciate your insightful comment regarding the challenge of distinguishing fMRI activation patterns related to SO-up vs. SO-down states due to the limited temporal resolution of fMRI. While our current analysis does not differentiate between these two phases, we acknowledge that separately modeling SO-up and SO-down states using parametric modulators could provide a more refined understanding of their distinct neural correlates. However, as you notes, this approach carries the risk of collinearity, and there is indeed a high correlation between the two amplitudes across all subjects in our results (r=0.98). Future studies could explore more on leveraging high-temporal-resolution techniques. While implementing this in the current study is beyond our scope, we will acknowledge this limitation in the Discussion section.
Discussion, Page 17 Lines 308-322
“An intriguing aspect of our findings is the reduced DMN activity during SOs when modeled at the SO trough (DOWN-state). This reduced DMN activity may reflect large-scale neural inhibition characteristic of the SO trough. The DMN is typically active during internally oriented cognition (e.g., self-referential processing or mind-wandering) and is suppressed during external stimuli processing (Yeshurun, Nguyen, & Hasson, 2021). It is unlikely, however, that this suppression of DMN during SO events is related to a shift from internal cognition to external responses given it is during deep sleep time. Instead, it could be driven by the inherent rhythmic pattern of SOs, which makes it difficult to separate UP- from DOWN-states (the two temporal regressors were highly correlated, and similar brain activation during SOs events was obtained if modelled at the SO peak instead, Fig. S5). Since the amplitude at the SO trough is consistently larger than that at the SO peak, the neural activation we detected may primarily capture the large-scale inhibition from DOWN-state. Interestingly, no such DMN reduction was found during SO-spindle coupling, implying that coupling may involve distinct neural dynamics that partially re-engage DMN-related processes, possibly reflecting memory-related reactivation. Future research using high-temporal-resolution techniques like iEEG could clarify these possibilities.”
Discussion, Page 18 Lines 333-341
“Despite providing new insights, our study has several limitations. First, our scalp EEG did not directly capture hippocampal ripples, preventing us from conclusively demonstrating triple coupling. Second, the combination of EEG-fMRI and the lack of a memory task limit our ability to parse fine-grained BOLD responses at the DOWN- vs. UP-states of SOs and link observed activations to behavioral outcomes. Third, the use of large anatomical ROIs may mask subregional contributions of specific thalamic nuclei or hippocampal subfields. Finally, without a memory task, we cannot establish a direct behavioral link between sleep-rhythm-locked activation and memory consolidation. Future studies combining techniques such as ultra-high-field fMRI or iEEG with cognitive tasks may refine our understanding of subregional network dynamics and functional significance during sleep.”
(13) L327: "It is likely that our findings of diminished DMN activity reflect brain activity during the SO DOWN-state, as this state consistently shows higher amplitude compared to the UP-state within subjects, which is why we modelled the SO trough as its onset in the fMRI analysis." This conclusion is not justified as the fact that SO down-states are larger in amplitude does not mean their impact on the BOLD response is larger.
We appreciate your concern regarding our interpretation of diminished DMN activity reflecting the SO down-state. We acknowledge that the current expression is somewhat misleading, and our interpretation of it is: it could be driven by the inherent rhythmic pattern of SOs, which makes it difficult to separate UP- from DOWN-states (the two temporal regressors were highly correlated, and similar brain activation during SOs events was obtained if modelled at the SO peak instead). Since the amplitude at the SO trough is consistently larger than that at the SO peak, the neural activation we detected may primarily capture the large-scale inhibition from DOWN-state. And we will make this clear in the Discussion section.
Discussion, Page 17 Lines 308-322
“An intriguing aspect of our findings is the reduced DMN activity during SOs when modeled at the SO trough (DOWN-state). This reduced DMN activity may reflect large-scale neural inhibition characteristic of the SO trough. The DMN is typically active during internally oriented cognition (e.g., self-referential processing or mind-wandering) and is suppressed during external stimuli processing (Yeshurun, Nguyen, & Hasson, 2021). It is unlikely, however, that this suppression of DMN during SO events is related to a shift from internal cognition to external responses given it is during deep sleep time. Instead, it could be driven by the inherent rhythmic pattern of SOs, which makes it difficult to separate UP- from DOWN-states (the two temporal regressors were highly correlated, and similar brain activation during SOs events was obtained if modelled at the SO peak instead, Fig. S5). Since the amplitude at the SO trough is consistently larger than that at the SO peak, the neural activation we detected may primarily capture the large-scale inhibition from DOWN-state. Interestingly, no such DMN reduction was found during SO-spindle coupling, implying that coupling may involve distinct neural dynamics that partially re-engage DMN-related processes, possibly reflecting memory-related reactivation. Future research using high-temporal-resolution techniques like iEEG could clarify these possibilities.”
(14) Line 77: "In the current study, while directly capturing hippocampal ripples with scalp EEG or fMRI is difficult, we expect to observe hippocampal activation in fMRI whenever SOs-spindles coupling is detected by EEG, if SOs- spindles-ripples triple coupling occurs during human NREM sleep". Not all SO-spindle events are associated with ripples (Staresina et al., 2015), but hippocampal activation may also be expected based on the occurrence of spindles alone (Bergmann et al., 2012).
We appreciate your clarification regarding the relationship between SO-spindle coupling and hippocampal ripples. We acknowledge that not all SO-spindle events are necessarily accompanied by ripples (Staresina et al., 2015). However, based on previous research, we found that hippocampal ripples are significantly more likely to occur during SO-spindle coupling events. This suggests that while ripple occurrence is not guaranteed, SO-spindle coupling creates a favorable network state for ripple generation and potential hippocampal activation. To ensure accuracy, we will revise the manuscript to delete this misleading sentence in the Introduction section and acknowledge in the Discussion that our results cannot conclusively directly observe the triple coupling of SO, spindle, and hippocampal ripples.
Discussion, Page 18 Lines 333-341
“Despite providing new insights, our study has several limitations. First, our scalp EEG did not directly capture hippocampal ripples, preventing us from conclusively demonstrating triple coupling. Second, the combination of EEG-fMRI and the lack of a memory task limit our ability to parse fine-grained BOLD responses at the DOWN- vs. UP-states of SOs and link observed activations to behavioral outcomes. Third, the use of large anatomical ROIs may mask subregional contributions of specific thalamic nuclei or hippocampal subfields. Finally, without a memory task, we cannot establish a direct behavioral link between sleep-rhythm-locked activation and memory consolidation. Future studies combining techniques such as ultra-high-field fMRI or iEEG with cognitive tasks may refine our understanding of subregional network dynamics and functional significance during sleep.”
Reviewer #2 (Public review):
In this study, Wang and colleagues aimed to explore brain-wide activation patterns associated with NREM sleep oscillations, including slow oscillations (SOs), spindles, and SO-spindle coupling events. Their findings reveal that SO-spindle events corresponded with increased activation in both the thalamus and hippocampus. Additionally, they observed that SO-spindle coupling was linked to heightened functional connectivity from the hippocampus to the thalamus, and from the thalamus to the medial prefrontal cortex-three key regions involved in memory consolidation and episodic memory processes.
This study's findings are timely and highly relevant to the field. The authors' extensive data collection, involving 107 participants sleeping in an fMRI while undergoing simultaneous EEG recording, deserves special recognition. If shared, this unique dataset could lead to further valuable insights. While the conclusions of the data seem overall well supported by the data, some aspects with regard to the detection of sleep oscillations need clarification.
The authors report that coupled SO-spindle events were most frequent during NREM sleep (2.46 [plus minus] 0.06 events/min), but they also observed a surprisingly high occurrence of these events during N1 and REM sleep (2.23 [plus minus] 0.09 and 2.32 [plus minus] 0.09 events/min, respectively), where SO-spindle coupling would not typically be expected. Combined with the relatively modest SO amplitudes reported (~25 µV, whereas >75 µV would be expected when using mastoids as reference electrodes), this raises the possibility that the parameters used for event detection may not have been conservative enough - or that sleep staging was inaccurately performed. This issue could present a significant challenge, as the fMRI findings are largely dependent on the reliability of these detected events.
Thank you very much for your thorough and encouraging review. We appreciate your recognition of the significance and relevance of our study and dataset, particularly in highlighting how simultaneous EEG-fMRI recordings can provide complementary insights into the temporal dynamics of neural oscillations and their associated spatial activation patterns during sleep. In the sections that follow, we address each of your comments in detail. We have revised the text and conducted additional analyses wherever possible to strengthen our argument, clarify our methodological choices. We believe these revisions improve the clarity and rigor of our work, and we thank you for helping us refine it.
We appreciate your insightful comments regarding the detection of sleep oscillations. Our methods for detecting SOs, spindles, and their couplings were originally developed for N2 and N3 sleep data, based on the specific characteristics of these stages. These methods are widely recognized in sleep research (Hahn et al., 2020; Helfrich et al., 2019; Helfrich et al., 2018; Ngo, Fell, & Staresina, 2020; Schreiner et al., 2022; Schreiner et al., 2021; Staresina et al., 2015; Staresina et al., 2023). However, because this percentile-based detection approach will inherently identify a certain number of events if applied to other stages (e.g., N1 and REM), the nature of these events in those stages remains unclear compared to N2/N3. We nevertheless identified and reported the detailed descriptive statistics of these sleep rhythms in all sleep stages, under the same operational definitions, both for completeness and as a sanity check. Within the same subject, there should be more SOs, spindles, and their couplings in N2/N3 than in N1 or REM. We will acknowledge the reasons for these results in the Methods section and emphasize that they are used only for sanity checks.
Regarding the reported SO amplitudes (~25 µV), during preprocessing, we applied the Signal Space Projection (SSP) method to more effectively remove MRI gradient artifacts and cardiac pulse noise. While this approach enhances data quality, it also reduces overall signal power, leading to systematically lower reported amplitudes. Despite this, our SO detection in NREM sleep (especially N2/N3) remain physiologically meaningful and are consistent with previous fMRI studies using similar artifact removal techniques. We appreciate your careful evaluation and valuable suggestions.
In addition, we will provide comprehensive tables in the supplementary materials, contains descriptive information about sleep-related characteristics (Table S1), as well as detailed information about sleep waves at each sleep stage for all 107 subjects(Table S2-S4), listing for each subject:(1)Different sleep stage duration; (2)Number of detected SOs; (3)Number of detected spindles; (4)Number of detected SO-spindle coupling events; (2)Density of detected SOs; (3)Density of detected spindles; (4)Density of detected SO-spindle coupling events.
Methods, Page 25 Lines 515-524
“We note that the above methods for detecting SOs, spindles, and their couplings were originally developed for N2 and N3 sleep data, based on the specific characteristics of these stages. These methods are widely recognized in sleep research (Hahn et al., 2020; Helfrich et al., 2019; Helfrich et al., 2018; Ngo, Fell, & Staresina, 2020; Schreiner et al., 2022; Schreiner et al., 2021; Staresina et al., 2015; Staresina et al., 2023). However, because this percentile-based detection approach will inherently identify a certain number of events if applied to other stages (e.g., N1 and REM), the nature of these events in those stages remains unclear compared to N2/N3. We nevertheless identified and reported the detailed descriptive statistics of these sleep rhythms in all sleep stages, under the same operational definitions, both for completeness and as a sanity check. Within the same subject, there should be more SOs, spindles, and their couplings in N2/N3 than in N1 or REM (see also Figure S2-S4, Table S1-S4).”
Supplementary Materials, Page 42-54, Table S1-S4
(Consider of the length, we do not list all the tables here. Please refer to the revised manuscript.)
Reviewer #3 (Public review):
Summary:
Wang et al., examined the brain activity patterns during sleep, especially when locked to those canonical sleep rhythms such as SO, spindle, and their coupling. Analyzing data from a large sample, the authors found significant coupling between spindles and SOs, particularly during the upstate of the SO. Moreover, the authors examined the patterns of whole-brain activity locked to these sleep rhythms. To understand the functional significance of these brain activities, the authors further conducted open-ended cognitive state decoding and found a variety of cognitive processing may be involved during SO-spindle coupling and during other sleep events. The authors next investigated the functional connectivity analyses and found enhanced connectivity between the hippocampus, the thalamus, and the medial PFC. These results reinforced the theoretical model of sleep-dependent memory consolidation, such that SO-spindle coupling is conducive to systems-level memory reactivation and consolidation.
Strengths:
There are obvious strengths in this work, including the large sample size, state-of-the-art neuroimaging and neural oscillation analyses, and the richness of results.
Weaknesses:
Despite these strengths and the insights gained, there are weaknesses in the design, the analyses, and inferences.
Thank you for your detailed and thoughtful review of our manuscript. We are delighted that you recognize our advanced analysis methods and rich results of neuroimaging and neural oscillations as well as the large sample size data. In the following sections, we provide detailed responses to each of your comments. And we have revised the text and conducted additional analyses to strengthen our arguments and clarify our methodological choices. We believe these revisions enhance the clarity and rigor of our work, and we sincerely appreciate your thoughtful feedback in helping us refine the manuscript.
(1) A repeating statement in the manuscript is that brain activity could indicate memory reactivation and thus consolidation. This is indeed a highly relevant question that could be informed by the current data/results. However, an inherent weakness of the design is that there is no memory task before and after sleep. Thus, it is difficult (if not impossible) to make a strong argument linking SO/spindle/coupling-locked brain activity with memory reactivation or consolidation.
We appreciate your suggestion regarding the lack of a pre- and post-sleep memory task in our study design. We acknowledge that, in the absence of behavioral measures, it is hard to directly link SO-spindle coupling to memory consolidation in an outcome-driven manner. Our interpretation is instead based on the well-established role of these oscillations in memory processes, as demonstrated in previous studies. We sincerely appreciate this feedback and will adjust our Discussion accordingly to reflect a more precise interpretation of our findings.
Discussion, Page 18 Lines 333-341
“Despite providing new insights, our study has several limitations. First, our scalp EEG did not directly capture hippocampal ripples, preventing us from conclusively demonstrating triple coupling. Second, the combination of EEG-fMRI and the lack of a memory task limit our ability to parse fine-grained BOLD responses at the DOWN- vs. UP-states of SOs and link observed activations to behavioral outcomes. Third, the use of large anatomical ROIs may mask subregional contributions of specific thalamic nuclei or hippocampal subfields. Finally, without a memory task, we cannot establish a direct behavioral link between sleep-rhythm-locked activation and memory consolidation. Future studies combining techniques such as ultra-high-field fMRI or iEEG with cognitive tasks may refine our understanding of subregional network dynamics and functional significance during sleep.”
(2) Relatedly, to understand the functional implications of the sleep rhythm-locked brain activity, the authors employed the "open-ended cognitive state decoding" method. While this method is interesting, it is rather indirect given that there were no behavioral indices in the manuscript. Thus, discussions based on these analyses are speculative at best. Please either tone down the language or find additional evidence to support these claims.
Moreover, the results from this method are difficult to understand. Figure 3e showed that for all three types of sleep events (SO, spindle, SO-spindle), the same mental states (e.g., working memory, episodic memory, declarative memory) showed opposite directions of activation (left and right panels showed negative and positive activation, respectively). How to interpret these conflicting results? This ambiguity is also reflected by the term used: declarative memory and episodic memories are both indexed in the results. Yet these two processes can be largely overlapped. So which specific memory processes do these brain activity patterns reflect? The Discussion shall discuss these results and the limitations of this method.
We appreciate your critical assessment of the open-ended cognitive state decoding method and its interpretational challenges. Given the concerns about the indirectness of this approach, we decided to remove its related content and results from Figure 3 in the main text and include it in Supplementary Figure 7.
Due to the complexity of memory-related processes, we acknowledge that distinguishing between episodic and declarative memory based solely on this approach is not straightforward. We will revise the Supplementary Materials to explicitly discuss these limitations and clarify that our findings do not isolate specific cognitive processes but rather suggest general associations with memory-related networks.
Discussion, Page 17-18 Lines 323-332
“To explore functional relevance, we employed an open-ended cognitive state decoding approach using meta-analytic data (NeuroSynth: Yarkoni et al. (2011)). Although this method usefully generates hypotheses about potential cognitive processes, particularly in the absence of a pre- and post-sleep memory task, it is inherently indirect. Many cognitive terms showed significant associations (16 of 50), such as “episodic memory,” “declarative memory,” and “working memory.” We focused on episodic/declarative memory given the known link with hippocampal reactivation (Diekelmann & Born, 2010; Staresina et al., 2015; Staresina et al., 2023). Nonetheless, these inferences regarding memory reactivation should be interpreted cautiously without direct behavioral measures. Future research incorporating explicit tasks before and after sleep would more rigorously validate these potenial functional claims.”
(3) The coupling strength is somehow inconsistent with prior results (Hahn et al., 2020, eLife, Helfrich et al., 2018, Neuron). Specifically, Helfrich et al. showed that among young adults, the spindle is coupled to the peak of the SO. Here, the authors reported that the spindles were coupled to down-to-up transitions of SO and before the SO peak. It is possible that participants' age may influence the coupling (see Helfrich et al., 2018). Please discuss the findings in the context of previous research on SO-spindle coupling.
We appreciate your concern regarding the temporal characteristics of SO-spindle coupling. We acknowledge that the SO-spindle coupling phase results in our study are not identical to those reported by Hahn et al. (2020); Helfrich et al. (2018). However, these differences may arise due to slight variations in event detection parameters, which can influence the precise phase estimation of coupling. Notably, Hahn et al. (2020) also reported slight discrepancies in their group-level coupling phase results, highlighting that methodological differences can contribute to variability across studies. Furthermore, our findings are consistent with those of Schreiner et al. (2021), further supporting the robustness of our observations.
That said, we acknowledge that our original description of SO-spindle coupling as occurring at the "transition from the lower state to the upper state" was not entirely precise. The -π/2 phase represents the true transition point, while our observed coupling phase is actually closer to the SO peak rather than strictly at the transition. We will revise this statement in the manuscript to ensure clarity and accuracy in describing the coupling phase.
Discussion, Page 16 Lines 283-291
“Our data provide insights into the neurobiological underpinnings of these sleep rhythms. SOs, originating mainly in neocortical areas such as the mPFC, alternate between DOWN- and UP-states. The thalamus generates sleep spindles, which in turn couple with SOs. Our finding that spindle peaks consistently occurred slightly before the UP-state peak of SOs (in 83 out of 107 participants), concurs with prior studies, including Schreiner et al. (2021). Yet it differs from some results suggesting spindles might peak right at the SO UP-state (Hahn et al., 2020; Helfrich et al., 2018). Such discrepancies could arise from differences in detection algorithms, participant age (Helfrich et al., 2018), or subtle variations in cortical-thalamic timing. Nonetheless, these results underscore the importance of coordinated SO-spindle interplay in supporting sleep-dependent processes.”
(4) The discussion is rather superficial with only two pages, without delving into many important arguments regarding the possible functional significance of these results. For example, the author wrote, "This internal processing contrasts with the brain patterns associated with external tasks, such as working memory." Without any references to working memory, and without delineating why WM is considered as an external task even working memory operations can be internal. Similarly, for the interesting results on SO and reduced DMN activity, the authors wrote "The DMN is typically active during wakeful rest and is associated with self-referential processes like mind-wandering, daydreaming, and task representation (Yeshurun, Nguyen, & Hasson, 2021). Its reduced activity during SOs may signal a shift towards endogenous processes such as memory consolidation." This argument is flawed. DMN is active during self-referential processing and mind-wandering, i.e., when the brain shifts from external stimuli processing to internal mental processing. During sleep, endogenous memory reactivation and consolidation are also part of the internal mental processing given the lack of external environmental stimulation. So why during SO or during memory consolidation, the DMN activity would be reduced? Were there differences in DMN activity between SO and SO-spindle coupling events?
We appreciate your concerns regarding the brevity of the discussion and the need for clearer theoretical arguments. We will expand this section to provide more in-depth interpretations of our findings in the context of prior literature. Regarding working memory (WM), we acknowledge that our phrasing was ambiguous. We will modify this statement in the Discussion section.
For the SO-related reduction in DMN activity, we recognize the need for a more precise explanation. This reduced DMN activity may reflect large-scale neural inhibition characteristic of the SO trough. The DMN is typically active during internally oriented cognition (e.g., self-referential processing or mind-wandering) and is suppressed during external stimuli processing (Yeshurun, Nguyen, & Hasson, 2021). It is unlikely, however, that this suppression of DMN during SO events is related to a shift from internal cognition to external responses given it is during deep sleep time. Instead, it could be driven by the inherent rhythmic pattern of SOs, which makes it difficult to separate UP- from DOWN-states (the two temporal regressors were highly correlated, and similar brain activation during SOs events was obtained if modelled at the SO peak instead). Since the amplitude at the SO trough is consistently larger than that at the SO peak, the neural activation we detected may primarily capture the large-scale inhibition from DOWN-state.
To address your final question, we have conducted the additional post hoc comparison of DMN activity between isolated SOs and SO-spindle coupling events. Our results indicate that
DMN activation during SOs was significantly lower than during SO-spindle coupling (t<sub>(106)</sub> = -4.17, p < 1e-4). This suggests that SO-spindle coupling may involve distinct neural dynamics that partially re-engage DMN-related processes, possibly reflecting memory-related reactivation. We appreciate your constructive feedback and will integrate these expanded analyses and discussions into our revised manuscript.
Results, Page 11 Lines 199-208
“Spindles were correlated with positive activation in the thalamus (ROI analysis, t<sub>(106)</sub> = 15.39, p < 1e-4), the anterior cingulate cortex (ACC), and the putamen, alongside deactivation in the DMN (Fig. 3c). Notably, SO-spindle coupling was linked to significant activation in both the thalamus (ROI analysis, t<sub>(106)</sub> \= 3.38, p = 0.0005) and the hippocampus (ROI analysis, t<sub>(106)</sub> \= 2.50, p = 0.0070, Fig. 3d). However, no decrease in DMN activity was found during SO-spindle coupling, and DMN activity during SO was significantly lower than during coupling (ROI analysis, t<sub>(106)</sub> \= -4.17, p < 1e-4). For more detailed activation patterns, see Table S5-S7. We also varied the threshold used to detect SO events to assess its effect on hippocampal activation during SO-spindle coupling and observed that hippocampal activation remained significant when the percentile thresholds for SO detection ranged between 71% and 80% (see Fig. S6).”
Discussion, Page 17-18 Lines 308-332
“An intriguing aspect of our findings is the reduced DMN activity during SOs when modeled at the SO trough (DOWN-state). This reduced DMN activity may reflect large-scale neural inhibition characteristic of the SO trough. The DMN is typically active during internally oriented cognition (e.g., self-referential processing or mind-wandering) and is suppressed during external stimuli processing (Yeshurun, Nguyen, & Hasson, 2021). It is unlikely, however, that this suppression of DMN during SO events is related to a shift from internal cognition to external responses given it is during deep sleep time. Instead, it could be driven by the inherent rhythmic pattern of SOs, which makes it difficult to separate UP- from DOWN-states (the two temporal regressors were highly correlated, and similar brain activation during SOs events was obtained if modelled at the SO peak instead, Fig. S5). Since the amplitude at the SO trough is consistently larger than that at the SO peak, the neural activation we detected may primarily capture the large-scale inhibition from DOWN-state. Interestingly, no such DMN reduction was found during SO-spindle coupling, implying that coupling may involve distinct neural dynamics that partially re-engage DMN-related processes, possibly reflecting memory-related reactivation. Future research using high-temporal-resolution techniques like iEEG could clarify these possibilities.
To explore functional relevance, we employed an open-ended cognitive state decoding approach using meta-analytic data (NeuroSynth: Yarkoni et al. (2011)). Although this method usefully generates hypotheses about potential cognitive processes, particularly in the absence of a pre- and post-sleep memory task, it is inherently indirect. Many cognitive terms showed significant associations (16 of 50), such as “episodic memory,” “declarative memory,” and “working memory.” We focused on episodic/declarative memory given the known link with hippocampal reactivation (Diekelmann & Born, 2010; Staresina et al., 2015; Staresina et al., 2023). Nonetheless, these inferences regarding memory reactivation should be interpreted cautiously without direct behavioral measures. Future research incorporating explicit tasks before and after sleep would more rigorously validate these potential functional claims.”
Reviewing Editor Comment:
The reviewers think that you are working on a relevant and important topic. They are praising the large sample size used in the study. The reviewers are not all in line regarding the overall significance of the findings, but they all agree the paper would strongly benefit from some extra work, as all reviewers raise various critical points that need serious consideration.
We appreciate your recognition of the relevance and importance of our study, as well as your acknowledgment of the large sample size as a strength of our work. We understand that there are differing perspectives regarding the overall significance of our findings, and we value the constructive critiques provided. We are committed to addressing the key concerns raised by all reviewers, including refining our analyses, clarifying our interpretations, and incorporating additional discussions to strengthen the manuscript. Below, we address your specific recommendations and provide responses to each point you raised to ensure our methods and results are as transparent and comprehensible as possible. We believe that these revisions will significantly enhance the rigor and impact of our study, and we sincerely appreciate your thoughtful feedback in helping us improve our work.
Reviewer #1 (Recommendations for the authors):
(1) The phrase "overnight sleep" suggests an entire night, while these were rather "nocturnal naps". Please rephrase.
Thank you for pointing this out. We have revised the phrasing in our manuscript to "nocturnal naps" instead of "overnight sleep" to more accurately reflect the duration of the sleep recordings.
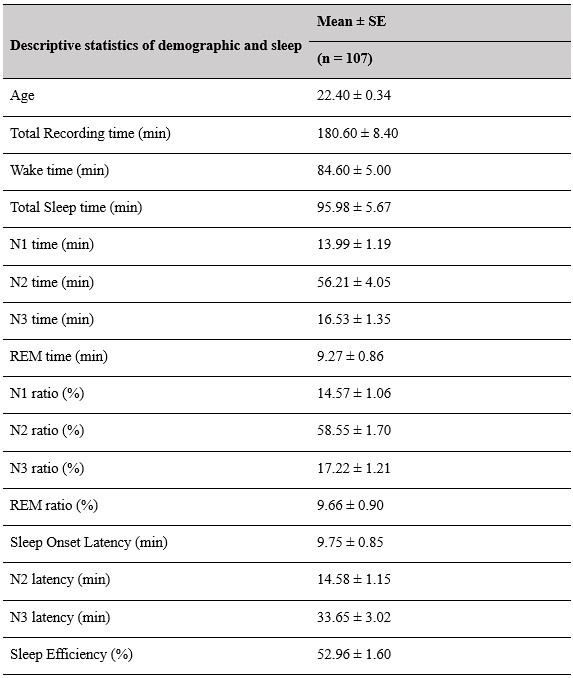
(2) Sleep staging results (macroscopic sleep architecture) should be provided in more detail (at least min and % of the different sleep stages, sleep onset latency, total sleep duration, total recording duration), at least mean/SD/range.
Thank you for this suggestion. We will provide comprehensive tables in the supplementary materials, contains descriptive information about sleep-related characteristics. This information will help provide a clearer overview of the macroscopic sleep architecture in our dataset.
Supplementary Materials, Page 42, Table S1
Author response table 1.
Descriptive results of demographic information and sleep characteristics. Note: The total recorded time is equal to the awake time plus the total sleep time. The sleep onset latency is the time taken to reach the first sleep epoch. The Sleep Efficiency is the ratio of actual sleep time to total recording time.
Reviewer #2 (Recommendations for the authors):
In order to allow for a better estimation of the reliability of the detected sleep events, please:
(1) Provide densities and absolute numbers of all detected SOs and spindles (N1, NREM, and REM sleep).
Thank you for pointing this out. We will provide comprehensive tables in the supplementary materials, contains detailed information about sleep waves at each sleep stage for all 107 subjects (Table S2-S4), listing for each subject:1) Different sleep stage duration; 2) Number of detected SOs; 3) Number of detected spindles; 4) Number of detected SO-spindle coupling events; 5) Density of detected SOs; 6) Density of detected spindles; 7) Density of detected SO-spindle coupling events.
Supplementary Materials, Page 43-54, Table S2-S4
(Consider of the length, we do not list all the tables here. Please refer to the revised manuscript.)
(2) Show ERPs for all detected SOs and spindles (per sleep stage).
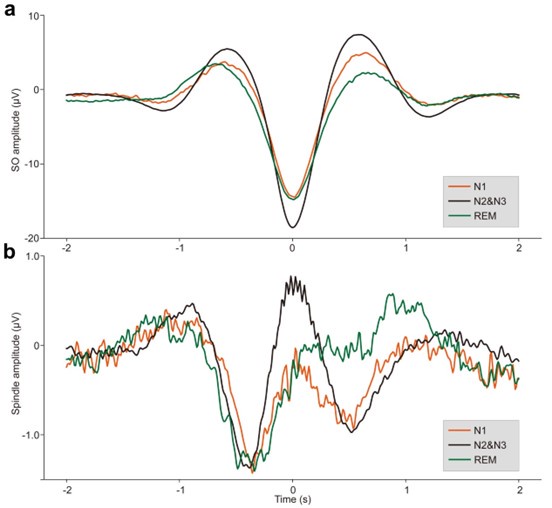
Thank you for the suggestion. We will provide ERPs for all detected SOs and spindles, separated by sleep stage (N1, N2&N3, and REM) in supplementary Fig. S2-S4. These ERP waveforms will help illustrate the characteristic temporal profiles of SOs and spindles across different sleep stages.
Methods, Page 25, Line 525-532
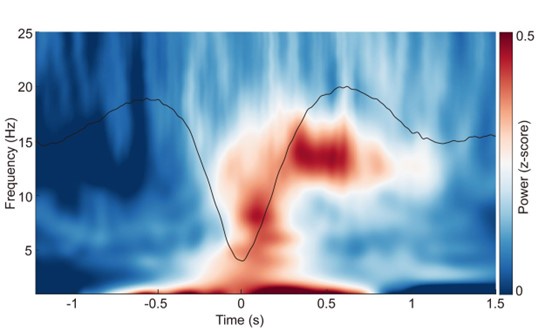
“Event-related potentials (ERP) analysis. After completing the detection of each sleep rhythm event, we performed ERP analyses for SOs, spindles, and coupling events in different sleep stages. Specifically, for SO events, we took the trough of the DOWN-state of each SO as the zero-time point, then extracted data in a [-2 s to 2 s] window from the broadband (0.1–30 Hz) EEG and used [-2 s to -0.5 s] for baseline correction; the results were then averaged across 107 subjects (see Fig. S2a). For spindle events, we used the peak of each spindle as the zero-time point and applied the same data extraction window and baseline correction before averaging across 107 subjects (see Fig. S2b). Finally, for SO-spindle coupling events, we followed the same procedure used for SO events (see Fig. 2a, Figs. S3–S4).”
Supplementary Materials, Page 36-38, Fig. S2-S4
Author response image 1.
ERPs of SOs and spindles coupling during different sleep stages across all 107 subjects. a. ERP of SOs in different sleep stages using the broadband (0.1–30 Hz) EEG data. We align the trough of the DOWN-state of each SO at time zero (see Methods for details). The orange line represents the SO ERP in the N1 stage, the black line represents the SO ERP in the N2&N3 stage, and the green line represents the SO ERP in the REM stage. b. ERP of spindles in different sleep stages using the broadband (0.1–30 Hz) EEG data. We align the peak of each spindle at time zero (see Methods for details). The color scheme is the same as in panel a.
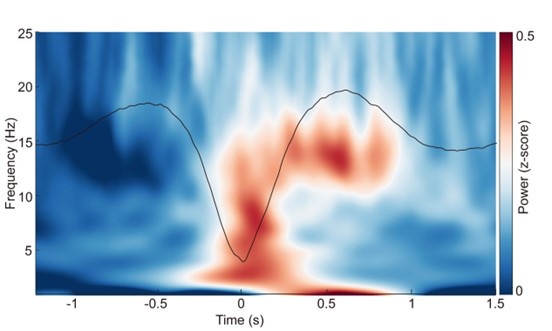
Author response image 2.
ERP and time-frequency patterns of SO-spindle coupling in the N1 stage. The averaged temporal frequency pattern and ERP across all instances of SO-spindle coupling, computed over all subjects, following the same procedure as in Fig. 2a, but for N1 stage.
Author response image 3.
ERP and time-frequency patterns of SO-spindle coupling in the REM stage. The averaged temporal frequency pattern and ERP across all instances of SO-spindle coupling, computed over all subjects, again following the same procedure as in Fig. 2a, but for REM stage.
(3) Provide detailed info concerning sleep characteristics (time spent in each sleep stage etc.).
Thank you for this suggestion. Same as the response above, we will provide comprehensive tables in the supplementary materials, contains descriptive information about sleep-related characteristics.
Supplementary Materials, Page 42, Table S1 (same as above)
(4) What would happen if more stringent parameters were used for event detection? Would the authors still observe a significant number of SO spindles during N1 and REM? Would this affect the fMRI-related results?
Thank you for this suggestion. Our methods for detecting SOs, spindles, and their couplings were originally developed for N2 and N3 sleep data, based on the specific characteristics of these stages. These methods are widely recognized in sleep research (Hahn et al., 2020; Helfrich et al., 2019; Helfrich et al., 2018; Ngo, Fell, & Staresina, 2020; Schreiner et al., 2022; Schreiner et al., 2021; Staresina et al., 2015; Staresina et al., 2023). However, because this percentile-based detection approach will inherently identify a certain number of events if applied to other stages (e.g., N1 and REM), the nature of these events in those stages remains unclear compared to N2/N3. We nevertheless identified and reported the detailed descriptive statistics of these sleep rhythms in all sleep stages, under the same operational definitions, both for completeness and as a sanity check. Within the same subject, there should be more SOs, spindles, and their couplings in N2/N3 than in N1 or REM (see also Figure S2-S4, Table S1-S4).
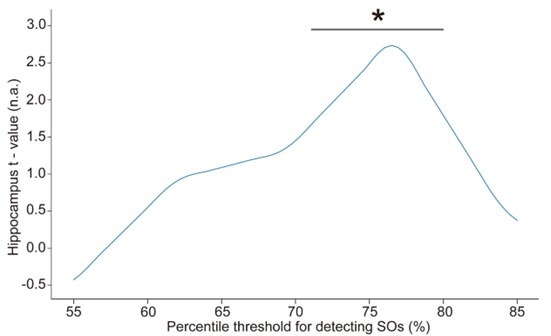
Furthermore, in order to explore the impact of this on our fMRI results, we conducted an additional sensitivity analysis by applying different detection parameters for SOs. Specifically, we adjusted amplitude percentile thresholds for SO detection (the parameter that has the greatest impact on the results). We used the hippocampal activation value during N2&N3 stage SO-spindle coupling as an anchor value and found that when the parameters gradually became stricter, the results were similar to or even better than the current results. However, when we continued to increase the threshold, the results began to gradually decrease until the threshold was increased to 80%, and the results were no longer significant. This indicates that our results are robust within a specific range of parameters, but as the threshold increases, the number of trials decreases, ultimately weakening the statistical power of the fMRI analysis.
Thank you again for your suggestions on sleep rhythm event detection. We will add the results in Supplementary and revise our manuscript accordingly.
Results, Page 11, Line 199-208
“Spindles were correlated with positive activation in the thalamus (ROI analysis, t<sub>(106)</sub> = 15.39, p < 1e-4), the anterior cingulate cortex (ACC), and the putamen, alongside deactivation in the DMN (Fig. 3c). Notably, SO-spindle coupling was linked to significant activation in both the thalamus (ROI analysis, t<sub>(106)</sub> \= 3.38, p = 0.0005) and the hippocampus (ROI analysis, t<sub>(106)</sub> \= 2.50, p = 0.0070, Fig. 3d). However, no decrease in DMN activity was found during SO-spindle coupling, and DMN activity during SO was significantly lower than during coupling (ROI analysis, t<sub>(106)</sub> \= -4.17, p < 1e-4). For more detailed activation patterns, see Table S5-S7. We also varied the threshold used to detect SO events to assess its effect on hippocampal activation during SO-spindle coupling and observed that hippocampal activation remained significant when the percentile thresholds for SO detection ranged between 71% and 80% (see Fig. S6).”
Supplementary Materials, Page 40, Fig. S6
Author response image 4.
Influence of the percentile threshold for SO detection on hippocampal activation (ROI) during SO-spindle coupling. We changed the percentile threshold for SO event detection in the EEG data analysis and then reconstructed the GLM design matrix based on the SO events detected at each threshold. The brain-wide activation pattern of SO-spindle couplings in the N2/3 stage was extracted using the same method as shown in Fig. 3. The gray horizontal line represents the significant range (71%–80%). * p < 0.05.
Finally, we sincerely thank all again for your thoughtful and constructive feedback. Your insights have been invaluable in refining our analyses, strengthening our interpretations, and improving the clarity and rigor of our manuscript. We appreciate the time and effort you have dedicated to reviewing our work, and we are grateful for the opportunity to enhance our study based on your recommendations.
References:
Bergmann, T. O., Mölle, M., Diedrichs, J., Born, J., & Siebner, H. R. (2012). Sleep spindle-related reactivation of category-specific cortical regions after learning face-scene associations. NeuroImage, 59(3), 2733-2742.
Buzsáki, G. (2015). Hippocampal sharp wave‐ripple: A cognitive biomarker for episodic memory and planning. Hippocampus, 25(10), 1073-1188.
Caporro, M., Haneef, Z., Yeh, H. J., Lenartowicz, A., Buttinelli, C., Parvizi, J., & Stern, J. M. (2012). Functional MRI of sleep spindles and K-complexes. Clinical neurophysiology, 123(2), 303-309.
Coulon, P., Budde, T., & Pape, H.-C. (2012). The sleep relay—the role of the thalamus in central and decentral sleep regulation. Pflügers Archiv-European Journal of Physiology, 463, 53-71.
Crunelli, V., Lőrincz, M. L., Connelly, W. M., David, F., Hughes, S. W., Lambert, R. C., Leresche, N., & Errington, A. C. (2018). Dual function of thalamic low-vigilance state oscillations: rhythm-regulation and plasticity. Nature Reviews Neuroscience, 19(2), 107-118.
Czisch, M., Wehrle, R., Stiegler, A., Peters, H., Andrade, K., Holsboer, F., & Sämann, P. G. (2009). Acoustic oddball during NREM sleep: a combined EEG/fMRI study. PloS one, 4(8), e6749.
Diba, K., & Buzsáki, G. (2007). Forward and reverse hippocampal place-cell sequences during ripples. Nature Neuroscience, 10(10), 1241.
Diekelmann, S., & Born, J. (2010). The memory function of sleep. Nature Reviews Neuroscience, 11(2), 114-126.
Fogel, S., Albouy, G., King, B. R., Lungu, O., Vien, C., Bore, A., Pinsard, B., Benali, H., Carrier, J., & Doyon, J. (2017). Reactivation or transformation? Motor memory consolidation associated with cerebral activation time-locked to sleep spindles. PloS one, 12(4), e0174755.
Hahn, M. A., Heib, D., Schabus, M., Hoedlmoser, K., & Helfrich, R. F. (2020). Slow oscillation-spindle coupling predicts enhanced memory formation from childhood to adolescence. Elife, 9, e53730.
Halassa, M. M., Siegle, J. H., Ritt, J. T., Ting, J. T., Feng, G., & Moore, C. I. (2011). Selective optical drive of thalamic reticular nucleus generates thalamic bursts and cortical spindles. Nature Neuroscience, 14(9), 1118-1120.
Hale, J. R., White, T. P., Mayhew, S. D., Wilson, R. S., Rollings, D. T., Khalsa, S., Arvanitis, T. N., & Bagshaw, A. P. (2016). Altered thalamocortical and intra-thalamic functional connectivity during light sleep compared with wake. NeuroImage, 125, 657-667.
Helfrich, R. F., Lendner, J. D., Mander, B. A., Guillen, H., Paff, M., Mnatsakanyan, L., Vadera, S., Walker, M. P., Lin, J. J., & Knight, R. T. (2019). Bidirectional prefrontal-hippocampal dynamics organize information transfer during sleep in humans. Nature Communications, 10(1), 3572.
Helfrich, R. F., Mander, B. A., Jagust, W. J., Knight, R. T., & Walker, M. P. (2018). Old brains come uncoupled in sleep: slow wave-spindle synchrony, brain atrophy, and forgetting. Neuron, 97(1), 221-230. e224.
Horovitz, S. G., Fukunaga, M., de Zwart, J. A., van Gelderen, P., Fulton, S. C., Balkin, T. J., & Duyn, J. H. (2008). Low frequency BOLD fluctuations during resting wakefulness and light sleep: A simultaneous EEG‐fMRI study. Human brain mapping, 29(6), 671-682.
Huang, Q., Xiao, Z., Yu, Q., Luo, Y., Xu, J., Qu, Y., Dolan, R., Behrens, T., & Liu, Y. (2024). Replay-triggered brain-wide activation in humans. Nature Communications, 15(1), 7185.
Ilhan-Bayrakcı, M., Cabral-Calderin, Y., Bergmann, T. O., Tüscher, O., & Stroh, A. (2022). Individual slow wave events give rise to macroscopic fMRI signatures and drive the strength of the BOLD signal in human resting-state EEG-fMRI recordings. Cerebral Cortex, 32(21), 4782-4796.
Laufs, H. (2008). Endogenous brain oscillations and related networks detected by surface EEG‐combined fMRI. Human brain mapping, 29(7), 762-769.
Laufs, H., Walker, M. C., & Lund, T. E. (2007). ‘Brain activation and hypothalamic functional connectivity during human non-rapid eye movement sleep: an EEG/fMRI study’—its limitations and an alternative approach. Brain, 130(7), e75.
Margulies, D. S., Ghosh, S. S., Goulas, A., Falkiewicz, M., Huntenburg, J. M., Langs, G., Bezgin, G., Eickhoff, S. B., Castellanos, F. X., & Petrides, M. (2016). Situating the default-mode network along a principal gradient of macroscale cortical organization. Proceedings of the National Academy of Sciences, 113(44), 12574-12579.
Massimini, M., Huber, R., Ferrarelli, F., Hill, S., & Tononi, G. (2004). The sleep slow oscillation as a traveling wave. Journal of Neuroscience, 24(31), 6862-6870.
Moehlman, T. M., de Zwart, J. A., Chappel-Farley, M. G., Liu, X., McClain, I. B., Chang, C., Mandelkow, H., Özbay, P. S., Johnson, N. L., & Bieber, R. E. (2019). All-night functional magnetic resonance imaging sleep studies. Journal of neuroscience methods, 316, 83-98.
Molle, M., Bergmann, T. O., Marshall, L., & Born, J. (2011). Fast and slow spindles during the sleep slow oscillation: disparate coalescence and engagement in memory processing. Sleep, 34(10), 1411-1421.
Ngo, H.-V., Fell, J., & Staresina, B. (2020). Sleep spindles mediate hippocampal-neocortical coupling during long-duration ripples. Elife, 9, e57011.
Picchioni, D., Horovitz, S. G., Fukunaga, M., Carr, W. S., Meltzer, J. A., Balkin, T. J., Duyn, J. H., & Braun, A. R. (2011). Infraslow EEG oscillations organize large-scale cortical– subcortical interactions during sleep: a combined EEG/fMRI study. Brain research, 1374, 63-72.
Schabus, M., Dang-Vu, T. T., Albouy, G., Balteau, E., Boly, M., Carrier, J., Darsaud, A., Degueldre, C., Desseilles, M., & Gais, S. (2007). Hemodynamic cerebral correlates of sleep spindles during human non-rapid eye movement sleep. Proceedings of the National Academy of Sciences, 104(32), 13164-13169.
Schreiner, T., Kaufmann, E., Noachtar, S., Mehrkens, J.-H., & Staudigl, T. (2022). The human thalamus orchestrates neocortical oscillations during NREM sleep. Nature communications, 13(1), 5231.
Schreiner, T., Petzka, M., Staudigl, T., & Staresina, B. P. (2021). Endogenous memory reactivation during sleep in humans is clocked by slow oscillation-spindle complexes. Nature Communications, 12(1), 3112.
Singh, D., Norman, K. A., & Schapiro, A. C. (2022). A model of autonomous interactions between hippocampus and neocortex driving sleep-dependent memory consolidation. Proceedings of the National Academy of Sciences, 119(44), e2123432119.
Spoormaker, V. I., Schröter, M. S., Gleiser, P. M., Andrade, K. C., Dresler, M., Wehrle, R., Sämann, P. G., & Czisch, M. (2010). Development of a large-scale functional brain network during human non-rapid eye movement sleep. Journal of Neuroscience, 30(34), 11379-11387.
Staresina, B. P., Bergmann, T. O., Bonnefond, M., van der Meij, R., Jensen, O., Deuker, L., Elger, C. E., Axmacher, N., & Fell, J. (2015). Hierarchical nesting of slow oscillations, spindles and ripples in the human hippocampus during sleep. Nature Neuroscience, 18(11), 1679-1686.
Staresina, B. P., Niediek, J., Borger, V., Surges, R., & Mormann, F. (2023). How coupled slow oscillations, spindles and ripples coordinate neuronal processing and communication during human sleep. Nature Neuroscience, 1-9.
Yarkoni, T., Poldrack, R. A., Nichols, T. E., Van Essen, D. C., & Wager, T. D. (2011). Large-scale automated synthesis of human functional neuroimaging data. Nature methods, 8(8), 665-670.
Yeshurun, Y., Nguyen, M., & Hasson, U. (2021). The default mode network: where the idiosyncratic self meets the shared social world. Nature Reviews Neuroscience, 1-12.